the impact of the 2008-09 recession and economic crisis on …eneken.ieej.or.jp/data/2988.pdf ·...
TRANSCRIPT
OXF
OR
D IN
STIT
UTE
FO
R E
NER
GY
STU
DIE
SN
atur
al G
as R
esea
rch
Prog
ram
me
The Impact of the 2008-09 Recession and Economic Crisis on Russian and European Gas Markets
Professor Jonathan SternOxford Institute for Energy Studies
IEEJ, TokyoFebruary 9, 2010

OXF
OR
D IN
STIT
UTE
FO
R E
NER
GY
STU
DIE
SN
atur
al G
as R
esea
rch
Prog
ram
me
22
OIES* Natural Gas Research Programme
WE ARE: a gas research programme at an independent academic institute, part of Oxford University, specialising in fossil fuel researchWE ARE NOT: consultants sellers of exclusive, high price business reportsWE PRODUCE: independent research on national and international gas issues
WE ARE FUNDED BY: sponsorship by companies and governments in gas producing and consuming countries
*Oxford Institute for Energy Studies is an educational charity
Information about our Institute, our Programme and its publications can be found on our website:http://www.oxfordenergy.org/gasprog.shtml

OXF
OR
D IN
STIT
UTE
FO
R E
NER
GY
STU
DIE
SN
atur
al G
as R
esea
rch
Prog
ram
me
THE RUSSIAN GAS MARKET
3

OXF
OR
D IN
STIT
UTE
FO
R E
NER
GY
STU
DIE
SN
atur
al G
as R
esea
rch
Prog
ram
me
44
Russian GDP Growth Rates: 1961-2009
Source: Federal State Statistics Service, Ministry for Economic Development
-30
-24
-18
-12
-6
0
6
12
1961
1963
1965
1967
1969
1971
1973
1975
1977
1979
1981
1983
1985
1987
1989
1991
1993
1995
1997
1999
2001
2003
2005
2007
2009
f
% c
hang
e (y
/y)
-50
-40
-30
-20
-10
0
10
20
% c
hang
e (y
/y)
Industrial production (left scale) GDP (left scale) Gross Fixed Capital Formation (right scale)
Soviet times
Highest levels of economic growth in post-war period
GDP fell by 7.9% in 2009
OXF
OR
D IN
STIT
UTE
FO
R E
NER
GY
STU
DIE
SN
atur
al G
as R
esea
rch
Prog
ram
me
55
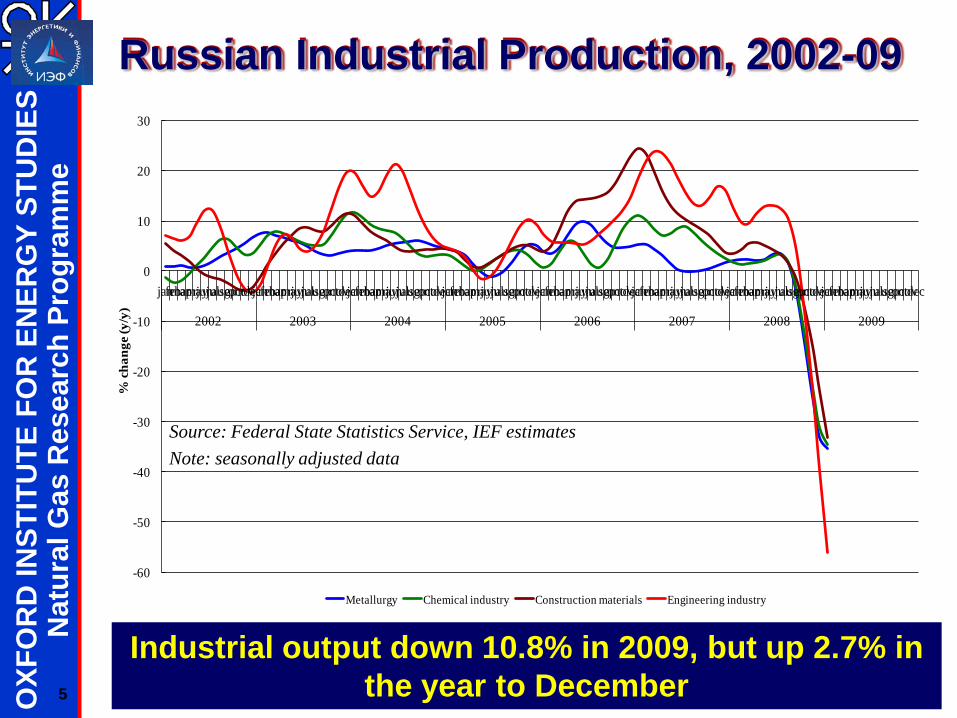
Russian Industrial Production, 2002-09
Source: Federal State Statistics Service, IEF estimates Note: seasonally adjusted data
-60
-50
-40
-30
-20
-10
0
10
20
30
janfebmaraprmayjunjulaugsepoctnovdecjanfebmaraprmayjunjulaugsepoctnovdecjanfebmaraprmayjunjulaugsepoctnovdecjanfebmaraprmayjunjulaugsepoctnovdecjanfebmaraprmayjunjulaugsepoctnovdecjanfebmaraprmayjunjulaugsepoctnovdecjanfebmaraprmayjunjulaugsepoctnovdecjanfebmaraprmayjunjulaugsepoctnovdec
2002 2003 2004 2005 2006 2007 2008 2009
% c
hang
e (y
/y)
Metallurgy Chemical industry Construction materials Engineering industry
Industrial output down 10.8% in 2009, but up 2.7% in the year to December

OXF
OR
D IN
STIT
UTE
FO
R E
NER
GY
STU
DIE
SN
atur
al G
as R
esea
rch
Prog
ram
me
2009: THE HARDEST YEAR IN GAZPROM’S HISTORY
Gas production 462 bcm, the company’s lowest ever
Big fall in European and CIS export sales
TWO “GAS WARS”: January dispute with Ukraine: Gazprom lost
$100m + per day, and its reputation suffered in Europe
No Turkmen gas imported from April-December 2009
6

OXF
OR
D IN
STIT
UTE
FO
R E
NER
GY
STU
DIE
SN
atur
al G
as R
esea
rch
Prog
ram
me
77
Russian gas production 2004-09 (Bcm)
2004 2005 2006 2007 2008 2009
GAZPROM 545.1 548.4 556.0 548.6 549.7 462.2*
OTHER PROD’ERS
88.4 92.2 100.2 104.1 113.9 120.2*
TOTAL RUSSIA
633.5 640.8 656.2 652.7 663.6 582.4*
2009: Russian production fell by nearly >80 Bcm; Gazprom production fell by nearly 90
Bcm; independent production increased
*preliminary figures
Source: Gazprom

OXF
OR
D IN
STIT
UTE
FO
R E
NER
GY
STU
DIE
SN
atur
al G
as R
esea
rch
Prog
ram
me
88
But Some Companies Increase ProductionNOVATEK: 32 Bcm in 2009 – potential to grow rapidly A powerful new part-owner (Gennady Timchenko) 50.1% of Yamal LNG Supply contracts with OGK-1 power company
THE OIL COMPANIES: Priority for associated gas in Gazprom’s pipelines
meant that most maintained production in 2009 Rosneft contesting third-party access case
Is the Russian government making space for non-Gazprom output to increase?

OXF
OR
D IN
STIT
UTE
FO
R E
NER
GY
STU
DIE
SN
atur
al G
as R
esea
rch
Prog
ram
me
99
Production and import projections 2009-12
Bcm 2008 actual
2009prelim
2010 2011 2012
GAZPROM (Source: Gazprom*)
549.7 462.2 529 532 542
TOTAL RUSSIA (Source: MinEcDev’t**)
663.6 582.4 643 655 669
OTHER RUS. PRODUCTION***
113.9 120.2 114 123 127
CENTRAL ASIAN IMPORTS*
61 33.6 32.8 33.9 37.9
*Gazprom investment forecast 11.09; ** December 2009 = +20 cf September 2009, Interfax Dec 10-16, 2009, p.14 ***residual
Gazprom/Russian production does not regain 2008 levels till 2012

OXF
OR
D IN
STIT
UTE
FO
R E
NER
GY
STU
DIE
SN
atur
al G
as R
esea
rch
Prog
ram
me
1010
Central Asian supplies
TURKMENISTAN: Chinese exports have started (~ 6bcm in 2010) $10bn (Chinese and Middle Eastern) investment
agreed for Yolotan Exports to Iran could increase ‘Up to 30 Bcm’ to Russia in 2010 = 10 Bcm, probably
UZBEKISTAN AND KAZAKHSTAN: Uzbekistan: 15.5 Bcm to Russia in 2010 These purchases fit with Russian foreign policy
Russia/Gazprom retains a strategic interest ... but in the early 2010s has limited need for
Central Asian gas

OXF
OR
D IN
STIT
UTE
FO
R E
NER
GY
STU
DIE
SN
atur
al G
as R
esea
rch
Prog
ram
me
Balancing Supply with Demand Medium term Gazprom’s production
increase will depend on Yamal Peninsula (Bovanenkovskoye field) development
Gazprom has announced : a one-year delay for Yamal – now end-2012
(instead of 2011) and a 3-year delay for Shtokman
HOW MUCH additional supply will Gazprom need AND WHEN?
Answer depends on when demand for Russian gas recovers: in Russia, in CIS, in Europe...
and on independents’ role 11

OXF
OR
D IN
STIT
UTE
FO
R E
NER
GY
STU
DIE
SN
atur
al G
as R
esea
rch
Prog
ram
me
12
Yamal-Nenets Gas Fields and Pipelines

OXF
OR
D IN
STIT
UTE
FO
R E
NER
GY
STU
DIE
SN
atur
al G
as R
esea
rch
Prog
ram
me
13
Shtokman Field and Nord Stream Pipelines
Rethink on Shtokman due to US price outlook?

OXF
OR
D IN
STIT
UTE
FO
R E
NER
GY
STU
DIE
SN
atur
al G
as R
esea
rch
Prog
ram
me
14
Demand for Russian Gas in 2009
DOMESTIC DEMAND: fell between -4% to -6.6% = 21-28 BcmCIS MARKET: Ukraine alone down 15-20 Bcm; Belarus 3-4 Bcm, Moldova another 1-1.5 Bcm
Russia and CIS demand fell 40-55 Bcm in 2009
WILL 2010 BE BETTER?

OXF
OR
D IN
STIT
UTE
FO
R E
NER
GY
STU
DIE
SN
atur
al G
as R
esea
rch
Prog
ram
me
Russian domestic gas prices 2008-09Russian Fed’n Avge Group 4, all data ex. VAT), assuming $1 = 29RR
2008 2009INDUSTRY: Rubles $US Rubles $US
Price/mcm 2059 71 2389 82HOUSEHOLD:
Price/mcm 2030 70 2388 82Netback European Price* 4349 150 6642 229
Gazprom EU price** 10202 352 11485 396
Russian domestic prices remain around one third of netback export prices (even using
FTS methodology). But subsidies have been largely eliminated
*FTS formula equalising domestic and export prices for Nizhnegorodsk oblast **10/08-7/09Source: Russian Federal Tariff Service

OXF
OR
D IN
STIT
UTE
FO
R E
NER
GY
STU
DIE
SN
atur
al G
as R
esea
rch
Prog
ram
me
16
Gazprom Exports to CIS Countries 2003-08 (Bcm)
Sources: Gazprom in Figures 2004, p.30, Annual Reports: 2004, p.47; 2005, p.55; 2006 p.49; 2008 p.51. *includes RosUkrEnergo re-exports; statistical basis of data is different to previous years
2009 exports were less than 60 Bcm
2003 2004 2005 2006* 2007* 2008*
Ukraine 26.0 34.4 37.6 59.0 59.2 56.2
Belarus 10.2 10.2 19.8 20.5 20.6 21.1
Moldova 1.5 1.9 2.8 2.5 2.7 2.7
Caucasus 0.5 0 6.9 7.6 3.1 2.8
Kazakhst’n - 0.8 4.0 6.5 10.0 9.6
TOTAL CIS 38.2 47.1 71.1 96.1 95.6 92.4

OXF
OR
D IN
STIT
UTE
FO
R E
NER
GY
STU
DIE
SN
atur
al G
as R
esea
rch
Prog
ram
me
1717
Russia/Ukraine: another gas war in 2010?REASONS FOR: Ukraine could reopen price negotiations Yanukovich could resurrect RosUkrEnergo
(unlikely) The IMF-backed cash flow could be interrupted
REASONS AGAINST: The IMF will likely still see Ukraine as a “domino
that must not fall”, whoever is president The new president will be less antagonistic to
Russia
Ukraine is paying European netback prices. But it will struggle to pay at this level without IMF
assistance

OXF
OR
D IN
STIT
UTE
FO
R E
NER
GY
STU
DIE
SN
atur
al G
as R
esea
rch
Prog
ram
me
Russian Export Prices to CIS Countries ($/mcm)
2007 2008 2009 2010actual estimated
Ukraine 130 180 231 295*Belarus 118 127 151 168Moldova 170 236 238 233*
Export prices intended to reach “European” (netback) levels by 2011 – for Ukraine 2010;
2-3 times higher than Russian domestic prices
*Q1 Prices only

OXF
OR
D IN
STIT
UTE
FO
R E
NER
GY
STU
DIE
SN
atur
al G
as R
esea
rch
Prog
ram
me
19
Gazprom’s Gas Exports to Europe: consolidated and actual (Bcm)
1995 2000 2005 2006 2007 2008Western Europe
75.1 90.3 113.2 118.0 128.6 141.0
Eastern Europe
42.3 38.7 42.9 43.5 39.4 42.5
Baltic States
4.4 4.7 5.0 5.2 5.3 4.1
TOTAL (consolidated)*
121.8 133.7 161.1 166.7 173.8 188.5
Actual** 147.0 151.1 150.5 158.8*consolidated IAS figure including all gas sold by Gazprom affiliates in Europe; **actual Russian gas volumes exported to Europe
2009 – 140.2 Bcm actual (preliminary)2010: 160.8; 2011: 163.5; 2012: 170.9 Bcm

OXF
OR
D IN
STIT
UTE
FO
R E
NER
GY
STU
DIE
SN
atur
al G
as R
esea
rch
Prog
ram
me
Short term outlook post-recession Recovery of gas sales/exports and
production – depends on economic/gas demand recovery
Gazprom’s short term decisions: Hold back Yamal development and allow
independents/Central Asia to fill any gap? Raise prices to CIS countries and accept
demand reduction? Maintain traditional European price formula
and see others take market share?
20
Even if Ukraine problems do not recur, this is a bleak short term outlook; Gazprom
must take very difficult decisions

OXF
OR
D IN
STIT
UTE
FO
R E
NER
GY
STU
DIE
SN
atur
al G
as R
esea
rch
Prog
ram
me
Medium/longer term outlook
Yamal development and independent production: no major availability problem?
Caspian/Central Asia will be strategically important but volumes much less than expected at least up to 2015
Realistically before 2020 no significantRussian gas to China or North America (unless market conditions change radically)
21
Gazprom “export diversification” strategy looks doubtful before 2020, but domestic
and CIS markets could look more attractive than in the past

OXF
OR
D IN
STIT
UTE
FO
R E
NER
GY
STU
DIE
SN
atur
al G
as R
esea
rch
Prog
ram
me
EUROPEAN GAS MARKETS
22

OXF
OR
D IN
STIT
UTE
FO
R E
NER
GY
STU
DIE
SN
atur
al G
as R
esea
rch
Prog
ram
me
Demand in Europe 35 - 1990 to 2008
23Slow down of gas demand growth pre-dated recession
Source: A. Honore, forthcoming 2010, Oxford University Press

OXF
OR
D IN
STIT
UTE
FO
R E
NER
GY
STU
DIE
SN
atur
al G
as R
esea
rch
Prog
ram
me
24Source: IEA Countries: 18 (Aus, Bel, Cz Rep, Den, Fin, Fra, Ger, Gre, Hun, Ire, Ita, NL, Pol, Por, Spa, Swe, Tur, UK)
Gas demand slowed in mid 2008, declined in late 2008… and continued to fall into 2009

OXF
OR
D IN
STIT
UTE
FO
R E
NER
GY
STU
DIE
SN
atur
al G
as R
esea
rch
Prog
ram
me
25
Certainty about the future gas demand has changed over the past few years... What about 2008-2015 ???
Mtoe
Source: Source: A. Honore, forthcoming 2010, Oxford University Press, from WEO 2000, 2002, 2004 ,2006, 2008 and 2009
WEO 09
WEO 09
WEO 09
???
???
???

OXF
OR
D IN
STIT
UTE
FO
R E
NER
GY
STU
DIE
SN
atur
al G
as R
esea
rch
Prog
ram
me
0
100
200
300
400
500
600
700
2005 2020e 2020e 2020e 2020e
Observed demand EC Baseline 61$/bblEC Baseline 100$/bbl EC New Energy Policy Proj. 61$/bblEC New Energy Policy Proj. 100$/bbl
+13%
-0.5% -10.3%
-22.5%
Sources: EC (2008), 2nd Strategic Energy Review (COM(2008) 781 final), Annex 1, p.19
EC scenarios for natural gas demand in EU27 by 2020 (bcm)

OXF
OR
D IN
STIT
UTE
FO
R E
NER
GY
STU
DIE
SN
atur
al G
as R
esea
rch
Prog
ram
me
Gas Supply and Import Capacity
European domestic gas production is flat or declining BUT:
Major pipeline infrastructure is under construction: Nord Stream, Medgaz
More pipelines planned: South Stream, Nabucco, Galsi
Major new LNG capacity has just opened or is under construction in: UK, France, Italy, Netherlands and others
27
Weak and uncertain demand makes it very difficult for buyers to sign new long
term take or pay contracts

OXF
OR
D IN
STIT
UTE
FO
R E
NER
GY
STU
DIE
SN
atur
al G
as R
esea
rch
Prog
ram
me
Oversupply/weak demand highlights a lack of economic logic in gas pricing
CONTINENTAL EUROPE long term contracts:
traditional netback market pricing based (largely) on oil products is no longer logical because: gas and oil product markets have diverged very little switching capacity remains
gas prices are under increasing pressure due to supply surplus
Market growth requires change in pricing; but major producers do not want change!

OXF
OR
D IN
STIT
UTE
FO
R E
NER
GY
STU
DIE
SN
atur
al G
as R
esea
rch
Prog
ram
me
NBP and German Import Prices 2000-2010 (Euros/Mwh)
0
5
10
15
20
25
30
35
40
45
Jan-
00
Jan-
01
Jan-
02
Jan-
03
Jan-
04
Jan-
05
Jan-
06
Jan-
07
Jan-
08
Jan-
09
Oil linked prices likely to rise above Euros 20/MWh in 1H/10, hub-based prices likely to
remain steady or even fall

OXF
OR
D IN
STIT
UTE
FO
R E
NER
GY
STU
DIE
SN
atur
al G
as R
esea
rch
Prog
ram
me
US Henry Hub Compared with European prices (Euros/Mwh)
For LNG to divert to US, Henry Hub must be >40c higher than NBP
0
5
10
15
20
25
30
35
40
45Ja
n-00
Jan-
01
Jan-
02
Jan-
03
Jan-
04
Jan-
05
Jan-
06
Jan-
07
Jan-
08
Jan-
09
€/M
wh
Gas Prices
Henry Hub
NBP
AGIP

OXF
OR
D IN
STIT
UTE
FO
R E
NER
GY
STU
DIE
SN
atur
al G
as R
esea
rch
Prog
ram
me
Possible Steps in the Transition Away from Oil-Linked Pricing
Hub based pricing seems the most likely outcome:
either NBP-based or average of NW Europe What kind of contractual transition measures are most likely:
an increasing % of spot gas in the base price and index; “temporary relief” envisaging return to oil linkage in the future; relaxation of Take or Pay?
31
The trade-off for producers/exporters is between accepting lower base prices/
indexation to spot prices, or relaxing Take or Pay and allowing buyers a choice of sources

OXF
OR
D IN
STIT
UTE
FO
R E
NER
GY
STU
DIE
SN
atur
al G
as R
esea
rch
Prog
ram
me
GAS SURPLUS DUE TO: Likely weak demand recovery in 2010-11 Surge of new LNG supplies; north west
Europe already increased LNG imports in 2009 due to price differentials
THIS WILL CAUSE: Take or Pay problems in long term gas
contracts until 2011-12
Short term outlook post-recession
• Increasing competition means that major importers can no longer force LTC gas on customers at twice the
price of spot gas• Oil-indexation is becoming an increasing problem

OXF
OR
D IN
STIT
UTE
FO
R E
NER
GY
STU
DIE
SN
atur
al G
as R
esea
rch
Prog
ram
me
Medium and longer term outlook Indigenous production and ACQ levels of
contracted pipeline gas can cover demand up until 2014
Long term contract pipeline gas+LNG below demand post 2016
Uncertainties on future demand recovery (crisis & 20/20/20 policies), but post 2014, supply/demand balance tightens due to: accelerating decline in Europe production plateau in pipeline import potential (~2014), post 2014-15 is also the period when LNG
supply growth slows down
Around 2015 market may change from surplus to shortage (perhaps within a short time?)