the impact of telecommunication growth on the …
TRANSCRIPT

58
ABSTRACT
Using annual time series data of Sri Lanka thisstudy examines the impact of telecommunicationsector growth on the service sector growth. Themethodology employed consists of the bivariateand multivariate cointegration approach toestablish the long run equilibrium relationshipand causality testing is employed to detect thedirection of this relationship. The current studyis the first of its kind to use annual secondarydata to examine the long run relationshipbetween telecommunications sector and servicesector in Sri Lanka. I find statistical evidence fora positive long run equilibrium relationshipbetween telecommunication sector growth andservice sector growth which confirmed theresearch hypothesis. Finally, the possibility ofone-way link between telecommunications sectorgrowth and service sector growth wasestablished through causality test. Based onthese finding the current study emphasizes theneed to target long term growth strategies in thetelecommunication service sector for Sri Lanka.
Keywords: Telecommunication, TelephoneDensity Rate, Economic Growth, Sri Lanka
Introduction
Assessing the impact of telecommunication
sector growth on economic growth has been
addressed over the past decade in many countries
owing to the rapid increase technological
innovations. The link with technology opens
telecommunication sector to innumerous avenues
since new technology (ex. 3G, 3.5G high speed
packed access (HSPA) technology) would
translate to new development potentials. For
example, there is emphasis on mobile commerce
(M-Commerce) which would facilitate Small and
Medium Scale Enterprises (SMEs) as a
communication tool which uses network that
provides access to direct marketing business.
Service sector has drawn a similar attention
being the highest contributor to the overall GDP
over the past years. Furthermore, within the
service sector, telecommunication seems to be
performing well. For example, the mobile
phones subscribers’ base has reached almost 17.2
million and it is revealed that the telephone
density, the number of connections (both fixed
and mobile connections) for every 100 persons,
is 100.79(Central Bank of Sri Lanka (2010) that
implies the number of connections has surpassed
the population. The waiting lists have plummeted
and the expensive down payments are substituted
by “easy installment” schemes. All of
whichindicate of how telecommunications has
managed to become a household necessity.
Thus being a country which is now experiencing
an over the average growth in the
telecommunications sector as compared to other
countries in the region, telecommunication sector
is still under developed in Sri Lanka. Economists
around the world have paid special attention to
examining the relationship as well as the
direction of the relationship between the
telecommunication sector growth and economic
growth.
According to Waverman, Meschi andFuss (2005)
at the beginning telecommunications promoted
economic growth by cutting down transaction
cost of individuals and firms. Röller and
Waverman (2001) estimated the impact of
investment in telecommunication infrastructure
THE IMPACT OF TELECOMMUNICATION GROWTH ONTHE SERVICE SECTOR: A COINTEGRATION ANALYSIS
Dhanushka ThamarapaniEconomics Department, Clark University, USA.

59
The Impact of Telecommunication Growth on the Service Sector:A Cointegration Analysis
on GDP in the OECD countries and revealed a
significant positive relationship between the two
variables. Although the telephone penetration
rates were quite low during 1970s and there was
no usage of mobile phones, gradually the
importance of telecommunications sector reached
the developing world. Chakraborty and Nandi
(2003) reveals that there is bi-directional
causation and a long run equilibrium
relationship. However, the frequent findings of
positive correlation between these two variables
were challenged by Straub et al (2008) with the
finding of no significant link between
infrastructure stock and economic growth.
Many cross country studies have examined the
relationship between telecommunications
infrastructure growth and economic growth and
some of these studies have included Sri Lanka in
their sample (for example, Fink et al.(2002),
Torero et al.(2002)) However there is a gap of a
country specific study especially with regard to
the telecommunication sector’s impact on the
service sector. When Sri Lanka is included in a
general sample the country specific features of
the Sri Lankan telecommunications sector is
dampened through averaging and generalization.
Therefore it urges the need of conducting a study
paying attention to the market behavior specific
to Sri Lanka.
The remainder of the paper is organized as
follows. Section two discusses the literature,
followed by a summary of the
telecommunications policy in Sri Lanka. Section
four puts forth the model followed by the
discussion of results. Section six concludes.
Literature Review
Considering the research that has been done so
far it is evident that most of the studies tend to
analyze the impact of telecommunication sector
on the economic growth as a whole. The most
common used methodology is the Annual
Production Function. For example, Röller and
Waverman (2001) demonstrate that
telecommunications infrastructure significantly
and positively affects economic growth using
annual time series and cross sectional data for 21
OECD countries. Several more recent papers
extended this analysis to the developing
countries which yield consistent results (for
example, Yoo (2002), Belaîd (2003); Waverman
et al (2005)). The latter also reveals that mobile
phones in less developed economies are playing
the same role that fixed lines played in the richer
economies in the 1970s and 1980s. Therefore
mobile phones are substitutes for fixed lines in
developing countries and complements fixed
lines in developed countries.
Employing similar methodologyTorero et al.
(2002) reveal a positive causal link between
infrastructure and GDP in which the sample
includes Sri Lanka. An extension of this study is
attempted by Sridhar and Sridhar (2004) through
the introduction of the mobile phone sector and
concludes that the impact of telecommunication
penetration on total output is significantly lower
for developing countries than that reported for
OECD countries in Röller and Waverman (2001)
thus dismissing the convergence hypothesis as
suggested by Mankiw et al. (1992).
In contrast, the work of Beil et al. (2003) based
on investment and GDP data for USA, indicates
that investment in the telecommunications
industry is caused by, but does not cause,
economic activity by employing Granger-Sims
causality tests. In contrast Chakraborty and
Nandi (2003) establish bi-directional causation
and a long run equilibrium relationship between
GDP and Telephone Density Rate (TDR).
However they only account for the fixed lines
thus overlooking the contribution of the mobile
phone sector. There are other studies that have
concentrated on similar topic using datasets from
different parts of the world (for example,
Madden and Savage (1997) – Central and
Eastern Europe; Seethepalli et al. (2008), Straub
et al. (2008) – East Asia; Fink et al. (2002) - 86
developing countries) although there is debate on
the exact sign and magnitude of the correlation.
60
JOURNAL OF MANAGEMENT – Volume IX No.1 - October 2013
Some studies analyzing the impact of
infrastructure as a whole on economic growth
(Calderón and Servén (2004);Canning and
Pedroni (2004)) conclude that infrastructure
stock positively affects economic growth while
Canning (1999) highlights the effect of network
externalities. There are some studies that look at
specific countries (ex. Narayana (2008) and
Vijayamohanan (2008)). In the case of Sri Lanka,
although telecommunications infrastructure
remains underprovided this sector is nonetheless
one of the fastest growing and technological
improvements are occurring at a rapid rate (de
Mel & Wijayasiri (2008)). However there is still
the absence of studies looking at the exact
contribution of telecommunication sector.
According to Munnell (1992) there is potential
for policy implications in this sector. Thus the
present study attempts to fill the gap in the
available literature by examining the long run
effect of growth in telecommunications sector
(which accounts for both fixed and mobile
telephony) on the growth of the service sector
which has not been addressed with respect to Sri
Lanka.
The Evolution of theTelecommunications Policy in Sri Lanka
Fixed telephony has shouldered the development
of the telecommunications industry since
economic liberalization in 1977. Despite the
growth the waiting periods were long; the
transmission quality was poor and the high initial
cost resulted in inadequate access to
telecommunications. The situation gradually
changed with the introduction of reforms as well
as competition. Instead of owning a traditional
fixed wire line, now the customer has the option
to choose from wireless local loop (WLL)
operators as well as code division multiple
access (CDMA) phones or even mobile phones
with distinctive features like 3G and video
conferencing.The customers were given a better
service and consequently the industry grew at a
rapid scale drawing attention for professional
intervention. Such interventions resulted in
establishing regulatory bodies and opening up of
the industry to accommodate competition.The
gradual growth of the service sector has now
reached its climax being the highest contributor
to the overall GDP. Within the service sectorthe
performance of the telecommunications has
dramatically improved. Figure 1 is a
simultaneous look at the growths in these two
sectors. The tele-mobile density rate (TMDR) is
the number of fixed lines and mobile phones per
100 persons4. The underprovision of telephone
service was continuously prevalent that in 1996
only 50 percent of the expressed demand was
catered by the Sri Lanka Telecom (SLT) (Central
Bank 1996). Nonetheless alandmark in
telecommunications industry was the partial
privalization of SLT by Nippon Telegraph and
Telephone (NTT) in1997 which contirubuted to
the conspequous growth in telecommunications.
Thus by 1999 Sri Lanka had the most
deregulated telecommunications sector in South
Asia (Central Bank 1999). The increasing
significance of telecommunications is
demonstrated in the Figure 2 which compares the
contribution of the transport, storage and
communications sector in 1978 and 2010 in
order to see the growth pattern over 30 years.
At present transport, storage and
communications sector is the second largest
contributor to the service sector GDP.
The actual reforms in telecommunications sector
began in 1980 through the de-linking of post and
telecommunication services (de Mel &
Wijayasiri 2008) which resulted in breaking
away from the Post, Telegraph and Telephone
(PTT) model. The entrance of the first private
operator into the market occurred in 1989 when
Celltel, a mobile operator, was licensed.
However, the reforms transpired in 1991 with the
Telecommunications Act No. 25 which converted
then Department of Telecommunication (DoT) to
Sri Lanka Telecommunication Corporation (SLT)
that was owned by the government. The act of
1991 was amended in 1996 by the Sri Lanka
Telecommunications Act No. 27 thorough which
the Telecommunications Regulatory Commission

61
The Impact of Telecommunication Growth on the Service Sector:A Cointegration Analysis
of Sri Lanka (TRC) was established. Among the
plans for the future development of the industry
TRC has set goals to achieve a 16 million mobile
phone subscriber base by 2016 (TRC 2006). In
the year of TRC’s establishment, SLT was
transformed into a public company as a
preliminary step towards privatization
(Jayasuriya & Knight-John 2002). The following
year, in 1997, the government sold 35 per cent of
its shareholding to NTT and another 3.5 per cent
of shares were distributed among the employees
of SLT. In mobile telephony the new players
have been entering over the past decade. As at
August 2011 there were five mobile service
providers in operation: Dialog (1995), Mobitel
(2002)5, Hutch (2004), Airtel (2008) and Etisalat
(2009)6. Nonetheless telecommunications
industry is still in need of comprehensive
policies to promote its growth. Thus
implementation of up to date policies has
become a timely necessity in this industry.
Research Methods
Annual data for the period of 1978 – 2010 was
collected from Statistical Abstracts published by
the Department of Census and Statistics as well
as from the Annual Reports of the Central Bank
of Sri Lanka. This study is the first of its kind to
use annualsecondary data for the test of
cointegration specifically between telecommu -
nications sector and service sector.
The study comprises of all the variables in their
growth rates form. Service sector growth (St) is
defined as service sector Real GDP growth. The
growth in the telecommunication sector is
measured by the growth in Tele-Mobile Density
Rate (TMDRt) which represents the growth in
number of fixed lines and mobile phones per 100
persons. Growth rates of the Real GDP of other
sub sectors of the service sector, i.e. Wholesale
and Retail Trade (Wt), Banking, Insurance
and Real Estate (Bt), Ownership of Dwellings
(Odt), Public Services (Pbt) and Private Services
(Prt) are also included to this model.
Cointegration analysis of bivariate approach
(Engle & Granger 1987) and multivariate
approach (Johansen 1988) are adopted in this
study. A simple Cobb Douglas production
function employed by Canning and Pedroni
(2004) based on Barro (1990) is modified and
used to highlight the impact of
telecommunications infrastructure on economic
growth. Thus, the aggregate output Y, at time t is
produced utilizing telecommunication
infrastructure capital, G, other capital, K, and
labor L, such that
Yt = At Ktα Gt
βLt1-α-β, (1)
where At is total factor productivity at time t.
According to equation 1, the growth in
telecommunications infrastructure results in
achieving higher economic growth. The present
study looks at the contribution to the service
sector growth which is a significant component
of the overall economic growth. First, time series
properties of the variables are tested. Then,
cointegration analysis is performed using the
simple bivariate cointegration test proposed by
Engle and Granger in 1987. Thus service sector
growth rate (St) is regressed on growth in Tele-
Mobile Density Rate (TMDRt) as follows:
St = ct + βTMDRt + et, (2)
which can be alternatively expressed as :
et = St - ct - β TMDRt. (3)
According to Engle Granger Approach,
Augmented Dickey Fuller (ADF) test on the
residual (et) is performed to find out whether the
linear combination of these two variables are
stationary. If the null hypothesis is rejected, then
the linear combination of the service sector
growth (St) and TMDR growth (TMDRt) is
stationary and therefore there exists a long run
(equilibrium) relationship between these two
variables.
The Error Correction Models (ECM) is used to
estimate the short run dynamics between

62
JOURNAL OF MANAGEMENT – Volume IX No.1 - October 2013
telecommunication sector growth and service
sector growth in Sri Lanka. When two variables
are cointegrated, though they are in equilibrium
in the long run, in the short run they may be in
disequilibrium. Therefore the residual (et) in
equation 3 can be treated as an equilibrium
error.This error term can be used to tie the short
run behavior of service sector growth (St) to the
long run value. According to the Granger
Representation Theorem (Engle and Granger
(1987)) if two variables are cointegrated, then the
relationship between those two can be expressed
in an ECM as follows:
∆St = α0+ α1 ∆TMDRt + α2et-1 + ηt, (5)
where et-1 is the lagged error term of equation 2.
The absolute value of α2decides how quickly the
equilibrium is restored. It is the speed ofadjustment coefficient. If α2 in equation 5 is
statistically significant it could be concluded that
service sector growth rate (St) responds to
disequilibria in the service sector growth–
telecommunication sector growth relationship andthe value of the coefficient α2 demonstrates how
much of the disequilibrium is corrected annually.
It is often possible that there may be more than
one cointegrating relationship among variables.
In order to capture this aspect Johansen (1988)
approach is employed. As pointed out by Hassan
(2003) this approach considers the vector
autoregressive (VAR) model of the following
form
where Xt is a 7 by 1 vector containing all the
growth rate variables in the Model 1. “In a VAR,
each variable is ‘explained’ by its own lagged
values, and the lagged values of all other
variables in the system” (Hendry and Juselius
(2000)). This test indicates the number of
cointegrating vectors, r, in the system. In the
process of estimation, the r co-integrating
relations are solved for the first r variables in the
Xt vector as a function of the remaining k-rvariables. Later this was developed to a Vector
Error Correction Model (VEC) thus
incorporating all the other variables in to the
model in order to estimate their short run
behavior. In the presence of more than one
cointegrating relationship the VEC model is
adopted that in the short term, deviations from
the long term equilibrium is fed back on the
changes in the dependent variables in order to
force their movements towards the long term
equilibrium (Hassan (2003)). Thus by using
equation 4 the following VEC model is derived.
where ΔXt is the vector of first differences of thevariables in growth rate model, the Γs areestimated parameters, ηt is a vector of
unanticipated movements in Xt and П is the longterm parameter matrix.
As the final step the direction of the relationship
between telecommunication sector growth and
service sector growthis established through
employing Granger Causality test (Granger
(1969)) with the objective of finding whether the
relationship (if any) between these two variables
is uni-directional or bi-directional. Hence the
following formulae are derived from the
standard:
where the lag length was determined by the AIC
& SIC criterion. The rejection of both null
hypotheses would indicate bi-directional
causality. If a single null hypothesis is rejected it
would proveuni-direction.
ttt XXX � +�+�+= �� ....2211
(4) tktk X �+�+ �. , t = 1, 2,…., T
ttt XXX � ++��+��+=� �� 2211 ...
tktktk XX �+�+�� �+�� 11 , t = 1,…,T (6)
(7) tS = �=
k
ii
11� itTMDR � �
=
+k
ii
12� itS � tu1+
(8) tit
k
iiit
k
iit uSTMDRTMDR 2
14
13 ++= �
=�
=�� ��

63
The Impact of Telecommunication Growth on the Service Sector:A Cointegration Analysis
Results and Discussions
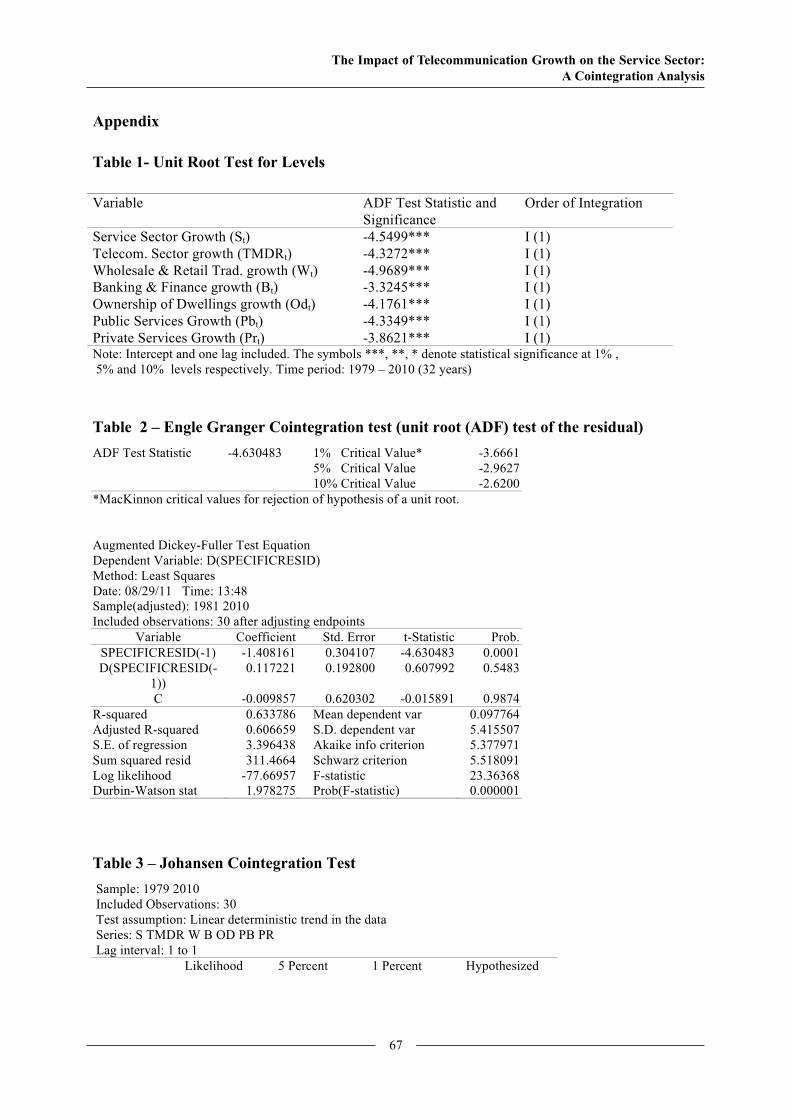
The unit root test isperformed to find out the
order of integration of the variables in the study.
The ADF test results are summarized in Table 1.
Thus all the variables are I(1) in the level form
and they became stationary in its first difference.
With the results of the unit root tests reported in
Table 1 it was established that service sector (St)
is integrated to order I (1) and that tele-mobile
density rate (TMDRt) is integrated to order one
I (1). Testing for bivariate co-integration, the
residual, et, yielded the results such that ADF
test statistics is -4.6305 (Table 2). The large
negative value of ADF statistic implies
stationarity of the residual series (integrated to
order zero, I (0)). Thus St and TMDRt are
cointegrated. There exists a long run equilibrium
relationship between service sector growth and
telecommunication sector growth. Among the
studies that investigate the relationship between
telecommunication sector and economic growth
(GDP), Canning (1999), Chakraborty and Nandi
(2003) and Canning and Pedroni (2004) have
also concluded that these two variables are co-
integrated.
As for multivariate cointegration the results of
the Johansen cointegration test indicated four
cointegrating relationships within the system
which was statistically significant at 5 per cent
level (Table 3). Thus the rank of the Пmatrix is 4(r = 4) which rejects the null hypothesis of no
cointegration equation is 3.
The magnitude of the contribution of
telecommunication sector growth to the service
sector growth can be obtained by the general
(cointegrating) regression output as summarized
in Table 4. It is evident that when the growth in
tele-mobile density rate (TMDRt) increases by 1
percent service sector growth rate (St) increases
by 0.0356 percent which is statistically
significant at 10 per cent. The coefficients
are positive implying a positive relationship
between the telecommunication sector and
service sector.
Having established a long run relationship
between service sector growth and
telecommunication sector growth the next step is
to determine the short run effects. As indicated
by Mohanty et al (1996) residuals from the
cointegrating equation (error correction term)
which represents departure from the long-run
equilibrium are included in the ECM to capture
the response of service sector growth to any
disequilibrium created by the movement in
telecommunication sector growth. Thus the error
correction model (using growth rate model)
yielded the results summarized in Table 5. Since
the speed of adjustment coefficient at 1 per cent
level it can be concluded that service sector
growth responds to disequilibria in the service
sector growth – telecommunication sector growth
relationship. The negative sign in front of the
error correction coefficient indicates that if in
this year service sector growth moves away from
the equilibrium in the next year it will start
falling in order to come back to the equilibrium.
The negative value of the speed of adjustment
coefficient confirms the system is stable and
signifies how quickly the equilibrium is restored.
Under the multivariate analysis the short run
effects of the growth rates variables are analyzed
using the VEC which translates to about 48
percent of the disequilibrium corrected each year
due to changes in the service sector growth rate
(St)and the correction owing to the changes in
tele-mobile density rate growth (TMDRt) is
about 11 percent. Thus both ECM and VEC
models confirmed the existence of the short run
dynamics.
As the final step of the estimation process I run
the causality tests. The Granger Causality tests
the exogeneity of the impact of one variable on
another Canning and Pedroni (2004). I find
statistical evidence for uni-directional causation
running from tele-mobile density rate (TMDRrt)
to service sector real GDP (Srt) in the presence
of three lags (Table 6). Though this study does
not support bi-directional causation empirical
evidence for bi-directional causality can be found
in Chakraborty and Nandi (2003) and Canning

64
JOURNAL OF MANAGEMENT – Volume IX No.1 - October 2013
and Pedroni (2004), the two studies which
looked at the relationship between infrastructure
(including telecommunication) and economic
growth.
Summary and Conclusions
The current study is an attempt to fill the gap in
the existing literature with the primary objective
of investigating the impact of
telecommunications on the service sector in Sri
Lanka using annual secondary data over the
period of 1978 to 2008. I employed bivariate and
multivariate cointegration framework and the
sample confirmed the research hypothesis that
telecommunications sector growth positively
contributes to the service sector in the long run.
The bivariate cointegration test proved that there
has been equilibrium relationship between these
two sectors for the period of 1978 to 2008 while
the multivariate cointegration framework
indicated four such long run relationships in the
model. Thus it can be concluded that increase in
telecommunications sector growth increases the
long run service sector growth.
Both ECM and VEC suggested that the short
term disequilibria is corrected (to a certain
extent) in the subsequent year. I find evidence
that telecommunications contribute to boost the
service sector which is uni-directional causation.
This study was limited to the period of 1978 to
2010 due to the absence of dependable data for
the period prior to 1978. To be more precise, the
GDP calculations prior to 1978 were not
consistent with those of the latter years. This
incompatibility in data truncated the sample to
only 1978 and forward.
Results imply that growth in telecommunications
services foster a source of economic growth
through growth in the service sector. There is
also evidence that service sector growth causes
increased demand for telecommunications.
However growth by itself does not guarantee the
efficient provision of such services. First step
towards promoting a sustainable growth in
telecommunications sector would be formulating
complementary regulations aimed at encouraging
healthy competition, service quality and cost
effectiveness which would overcome the supply
bottlenecks of telecommunications services. In
addition, utilizing telecommunications to share
the information of, for example, prices, job
opportunities and markets would enhance the
possibility of dispersing growth benefits
effectively to different strata of the society.
Furthermore, expanding linkage effects of
telecommunications services would result in
generating more income and employment and Sri
Lanka can be developed as a regional
communication hub. A preliminary step towards
achieving this target would be organizing
international communication conferences and
exhibitions in the country. Finally, an important
measure would be to reduce inequalities in
telecommunications services among different
regions so that major economic activities are not
limited to few cities of the county. There is both
theoretical and empirical evidence that better
governance seems to engender better services.
Hence this policy formulation could be used as
means of capturing the benefits of the modern
telecommunications technology.
As suggestions for further studies one could
check the robustness of the finding by employing
different methodology like production function
method and growth accounting framework.
Furthermore, as frequently done in literature, this
study can be extended to investigate the
contribution of telecommunications sector (or
infrastructure as a whole) to the economic growth
of Sri Lanka which would in turn facilitate more
comprehensive policy formulation.

65
The Impact of Telecommunication Growth on the Service Sector:A Cointegration Analysis
References
Aschauer, D (1989), Is Public Expenditure
Productive?, Journal of Monetary Economics,
Vol. 23, No. 2, pp. 177-200.
Asteriou, D & Hall, S (2007), AppliedEconometrics: A Modern Approach, revised
edition, Palgrave Macmillan, New York.
Barro, R (1990), Government Spending in a Simple
Model of Endogenous Growth, Journal ofPolitical Economy, Vol. 98, pp. 103-105.
Beil, R, Ford, G & Jackson, J (2003), On the
Relationship between Telecommunications
Investment and Economic Growth in the
United States, Telepolicy Working Paper.
Belaîd, H (2003), Telecommunications
Infrastructure and Economic Development,
Simultaneous Approach: Case of Developing
Countries.
Bougheas, S, Demetriades, P & Mamuneas T
(1999), Infrastructure, Specialization and
Economic Growth.
Calderón, C & Servén, L (2004), The Effects of
Infrastructure Development on Growth and
Income Distribution, World Bank PolicyResearch Working Paper No. 3400.
Canning, D (1999), The Contribution of
Infrastructure to Aggregate Output, World BankPolicy Research Working Paper No. 2246.
Canning, D & Pedroni, P (2004), The Effect of
Infrastructure on Long Run Economic Growth.
Central Bank, (1981), (1996), (1999), (2008),
Annual Reports, Central Bank, Colombo.
Chakaraborty, C & Nandi, B (2003), Privatization,
Telecommunications and Growth in Selected
Asian Countries: An Econometric Analysis.
De Mel, D & Wijayasiri, J (2008), Domestic
Preparedness of Sri Lanka with respect to
Services Trade Liberalization:
A Case Study of the Telecom Sector, in DomesticPreparedness for Services TradeLiberalization, S Raihan (ed)
CUTS international, Jaipur, pp. 149-177.
Engle, R & Granger, C (1987), Co-integration and
Error Correction: Representation, Estimation
and Testing, Econometrica, Vol. 55, No. 2,
pp. 251-276.
Estache, A, Speciale, B & Veredas, D (2005), How
Much Does Infrastructure Matter to Growth in
Sub-Saharan Africa?.
Fink, C, Mattoo, A & Rathindran, R (2002), An
Assessment on Telecommunications Reforms
in Developing
Countries, World Bank Policy Research WorkingPaper 2909.
Granger, C (1969), Investigating Causal relations
by Econometric Models and Cross-Spectral
Methods, Econometrica, Vol. 37, No. 3,
pp. 424-438.
Hassan, A (2003), Financial Integration of Stock
Markets in the Gulf: A Multivariate
Cointegration Analysis, International Journalof Business, Vol. 8, No. 3, pp. 335 -346.
Hendry, D & Juselius, K (2000), Explaining
Cointegration Analysis: Part II.
Johansen, S (1988), Statistical Analysis of
Cointegration Vectors, Journal of EconomicDynamics and control, Vol. 2, No. 2-3,
pp. 231-254.
Jayasuriya, S & Knight-John, M (2002), Sri
Lanka’s Telecommunications Industry: from
Privatization to Anti-Competition?
Madden, G & Savage, S (1997), CEE
telecommunications Investment and Economic
growth, MPRA paper no. 11843.
Mankiw, N, Romer, D & Weil, D (1992), A
Contribution to the Empirics of Economic
Growth, The Quarterly Journal of Economics,
Vol. 107, No. 2, pp. 407-437.
Mohanty, S, Peterson, W & Smith, D (1996),
Relationships between U.S. and Canadian
Wheat Prices: Cointegration and Error
Correction Approach, Canadian Journal ofAgricultural Economics, Vol. 44, pp. 265-276.
Munnell, A (1992), Policy Watch: Infrastructure
Investment and Economic Growth, Journal ofEconomic Perspectives, vol. 6, no. 4, pp. 189 –
198.
Narayana, M (2008), Telecommunication Services
and Economic Growth: Evidence from India.
66
JOURNAL OF MANAGEMENT – Volume IX No.1 - October 2013
Röller, L & Waverman, L (2001), Telecommu -
nication Infrastructure and Economic
Development: A Simultaneous Approach, TheAmerican Economic Review, Vol. 91, No. 4,
pp. 909-923.
Seethepalli, K, Bramati, M & Veredas, D (2008),
How Relevant Is Infrastructure to Growth in
East Asia?, World Bank Policy ResearchWorking Paper 4597.
Sridhar, K, & Sridhar, V (2004),
Telecommunications Infrastructure and
Economic Growth: Evidence from Developing
Countries.
Straub, S, Vellutini, C & Warlters, M (2008),
Infrastructure and Economic Growth in East
Asia, World Bank Policy Research WorkingPaper 4589.
Telecommunications Regulatory Commission,
(2006), Proposed Ten Year Development Plan(2006 – 2016).
Torero, M, Chowdhury, S & Bedi, A (2002),
Telecommunication Infrastructure and
Economic Growth: A Cross-Country Analysis.
Vijayamohanan, P (2008), Infrastructure, Growth
and Human Development in Kerala, MPRApaper no. 7017.
Vuong, V (2008), Mobile Telecommunication
Impact on Developing Countries’ Growth.
Waverman, L, Meschi, M & Fuss, M 2005, The
Impact of Telecoms on Economic Growth in
Developing Countries, Vodafone Policy PaperSeries, No. 2, pp. 10-23.
Yoo, S (2002), An Empirical Investigation of
Telecommunications Investment and Economic
Development in Developing Countries.
67
The Impact of Telecommunication Growth on the Service Sector:A Cointegration Analysis
Appendix
Table 1- Unit Root Test for Levels
Variable ADF Test Statistic and Significance
Order of Integration
Service Sector Growth (St) -4.5499*** I (1) Telecom. Sector growth (TMDRt) -4.3272*** I (1) Wholesale & Retail Trad. growth (Wt) -4.9689*** I (1) Banking & Finance growth (Bt) -3.3245*** I (1) Ownership of Dwellings growth (Odt) -4.1761*** I (1) Public Services Growth (Pbt) -4.3349*** I (1) Private Services Growth (Prt) -3.8621*** I (1) Note: Intercept and one lag included. The symbols ***, **, * denote statistical significance at 1% , 5% and 10% levels respectively. Time period: 1979 – 2010 (32 years)
Table 2 – Engle Granger Cointegration test (unit root (ADF) test of the residual)
ADF Test Statistic -4.630483 1% Critical Value* -3.6661 5% Critical Value -2.9627 10% Critical Value -2.6200
*MacKinnon critical values for rejection of hypothesis of a unit root.
Augmented Dickey-Fuller Test Equation Dependent Variable: D(SPECIFICRESID) Method: Least Squares Date: 08/29/11 Time: 13:48 Sample(adjusted): 1981 2010 Included observations: 30 after adjusting endpoints
Variable Coefficient Std. Error t-Statistic Prob. SPECIFICRESID(-1) -1.408161 0.304107 -4.630483 0.0001 D(SPECIFICRESID(-
1)) 0.117221 0.192800 0.607992 0.5483
C -0.009857 0.620302 -0.015891 0.9874 R-squared 0.633786 Mean dependent var 0.097764 Adjusted R-squared 0.606659 S.D. dependent var 5.415507 S.E. of regression 3.396438 Akaike info criterion 5.377971 Sum squared resid 311.4664 Schwarz criterion 5.518091 Log likelihood -77.66957 F-statistic 23.36368 Durbin-Watson stat 1.978275 Prob(F-statistic) 0.000001
Table 3 – Johansen Cointegration Test
Sample: 1979 2010 Included Observations: 30 Test assumption: Linear deterministic trend in the data Series: S TMDR W B OD PB PR Lag interval: 1 to 1 Likelihood 5 Percent 1 Percent Hypothesized

68
JOURNAL OF MANAGEMENT – Volume IX No.1 - October 2013
Eigenvalue Ratio Critical Value Critical Value No. of CE(s) 0.936110 207.0635 124.24 133.57 None ** 0.779483 124.5458 94.15 103.18 At most 1 ** 0.623548 79.19239 68.52 76.07 At most 2 ** 0.561084 49.88346 47.21 54.46 At most 3 * 0.397984 25.18005 29.68 35.65 At most 4 0.219721 9.955896 15.41 20.04 At most 5 0.080348 2.512791 3.76 6.65 At most 6 *(**) denotes rejection of the hypothesis at 5% (1%) significance level. L.R. test indicates 4 cointegrating equation(s) at 5% significance level.
Table 4 – Cointegrating Regression Output
Dependent Variable: S Method: Least Squares Date: 08/16/11 Time: 15:33 Sample: 1979 2010 Included observations: 32
Variable Coefficient Std. Error t-Statistic Prob. TMDR 0.035569 0.019620 1.812872 0.0819
W 0.362765 0.053733 6.751248 0.0000 B 0.175272 0.045625 3.841538 0.0007 OD 0.042322 0.023517 1.799657 0.0840 PB 0.146131 0.046557 3.138756 0.0043 PR 0.042817 0.059946 0.714248 0.4817 C 0.563931 0.818143 0.689282 0.4970
R-squared 0.800449 Mean dependent var 6.526622 Adjusted R-squared 0.752557 S.D. dependent var 3.395904 S.E. of regression 1.689246 Akaike info criterion 4.077082 Sum squared resid 71.33883 Schwarz criterion 4.397712 Log likelihood -58.23331 F-statistic 16.71357 Durbin-Watson stat 2.339236 Prob(F-statistic) 0.000000
Table 5 – Error Correction Model
Dependent Variable: D(S) Method: Least Squares Date: 08/29/11 Time: 18:29 Sample(adjusted): 1980 2010 Included observations: 31 after adjusting endpoints
Variable Coefficient Std. Error t-Statistic Prob. D(TMDR) 0.115603 0.044077 2.622733 0.0140
ERROR(-1) -1.258183 0.175310 -7.176912 0.0000 C -0.061204 0.577814 -0.105923 0.9164
R-squared 0.678513 Mean dependent var 0.055591 Adjusted R-squared 0.655550 S.D. dependent var 5.478778 S.E. of regression 3.215489 Akaike info criterion 5.265601 Sum squared resid 289.5023 Schwarz criterion 5.404374 Log likelihood -78.61682 F-statistic 29.54765 Durbin-Watson stat 1.918998 Prob(F-statistic) 0.000000

69
The Impact of Telecommunication Growth on the Service Sector:A Cointegration Analysis
Table 6 – Granger Causality Test
Direction of Causality F value Probability Decision
TMDRrt does not Granger cause Srt 2.4347* 0.0919 Reject Srt does not Granger cause TMDRrt 0.2046 0.8921 Do not Reject Note: (*) denotes significance at 10 %
Rr
6 elTab –
fonoitcerDi
rRDTM t doeSrt Gnotsdoe
ned)*(:etNo
tsty Teialsau CrgeanrG
ytilasuaC
rSeusacrngearGnots trRDMTeusacrngearG t
%01taecnaciffiingisseton
eulavF
4347*2.20460.
ytilibaboPr isicDe
09190. tcejReej89210. Do not
no
tcejeejRnot
Figure 1 – Growth Trend in Tele-Mobile Density Rate (TMDR) and Service Sector
(20.0)
-
20.0
40.0
60.0
80.0
19
79
19
81
19
83
19
85
19
87
19
89
19
91
19
93
19
95
19
97
19
99
200
1
200
3
200
5 2
007
200
9
Gro
wth
Rate
s (
%)
Year
Growth in Service Sector and TMDR
(1979 - 2010)
���������� ���� ����
������� ����
Mobile denstity rate included after 1994
� � �
�
� � �
�
� � �
�
� � �
�
� � �
�
� � �
�
1 erguiF –
� � �
�
– el Ten idne TrthowrG -M
titnsdeelobiM
� � �
�
(TMatety Risne DeliobM
eaty rt
� � �
�
torce Secvire Sd) anRD (TM
� � �
�
tor
� � �
�
� � �
�
19
79
19
81
19
83
19
85
19
87
19
89
19
91
titns deelobiMfddli
� � �
�
19
93
19
97
19
99
200
1
200
3
200
52
007
200
9
e1
995
aty rt91994
� � �
�
� � �
�
� � �
�
� � �
�
� � �
�
� � �
�
� � �
�
Figure 2 – Significance of the Transport, Storage and Communication Sector within the
Service Sector
Data Source : Central Bank Annual Reports (1978 and 2010)
����
����
���
���
����
���
�����Service Sector Real GDP
Rs. 1283 million
��
�������
���
����
���
�����
�� ������������ ��� � �!�""#��� $���%��&�� &�� � ���� �&��� ��' �(�����)�� ���� � ��� &�*�� ���+���������,����&&����-#.&������������
-��� ������������
Service Sector Real GDP Rs. 9522 million
� �
� �� � �
�� � �
� �
��
� �
2 erguiF –
e SecvireS
� �
� �� � �
�� � �
� �
��
� �
– an Tre of thecancfiigniS
torce
� �
� �� � �
�� � �
� �
��
� �
ommu Cd anagetort, Sorpsan
� �
� �� � �
�� � �
� �
��
� �
onaticinommu thi wtorceS
� �
� �� � �
�� � �
� �
��
� �
e thni
� �
� �� � �
�� � �
� �
��
� �
� �
� �� � �
�� � �
� �
��
� �
� �
� �� � �
�� � �
� �
��
� �
� �
� �� � �
�� � �
� �
��
� �
� �
� �� � �
�� � �
� �
��
� �
� �
� �� � �
�� � �
� �
��
� �
� �
� �� � �
�� � �
� �
��
� �
� �
� �� � �
�� � �
� �
��
� �
neCCe:ecruoSatDa
� �
� �� � �
�� � �
� �
��
� �
791((1sttsropeepRlaunnAknaBlart
� �
� �� � �
�� � �
� �
��
� �
)00)102dna87
Data source: Cental Bank Annual Reports various issues