the impact of technological distance on m&a target … · m&a target choice and transaction...
TRANSCRIPT

The Impact of Technological Distance on
M&A Target Choice and Transaction Value IPSDM Conference, Tokyo, 17-18 Nov. 2014
Florian Stellner

2 Florian Stellner, The Impact of Technological Distance on M&A Target Choice and Transaction Value
Agenda
1. Introduction & Motivation
2. Hypotheses
3. Choice model
4. Data
5. Descriptives
6. Results & robustness checks
7. Conclusions

3 Florian Stellner, The Impact of Technological Distance on M&A Target Choice and Transaction Value
What is technological distance? • I am interested in the technological distance between firms
• Other researchers use the terms technological relatedness, proximity or similarity
• Conceptually: The overlap of knowledge base between firms: e.g. methods of search, sources of knowledge, area of application, etc. (Breschi, Lissoni & Malerba, 2003)
More overlap means less distance
• Formally: The length of technological space between two firms
• Typically measured using patent data, especially the classification (IPCs or USPTO) of patents into patent classes, subclasses, etc.
• Firms are described as a vector in knowledge space, where the elements represent the share of a particular patent class for a particular firm

4 Florian Stellner, The Impact of Technological Distance on M&A Target Choice and Transaction Value
Measuring technological distance
=> Jaffe covariance has stronger microeconomic foundations (Bloom, Schankerman & van Reenen, 2013), no bias in small samples (->bootstrapping analysis) and satisfies the independence of irrelevant patent classes criterion (Bar & Leiponen, 2012)
(1) (2) (3) (4) (5) (6) (7) (8) (9) (10)
Micro-
economic
foundations
Own distance Symmetry
Indepen-
dence to
scaling
Robustness
to the
propensity to
patent
Same field
patenting
Accout for
field
relatedness
Insensitivity
to level of
aggegation
Indepen-
dence of
irrelevant
fields
Ease of
calculation
Angular separation
Euclidean distance
Jaffe covariance
Pearson correlation
CRTA
Min-complement
Mahalanobis distance ()Weighted angular
separation ()Patent-to-patent
angular separation
Patent-to-patent
textual distance () n/a n/a

5 Florian Stellner, The Impact of Technological Distance on M&A Target Choice and Transaction Value
Impact of technological distance on innovation performance post M&A
• Ahuja and Katila (2001): innovation output (patents) post M&A is higher when there is an intermediate level of technological distance.
• Subsequently confirmed by Cloodt, Hagedoorn and van Kranenburg (2006), Prabhu, Chandy and Ellis (2005) and Sears and Hoetker (2014).
• Alliance literature has also found that an intermediate level of relatedness is most conducive to innovation (Nooteboom, van Haverbeke, Duysters, Gilsing & van den Oord, 2007).
ABSORPTIVE CAPACITY LEARNING / NOVELTY GAIN
An intermediate level of technological distance is most conducive to post M&A innovation performance

6 Florian Stellner, The Impact of Technological Distance on M&A Target Choice and Transaction Value
The impact of technological distance on M&A target choice and transactions values • Typically analyzed with a binary choice model estimated using conditional logit
going back to Hall (1988).
• Also used by AlAzzawi (2008); Bena & Li (in press); Frey & Hussinger (2006); Hussinger (2010).
Firms choose technologically close firms; no indication of curvilinear effect (sometimes not tested for)
0 Acquirers choose targets which are close to them in technology space

7 Florian Stellner, The Impact of Technological Distance on M&A Target Choice and Transaction Value
Post M&A Performance vs. Target Choice
8 Florian Stellner, The Impact of Technological Distance on M&A Target Choice and Transaction Value
Hypothesis 1
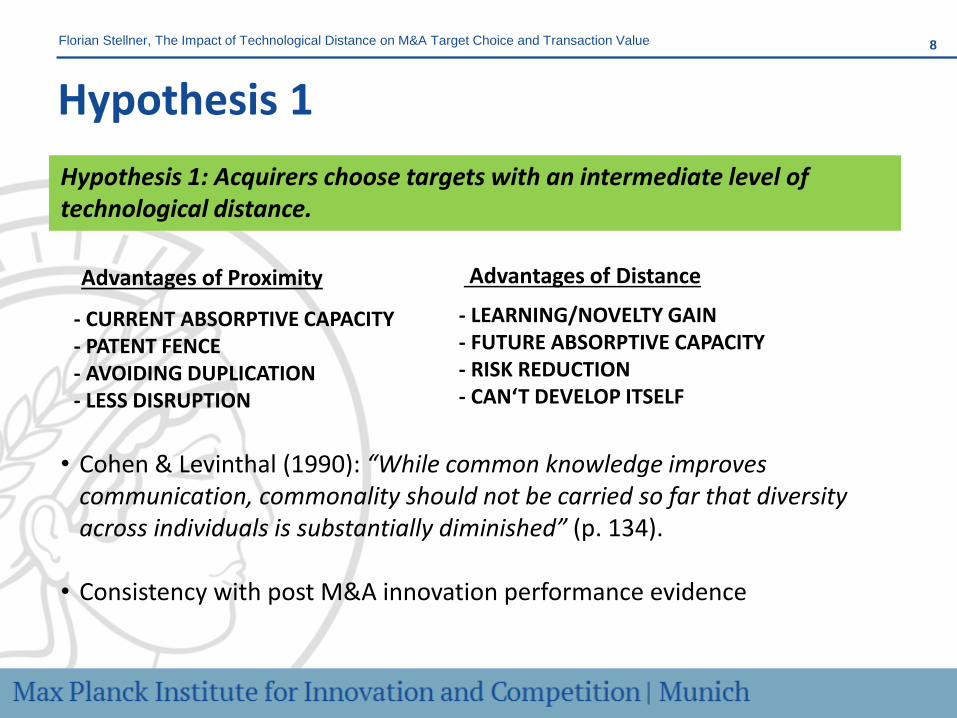
Hypothesis 1: Acquirers choose targets with an intermediate level of technological distance.
• Cohen & Levinthal (1990): “While common knowledge improves
communication, commonality should not be carried so far that diversity across individuals is substantially diminished” (p. 134).
• Consistency with post M&A innovation performance evidence
- CURRENT ABSORPTIVE CAPACITY - PATENT FENCE - AVOIDING DUPLICATION - LESS DISRUPTION
- LEARNING/NOVELTY GAIN - FUTURE ABSORPTIVE CAPACITY - RISK REDUCTION - CAN‘T DEVELOP ITSELF
Advantages of Distance Advantages of Proximity
9 Florian Stellner, The Impact of Technological Distance on M&A Target Choice and Transaction Value
Hypothesis 2
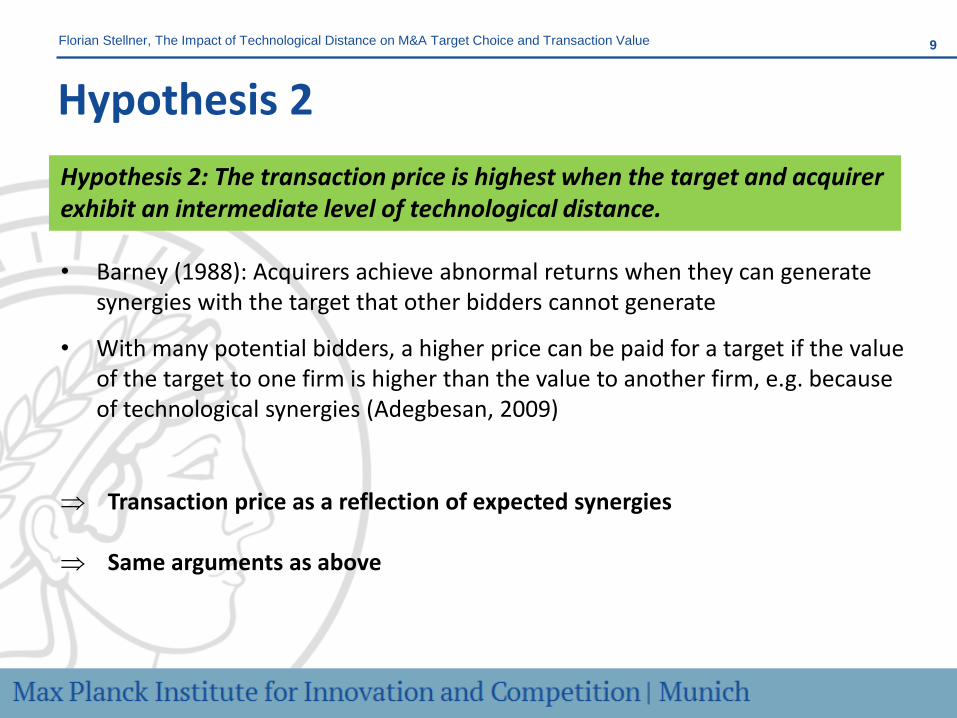
Hypothesis 2: The transaction price is highest when the target and acquirer exhibit an intermediate level of technological distance. • Barney (1988): Acquirers achieve abnormal returns when they can generate
synergies with the target that other bidders cannot generate
• With many potential bidders, a higher price can be paid for a target if the value of the target to one firm is higher than the value to another firm, e.g. because of technological synergies (Adegbesan, 2009)
Transaction price as a reflection of expected synergies
Same arguments as above

10 Florian Stellner, The Impact of Technological Distance on M&A Target Choice and Transaction Value
Hypothesis 3
Hypothesis 3: The higher the product market (technological) distance between the acquirer and the target, the more will acquirers prefer firms which are close in technological (product market) space. Acquiring companies which are distant in technology or product market space is associated with uncertainty and asymmetric information. • When acquiring a company which is close in technology space, the
acquirer can venture into new product markets
• When acquiring a company which is close in terms of product market, the acquirer can venture into new technology fields

11 Florian Stellner, The Impact of Technological Distance on M&A Target Choice and Transaction Value
Hall‘s (1988) model of target choice • The decision of the acquirer which firm to buy
• The value of a firm is a function of its characteristics:
• Denote j the acquirer, S the choice set and the value increment to j from an acquisition , and the price j has to pay for firm i
• An acquisition will take place under two conditions:
• The probability that j acquires i is estimated using a conditional logit model:
• Net gain from is modeled as a function of the target characteristics, acquirer characteristics (not measureable!) and the relationship between the two
Choice set
• Each acquirer is given a choice of non-chosen firms in addition to the target
a. Random sample of firms
b. Matching based on identical 2-digit primary SIC (and size)
𝑉 𝑋𝑖 = 𝑉(𝑋1,𝑋2, 𝑋3 … )
𝑉𝑗 𝑋𝑖 − 𝑃𝑖 > 𝑉𝑗 𝑋𝑘 − 𝑃𝑘 ∀ (𝑘 ≠ 𝑖) ∈ 𝑆
𝑉𝑗 𝑋𝑖 − 𝑃𝑖 ≥ 0
𝑃(𝑗 𝑎𝑐𝑞𝑢𝑖𝑟𝑒𝑠 𝑖|𝑆) =exp(𝑓 𝑋𝑖 , 𝑋𝑗 )
exp(𝑓 𝑋𝑘 ,𝑋𝑗 )k∈S
𝑉𝑗 𝑋𝑖
𝑃𝑖

12 Florian Stellner, The Impact of Technological Distance on M&A Target Choice and Transaction Value
Data • 538 M&A transactions in the time period 1985-2005
• Covering both public and VC financed firms
• Subsample of 380 firms for which financials are available
• Both target and acquirer must have filed for at least one patent in the five years prior to the transaction
• Sources: Thomson Reuters SDC for M&A transactions and VC financed firms; NBER Patent Data Project for US patents, Compustat for financials
• Aside: Determining the patent portfolio of company X at time T:
• Name standardization (typos, parent company)
• Dynamic reassignments for listed firms (reorganizations, M&A)
• Name matching algorithm for private firms

13 Florian Stellner, The Impact of Technological Distance on M&A Target Choice and Transaction Value
Variables • Dependent variable 1: Indicator function equal to one if a firm is acquired • Dependent variable 2: Natural logarithm of the transaction price
• Technological distance: Angular separation or Jaffe covariance based on the 37
technology subcategories determined by Hall, Jaffe and Trajtenberg (2001) • Product market overlap: Set to 0, 1, 2 or 3 depending on 4-,3- or 2-digit SICs overlap
• Patent stock (ln): Patent (successfully) applied for in the five calendar years prior to the transaction, depreciated by 15%
• Patenting growth (ln): Number of patent applied for in Y1+2+3 prior to the transaction relative to patent applied for in Y4+5+6 prior to the transaction.
• Technological diversification: Number equivalent entropy • R&D (ln)
• Assets (ln) • Return on assets (RoA) • Sales growth
Dis
tan
ces
Inn
ova
tio
n m
etri
cs
Fin
anci
als

14 Florian Stellner, The Impact of Technological Distance on M&A Target Choice and Transaction Value
Descriptives
Business
Services
Instruments &
Related
Products
Electronic &
Other Electric
Equipment
Industrial
Machinery &
Equipment
Chemical &
Allied Products Other SUM
Business Services 11.9% 0.6% 1.1% 1.3% 0.0% 0.2% 15.1%
Instruments & Related Products 1.5% 10.8% 2.0% 1.9% 0.7% 0.6% 17.5%
Electronic & Other Electric Equipment 1.3% 1.1% 11.0% 1.3% 0.0% 0.7% 15.4%
Industrial Machinery & Equipment 4.3% 0.9% 3.5% 7.2% 0.0% 0.7% 16.7%
Chemical & Allied Products 0.0% 3.5% 0.0% 0.2% 12.1% 3.2% 19.0%
Other 0.6% 0.9% 1.7% 2.0% 0.4% 10.8% 16.4%
SUM 19.5% 17.8% 19.3% 13.9% 13.2% 16.2% 100.0%
Target Sector
Acq
uir
or
Secto
r
# Sample * Transactions Strata Size Average Median Min. Max.
1 Public & private, matched (SIC) 538 507 172,259 341 363 9 776
2 Public & private, random 538 507 244,841 484 484 473 495
3 Public, matched (SIC, size) 380 362 48,199 134 146 3 245
4 Public, random 380 362 65,336 182 190 35 256
Choice set statistics
* Matched refers the case where the choice set is constituted of firms in with the same 2-digit SIC code as the target and, in the case of public
firms for which financials are available, where assets are not in excess of twice the acquirer's assets. Random refers to the case where the choice
set is allocated randomly the acquirers.

15 Florian Stellner, The Impact of Technological Distance on M&A Target Choice and Transaction Value
Choice model
(1) (2) (3) (4) (5) (6) (7) (8)
Angular separation 5.660*** 6.874*** 5.404*** 7.145***
(0.610) (0.580) (0.755) (0.707)
(Angular separation)^2 -3.207*** -3.968*** -2.679*** -3.898***
(0.633) (0.609) (0.764) (0.739)
Jaffe covariance 8.990*** 10.64*** 9.143*** 11.53***
(0.613) (0.614) (0.781) (0.781)
(Jaffe covariance)^2 -7.588*** -8.801*** -7.095*** -9.114***
(0.747) (0.775) (0.896) (0.975)
Product market overlap 1.065*** 1.109*** 1.006*** 1.051*** 1.020*** 1.064*** 0.867*** 0.913***
(0.107) (0.107) (0.0527) (0.0528) (0.127) (0.126) (0.0597) (0.0605)
Size of patent portfolio (ln) 0.0844* 0.0720* 0.0894* 0.0751* -0.175** -0.169** -0.152** -0.154**
(0.0369) (0.0361) (0.0358) (0.0350) (0.0580) (0.0573) (0.0561) (0.0555)
Patenting growth -0.119*** -0.117*** -0.132*** -0.130*** -0.157*** -0.155*** -0.161*** -0.159***
(0.0261) (0.0262) (0.0271) (0.0274) (0.0382) (0.0385) (0.0390) (0.0397)
Technological diversification -0.113*** -0.0185 -0.116*** -0.00248 -0.121** -0.0174 -0.126** 0.0104
(0.0315) (0.0274) (0.0312) (0.0264) (0.0401) (0.0360) (0.0399) (0.0346)
R&D productivity 0.0189 0.0161 0.00706 0.00391
(0.0312) (0.0314) (0.0262) (0.0268)
R&D expenditures (ln) 0.292** 0.282** 0.294*** 0.284***
(0.0937) (0.0939) (0.0847) (0.0845)
R&D intensity -0.202 -0.202 -0.751 -0.774
(0.521) (0.521) (0.509) (0.518)
Total assets (ln) 0.0641 0.0658 0.0137 0.0147
(0.0828) (0.0828) (0.0743) (0.0740)
Return on assets -0.115 -0.101 -0.141 -0.136
(0.190) (0.191) (0.189) (0.193)
Sales growth -0.0851 -0.0858 -0.0962 -0.0960
(0.0495) (0.0502) (0.0559) (0.0556)
N 172797 172797 245379 245379 48579 48579 65716 65716
Pseudo R^2 0.106 0.099 0.244 0.234 0.146 0.137 0.296 0.284
* p<0.05, ** p<0.01, *** p<0.001; numbers in parentheses are standard errors
Public & Private, matched (SIC) Public & Private, random Public, matched (SIC, size) Public, random
16 Florian Stellner, The Impact of Technological Distance on M&A Target Choice and Transaction Value
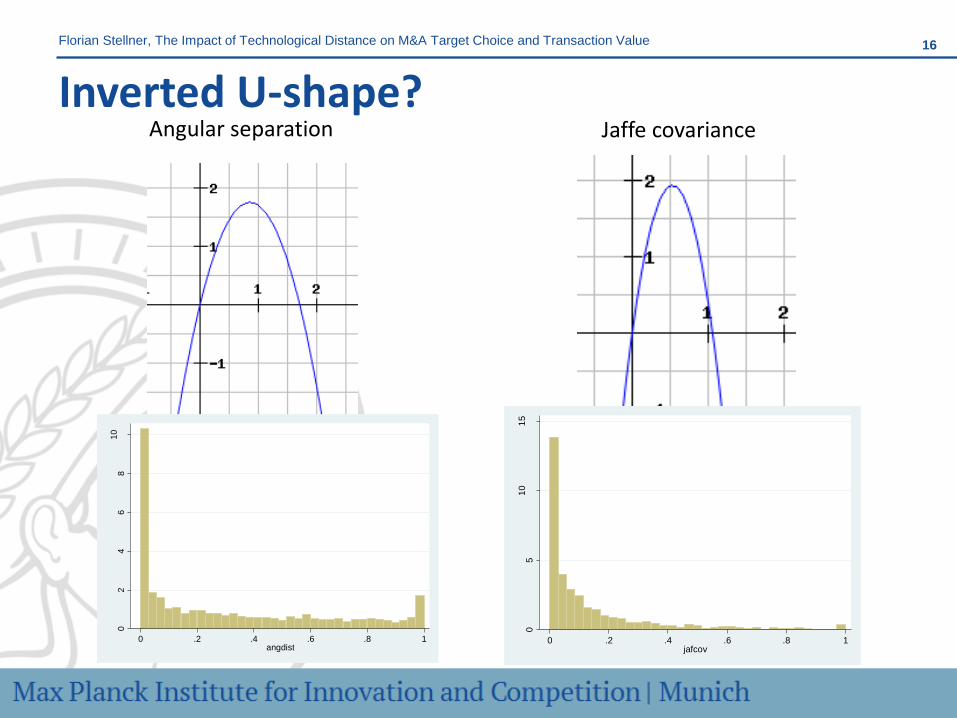
Inverted U-shape? Angular separation Jaffe covariance
05
10
15
Den
sity
0 .2 .4 .6 .8 1jafcov
02
46
81
0
Den
sity
0 .2 .4 .6 .8 1angdist
17 Florian Stellner, The Impact of Technological Distance on M&A Target Choice and Transaction Value
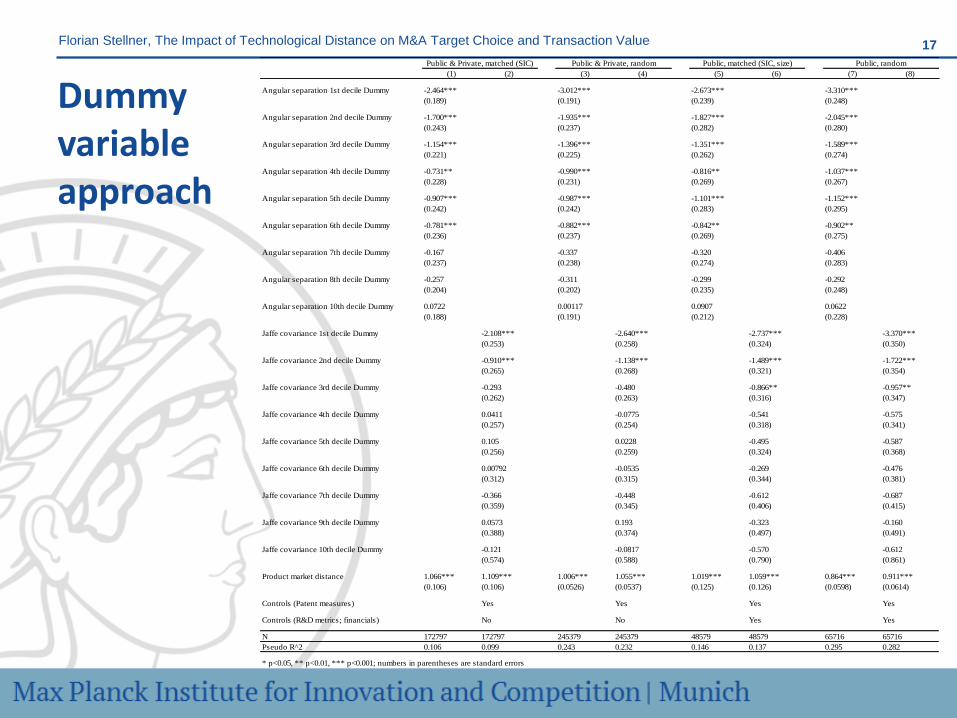
Dummy variable approach
(1) (2) (3) (4) (5) (6) (7) (8)
Angular separation 1st decile Dummy -2.464*** -3.012*** -2.673*** -3.310***
(0.189) (0.191) (0.239) (0.248)
Angular separation 2nd decile Dummy -1.700*** -1.935*** -1.827*** -2.045***
(0.243) (0.237) (0.282) (0.280)
Angular separation 3rd decile Dummy -1.154*** -1.396*** -1.351*** -1.589***
(0.221) (0.225) (0.262) (0.274)
Angular separation 4th decile Dummy -0.731** -0.990*** -0.816** -1.037***
(0.228) (0.231) (0.269) (0.267)
Angular separation 5th decile Dummy -0.907*** -0.987*** -1.101*** -1.152***
(0.242) (0.242) (0.283) (0.295)
Angular separation 6th decile Dummy -0.781*** -0.882*** -0.842** -0.902**
(0.236) (0.237) (0.269) (0.275)
Angular separation 7th decile Dummy -0.167 -0.337 -0.320 -0.406
(0.237) (0.238) (0.274) (0.283)
Angular separation 8th decile Dummy -0.257 -0.311 -0.299 -0.292
(0.204) (0.202) (0.235) (0.248)
Angular separation 10th decile Dummy 0.0722 0.00117 0.0907 0.0622
(0.188) (0.191) (0.212) (0.228)
Jaffe covariance 1st decile Dummy -2.108*** -2.640*** -2.737*** -3.370***
(0.253) (0.258) (0.324) (0.350)
Jaffe covariance 2nd decile Dummy -0.910*** -1.138*** -1.489*** -1.722***
(0.265) (0.268) (0.321) (0.354)
Jaffe covariance 3rd decile Dummy -0.293 -0.480 -0.866** -0.957**
(0.262) (0.263) (0.316) (0.347)
Jaffe covariance 4th decile Dummy 0.0411 -0.0775 -0.541 -0.575
(0.257) (0.254) (0.318) (0.341)
Jaffe covariance 5th decile Dummy 0.105 0.0228 -0.495 -0.587
(0.256) (0.259) (0.324) (0.368)
Jaffe covariance 6th decile Dummy 0.00792 -0.0535 -0.269 -0.476
(0.312) (0.315) (0.344) (0.381)
Jaffe covariance 7th decile Dummy -0.366 -0.448 -0.612 -0.687
(0.359) (0.345) (0.406) (0.415)
Jaffe covariance 9th decile Dummy 0.0573 0.193 -0.323 -0.160
(0.388) (0.374) (0.497) (0.491)
Jaffe covariance 10th decile Dummy -0.121 -0.0817 -0.570 -0.612
(0.574) (0.588) (0.790) (0.861)
Product market distance 1.066*** 1.109*** 1.006*** 1.055*** 1.019*** 1.059*** 0.864*** 0.911***
(0.106) (0.106) (0.0526) (0.0537) (0.125) (0.126) (0.0598) (0.0614)
Controls (Patent measures) Yes Yes Yes Yes
Controls (R&D metrics; financials) No No Yes Yes
N 172797 172797 245379 245379 48579 48579 65716 65716
Pseudo R^2 0.106 0.099 0.243 0.232 0.146 0.137 0.295 0.282
* p<0.05, ** p<0.01, *** p<0.001; numbers in parentheses are standard errors
Public & Private, randomPublic & Private, matched (SIC) Public, matched (SIC, size) Public, random

18 Florian Stellner, The Impact of Technological Distance on M&A Target Choice and Transaction Value
Fractional polynomials Sample / Measure Best specification Graphical
Sample: Public, matched (SIC, size)
Measure: Jaffe covariance (JC)
β1 *(X^(-0.5)-2.64)+ β2*(ln(X)+1.94)
where X=JC+2.328*e^(-10)
β1=0.0002161 (t-stat: 8.47)
β2=0.7773188 (t-stat: 9.60)
Sample: Public, matched (SIC, size)
Measure: Angular separation (AS)
β1 *(ln(X)-1.16)+ β2*(ln(X)*ln(X) -
1.34)
where X=AS+3.818*e^(-10)
β1=1.003695 (t-stat: 9.79)
β2=0.0494789 (t-stat: 8.58)
Sample: Public, random
Measure: Jaffe covariance (JC)
β1 *(X^(-0.5)-3.49)+ β2*(ln(X)+2.50)
where X=JC+1.164*e^(-10)
β1=0.0001852 (t-stat: 9.07)
β2=0.9177666 (t-stat: 10.30)
Sample: Public, random
Measure: Angular separation (AS)
β1 *(X^(0.5)-.436)
where X=AS+7.451*e^(-9)
β1=3.817814 (t-stat: 14.27)
19 Florian Stellner, The Impact of Technological Distance on M&A Target Choice and Transaction Value
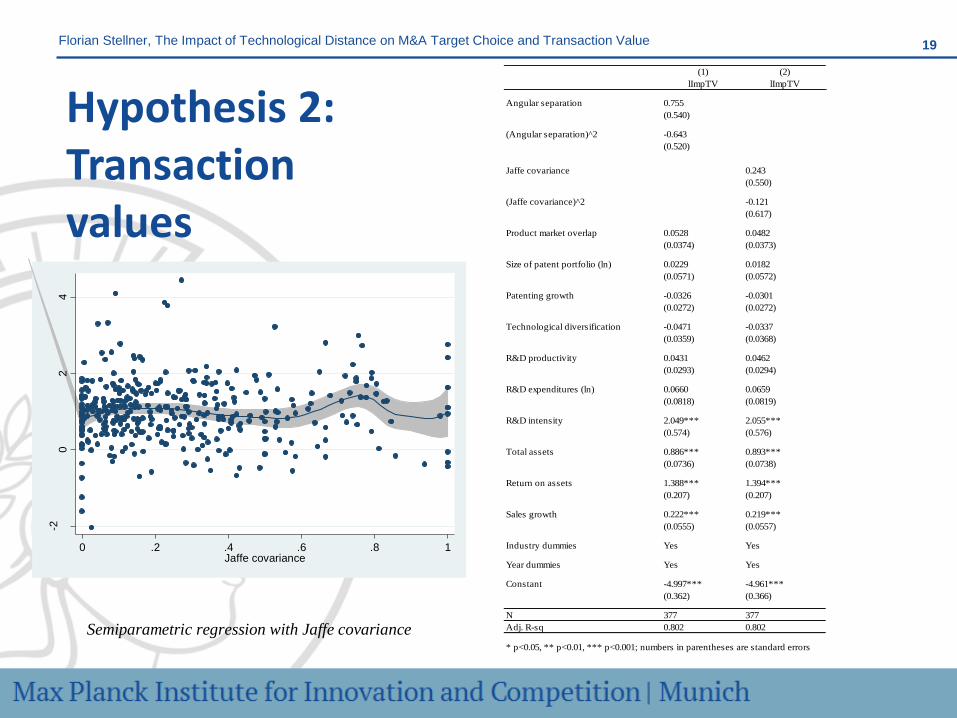
Hypothesis 2: Transaction values
(1) (2)
lImpTV lImpTV
Angular separation 0.755
(0.540)
(Angular separation)^2 -0.643
(0.520)
Jaffe covariance 0.243
(0.550)
(Jaffe covariance)^2 -0.121
(0.617)
Product market overlap 0.0528 0.0482
(0.0374) (0.0373)
Size of patent portfolio (ln) 0.0229 0.0182
(0.0571) (0.0572)
Patenting growth -0.0326 -0.0301
(0.0272) (0.0272)
Technological diversification -0.0471 -0.0337
(0.0359) (0.0368)
R&D productivity 0.0431 0.0462
(0.0293) (0.0294)
R&D expenditures (ln) 0.0660 0.0659
(0.0818) (0.0819)
R&D intensity 2.049*** 2.055***
(0.574) (0.576)
Total assets 0.886*** 0.893***
(0.0736) (0.0738)
Return on assets 1.388*** 1.394***
(0.207) (0.207)
Sales growth 0.222*** 0.219***
(0.0555) (0.0557)
Industry dummies Yes Yes
Year dummies Yes Yes
Constant -4.997*** -4.961***
(0.362) (0.366)
N 377 377
Adj. R-sq 0.802 0.802
* p<0.05, ** p<0.01, *** p<0.001; numbers in parentheses are standard errors
Semiparametric regression with Jaffe covariance
-20
24
Tra
nsactio
n V
alu
e
0 .2 .4 .6 .8 1Jaffe covariance

20 Florian Stellner, The Impact of Technological Distance on M&A Target Choice and Transaction Value
Hypothesis 3: Interaction effect
(1) (2) (3) (4) (5) (6) (7) (8)
Angular separation 3.048*** 3.956*** 3.029*** 4.130***
(0.218) (0.169) (0.274) (0.215)
Jaffe covariance 4.218*** 5.021*** 4.750*** 5.738***
(0.354) (0.245) (0.527) (0.377)
Product market overlap 1.234*** 1.349*** 1.370*** 1.350*** 1.108*** 1.312*** 1.226*** 1.222***
(0.125) (0.113) (0.0681) (0.0544) (0.152) (0.135) (0.0858) (0.0668)
Product market overlap * Angular separation -0.301** -0.667*** -0.151 -0.626***
(0.114) (0.0944) (0.155) (0.128)
Product market overlap * Jaffe covariance -0.725*** -0.893*** -0.706** -0.912***
(0.152) (0.101) (0.235) (0.149)
Controls (Patents) Yes Yes Yes Yes Yes Yes Yes Yes
Controls (Innovation & Financials) No No No No Yes Yes Yes Yes
N 172797 172797 245379 245379 48567 48567 65480 65480
Pseudo R^2 0.103 0.083 0.244 0.217 0.142 0.122 0.293 0.263
* p<0.05, ** p<0.01, *** p<0.001; numbers in parentheses are standard errors
Private & Public, matched (SIC) Private & Public, random Public, matched (SIC, size) Public, random

21 Florian Stellner, The Impact of Technological Distance on M&A Target Choice and Transaction Value
Conclusion
• No robust evidence for inverted U-shape relationship between technological distance and the likelihood of being chosen as a target
• Rather, the relationship appears to be better represented by a flattening curve
• Importance of methodological rigor
• What may explain the apparent puzzle between post M&A performance and target choice?
• Risk averse managers
• Improving innovation output may not be the driver of the transactions. Acquirers may choose close firms if it generates economies of scale that outweigh the innovation output effect
• Post M&A evidence has not been thoroughly tested (only linear and squared terms included, but also very little mass in declining part of the curve)

22 Florian Stellner, The Impact of Technological Distance on M&A Target Choice and Transaction Value
Thank you for your attention!
Florian Stellner | [email protected]

23 Florian Stellner, The Impact of Technological Distance on M&A Target Choice and Transaction Value
APPENDIX
23

24 Florian Stellner, The Impact of Technological Distance on M&A Target Choice and Transaction Value
Technology as a motivation for M&A • Cost driven motivations such as economies of scale or scope in R&D activities
(Cassiman & Ueda, 2006), avoiding duplication (Comanor & Scherer, 2012)
• Creating synergies (Barney, 1988; Karim & Mitchell, 2000)
• Strengthening core competencies and restructure existing competencies (Frey & Hussinger, 2006)
• Exploring and adapting to a changing environment: overcoming the competency trap (Levitt & March, 1988) & core rigidities (Leonard-Barton, 1995)
• Reducing the risk profile
• For “strategic” reasons (Gans & Stern, 2000; Grimpe & Hussinger, 2008, 2013)
• Obtaining access to valuable and scarce resources, e.g. key inventors and engineers (Ranft & Lord, 2000) or key patents
• Internalizing positive or negative knowledge spillovers (Hart & Holmstrom, 2010; Marco & Rausser, 2011)
• Providing the right incentives and organizational structure for innovation

25 Florian Stellner, The Impact of Technological Distance on M&A Target Choice and Transaction Value
Ex ante vs. ex post • Ex post impact is very interesting from a (merger) policy perspective, but…
• Ex post analysis suffers from many confounding effects; the smaller the target relative to the acquirer, the more difficult it is to measure an impact
• Ex post performance in terms of R&D is difficult to interpret
• There are also endogeneity concerns, as the innovation outlook of the acquirer may impact the choice of technologically distant vs. close targets
• Difficulties addressing timing and value aspects
• Ex ante investigation is much more amenable for empirical research
• The model presented below takes endogeneity explicitly into account
• Can determine the role of distance when a large firm acquires a small firm
• Timing issues as in the above case do not arise
• Relationship between expected benefits/synergies and realized benefits/synergies
• Managerial hubris (Roll, 1986) as well as empire building
• Different focus: the chosen firms vs. the choice set

26 Florian Stellner, The Impact of Technological Distance on M&A Target Choice and Transaction Value
Descriptives
# Variable Sample Mean S.D. 1 2 3 4 5 6 7 8 9 10 11 12 13 14
1 Angular separation 48,579 0.29 0.33 1.00
2 (Angular separtion)^2 48,579 0.19 0.30 0.96 1.00
3 Jaffe covariance 48,579 0.14 0.21 0.89 0.92 1.00
4 (Jaffe covariance)^2 48,579 0.06 0.16 0.70 0.80 0.93 1.00
5 Product market overlap 48,579 1.10 1.07 0.27 0.29 0.32 0.29 1.00
6 Size of patent portfolio (ln) 48,579 1.79 1.51 0.07 0.03 -0.07 -0.10 -0.04 1.00
7 Patenting growth 48,579 2.02 2.06 0.01 0.01 0.00 -0.01 0.03 0.15 1.00
8 Technological diversification 48,579 2.57 1.92 -0.01 -0.08 -0.19 -0.20 -0.10 0.68 -0.01 1.00
9 R&D productivity 48,579 1.78 3.17 -0.06 -0.05 -0.05 -0.02 -0.05 0.12 -0.03 0.05 1.00
10 R&D expenditures (ln) 48,579 2.18 1.68 0.14 0.09 0.03 -0.02 0.06 0.54 0.12 0.40 -0.54 1.00
11 R&D intensity 48,579 0.15 0.18 0.13 0.14 0.16 0.14 0.13 -0.05 0.02 -0.15 -0.14 0.10 1.00
12 Total assets (ln) 48,579 4.62 1.74 0.04 -0.01 -0.08 -0.11 -0.04 0.53 0.07 0.48 -0.31 0.78 -0.42 1.00
13 Return on assets 48,579 -0.11 0.41 -0.10 -0.12 -0.14 -0.13 -0.10 0.13 0.00 0.18 -0.05 0.15 -0.69 0.47 1.00
14 Sales growth 48,579 1.40 1.32 0.04 0.05 0.07 0.07 0.04 -0.04 0.15 -0.10 -0.02 0.00 0.06 -0.04 -0.12 1.00
# Variable Sample Mean S.D. 1 2 3 4 5 6 7 8 9 10 11 12 13 14
1 Angular separation 380 0.56 0.34 1.00
2 (Angular separtion)^2 380 0.43 0.36 0.97 1.00
3 Jaffe covariance 380 0.27 0.25 0.81 0.85 1.00
4 (Jaffe covariance)^2 380 0.14 0.22 0.64 0.72 0.95 1.00
5 Product market overlap 380 1.40 1.29 0.28 0.30 0.27 0.24 1.00
6 Size of patent portfolio (ln) 380 1.79 1.58 0.22 0.17 -0.09 -0.13 0.06 1.00
7 Patenting growth 380 1.59 1.52 0.00 -0.01 0.00 -0.01 0.08 0.06 1.00
8 Technological diversification 380 2.57 1.95 0.05 -0.02 -0.31 -0.32 0.03 0.72 -0.06 1.00
9 R&D productivity 380 1.23 2.36 0.02 -0.01 -0.04 -0.06 -0.14 0.19 0.14 0.09 1.00
10 R&D expenditures (ln) 380 2.59 1.57 0.17 0.15 -0.06 -0.11 0.16 0.55 -0.08 0.44 -0.46 1.00
11 R&D intensity 380 0.15 0.17 0.15 0.19 0.26 0.25 0.08 -0.15 0.00 -0.23 -0.17 0.05 1.00
12 Total assets (ln) 380 5.03 1.71 0.06 0.02 -0.22 -0.25 0.06 0.59 -0.08 0.56 -0.21 0.76 -0.48 1.00
13 Return on assets 380 -0.08 0.38 -0.18 -0.21 -0.30 -0.29 -0.05 0.20 0.02 0.22 0.07 0.14 -0.79 0.50 1.00
14 Sales growth 380 1.24 0.83 0.05 0.06 0.11 0.12 0.01 -0.02 0.26 -0.12 -0.04 0.01 0.12 -0.08 -0.14 1.00
Descriptive statistics and correlation matrix (Public firms with choice set matchtched according to SIC and assets)
Descriptive statistics and correlation matrix (Public transactions excluding choice set)