the impact of systems improvements: a progress review · pdf file · 2014-04-17the...
TRANSCRIPT

The Impact of Systems Improvements: A Progress Review of Healthcare-Associated
Infections & Blood Disorders and Blood Safety
August 28, 2013

Howard K. Koh, MD, MPH Assistant Secretary for Health
U.S. Department of Health and Human Services

Progress Review Overview
■ Systems improvements with substantial impacts in Healthcare-Associated Infections and Blood Disorders and Blood Safety
■ Provide an update on the progress of Healthy People 2020 objectives
■ Examine what is being done to achieve the Healthy People 2020 objectives
3

Healthy People 2020 Remains Relevant
4
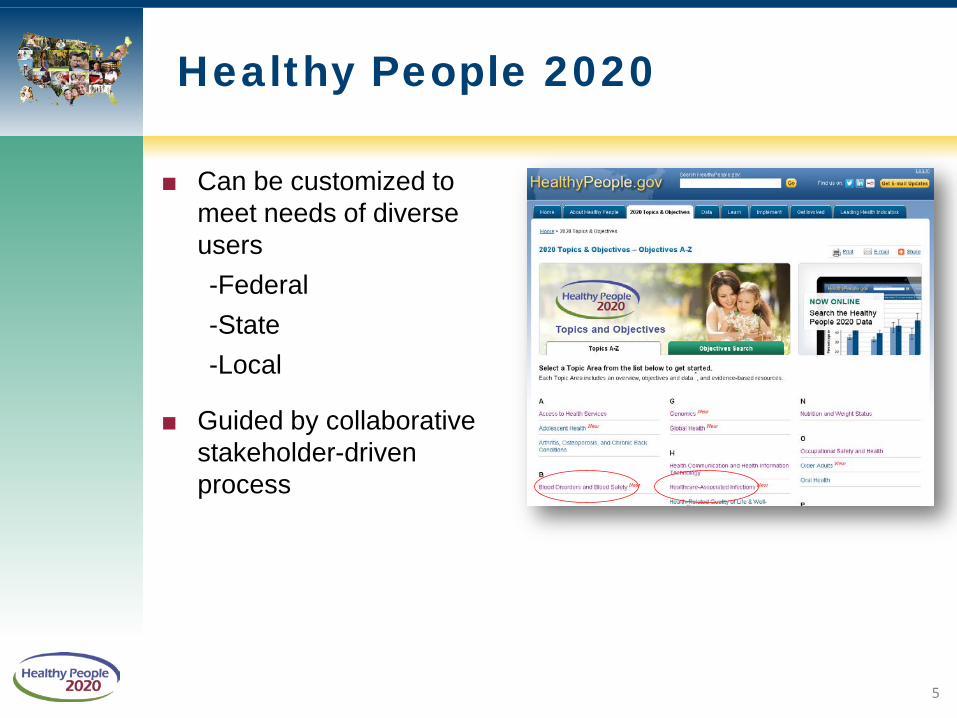
■ Can be customized to meet needs of diverse users -Federal -State -Local
■ Guided by collaborative stakeholder-driven process
Healthy People 2020
5

Healthcare-Associated Infections (HAI) Definition
Infections that people acquire while they are receiving treatment for another condition in healthcare settings:
■ Inpatient Hospitals
■ Ambulatory settings
■ Long-term care facilities
■ HAIs of unknown origin
6

Each year, 1 in 20 U.S. hospital patients acquires a healthcare-associated infection.
SOURCE: http://www.cdc.gov/HAI/burden.html
HAI Burden
$33 billion in potentially preventable health care costs annually.
7

HAI Risk Factors
■ Transmission of communicable diseases between patients and healthcare workers
■ Use of indwelling medical devices e.g. central line or urinary catheters and endotracheal tubes
■ Contamination of the healthcare environment
■ Surgical Procedures
■ Injections
■ Overuse or improper use
of antibiotics
8

Infectious Agents that Cause HAIs
■ Bacteria ■ Fungi ■ Viruses ■ Other less common
types of pathogens
9
Types of HAIs
■ Central Line-Associated Bloodstream Infections (CLABSI)
■ Catheter-Associated Urinary Tract Infection (CAUTI)
■ Ventilator-Associated Events (VAE)
■ Surgical Site Infection (SSI)
■ Clostridium difficile gastrointestinal infection
■ Methicillin-Resistant Staphylococcus aureaus (MRSA)
10

Blood Disorders and Blood Safety
■ Blood Safety
■ Hemoglobinopathies
■ Bleeding and Clotting
11

Blood Safety
■ Each year, 5 million people in the U.S. need a blood transfusion
■ Blood transfusions are lifesaving for people with:
■ Cancer
■ Inherited blood disorders
■ Liver disease or infection that stops blood production
■ Blood loss due to accidents
■ Surgical requirements
■ Blood availability is critical 12

Infectious Threats to Blood Supply
■ Bacteria ■ Fungi ■ Viruses ■ Less common pathogens
13

Inherited and Acquired Blood Disorders
■ Inherited Disorders – Hemoglobinopathies
o Sickle Cell Disease (SCD) o Thalassemias
– Bleeding Disorders o Hemophilia o Von Willebrand Disease (VWD)
■ Acquired Disorder – Venous Thromboembolism
(VTE) o Deep Vein Thrombosis (DVT) o Pulmonary Embolism (PE)
SOURCE: http://www.nlm.nih.gov/medlineplus/bloodheartandcirculation.html 14

Hemoglobinopathies: Emergency Department and Hospital Utilization
Source: HCUPnet, Healthcare Cost and Utilization Project. Agency for Healthcare Research and Quality, Rockville, MD. http://hcupnet.ahrq.gov/
15

Bleeding Disorders
■ Hemophilia ~22,000 U.S. males affected1
■ Affects males, females are carriers
■ Damages joints and inhibits clotting
■ $3 billion annual in hemophilia care and treatment ($150,000 per person/year)2
■ Von Willebrand disease (VWD) ~ 1.4 million people in the U.S. affected3,4
■ Most common bleeding disorder
■ 1 in 1,000 have bleeding symptoms5,6
■ Women experience more severe symptoms (heavy menses, bleeding after child birth)
Joint disease
16
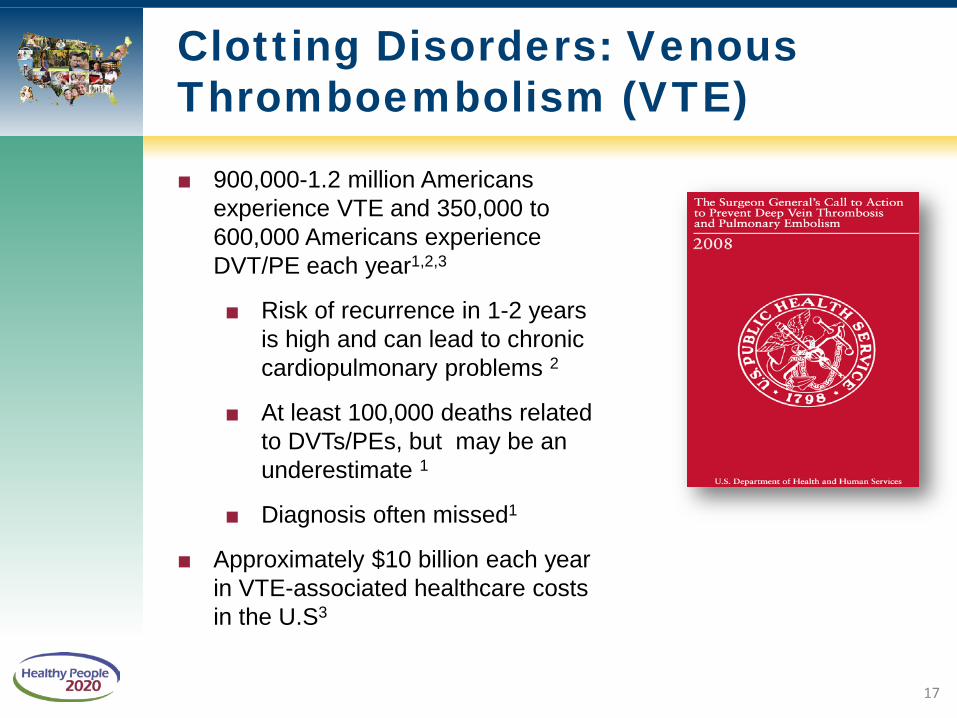
Clotting Disorders: Venous Thromboembolism (VTE)
■ 900,000-1.2 million Americans experience VTE and 350,000 to 600,000 Americans experience DVT/PE each year1,2,3
■ Risk of recurrence in 1-2 years is high and can lead to chronic cardiopulmonary problems 2
■ At least 100,000 deaths related to DVTs/PEs, but may be an underestimate 1
■ Diagnosis often missed1
■ Approximately $10 billion each year in VTE-associated healthcare costs in the U.S3
17

Presenters
Chair ■ Howard K. Koh, MD, MPH Assistant Secretary for Health, U.S. Department of Health and Human Services Data Presentation ■ Irma Aripse, PhD
Associate Director, National Center for Health Statistics, CDC Healthcare-Associated Infections ■ Don Wright, MD, MPH Deputy Assistant Secretary, Director, Office of Disease Prevention and Health Promotion, U.S. Department of Health and Human Services Blood Disorders and Blood Safety ■ George A. Mensah, MD Special Advisor, Office of the Director, National Heart, Lung and Blood Institute, National Institutes of Health ■ Michael Lu, MD, MS, MPH Associate Administrator, Maternal and Child Health Bureau, Health Resources and Services Administration Community Highlight ■ John Boyce MD, Diane Dumigan RN, Carrie Guttman RN
Yale-New Haven Hospital
18

Irma Arispe, PhD Associate Director, National Center for Health Statistics
Centers for Disease Control and Prevention

Healthcare-Associated Infections
Blood Disorders and Blood Safety
Presentation Outline
20

Healthcare-associated infections include:
Central line-associated bloodstream infections (CLABSI)
Catheter-associated urinary tract infections (CAUTI)
Surgical site infections (SSI)
Clostridium difficile infections (CDI)
Estimated more than 1 million healthcare-associated infections across healthcare settings each year.
5 HAI cases per 100 hospital admissions or 1 in 20 patients acquires HAI annually.
SOURCE: U.S. Department of Health and Human Services. National Action Plan to Prevent Health Care-Associated Infections: Road Map to Elimination. Washington DC. June 2013. Accessed on July 25, 2013. Available at: http://www.hhs.gov/ash/initiatives/hai/index.html. Klevens RM, Edwards JR, Richards CL, et al. Estimating health care-associated infections and deaths in U.S. hospitals, 2002. Public Health Rep 2007;122(2):160-6.
21
Burden of Healthcare-Associated Infections

HAIs in Healthcare Settings
22

Federal steering committee to coordinate and maximize prevention efforts
Department of Health and Human Services
Department of Defense
Department of Labor
Department of Veterans Affairs
Phase one: Acute Care Hospitals
Phase two: Ambulatory Surgical Centers, End Stage Renal Disease Facilities, and increasing influenza vaccination among health care personnel
Phase three: Long-Term Care Facilities SOURCE: U.S. Department of Health and Human Services. National Action Plan to Prevent Healthcare-Associated Infections: Road Map to Elimination. Washington DC. June 2013. Accessed on July 25, 2013. Available at: http://www.hhs.gov/ash/initiatives/hai/index.html
23
National Action Plan to Prevent Healthcare-Associated Infections: Roadmap to Elimination

National Healthcare Safety Network (NHSN) CDC Web-based surveillance system
More than 12,000 facilities reporting
Active Bacterial Core surveillance (ABCs), Emerging Infections Program (EIP) CDC An active laboratory- and population-based
surveillance system
Data from 10 states, 44 million persons
24
HAI Surveillance Systems

Nationwide Inpatient Sample (NIS) Healthcare Cost Utilization Project, Agency for Healthcare Research Quality (AHRQ)
The 2011 NIS has all discharge data from 1,045 hospitals in 46 States
U.S. Renal Data System National Institute of Diabetes and Digestive and Kidney Diseases, National Institutes of Health
Records on all ESRD patients in the U.S.
Data originate from CMS, United Network for Organ Sharing, the CDC, and the ESRD Networks
25
Data Systems and Sources

NOTES: *Healthy People 2020 objectives HAI-1 and HAI-2 26
Progress Toward the National Action Plan Targets: Elimination of HAIs in Acute Care Hospitals

0.00
0.25
0.50
0.75
1.00
2006-08 2009 2010 2011
Central Line-Associated Bloodstream Infections (CLABSI), 2006–2011
SOURCE: National Healthcare Safety Network (NHSN), CDC/NCEZID.
NOTES: I = 95% confidence interval. The Standardized Infection Ratio compares the observed number of HAI cases during a reporting period with the 2006-08 baseline number of HAI cases.
Standardized Infection Ratio
Obj. HAI-1 Decrease desired
HP2020 Target: 0.25
0
27
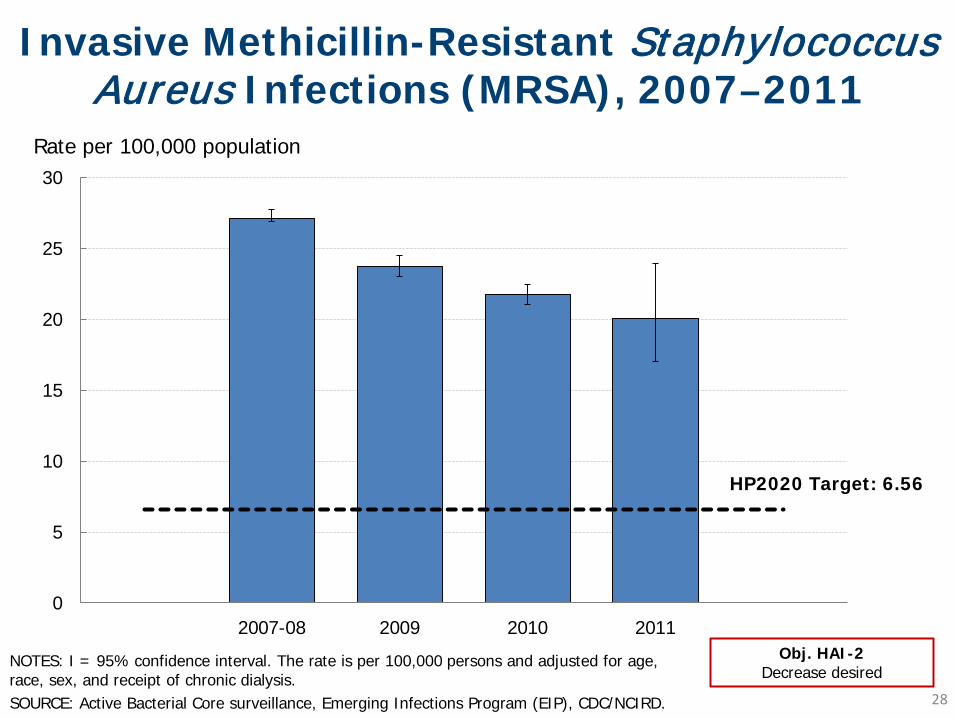
0
5
10
15
20
25
30
2007-08 2009 2010 2011
Invasive Methicillin-Resistant Staphylococcus Aureus Infections (MRSA), 2007–2011
NOTES: I = 95% confidence interval. The rate is per 100,000 persons and adjusted for age, race, sex, and receipt of chronic dialysis. SOURCE: Active Bacterial Core surveillance, Emerging Infections Program (EIP), CDC/NCIRD.
Rate per 100,000 population
Obj. HAI-2 Decrease desired
HP2020 Target: 6.56
28

0
25
50
75
100
125
150
1998 1999 2000 2001 2002 2003 2004 2005 2006 2007 2008 2009 2010 2011
CDI as a principal diagnosis
29
Clostridium Difficile Infection (CDI) Hospitalizations, 1998-2011
SOURCE: National Inpatient Sample (NIS), Healthcare Cost and Utilization Project (HCUP), AHRQ
NOTES: The CDI hospital stays include hospitalizations with a principal or secondary diagnosis of CDI.
Rate per 100,000 population
CDI as a principal or secondary diagnosis

0
200
400
600
800
1,000
1,200
1,400
Total Female Male <18 18-44 45-64 65-84 85+
Clostridium Difficile Infection (CDI) Hospitalizations, 2011
SOURCE: National Inpatient Sample (NIS), Healthcare Cost and Utilization Project (HCUP), AHRQ
Rate per 100,000 population
Age (years)
NOTES: Rate of CDI stays per 100,000 population. The CDI hospital stays include hospitalizations with a principal or secondary diagnosis of CDI.
30
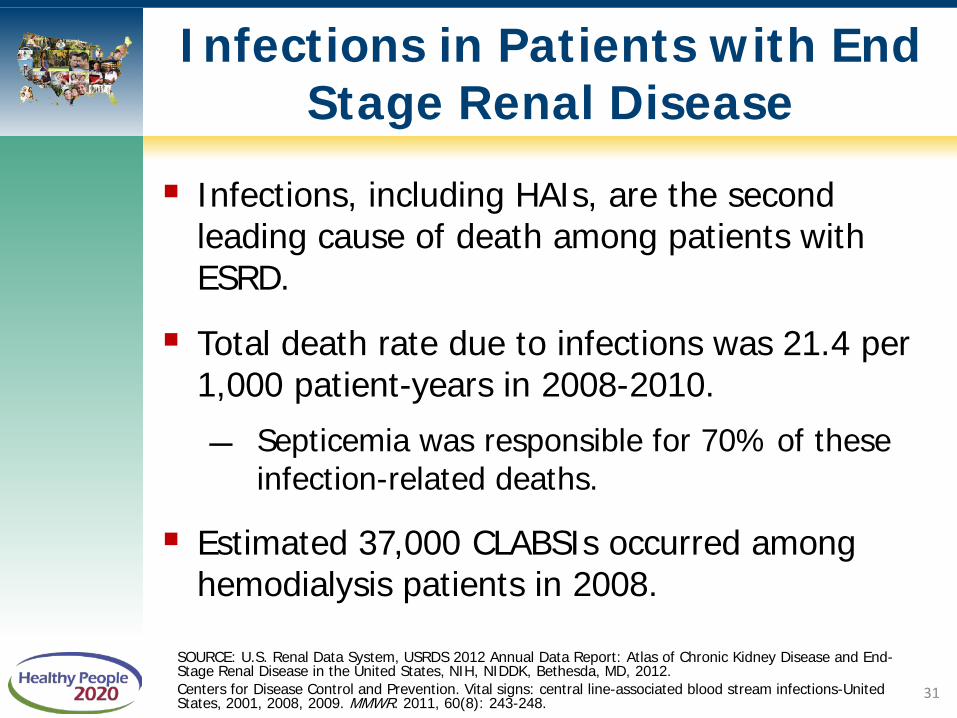
Infections, including HAIs, are the second leading cause of death among patients with ESRD.
Total death rate due to infections was 21.4 per 1,000 patient-years in 2008-2010.
Septicemia was responsible for 70% of these infection-related deaths.
Estimated 37,000 CLABSIs occurred among hemodialysis patients in 2008.
SOURCE: U.S. Renal Data System, USRDS 2012 Annual Data Report: Atlas of Chronic Kidney Disease and End-Stage Renal Disease in the United States, NIH, NIDDK, Bethesda, MD, 2012. Centers for Disease Control and Prevention. Vital signs: central line-associated blood stream infections-United States, 2001, 2008, 2009. MMWR. 2011, 60(8): 243-248.
31
Infections in Patients with End Stage Renal Disease
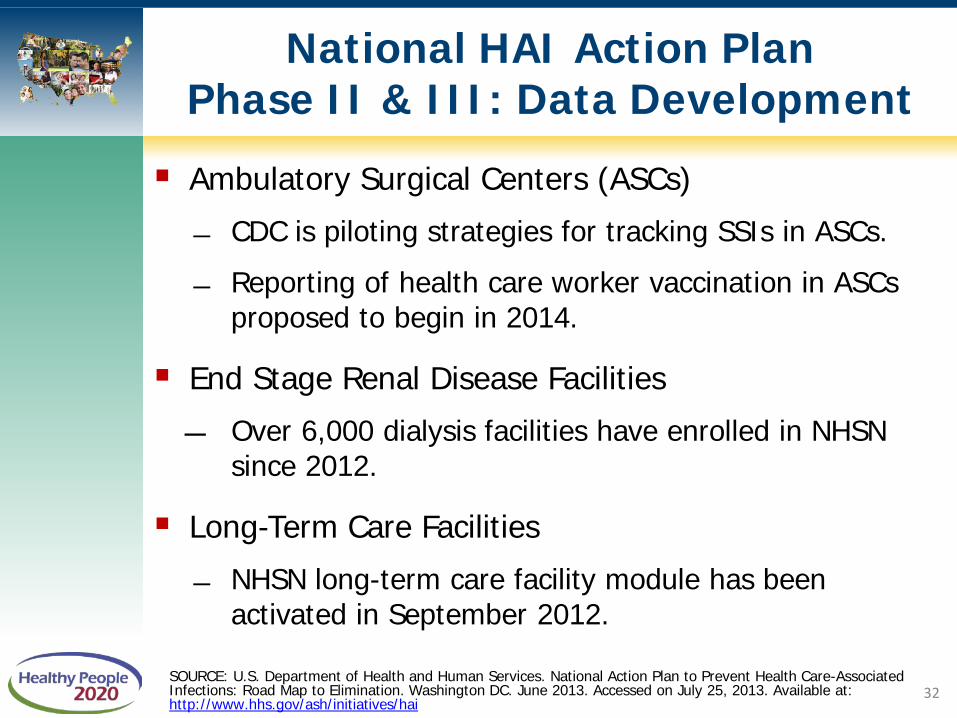
Ambulatory Surgical Centers (ASCs)
CDC is piloting strategies for tracking SSIs in ASCs.
Reporting of health care worker vaccination in ASCs proposed to begin in 2014.
End Stage Renal Disease Facilities
Over 6,000 dialysis facilities have enrolled in NHSN since 2012.
Long-Term Care Facilities
NHSN long-term care facility module has been activated in September 2012.
SOURCE: U.S. Department of Health and Human Services. National Action Plan to Prevent Health Care-Associated Infections: Road Map to Elimination. Washington DC. June 2013. Accessed on July 25, 2013. Available at: http://www.hhs.gov/ash/initiatives/hai
32
National HAI Action Plan Phase II & III: Data Development

0
20
40
60
80
100
Children Adults Health carepersonnel
Influenza Vaccination Coverage, 2010–2011 Influenza Season
SOURCE: National Health Interview Survey (NHIS), CDC/NCHS.
NOTES: Data are for children ages 6 months to 17 years and adults ages 18 and older. Data are for the total US population.
Obj. IID-12.11 through 12.13 Increase desired
Percent
HP2020 Target: 70%
HP2020 Target: 90%
33

Healthcare-Associated Infections
Blood Disorder and Blood Safety
– Blood Donation and Safety
– Hemoglobinopathies
– Bleeding disorders
– Clotting disorders
Presentation Outline
34

5.5 6.4 6.1
1998 2002 2006 2010
Percent (age adjusted)
HP2020 Target: 6.7%
10
5
0
Blood Donations: Adults 18 Years and Older, 1998–2010
NOTES: Data are for adults who have donated blood in the past 12 months, and are age adjusted to the 2000 standard population. SOURCE: National Health Interview Survey (NHIS), CDC/NCHS.
Obj. BDBS-17 Increase desired 35

Blood Donations: Adults 18 Years and Older, 2010
NOTES: Data are for adults who have donated blood in the past 12 months, and are age adjusted to the 2000 standard population, except data by age group*. Persons of Hispanic origin may be any race. Respondents were asked to select one or more races. Data for the single race categories are for persons who reported only one race. SOURCE: National Health Interview Survey (NHIS), CDC/NCHS.
Obj. BDBS-17 Increase desired
Total
FemaleMale
AsianHispanic or Latino
Black, non-HispanicWhite, non-Hispanic
18-24 years*25-44 years*45-64 years*65 and over*
0 5 10 Percent (age adjusted)
HP2020 Target: 6.7%
36

12.7%
8.4%
6.9%
4.4% 3.3%
2001 2004 2006 2008 2011
% Hospitals reporting delays 15
10
5
0
Elective Surgeries Postponed due to Blood Inventory Shortages, 2001–2011
SOURCE: National Blood Collection and Utilization Survey (NBCUS), HHS/OASH. 37

Transfusion-Related Adverse Reactions in 2011
SOURCE: National Blood Collection and Utilization Survey (NBCUS), HHS/OASH.
Obj. BDBS-18.1, 18.2 and 18.3 Reduce transfusion-related adverse reactions: TRALI, ABO incompatibility and post-transfusion virus transmission
Number of transfused units 20,933,000 Number of adverse reactions that 50,570 required diagnostic or therapeutic interventions Transfusion-related acute lung injury 327 (TRALI) Acute hemolysis due to ABO 42 incompatibility Post-transfusion virus transmission 36
Healthcare-associated infections
Blood Disorder and Blood Safety
– Blood Donation and Safety
– Hemoglobinopathies
– Bleeding disorders
– Clotting disorders
Presentation Outline
39
SOURCES: www.sicklecelldisease.org Accessed August 5, 2013; Brousseau, DC et al. The number of people with sickle-cell disease in the United States: national and state estimates. Am J Hematol. Published online 21 October 2009. Hassell, KL. Population Estimates of Sickle Cell Disease in the U.S. Am J Prev Med 2010;38(4S):S512–S521; Healthcare Cost and Utilization Project (HCUP), AHRQ.
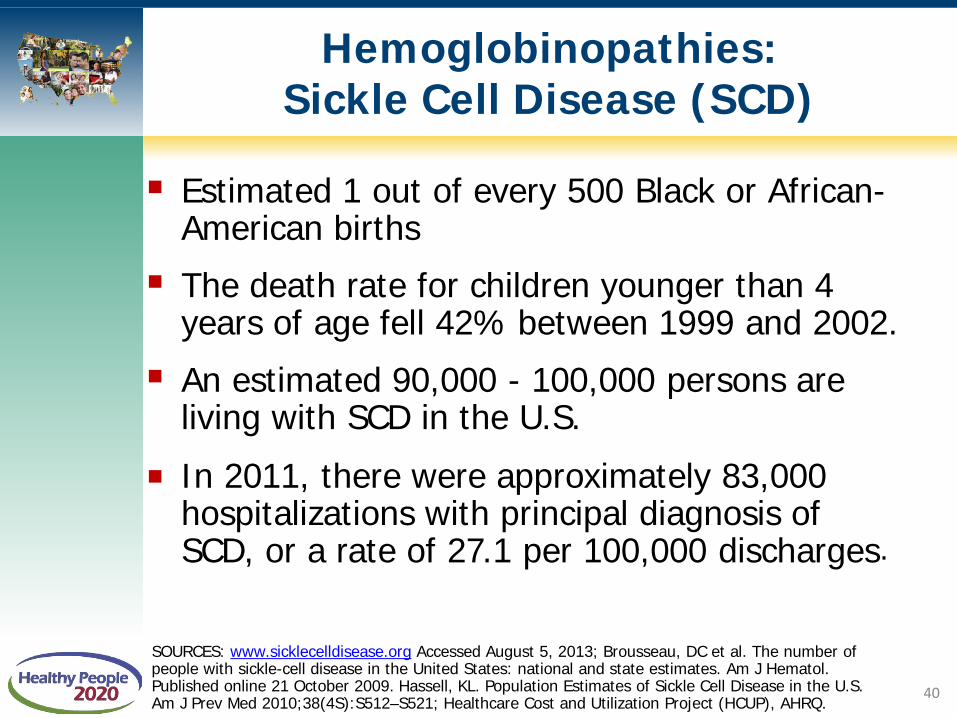
Hemoglobinopathies: Sickle Cell Disease (SCD)
Estimated 1 out of every 500 Black or African-American births
The death rate for children younger than 4 years of age fell 42% between 1999 and 2002.
An estimated 90,000 - 100,000 persons are living with SCD in the U.S.
In 2011, there were approximately 83,000 hospitalizations with principal diagnosis of SCD, or a rate of 27.1 per 100,000 discharges.
40

NOTE: ICD-9-CM diagnosis code 282.6 for sickle cell disease. SOURCE: Healthcare Cost and Utilization Project (HCUP), AHRQ.
18-44 years 73.2%
65-84 years 0.5%
45-64 years 11.4%
17 years and under 15.0%
Hospitalizations for SCD by Age, 2011
41

Hemoglobinopathies: Thalassemia
An estimated 1,000 people have severe thalassemia (or Cooley’s anemia) in the U.S. – Survivability depends on access to frequent
blood transfusions – At increased risk for transfusion-related adverse
reactions and healthcare-associated infections – Most common among people from the
Mediterranean, Middle East, Africa, and parts of Asia (southern China, India, and southeast Asia)
About 4,626 ED visits in 2010; 64% resulted in hospital admission.
SOURCES: Healthcare Cost and Utilization Project (HCUP), AHRQ; http://www.cdc.gov/ncbddd/thalassemia/index.html.
42
Healthcare-associated infections
Blood Disorder and Blood Safety
– Blood Safety
– Hemoglobinopathies
– Bleeding disorders
– Clotting disorders
Presentation Outline
43

Bleeding Disorders: Hemophilia and Von Willebrand Disease
Hemophilia
Estimated 20,000 individuals (mostly males) with hemophilia in the U.S.
1 in 5,000 male births each year
In 2011, 1,476 hospitalizations with a primary diagnosis of hemophilia
VWD affects males and females
Estimated to affect 1% of population
Women more likely to notice symptoms
SOURCES: Soucie, JM et al. The occurrence of hemophilia in the United States. Am J Hematol 1998; 59:288-294. Healthcare Cost and Utilization Project, AHRQ. 44

0
2,500
5,000
7,500
10,000
2002 2004 2006 2008 2010 2012
Number of female patients registered at federally-funded HTCs
Female Von Willebrand Disease Patients at Hemophilia Treatment Centers, 2002–2012
SOURCES: Baker JR et al. US Hemophilia Treatment Center population trends 1990–2010: patient diagnoses, demographics, health services utilization. Hemophilia 2013 Jan;19(1):21-6; and Hemophilia Data Set (HDS), HRSA. 45

Healthcare-associated infections
Blood Disorder and Blood Safety
– Blood Donation and Safety
– Hemoglobinopathies
– Bleeding disorders
– Clotting disorders
Presentation Outline
46

Clotting Disorders: Venous Thromboembolism (VTE)
350,000 to 600,000 new cases of VTE each year – An estimated 1.2 million Americans are living with
VTE – Estimated 168,000 hospitalizations due to VTE in
2011 – At least 100,000 deaths due to VTE
Risk factors for VTE: age, hospital admission, surgery, prior VTE, and cancer $10 billion each year in VTE-associated health
care costs in the U.S. SOURCES: http://www.surgeongeneral.gov/news/2008/09/pr20080915.html accessed on August 5, 2013. Healthcare Cost and Utilization Project (HCUP), AHRQ. Mahan CE, et. al. Venous thromboembolism: annualized United States models for total, hospital-acquired and preventable costs utilizing long-term attack rates. Thromb Haemost. 2012;108:291-302.
47

Total 18-44 45-64 65-74 75+0
100
200
300
Age (years)
Clinic Visits** per 10,000
Total clinic visits with a diagnosis of VTE in 2007: 1,295,000
NOTES: *Annual rate of hospitalizations with a discharge diagnosis of VTE, 2007-09. **Number of clinic visits with a diagnosis of VTE, 2007. SOURCES: National Hospital Discharge Survey (NHDS), CDC/NCHS; National Ambulatory Medical Care Survey (NAMCS) and National Hospital Ambulatory Medical Care Survey (NHAMCS), CDC/NCHS.
Hospitalizations and Clinic Visits with a Diagnosis of VTE, by Age
**Obj. BDBS-12 Decrease Desired
HP2020 Target: 48.6
Total 18-44 45-64 65-74 75+0
100
200
300
Age (years)
Hospitalizations* per 10,000
Annual hospitalizations with a diagnosis of VTE in 2007-09: 548,000
48

Health care-associated infections account for a substantial portion of health care-acquired conditions.
National Action Plan is tracking HAIs in acute care settings, and moving toward targeting HAIs in ambulatory and long term care settings.
CLABSI and MRSA rates are declining, but have not yet met Healthy People targets.
National estimates are not available for many BDBS objectives; however, hemoglobinopathies, bleeding and clotting disorders are conditions that significantly impact those affected.
Key Takeaways
49

Don Wright, MD, MPH Deputy Assistant Secretary
Director, Office of Disease Prevention and Health Promotion U.S. Department of Health and Human Services

Cross-Federal Collaboration
U.S. Department of Health & Human Services Administration for Community Living (ACL)
Agency for Healthcare Research & Quality (AHRQ)
Centers for Disease Control & Prevention (CDC)
Centers for Medicare & Medicaid Services (CMS)
Food and Drug Administration (FDA)
Health Resources & Services Administration (HRSA)
Indian Health Services (IHS)
National Institutes of Health (NIH)
Office of the Secretary (OS)
U.S. Department of Defense (DoD) U.S. Department of Labor (DoL) U.S. Department of Veterans Affairs (VA)
51

Contributions
**Not all partnerships are listed. 52

Centers for Disease Control & Prevention: Surveillance
■ National Healthcare Safety Network (NHSN)
– Standardized data reported through internet
– >11,000 facilities across United States
– Data drives incentive payment programs
■ Emerging Infections Program (EIP)
– Population-level data
– Information on pathogen-induced HAIs National Healthcare Safety Network
Emerging Infections Program 53

State-level Public Reporting HAI Policy, 2004
DC*
Disclosures of HAI rates required
54

State-level Public Reporting HAI Policy – January 2013
Disclosures of HAI rates required
DC*
Requires use of NHSN for reporting HAI data to the state (30 states and DC) 55

Facilities Submitting Data to NHSN
NOTES: *Data as of July 31, 2013: Total number of facilities enrolled – 12,150; number of facilities actively submitting data – 11,100. 56

Agency for Healthcare Research & Quality (AHRQ)
57

Centers for Medicare & Medicaid Services: Payment Incentives
■ CMS Inpatient Prospective Payment System – Prospectively set payment rates for hospitals – Additional payments for more costly episodes NOT including secondary diagnoses resulting
from HAIs
■ Hospital Value-Based Purchasing Program – Affordable Care Act mandated incentive program – Must include HAI measures for the initial year (FY
2013) of the program – HAI measure list will expand to include SCIP,
CLABSI, CAUTI, SSI, MRSA and Cdif by FY 2017
58

Office of the Assistant Secretary: Patient Safety Educational Video
Partnering to Heal OASH/ODPHP Health Care-Associated Infections
59

Partnership for Patients
Partnership for Patients 60

National Awards Recognition Programs
OASH/ODPHP HAI Projects
■ Critical Care Societies Collaborative (CCSC) National Awards Program – Partnership between HHS and CCSC – Public recognition of critical care professionals in
eliminating HAIs
■ Partnership in Prevention Award – Partners:
– Association for Professionals in Infection Control and Epidemiology
– Society for Healthcare Epidemiology of America – Recognizes single multidisciplinary team
61


For More Information
Division of Healthcare Quality Office of Disease Prevention & Health
Promotion Office of the Assistant Secretary for Health
1101 Wootton Parkway Rockville, MD
Subscribe to the HAI listserv:
HAI Listserv
63

George A. Mensah, M.D. Special Advisor to the Director
National Heart, Lung, and Blood Institute (NHLBI) National Institutes of Health (NIH)
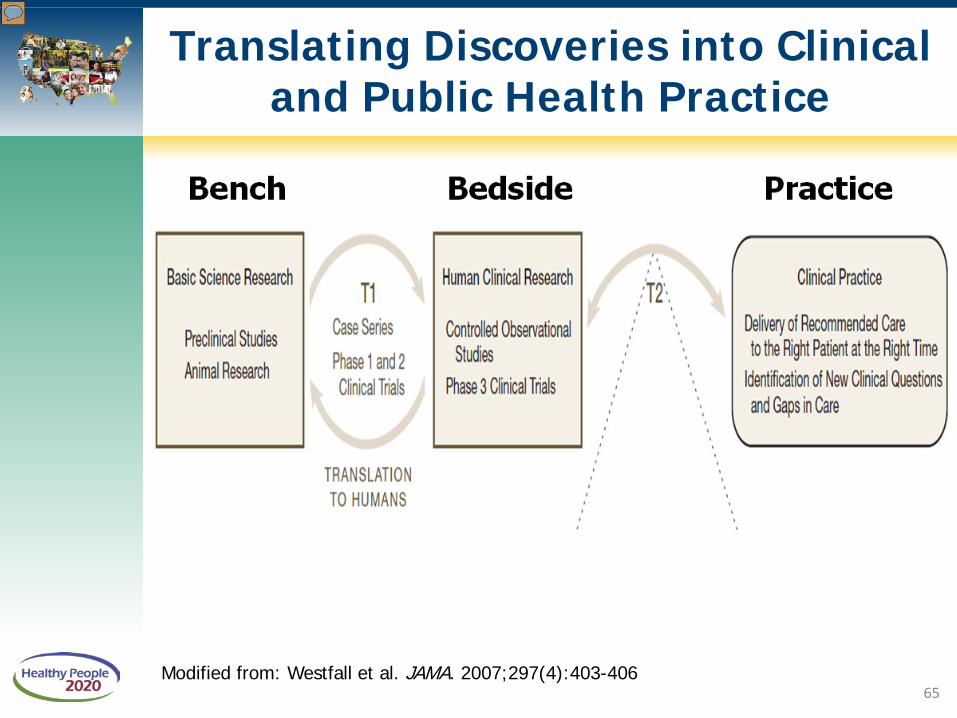
Translating Discoveries into Clinical and Public Health Practice
Modified from: Westfall et al. JAMA. 2007;297(4):403-406 65

Systems and Procedures to Protect Blood Supply
■ Federal infrastructure and Public-Private Partnerships
■ Donor recruitment and screening
■ Blood testing
■ Preparation of blood and blood products
■ Investigation of problems
66

Contributions to a Safe and Adequate Blood Supply
67

Busch, et. al., Transfusion, Oct 2013, in press. Used with permission
Objective: BDBS-18.3 reduce transfusion-transmitted infections
Historical Transfusion Risks of HIV, HCV, and HBV Have Declined
68

Blood Safety Includes the Availability of Blood and Blood Products
Local television station covered the NIH Blood Bank on the increased need for blood and platelet donor over the holidays http://clinicalcenter.nih.gov/blooddonor/urgentupdates.html
Objectives: BDBS-17 increase the proportion of persons who donate blood, BDBS-18.4 decrease persons with hemoglobinopathy who develop alloimmunization, BDBS-19.1 reduce blood shortages
69

Inherited and Acquired Blood Disorders
■ Inherited Disorders – Hemoglobinopathies
o Sickle Cell Disease (SCD) o Thalassemias
– Bleeding Disorders o Hemophilia o Von Willebrand Disease (VWD)
■ Acquired Disorder – Venous Thromboembolism
(VTE) o Deep Vein Thrombosis (DVT) o Pulmonary Embolism (PE)
SOURCE: http://www.nlm.nih.gov/medlineplus/bloodheartandcirculation.html 70

Sickle Cell Disease Research: From the Molecule to the Community
71

Life Expectancy of Patients with Sickle Cell Anemia has Increased
Objectives: BDBS-2 increase referrals for evaluation and treatment, BDBS-4 increase screening for complications, BDBS-5 increase therapies, BDBS-6 increase penicillin 72

SOURCE: Kalinyak, K, Crosby, L, et. al. Funded by Cincinnati Children’s Hospital and Medical Center. Used with permission
Objective: BDBS-7 Reduce preventable hospitalizations in SCD children
Preventable ED Visits for SCD Pain Children and Young Adults ages 5-21 years

Thalassemia Research: Improved Understanding but a Long Way to Go
74

Thalassemia: Comprehensive Care for Patients and Families
SOURCE: Abridged version of http://cooleysanemia.org/updates/CompCare3.pdf. Used with permission of the Cooley’s Anemia Foundation
Objectives: BDBS-1 increase vaccinations, BDBS-2 increase referrals for evaluation and treatment, BDBS-4 increase screening, BDBS-5 increase therapies, BDBS-10 increase knowledge of carrier status
75

Thalassemia + Blood Safety: A Collaboration of the Cooley’s Anemia Foundation and the CDC
76

Research in Bleeding and Clotting: Basic Science to Clinical Application
■ Molecular basis of hemophilia – Discovery of recombinant factor
■ Molecular genetics and proteins in von Willebrand Disease (VWD) – ELISA assay to diagnose defects – NHLBI Report
■ Venous Thromboembolism (VTE) – Risk factors – Therapies
Objectives: BDBS-14 increase referrals for women with bleeding disorder symptoms, BDBS-15 increase VWD diagnosis
77
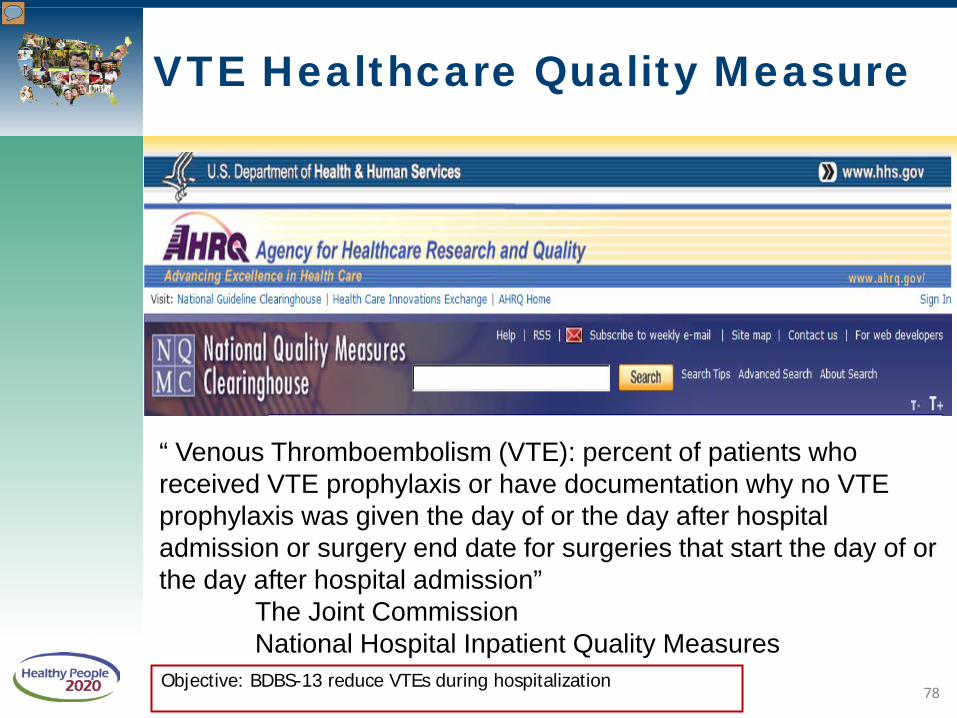
VTE Healthcare Quality Measure
“ Venous Thromboembolism (VTE): percent of patients who received VTE prophylaxis or have documentation why no VTE prophylaxis was given the day of or the day after hospital admission or surgery end date for surgeries that start the day of or the day after hospital admission” The Joint Commission National Hospital Inpatient Quality Measures Objective: BDBS-13 reduce VTEs during hospitalization
78

Are federal partners* and stakeholders taking steps to help make progress toward HP2020-BDBS Objectives?
For questions, comments and more information, email: [email protected]
*excluding HRSA, which will present its progress
79

Michael Lu, MD, MS, MPH Associate Administrator, Maternal and Child Health Bureau
Health Resources and Services Administration

Health Resources and Services Administration (HRSA)
HRSA is the primary Federal agency for improving access to health care services for people who are uninsured, isolated, or medically vulnerable. Tens of millions of Americans get affordable health care and other help through HRSA's 100-plus programs and more than 3,000 grantees
81

Maternal and Child Health Bureau (MCHB)
82

HRSA BD/BS Infrastructure
■ The National Hemophilia Program
■ Sickle Cell Treatment Demonstration Programs
■ Sickle Cell Newborn Screening Program
■ Thalassemia Program
83

The National Hemophilia Program
Funded since 1975 with two primary structured activities: – National Hemophilia Program Regional Network
(RHN)
■ 8 Regional Networks containing 135 Hemophilia Treatment Centers
– National Hemophilia Program Coordinating Center (NHPCC)
■ The American Thrombosis and Hemostasis Network (ATHN) was awarded funding in June 2012
The Regional Networks through ATHN will be providing data for several Healthy People 2020 objectives
84

Hemophilia Treatment Center Distribution
85

SOURCES: Universal Data Collection System (UDC), 1998-2011, CDC/NCBDDD.
Hemophilia Registration at Hemophilia Treatment Centers, 1998-2011
0
2,000
4,000
6,000
8,000
2-10 11-19 20-44 45-64 65+Age (years)
SevereModerateMild
Number of patients registered at Federally supported HTC
Severity of hemophilia
86

SOURCES: US Hemophilia Treatment Center population trends 1990–2010: patient diagnoses, demographics, health services utilization. JR Baker, B Riske, JH Drake, AD Forsberg, R Atwood, M Voustis and R Shearer. Hemophilia 2013 Jan;19(1):21-6. Universal Data Set, 1998-2011, National Regional Hemophilia Network, HRSA.
Von Willebrand Disease Registration at Hemophilia Treatment Centers
87
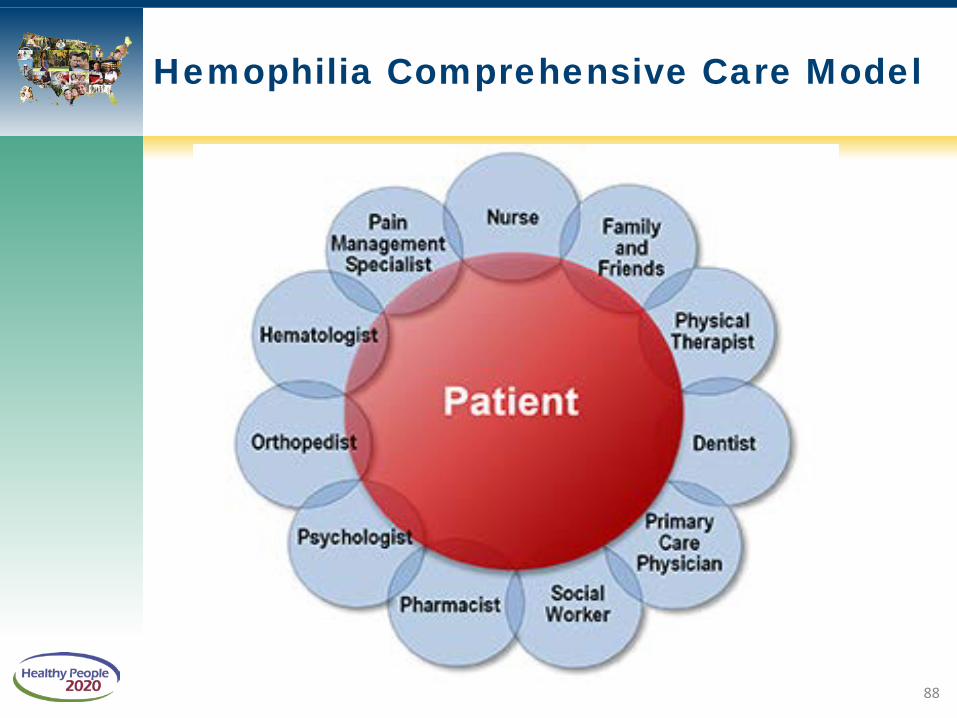
Hemophilia Comprehensive Care Model
88

American Thrombosis & Hemostasis Network (ATHN)
Not-for-profit organization
Founded July 2006
ATHN’s mission is to provide stewardship of a secure national database used to support:
– Outcomes analyses – Research – Advocacy – Public Health
Ultimate vision is to advance and improve care
89

ATHN: Current Data Initiatives
CDC Public Health Surveillance for Bleeding Disorders
HRSA National Hemophilia Program Coordinating Center
ATHNdataset
– Over 16,000 patients opt-in as of June 1, 2013 ATHN-1: Cardiovascular Disease in Hemophilia – Standard data within ATHN database plus new data
My Life Our Future – Genotyping data; linked to ATHNdataset phenotypic data
90

CDC Public Health Surveillance Project for Bleeding Disorders Building on the 13 year longitudinal surveillance in the
CDC’s Universal Data Collection Project (UDC) Provide descriptive knowledge about the populations
of hemophilia, von Willebrand disease (VWD), other bleeding disorders and VTE receiving care at HTCs (HTC Population Profile)
Monitor health indicators among populations with bleeding disorders (Registry)
– Assess trends over time
– Measure rates of, and risk factors for, complications
– Identify high risk populations for prevention
– Identify issues that require research 91
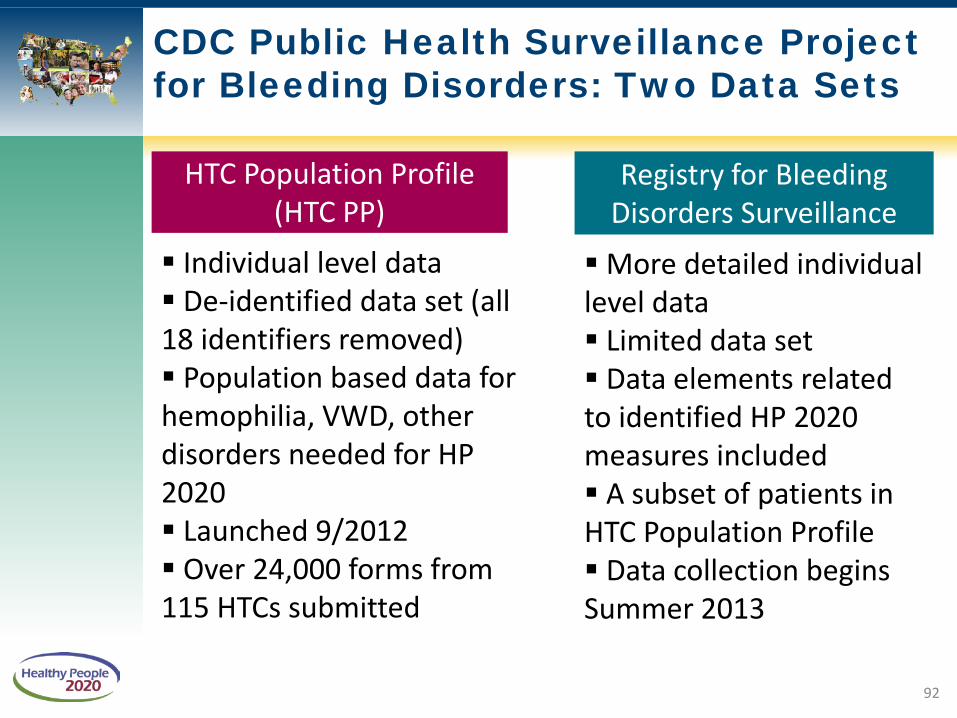
CDC Public Health Surveillance Project for Bleeding Disorders: Two Data Sets
HTC Population Profile (HTC PP)
Registry for Bleeding Disorders Surveillance
Individual level data De-identified data set (all 18 identifiers removed) Population based data for hemophilia, VWD, other disorders needed for HP 2020 Launched 9/2012 Over 24,000 forms from 115 HTCs submitted
More detailed individual level data Limited data set Data elements related to identified HP 2020 measures included A subset of patients in HTC Population Profile Data collection begins Summer 2013
92

Thank You
Regional Hemophilia Networks • New England Region • Mid-Atlantic Region • Southeast Region • Great Lakes Region • Northern States Region • Great Plains Region • Mountain States Region • Western States Region
National Hemophilia Program Coordinating Center • American Thrombosis & Hemostasis Network Colleagues at the Center for Disease Control and Prevention (CDC) • CDC Public Health Surveillance Project Science Committee
93

Sickle Cell Newborn Screening Program
Sickle Cell Disease for Newborn Screening Program
■ Established in 2002
■ Community-based networks partner with State Title V and state newborn screening programs, comprehensive sickle cell treatment centers, and other stakeholders to provide support to infants
■ Projects work with the SCD National Coordinating Center to implement models of follow-up for individuals with sickle cell diseases and trait
■ Works with Sickle Cell Disease Association of America (SCDAA) to work on Newborn Screening Educational project
SCD National Coordinating Center
■ Coordinates and supports grantee networks through technical assistance and information exchange.
■ Led by the National Initiative for Children’s Healthcare Quality (NICHQ).
■ Holds hemoglobinopathy learning collaboratives so network teams may learn from each other and from national expert faculty.
94

Sickle Cell Treatment Demonstration Program
■ Established in 2004 – To improve access to services for individuals with sickle cell disease, – Improve and expand patient and provider education, – Improve and expand the continuity and coordination of service
delivery for individuals with sickle cell disease or who are carriers of the sickle cell gene mutation.
■ Grantee networks have two main goals: – To support the provision of coordinated, comprehensive, culturally
competent and family-centered care for individuals living with sickle cell disease, and
– To work collaboratively with our non-federal partners.
■ Originally 4 grantees and a National Coordinating Center; recently expanded to 6 grantees for sickle cell model system of comprehensive care and medical management treatment demonstration project
95

Thalassemia Program
■ In existence for over 30 years
Purpose: to support the demonstration of a model system of comprehensive care and medical management for individuals and families at risk or affected by Thalassemia.
■ Program initiatives: – Developing and expanding outreach strategies and patient support groups – Establishing statewide newborn screening for thalassemia – Supporting successful transition to independent adult life including healthcare &
employment – Developing and implementing program sustainability
■ Grants held: – Children’s Hospital – Oakland Hematology Department; California – Ann & Robert H. Lurie Children’s Hospital of Chicago Comprehensive
Thalassemia Program; Chicago – The Children’s Hospital of Philadelphia; Pennsylvania
96

Key Points
■ HRSA is dedicated to developing, growing, and maintaining the critical infrastructure necessary to provide health care services to those with unmet needs, in conjunction with our federal partners and stakeholders.
■ Development of systems of care and the infrastructure necessary requires multi-stakeholder buy-in.
■ Validated data collection is necessary to track longitudinal trends and improve process and health care outcomes.
■ Data collection and program evaluation within rare diseases/condition is a significant challenge (cost, burden, time, etc), but can be accomplished.
97

Reducing Central Line-Associated Bloodstream Infections
John M. Boyce, MD Diane G. Dumigan, RN, CIC
Carrie Guttman, MSN Sean Boyle, RN
Yale-New Haven Hospital
New Haven, CT
August 28, 2013 98

Yale-New Haven Hospital
99
• Private, non-profit teaching hospital that includes two inpatient campuses, Yale-New Haven Children’s Hospital, Yale-New Haven Psychiatric Hospital and Smilow Cancer Hospital at Yale-New Haven • Primary teaching hospital of Yale School of Medicine • 1,500 inpatient beds • Staff: More than 13,000 employees, 4,800 university and community physicians
To provide sensitive, high-quality,
cost-effective health care to all
patients, regardless of ability to pay
Our Mission

Reduction of Central Line-Associated Bloodstream Infections
• In 2009, the Hospital of Saint Raphael (now the Saint Raphael campus of Yale-New Haven Hospital) joined the Comprehensive Unit-Based Safety Program (CUSP) to reduce central line-associated bloodstream infections (CLABSIs) – Utilized a number of CUSP tools when implementing our program
• In 2010, despite making progress, our CLABSI rates were still above expected levels, so the hospital re-organized our CLABSI prevention committee
• A multidisciplinary committee was formed – included front-line care givers involved in insertion and care of central
lines 100

Methods for Reducing CLABSIs Methods for Reducing CLABSIs,
Saint Raphael Campus, Yale-New Haven Hospital
• Brainstorming: We used affinity diagrams to clarify current knowledge
Understanding variation and selecting processes to improve
101

INTERVENTIONAL TOOLS
Intervention Tools • Hired mobile simulation lab to re-
train residents on catheter insertion technique
- Khouli H et al. Chest 2011;139:80
• Re-certified all nurses who insert PICC catheters
• Re-educated physicians and nurses on use of new checklist
• High-level administrative support for nurses who reported physicians with suboptimal insertion technique
• Developed process for monthly review of checklists
• Daily central line rounds to assess post-insertion care
Mobile Simulation Lab
102

Intervention Tools • Several cases reported as CLABSIs appeared to represent
contaminants in blood cultures drawn from central catheters • Reduce blood cultures drawn from central catheters
– Memo to physicians recommending venipuncture as preferred site – 2-nurse protocol developed for drawing blood cultures from central catheters – Special kit developed for drawing blood cultures from central lines
103

• Have nurse at bedside for entire procedure • Nurses and physicians hand-off patients
INTERVENTIONAL TOOLS
104

HHS/SHEA/APIC Partnership in Prevention Award
Saint Raphael campus team members, front row (left to right), John M Boyce, MD, Jeannette Bronsord, RN, Diane G Dumigan, RN, Alan S.Kliger, MD
Courtesy: U.S. Dept. of Health and Human Services 105

CLABSIs/1000 Catheter Days, Saint Raphael Campus, Yale-New Haven Hospital
Q1 2010 – Q1 2013
106

Expanding Interventions to ICUs, York Street Campus, Yale-New Haven Hospital
• Intensified interventions at York Street campus began November 2012
107

Reducing CLABSIs on the Comprehensive Sickle Cell Specialty Unit
York Street Campus, YNHH • Why did we target the
specialty unit? – high number of CLABSIs – a majority of reported CLABSIs
appeared by clinical criteria to represent contaminants recovered from central line blood cultures
• Project components: focus on line maintenance
– multidisciplinary team with local champions
– tackled barriers particular to patients with sickle cell disease
– process mapping – clinical rounding tool: prevention “bundle”
Left to right: Jack Gorero, RN, Unit Manager Darren Lawrence Diane Vorio, RN, MSN, Vice President Patient Services Victor Morris, MD, Associate Chief of Staff
108

Reducing CLABSIs on the Comprehensive Sickle Cell Specialty Unit York Street Campus, YNHH (continued)
109
• Pilot unit results: – 58 weeks without CLABSI on sickle cell specialty unit
• Spread phase: – Interventions and processes spread to other units in the
Department of Medicine
• Department results: – Reduction of CLABSIs on all Medicine floors:
• CY 2012 – 39 infections • CY 2013 to date – 11 infections

Partnership for Patients Recognition
November 2012 HEN Week
Left to right: Rich Umbenstock, President and Chief Executive Officer, America Hospital Association Carrie Guttman, Safety Coordinator, YNHH Charisse Coulombe, MS, MBA, CPHQ Senior Director of AHA/HRET HEN Maulik Joshi, Dr.P.H, President, HRET and Senior Vice-President, American Hospital Association Photo credit: Eric Craig
110

Lessons Learned
• Multidisciplinary team must include personnel involved in catheter insertion and maintenance
• Executive leadership and administrative support is essential
• Educate personnel and implement best practices for line insertion and care
• Implement processes to minimize catheter-drawn blood cultures
• Monitor processes and CLABSI rates; provide feedback
111
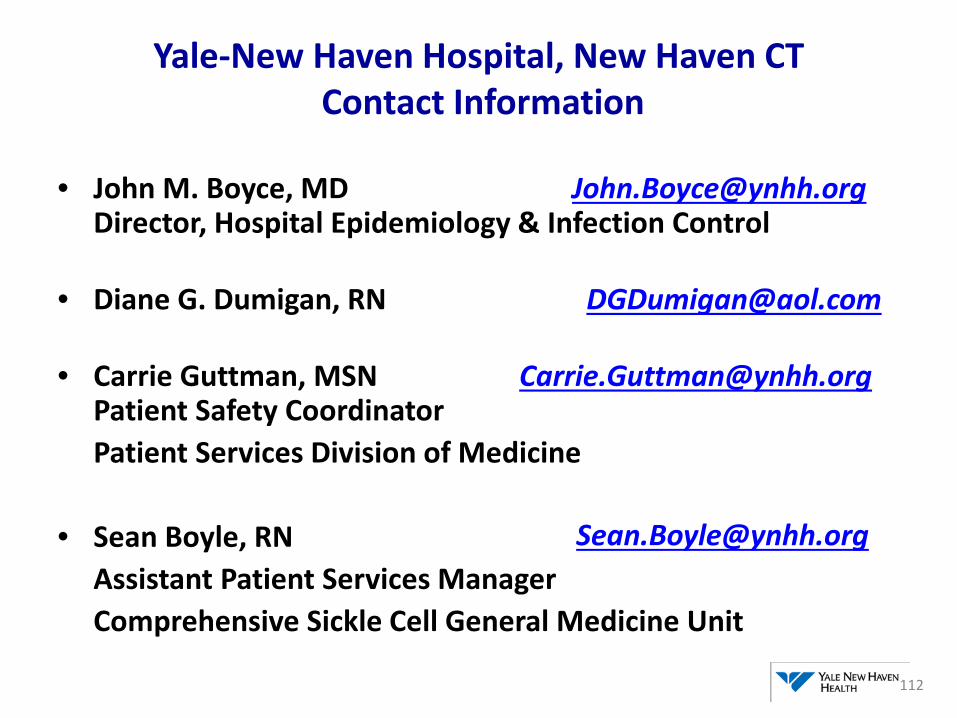
Yale-New Haven Hospital, New Haven CT Contact Information
• John M. Boyce, MD [email protected] Director, Hospital Epidemiology & Infection Control
• Diane G. Dumigan, RN [email protected]
• Carrie Guttman, MSN [email protected] Patient Safety Coordinator
Patient Services Division of Medicine
• Sean Boyle, RN Assistant Patient Services Manager Comprehensive Sickle Cell General Medicine Unit
112

Yale New Haven Hospital
113

BIS Preventing Daily Rounds
114

Please submit your questions through the Q&A function

Healthy People 2020 Team
Progress Review Core Planning Group ■ Denise Stredrick, NIH/OD
■ Ellen Werner, NIH/NHLBI
■ Emily DeCoster, HRSA
■ Kathryn McLaughlin, HRSA
■ Tina Turgel, HRSA
■ Jim Berger, HHS/OASH
■ Richard Henry, HHS/OASH
■ Lisa Richardson, CDC/ONDIEH
■ Mike Soucie, CDC/ONDIEH
■ Caryn Steinman, CDC/ONDIEH
■ Mark Weinstein, FDA/CBER
■ Yael Harris, HHS/ODPHP
■ Tinya Sensie, HHS/ODPHP
■ Rebecca Hines, CDC/NCHS
■ Leda Gurley, CDC/NCHS
■ Asel Ryskulova CDC/NCHS
■ Insun Kim, CDC/NCHS
■ Carter Blakey, HHS/ODPHP
■ Yen Luong, HHS/ODPHP
■ Deb Nichols, HHS/ODPHP
■ Emmeline Ochiai, HHS/ODPHP
■ Ellis Davis, HHSODPHP

Online Resources and Tools

Stay Connected
WEB healthypeople.gov
EMAIL [email protected]
TWITTER @gohealthypeople
LINKEDIN Healthy People 2020
YOUTUBE ODPHP (search “healthy people”)
JOIN THE HEALTHY PEOPLE LISTSERV & CONSORTIUM