the impact of supplies quality on universities performance ... · pdf filethe impact of...
TRANSCRIPT

European Journal of Logistics Purchasing and Supply Chain Management
Vol. 1, No.2, pp.11-35, December 2013
Published by European Centre for Research Training and Development, UK (www.ea-journals.org)
11
THE IMPACT OF SUPPLIES QUALITY ON UNIVERSITIES PERFORMANCE: A
CASE STUDY OF MASINDE MULIRO UNIVERSITY OF SCIENCE AND
TECHNOLOGY
Sanewu Esther Nasidai, Simiyu Emmanuel Sikuku, Mutua Nicholas Muthama
School of Business, Economics and Social Sciences, Department of Business Studies and
Economics, Taita Taveta University College
School of Science and Informatics, Department of Mathematics and Informatics, Taita Taveta
University College
ABSTRACT: The role of Quality supplies in the performance of universities cannot be
under estimated. Quality is the driving force in university performance. However its role is
greatly affected by having quality systems in the universities. This research sought to assess
the impact of quality of supplies on university performance using four indicators; cost
reduction, effectiveness, efficiency and customer satisfaction. The study utilized a descriptive
study using a survey method and targeted the MMUST population. A sample of 25 students
and 25 staffs were administered with questionnaires that had both open and closed questions.
23 students (92%) and 19 staffs (82.6%) responded. The study results using the Chi-squire
revealed that quality of supplies impact positively to university performance. The research
further recommends that universities should ensure quality of its supplies in order to realize
good performance.
KEYWORDS: Quality, Performance, Chi-square, University
INTRODUCTION
This section discusses various aspects of the study including; background of the study which
gives an in-depth review of the historical development of the research problem globally,
regionally, and locally, statement of the problem that tries to give a picture of the real
situation and the ideal situation and establishes the gap that the research has to fill, study
objectives, significance of the study, scope of the study, hypothesis and also general
objectives of the study.
Background of the Study
Quality of supplies has had little considerations among the institutions and this has resulted to
poor quality of supplies (Kuei et al, 2001). A failure to recognize quality problems and too
much emphasis on price has been the main cause of poor quality of supplies in the
universities (Johnson & Leenders, 2011). Lysons (2006) said that poor quality of products
and services costs about 20%of the revenue a cost that can be avoided by using good
practices. He pushed for zero defects. His “absolutes” are that; quality is defined as
conformance to requirements not goodness, the system for achieving quality is prevention not
appraisal. The philosophical leaders of quality,(Juran, Crosby and Deming) all had a general
message, “to achieve outstanding quality requires quality leadership from senior

European Journal of Logistics Purchasing and Supply Chain Management
Vol. 1, No.2, pp.11-35, December 2013
Published by European Centre for Research Training and Development, UK (www.ea-journals.org)
12
management, a customer focus, total involvement of the workforce and continuous
improvement based upon vigorous analysis of processes.
The world have come to the realization of the need to establish a standard measure of quality
to ensure supplies being consumed within the country and those that are exported are of good
quality. Africa being one of them has come up with quality control bodies and policies to
regulate the quality of supplies being produced in the organisations and also imports coming
to the country from outside. In Kenya, the government has come up with various policies and
bodies that control quality standards. Kenya Bureau of Standards (KEBS) responsible for
quality controlling, standards and inspection of products, testing and certification of products.
National Quality Institute(NQI) ensure advancement of quality management practices to
enhance the competitiveness of Kenyan goods and services in the world market and to
manage key quality awards in order to promote excellence of Kenyan industries.Another
body established by the government of Kenya to oversee quality issues is, Kenya Plant
Health Inspectorate Services (KEPHIS). This is a regulatory body for agricultural imports
and produce in Kenya. As a result of realizing the need for procuring of quality supplies, the
government has established, Public Procurement Oversight Authority (PPOA) that oversees
all procurement activities and procedures in the country and that all firms should observe the
regulations of this body in relation to procurement matters.
Human resource departments have also been established on the forefront to providing quality
and qualified staff who understands better matters relating to quality and how to work
towards achieving the desired quality in the university. On the other hand performance is also
pegged on the quality of services offered by the university. Quality of services offered is
dependent on the quality of inputs provided. This has seen many public universities put
quality of supplies a priority in ensuring quality.
Statement of the Problem
Supplies quality is a key determinant of an organisational performance since it ensures the
end products of the organisation are acceptable to the consumers(Saleemi, 2001)
Organisations should therefore purchase quality supplies for this to be attainable.
In Kenyan Universities however, complains have been observed on the poor quality of output
as a result of poor quality inputs, for example graduate of medicine from Moi University are
viewed as unqualified. Poor workmanship and substandard buildings have been cited
example of the Nyamakima building in Nairobi which collapsed due to poor quality. This can
be attributed to lack of careful consideration of supplies quality which in turn affects the end
product quality. This research study therefore seeks to establish the effect of supplies quality
on organisational performance in Universities in Kenya.
Research Objectives
General Objective
To examine the impact of quality of supplies on University performance in Kenya.
Specific Objectives
1. To determine the impact of supplies serviceability on cost reduction.
2. To examine the effect of supplies durability on university efficiency.
3. To explain the impact of aesthetics on university image.
4. To determine the impact of conformance on customer satisfaction.

European Journal of Logistics Purchasing and Supply Chain Management
Vol. 1, No.2, pp.11-35, December 2013
Published by European Centre for Research Training and Development, UK (www.ea-journals.org)
13
Research Questions
1. What is the impact of supplies serviceability on cost reduction?
2. How does supplies durability affect University efficiency?
3. What is the impact of aesthetics on the University image?
4. How does conformance impact on customer satisfaction?
Hypothesis
1. HO1: There is no significant difference in supplies quality and organizational
performance.
HA1: There is significance difference in supplies quality and organizational
performance.
2. H01: There is no significance difference in supplies quality and University efficiency.
HA1: There is significant difference in supplies quality and university efficiency.
Significance of the Study
This study aimed at helping the Universities management to cut down costs associated with
quality of supplies such as, reworks, scrap and return of supplies where distance involved is
too high.
The study also may be of significance to students to capitalise on these data as well as adopt
new research methods to demonstrate to organisations decision makers that supplies quality
may contribute to customer satisfaction, good image and increase in efficiency in operations.
They also examines in broader details other factors that affect supplies quality on University
performance and discover more dimensions and approaches to quality that the organisation
can employ to improve its operations.
The study is to help the Government to come up with legal policies and procedures governing
procurement of supplies. This ensured that all purchases made by the organisations conform
to the right quality. This helps the government to control piracy.
Finally the research will be of significance to the citizens of the nation for they will be
sensitised on the effects of poor quality of supplies hence enabling them to make the right
decisions as to quality when making purchases.
Scope of The Study
The study is basically concerned with the impact of supplies quality on university
performance in Kenya. Masinde Muliro University of science and Technology was chosen as
the case study.
Limitations of The Study
1. Financial constraints
Financial limitation for research expenses such as transport to the field, airtime, stationary
and printing.
Financial limitation was a major constraint for us to carry out research in other universities
and institutions. This research called for us to have adequate funds to cater for research
expenses such as transport to the field, airtime, stationary and printing. This limitation was
dealt with by reducing unnecessary expenses and sourcing for more funds from our private
forces.
2. Limited time
This research was conducted for a period of four months (one semester) at the same time
running con-currently with our studies. This period of time was not sufficient to carry out the
European Journal of Logistics Purchasing and Supply Chain Management
Vol. 1, No.2, pp.11-35, December 2013
Published by European Centre for Research Training and Development, UK (www.ea-journals.org)
14
study comprehensively. The researchers overcome this by creating extra time out of a busy
schedule of lecture program including meeting after lectures, weekends and evenings.
3. Non response from respondents
Most respondents were not willing to give information due to their busy schedule and fear of
giving information. This was overcome by assuring them that the information was going to
be confidential and that it will be secretive. We would also get free rime to visit them.
4. Limited resource material
Since this area of study is new in the market, it was not easy to get required information. Also
the case i.e. area of study is a young university which is not fully developed in terms of
procurement, quality issues and performance.
LITERATURE REVIEW
Empirical quality management (QM) research has evolved over the last 20 years. Empirical
research has defined and measured QM practices. Numerous studies have investigated the
relationships among QM practices and various aspects of a firm’s performance. As
competition moves beyond a single firm into the supply network of multi firms, focus is
shifting from management of internal practices alone to the management of external firms.
Quality managers must integrate their firms’ practices with those of customers and suppliers.
Integrating QM and supply chain management (SCM) will be important for future
competitiveness.
Quality assurance in supplies management related to different kinds of goods and services
have been researched by (Sroufe and Curkovic, 2008) in order to align the supply chain with
quality assurance to derive the models which can be adopted by the organizations to assure
the quality.
The Supply chain performance measurement Bongsug Chae, (2009) Verma et al., 2008; Rick
Hoole, Khan et al., 2009; Hong et al., 2010; Theeranuphattana and Tang, 2008; Sun et al.,
2009; Chris Morgan, Yeung, 2008; Fantazy et al., 2009; Hervani et al., 2005; Soo Wook
Kim, 2006 ) models, methods and frameworks related to supply chain partnership (kim et al.,
2010), supply chain integration (Flynn et al., 2010), supply chain interaction (Salvador et al.,
Salvador), Supplier relations(Ou et al., 2010; Simpson and Power; 2009; Sezen, 2008),
supplier selection and Quality improvement ; Cagnazzo et al., 2010; Supply chain
effectiveness ,Supply chain collaboration (Papakiriakopoulos and Pramatari, (2010);
Wiengarten et al., 2010) for different types of goods and services such as FMCG, perishable
goods, services etc. have been researched for increasing the performance of supply chain at
different cross sections of it to derive the profit as well as sustained market position and
growth for organizations.
Supply chain quality management has been explored by researchers where six hypotheses
related to Supply chain quality management developed through literature review and tested
using survey data from US manufacturing companies. Relationship between supplies quality
management practices and organizational performance have been researched and it was found
that organizational performance could be enhanced through improved supply chain quality
management . the concept of supplies quality management as the formal coordination and
integration of business processes involving all partner organizations in the supply channel to
measure, analyze and continually improve products, services, and processes in order to create

European Journal of Logistics Purchasing and Supply Chain Management
Vol. 1, No.2, pp.11-35, December 2013
Published by European Centre for Research Training and Development, UK (www.ea-journals.org)
15
value and achieve satisfaction of intermediate and final customers in the marketplace. They
also found out its relevance to academic and industrial practice and proposed a Quality-SCM
framework. (Taticchi and Brun, 2010) identified role of performance measurement systems to
support quality improvement initiatives at supply chain level. (Gionata Carmignani, 2009)
modified interpretation of ISO 9001:2000 norm and introduced a research to determine a
standard to implement a management system for a whole supply chain through the
identification of the main supply chain processes and drivers. (Vanichchinchai and Igel,
2009) found that TQM and Supplies Management have same ultimate goal which is customer
satisfaction. TQM emphasizes internal (employee) participation and Supplies Management
focuses on external (business partners) partnerships but there is a need to emphasize both
internal and external partnerships to further strengthen the emphasis on “total” TQM and the
entire supplies management. The service quality and total quality management as a business
strategy designed to add value to customers. In managing quality effectively in supplies, there
are ten critical factors for describing a Supply Quality Management system. These factors
could be clustered into three major groups namely supplier selection, supplier development
and supplier integration. This study has not covered the relationship among supply quality
management, supplier quality and buyer quality, the effect of increased emphasis on supply
chain management on the practice of quality management.
This research reviewed current research in quality management and identified common
themes found in the literature. Key quality management content variables identified are
customer focus, quality practices, supplier relations, business results, and safety. Based on
these variables we proposed areas for future research in the field of supply chain quality
management. Kaynak and Hartley, (2008) found that the inclusion of customer focus and
supplier quality management in the QM model supports the importance of internal and
external integration for quality performance. Improving the quality of all supplies results in
reduced costs, improved resource utilization, and improved process efficiency. The study
found that majority of studies on service quality has focused on service industries, not supply
chain as a whole. On finding that there are certain service quality domains that have not been
investigated sufficiently, we propose a model for assessing the quality of service at various
interfaces of supply chain using 3PL.
(Mowat and Collins, 2006) worked on consumer behavior and fruit quality and found in their
survey that 124 consumers revealed that 46 percent ranked price as the most important
attribute influencing the purchase decision, followed by taste (25 percent), size (13 percent)
and skin color (3 percent). Taste was the attribute most frequently associated with
disappointment (84 percent of responses), followed by price (10 percent) and texture (6
percent). Supply chains in new and emerging agricultural industries typically lack
information linking product quality with consumer behavior. (Ramudhin et al., 2008) worked
on incorporating cost of quality in supply chain network design to ensure the lowest overall
cost, because it reduces the probability of defects and hence the probability of additional cost
which might be due to corrective action but further research could model cost of quality
(COQ) at both supplier and plants simultaneously. In industries such as the aerospace
industry, the variable production cost is high; hence producing extra parts to compensate for
defectives would be a costly option. Sengupta, (2010) worked on placing a quality-oriented
coordination process between the supply and receiving partners by following the
mathematical model which supports the development of an effective supply chain network
that maximizes profit. (Romano and Vinelli, (2001) worked towards understanding how

European Journal of Logistics Purchasing and Supply Chain Management
Vol. 1, No.2, pp.11-35, December 2013
Published by European Centre for Research Training and Development, UK (www.ea-journals.org)
16
quality can be managed using a supply chain which reports a case study conducted on
Marzotto, an important Italian textile and Apparel Company, and its supply chain
relationships. The study compares the quality practices in the two different kinds of supply
network of which Marzotto is the focal firm. One is managed using a traditional customer-
supplier approach and the other a broader and more coordinated perspective. In the latter
case, it was found that the whole supply network could improve its ability to meet the
expectations of the final consumer in terms of quality through the joint definition and co-
management of quality practices/procedures. Yang et al., (2007) carried out a case study in
Samsung, where they found that the effort and investment in synthesizing SCM and six
sigma, and developing a unique six-sigma-based methodology to improve its SCM operation,
have turned out to be fruitful. The Black Belt program has produced highly qualified and
talented SCM specialists, who are currently training the methodology to members in their
organizations and leading SCM projects. Braglia and Petroni, (2010) describes a multiple
attribute utility theory based on the use of data envelopment analysis (DEA), aimed at
helping purchasing managers to formulate viable sourcing strategies in the changing market
place. DEA has proved to be capable of handling multiple conflicting attributes inherent in
supplier selection while simultaneously trading-off key supplier selection criteria.
Burgess and et al. (2006) found that the supply chain field is a relatively “new” one; several
disciplines claim ownership of the field; consensus is lacking on the definition of the term;
contextual focus is mostly on the manufacturing industry; predominantly “process”
conceptual framing prevails; research methods employed are mostly analytical conceptual,
empirical surveys or case studies; the positivist research paradigmatic stance is prevalent; and
theories related to transaction cost economics and competitive advantage dominate. Das et
al., 2008) found that with a few notable exceptions, there is no guidance in the literature for
operations managers trying to understand the role that employee safety at their own or a
supplier could play in quality outcomes. Empirical tests of these propositions provide initial
evidence that safety does indeed
Definition of Organisational Performance
Most organizations view performance in terms of effectiveness in achieving their mission,
purpose or goals. Most would tend to link the large notion of organization performance to the
results of their particular programs to improve performance.
Performance therefore can be defined as a state of competitiveness of the organization
received through a level of efficiency and producing which ensures a sustainable presence
658 hence we conclude that a performing organization is efficient, competitive and
productive.
P. Drucker states that to be effective means “to do plan things well” by efficiency we meant
the extent to which objectives were achieved.
Having known what performance is or means, we can define organizational performance,
and it comprises the actual output or results of an organization as measured against its
int6ended output or goals and objectives. According to Richard et al (2009) organizational
performance encompasses three specific areas of firm outcomes.
a) Financial performance which involves profits, returns on assets, return on investments
among others.
b) Product market performance which involves sales and market share.
c) Shareholders returns which involves total shareholder returns and economic value
added.

European Journal of Logistics Purchasing and Supply Chain Management
Vol. 1, No.2, pp.11-35, December 2013
Published by European Centre for Research Training and Development, UK (www.ea-journals.org)
17
Richard et al (2009) also added that dimensions of organizational performance may include
financial performance, customer service, social responsibility and employee stewardship.
Relationship between Supplies Quality And Organizational Performance
The effective management of technology and quality is the key to increased quality and
enhanced competitive position in today’s global environment (Kuei et al, 2002)
(Bowersex et al 2002) noted the quality and operational efficiency are known as the greatest
supply chain challenges. To make high quality supply chains a reality, those challenges must
be resolved. Madu et al (1905) found a causal significant relationship between the quality
acclimation (customer satisfaction, employee satisfaction and employee service quality)and
organization performance (Wang et al, 1999) found out that factors such as cooperation , trust
and long term relationship enhance quality in the supply chain members.
Quality management practices and supplier participation are significant correlated (Tracey,
2001) urged that supplier involvement relate to customer satisfaction level and firms
performance that is the supplier participation separate good performing organization and not
good performing organization.
The level or supplier participation practices influence their degree of organization
performance that is suppliers should be selected based on their areas of quality practices
hence the supplier selection is one of the critical factors in managing supply chain quality.
Therefore quality management issues and supplier selection are significantly correlated
(Tanetal 1998) contended that supplier evaluation practices relates to performance of firms.
As a result the level of supplier selection practice positioning influences the degree of the
organizational performance (Tanet 1998) noted a relationship between the firm’s operational
quality approaches and their performance. Their empirical result however shows that quality
management practices and supply chain management practices must be implemented
conjointly to realize superior finance business results.
Figure 2.7.1: Multiscale of supply chain quality management

European Journal of Logistics Purchasing and Supply Chain Management
Vol. 1, No.2, pp.11-35, December 2013
Published by European Centre for Research Training and Development, UK (www.ea-journals.org)
18
Table 2.7.1: Multiscale of supply chain quality management.
Variable Construction Description
Quality management Top management leadership Top management provide the
necessary leadership in enabling
condition for total quality
Training Job related skills total quality
control concepts are emphasized
Product/service design Consider the design side of the
product cycle, emphasize on
customer needs and wants.
Supplier quality
management
Emphasize on quality not price.
Process management Process improved methods are
used to ensure stable and capable
process.
Quality data reporting Records about cost of quality and
other indicators are kept for
analysis.
Employee retention Empower employees’ reliance on
awareness and effort of all
employees.
Customer relations Based in class satisfaction is
emphasized
Benchmarking Benchmarking is used to improve
enterprise performance
Supplier participation Supplier
participation/product design
and Kaizen project
Supplier communication and work
with enterprise on continuous
improvement project or
ownership.
Supplier selection Quality oriented supplier
selection
Suppliers are selected based on
their capacity to meet the needs of
the enterprise
Cost oriented supplier
evaluation
Suppliers are selected based on
cost component
Organizational
performance
Satisfaction level Component items include
employee satisfaction and
customer satisfaction.
Business result Component items include;
productivity, cost, performance
profitability, sales growth, earning
growth and market share.
Study Gap
Previous studies have concentrated on showing the relationship between quality supplies and
organizational performance in various sectors including; Agricultural sector, Industrial sector,
Tourism sector, Medical and Health sectors. Few studies have looked at these relationships in

European Journal of Logistics Purchasing and Supply Chain Management
Vol. 1, No.2, pp.11-35, December 2013
Published by European Centre for Research Training and Development, UK (www.ea-journals.org)
19
the Education Sector, specifically the Universities in Kenya. The study therefore seeks to fill
this gap by examining the effects of supplies quality on Universities performance.
This study borrows aspects from Demeyers Model of 1990. The independent variable,
supplies quality was measured based on; performance, serviceability, durability, conformance
and aesthetics. The dependant variable, organizational performance shall be measured based
on; cost reduction, efficiency, effectiveness, customer satisfaction and University image.
CONCEPTUAL FRAMEWORK
Theory of quality Demeyer (1990) have proposed a sound cone model which states that
quality is a base of all subsequent improvement in the organization. Once a base of quality is
constructed, management can build other factors or areas e.g. dependability, flexibility
efficiency but which doing all these quality should also be improved continuously.
Independent Variables Dependent Variable
Figure 2.9.2: Conceptual framework
RESEARCH METHODOLOGY
This section covers the area of study, the research design, target population, sample and
sampling techniques, research instruments, data collection procedure and data analysis. The
study is based on both primary data and secondary data.
Study Area
MMUST is in Kakamega County in Western province. MMUST has a population density of
about 7,000 hence it is among the highly populated university in Western region.
MMUST is the most convenient study area for our research; this is because it is easy to get
accessed to information from the institution. This is because MMUST is a young growing
university and quality issues may be a problem which needs to be addressed. MMUST is also
convenient because the accessibility to researches hence did not pose problems when carrying
out research.
Research Design
The descriptive study determines and reports the way things are (Sikurani, 2004). Research
was guided by descriptive survey design to establish the relationship between variables
especially impact of supplies quality on organizational performance. Guy (1981) defines
descriptive research as a process of collecting data in order to test hypothesis or to ensure
Organizational performance
Efficiency of
organization
Customer satisfaction
Organizational image
Cost reduction
Supply quality
Serviceability
Durability
Conformance
Reliability
aesthetic Moderating factors/variables
Procurement
Legal aspects on
performance
Economic factors
Supplier availability
Supplier reliability

European Journal of Logistics Purchasing and Supply Chain Management
Vol. 1, No.2, pp.11-35, December 2013
Published by European Centre for Research Training and Development, UK (www.ea-journals.org)
20
questions concerning the correct status of the subject in the study. According to Sikurani
(2004) a descriptive study is undertaken in order to ascertain and be able to describe the
characteristics of variable of interest in the study. The goal of descriptive study is, hence is to
offer to the researcher a profile or is to describe relevant aspects of the phenomenon of
interest from an individual organizational industry oriented or other perspective. The study
was of a case study nature.
This research is the most commonly used and the basic reason for carrying out descriptive
research is to identify the cause of some happening. However if the research is to retain
useful result however is conducting the research must comply with strict research
requirement in order to obtain the most accurate figure or results possible (D.S.S Research
limited).
Target Population
Kombo and Tromp (2006) population is a group of individuals, objects or items from which
samples are taken for study. The study was conducted in MMUST with a population of about
7,000 people which include students, staffs, subordinates e.tc. The research was in MMUST
departments which are many but a sample of the departments shall be researched on.
Sample Size
The study chose a sample of fifty respondents composed of students, lecturers and non-
teaching staff of the university. Random sampling was be used to choose the respondents
after they had been selected through stratified sampling which selected the department.
Data Collection Instruments
This refers to tools used for data collection and how they were developed (Kombo and Tromp
2006). This study employed questionnaires of the primary instruments of data collection. The
structured (closed ended) and unstructured (open ended) questionnaires were used. In
structured questionnaires the questionnaires are accompanied by a list of all possible
alternatives from which the key respondents selected the answer that describe their situation
(Mugenda 1999). The advantage of using this type of data collection instrument is ease with
which they afford the researcher when analyzing data. Moreover they are easy to administer
and economical to use in terms of time and resources.
Open ended questions are included in the instrument for the advantage of giving insight into
the motivation of the respondents. It also makes it possible to analyse qualitative open ended
questions.
Observation
As a method of data collection, it involves eye contact. This is according to Folerit, BS and
G. Dunn (1983). Here visit the departments were visited and their operations observed. We
also observed the students behaviour in attending lectures and lecturers when delivering their
lectures.
Interview
This is where we held a conversation with the respondents that is the interviewer and the
interviewee. It is a method of data collection as advanced by Everrit B.S (1983). Emphasis
shall be put on research topic during the conversation.
This method was reliable because feedback was obtained immediately. This saves time as
there were no delays (Stigler S.M, 1986).

European Journal of Logistics Purchasing and Supply Chain Management
Vol. 1, No.2, pp.11-35, December 2013
Published by European Centre for Research Training and Development, UK (www.ea-journals.org)
21
Validity And Reliability Of The Research Instrument
This section tests the validity and reliability of research instruments that were used when
collecting and analyzing data.
Validity
Any instrument used in research has to uphold validity. This means accurate, concrete and
meaningful of the instrument. Validity is the external to which the instrument measures
according to the researcher’s subjective assessment.
(Nachiams 158) Best and Kaln (1989) Suggested that the validity of the instrument is asking
the right question framed from the least ambiguous way. To ensure the content validity of the
questionnaires the operational definitions of the proposed research were developed after an
intensive review of the relevant literature. Freaenekel (1993) posts that the instrument should
be given to the individual who can be expected to vender an intelligent judgement about the
adequacy of the instruments. The instrument was then amended according to the expert
comments and recommendations before being administered. For the validation of the
instruments the researcher should consult supervisors and experts. The aim is to determine
whether the items are adequate in content and logically arranged.
Reliability
This research refers to how consistent a research produce or an instrument is i.e. the degree of
consistency demonstrated in a study. (Furnum et al 1989). Researchers of this study ensured
that there was reliability in the study.
To test reliability of instruments the questionnaire was piloted using one of the user
departments for example production engineering. One production major and the staff in
production department. After about a week the questionnaire was readministered to the same
group. The data was then analysed and the results corrected to determine the reliability and
coefficient. Best and Kaln (1989) suggested that Pearson product moment correlation is most
often used because of its precision with p value of 0.5, both reliability and validity should be
high to be desirable (Fraenkel et al 1993).
Data Analysis Techniques
Saunders et al (2003) asserts that data analysis may be defined as a process of data collection
and analysis of qualitative data that involves three concurrent sub processes of data reduction,
data display, drawing and verifying conclusions. In most cases it is usually the use of
qualitative methods in a descriptive study.
It involves theoretical method of data collection, as elaborated by Tufte ER (1983).les,
figures, percentages and charts. The researcher also used Qualitative methods when coming
up with tables, charts and diagrams for data analysis. All completed instruments were
assembled and information organized. Quantitative as already mentioned was analysed using
descriptive results, summarized and presented in tables.
DATA ANALYSIS, PRESENTATION AND FINDINGS.
The research involved three enumerators who collected data from twenty five students and
twenty five staff members of Masinde Muliro University of Science and Technology. Of the
fifty respondents targeted, fourty two respondent representing 85%. This indicates that most
respondents were able to fill the questionnaire and return it.

European Journal of Logistics Purchasing and Supply Chain Management
Vol. 1, No.2, pp.11-35, December 2013
Published by European Centre for Research Training and Development, UK (www.ea-journals.org)
22
Departments Response
Table 4.1. 2: department’s response
Departments researched on Frequency Percentage (%)
Centre for disaster(CIDMA) 4 9.5
Procurement 3 7.1
Education Science 10 23.8
Business Management 5 11.9
Catering 2 4.8
Engineering 4 9.5
Criminology 1 2.4
Health 1 2.4
Quality assurance 1 2.4
Library 5 11.9
Finance 2 4.8
Registrar 1 2.4
Estates 1 2.4
Students affairs 2 4.8
Gender Distribution
Figure 4.2. 3: Students respondents.
The students were required to indicate their gender; this was to establish the main gender
group of the student respondents. The biggest percentages of 65.2% were male while 34.8%
were female. This shows that there is gender imbalance in the university student’s population;
therefore the university should admit more female students than male students.
male
female
Figure4.2. 4: Staff respondent
0
20
40
60
80
Male Female
Frequency
Percentage(%)

European Journal of Logistics Purchasing and Supply Chain Management
Vol. 1, No.2, pp.11-35, December 2013
Published by European Centre for Research Training and Development, UK (www.ea-journals.org)
23
The staffs were required to indicate their ages; this was to establish the main age group of the
staff respondents. The biggest percentages of 73.6% were male, while 26.3% were female.
This shows that most staff respondents were male. This means that the university should
employ more female staff.
Age Distribution among the Respondents
Students
The students were required to indicate their ages; this was to establish the main age group of
the student respondents. The biggest percentages of 73.9% were between 21 to 24 years,
17.4% were between 25 to 30 years, 8.7%were above 30years. This shows that most student
respondents are mature students having joined university after completing their O-level
studies.
21 to 24years
25 to 30years
Above 30years
Figure4.3. 5: Students
Staffs
The members of staff were also requested to indicate their ages. This sought to establish the
main age bracket of the staffs. The largest percentage 47.4% representing nine respondents
were between ages of 25 to 30years, 31.6% representing six respondents were between 31 to
35 years, 5.3% representing one was between 36 to 41 years, and 15.8% representing three
respondents were above 42years. This implies that most of the staff members were still young
hence can accept change and can understand quality issues well.
25 to 30years
31 to 35years
36 to 41years
Above 42years
Figure 4.3. 6: Staff

European Journal of Logistics Purchasing and Supply Chain Management
Vol. 1, No.2, pp.11-35, December 2013
Published by European Centre for Research Training and Development, UK (www.ea-journals.org)
24
Year of Study
The study also sought to establish the year of study of the student’s who responded to the
questionnaires. It was reported that 26.1% representing six students were first years, 17.4%
four respondents were third years, and 56.5% representing thirteen were fourth years. This
shows that most students have been in collage for long hence they can give relevant
information about quality supplies.
First years
Third years
Fourth years
Figure 4.4. 7: Year of Study
Job Status
The staff’s respondents were required to indicate their job status in order to find out what
positions they hold. It was reported that 5.6% representing one respondent was lecturer,
47.4% representing nine were clerks, 21% representing four staffs were heads of sections and
26.3% representing five were supervisors. This shows that most of the staff respondents were
clerks, meaning that they are directly involved with most of the supplies hence they can be
able to give the right information about quality of supplies.
0
5
10
15
20
25
30
35
40
45
50
Lecturers Clerks Heads of section Supervisors
Frequency
Percentage(%)
Figure 4.5. 8: Job Status

European Journal of Logistics Purchasing and Supply Chain Management
Vol. 1, No.2, pp.11-35, December 2013
Published by European Centre for Research Training and Development, UK (www.ea-journals.org)
25
Number of Years Worked
The study also sought to establish the number of years the staff has worked in the University.
It was established that 47.4% representing nine staffs have worked between 2 to 4 years,
26.3% representing five were between 5 to 7 years, 15.8% representing three were above 7
years, and 10.5% representing two were below one year of work. This means that the largest
group had worked between 2 to 4 years, hence they can be able to tell quality of supplies and
the operations of the university given their experience.
0
10
20
30
40
50
Below 1 year 2 to 4 years 5 to 7 years Above 7 years
Frequency
Percentage(%)
Figure 4.6. 9: Number of Years worked
Supplies Quality
Students Perspective
Quality Of Facilities Provided By The University
From the study it was established that 39.1% representing nine students agree that the
facilities provided are of quality, while 60.9% representing fourteen students, and disagree.
This means that most of the students are of the opinion that the facilities are not of quality
Frequency
Percentage(%)
0
20
40
60
80
Agree
Disagree
Frequency
Percentage(%)
Figure 4.7.10: quality of facilities provided by the university
Staff Perspective
Quality Of Supplies Received In The Departments

European Journal of Logistics Purchasing and Supply Chain Management
Vol. 1, No.2, pp.11-35, December 2013
Published by European Centre for Research Training and Development, UK (www.ea-journals.org)
26
From the research it was established that 73.7% of the staffs representing fourteen members
of staff agree that they are of quality while 26.3% representing five members were not in
agreement. This shows that according to staffs majority are in agreement that the supplies are
of quality.
0
20
40
60
80
Agree Disagree
Frequency
Percentage(%)
Figure 4.7. 11: Quality of supplies received in the departments
Quality Of Programmes Offered By The University
The student respondents were required to indicate their opinion as far as the quality of the
programmes are concerned. From the study it was established that 82.6% representing
nineteen were of the opinion that the programmes were satisfactory, 13% representing three
students were not satisfied while 4.3% representing one was not able to tell. From the study it
was noted that most students are satisfied with the programmes offered by the university.
0
20
40
60
80
100
Satisifying Not satisifying No idea
Frequency
Percentage(%)
Figure 4.8. 12: Quality of programmes offered by the university
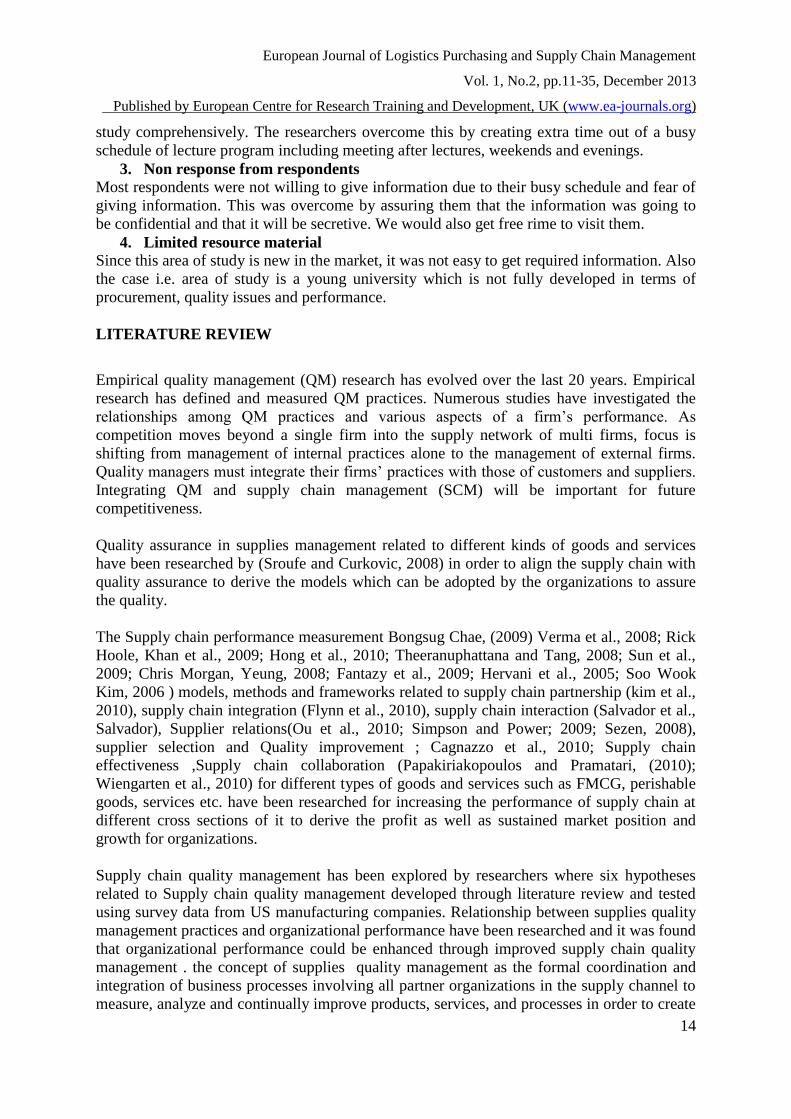
Ways Ascertaining Quality
The research sought to find out about the ways the University employ in ascertaining quality
of the supplies. It was noted that 75% of the respondents representing three staffs said that
inspection while 15% representing one staff says that they use other ways. From the study it
shows that the university apply inspection as a method of ascertaining quality.
European Journal of Logistics Purchasing and Supply Chain Management
Vol. 1, No.2, pp.11-35, December 2013
Published by European Centre for Research Training and Development, UK (www.ea-journals.org)
27
Frequency0
20
40
60
80
InspectionOthers
Frequency
Percentage(%)
Figure 4.9.13: Ways ascertaining quality
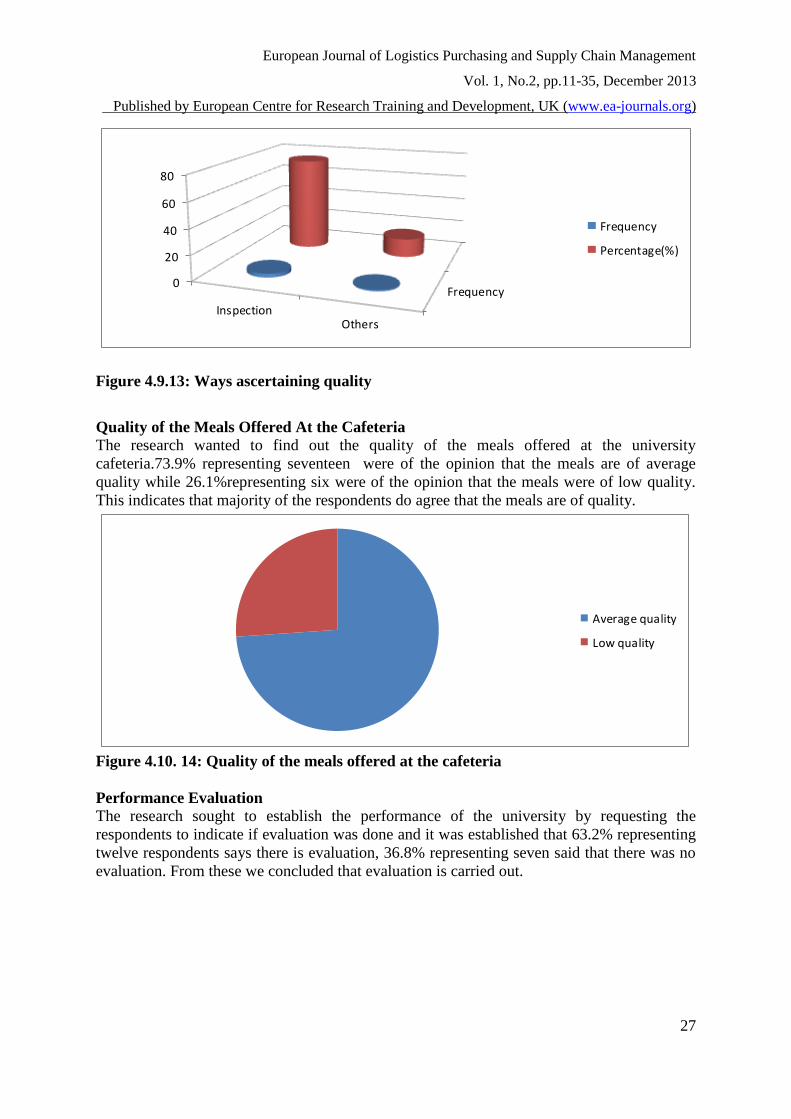
Quality of the Meals Offered At the Cafeteria
The research wanted to find out the quality of the meals offered at the university
cafeteria.73.9% representing seventeen were of the opinion that the meals are of average
quality while 26.1%representing six were of the opinion that the meals were of low quality.
This indicates that majority of the respondents do agree that the meals are of quality.
Average quality
Low quality
Figure 4.10. 14: Quality of the meals offered at the cafeteria
Performance Evaluation
The research sought to establish the performance of the university by requesting the
respondents to indicate if evaluation was done and it was established that 63.2% representing
twelve respondents says there is evaluation, 36.8% representing seven said that there was no
evaluation. From these we concluded that evaluation is carried out.

European Journal of Logistics Purchasing and Supply Chain Management
Vol. 1, No.2, pp.11-35, December 2013
Published by European Centre for Research Training and Development, UK (www.ea-journals.org)
28
0
10
20
30
40
50
60
70
80
Yes No
Percentage(%)
Frequency
Figure 4.11. 15: Performance evaluation
Quality Of Education Contributes To University Performance.
The study wanted to find out if the quality of education offered contributes to performance.
Opinions of respondents were sought to find out. From the research 13% representing three
students were of the opinion that it has no contribution while 26% representing six were not
able to tell, and 61% representing fourteen were of the opinion that it contributes.
0
10
20
30
40
50
60
70
No contrbution Not sure Contributes
Frequency
Percentage(%)
Figure 4.12. 16: Quality of education contributes to university performance
Satisfaction Levels of Respodents on Various Aspects Quality
The research sought to establish the satisfaction level of the respondents on the following
issues.
Student’s perspective
Teaching services
A total of twenty three students participated in these section and out of this, two students
representing 8.7% were of the opinion that the services are very satisfying, fifteen students
representing 65% said that it is satisfying, five respondents 21.7% were dissatisfied while

European Journal of Logistics Purchasing and Supply Chain Management
Vol. 1, No.2, pp.11-35, December 2013
Published by European Centre for Research Training and Development, UK (www.ea-journals.org)
29
one student representing 4.3% were very dissatisfied. From these the research established that
the respondents were satisfied with the teaching services offered.
Catering services
The research sought to find out about the catering services. From the research it was
established that eight respondents representing 34.8% were satisfied, nine representing 39.7%
were unsatisfied, and two representing 8.7% were dissatisfied while four representing 17.45%
were very dissatisfied. From this it was established that respondents were unsatisfied with the
services.
Facilities
The respondents were also required to indicate their opinion on facilities. It was found out
that eleven respondents representing 47.8% were satisfied; ten representing 43.5% were
unsatisfied while two students representing 8.7% were dissatisfied. This shows that a
majority of them were in agreement that facilities were of good quality.
University image
The respondents were required to comment on the university image as a result of quality of
supplies. It was noted that four respondents representing17.4% were very satisfied of the
image, twelve representing 52.1% were satisfied, six representing 26% were unsatisfied while
one representing4.3% was dissatisfied. This means that the image of the university is
improved by quality of supplies.
Staffs perspective
The research sought to establish the various opinions of staff on the various aspects of
performance in relation to quality of supplies. The following was established:
Cost reduction
It was established that 3 staffs out of 19(15.8%) agree that quality of supplies highly reduced
costs, 13 staff (68.4%) were of the opinion that it leads to performance medium, while 3 staff
(15.8%) say that it is contribution is low. This shows that most staff agrees that quality of
supplies contributes to reduction in cost.
Effectiveness
It was established that 5 staff (26.2%) gave an opinion that the contribution of quality of staff
is high, 12 staff (63.2%) says the contribution is medium, 2 staffs (10.5%) says that the
contribution is low. This means that most staff are in agreement that supplies quality
averagely contributes to effectiveness.
Efficiency
It was established that 6 staff (31.6%) were in agreement that supplies quality contributes
highly on university efficiency, 11 staffs (57.9%) were in agreement that the quality of
supplies is averagely contributing to university performance while 2 staff (10.5%) indicated
that the contribution of supplies quality contributes lowly to university efficiency. This
shows that majority of the staff agree that supplies quality contributes averagely to the
efficiency of the university.
Customer satisfaction
It was established that 4 staff(21.1%) agree that customer satisfaction is high as a result of
supplies quality, 8 staffs(42.1) says that it medium contributes to customer satisfaction, 7
staff(36.8%) says that customer satisfaction is low as a result of supplies quality. From this
we can infer that most staff view that customer satisfaction is averagely contributed by
supplies quality.

European Journal of Logistics Purchasing and Supply Chain Management
Vol. 1, No.2, pp.11-35, December 2013
Published by European Centre for Research Training and Development, UK (www.ea-journals.org)
30
Observational results
The researchers were able to observe how the lecturers were carried out, how supplies were
received in the procurement department, and how students attended the lectures, here we
were able to note that quality is observed.
Interviews results
The researchers were able to interview the staff members and the students on various aspects
of supplies quality. It was found that supplies quality in some areas was high while in some
area it was not of high quality .This reinforced the earlier findings of the study elicited by
questionnaires.
HYPOTHESIS TESTING
H01: Effects of supplies quality on organizational performance
Table 4.14. 3: Effects of supplies quality on organizational performance
Observed N Expected N Residual
very
dissatisfying 3 8.4 -5.4
dissatisfying 5 8.4 -3.4
undecided 2 8.4 -6.4
satisfying 14 8.4 5.6
very satisfying 18 8.4 9.6
Total 42
Test Statistics
Table 4.14.4: Effects of supplies quality on organizational performance
effects of supplies quality on organizational performance
Chi-Square 24.429a
Df 4
Asymp.
Sig. .000
a. 0 cells (.0%) have expected frequencies less than 5. The minimum expected cell frequency
is 8.4.
IF A SYMPTOTIC SIGNIFICANCE (P)<0.05 REJECT THE NULL HYPOTHESIS
OTHERWISE FAIL TO REJECT HO1. Since the symptotic significance (p) is less than 0.05,
and then we reject the null hypothesis meaning that there is a significant relationship between
quality supplies and university performance.

European Journal of Logistics Purchasing and Supply Chain Management
Vol. 1, No.2, pp.11-35, December 2013
Published by European Centre for Research Training and Development, UK (www.ea-journals.org)
31
H02: Effects of supply quality on university efficiency
Table 4.14. 5: Effects of supply quality on university efficiency
Observed N Expected N Residual
very
dissatisfying 2 10.5 -8.5
dissatisfying 3 10.5 -7.5
undecided 6 10.5 -4.5
satisfying 31 10.5 20.5
Total 42
Test Statistics
Table 4.14. 6: Effects of supplies quality on organizational performance
effects of supplies quality on organizational performance
Chi-Square 24.429a
Df 4
Asymp. Sig. .000
a. 0 cells (.0%) have expected frequencies less than 5. The minimum expected cell frequency
is 8.4.
IF A SYMPTOTIC SIGNIFICANCE (P)<0.05 REJECT THE NULL HYPOTHESIS
OTHERWISE FAIL TO REJECT HO2.Since the symptotic significance(p) is less than 0.05,
then we reject the null hypothesis meaning that there is a significant relationship between
quality supplies and university performance.
IMPLICATION TO RESEARCH AND PRACTICE
The impact of supplies quality on universities performance: a case study of Masinde Muliro
University of science and technology acted as a benchmark to other public and private
universities in gauging their performance and improving the quality of supplies. This will go
a long way towards meeting the core mandates of the entire university. The current research
emphasizes the significance of the procurement units in all the institutions are centres of
implementing supplies quality in a bid to measure the university performance.
SUMMARY, CONCLUSION AND RECOMMENDATIONS
This section summarizes the important elements of the research. It briefly summarizes the
purpose of study, specific objectives, methodology used and major findings. The results are
further discussed to provide the interpretation and compared to previous studies and the
theoretical background. Conclusions have been drawn from the findings. The research also
provides recommendations for improvement and further studies.

European Journal of Logistics Purchasing and Supply Chain Management
Vol. 1, No.2, pp.11-35, December 2013
Published by European Centre for Research Training and Development, UK (www.ea-journals.org)
32
THE INTENTION OF THE STUDY
Specifically, the study sought to find out the impact of serviceability of supplies on cost
reduction. The study found out that serviceability of supplies greatly affects cost reduction as
was confirmed by 34 (70%) of the respondents. Further chi-square analysis on the results
showed that there is a significant relationship between supplies quality and organizational
performance. This therefore led the study to conclude that serviceability of supplies greatly
affects the organizational performance. On the issue of how supplies durability affects
organizational efficiency, the study found out that supplies durability greatly affects
organizational efficiency as was confirmed by 38 (90%) of the respondents. Chi-square
analysis on the results also showed that there is significant relationship between supplies
quality and universities performance. This therefore led the study to conclude that supplies
durability greatly affects the organizational performance.On the study of the impact of
aesthetics on organizational image, according to the respondents view ,the study found out
that aesthetics greatly affects organizational image as was confirmed by 36(83%) of the
respondents. Concerning the impact of conformance on customer satisfaction, the study
found out that conformance of supplies greatly affects customer satisfaction as was confirmed
by 35(83%) of the respondents.
The research involved collection of data from a representative target population which was
chosen was at random from various department of both students and staff.(procurement,
engineering, Total Quality Management, catering, finance, CDHMA, education science,
BBM, Criminology, health, library, registrar, estates, Students Affairs.
Questionnaires were the only data collection tool used. The results were analysed using
tables, graphs and pie charts.
The study established that supplies quality contributes to university performance which was
measured in terms of various dimensions of cost-reductions of cost-reduction, effectiveness,
efficiency and customer satisfaction and university image. 68.4% the respondents were in
agreement that there is a contribution of supplies quality to cost reduction and this
contribution of supplies quality to cost reduction and this contribution is medium, 63.2%
agree that performance of university in terms of effectiveness is averagely contributed to by
supplies quality.57.9% of respondents says that it is supplies quality that has contributed to
efficiency of the university.42.1% were in agreement that quality of supplies contributes to
customer image and also 52.1% agree that university image is good as result of supplies
quality. The university has a way of ascertaining quality of their supplies in terms of
inspection as opposed to other ways as including supplier selection. The university has also
established a total quality unit to ensure inspection.
The study also established that majority of respondents strongly agree that quality supplies
contributes to university performance. In addition majority of the student’s respondents
agrees that quality of education contributes to university performance. From the study also it
is found that university department do carry out evaluation, it was established that evaluation
is done on occasional time to establish performance.Based on the above, the study concluded
that supplies quality greatly affects the performance of the university.

European Journal of Logistics Purchasing and Supply Chain Management
Vol. 1, No.2, pp.11-35, December 2013
Published by European Centre for Research Training and Development, UK (www.ea-journals.org)
33
CONCLUSION
The following conclusion can be made based on the analysis of the data in this study. First
the analysis of supplies is related to the university performance. Therefore it is important to
conclude that majority of the respondents agrees that supplies obtained by the university are
of quality and also services offered by the university. This implies that supplies quality plays
a great role in university performance. It is also important to note that from the study it is
evident that procurement department plays a key role in ensuring quality of supplies received
and also the quality assurance units of the university do a lot to ensure quality of all services
and supplies received.
The relationship between quality of supplies and university performance is strong such that
supplies quality leads to university performance. All the dimensions of quality of supplies
have an impact on all dimensions of university performance.
RECOMMENDATIONS FOR FUTURE RESEARCH
From the study some recommendations were suggested for improvement or practice and for
further research by scholars or readers. These suggestions for improvement are aimed at
improving the effectiveness of operations of universities to impact positively on performance
of the universities.
The university faces a great challenge in its operations as a result of poor quality of supplies
from the suppliers of the goods and services. So the university procurement department
should place strong restrictions on the suppliers to ensure they supply quality goods and
services. The university quality assurance section should do thorough inspections on goods
and services procured by the university.
The university recruitment department/human resource department should ensure that the
staffs recruited are qualified and competent to be able to ensure quality especially
procurement staff should be knowledgeable in procurement practices and requirements. The
government should also put in place various quality checks in all public universities, this
ensured that quality is attained. The government can come up with legal policies and
practices that should be followed by all universities in the country when undertaking
procurement activities.
The procurement act should be provided to the university by the government and ensure it
adherence to it.
The university management should also ensure that quality is its priority in its operations.
This ensured quality at every activity and stage. This means that the universities should apply
the principal of total quality management so that everything can be viewed in terms of quality
all round.
The department heads should ensure care when drawing up specification for supplies to the
procurement department. This is because procurement department only procures what is
requested for. If a wrong specification is made, it will lead to procuring of the wrong product.
Hence the departments should draw specific and accurate specifications.
The university management should also pursue ISO certification of the university. The
university should be ISO certified in order to ensure that all it operations are of quality.
The university should also ensure that tendering procedures for both goods and services are
carried out openly and effectively to ensure quality and ensuring that contracts are awarded to
qualified vendors and that they are open and genuine. This will enhance quality. There should

European Journal of Logistics Purchasing and Supply Chain Management
Vol. 1, No.2, pp.11-35, December 2013
Published by European Centre for Research Training and Development, UK (www.ea-journals.org)
34
be no collusion between procurement staff and vendor that may amount to receiving of poor
quality supplies.
The procurement department should ensure that those suppliers who are awarded the
contracts are ISO certified in order to guarantee quality of supplies.
Further research should be carried out on the same topic of input of quality on university
performance in Kenya and other universities like Nairobi, JKUAT and Moi which are long
established and give a clear perspective of quality issues in their operations and how they
affect their performance.
REFERENCES
Ajay Das, Mark Pagell, Michael Behm, Anthony Velia “Toward a theory of the linkages
between safety and quality” Journal of Operations Management 26 (2008) 521–535.
Amar Ramudhin, Chaher Alzaman and Akif A. Bulgak “ Incorporating the cost of quality in
supply chain design” Journal of Quality in Maintenance Engineering Vol. 14 No. 1,
2008 pp. 71-86.
Andy C.L. Yeung “Strategic supply management, quality initiatives, and organizational
performance” Journal of Operations Management 26 (2008) 490–502.
Assadej Vanichchinchai and Barbara Igel “Total quality management and supply chain
management: similarities and differences” The TQM Magazine Vol. 21 No. 3, 2009
pp. 249-260.
Barbara B. Flynn, Baofeng Huo Xiande Zhao “The impact of supply chain integration on
performance: A contingency and configuration approach” Journal of Operations
Management 28 (2010) 58–71.
Bongsug (Kevin) Chae “Developing key performance indicators for supply chain: an industry
perspective” Supply Chain Management: An International Journal 14/6 (2009) 422–
428.
Brian Fynesa, Chris Vossb, Sea´n de Bu´ rcac “ The impact of supply chain relationship
quality on quality performance” Int. J. Production Economics 96 (2005) 339–354[17]
Bu¨ lent Sezen “ Relative effects of design, integration and information sharing on
supply chain performance” Supply Chain Management: An International Journal 13/3
(2008) 233–240.
Chin S. Ou Fang C. Liu Yu C. Hung David C. Yen “A structural model of supply chain
management on firm performance” International Journal of Operations & Production
Management Vol. 30 No. 5, 2010 pp. 526-545.
Dimitris Papakiriakopoulos and Katerina Pramatari “Collaborative performance measurement
in supply chain” Industrial Management & Data Systems Vol. 110 No. 9, 2010 pp.
1297-1318.
Dong-Young Kim, Vinod Kumar and Uma Kumar “Performance assessment framework for
supply chain partnership” Supply Chain Management: An International Journal 15/3
(2010) 187–195.
Emilio Esposito and Renato Passaro “Evolution of the supply chain in the Italian railway
industry” Supply Chain Management: An International Journal14/4 (2009) 303–313.
Frank Wiengarten Paul Humphreys and Guangming Cao Brian Fynes Alan McKittrick
“Collaborative supply chain practices and performance: exploring the key role of
information quality” Supply Chain Management: An International Journal 15/6
(2010) 463–473.

European Journal of Logistics Purchasing and Supply Chain Management
Vol. 1, No.2, pp.11-35, December 2013
Published by European Centre for Research Training and Development, UK (www.ea-journals.org)
35
Gionata Carmignani “Supply chain and quality management the definition of a standard to
implement a process management system in a supply chain” Business Process
Management Journal Vol. 15 No. 3, 2009 pp. 395-407.
H.M. Wee Simon Wu “Lean supply chain and its effect on product cost and quality: a case
study on Ford Motor Company” Supply Chain Management: An International Journal
14/5 (2009) 335–341.
Hale Kaynak a,*, Janet L. Hartley “A replication and extension of quality management into
the supply chain” Journal of Operations Management 26 (2008) 468–489.
Jao-Hong Cheng, Chung-Hsing Yeh and Chia-Wen Tu “Trust and knowledge sharing in
green supply chains” Supply Chain Management: An International Journal, 13/4
(2008) 283–295.
Jari Collin Elisa, Helsinki, Finland, and Eero Eloranta and Jan Holmstro¨m “How to design
the right supply chains for your customers” Supply Chain Management: An
International Journal 14/6 (2009) 411–417.
Su-Yol Lee “Drivers for the participation of small and medium-sized suppliers in green
supply chain initiatives” Supply Chain Management: An International Journal, 13/3
(2008) 185–198.
Szu-Yuan Sun and Meng-Hsiang Hsu Wen-Jin Hwang “The impact of alignment between
supply chain strategy and environmental uncertainty on SCM performance” Supply
Chain Management: An International Journal 14/3 (2009) 201–212.