the impact of stakeholder orientation on · pdf filedirectors to consider stakeholders’...
TRANSCRIPT
1
THE IMPACT OF STAKEHOLDER ORIENTATION ON INNOVATION:
EVIDENCE FROM A NATURAL EXPERIMENT
CAROLINE FLAMMER Richard Ivey School of Business University of Western Ontario
1255 Western Road, Office 3351 London, ON N6G 0N1, Canada
(519) 661-3144 [email protected]
ALEKSANDRA KACPERCZYK
Sloan School of Management Massachusetts Institute of Technology
100 Main Street, E62-480 Cambridge, MA 02142
(617) 253-6618 [email protected]
August 2014
ABSTRACT
In this study, we assess the causal impact of stakeholder orientation on innovation. To obtain exogenous variation in stakeholder orientation, we exploit the enactment of state-level constituency statutes, which allow directors to consider stakeholders’ interests when making business decisions. Using a difference-in-differences methodology, we find that the enactment of constituency statutes leads to a significant increase in the number of patents and citations per patent. We further examine the mechanisms through which stakeholder orientation fosters innovation. In particular, we argue and provide evidence suggesting that stakeholder orientation sparks innovation by i) promoting a secure work environment that is conducive to experimentation, and ii) enhancing the satisfaction of various stakeholders.
Keywords: innovation; stakeholder view; long-term orientation; constituency statutes; difference-in-differences.
* Both authors contributed equally. We are grateful to Pierre Azoulay, Tima Bansal, Marc Gruber, Bryan Hong, Jennifer Howard-Grenville, Michael Lenox, as well as seminar participants at Ivey Business School, the 5th People and Organizations Annual Conference at Wharton, the 6th Alliance for Research on Corporate Sustainability Conference at Cornell, the SMS Special Conference: Startup and Restart Strategies (Tel Aviv), as well as the 74th Annual Meeting of the Academy of Management (Philadelphia, PA) for helpful comments and suggestions.
2
1. Introduction
A long-standing literature acknowledges the significance of innovation for economic growth (e.g.,
Aghion and Howitt 1992, Grossman and Helpman 1990, 1994, Jones 1995, Romer 1990) and firms’
survival (e.g., Baumol 2002, Porter 1990, Schumpeter 1942). For example, Baumol (2002, p. 1) argues
that “[u]nder capitalism, innovative activity (…) becomes mandatory, a life-and-death matter for the
firm.” In particular, the ability to innovate is central to responding to changes in the business environment
(e.g., Eisenhardt and Brown 1998, Eisenhardt and Martin 2000), and establishing market leadership (e.g.,
Porter 1990). Accordingly, understanding what conditions foster innovation within the firm is an
important question for academics and business practitioners alike.
Research in strategy, organization theory, and economics has tackled this question, emphasizing
the difficulty of crafting incentive schemes and monitoring devices to encourage the pursuit of innovative
activities within firms (e.g., Aghion and Tirole 1994, Balkin et al. 2000, Baysinger et al. 1991, David et
al. 2001, Graves 1988, Hansen and Hill 1991, Hill and Snell 1988, Hoskisson et al. 2002, Kochhar and
David 1996, Manso 2011, Zahra 1996). While this literature focuses on how shareholders can provide
appropriate incentives for executives to pursue innovation, the role of stakeholdersi.e., “any group or
individual who can affect or is affected by the achievement of an organization’s purpose” (Freeman 1984,
p. 53)has remained mostly unexplored. With the exception of a few studies that examine the potential
influence of employee-friendly policies on innovation (e.g., Azoulay et al. 2011), very little is known
about the impact of stakeholder orientation (i.e., the attention to non-financial stakeholders) on
innovation.
Yet anecdotal evidence abounds with examples of innovative companies engaged in vigorous
interactions with non-financial stakeholders, including employees, customers, and community groups. In
fact, attending to non-financial stakeholders is often claimed to drive the firm’s ability to innovate. At
General Electric (GE), for example, executives view the firm’s innovativeness as a function of its external
focus on non-financial stakeholders, including “customers, governments, regulators, community groups
3
and others” (New York Times 2012a). Similarly, one of the stated objectives of IBM’s social business
platform is to “engage all key stakeholders whether an employee, customer or partners in order to
accelerate innovation” (Computer Weekly News 2013).1 Despite the prevalence of such anecdotes,
empirical research on this topic remains scarce.
In this study, we examine the potential impact of corporate attention to non-financial stakeholders
on innovation. This question is difficult to address empirically since stakeholder orientation is likely
endogenous with respect to innovation. In particular, finding a positive relationship between stakeholder
orientation and innovation may be spurious if such relationship is driven by unobserved firm
characteristics that enhance a firm’s propensity to engage in both innovation and stakeholder-friendly
initiatives. This concern is particularly severe given that firm-level attributes, such as slack resources or
managerial ability, while difficult to observe, are likely to drive a firm’s investments in innovation and
stakeholder orientation alike. Moreover, the relationship between stakeholder-friendly policies and
innovation is subject to reverse causality concerns. For example, a positive correlation between
stakeholder orientation and innovation may indicate that innovative firms generate more slack resources,
which can be, in turn, allocated to cater to the interests of stakeholders. In short, while empirically
challenging, leveraging a research design that provides a clean causal estimate is central to understanding
the impact of a firm’s stakeholder orientation on innovation.
We address this empirical challenge by exploiting a quasi-natural experiment provided by the
enactment of constituency statutes in 34 states between 19842006. These statutes allow corporate
directors to consider stakeholders’ interests when making business decisions, and hence provide
exogenous variation in the weight that U.S. public corporations give to the interest of non-financial
stakeholders (Orts 1992). Using a difference-in-differences methodology―with the “treatment” group
composed of states that adopted the statutes, and the “control” group composed of states that did not―we
find that the enactment of constituency statutes leads to a significant increase in the number of patents and
1 Relatedly, in a recent survey of International Data Corp (IDC), 700 businesses were asked why they are using social business platforms. The top response was “involving stakeholders in the innovation process” (The Edge Financial Daily 2013).

4
citations per patent. These findings indicate that stakeholder orientation does indeed foster innovation.
We further extend our analysis by exploring the underlying mechanisms through which
stakeholder orientation promotes innovation. First, we argue that stakeholder orientation fosters a more
secure work environment. Such work environment is conducive to the pursuit of innovative activities, as
it promotes experimentation and tolerance for failure. Consistent with this argument, we find that the
enactment of constituency statutes leads to more innovations in the tails of the distribution (i.e., more hits
but also more failures) as well as more original and somewhat more general innovations.
Second, we argue that stakeholder orientation fosters innovation by increasing the satisfaction of
various stakeholders. In particular, scholars have long attributed creativity and engagement in innovative
tasks to employees’ job satisfaction. In line with this argument, we find that the enactment of constituency
statutes leads to an increase in innovative productivity (i.e., patents per employee and citations per
employee). Moreover, our results show that the positive impact of stakeholder orientation on innovation
is larger for firms in consumer-focused industries (i.e., the B2C sector), and firms in less eco-friendly
industries with greater stakeholder dissatisfaction (i.e., high-polluting industries).
Finally, we examine how the enactment of constituency statutes affects firm performance. We
find that performance increases, but only in the long run. In the short run, operating performance actually
decreases. This suggests a temporal trade-off―while stakeholder orientation pays off in the long run, it
hurts profits in the short run. Hence, without a legal tool such as a constituency statute, short-term market
pressure may prevent shareholder-oriented companies from becoming more stakeholder-friendly (and
hence innovative) in the first place.
Overall, our findings support the view that stakeholders play an important role in fostering
innovation and shed light on the mechanisms through which stakeholder orientation enhances firms’
ability to innovate. In the following, we develop the theoretical arguments in detail, describe the
methodology, present the empirical results, and conclude.

5
2. Theory and Hypotheses
2.1. Stakeholder Orientation and Innovation
Though innovation is an important determinant of firm value and competitive strength, it also entails
considerable risks. Scholars commonly argue that innovative activities are uncertain and difficult to
discern partly because they are long-term, non-routine, and subtle in nature, with long gestational periods
and unpredictable outcomes (e.g., Aghion and Tirole 1994, Griliches 1990, Hall et al. 2005, Holmstrom
1989). Given the precarious nature of innovative activities, successfully engaging key stakeholders, such
as employees and customers, raises significant challenges for the firm.
First, innovation hinges on entrepreneurial initiatives of employees and managers. Undertaking
innovative projects poses, however, considerable career risks as the uncertainty inherent in these projects
increases the probability of employees’ termination. As a result, employees tend to refrain from investing
effort in innovation, preferring instead to focus on activities that are incremental and have more
predictable outcomes (Wiseman and Gomez-Mejia 1998).2 Similarly, while companies’ payoffs from
innovation accrue over the long run, employees and managers generally prefer to invest in short-term
projects, unless provided with long-term incentives, such as long-term compensation (Ederer and Manso
2013, Holthausen et al. 1995, Lerner and Wulf 2007), or funding policies with long-term horizons
(Azoulay et al. 2011).
Second, the pursuit of innovative projects may lead to a decline in customer loyalty and
commitment to a firm’s products and services. In particular, high rates of failure associated with new
products may trigger customer dissatisfaction, threatening a firm’s relation with its customers. For
example, Apple’s release of the iPhone 4S was followed by a wave of complaints from customers
concerned about the new iPhone’s battery life (Forbes 2011a). Relatedly, the pursuit of innovation may
be difficult for customers and investors to evaluate with precision. Indeed, a number of studies suggest
2 Some companies explicitly recognize this challenge. For example, in evaluating their employees, DreamWorks and General Electric explicitly acknowledge the need to take risk and tolerate failure (New York Times 2012a).
6
that capital markets tend to be myopic, leading to systematic undervaluation of corporate investments in
long-run projects such as innovation (e.g., Froot et al. 1992, Hall and Hall 1993).
Given the challenges inherent in innovation, stakeholder orientation is likely to have important
implications for a firm’s ability to develop innovative capabilities. Much like innovation, stakeholder
orientation focuses on long-term horizons rather than immediate payoffs (Slawinski and Bansal 2012,
Wang and Bansal 2012). Benefits from stakeholder orientation materialize in the long run as firms acquire
intangible resources (e.g., Hart 1995, Jones 1995, Porter and Kramer 2006, 2011, Russo and Fouts 1997).
For example, by catering to the interests of consumers, employees, and the natural environment, firms are
able to secure intangible assets such as legitimacy, reputation, and trust (e.g., Luo and Bhattacharya 2006,
Sen and Bhattacharya 2001, Turban and Greening 1996), which may lead to a sustainable competitive
advantage (e.g., Barney and Hansen 1994, Hillman and Keim 2001, Teece 1998).
By fostering long-term horizons, stakeholder orientation is likely to relieve key stakeholders, such
as customers and employees, from short-termism, which generally hinders innovation. In particular,
catering to non-financial stakeholders may encourage employees to engage in innovative activities despite
the long horizon and high uncertainty of doing so. Likewise, stakeholder orientation may foster customer
loyalty and willingness to tolerate potential failure and uncertainty associated with the development of
new products. Overall, we expect stakeholder orientation to enhance the innovative process, increasing
the quantity and quality of innovative output.
HYPOTHESIS 1. An increase in a firm’s stakeholder orientation leads to an increase in
innovation.
In what follows, we examine the mechanisms underlying the relation between stakeholder
orientation and innovation in greater detail. Specifically, we argue that attention to non-financial
stakeholders improves innovation in at least two ways: (a) by fostering a more secure work environment;
and (b) by enhancing stakeholder satisfaction.
7
2.2. Mechanisms
Secure Work Environment
Stakeholder orientation may increase innovation by offsetting the risks associated with high
unpredictability and long-term horizons, inherent to the pursuit of innovation. Firms that cater to
employees typically provide them with comprehensive social benefits. The provision of such benefits may
help strengthen the relationship with employees and foster a more secure work environment,
characterized by long-term commitment to employees and high tolerance for failure. Protection from
involuntary turnover likely encourages employees’ engagement in experimentation and trial-and-error,
leading to an increase in innovative output. In support of this argument, a number of empirical studies
demonstrate that employees are more motivated and willing to invest effort in risky, innovative projects,
when they are protected from dismissal and are safe to fail. For example, in their study of life scientists,
Azoulay et al. (2011) find that freedom to experiment and tolerance for failure foster creativity and
innovation in scientific research. Similarly, Tian and Wang (2014) document that firms backed by venture
capitalists who tolerate failure are significantly more innovative than firms backed by venture capitalists
less tolerant of failure. Finally, Shleifer and Summers (1988) argue that managers are reluctant to invest
in projects with risky payoffs, when they face uncertainty about long-term employment.
Because stakeholder-friendly orientation is likely to foster a more secure workplace, we expect
such policies to relieve employees from short-termism; instead, stakeholder orientation redirects
employee attention toward the pursuit of long-term, unpredictable initiatives, such as innovative projects.
This mechanism implies that by adopting a stakeholder-friendly orientation, firms are able to offset the
negative effect of low job security on employees’ engagement in risky innovative activities. Accordingly,
following the adoption of stakeholder-friendly policies, we expect employees to experiment more and
hence generate i) more original innovations, ii) more general innovations, as well as iii) more innovations
in the tails of the distribution (i.e., more hits but also more failures). The latter argument is related to

8
Azoulay et al.’s (2011) finding that greater job security leads to more innovations that are either “hits” or
“flops”. In sum, the above considerations motivate the following hypothesis:
HYPOTHESIS 2a. An increase in a firm’s stakeholder orientation leads to more
experimentation, and hence innovations that are i) more original, ii) more general, and
iii) more often in the tails of the distribution (“hits and flops”).
Stakeholder Satisfaction
Besides providing a safer work environment, stakeholder orientation may also increase innovative output
by enhancing satisfaction, commitment, and loyalty of various stakeholder groups. First, by attending to
stakeholders, firms are likely to improve employees’ job satisfaction, and hence commitment and
retention among employees (e.g., Herzberg et al. 1959, Maslow 1943, McGregor 1960). A number of
empirical studies provide evidence in support of this argument: Firms that cater to stakeholders are better
able to attract a higher-quality workforce (e.g., Albinger and Freeman 2000, Greening and Turban 2000,
Turban and Greening 1996), foster employees’ commitment to organizational values and practices, and
retain talented employees (e.g., Huselid 1995, Sheridan 1992, Vogel 2005).
Employees’ job satisfaction has important implications for a firm’s ability to innovate. Scholars
have long attributed creativity and engagement in innovative tasks to job satisfaction. In particular,
workers who are satisfied with their jobs are more likely to adopt long-term horizons and generate novel,
potentially valuable ideas for new products, services, and processes (Aiken and Hage 1971, Amabile et al.
1996, Oldham and Cummings 1996).3 In line with this argument, stakeholder orientation―by enhancing
employee satisfaction and motivation―is likely to foster employees’ engagement with innovation.
3 Recent anecdotal evidence further supports this argument. For example, Google engineers are encouraged to take 20 percent of their time to work on something company-related that interests them personally. When describing this policy, a software engineer at Google noted: “It sounds obvious, but people work better when they’re involved in something they’re passionate about, and many cool technologies have their origins in 20 percent time” (New York Times 2007).
9
Accordingly, we expect stakeholder orientation to have a positive impact on employees’ innovative
productivity.
HYPOTHESIS 2b. An increase in a firm’s stakeholder orientation leads to an increase in
employees’ innovative productivity.
We further expect that by implementing stakeholder-friendly policies, firms are able to generate
positive attitudes among other stakeholders such as customers. Much like with employees, stakeholder-
friendly initiatives can help attract and retain customers, as the latter develop positive attitudes, loyalty,
and stronger brand recognition in response to stakeholder orientation (e.g., Brown and Dacin 1997,
Fournier 1998, Kotler et al. 2012, Luo and Bhattacharya 2006, Sen and Bhattacharya 2001). Similarly,
catering to stakeholders may enhance firm’s reputation among customers, and other stakeholders alike
(Porter and Kramer 2006, Williams and Barrett 2000).
Customer satisfaction has direct implications for innovation, affecting innovative output in at
least three different ways. First, positive attitudes among customers have been linked to greater demand
for the firm’s products and services (Lev et al. 2010). There is further evidence that rising demand leads
to an increase in innovation (Schmookler 1962, 1966) because firms have a stronger incentive to work on
an unsolved problem and invest vast resources into the development of expensive and uncertain R&D
activities, if they know there is a market for the product.
Second, customer loyalty and satisfaction may encourage innovation by acting as a buffer in
which it is safer for the firm to experiment with novel ideas and technologies. Firms may be more willing
to take on risks when experimenting with new, failure-prone technologies, if their customers are
committed and loyal. For example, Apple’s customer loyalty is believed to have facilitated the
willingness to experiment with innovative but often risky technologies, given that “whenever Apple has
problems with its products, its customers are incredibly forgiving and patient” (Forbes 2011a).
Third, loyal and committed customers may foster innovative output by acting as a key source of
new ideas and valuable know-how. For example, the car manufacturer Audi initiated an online
10
development project called “Virtual Lab,” where customers and enthusiasts participate in an exchange of
ideas in order to develop new products and processes. Similarly, Nike enthusiasts participate in the
“NikeTalk” in order to generate new shoe designs incorporating customers’ preferred features (Fueller et
al. 2008). More generally, satisfied consumers are more motivated to engage in new product development
and the improvement of existing ones, acting as an important determinant of the firm’s ability to innovate
(Bogers et al. 2010, Chatterji and Fabrizio 2013, Fueller et al. 2008, Sawhney et al. 2005, von Hippel
1976, 1978).
Overall, the above arguments imply that stakeholder-friendly policies contribute to customer
satisfaction and positive customer attitudes. If customer satisfaction accounts for the positive influence of
stakeholder orientation on innovation, we would expect the effect of catering to non-financial
stakeholders to be stronger in consumer-focused industries (i.e., industries in which goods and services
are sold directly to individual customers).4
HYPOTHESIS 2c. The positive impact of firms’ stakeholder orientation on innovation is
amplified in consumer-focused industries.
Finally, we expect stakeholder orientation to spark innovation by attending to the natural
environment and thus improving the satisfaction of stakeholders concerned about environmental issues.
For example, GE’s green technology and sustainability initiative “Ecomagination” shows commitment to
build innovative solutions for today’s environmental challenge. Using the creativity of countless startups
and research centers around the world, GE encourages innovation for a smart grid, clean energy, as well
as eco-friendly homes, buildings, and cars (Forbes 2011b, GreenBiz 2010). By addressing environmental
challenges and improving their own environmental footprint, companies can contribute to the satisfaction
of various other stakeholders.5 In particular, environmentally-friendly firms benefit from higher
4 Relatedly, Lev et al. (2010) show that, in such industries, clients are more sensitive to the social engagement of companies. 5 Anecdotal evidence further suggests that sustainability benefits the environment and other stakeholders alike. For example, in referring to eco-friendly business practices, the CEO of Seventh Generation said: “Sustainability is no
11
reputation and cleaner work environment, improving the satisfaction of employees and consumers (e.g.,
Bansal and Roth 2000, Hart 1995, Russo and Fouts 1997), which may further enhance innovation. If
stakeholder-friendly orientation promotes innovation by enhancing stakeholder satisfaction, we would
expect such orientation to have a stronger impact on innovation in industries engaged in less eco-friendly
activities (i.e., industries that are more likely to be associated with stakeholder dissatisfaction).
HYPOTHESIS 2d. The positive impact of firms’ stakeholder orientation on innovation is
amplified in industries engaged in less eco-friendly activities.
2.3. Temporal Tradeoff
The previous arguments imply that stakeholder orientation has a positive impact on innovation—an
outcome that is closely aligned with shareholders’ interests. Naturally, this raises the question of what
market imperfection prevents shareholder-oriented companies to become more stakeholder-friendly and,
as a result, more innovative.
On one hand, stakeholder orientation focuses on long-term horizons, rather than immediate
payoffs (Slawinski and Bansal 2012, Wang and Bansal 2012). Benefits from stakeholder orientation
accrue in the long run as firms acquire intangible resources (e.g., Hart 1995, Jones 1995, Luo and
Bhattacharya 2006, Porter and Kramer 2006, 2011, Russo and Fouts 1997, Sen and Bhattacharya 2001,
Turban and Greening 1996) and develop their innovative capabilities.
Managers, on the other hand, are faced with tradeoffs between short- and long-term payoffs in
their daily decision-making. Shareholders devise a series of mechanisms to keep managers on their
toes―such mechanisms are valuable, as managers would otherwise enjoy the “quiet life” (Bertrand and
Mullainathan 2003). Under shareholder primacy, the manager’s decision is guided by the principle of
shareholder value maximization, where shareholder value is measured by the daily stock price. Focusing
on the short-term stock market performance pressures managers to deliver short-term results, leading
longer optional. Companies that fail to adopt such practice will perish. They will not only lose on a cost basis, they will also suffer in recruiting employees as well as attracting consumers” (Forbes 2011c).
12
them to favor projects that pay off in the short run (e.g., Stein 1988). This preference is further reinforced
by myopic capital markets which tend to undervalue corporate investments in long-term projects (e.g.,
Froot et al. 1992, Hall and Hall 1993). Accordingly, shareholder pressure for short-term results may
prevent managers from becoming more stakeholder-friendly in the first place.
In sum, we posit that becoming more stakeholder-friendly presents an inherent managerial
tradeoff—stakeholder orientation negatively impacts short-term financial performance but boosts long-
term financial performance. This motivates the following hypothesis:
HYPOTHESIS 3: An increase in a firm’s stakeholder orientation leads to a decrease in
financial performance in the short run, but an increase in the long run.
Given this temporal tradeoff, shareholders’ myopic behavior can lead to the paradoxical situation
in which shareholder value maximization prevents managers from acting in shareholders’ (long-term) best
interest. Leading innovative companies have recognized this market imperfection and counter the
negative influence of short-term pressure by employing specific measures. For example, Alibaba,
Facebook, Google, and LinkedIn try to weaken shareholder pressure by introducing a dual stock structure,
permitting their managers to focus on innovation and long-term financial performance (Forbes 2013, New
York Times 2012b, 2013).6 Relatedly, we argue that providing corporate leaders with a legal tool—such as
constituency statutes—to shift their focus away from shareholder primacy towards all (i.e., non-financial
and financial) stakeholders may enable companies to overcome this paradox and ultimately become more
innovative.
6 With the exception of China-based Alibaba, all these companies are incorporated in California―a state without constituency statute.
13
3. Data and Methodology
3.1. Data and Variable Definitions
Constituency Statutes
Identifying the causal effect of stakeholder orientation on innovation is challenging because of potential
endogeneity concerns. First, the relation between stakeholder orientation and innovation could be
spurious if both are driven by a third, difficult-to-observe, variable. Moreover, a potential correlation
between stakeholder orientation and innovation could be driven by reverse causation if higher innovation
leads the firm to cater to non-financial stakeholders. Given those empirical challenges, estimating the
effect of stakeholder orientation on innovation hinges on finding an empirical context in which variation
in stakeholder orientation arises exogenously. The specific source of exogenous variation we exploit in
this paper is the enactment of state-level constituency statutes.
Constituency statutes are the statutory result of a longstanding academic debate over the
corporations’ purpose and legal obligation to society (e.g., Bainbridge 1992, Orts 1992). The debate
originated in the 1930s, when scholars debated whether the corporation’s responsibility is to serve its
shareholders exclusively or to serve a broader social purpose (Berle 1931, Dodd 1932). This debate was
revitalized with the development of stakeholder management theories in the 1980s (e.g., Freeman 1984).
On one side, scholars argued for the primacy of shareholder interests. Corporate leaders were not
permitted to consider stakeholders’ interests because their fiduciary duties required them to act in
accordance with shareholders’ interests. Historically, this “shareholder primacy” view prevailed in court
(e.g., Orts 1992).7 As a result, companies refrained from diverting their attention away from shareholders
in order to prevent the risk of potential lawsuits. Others argued that corporate actions affect not only
7 The seminal case embodying the shareholder primacy view is Dodge vs. Ford Motor Co., 170 N.W. 668 (Mich. 1919), in which the Michigan Supreme Court stated: “A business corporation is organized and carried on primarily for the profit of the shareholders. The powers of the directors are to be employed for that end. The discretion of directors is to be exercised in the choice of means to attain that end, and does not extend to a change in the end itself, to the reduction of profits, or to the nondistribution of profits among stockholders in order to devote them to other purposes.”
14
shareholders, but also a variety of non-shareholding constituencies having legitimate interests in the
corporation’s actions. The proponents sought to change corporate law to reflect their belief that
corporations are more than just investment vehicles for owners of financial capital (Bainbridge 1992).
Derived from the scholarly debates in the 1980s, constituency statutes provided corporate leaders
with a legally enforceable mechanism—beyond case law and the business judgment rule—for considering
stakeholder interests without breaching their fiduciary obligations to shareholders (Orts 1992, Stout
2012). The statutes’ core principle is that a corporation should, or at least may, be run in the interests of
more groups than just shareholders. Hence, under these statutes, a corporation’s officers and directors are
allowed to consider the interests of employees, customers, suppliers, the environment, the local
community, and any other potentially affected constituency (e.g., Orts 1992). For example, the
Pennsylvania statute reads:
“In discharging the duties of their respective positions, the board of directors, committees of the board and individual directors of a domestic corporation may, in considering the best interests of the corporation, consider the effects of any action upon employees, upon suppliers and customers of the corporation and upon communities in which offices or other establishments of the corporation are located, and all other pertinent factors.” (15 Pa. Cons. Stat. § 516(a))
Though the language may be state-specific, the core content of the legislation remains the same:
constituency statutes emphasize the importance of considering the interests of non-financial stakeholders
and hence pursuing interests that are not restricted to the bottom line. In fact, most statutes give corporate
leaders permission to consider stakeholder interests in any circumstance, including any structural and
operational decisions, or whenever corporate leaders wish to consider them. While the statutes are only
permissive in nature, they are legally enforceable and marked an important shift away from the one-
dimensional shareholder primacy (Orts 1992, Stout 2012).8
By the year 2006, a total of 34 states in the U.S. had adopted constituency statutes. Table 1 lists
8 The enforceability of the statutes is reflected in business case law. For example, in the federal bankruptcy case In re McCalla Interiors, Inc., 228 B.R. 657 (United States Bankruptcy Court, N.D. Ohio 1998), the court cited the Ohio constituency statute to defend the interests of employees and customers.

15
all 34 states along with the enactment years (this list is adapted from Barzuza 2009, pp. 2040-2041).9 We
use the enactment of these constituency statutes as a quasi-natural experiment to examine the impact of a
firm’s stakeholder orientation on innovation. Because the introduction of the statutes does not reflect any
firm’s strategic decision, such statutes offer plausibly exogenous variation in a firm’s orientation toward
stakeholders.
Data Sources and Sample Selection
The data on innovation are obtained from the National Bureau of Economic Research (NBER) Patent
Data Project database, which contains annual information on patent assignee names, the number of
patents, the number of citations per patent, and the year of patent application. The NBER data are
available from 1976 to 2006. We merge the NBER database with Standard & Poor’s Compustat, which
contains detailed accounting information as well as additional firm-level attributes (e.g., state of
incorporation). We exclude companies that are incorporated outside the U.S. In addition, we only include
firm-year observations for which the necessary accounting variables (e.g., book value of total assets) are
not missing. The list of accounting variables used in this study is provided below. These selection criteria
yield a sample of 159,558 firm-year observations.
Dependent Variables
To measure innovation, we follow common practice in the innovation literature and construct two patent-
based metrics (e.g., Hall et al. 2005, Seru 2014, Tian and Wang 2014). The first metric (“patents”) is the
patent count for each firm in each year. More precisely, this variable counts the number of patent
applications filed in a year that are eventually granted. The relevant year is the application year (as
opposed to the year in which the patent is granted) since it is very close to the actual innovation (see, e.g.,
9 For more details on the constituency statutes, as well as their institutional background, see the law review articles by Bainbridge (1992), Barzuza (2009), and Bisconti (2009). Also, note that Nebraska passed a constituency statute in 2007, but since our sample ends in 2006 (the last year in which patent data are available) the Nebraska statute is not considered in our analysis.
16
Griliches et al. 1987, Hall et al. 2001). The number of patents is subject to a truncation problem, because
patents appear in the NBER database only after they are granted, and the lag between patent applications
and patent grants is about two years on average. Accordingly, as we approach the last few years of the
sample (i.e., 2005 and 2006), the number of patent applications that are eventually granted decreases
because many patent applications filed during these years were still under review and had not been
granted by 2006. To correct for this truncation problem, a common approach (e.g., Hall et al. 2001, 2005)
is to divide the patent count by the total number of patent applications in the same year or, equivalently,
to include year fixed effects in the regressions. We follow the latter approach throughout this paper.
The second metric is a measure of innovation quality. Griliches et al. (1987) show that the
distribution of patents’ value is extremely skewed, with most of the value being concentrated in a small
number of very important and highly cited patents. Accordingly, to measure patents’ quality, we compute
the number of citations in subsequent years divided by the number of patents for any given firm and year
(“citations”). This second metric is again subject to a truncation problem. By construction, a 2005 patent
will receive fewer citations than a 1990 patent (all else being equal) because we only observe citations
received up to 2006. To account for this truncation problem, we multiply the number of citations by the
adjustment factor of Hall et al. (2001), provided in the NBER database.10
In auxiliary analysis, we use the measures of generality and originality constructed by Hall et al.
(2001). Generality is defined as one minus the Herfindahl-Hirschman index of citations that the patent
receives over patent classes. The idea is that if citations to a patent are spread over a larger number of
technology classes, the cited patent is to be regarded as more “general,” in that it presumably spilled over
a broader range of fields (see Hall et al., 2001). Originality is defined similarly, but with respect to
citations given to other patents. To obtain firm-level measures of generality and originality, we compute
the average across all patents for any given firm and year.
10 This adjustment factor is obtained by estimating the shape of the citation-lag distribution across time periods and technological classes. See Hall et al. (2001) for details.
17
We further construct a measure of “hits and flops”. In analogy to Azoulay et al. (2011), we code a
patent as being a hit (flop) if the number of citations it receives is above (below) the highest (lowest)
citation quantile across all patents in the same technology class. To obtain a firm-level measure of “hits
and flops,” we divide the number of hits and flops by the number of patents for any given firm and year.
Finally, we construct two measures of innovative productivity, which are obtained by dividing the
number of patents and citations, respectively, by the number of employees (from Compustat).
Independent Variables
In our baseline regressions (see Section 3.2), we control for a vector of firm-level characteristics that may
affect innovation. All control variables are obtained from Compustat. Specifically, we control for size,
age, return on assets (ROA), market-to-book ratio, cash holdings, leverage, and R&D (research and
development) expenditures. Size is the natural logarithm of one plus the book value of total assets. Age is
the natural logarithm of one plus the number of years since the company was first covered by Compustat.
ROA is the ratio of operating income before depreciation to the book value of total assets. The market-to-
book ratio is the ratio of the market value of total assets (obtained as the book value of total assets plus
the market value of common stock minus the sum of the book value of common stock and balance sheet
deferred taxes) to the book value of total assets. Cash holdings is the ratio of cash and short-term
investments to the book value of total assets. The leverage ratio is the sum of long-term debt and debt in
current liabilities divided by the book value of total assets. R&D is the ratio of R&D expenses to the book
value of total assets. A well-known issue with Compustat is that R&D is missing for many companies. To
avoid losing observations, we follow common practice in the literature and set the missing values equal to
zero. We then include as additional control a dummy variable (“R&D dummy”) that indicates whether
R&D is zero (see, e.g., Hall et al. 2005).
In auxiliary analysis, we further examine whether the effect of stakeholder orientation on
innovation differs depending on industry characteristics. To distinguish between the B2C (business-to-
consumer) and B2B/G (business-to-business/government) sectors, we use the partition of Lev et al. (2010,
18
p. 188) based on 4-digit SIC codes. We refer to B2C industries as “consumer-oriented industries”.
Finally, the U.S. Environmental Protection Agency (EPA) identifies seven industry sectors that account
for 92% of all disposal and other releases of TRI (toxic release inventory) chemicals (EPA 2013, p. 17).11
We refer to companies in these sectors as operating in “less eco-friendly industries”.
3.2. Methodology
Difference-in-Differences
To examine whether an increase in a firm’s orientation toward stakeholders fosters innovation, we use a
difference-in-differences methodology based on the enactment of the 34 constituency statutes listed in
Table 1 (“treatments”). We follow very closely Bertrand and Mullainathan’s (2003) application of the
difference-in-differences methodology in the presence of staggered treatments at the state level.
Specifically, we estimate the following regression:
yilst = αi + αt + αl × αt + β × Constituency Statutest + γ’Xilst + εilst, (1)
where i indexes firms; t indexes years; l indexes states of location; s indexes states of incorporation; αi, αt
and αl × αt are firm, year, and state (of location) times year fixed effects, respectively. y is the dependent
variable of interest, which is either log(1 + patents) or log(1 + citations/patents). Constituency Statute is
the “treatment dummy”—i.e., a dummy variable that equals one if the company is incorporated in a state
that has passed a constituency statute by year t.12 X is the vector of control variables, which includes size,
age, ROA, market-to-book, cash, leverage, R&D, and the R&D dummy. All control variables are lagged
11 The seven high-polluting sectors are metal mining (NAICS 212), electric utilities (2211), chemicals (325), primary metals (331), paper (322), food, beverages, and tobacco (311 and 312), and hazardous waste management (5622 and 5629). We use the NAICS-SIC bridge of the U.S. Census Bureau to match these sectors to 4-digit SIC codes. 12 The state of incorporation is a legal concept that determines which constituency statute, if any, applies to a given company (the state of incorporation does not need to coincide with the state of location of the company’s headquarters). We obtain information on states of incorporation from Compustat. A caveat is that Compustat only reports the state of incorporation for the latest available year. Nevertheless, this caveat is unlikely to matter for our results. Anecdotal evidence suggests that changes in states of incorporation are very rare (e.g., Romano 1993). Along similar lines, Cheng et al. (2004) report that none of the 587 Forbes 500 firms in their panel had changed their state of incorporation during their sample period from 1984 to 1991.
19
by one year. ε is the error term. The regression is estimated by Ordinary Least Squares (OLS). To account
for serial correlation of the error term, we cluster standard errors at the state of incorporation level. The
coefficient of interest is β, which measures the effect of the constituency statutes on innovation.13
Hypothesis 1 predicts that β should be positive and significant.
Our identification strategy can be illustrated with an example. Assume we want to measure the
effect of Georgia’s 1989 constituency statute on the number of patents. We would subtract the number of
patents after 1989 from the number of patents before 1989 for Georgia-incorporated firms (“treated
firms”). However, other events may have happened around 1989, exerting a potential influence on
innovation. For example, there may have been an economy-wide boom that translates into higher profits
and hence more resources available to develop patents after 1989. To account for such contemporaneous
effect, we use a control group. For example, we could look at Alabama-incorporated firms (“control
firms”) and compute the corresponding difference in patents before and after 1989 (no constituency
statute was passed in Alabama). By computing the difference between these two differences, we then
obtain an estimate of Georgia’s 1989 constituency statute on innovation controlling for contemporaneous
changes in innovation that are due to changes in economic conditions. An important difference between
this example and the regression specification is that the latter accounts for the fact that the introduction of
the constituency statutes is staggered over time. Accordingly, the composition of both the treatment and
control groups changes over time as more states are progressively treated.
An appealing feature of specification (1) is the inclusion of state (of location) by year fixed
effects (αl × αt). We are able to include them due to the lack of congruence between states of location and
states of incorporation (for details, see Bertrand and Mullainathan 2003). These fixed effects tighten our
identification since they account for any local shock (e.g., changes in local economic conditions) that may
affect innovation and, at the same time, coincide with the treatment.
13 Due to the logarithmic specification of the dependent variable, β measures the percentage change in innovation.
20
3.3. Validity of the Identification Strategy
To be valid, our identification strategy needs to satisfy two requirements—the inclusion and exclusion
restrictions. First, the treatments (i.e., the enactment of constituency statutes) need to trigger relevant
changes in corporate behavior. Second, the treatments need to be exogenous with respect to innovation. In
the following, we discuss both requirements.
Inclusion Restriction
While constituency statutes are legally enforceable, this characteristic alone does not guarantee that they
lead to an actual change in corporate behavior. To satisfy the inclusion restriction, constituency statutes
need to lead to relevant changes in companies’ stakeholder orientation.
Prior work by Luoma and Goodstein (1999) suggests that they do. Specifically, the authors show
that companies incorporated in states that have enacted constituency statutes increased stakeholder
representation on their board of directors.
To obtain additional evidence, we examine whether the enactment of stakeholder-friendly
legislation leads to an increase in the number of stakeholder-friendly provisions at the firm level. To do
so, we construct a firm-level measure of stakeholder orientation using the Kinder, Lydenberg, and Domini
(KLD) database. This database contains social ratings of companies along several dimensions that reflect
how well they cater to, e.g., the community, the natural environment, employees, diversity, human rights,
product quality, as well as whether firms’ operations are related to alcohol, gambling, firearms, nuclear
power, and military contracting. For each dimension, strengths and concerns are measured to evaluate
positive and negative aspects of corporate actions toward stakeholders. Since the KLD data start in 1991,
the sample period considered for this analysis is from 1991 to 2006. To account for stakeholder
orientation, we focus on firms’ attention to employees, customers, the natural environment, and society at

21
large (community and minorities). We then construct a composite KLD-index by summing up all
strengths along these dimensions.14
To examine whether the enactment of constituency statutes leads to an increase in the KLD-
index, we estimate specification (1) using the KLD-index as dependent variable. The results are provided
in column (1) of Appendix Table I. As is shown, the coefficient on the treatment dummy is positive and
significant. Since the average KLD-index is 1.37 (see Table 2), the estimate of 0.253 implies that
stakeholder orientation increases by 18% following the treatment. This finding indicates that the
enactment of constituency statutes brings about a substantial increase in stakeholder orientation.15
Exclusion Restriction
Our identification strategy relies on the assumption that the enactment of constituency statutes is
exogenous with respect to innovation. In the following, we discuss potential identification concerns and
describe how our difference-in-differences specification helps address them.
Lobbying. A potential concern is that constituency statutes reflect a firm’s choice, as firms may
lobby for the enactment of constituency statutes. In particular, if firms that are characterized by high
innovative output tend to be successful at lobbying for constituency statutes (e.g., as a way to reward their
employees), then our results would be driven by reverse causation. To rule out this concern, we first
search for qualitative evidence that would be suggestive of this possibility. Specifically, we search the
Lexis-Nexis database for press releases indicating that innovative firms actively lobbied for the
14 In addition to strengths, the KLD data also contain a list of concerns. Accordingly, an alternative approach is to construct a “net” KLD-index by subtracting the concerns from the strengths. However, recent research suggests that this approach is methodologically questionable. Because KLD strengths and concerns lack convergent validity, using them in conjunction fails to provide a valid measure of stakeholder orientation (e.g., Kacperczyk 2009, Mattingly and Berman 2006). For this reason, our analysis relies on the composite index of KLD strengths. 15 As can be seen from Table 1, only six states passed a constituency statute after 1991. Accordingly, a caveat of this analysis is that it relies on a small number of treatments. Mindful of this caveat, we can build on this analysis to conduct an instrumental variable (IV) estimation. The regression in column (1) of Appendix Table I is the first stage in which we instrument the KLD-index with the treatment. In the second stage, provided in columns (2) and (3), we find that the (instrumented) KLD-index leads to a significant increase in innovation. In columns (4) and (5), we further report the OLS regressions (i.e., the regressions using the non-instrumented KLD-index). As is shown, the OLS coefficients are smaller than the IV coefficients. Accordingly, not accounting for the potential endogeneity of the KLD-index may lead to an understatement of the effect of the KLD-index on innovation.

22
constituency statutes. Not surprisingly, we find no such evidence. While the absence of qualitative
evidence helps mitigate reverse causality concerns, it does not provide rigorous empirical evidence.
Therefore, we perform additional empirical analyses to further examine the potential (reverse) effect of
innovation on the constituency statutes. Specifically, we examine the dynamics of the treatment effect. If
our results are driven by reverse causation, the constituency statutes should have a positive and significant
“effect” already before they had been enacted. Nevertheless, when we look at the dynamic effect of the
treatment, we find no evidence for such pre-existing trends (see Section 4.2).
Political economy of the constituency statutes. A related concern is that changes in local
economic conditions may be driving both the introduction of constituency statutes and increases in
innovation. For example, suppose a state’s economy is booming. Politicians may seize this opportunity to
introduce a constituency statute (e.g., because companies are less likely to oppose regulations in good
times). At the same time, the favorable economic conditions may be conducive to innovation.
Nevertheless, this concern is minimized for two reasons. First, as discussed in the methodology
section, the lack of congruence between states of location and states of incorporation allows us to include
state (of location) by year fixed effects in all regressions. These fixed effects account for any state trend
that may confound our results.
Second, in robustness checks, we show that we obtain similar results if we use a matching
approach (see Section 4.5). Specifically, we match each treated firm to a control firm on the basis of
several observable characteristics, and further require that each control firm be located in the same state
as the treated firm (while being incorporated in a different state). Thus, by construction, treated and
matched control firms face virtually identical local economic conditions.
Unobserved differences between treated and control firms. Another potential concern is that
treated and control firms may differ along unobservable characteristics that may affect both innovation
and the treatment. Nevertheless, this concern is unlikely to explain our results, for the following reasons.
First, as discussed above, we find no evidence of pre-existing trends. This implies that treated and
control firms are on similar trends prior to the treatment. Second, due to the staggered introduction of the

23
constituency statutes, the eventually treated firms are first in the control group, and only later in the
treatment group (i.e., once they have been treated). Accordingly, we can re-estimate our difference-in-
differences specification using only the eventually treated firms―in this case, the control group consists
exclusively of firms that are eventually treated (for a similar test, see Bertrand and Mullainathan 2003).
When we do so, we find that our results are robust (see Section 4.5).
Other laws. Finally, the enactment of constituency statutes may coincide with the enactment of
other state-level legislations that may also affect innovation. In this case, our results could be spurious,
merely capturing the effect of other laws. In particular, our sample period witnessed the enactment of
state-level antitakeover laws (e.g., Atanassov 2013, Sapra et al. 2013) and bank deregulation laws (e.g.,
Amore et al. 2013, Chava et al. 2013), which have been shown to affect innovation. While it is unclear
how such contemporaneous laws would bias our results—for example, the findings of Atanassov (2013)
point toward a negative relationship between antitakeover laws and innovation—we show in robustness
checks that our results are unchanged if we exclude the confounded states from our analysis (see Section
4.5).
4. Results
4.1. Summary Statistics
Table 2 provides descriptive statistics for the variables used in this paper, as well as the corresponding
correlation matrix. The first two rows contain the main dependent variables—i.e., log(1 + patents) and
log(1 + citations/patents).16 As shown, there is a large positive correlation between the two, suggesting
that firms that generate more patents also receive more citations per patent. Interestingly, the correlation
between the KLD-index and both measures of innovation is positive (the correlation with the number of
patents is 28%, and the correlation with the number of citations per patent is 18%). These correlations are
suggestive of Hypothesis 1, according to which stakeholder orientation fosters innovation. In columns (4)
16 The average number of patents per firm is 3.9, and the average number of citations per patent is 60.9.
24
and (5) of Appendix Table I, we further document that these correlations are robust to the inclusion of the
various controls and fixed effects used in our baseline specification.
4.2. Main Results
The main results are presented in Table 3. All regressions are variants of the difference-in-differences
specification in equation (1). In columns (1) to (3), the dependent variable is log(1 + patents)―referred to
as Patents in the table. The specification in column (1) includes the treatment dummy (Constituency
Statute), year, firm, and state (of location) by year fixed effects. In column (2), we further include control
variables.17 As shown, the coefficient on the constituency statute dummy is remarkably stable across both
specifications. It lies between 0.064 and 0.068, which implies that the number of patents increases by
6.4% to 6.8% following the enactment of constituency statutes. In columns (4) and (5), we repeat the
same analysis using as dependent variable log(1 + citations/patents)―referred to as Citations in the table.
The results mirror those we obtain for the number of patents. Specifically, we find that the number of
citations per patent increases by 6.3% to 6.9%. These findings are in line with Hypothesis 1, indicating
that stakeholder orientation leads to an increase in innovation.
In columns (3) and (6), we assess the dynamics of the treatment effect. To do so, we replace the
treatment dummy with a set of four dummy variables indicating the year prior to the treatment
(Constituency Statute (–1)), the year of the treatment (Constituency Statute (0)), the first year after the
treatment (Constituency Statute (1)), and two or more years after the treatment (Constituency Statute
(2+)). As shown, for both measures of innovation, the coefficient of Constituency Statute (–1) is small
and insignificant. This finding is reassuring, as it shows that there is no pre-existing trend in the data.
Interestingly, we find no effect in the year of the treatment either―the coefficient of Constituency Statute
(0) is insignificant. In fact, as shown by the positive and statistically significant coefficient of
Constituency Statute (1), it is only one year after the enactment year that the effect becomes large and
significant. This suggests that it takes about 12 to 24 months for the increase in stakeholder orientation to
17 The coefficients of the control variables are reported in Appendix Table II.
25
translate into higher innovative output, which is consistent with the innovation lag found in previous
studies (e.g., Acharya et al. 2013, Amore et al. 2013, Pakes and Schankerman 1984). Finally, the
coefficient of Constituency Statute (2+) remains large and significant, which indicates that stakeholder
orientation has a long-lasting effect on innovation.
In Figures 1 and 2, we illustrate the dynamics of the treatment effect by plotting the evolution of
Patents and Citations in the treatment (solid line) and control group (dashed line) four years before and
after the treatment. As can be seen, innovation is trending upward in both the control and treatment
groups. This underscores the importance of using a control group—not accounting for changes in
innovation at the control group would overstate the effect of constituency statutes on innovation, as it
would capture some of the time trend. Overall, the patterns in both figures mirror the patterns in columns
(3) and (6) of Table 3. In particular, there is no pre-existing trend, the effect comes with a lag of 12 to 24
months, and it is somewhat persistent in the longer run.
4.3. Mechanisms
The central tenet of our theory is that stakeholder orientation increases innovation by 1) fostering a secure
work environment that is conducive to experimentation, and 2) enhancing the satisfaction of the firm’s
stakeholders. We empirically assess these mechanisms in Table 4.
To the extent that greater job security leads to more experimentation, we expect to see more tail
innovations (i.e., more hits and flops), more original innovations, and more general innovations. As is
shown in column (1), the number of hits and flops increases significantly following the treatment.
Similarly, in column (2), we document a significant increase in originality. Finally, in column (3), we
observe an increase in generality, albeit not significant. Overall, these results are consistent with the job
security argument formulated in Hypothesis 2a.
Besides providing a safer work environment, stakeholder orientation may also improve the
satisfaction of various stakeholders, which in turn could positively influence innovative activity. First, we
examine the role of employee satisfaction. Scholars have long attributed creativity and engagement in
26
innovative tasks to employees’ job satisfaction (e.g., Aiken and Hage 1971, Amabile et al. 1996, Oldham
and Cummings 1996). Accordingly, to the extent that stakeholder orientation increases employee
satisfaction, we expect to observe an increase in employees’ innovative productivity. We examine this
hypothesis in columns (4) and (5). As can be seen, we find that both productivity measures―the number
of patents per employee and the number of citations per employee, respectively―increase significantly
after the treatment. These findings lend support to Hypothesis 2b.
Next, we examine the role of customer satisfaction as a potential explanation for the positive
impact of stakeholder orientation on innovation. We examine this mechanism in columns (6) and (7) by
including an interaction term between the treatment dummy and a dummy variable indicating whether the
company operates in the B2C sector. In line with Hypothesis 2c, we find that the treatment effect is
significantly larger for companies in the B2C sector.
Finally, we examine whether stakeholder orientation fosters innovation by attending to the natural
environment and thus improving the satisfaction of stakeholders concerned about environmental issues.
We examine this mechanism in columns (8) and (9) by including an interaction term between the
constituency statute dummy and a dummy variable indicating whether the company operates in a high-
polluting industry. Consistent with Hypothesis 2d, we find that the treatment effect is significantly larger
for companies operating in high-polluting industries.18
4.4. Firm Performance
The results presented so far indicate that stakeholder orientation has a positive impact on innovation—an
activity that is often considered value-enhancing (e.g., Hall et al. 2005) and hence in shareholders’ best
interests. Accordingly, a natural question is why companies do not implement stakeholder-friendly
policies on their own, i.e. even absent a constituency statute?
18 The analysis of the consumer and environment mechanisms in columns (6)-(9) is conducted by interacting the treatment dummy with cross-sectional characteristics (B2C industries and high-polluting industries, respectively). A caveat of this approach is that we do not have exogenous variation in the cross-sectional characteristics of interest, i.e. they may correlate with other variables. Accordingly, albeit informative, these results are merely suggestive and do not necessarily warrant a causal interpretation.
27
In the theory section, we argued that becoming stakeholder-friendly presents an inherent temporal
tradeoff—it may benefit companies in the long run, while hurting profits in the short run. As a result,
short-term market pressure may prevent companies from becoming more stakeholder-oriented in the first
place. To examine this hypothesis, we re-estimate our baseline specification using measures of financial
performance as dependent variables. The results are presented in Table 5.
In columns (1) and (2), the dependent variable is the return on assets (ROA). As can be seen in
column (1), we observe a positive (albeit insignificant) increase in ROA following the enactment of
constituency statutes. In column (2), we examine the dynamics of the effect on ROA. We find that ROA
decreases in the short run. It is only after three years that the effect becomes positive and significant. This
pattern illustrates the temporal tradeoff faced by managers in becoming more stakeholder-oriented, and
lends support to Hypothesis 3.
In columns (3) and (4), we repeat the previous analysis using Tobin’s Q as dependent variable.
The overall pattern is similar, except that Tobin’s Q does not react in the short run (the coefficients are
small and highly insignificant). Unlike ROA―which measures realized operating performance―Tobin’s
Q is a forward-looking measure (i.e., it accounts for all future cash flows of the company). Accordingly,
the small economic magnitude of the short-run coefficients suggests that shareholders do not fully realize
the future gains from stakeholder orientation. This is in line with prior research showing that the stock
market tends to undervalue corporate investments in long-term projects such as innovation (e.g., Froot et
al. 1992, Hall and Hall 1993).
To further shed light on this temporal tradeoff, we assess the moderating role of shareholders’
temporal orientation. Not all shareholders have a short-term horizon. In particular, it is often argued that
institutional investors have a longer horizon.19 Consistent with this argument, Aghion et al. (2013) and
Bushee (1998) document a positive relationship between institutional ownership and innovation. To the
extent that companies with higher institutional ownership face less short-term pressure (already prior to
19 Institutional investors are less focused on short-term financial performance as they are better informed and hence better able to infer the company’s long-term fundamental value (e.g., Aghion et al. 2013, Bushee 1998).
28
the enactment of constituency statutes), we expect these companies to benefit less from the constituency
statutes. To examine the potential role of shareholders’ temporal orientation, we re-estimate our baseline
specification interacting the treatment dummy with a dummy variable indicating whether the company’s
institutional ownership is above the median across all companies in the year prior to the treatment (“high
institutional ownership”). Institutional ownership is computed as the percentage of shares owned by
institutional investors using data from Thomson-Reuters institutional holdings database. As shown in
Table 6, we find that the treatment effect is indeed weaker for companies with higher institutional
ownership.20 This weaker effect suggests that stakeholder orientation and institutional ownership might
act as substitutes in attenuating shareholders’ short-term pressure.
4.5. Robustness
This section presents various robustness checks and extensions of our baseline analysis. The underlying
specification is the one used in columns (2) and (5) of Table 3, unless otherwise specified.
Eventually treated companies. A potential concern is that unobserved differences between
treated and control firms may affect our results. To address this concern, we re-estimate our baseline
specification for the subsample of eventually treated firms (for a similar robustness check, see Bertrand
and Mullainathan 2003). The results are presented in columns (1) and (2) of Appendix Table III. Despite
the smaller sample size (59,898 firm-year observations), our estimates of the treatment effect remain
similar, which indicates that our findings are not driven by unobserved differences between firms
incorporated in treated and control states.
Matching. Another way to address the possibility that treated and control firms may differ along
unobservable characteristics is to use a matching approach―i.e, construct a sample of matched control
firms that are as similar as possible to the treated firms ex ante. We follow very closely the matching
algorithm described in Flammer (2014b). First, for each treated firm, we only consider companies that are
20 A caveat of this analysis is that institutional ownership is potentially endogenous with respect to innovation. Hence, the results provided in Table 6 are suggestive and do not necessarily warrant a causal interpretation.

29
located in the same state (but incorporated in non-treated states). Among the pool of candidates, we select
the nearest neighbor on the basis of the following firm-level characteristics: size, age, market-to-book,
ROA, leverage, cash holdings, and R&D expenses, all computed as average in the five years preceding
the enactment of the constituency statute. The nearest neighbor is the firm with the lowest Mahalanobis
distance to the treated firm across these seven matching characteristics.21 For each treated firm and each
matched control firm, we compute the average of log(1 + patents) in the five years following the
treatment, and the corresponding average in the five years preceding the treatment. We compute Δ Patents
as the difference between the two (Δ Citations is computed analogously). We then regress this difference
on the treatment dummy. The results are provided in columns (3) and (4) of Appendix Table III. As can
be seen, the treatment effect is similar to before.
Excluding Delaware. An important feature of the U.S. corporate landscape is that more than half
of U.S. public companies are incorporated in Delaware (see, e.g., Bebchuk and Cohen 2003, p. 389).
Because Delaware has not introduced a constituency statute, Delaware-incorporated firms are in the
control group. Accordingly, if Delaware companies are becoming less innovative over time, our results
could be spurious, merely reflecting a Delaware effect. To address this concern, we re-estimate our
baseline specification excluding Delaware firms. The results are presented in columns (5) and (6) of
Appendix Table III. As is shown, excluding Delaware has little impact on our results.
Alternative time period. As can be seen from Table 1, the majority of the constituency statutes
were passed between 1984 and 1990 (27 out of 34 states). Since our sample period ranges from 1976 to
2006, we have more “after” years than “before” years. To see whether this imbalance affects our results,
we re-estimate our baseline specification by truncating the sample in 1995. As shown in columns (7) and
(8) of Appendix Table III, doing so is immaterial for our results.
Confounding effects. Another potential concern is that the increase in innovation in the post-
treatment period may be due to confounding factors. In particular, it could be that treated and control
21 Formally, the Mahalanobis distance δ between treated firm i and candidate firm j is given by δ = [(Xi – Xj)’ Σ
-1 (Xi – Xj)]
½, where X is a (7 × 1) vector containing the seven matching variables and Σ is the (7 × 7) covariance matrix of these seven variables. For further details about this matching procedure, see Flammer (2014b).

30
firms are on different industry trends; that the enactment of constituency statutes coincides with the
passage of other state-level laws; or that differences in corporate governance are driving our results. As
can be seen in Appendix Table IV, our results are unchanged if we include 2-digit SIC industry by year
fixed effects (columns (1) and (2)); if we exclude companies incorporated in states that have passed
antitakeover laws or bank deregulation laws (columns (3) and (4)); or if we account for governance by
including the G-index of Gompers et al. (2003) as additional control (columns (5) and (6)).22
Citation-weighted patents. In column (1) of Appendix Table V, we re-estimate our baseline
specification using citation-weighted patent counts in lieu of patent counts (e.g., Trajtenberg 1990). The
citation weights account for the fact that patents can vary greatly in their importance. As can be seen, the
treatment effect is similar to before.
Models for count variables. Since the number of patents is a count variable, we can re-estimate
our baseline specification using count data models (instead of OLS). In columns (2) and (3) of Appendix
Table V, we use a Poisson and Negative Binomial regression, respectively. As can be seen, our results are
robust to using count data models.
Serial correlation. In our main specification, we account for serial correlation of the error term
by clustering standard errors at the state of incorporation level. In Appendix Table VI, we consider
alternative methods to account for serial correlation. These methods are described in Bertrand, Duflo, and
Mullainathan (2004).
The first method is parametric. We assume that the error term follows an AR(1) process and
estimate the first-order autocorrelation coefficient by regressing the residuals from our baseline
regressions on their lagged values. We then form an estimate of the covariance matrix of the residuals and
re-estimate our baseline specification using Generalized Least Squares (GLS). As can be seen from
columns (1) and (2), our results are robust to using this method.
22 The list of antitakeover laws (business combination laws) is obtained from Bertrand and Mullainathan (2003, p. 1048). The list of bank deregulation laws is obtained from Amore et al. (2013, p. 838). The G-index is obtained from RiskMetrics. It is available for the years 1990, 1993, 1995, 1998, 2000, 2002, 2004, and 2006. To fill in the missing years, we use the latest available value of the index. Since the G-index is not available prior to 1990, the sample period used in columns (5) and (6) is restricted to 1990-2006.
31
The second method is block bootstrapping. The difference to standard bootstrapping is that
instead of drawing single observations, we draw entire groups (“blocks”) of observations. The idea, which
is similar to clustering, is to preserve the existing correlation structure within each block while using the
independence across blocks to consistently estimate standard errors. In analogy to our clustering
approach, we construct blocks at the state of incorporation level. Specifically, we construct 200 bootstrap
samples by drawing with replacement states of incorporation. For each bootstrap sample, we estimate our
baseline specification and store the coefficients. The standard errors are then calculated based on the
empirical distribution of these 200 sets of coefficients. As shown in columns (3) and (4), the significance
levels are very similar to those we obtained in our baseline regressions.
The third method is to collapse the data into two periods, before and after the treatment, and run
an OLS regression on this two-period panel. Due to the staggered enactment of the constituency statutes,
“before” and “after” are not the same for each treated state. In addition, for control states, “before” and
“after” are not well defined. To address these issues, we use the two-step procedure proposed by
Bertrand, Duflo, and Mullainathan (2004, “residual collapsing”). In the first step, we regress patents (and
citations, respectively) on fixed effects and covariates, except for the treatment dummy. For treated
companies only, we store the residuals and compute the average residuals for the pre- and post-treatment
periods. This provides us with a two-period panel, where the first period is before the treatment and the
second period is after the treatment. In the second step, we regress the average residuals on the
constituency statute dummy, and use White standard errors to correct for heteroskedasticity. As can be
seen from columns (7) and (8), our results are robust to using this method.
5. Discussion and Conclusion
How can companies spark innovation? This question has received considerable attention in the literature.
Yet very little is known about the role of stakeholder orientation. Motivated by this research gap, this
study examines whether and how attending to the company’s non-financial stakeholders affects
innovative activity within the firm.
32
To examine the impact of stakeholder orientation on innovation, we exploit a quasi-natural
experiment provided by the enactment of constituency statutes in 34 states between 19842006. These
statutes encourage corporate directors to consider non-shareholder interests when making business
decisions, and hence provide exogenous variation in the way public U.S. corporations cater to
stakeholders. Using a difference-in-differences methodology, we find that the introduction of
constituency statutes leads to a significant increase in innovation. Specifically, we find that firms
incorporated in states that have enacted constituency statutes generate more patents and receive more
citations per patent than firms incorporated in states that have not enacted such statutes. These findings
are consistent with the view that stakeholder orientation fosters innovation.
We further examine the mechanisms through which stakeholder orientation fosters innovation. In
particular, we argue that stakeholder orientation sparks innovation by 1) promoting a secure work
environment that is conducive to experimentation, and 2) enhancing the satisfaction of various
stakeholders such as employees and customers. Consistent with the first argument, we find that the
enactment of constituency statutes leads to more innovations in the tails of the distribution (i.e., more hits
but also more failures) as well as more original and, to a lesser extent, more general innovations. As for
the second argument, we document an increase in innovative productivity (i.e., patents per employee and
citations per employee) following the adoption of constituency statutes. Moreover, our results show that
the positive impact of stakeholder orientation on innovation is larger for firms in consumer-focused
industries (i.e., B2C sector), and firms in less eco-friendly industries with greater stakeholder
dissatisfaction (i.e., high-polluting industries).
Lastly, we argue and provide evidence suggesting that stakeholder orientation benefits companies
in the long run, but hurts short-term profits. Accordingly, managers face a temporal tradeoff when
deciding upon stakeholder-friendly policies. Without a legal tool such as a constituency statute, short-
term market pressure may prevent shareholder-oriented companies from becoming more stakeholder-
friendly (and hence more innovative) in the first place.
33
To the best of our knowledge, this study is the first to examine whether stakeholder orientation
plays a role in fostering innovation. Our study relates to the large body of literature on corporate
governance which focuses on how shareholders can provide appropriate incentives to overcome agency
problems and limit managers’ discretion to pursue ends other than shareholder value. In particular, the
papers closest to our study are Atanassov (2013) and Sapra et al. (2013) who examine the relationship
between corporate governance and innovation. While our study also examines how companies can
encourage innovation, it offers a fundamentally distinct perspective and contribution: We hypothesize and
show evidence that innovation increases as a function of corporate attention to multiple non-shareholding
groups, including employees, customers, and the environment. Our findings suggest that by shifting
firms’ focus away from shareholder primacy toward a more stakeholder-friendly view relieves managers,
employees, and consumers from myopic behavior and helps spark innovation.
Our study also contributes to the vibrant body of work examining the impact of various types of
legislations on innovation. In addition to the studies on the effect of antitakeover legislation on innovation
(Atanassov 2013, Sapra et al. 2013), prior research has examined the effect of bank deregulation laws
(Amore et al. 2013, Chava et al. 2013, Cornaggia et al. 2014), bankruptcy laws (Acharya and
Subramanian 2009, Cerqueiro et al. 2014), and wrongful discharge laws (Acharya et al. 2013). In this
paper, we complement this line of research by studying the effect of constituency statutes on innovation.
Finally, our study contributes to the literature on the attention to stakeholders and performance
outcomes. In particular, a growing literature focuses on the link between corporate social performance
(CSP) and corporate financial performance (CFP) (e.g., Flammer 2013, 2014a, Margolis and Walsh 2003,
Walsh et al. 2003). In their meta-analysis, Margolis et al. (2007) report that, in general, this literature
points toward a positive relationship between CSP and CFP. Yet, the value-creating mechanisms behind
CSP and CFP remain largely unexplored. Studies in this vein emphasize the role of CSP investments in
generating high financial performance, e.g., by providing insurance against unexpected crises (Schnietz
and Epstein 2005), or by establishing a unique customer base (Sen and Bhattacharya 2001). Given that
innovative capabilities contribute to firms’ competitive advantage and market leadership (e.g., Baumol
34
2002, Porter 1990, Schumpeter 1942), our study implies a novel mechanism behind the positive
relationship between stakeholder orientation and financial performanceinnovation.
A caveat of our study is that it is difficult to provide direct evidence on the causal mechanisms
through which stakeholder orientation improves firms’ innovativeness. In auxiliary analyses, we provide
evidence that is indicative of potential mechanisms, yet the evidence is merely suggestive as the
underlying mechanisms are difficult to disentangle. For instance, in terms of a stronger employee
orientation, what specific actions should firms undertake—should they, e.g., provide child care,
encourage employees to participate in corporate decision making, improve the physical work
environment? As this example illustrates, providing conclusive evidence on the underlying mechanisms is
a challenging task that requires detailed micro data on the companies’ operations and processes. Making
ground on these mechanisms is a promising avenue for future research.
Lastly, our findings have potentially important policy and welfare implications. Encouraging
innovation and therefore economic growth requires designing and implementing effective policies. The
results of our study suggest that the enactment of constituency statutes is an effective tool to spark
innovation and enhance the welfare of companies’ (shareholding and non-shareholding) stakeholders.
Understanding and comparing the overall effect of constituency statutes relative to other policies (e.g.,
stronger patent rights, wrongful discharge laws, non-compete clauses, etc.) available to legislators to
promote innovation is an important question that merits further inquiry.
References
Acharya VV, Baghai RP, Subramanian KV (2013) Wrongful discharge laws and innovation. Rev. Financial Stud, forthcoming.
Acharya VV, Subramanian KV (2009) Bankruptcy codes and innovation. Rev. Financial Stud. 22(12): 4949–4988.
Aghion P, Howitt P (1992) A model of growth through creative destruction. Econometrica 60(2):323–352.
Aghion P, Tirole J (1994) The management of innovation. Quart. J. Econom. 109(4):1185–1209.
Aghion P, Van Reenen J, Zingales L (2013) Innovation and institutional ownership. Amer. Econom. Rev. 103(1):277–304.
35
Aiken M, Hage J. (1971) The organic organization and innovation. Sociology 5(1):63–82.
Albinger HS, Freeman SJ (2000) Corporate social performance and attractiveness as an employer to different job seeking populations. J. Bus. Ethics 28(3):243–253.
Amabile TM, Conti R, Coon H, Lazenby J, Herron M (1996) Assessing the work environment for creativity. Acad. Management J. 39(5):1154–1184.
Amore MD, Schneider C, Zaldokas A (2013) Credit supply and corporate innovation. J. Financial Econom. 109(3):835–855.
Atanassov J. (2013) Do hostile takeovers stifle innovation? Evidence from antitakeover legislation and corporate patenting. J. Finance 68(3):1097–1131.
Azoulay P, Graff Zivin JS, Manso G (2011) Incentives and creativity: evidence from the academic life sciences. RAND J. Econom. 42(3):527–554.
Bainbridge SM (1992) Interpreting nonshareholder constituency statutes. Pepperdine Law Rev. 19(3):971–1025.
Balkin DB, Markman GD, Gomez-Mejia LR (2000) Is CEO pay in high-technology firms related to innovation? Acad. Management J. 43(6):1118–1129.
Bansal P, Roth K (2000) Why companies go green: A model of ecological responsiveness. Acad. Management J. 43(4):717–736.
Barney JB, Hansen MH. 1994. Trustworthiness as a source of competitive advantage. Strategic Management J. 15(S1):175–190.
Barzuza M (2009) The state of state antitakeover law. Virginia Law Rev. 95(8):1973–2052.
Baumol WJ (2002) The Free-Market Innovation Machine (Princeton University Press, Princeton, NJ).
Baysinger BD, Kosnik RD, Turk TA (1991) Effects of board and ownership structure on corporate R&D strategy. Acad. Management J. 34(1):205–214.
Bebchuk LA, Cohen A (2003) Firm’s decisions where to incorporate. J. Law Econom. 46(2):383–425.
Berle AA Jr. (1931) Corporate powers as powers in trust. Harvard Law Rev. 44(7):1049–1074.
Bertrand M, Mullainathan S (2003) Enjoying the quiet life? Corporate governance and managerial preferences. J. Political Econom. 111(5):1043–1075.
Bertrand M, Duflo E, Mullainathan S (2004) How much should we trust differences-in-differences estimates? Quart. J. Econom. 119(1):249–275.
Bisconti A (2009) The double bottom line: can constituency statutes protect socially responsible corporations stuck in Revlon land. Loyola Los Angeles Law Rev. 42(3):765–806.
Bogers M, Afuah A, Bastian B (2010) Users as innovators: A review, critique, and future research directions. J. Management 36(4):857–875.
Brown TJ, Dacin PA (1997) The company and the product: Corporate associations and consumer product responses. J. Marketing 61(1):68–84.
Bushee BJ (1998) The influence of institutional investors on myopic R&D investment behavior. Account. Rev. 73(3):305–672.
Cerqueiro G, Hegde D, Penas MF, Seamans RC (2014) Debtor rights, credit supply, and innovation. Working paper, Tilburg Law and Economics Center, Tilburg, NL.
Chatterji AK, Fabrizio KR (2013) Using users: When does external knowledge enhance corporate product innovation? Strategic Management J. Forthcoming.
36
Chava S, Oettl A, Subramanian A, Subramanian KV (2013) Banking deregulation and innovation. J. Financial Econom. 109(3):759–774.
Cheng S, Nagar V, Rajan MV (2004) Identifying control motives in managerial ownership: evidence from antitakeover legislation. Rev. Financial Stud. 18(2):637–672.
Computer Weekly News (2013) IBM named worldwide market share leader in social software for fourth consecutive year. 9 May.
Cornaggia J, Mao Y, Tian X, Wolfe B (2014) Does Banking Competition Affect Innovation? J. Financial Econom. Forthcoming.
David P, Hitt MA, Gimeno J (2001) The influence of activism by institutional investors on R&D. Acad. Management J. 44(1):144–157.
Dodd EM Jr. (1932) For whom are corporate managers trustees? Harvard Law Rev. 45(7):1145-1163.
Ederer F, Manso G (2013) Is pay for performance detrimental to innovation? Management Sci.59(7):1496–1513.
Eisenhardt KM, Brown SL (1998) Time pacing: competing in markets that won’t stand still. Harvard Bus. Rev. 76(2):59–69.
Eisenhardt KM, Martin JA (2000) Dynamic capabilities: What are they? Strategic Management J. 21(10/11):1105–1121.
EPA (2013) 2011 Toxics Release Inventory National Analysis Overview (EPA, Washington, DC).
Flammer C (2013) Corporate social responsibility and shareholder reaction: The environmental awareness of investors. Acad. Management J. 56(3):758‒781.
Flammer C (2014a) Does corporate social responsibility lead to superior financial performance? A regression discontinuity approach. Management Sci. forthcoming.
Flammer C (2014b) Does product market competition foster corporate social responsibility? Evidence from trade liberalization. Strategic Management J. forthcoming.
Forbes (2011a) Is brand loyalty the core to Apple’s success? 27 November.
Forbes (2011b) GE’s new Ecomagination chief: Green tech innovation goes global. 3 May.
Forbes (2011c) Seventh Generation’s new CEO on why sustainability is necessary. 9 February.
Forbes (2013) Sorry CalPERS, dual class shares are a founder’s best friend, 14 May.
Fournier SM (1998) Consumers and their brands: developing relationship theory. J. Consumer Research, 24(4):343–73.
Freeman RE (1984) Strategic Management: A Stakeholder Approach (Pitman, Marshfield, MA).
Froot KA, Perold AF, Stein JC (1992) Shareholder trading practices and corporate investment horizons. J. Applied Corp. Finance 5(2):42–58.
Fueller J, Matzler K, Hoppe M (2008) Brand community members as a source of innovation. J. Prod. Innov. Management 25(6):608–619.
Gompers P, Ishii J, Metrick A (2003) Corporate governance and equity prices. Quart. J. Econom. 118(1):107–156.
Graves SB (1988) Institutional ownership and corporate R&D in the computer industry. Acad. Management J. 31(2):417–428.
GreenBiz (2010) GE’s Ecomagination challenge: A smart way to spur innovation. 5 October.
Greening DW, Turban DB (2000) Corporate social performance as a competitive advantage in attracting a quality workforce. Bus. Society 39:254–280.
37
Griliches Z (1990) Patent statistics as economic indicators: a survey. J. Econom. Literature 28(4):1661–1707.
Griliches Z, Pakes A, Hall BH (1987) The value of patents as indicators of inventive activity. Dasgupta P, Stoneman P, eds. Economic Policy and Technological Performance (Cambridge University Press, Cambridge, UK), 97–124.
Grossman GM, Helpman E (1990) Trade, innovation, and growth. Amer. Econom. Rev. 80(2):86–91.
Grossman GM, Helpman E (1994) Endogenous innovation in the theory of growth. J. Econom. Perspectives 8(1):23–44.
Hall BH, Jaffe AB, Trajtenberg M (2001) The NBER patent citations data file: lessons, insights and methodological tools. NBER working paper 8498, National Bureau of Economic Research, Cambridge, MA. Available at: http://www.nber.org/papers/w8498.
Hall BH, Jaffe AB, Trajtenberg M (2005) Market value and patent citations. RAND J. Econom. 36(1):16–38.
Hall BH, Hall RE (1993) The value and performance of U.S. corporations. Brookings Papers on Econom. Activity 1:1–34.
Hansen GS, Hill CWL (1991) Are institutional investors myopic? A time-series study of four technology-driven industries. Strategic Management J. 12(1):1–16.
Hart SL (1995) A natural-resource-based view of the firm. Acad. Management Rev. 20(4):986–1014.
Herzberg F, Mausner B, Snyderman BB (1959) The Motivation to Work (John Wiley & Sons, New York, NY).
Hill CWL, Snell SA (1988) External control, corporate strategy, and firm performance in research-intensive industries. Strategic Management J. 9(6):577–590.
Hillman AJ, Keim GD (2001) Shareholder value, stakeholder management, and social issues: what’s the bottom line? Strategic Management J. 22(2):125–139.
Holmstrom B (1989) Agency costs and innovation. J. Econom. Behavior Organ. 12(3):305–327.
Holthausen RW, Larcker DF, Sloan RG (1995) Business unit innovation and the structure of executive compensation. J. Account. Econom. 19(2–3):279–313.
Hoskisson RE, Hitt MA, Johnson RA, Grossman W (2002) Conflicting voices: the effects of institutional ownership heterogeneity and internal governance on corporate innovation strategies. Acad. Management J. 45(4):697–716.
Huselid MA (1995) The impact of human resource management practices on turnover, productivity, and corporate financial performance. Acad. Management J. 38(3):635–672.
Jones TM (1995) Instrumental stakeholder theory: a synthesis of ethics and economics. Acad. Management Rev. 20(2):404–437.
Kacperczyk AJ (2009) With greater power comes greater responsibility? Takeover protection and corporate attention to stakeholders. Strategic Management J. 30(3):261–285.
Kochhar R, David P (1996) Institutional investors and firm innovation: a test of competing hypotheses. Strategic Management J. 17(1):73–84.
Kotler P, Hessekiel D, Lee NR (2012) Good Works!: Marketing and Corporate Initiatives that Build a Better World ...and the Bottom Line (John Wiley & Sons, Hoboken, NJ).
Lerner J, Wulf J (2007) Innovation and incentives: evidence from corporate R&D. Rev. Econom. and Statist. 89(4):634–644.
38
Lev B, Petrovits C, Radhakrishnan S (2010) Is doing good good for you? How corporate charitable contributions enhance revenue growth. Strategic Management J. 31(2):182–200.
Luo X, Bhattacharya CB (2006) Corporate social responsibility, customer satisfaction, and market value. J. Marketing 70(4):1–18.
Luoma P, Goodstein J (1999) Stakeholders and corporate boards: institutional influences on board composition and structure. Acad. Management J. 42(5):553–563.
Manso G (2011) Motivating innovation. J. Finance 66(5):1823–1860.
Margolis JD, Elfenbein HA, Walsh JP (2007) Does it pay to be good? A meta-analysis and redirection of research on the relationship between corporate social and financial performance. Working paper, Harvard Business School, Boston, MA.
Margolis JD, Walsh JP (2003) Misery loves companies: rethinking social initiatives by business. Admin. Sci. Quart. 48(2):268–305.
Maslow A (1943) A theory of human motivation. Psychological Rev. 50:370–396.
Mattingly JE, Berman SL (2006) Measurement of corporate social action: discovering taxonomy in the Kinder Lydenburg Domini ratings data. Bus. Society 45(1):20–46.
McGregor D (1960) The Human Side of Enterprise (McGraw-Hill, New York, NY).
New York Times (2007) The Google way: give engineers room. 21 October.
New York Times (2012a) Our workplace: how three companies innovate. 17 March.
New York Times (2012b) New Share Class Gives Google Founders Tighter Control. 13 April.
New York Times (2013) Alibaba chastises Hong Kong exchange. 27 September.
Oldham GR, Cummings A (1996) Employee creativity: personal and contextual factors at work. Acad. Management J. 39(3):607–634.
Orts EW (1992) Beyond shareholders: interpreting corporate constituency statutes. George Washington Law Rev. 61(1):14–135.
Pakes A, Schankerman M (1984) The rate of obsolescence of patents, research gestation lags, and the private rate of return to research resources. Griliches Z, ed. R&D, Patents, and Productivity (University of Chicago Press, Chicago, IL), 73–88.
Porter M (1990) The Competitive Advantage of Nations (Free Press, New York, NY).
Porter ME, Kramer MR (2006) Strategy & society: the link between competitive advantage and corporate social responsibility. Harvard Bus. Rev. 84(12):78–92.
Porter ME, Kramer MR (2011) The big idea: creating shared value. Harvard Bus. Rev. 89(1/2):62–77.
Romano R (1993) Competition for corporate charters and the lesson of takeover statutes. Fordham Law Rev. 61(4):843–864.
Romer PM (1990) Endogenous Technological Change. J. Political Econom. 98(5):S71‒S102.
Russo MV, Fouts PA (1997) A resource-based perspective on corporate environmental performance and profitability. Acad. Management J. 40(3):534‒559.
Sapra H, Subramanian A, Subramanian KV (2013) Corporate governance and innovation: Theory and evidence. J Financial Quant. Analysis, forthcoming.
Sawhney M, Verona G, and Prandelli E (2005) Collaborating to create: the internet as a platform for customer engagement in product innovation. J. Interactive Marketing 19(4):4‒17.
Schmookler J (1962) Economic sources of inventive activity. J. Econom. History 22(1):1‒20.
39
Schmookler J (1966) Invention and Economic Growth (Harvard University Press, Cambridge, MA).
Schnietz KE, Epstein MJ (2005) Exploring the financial value of a reputation for corporate social responsibility during a crisis. Corporate Reputation Rev. 7(4):327–345.
Schumpeter JA (1942) Capitalism, Socialism, and Democracy (Harper, New York, NY).
Sen S, Bhattacharya CB (2001) Does doing good always lead to doing better? Consumer reactions to corporate social responsibility. J. Marketing Research 38(2):225–243.
Seru A (2014) Firm boundaries matter: evidence from conglomerates and R&D activity. J. Financial Econom. 111(2):381–405.
Sheridan JE (1992) Organizational culture and employee retention. Acad. Management J. 35(5):1036–1056.
Shleifer A, Summers LH (1988) Breach of trust in hostile takeovers. Auerbach AJ, ed. Corporate Takeovers: Causes and Consequences (University of Chicago Press, Chicago, IL), 33–68.
Slawinski N, Bansal P (2012) A matter of time: the temporal perspectives of organizational responses to climate change. Organ. Stud. 33(11):1537–1563.
Stein JC (1988) Takeover threats and managerial myopia. J. Political Econom. 96(1):61–80.
Stout L (2012) The Shareholder Value Myth: How Putting Shareholders First Harms Investors, Corporations, and the Public (Berrett-Koehler Publishers, San Francisco, CA).
Teece DJ (1998) Capturing value from knowledge assets: the new economy, markets for know-how, and intangible assets. California Management Rev. 40(3):55–79.
The Edge Financial Daily (2013) Global business goes social. 20 May.
Tian X, Wang T (2014) Tolerance for failure and corporate innovation. Rev. Financial Stud 27(1):211–255.
Trajtenberg M (1990) A penny for your quotes: Patent citations and the value of innovations, RAND J. of Econom. 21(1):172–187.
Turban DB, Greening DW (1996) Corporate social performance and organizational attractiveness to prospective employees. Acad. Management J. 40(3):658–672.
Vogel D (2005) The Market for Virtue: The Potential and Limits of Corporate Social Responsibility (Brookings Institution Press, Washington, DC).
von Hippel E (1976) The dominant role of users in the scientific instrument innovation process. Research Policy 5(3):212–239.
von Hippel E (1978) Successful industrial products from customer ideas. J. Marketing 42(1):39–49.
Walsh JP, Weber K, Margolis JD (2003) Social issues and management: our lost cause found. J. Management 29(6):859‒881.
Wang T, Bansal P (2012) Social responsibility in new ventures: profiting from a long-term orientation. Strategic Management J. 33(10):1135‒1153.
Williams RJ, Barrett JD (2000) Corporate philanthropy, criminal activity, and firm reputation: Is there a link? J. Business Ethics 26(4):341‒350.
Wiseman RM, Gomez-Mejia LR (1998) A behavioral agency model of managerial risk taking. Acad. Management Rev. 23(1):133–153.
Zahra SA (1996) Governance, ownership, and corporate entrepreneurship: the moderating impact of industry technological opportunities. Acad. Management J. 39(6):1713–1735.
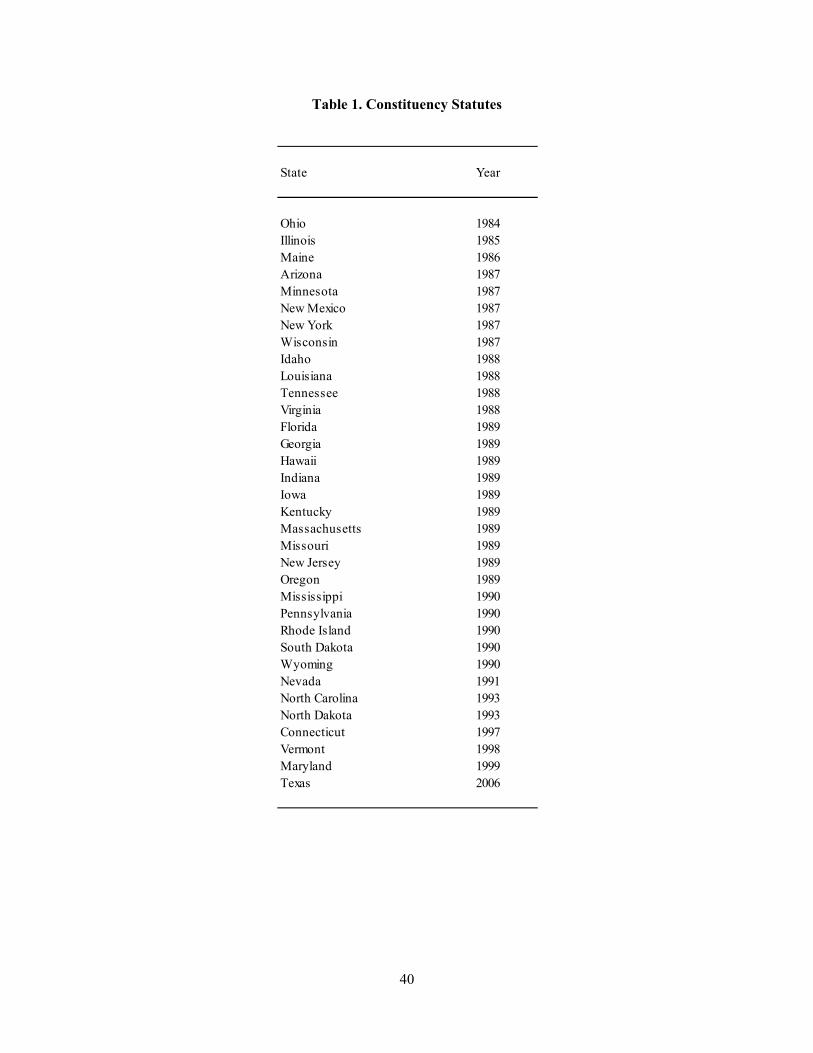
40
Table 1. Constituency Statutes
State Year
Ohio 1984Illinois 1985Maine 1986Arizona 1987Minnesota 1987New Mexico 1987New York 1987Wisconsin 1987Idaho 1988Louisiana 1988Tennessee 1988Virginia 1988Florida 1989Georgia 1989Hawaii 1989Indiana 1989Iowa 1989Kentucky 1989Massachusetts 1989Missouri 1989New Jersey 1989Oregon 1989Mississippi 1990Pennsylvania 1990Rhode Island 1990South Dakota 1990Wyoming 1990Nevada 1991North Carolina 1993North Dakota 1993Connecticut 1997Vermont 1998Maryland 1999Texas 2006

41
Table 2. Descriptive Statistics and Correlation Matrix
Variable Mean Median SD Min Max 1 2 3 4 5 6 7 8 9 10 11 12 13 14 15 16 17 18
1 Patents (log) 0.32 0.00 0.87 0.00 8.38
2 Citations (log) 0.40 0.00 0.98 0.00 5.84 0.75
3 Size (log) 4.58 4.52 2.47 -6.91 14.22 0.26 0.13
4 Age (log) 2.46 2.48 0.77 0.69 4.04 0.21 0.12 0.41
5 Tobinʼs Q 2.33 1.25 3.75 0.52 30.11 0.00 0.01 -0.39 -0.18
6 Return on assets 0.04 0.09 0.20 -0.55 0.28 0.11 0.09 0.43 0.25 -0.42
7 Leverage 0.26 0.20 0.28 0.00 1.89 -0.07 -0.09 -0.08 0.04 0.20 -0.15
8 Cash holdings 0.16 0.07 0.21 0.00 0.92 0.03 0.06 -0.27 -0.23 0.28 -0.32 -0.28
9 R&D 0.04 0.00 0.10 0.00 0.68 0.12 0.14 -0.27 -0.14 0.35 -0.48 -0.02 0.37
10 Patents/emp. (log) 0.29 0.00 0.80 0.00 8.29 0.63 0.67 -0.03 -0.03 0.11 -0.11 -0.11 0.24 0.31
11 Citations/emp. (log) 0.38 0.00 1.13 0.00 10.54 0.41 0.80 -0.08 -0.07 0.08 -0.07 -0.10 0.19 0.24 0.82
12 Hits and flops 0.07 0.00 0.22 0.00 1.00 0.59 0.78 0.10 0.10 0.00 0.06 -0.07 0.06 0.12 0.55 0.63
13 Originality 0.09 0.00 0.23 0.00 1.00 0.70 0.75 0.15 0.15 0.01 0.05 -0.08 0.08 0.16 0.66 0.59 0.61
14 Generality 0.08 0.00 0.22 0.00 1.00 0.69 0.85 0.13 0.15 -0.01 0.09 -0.07 0.02 0.10 0.59 0.65 0.64 0.74
15 KLD-index 1.37 1.00 1.93 0.00 19.00 0.28 0.18 0.45 0.27 0.03 0.12 0.06 -0.08 -0.01 0.13 0.03 0.15 0.18 0.19
16 G-index 9.08 9.00 2.75 1.00 18.00 0.07 0.05 0.15 0.30 -0.10 0.03 0.05 -0.19 -0.09 -0.05 -0.07 0.03 0.08 0.07 0.02
17 Institutional ownership 0.33 0.27 0.28 0.00 1.00 0.24 0.15 0.55 0.26 -0.04 0.27 -0.05 0.00 -0.04 0.05 -0.01 0.10 0.18 0.12 -0.02 0.07
18 High pollution industry 0.16 0.00 0.36 0.00 1.00 0.10 0.06 0.07 0.14 0.04 -0.04 0.03 0.05 0.12 0.09 0.04 0.07 0.10 0.08 0.09 0.04 0.05
19 B2C industry 0.54 1.00 0.50 0.00 1.00 -0.11 -0.13 0.07 -0.08 -0.03 -0.01 -0.01 -0.02 -0.09 -0.08 -0.09 -0.10 -0.10 -0.10 0.01 -0.01 -0.06 -0.04
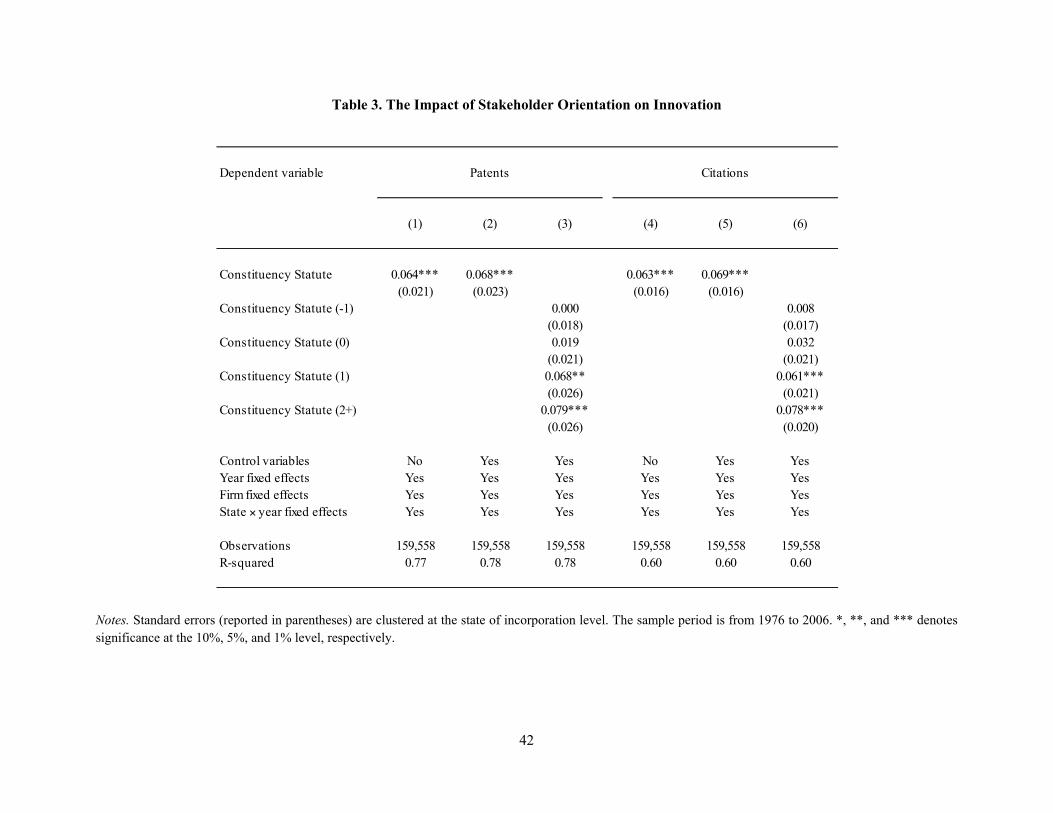
42
Table 3. The Impact of Stakeholder Orientation on Innovation
Notes. Standard errors (reported in parentheses) are clustered at the state of incorporation level. The sample period is from 1976 to 2006. *, **, and *** denotes significance at the 10%, 5%, and 1% level, respectively.
Dependent variable
(1) (2) (3) (4) (5) (6)
Constituency Statute 0.064*** 0.068*** 0.063*** 0.069***(0.021) (0.023) (0.016) (0.016)
Constituency Statute (-1) 0.000 0.008(0.018) (0.017)
Constituency Statute (0) 0.019 0.032(0.021) (0.021)
Constituency Statute (1) 0.068** 0.061***(0.026) (0.021)
Constituency Statute (2+) 0.079*** 0.078***(0.026) (0.020)
Control variables No Yes Yes No Yes YesYear fixed effects Yes Yes Yes Yes Yes YesFirm fixed effects Yes Yes Yes Yes Yes YesState × year fixed effects Yes Yes Yes Yes Yes Yes
Observations 159,558 159,558 159,558 159,558 159,558 159,558R-squared 0.77 0.78 0.78 0.60 0.60 0.60
Patents Citations
43
Table 4. Mechanisms
Notes. Standard errors (reported in parentheses) are clustered at the state of incorporation level. The sample period is from 1976 to 2006. *, **, and *** denotes significance at the 10%, 5%, and 1% level, respectively.
Dependent variable Hits and flops Originality Generality Patents/emp. Citations/emp. Patents Citations Patents Citations
(1) (2) (3) (4) (5) (6) (7) (8) (9)
Constituency Statute 0.018*** 0.014*** 0.008 0.022** 0.034** 0.046** 0.043** 0.057** 0.055***(0.004) (0.004) (0.006) (0.010) (0.016) (0.023) (0.018) (0.027) (0.019)
Constituency Statute × B2C industries 0.045* 0.049**(0.026) (0.024)
Constituency Statute × high pollution 0.061* 0.064**(0.037) (0.031)
Control variables Yes Yes Yes Yes Yes Yes Yes Yes YesYear fixed effects Yes Yes Yes Yes Yes Yes Yes Yes YesFirm fixed effects Yes Yes Yes Yes Yes Yes Yes Yes YesState × year fixed effects Yes Yes Yes Yes Yes Yes Yes Yes Yes
Observations 159,558 159,558 159,558 148,037 148,037 159,558 159,558 159,558 159,558R-squared 0.43 0.53 0.54 0.60 0.51 0.78 0.60 0.78 0.60
B2C versus B2B/G High versus low pollution
44
Table 5. Financial Performance
Notes. Standard errors (reported in parentheses) are clustered at the state of incorporation level. The sample period is from 1976 to 2006. *, **, and *** denotes significance at the 10%, 5%, and 1% level, respectively.
Dependent variable
(1) (2) (3) (4)
Constituency Statute 0.003 0.059*(0.002) (0.034)
Constituency Statute (-1) 0.002 0.010(0.005) (0.071)
Constituency Statute (0) -0.005 0.008(0.007) (0.059)
Constituency Statute (1) -0.008 0.009(0.005) (0.069)
Constituency Statute (2) 0.004 0.071(0.006) (0.054)
Constituency Statute (3+) 0.006* 0.093**(0.004) (0.045)
Control variables Yes Yes Yes YesYear fixed effects Yes Yes Yes YesFirm fixed effects Yes Yes Yes YesState × year fixed effects Yes Yes Yes Yes
Observations 159,558 159,558 159,558 159,558R-squared 0.79 0.79 0.71 0.71
ROA Tobinʼs Q
45
Table 6. Institutional Ownership
Notes. Standard errors (reported in parentheses) are clustered at the state of incorporation level. The sample period is from 1976 to 2006. *, **, and *** denotes significance at the 10%, 5%, and 1% level, respectively.
Dependent variable Patents Citations
(1) (2)
Constituency Statute 0.094*** 0.098***(0.028) (0.026)
Constituency Statute × high institutional ownership -0.061** -0.049**(0.029) (0.025)
Control variables Yes YesYear fixed effects Yes YesFirm fixed effects Yes YesState × year fixed effects Yes Yes
Observations 88,898 88,898R-squared 0.80 0.63
46
Figure 1. Evolution of Patents in Control and Treatment Groups
0.10
0.15
0.20
0.25
0.30
0.35
0.40
-4 -3 -2 -1 0 1 2 3 4
Log
(1 +
pat
ents
)
Year relative to treatment
Treatment group Control group
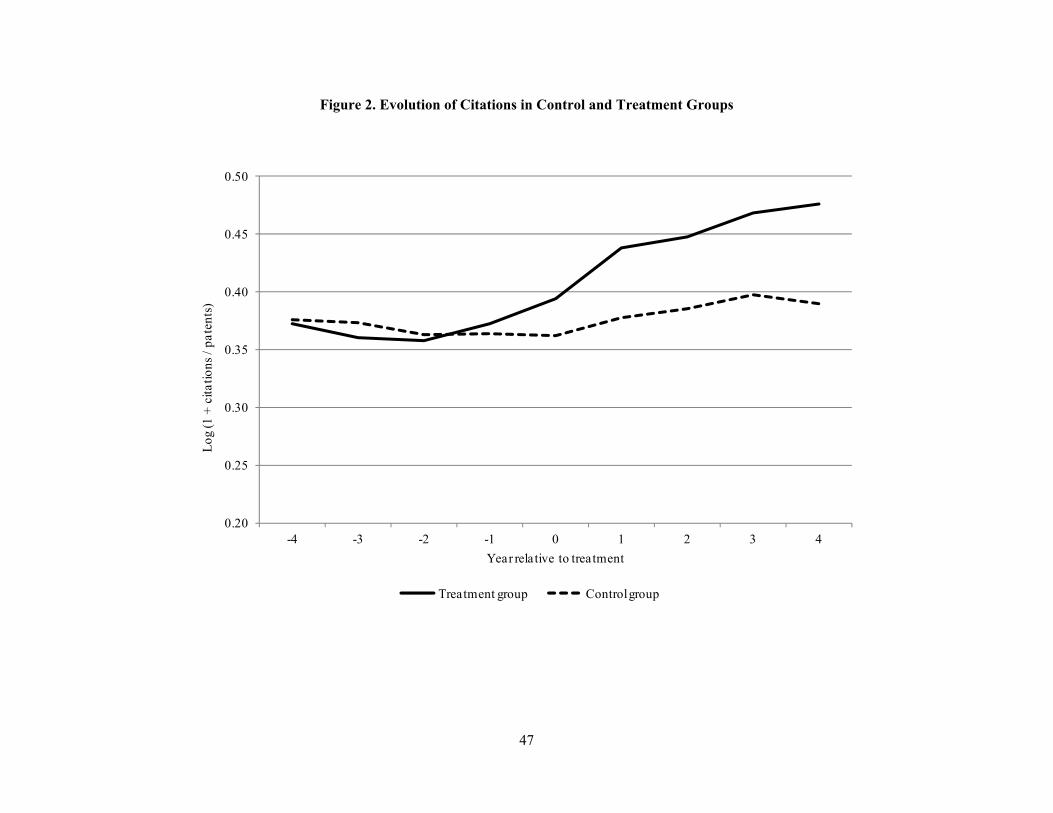
47
Figure 2. Evolution of Citations in Control and Treatment Groups
0.20
0.25
0.30
0.35
0.40
0.45
0.50
-4 -3 -2 -1 0 1 2 3 4
Log
(1 +
cita
tions
/ pa
tent
s)
Year relative to treatment
Treatment group Control group

48
Appendix Table I. KLD-Index
Notes. Standard errors (reported in parentheses) are clustered at the state of incorporation level. The sample period is from 1991 to 2006. *, **, and *** denotes significance at the 10%, 5%, and 1% level, respectively.
First stage
Dependent variable KLD-index Patents Citations Patents Citations
(1) (2) (3) (4) (5)
Constituency Statute 0.253***(0.080)
KLD (instrumented) 0.168** 0.194***(0.076) (0.073)
KLD 0.132*** 0.171***(0.035) (0.036)
Control variables Yes Yes Yes Yes YesYear fixed effects Yes Yes Yes Yes YesFirm fixed effects Yes Yes Yes Yes YesState × year fixed effects Yes Yes Yes Yes Yes
Observations 14,968 14,968 14,968 14,968 14,968R-squared 0.78 0.85 0.74 0.85 0.74
Second stage (IV) OLS

49
Appendix Table II. Control Variables
Notes. Standard errors (reported in parentheses) are clustered at the state of incorporation level. The sample period is from 1976 to 2006. *, **, and *** denotes significance at the 10%, 5%, and 1% level, respectively.
Dependent variable Patents Citations
Constituency Statute 0.068*** 0.069***(0.023) (0.016)
Size 0.071*** 0.035***(0.007) (0.005)
Age 0.081*** 0.131***(0.020) (0.013)
Market-to-book 0.011*** 0.010***(0.001) (0.001)
Return on assets -0.006 0.026**(0.005) (0.013)
Leverage -0.033* -0.021**(0.018) (0.010)
Cash 0.063*** 0.125***(0.023) (0.022)
R&D 0.176*** 0.202***(0.033) (0.048)
R&D dummy -0.021** -0.034***(0.009) (0.012)
Year fixed effects Yes YesFirm fixed effects Yes YesState × year fixed effects Yes Yes
Observations 159,558 159,558R-squared 0.78 0.60
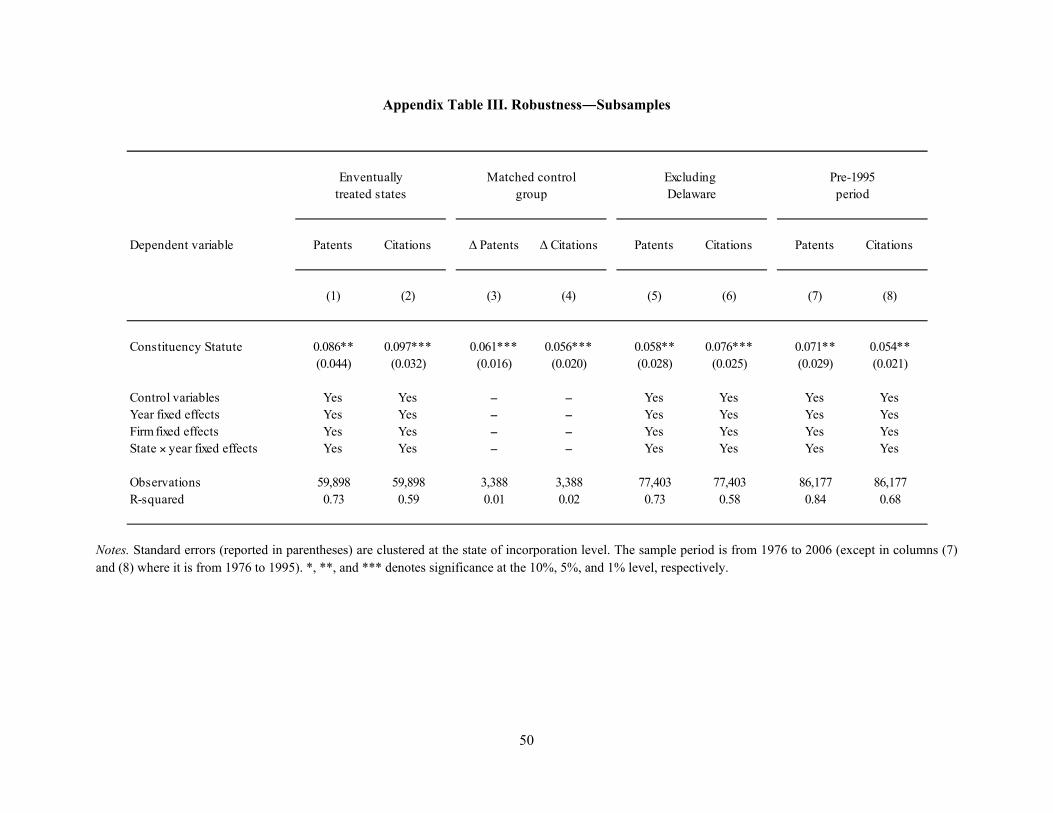
50
Appendix Table III. Robustness―Subsamples
Notes. Standard errors (reported in parentheses) are clustered at the state of incorporation level. The sample period is from 1976 to 2006 (except in columns (7) and (8) where it is from 1976 to 1995). *, **, and *** denotes significance at the 10%, 5%, and 1% level, respectively.
Dependent variable Patents Citations Δ Patents Δ Citations Patents Citations Patents Citations
(1) (2) (3) (4) (5) (6) (7) (8)
Constituency Statute 0.086** 0.097*** 0.061*** 0.056*** 0.058** 0.076*** 0.071** 0.054**(0.044) (0.032) (0.016) (0.020) (0.028) (0.025) (0.029) (0.021)
Control variables Yes Yes – – Yes Yes Yes YesYear fixed effects Yes Yes – – Yes Yes Yes YesFirm fixed effects Yes Yes – – Yes Yes Yes YesState × year fixed effects Yes Yes – – Yes Yes Yes Yes
Observations 59,898 59,898 3,388 3,388 77,403 77,403 86,177 86,177R-squared 0.73 0.59 0.01 0.02 0.73 0.58 0.84 0.68
Enventuallytreated states
Excluding Delaware
Pre-1995period
Matched controlgroup
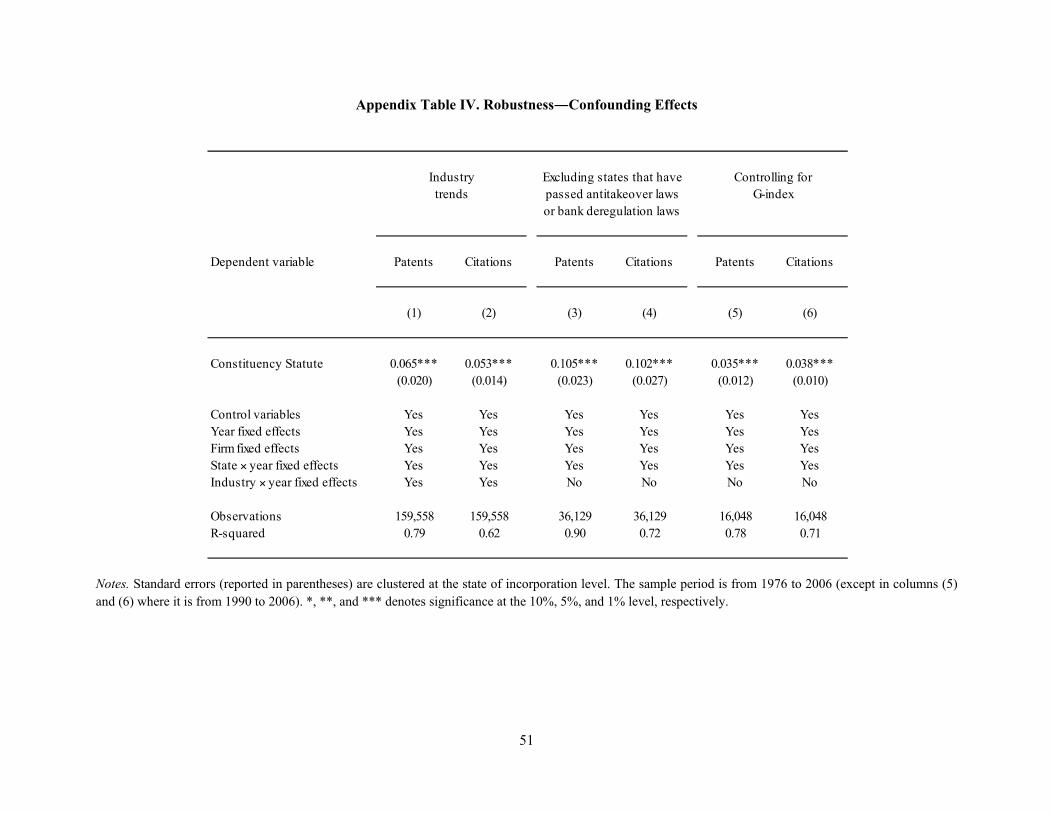
51
Appendix Table IV. Robustness―Confounding Effects
Notes. Standard errors (reported in parentheses) are clustered at the state of incorporation level. The sample period is from 1976 to 2006 (except in columns (5) and (6) where it is from 1990 to 2006). *, **, and *** denotes significance at the 10%, 5%, and 1% level, respectively.
Dependent variable Patents Citations Patents Citations Patents Citations
(1) (2) (3) (4) (5) (6)
Constituency Statute 0.065*** 0.053*** 0.105*** 0.102*** 0.035*** 0.038***(0.020) (0.014) (0.023) (0.027) (0.012) (0.010)
Control variables Yes Yes Yes Yes Yes YesYear fixed effects Yes Yes Yes Yes Yes YesFirm fixed effects Yes Yes Yes Yes Yes YesState × year fixed effects Yes Yes Yes Yes Yes YesIndustry × year fixed effects Yes Yes No No No No
Observations 159,558 159,558 36,129 36,129 16,048 16,048R-squared 0.79 0.62 0.90 0.72 0.78 0.71
or bank deregulation laws
Excluding states that have Controlling forIndustrypassed antitakeover laws G-indextrends
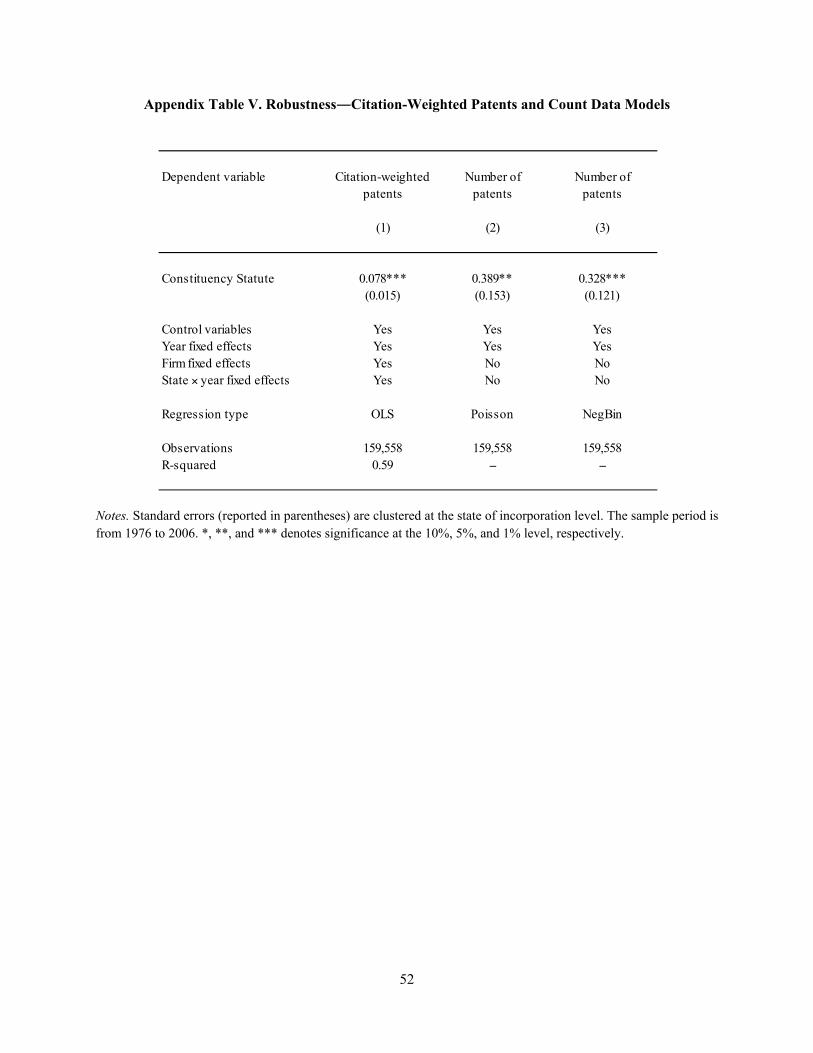
52
Appendix Table V. Robustness―Citation-Weighted Patents and Count Data Models
Notes. Standard errors (reported in parentheses) are clustered at the state of incorporation level. The sample period is from 1976 to 2006. *, **, and *** denotes significance at the 10%, 5%, and 1% level, respectively.
Dependent variable Citation-weighted Number of Number ofpatents patents patents
(1) (2) (3)
Constituency Statute 0.078*** 0.389** 0.328***(0.015) (0.153) (0.121)
Control variables Yes Yes YesYear fixed effects Yes Yes YesFirm fixed effects Yes No NoState × year fixed effects Yes No No
Regression type OLS Poisson NegBin
Observations 159,558 159,558 159,558R-squared 0.59 – –
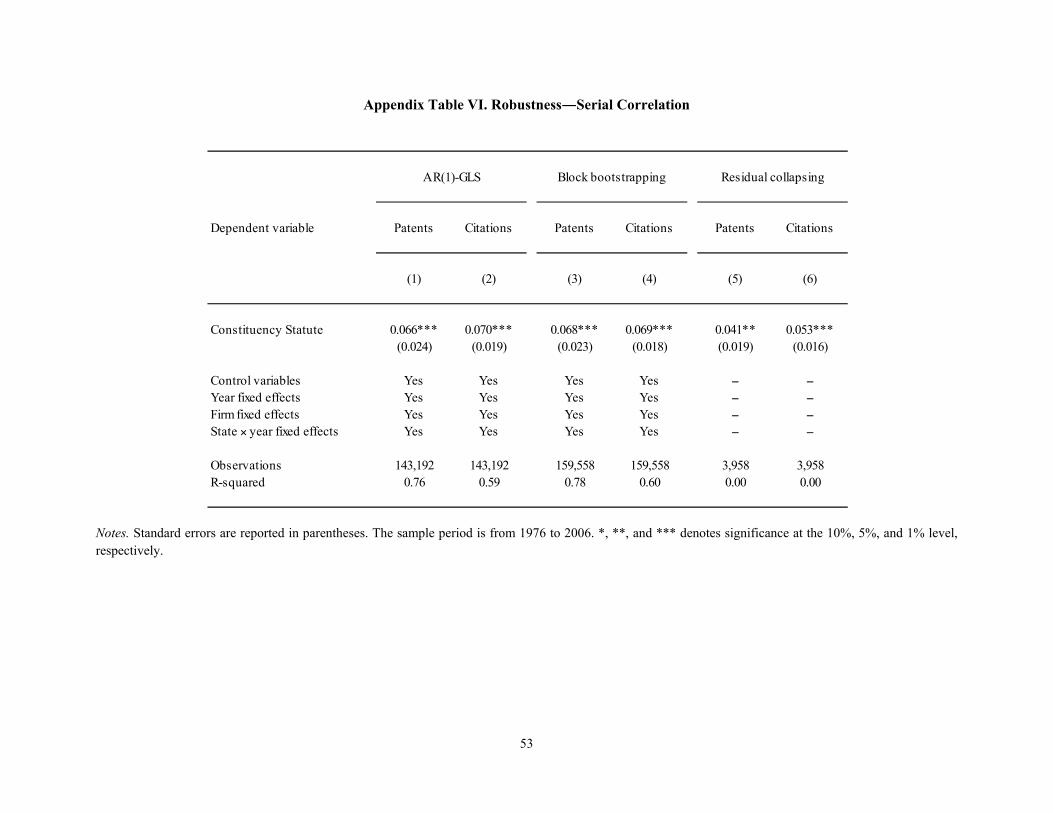
53
Appendix Table VI. Robustness―Serial Correlation
Notes. Standard errors are reported in parentheses. The sample period is from 1976 to 2006. *, **, and *** denotes significance at the 10%, 5%, and 1% level, respectively.
Dependent variable Patents Citations Patents Citations Patents Citations
(1) (2) (3) (4) (5) (6)
Constituency Statute 0.066*** 0.070*** 0.068*** 0.069*** 0.041** 0.053***(0.024) (0.019) (0.023) (0.018) (0.019) (0.016)
Control variables Yes Yes Yes Yes – –Year fixed effects Yes Yes Yes Yes – –Firm fixed effects Yes Yes Yes Yes – –State × year fixed effects Yes Yes Yes Yes – –
Observations 143,192 143,192 159,558 159,558 3,958 3,958R-squared 0.76 0.59 0.78 0.60 0.00 0.00
AR(1)-GLS Block bootstrapping Residual collapsing