the impact of social activities on cognitive …working paper no. 320 the impact of social...
TRANSCRIPT

WWOORRKKIINNGG PPAAPPEERR NNOO.. 332200
The Impact of Social Activities on Cognitive Ageing:
Evidence from Eleven European Countries
Dimitris Christelis and Loretti I. Dobrescu
September 2012
University of Naples Federico II
University of Salerno
Bocconi University, Milan
CSEF - Centre for Studies in Economics and Finance DEPARTMENT OF ECONOMICS – UNIVERSITY OF NAPLES
80126 NAPLES - ITALY Tel. and fax +39 081 675372 – e-mail: [email protected]


WWOORRKKIINNGG PPAAPPEERR NNOO.. 332200
The Impact of Social Activities on Cognitive Ageing:
Evidence from Eleven European Countries
Dimitris Christelis* and Loretti I. Dobrescu **
Abstract Using micro data from eleven European countries, we investigate the impact of being socially active on cognition in older age. Cognitive abilities are measured through scores on numeracy, fluency and recall tests. We address the endogeneity of social activities through panel data and instrumental variable methods. We find that social activities have an important positive effect on cognition, with the results varying by gender. Fluency is positively affected only in females, while numeracy only in males. Finally, recall is affected in both sexes. We also show that social activities, through their effect on cognition, influence positively households’ economic welfare. JEL Classification: I10, J14, C23 Keywords: Cognition, Social Activities, Ageing, SHARE, Panel Data. Acknowledgments: We would like to thank Denise Doiron, Denzil Fiebig and Anna Sanz-de-Galdeano for helpful comments. Christelis acknowledges financial support from the School of Economics and the Centre of Excellence in Population Ageing Research at the University of New South Wales. The SHARE data collection has been primarily funded by the European Commission through the 5th framework programme (project QLK6-CT-2001-00360 in the thematic programme Quality of Life). Further support by the European Commission through the 6th framework programme (projects SHARE-I3, RII-CT-2006-062193, as an Integrated Infrastructure Initiative, COMPARE, CIT5-CT-2005-028857, as a project in Priority 7, Citizens and Governance in a Knowledge Based Society, and SHARE-LIFE (CIT4-CT-2006-028812)) and through the 7th framework programme (SHARE-PREP (No 211909) and SHARE-LEAP (No 227822)) is gratefully acknowledged. Substantial co-funding for add-ons such as the intensive training programme for SHARE interviewers came from the U.S. National Institute on Aging (U01 AG09740-13S2, P01 AG005842, P01 AG08291, P30 AG12815, R21 AG025169, Y1-AG-4553-01, IAG BSR06-11 and OGHA 04-064). All errors remain our own.
* CSEF and CFS. Address: CSEF, Dept. of Economics, University of Naples Federico II, Via Cintia, Monte S.
Angelo, I-80126 Naples (NA), Italy. E-mail address: dimitris [dot] christelis [at] gmail [dot] com
** University of New South Wales and CEPAR. Address: School of Economics, Australian School of Business, University of New South Wales, UNSW Sydney NSW 2052, Australia. E-mail address: dobrescu [at] unsw [dot] edu [dot] au


Table of contents
1. Introduction
2. Data
3. Estimation methodology and empirical results
4. Robustness checks
5. Conclusions
References


7
1. Introduction
The extent to which older individuals preserve their cognitive skills has a significant
impact on how well they age. One of the many benefits that higher cognition brings is the
increased likelihood to achieve better economic outcomes, even in older age. In fact, there is
by now a well-documented positive association between cognition and economic
performance. For instance, cognitive abilities are found to be strongly positively correlated
with financial literacy (Delavande, Rohwedder and Willis, 2008), and with wealth and risky
portfolio holdings (Smith, McArdle and Willis, 2010; Lee and Willis, 2001; McArdle, Smith
and Willis, 2009). Moreover, Banks, O’Dea and Oldfield (2010) have shown that higher
cognition enhances consumption smoothing and life-satisfaction in retirement.
Given the importance of cognitive abilities in old age, many researchers have
investigated their determinants. One of the main findings documented in the literature is the
positive association between engaging in social activities and cognitive ability. But is this
relation causal? In other words, is this positive association due to the fact that an active social
life actually causes the preservation of cognitive skills? Using panel data from eleven
European countries, we address this issue and document the considerable positive causal
impact of social activities on cognition.
The traditional focus of research on cognition and social involvement has been on
relatively objective measures of social isolation/connectedness. These include: i) participation
in activities that prominently involve social interaction, namely doing volunteer work (Beland
et al., 2005), attending an educational or training course (Katzman, 1993), going to a sports
club, taking part in activities of a religious (Wilson et al., 2002a), and political or community-
related organization (Beland et al., 2005); ii) the number of friends and relatives contacted
regularly, i.e., social network size (Crooks et al., 2008; Stevens et al., 2001; Glei et al.,

8
2005);1 iii) social or emotional support (Glei et al., 2005; Boult et al., 1994; Fratiglioni et al.,
2000; Yeh and Liu, 2003; Seeman, Lusignolo and Berkman, 2001).2
Regardless of the definition of social involvement, empirical evidence shows older
adults who are more socially active perform at higher cognitive levels (Jopp and Hertzog,
2007), experience slower decline in cognitive abilities (Bassuk, Glass and Berkman, 1999;
Zunzunegui et al., 2003; Wang et al., 2002; Fratiglioni, Paillard-Borg and Winblad, 2004;
Barnes et al., 2004; Lovden, Ghisletta and Lindenberger, 2005; Ertel, Glymour and Berkman,
2008)3, and are less likely to suffer from mental problems, like dementia (Fratiglioni et al.,
2000; Verghese et al., 2003; Karp et al., 2005; Saczynski et al., 2006).4
Several studies reported on four channels through which maintaining an active social
life may help preserve cognitive functions. First, the lack of a social network that satisfies
older individuals’ need for social contact may cause loneliness, 5 which has also been used to
predict mental problems, including depression (Prince et al., 1997). Second, by providing
meaningful social roles and a sense of purpose in old age (Berkman, 2000), social activities
could have direct neurohormonal influences on the brain, including the reduction of the stress
response (Fratiglioni et al., 2004). Third, since social activities provide the challenge of
effective communication and participation in complex interpersonal exchanges, they have
1 Crooks et al. (2008) documented that having a larger social network has a protective influence on the cognitive function of elderly women, while Stevens et al. (2001) found that social network size is linked to higher recall ability, whereas the number of social contacts is linked to better self-assessed memory capacity. 2 On one hand, Glei et al. (2005) found that voluntary social interactions may have a greater impact on cognitive function than family or intimate ties. When adjusting for frequency of contact with friends and colleagues, Boult et al. (1994) found that social support was associated with a reduced risk of developing disability up to four years later. On the other hand, Fratiglioni et al. (2000) found single persons at greater risk for dementia compared with their married counterparts. Similarly, Yeh and Liu (2003) found that better cognition was associated with marital status and perceived support from friends, while Seeman, Lusignolo and Berkman (2001) showed that emotional support at entry in their study predicted maintaining cognitive functioning at the 7.5-year follow-up. 3 Bassuk et al. (1999) found that elderly persons who had no social ties were at increased risk for cognitive decline, compared with those who had five or six social ties; this relation persisted even after controlling for ill health, activities of daily living, socioeconomic status, sex, and ethnicity. In the same vein, Zunzunegui et al. (2003) has shown that social disengagement and unsatisfying contact with children were associated with greater risks of subsequent dementia or cognitive decline. 4 Verghese et al. (2003) found that participation in cognitively stimulating leisure activities protected against the development of dementia. 5 Andersson (1992), Cutrona, Russel and Rose (1986), Jones and Moore (1986), Weiss (1989).

9
been thought to inhibit cognitive decline in the elderly (Berkman, 2000). Finally, social
activity might also require a degree of physical activity above and beyond regular exercise
and walking, which could enhance physical health (Colcombe and Kramer, 2003; Fratiglioni
et al., 2004). Moreover, an active social life may induce greater self-esteem and better self-
care practices, i.e., regular exercise and smoking abstention (Hurst, 1997).
The empirical approaches used in these studies, however, cannot handle the problem
of the correlation of social activities with unobservables that also affect cognition. Such
unobservables might be both time-invariant (e.g. personality traits) and time-varying (e.g.
health problems), and their presence will most likely bias the estimate of the effect of social
activities on cognition. Unless this issue is addressed, one cannot be sure that the strong
observed association between cognition and social activities is due to the causal impact of the
latter on the former. One way to deal with this problem is to use panel data and instrumental
variable (IV) methods.
In our study, we use the first two waves of the Survey of Health, Ageing and
Retirement in Europe (SHARE) and employ both these methods to control for the
endogeneity between social activities and cognition. As a result, we are able to demonstrate
the positive causal impact of the former on the latter. We examine several indicators of
cognition, namely immediate and delayed recall capacity, as well as numeracy and fluency.
In addition, we are able to retrieve from our micro data information on a number of social
activities, including volunteering, participation in a political organization or a social club, and
attendance of an educational course. Our results confirm that social activities indeed have a
strong positive impact on cognition, with the results differing between the two sexes. In the
case of females, social activities have a positive effect on fluency and recall, whereas for
males social activities have a strong positive impact on recall and numeracy.

10
There are two other studies that are related to ours. Hu et al. (2012) use cross-
sectional data from the China Health and Retirement Longitudinal Study and find a positive
association between social activities and cognition (especially with respect to short-term
memory) for the Chinese elderly. They also try to address the issue of the endogeneity of
social activities by using IV methods, but their instruments are not related strongly enough to
their measures of social activities. Engelhardt et al. (2010) use the first wave of SHARE and a
stochastic frontier approach in order to show the positive association between social activities
and cognition. Compared to those studies, our use of panel data and IVs that are strongly
related to the potentially endogenous social activities variables allows us to firmly establish
the causal impact of social activities on cognition.
The structure of the paper is as follows: Section 2 describes the data. Our estimation
methodology and baseline results are presented in Section 3. Several robustness checks are
performed in Section 4. Section 5 concludes.
2. Data
We use data from the first two waves of SHARE, which took place in 2004-5 and 2006-
7 in eleven European countries (Sweden, Denmark, Germany, the Netherlands, Belgium,
France, Switzerland, Austria, Italy, Spain and Greece).6 SHARE surveys those aged fifty and
above and collects data on demographics, physical and mental health (including the
administration of tests like grip strength), cognition, social activities, housing, employment,
income, housing, assets and expectations.7
There are two questions in SHARE that convey information on the social activities that
the respondents engaged in the last month. The first one asks about the type of social activity
6 The second wave took place also in the Czech Republic, Poland, and Ireland, but given that we need to work with the two-wave panel data we do not use the information from these countries. 7 More detailed information on waves 1 and 2 of SHARE can be found in Börsch-Supan et al. (2005), Börsch-Supan and Jürges (2005), Börsch-Supan et al. (2008).

11
carried in the last month and offers as choices voluntary or charity work, care for sick or
disabled adult or help to family, friends or neighbours, educational or training course, going
to a sport, social or other kind of club, participating in a religious organization (church,
synagogue, mosque, etc.) or in a political or community-related organization. The second one
enquires about how often the above activities are performed. There are three possible answers
to this second question, expressed as almost daily, almost every week and less often than
almost weekly.
In our study, we will use two definitions for the number of activities: i) a narrow one,
consisting of voluntary or charity work, educational or training course, going to a sport,
social or other kind of club, and participating in a political or community-related
organization; ii) a wider one that includes all seven activities. Moreover, our main
specification will include those activities that are performed either almost daily or almost
every week. In Section 4 we will check how our results are affected when we use different
definitions of social activities.
In order to get information on the respondents’ cognitive abilities we use four SHARE
questions that are meant to assess their immediate and delayed recall, numeracy and fluency.
To evaluate the recall capacity, the respondents were read a purposefully long list of
words, in order to make it difficult for anyone to recall all of them. For the immediate
memory, they were asked to recall aloud as many of the words as possible, immediately after
the interviewer finished reading them the list. For the delayed memory, they were asked to
recall the same words aloud at a later time, i.e., after 5 questions. The two corresponding
variables we use recorded the number of words respondents could recall.
For the fluency, we use a variable showing the number of animals respondents named
in one minute, excluding repetitions and proper nouns.

12
Finally, there are several questions in SHARE that provide information on numeracy.
The possible answers are shown in a card and the interviewers are instructed not to read them
out to the respondent. There are five different numeracy questions: (1) how many people out
of one thousand would be expected to get the disease if the chance of getting a disease is 10
percent;8 (2) what is the sale cost of a sofa, given the initial price and a 50 percent discount;9
(3) what is the initial price of a car if two-thirds of what it costs new is 6,000 euro;10 (4) what
is the final balance of a savings account that initially hold 2,000 euro, at 10 percent interest
after 2 years.11 The score is assigned as follows: if a person answers (1) correctly she is then
asked (3) and if she answers correctly again she is asked (4). Answering (1) correctly results
in a score of 3, answering (3) correctly but not (4) results in a score of 4, while answering (4)
correctly results in a score of 5. On the other hand, if she answers (1) incorrectly she is
directed to (2). If she answers (2) correctly she scores 2, otherwise she gets a score of 1.
There are two ways of interpreting the numeracy score. The first would be as an
indicator of the level of numeracy, while the second as the number of numeracy questions
correctly answered. The second interpretation depends on the assumption that respondents
who answered question (1) correctly would have also answered (2) correctly, as (2) is
considered to be easier than (1). In addition, this interpretation requires the assumption that
those who did not answer (1) correctly would not have answered (3) and (4) correctly either,
as the last two questions are more difficult than (1).
The first interpretation of the numeracy score is preferable, given that it rests on fewer
assumptions than the second. However, it has the disadvantage that it requires a non-linear
ordered probit (or logit) model for estimation, which has some serious limitations, as we
discuss below. On the other hand, the interpretation of the numeracy score as the number of
8 The possible answers are 100, 10, 90, 900 and other answer. 9 The possible answers are 150, 600 and other answer. 10 The possible answers are 9,000, 4,000, 8,000, 12,000, 18,000, and other answer. 11 The possible answers are 2,420, 2,020, 2,040, 2,100, 2,200, 2,400 and other answer.

13
correctly answered questions allows for the use of linear or count data models, which in turn
give estimates that are more trustworthy than those obtained from an ordered probit or logit
model. Therefore, we will use a linear model as our baseline in order to estimate the effect of
social activities on numeracy, but we will also report results from an ordered probit model as
a robustness check.
After merging the waves 1 and 2 SHARE data we ended up with a sample of 34,824
households and 54,415 individuals.12 Information on the social activities carried out, by
country as well as on our four measures of cognition can be found in Table 1. We note that
the highest score on numeracy was registered by Switzerland, with 2.75 questions answered
correctly out of 4, while the lowest score recorded in Spain (1.45 out of 4). Spain represents
the lowest extreme also in the case of both immediate and delayed recall, with respondents
managing to remember on average only 3.54 and 2.33 words out of the 10 words read to
them, respectively. The opposite was registered in Denmark, where respondents remembered
5.42 words immediately and 4.16 words after some time. In terms of fluency, Spain scored
once again the lowest number of points (14.16 words per minute), while Swedish respondents
achieved the highest score among all countries (22.63 words per minute).
With respect to our social activities-related variables of interest, we note that the
countries with the highest prevalence of often performed social activities (in the wider sense)
are Netherlands and Sweden (roughly 80% and 78%, respectively), while the lowest
prevalence can be found in Spain (22%). Netherlands registers the highest prevalence
(roughly 50%) also when we focus on the narrow definition of social activities (i.e., voluntary
or charity work, educational or training course, sport, social or other kind of club and taking
part in a political or community-related organization), but in this case the lowest number of
these activities was registered in Greece (8.6%). The largest average share of respondents
12 We use Release 2.4 of the wave 1 and 2 data.

14
taking part in a political or community-related organization or caring for a sick or disabled
adult can be found in Belgium (3.8% and 7.8%, respectively), while the lowest in Spain
(0.5% and 2.2%, respectively). Spanish are also less likely to provide help to family, friends
or neighbors (at 3.2%) and, together with Greeks, less likely to do voluntary or charity work
(at 1.3% and 1.4%, respectively). However, Greeks are more likely to participate in religious
organizations (at about 22%) and less likely to attend a sport, social or any kind of other club
(at 4.2%), which is the opposite of Danes (only 3.3% attend religious organizations, but
30.5% go to a sport or social club). Finally, following an educational or training course is
most widespread in Switzerland (7.4%) and least common in Italy (0.8%).
One can get a first idea of the association between cognitive test scores and social
activities by plotting the mean of each test score by the number of social activities performed;
we show these plots in Fig. 1.13 It is immediately obvious that the data suggest a strong
positive association between social activities and all four cognitive test scores. Interestingly,
there is some evidence that this association is nonlinear, especially with respect to numeracy,
fluency and delayed recall. As we discuss below, we will allow in our empirical
specifications for nonlinear effects of social activities on cognitive test scores.
3. Estimation methodology and empirical results
We examine the association between cognitive abilities and social activities by
estimating linear equations that correlate cognitive test scores with measures of such
activities. The estimation methods that we use include ordinary least squares (OLS), panel
linear fixed effects (FE), cross-sectional instrumental variables (IV), and panel linear fixed
effects with instrumental variables (FE-IV).
13 We use the number of narrowly defined social activities that are also often performed, and we group together individuals with three and four activities, given that there are very few who engage in four activities.

15
In all our main specifications, the outcome variables will be the four scores in the
numeracy, fluency, and immediate and delayed recall tests. For the variable denoting social
activities we will use the number of narrowly-defined activities (as described in Section 2
above) in which the respondents engage at least once a week.14 More specifically, each
outcome y of a particular cognitive test will be a linear function of a vector of covariates x
and a polynomial g in the number of social activities na, i.e.,
(1)
where i indexes individuals and t denotes time. Given the strong evidence (as seen in Fig. 1)
of a nonlinear association between the number of social activities and the cognitive scores,
we need to investigate the use of polynomials of different degrees in na. We will thus try
polynomials of up to the third degree, and we will show results from the polynomial
specification that gives the best fit, as determined by the value of the Akaike information
criterion (AIC).15
Each estimation method that we use is based on some assumptions about the
correlation of both the variable denoting social activities and of the other variables included
in the specification with the error term . We assume that is equal to the sum of a time
invariant error and a time varying error (i.e., ). Examples of time
invariant unobservables that enter in include personality traits like intellectual curiosity
14 In section 4 we will report additional results involving other cognition-related outcomes and different definitions of the number of social activities. 15 If in a particular instance a linear specification is to be preferred, then and the marginal effect (m.e.) of the number of activities on the outcome y is going to be equal to . If, on the other hand, the AIC suggests that a quadratic polynomial is preferable, then the m.e. of is going to be equal to . Finally, if a cubic polynomial is chosen, then the m.e. of is going to be equal to . Obviously, if a quadratic or a cubic specification of is chosen, then the m.e. is going to differ across the population, and thus in our results we report its weighted average (calculated using the sampling weights) across all units in our estimation sample.

16
and the ease of relating to and learning from others. On the other hand, time-varying
unobservables that enter into could include particular physical health problems, or
psychological stress.
As already noted, we include in our specifications a number of control variables.
These include age,16 gender, whether the respondents have a partner and the number of their
children (if any), education,17 respondents’ family income and their health status.18 Moreover,
we include an indicator for whether, as reported by the interviewer, there were other people
present when the respondents took the cognitive tests, given that such a presence could have
an effect on the respondents’ test score. Finally, we include country fixed effects in all
specifications in order to capture country-specific factors that might affect our outcomes.
When we use panel data methods, time invariant controls like gender, education (which does
not change in our sample of the 50+) and country fixed effects will drop out of the
estimation. In all our specifications we estimate robust standard errors clustered at the
household level in order to capture any unobservable interactions between persons living in
the same household.
We first estimated an OLS specification, which gives consistent results if no regressor
is correlated with either or . Results are shown in Panel A of Table 2, and the values of
the AIC for the various polynomial specifications can be found in Panel A1 of Table A.1 in
the Appendix. We note the strong statistical significance of the marginal effect (m.e.) of the
number of social activities in the equations of all four cognitive test scores. The m.e. in the
equation for numeracy is equal to 0.102, which implies that if one moved from engaging in
no social activities to engaging in all four of them, the numeracy score would increase by
16 We use three dummies for age that will denote being between 60 and 70, 70 and 80, and above 80, respectively, with those below 60 forming the base age group. 17 We use two dummies denoting whether respondents have any post-secondary education and whether they have finished high school without getting any further education, respectively. 18 Information on health status is captured by a dummy that is equal to one when respondents report their health to be fair or bad, and by a variable denoting the number of activities of daily living (ADLs) in which they feel limited.

17
0.408, which is about equal to 0.34 standard deviations (SDs) of the test score (the SD of the
numeracy score is about 1.2). The same change in the number of social activities would result
in an increase of 4.24 words (=4*1.154) in the fluency score, i.e., an increase of 0.59 SDs
(the SD of the fluency score is equal to 7.87). Similarly, four additional social activities
would improve the scores for immediate and delayed recall by 0.84 and 0.97 words,
respectively, which would represent 0.43 and 0.48 of the respective SDs of the two memory
scores. All in all, the OLS results indicate important associations between social activities
and all four cognitive scores.
Unfortunately, it is likely that these associations do not represent causal effects, as the
number of social activities could be very well related to unobservable personality traits
present in (e.g. intellectual curiosity). In order to take care of the correlation of social
activities (as well as of all the other regressors) with , we proceeded to estimate panel
models with fixed effects (FE). As the FE model can be estimated by using observations that
appear at least twice in the sample, and given that we have to work with the two first waves
of SHARE, only the observations from the balanced panel are included in the FE estimation.
Consequently, our estimation sample contains about 36,100 observations (as opposed to
about 56,900 observations when using OLS).
As expected, the FE results (shown in Panel B of Table 2)19 were a bit weaker than
the OLS ones. However, social activities still remained relevant for three of the four cognitive
scores (the exception being the immediate recall score). Using the same conceptual
experiment as before (i.e., changing from engaging in no social activities to engaging in four
of them), our FE results imply that these additional social activities would result in increases
of about: i) 0.11 SDs for the numeracy score; ii) 0.20 SDs for the fluency score; iii) 0.46 SDs
for the delayed recall score.
19 The AIC values of the various specifications can be found in Panel B1 of Table A.1.

18
We also performed a random effects panel estimation, in which one assumes that no
control variables (including the one denoting social activities) are correlated with . After
testing this model against the FE one using a Hausman specification test, we found that the
null of no correlation of any variable with was decisively rejected.20 As a result, the FE
specification was found preferable to the random effects one.
Having established the existence of an effect of social activities on cognition, it is
important to understand how this can affect the economic welfare of older individuals. To
this purpose, we use the results of Smith et al. (2010, henceforth SMW), who investigate the
economic effect of cognition in older age.
First, let us consider our finding that engaging in four social activities increases
numeracy by 0.11 SDs compared to having no social activities at all. In the 2006 US Health
and Retirement Study (HRS) sample used by SMW, this result implies an increase of roughly
2,150 dollars in total household wealth and about 1,100 dollars in financial wealth. 21 Second,
if we average the increase in immediate and delayed recall as SMW do, we get an increase of
0.23 SDs in the combined memory score. In the same HRS sample, this change in cognition
would boost total and financial wealth by roughly 1,900 and 1,700 dollars, respectively.
Therefore, the overall increase in total household wealth due to a higher level of social
activity would be about 4,050 dollars, while the corresponding increase in financial wealth
would be about 2,800 dollars. These figures confirm that the positive impact (via higher
cognition) that engaging in social activities has on older households’ welfare is economically
important.
20 We use the bootstrap to calculate the variance of the difference of the two estimators, as described in Cameron and Trived (2005, p. 378 and p. 718). 21 We use in our calculations the results for the financial respondent as recorded in Table 4 in SMW. When computing the effect of the change in the level of the cognition variables in SMW, we also use the results in McArdle et al. (2009). This latter study uses the exact same sample as SMW and also records the SDs of the cognition variables.

19
Having finalized the choice of the estimation method, we investigated whether our
results differed by sex, both in the OLS and the FE models. The estimates for the two
separate models are shown in Panels A2, A3, B2 and B3 of Table 2. For the OLS case, the
effect of the number of social activities is statistically significant and sizeable in all
specifications and in both sexes. In the FE case, however, the pattern of results is quite
different. First, the effect of social activities on numeracy is statistically significant only for
males, and it is by about 138% (=(0.081/0.034)-1) stronger than that of the whole sample.
Using the SMW results, this higher level of numeracy would lead to increases in total and
financial household wealth of about 5,100 dollars and 2,600 dollars, respectively.
Second, the opposite pattern is present for the fluency and immediate recall scores.
The effect of social activities on these two cognitive indicators, is relevant only for females.
In this case, results were stronger than those for the whole sample by about 3% (=(.399/.387)-
1) and 78% (=(.064/.036)-1) for fluency and immediate recall, respectively. On the other
hand, there were no major differences between the two sexes with respect to the effect of
social activities on the delayed recall score, which remained important and about equal to that
estimated from the whole sample.
All in all, the results obtained using our preferred estimation method (FE) suggest
once more that social activities have a sizeable impact on all four cognitive scores. After
splitting the sample by sex, however, we find substantial differences between males and
females on which aspects of cognition are affected by such activities.
4. Robustness checks
In this section we will discuss a number of tests that we performed in order to check the
robustness of our results. Due to space limitations we cannot show all our results, which are
available from the authors upon request.

20
First, we wanted to take into account the correlation of the social activities with the
overall error term through the time-varying error , and not just through . Thus, we
explored the use of IV methods as an alternative to FE, as they account for the correlation of
social activities with or , or with both. We chose as instruments two variables that
denote health problems in the respondent’s partner, namely the number of problems in ADLs
and in instrumental activities of daily living (IADLs).22 The reason behind this choice of
instruments is that the partner’s health problems represent exogenous shocks that hit a person
other than the respondent, and that are likely to negatively affect a respondent’s ability to
engage in social activities, but have no effect on his/her cognition. A possible objection to
using these two variables as instruments would be that they might affect the respondent’s
cognition (by negatively affecting him/her psychologically). This might in turn affect his/her
responses in the cognition tests. In order to control for this effect, we included in our
specifications an indicator denoting whether the respondent felt depressed in the last month,
but our results did not change at all. Therefore, we will present the IV results obtained
without including the depression indicator in the specification.
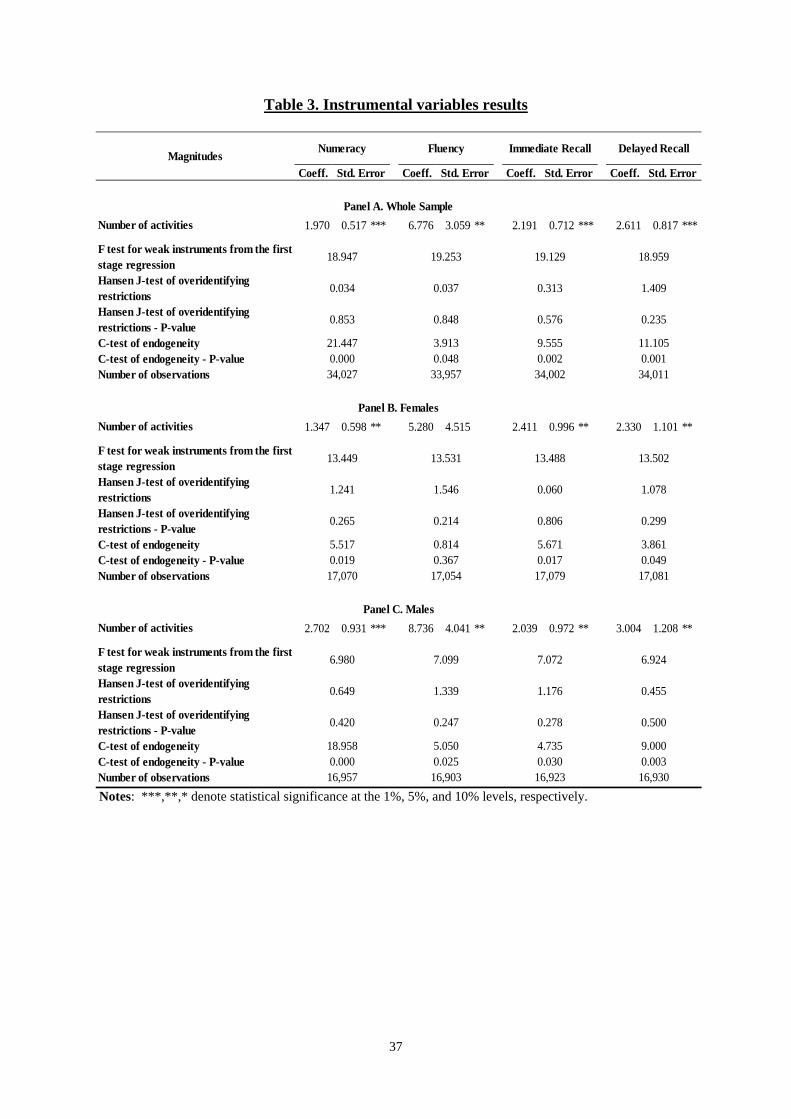
The IV results can be found in Table 3. We first note that our two instruments of
choice are very strongly correlated with the number of social activities, both in the whole
sample and for females. This can be seen from the value of the F-test of the significance of
the two instruments obtained from the first stage regression of the potentially endogenous
variable on all the control variables and our instruments. In the case of males, the value of the
F-test suggests that our instruments are weaker than desired. Furthermore, results from
Hansen’s J-test for overidentifying restrictions do not reject the null hypothesis that our two
instruments are exogenous.
22 This choice of instruments implies that we can use only couples in our estimation sample, which now contains about 34,000 observations. On the other hand, we can still use the observations that appear only once in it.

21
It is also important to check whether the use of instruments is justified, i.e. whether
the variable denoting social activities is indeed endogenous. In order to check this, we
performed a C test of the exogeneity. As can be seen from the results in Table 3, it is clear
that the null hypothesis of no endogeneity is decisively rejected.23 Therefore, the number of
activities is indeed correlated with , either through or through , or through both.
When examining the IV results it is immediately evident that they are much stronger
than both the OLS and the FE ones. In particular, the IV m.e. for numeracy is about 20 times
larger than the OLS one, while the IV results for fluency are more than 5 times stronger. In
addition, the IV results for immediate and delayed recall are about 11 times larger than their
OLS counterparts. Similar differences occur in the results for both sexes. It is a bit unusual to
obtain IV results that are so much stronger than the OLS ones. Typically IV results are
weaker, and one would expect the same to apply in our case if, for instance, there are
unobservables in that positively affect both cognition and social activities. On the other
hand, the larger IV results could be justified by an increased engagement in an unobservable
activity (e.g. reading books) that increases cognition but decreases the time one could devote
to social activities.
One could try to take care of the possible correlation of social activities with both
or by engaging in fixed effects estimation with instrumental variables (FE-IV). When we
used this method, however, we found that our instruments for cross-sectional IV (the
partner’s number of ADLs and IADLs), were no longer strongly correlated with the social
activities variable. Therefore, we added as instrument the partner’s number of social
activities, which turned out to be very strongly correlated with our potentially endogenous
23 The C test of exogeneity is a test of orthogonality conditions and is equal to the difference in the Hansen-Sargan statistic between the model in which the regressor is endogenous and the one in which it is exogenous. See Hayashi (2000, pp. 218-221, 233-234) for a description of the C test of the endogeneity of a regressor in the context of IV estimation.

22
variable. Once more, the use of this instrument rests on the assumption that the social
activities of one partner do not have any effect on the cognition of the other.
Before estimating the FE-IV specification with the additional instruments, we used
them in the cross-sectional IV model and we found that our results remained the same. When
we performed the FE-IV estimation, however, we found that the C test for the exogeneity of
social activities could not reject the null of no endogeneity. This result implies that once the
possible correlation of the social activities variable with is taken care of through the FE
estimation, there is no correlation of this variable with the time varying unobservable .
There are two important implications of the results of the C-test test in the FE-IV
model: i) the endogeneity of variable denoting the number social activities in the IV
specification is due to its correlation with , but not with ; ii) one need not use FE-IV
because FE estimation suffices for taking care of the endogeneity of social activities.
The one remaining issue is whether one should prefer IV to FE or vice versa. We opt
for FE over IV for the following reasons: i) FE controls for the correlation of all regressors
with and not just the correlation corresponding to the variable denoting social activities; ii)
the FE model does not need any instruments; iii) the FE results are much closer to the OLS
ones, and they are also smaller (as expected), while the IV ones are considerably larger.
Therefore, the FE results represent conservative estimates of the impact of social activities on
cognition.
One additional formal way to choose between FE and IV estimation is to perform a
Hausman (1978) specification test. Under the null, only the variable denoting social activities
is correlated with and the IV estimates are consistent. On the other hand, if the null is
rejected, then there are additional variables that are correlated with , and thus one needs to
perform FE estimation. The results from the Hausman test strongly reject the null; therefore,
the IV model estimates are likely inconsistent and one needs to use the FE specification.

23
Next, we experimented with a FE specification that includes not only the number of
narrowly defined social activities but also, as a separate variable, the number of the remaining
three social activities. We found that the results for the number of the narrowly defined social
activities are not affected by this change.
As already discussed, we addressed the issue of the nonlinearity of the effect of social
activities on cognition by trying polynomials up to the third degree in the number of activities
(and choosing between them using the AIC). One other way to address the same issue is to
use dummy variables denoting various numbers of activities. To that effect, we estimated a
FE specification that includes a dummy denoting one activity performed, as well as a second
dummy denoting two or more activities performed.24 Results are shown in Table 4, and we
note that they are consistent with the FE results derived from the polynomial specifications in
the number of activities (shown in Table 2). This consistency is present not only for the
whole sample, but also for the two samples split by sex. The exceptions consist of the non-
significance of the dummy denoting two or more activities in the equation for delayed recall,
and of the corresponding dummy in the equation of immediate recall for females. When we
compare, however, the values of the AIC in Table 4 to those from the polynomial
specifications (shown in Table A.1), we found that the AIC clearly denoted the latter
specifications as preferable. Therefore, we chose to use polynomials in the number of
activities in order to derive our baseline results.
We then wanted to check the robustness of our results when we include in our
specification not the total number of social activities, but rather each activity separately as a
dummy variable. Obviously, this makes our specification much more flexible. On the other
hand, there are a couple of reasons why including each activity separately might not be
advisable. First, as shown in Table 1, the vast majority of respondents do not engage in any of
24 We did not use a separate dummy for three or four activities performed because only about 0.7% of individuals in our sample engage into this many activities.

24
these activities. Hence, all of the dummy variables denoting activities will be zero for most
respondents, which makes these variables very correlated to one another. Second, some
activities could be complementary, e.g. volunteering and participating in a political
organization. In fact, about 39% of the respondents engaging in the latter activity engage also
in the former. Therefore, including each activity separately will measure the impact of one
net of the other, which will not reflect very well how these activities are actually performed
in real life. In any case, our FE results are shown in Panel A and B of Table 5, for the narrow
and wider definition of activities, respectively. For the narrowly defined activities, it seems
that taking part in a political and community-related organization has an impact on numeracy
and delayed recall. Fluency, on the other hand, is more affected by volunteering and going to
a sport or a club. For the expanded set of activities, the same results hold, but in addition
taking part in a religious organization has an impact on fluency and immediate recall. In order
to check whether including each activity separately improves the fit of our model compared
to when using just the total number of activities, we compared the AIC from both
specifications (the values of the AIC for the model with the total number of activities can be
found in Table A.1 in the Appendix). For six out of the eight total combinations of cognition
and social activities measures, we found that the specification with the total number of
activities was preferable to the one that included each activity separately. Hence, we kept the
former specification as our baseline one.
We also checked what happens when we weaken our measures of social activities. To
this purpose, we considered all social activities, even when respondents report performing
them less than once per week. We find that our results are indeed a bit weaker, especially for
the fluency and the delayed recall scores. This suggests that what the respondents report is
mirrored in our results, and thus the respondents’ answers to the questions on the frequency
of performed activities are of good quality.

25
One additional measure of cognition, used by Hu et al. (2012) involves the temporal
awareness of the respondents, as measured by whether they report correctly the date, the
month and the year in which the interview took place. To that effect, we constructed two
measures of temporal awareness: i) one that goes from zero to three, measuring the answers
to the aforementioned three questions; ii) one that adds to i) the answer to the question about
which day of the week the interview took place in. For both measures we found that both the
OLS and the FE results were statistically significant but extremely small in magnitude,
typically 30 or more times smaller than the results found for numeracy. We conclude that
there is no substantial effect of social activities on measures of temporal awareness.
As already discussed, one could also interpret the numeracy score not as the number of
correctly answered questions, but rather as an indicator of the level of numeracy of the
respondent. In this case, an appropriate statistical model to use would be an ordered probit,
and we show the results from such a model in Table 6. We report the m.e.’s of the number of
activities on the probability of reaching the five different levels of numeracy (higher levels
indicate higher numeracy). In Panel A of Table 6 we report the results from a simple cross-
sectional estimation, and we note the positive effect of the number of social activities
(narrowly defined) on the level of numeracy. For example, one more activity decreases the
probability of being at the lowest numeracy level by 1.3 pp, while it increases the probability
of reaching the highest level by 2 pp. In Panel B we report the m.e.’s from an IV estimation,
using once more the number of ADLs and IADLs of the partner as instruments. We use the
control function IV method of Rivers and Vuong (1988), in which the residuals from the first
stage regression are added as additional regressors in the main equation. As one can see in
Panel B, these residuals are strongly statistically significant, which implies that indeed the
number of activities is endogenous.25 The m.e.’s of the number of activities are, as in the
25 The same result was obtained in the linear IV model through the C test for endogeneity.

26
linear case, considerably stronger in the IV model. For example, one more social activity
increases the probability of reaching the highest level of numeracy by 45 pp. All in all, the
results from an ordered probit specification are qualitatively quite similar to those from a
linear one. This suggests that the latter is a reasonable specification to use in order to model
numeracy.
Unfortunately, it is problematic to perform a FE estimation when using the ordered
probit model because in this case the fixed effects ’s have to be estimated, unlike the case
of the linear model (in which the ’s drop out of the estimation). As a result, the ordered
probit is affected by the incidental parameters problem (Neymann and Scott, 1948), which
leads to inconsistent estimates, especially if one takes into account the fact that the length of
our panel is small (Greene, 2004). The inconsistency of the FE estimates in an ordered probit
model is the reason why we used a linear specification (as well as a couple of count data
ones, see below) to examine the effect of social activities on numeracy.
Finally, given that the number of correct answers to a cognitive test could be considered
a count variable, we experimented with Poisson and negative binomial FE specifications. In
both cases the incidental parameters problem can be circumvented, as discussed in Hausman
et al. (1984, henceforth HHG). In the Poisson case, the conditional mean of the outcome
is equal to , and the fixed effects can be conditioned out of the likelihood
function.26 Therefore, one can obtain consistent estimates of , as one does not need to
maximize the likelihood function with respect to the ’s. In order to estimate, however, the
m.e.’s of our variable of interest on the conditional mean of , we also need an estimate of
the ’s. As Cameron and Trivedi (2005, p. 805) point out, it can be shown that these
estimates are equal to . We can thus calculate the m.e.’s of the Poisson FE
26 As Cameron and Trivedi (2005, p. 803) show, one can rewrite as . Therefore, the fixed effect absorbs the constant of the linear index .

27
model, which we show in Panel A of Table 7, both for the whole sample and for the two
sexes separately. We observe that these m.e.’s are a bit smaller than, but otherwise
qualitatively very similar to, those obtained from the linear FE model.
In Panel B of Table 7 we show the m.e.’s of the number of social activities using the
negative binomial FE model of HHG. In this model the conditional mean of is equal to
, where is a parameter of the variance function of the negative binomial
distribution. As HHG show, and cannot be separately identified, and it turns out that
both drop out of the estimation. Furthermore, and in contrast to the Poisson case, one cannot
obtain estimates of from the negative binomial FE model, and thus the m.e.’s refer to the
magnitude , and not to the conditional mean . We show the m.e’s of
the negative binomial FE model in Panel B of Table 7. We immediately note that they are
much larger than the corresponding Poisson ones, both for the whole sample as well as for
the two sexes. It is quite likely that this disparity is due to the scaling problem induced by the
lack of estimates of . Therefore, and given that there is no known solution to this problem,
we will not give any further consideration to the results from the negative binomial FE
model.
There is, however, a more general issue that makes the use of both the Poisson and the
negative binomial models problematic in our context. A key assumption in both models is
that the events modelled (in our case the correct answers to each test) are independent from
each other, conditional on , (and in the negative binomial case). This assumption is
unlikely to hold in the case of answers to cognitive tests. It is easiest to consider this lack of
independence in the case of the answers to the immediate and delayed recall questions. In
both cases there is a fixed number (ten) of particular words that respondents are asked to

28
recall, and it stands to reason that they first mention the words that come to mind more easily.
They are likely, however, to find it progressively more and more difficult to come up with
the remaining words, given also the time pressure they are under (the enumeration has to take
place in one minute). This should make the distribution of the inter-arrival time of correct
answers move to the right as one comes closer to the maximum number of ten. This would be
incompatible with the Poisson and negative binomial distributions, for which the inter-arrival
time of events has a constant distribution in each sample unit. It is also likely that
enumeration is a self-reinforcing process: remembering words with relative ease at the
beginning of the enumeration process is likely to make respondents feel more confident and
thus make it easier to remember the remaining words, while the opposite is true if
respondents stumble at the beginning.27 Finally, the lack of independence between correct
answers is most obvious in the numeracy test, in which some questions are not asked at all if
one does not answer correctly a previous question. This lack of independence between
successive correct answers to the cognitive tests makes us sceptical about the applicability of
both the Poisson and the negative binomial models in our context. Hence, we opt for the
linear model as our baseline specification.
5. Conclusions
In this paper we investigated the impact of social activities on cognition later in life (as
measured by test scores for numeracy, fluency, and immediate and delayed recall), by using
representative and harmonized survey data for individuals aged fifty and above from eleven
European countries.
We found that social activities have an important effect on cognition, with results
differing by sex. Social activities increase cognitive performance in females by affecting their
27 This should also be true of the fluency questions, even if there is no maximum number of words and one is free to mention any relevant words that come to mind

29
fluency, and immediate and delayed recall. On the other hand, the improvement in males
comes with respect to numeracy and delayed recall. Importantly, we found these effects after
addressing the issue of the endogeneity of social activities through the use of panel data and
IV methods. As a result, we conclude that social activities have a positive causal impact on
cognition in older age.
Given that several studies have demonstrated that higher cognition in older age is
associated with significantly better economic outcomes, our findings suggest that having a
socially active life in older age can have an important economic impact. Therefore, pursuing
policies that target the social involvement of older people can be justified not only on medical
but also on economic grounds.

30
References
Andersson, L. (1992) ‘Loneliness and perceived responsibility and control in elderly
community residents.’ Journal of Social Behavior and Personality, 3, 431- 443.
Banks, J., O’Dea, C., Oldfield, Z. (2010) ‘Cognitive function, numeracy and retirement
saving trajectories.’ The Economic Journal, 120, 381–410.
Barnes, L.L., Mendes de Leon, C.F., Wilson, R.S., Bienias, J.L., Evans, D.A. (2004) ‘Social
resources and cognitive decline in a population of older African Americans and whites.’
Neurology, 63(12), 2322–2326.
Bassuk, S.S., Glass, T.A., Berkman, L.F. (1999) ‘Social disengagement and incident
cognitive decline in community-dwelling elderly persons.’ Annals of Internal Medicine,
131, 165–173.
Beland, F., Zunzunegui, M.V., Alvarado, B., Otero, A., del Ser, T. (2005) ‘Trajectories of
cognitive decline and social relations.’ The Journals of Gerontology Series B:
Psychological Sciences and Social Sciences, 60, 320-330.
Berkman, L.F. (2000) ‘Which influences cognitive function: Living alone or being alone?’
Lancet, 355, 1291-1292.
Boult, C., Kane, R.L., Louis, T.A., Boult, L., McCaffrey, D. (1994) ‘Chronic conditions that
lead to functional limitation in the elderly.’ Journal of Gerontology, 49, 28-36.
Börsch-Supan A., Brugiavini A., Jürges H., Mackenbach J., Siegriest J., Weber G., eds.
(2005) Health, Ageing and Retirement in Europe: first results from the Survey of
Health, Ageing and Retirement in Europe. Mannheim Research Institute for the
Economics of Aging: Mannheim.
Börsch-Supan A., Jürges H., eds. (2005) Health, Ageing and Retirement in Europe –
Methodology. Mannheim Research Institute for the Economics of Aging: Mannheim.

31
Börsch-Supan, A., Brugiavini A., Jürges H., Kapteyn A., Mackenbach J., Siegriest J., Weber
G., eds. (2008) First Results from the Survey on Health, Ageing and Retirement in
Europe (2004-2007) : Starting the Longitudinal Dimension. Mannheim: Mannheim
Research Institute for the Economics of Aging.
Cameron, A.C., Trivedi P. K. (2005). Microeconometrics: Methods and Applications.
Cambridge: Cambridge University Press.
Colcombe, S., Kramer, A. F. (2003) ‘Fitness effects on the cognitive function of older adults:
A meta-analytic study.’ Psychological Science, 14, 125–130.
Crooks, V.C., Lubben, J., Petitti, D.B., Little, D., Chiu, V. (2008) ‘Social networks, cognitive
function, and dementia incidence among elderly women.’ American Journal of Public
Health, 98, 1221–1226.
Cutrona, C.E., Russel, D.W., Rose, J. (1986) ‘Social support and adaptation to stress by the
elderly.’ Journal of Psychology and Aging, 1, 47-54.
Delavande, A., Rohwedder, S., Willis, R.J. (2008) ‘Preparation for retirement, financial
literacy and cognitive resources.’ Michigan Retirement Research Center Research
Paper No. 2008-190.
Engelhardt, H, Buber, I., Skirbekk, V., Prskawetz, A. (2010) ‘Social involvement,
behavioural risks and cognitive functioning among the aged.’ Ageing and Society,
30(5), 779-809.
Ertel, K.A., Glymour, M.M., Berkman, L.F. (2008) ‘Effects of social integration on
preserving memory function in a nationally representative US elderly population.’
American Journal of Public Health, 98(7), 1215–1220.
Fratiglioni, L., Wang, H., Ericsson, K., Maytan, M., Winblad, B. (2000) ‘Influence of social
network on occurrence of dementia: A community-based longitudinal study.’ Lancet,
355, 1315–1319.

32
Fratiglioni, L., Paillard-Borg, S., Winblad, B. (2004) ‘An active and socially integrated
lifestyle in late life might protect against dementia.’ Lancet Neurology, 3(6), 343–353.
Glei, D.A., Landau, D.A., Goldman, N., Chuang, Y-L., Rodríguez, G., Weinstein, M. (2005)
‘Participating in social activities helps preserve cognitive function.’ International
Journal of Epidemiology, 34(4), 864-8671.
Greene, W. (2004). ‘The behaviour of the maximum likelihood estimator of limited
dependent variable models in the presence of fixed effects.’ Econometrics Journal, 7,
98-119
Hausman, J. (1978). ‘Specification tests in econometrics.’ Econometrica, 46, 1251-1271.
Hausman, J. A., Hall B.H., Griliches Z. (1984), “Econometric Models For Count Data with
an Application to the Patents - R and D Relationship,” Econometrica, 52, 909–938.
Hayashi, F. (2000). Econometrics. Princeton, NJ: Princeton University Press.
House, J.S., Landis, K.R., Umberson, D. (1988) ‘Social relationships and health.’ Science,
241, 540–545.
Hu, Y., Lei, X., Smith, J.P., Zhao, Y. (2012) ‘Effects of social activities on cognitive
functions: Evidence from CHARLS.’ RAND Working Paper No. 918.
Hurst, D.F., Boswell, D.L., Boogaard, S.E., Watson, M.W. (1997) ‘The relationship of self-
esteem to the health-related behaviors of the patients of a primary care clinic.’ Archives
of Family Medicine, 6, 67-70.
Jones, W.H., Moore, T.L. (1986) ‘Loneliness and social support’ In Loneliness: Theory,
research, and applications (Edited by: Hojat H, Crandall R) Newbury Park, CA: Sage
145-157.
Jopp, D., Hertzog, C. (2007) ‘Activities, self-referent memory beliefs, and cognitive
performance: Evidence for direct and mediated relations.’ Psychology and Aging,
22(4), 811–825.

33
Karp, A., Paillard-Borg, S., Wang, H.X., Silverstein, M., Winblad, B., Fratiglioni, L. (2005)
‘Mental, physical and social components in leisure activities equally contribute to
decrease dementia risk.’ Dementia and Geriatric Cognitive Disorders, 21(2), 65–73.
Katzman, R. (1993) ‘Education and the prevalence of dementia and Alzheimer’s disease.’
Neurology, 43, 13-20.
Lee, L.A., Willis, R.J. (2001) ‘Cognition and wealth: The importance of probabilistic
thinking.’ Michigan Retirement Research Center Research Paper No. 007.
Lovden, M., Ghisletta, P., Lindenberger, U. (2005) ‘Social participation attenuates decline in
perceptual speed in old and very old age.’ Psychology and Aging, 20(3), 423–434.
McArdle, J.J., Smith, J.P., Willis, R.J. (2009) ‘Cognition and economic outcomes in the
Health and Retirement Survey.’ IZA Discussion Paper No. 4269.
Neyman, J., Scott., E. (1948). “Consistent Estimates Based on Partially Consistent
Observations.” Econometrica, 16, 1-32.
Prince, M.J., Harwood, R.H., Blizard, R.A., Thomas, A., Mann, A.H. (1997) ‘Social support
deficits, loneliness and life events as risk factors for depression in old age. The Gospel
Oak Project VI.’ Psychological Medicine, 27, 323-332.
Rivers, D., and Q. H. Vuong (1988), ‘‘Limited Information Estimators and Exogeneity Tests
for Simultaneous Probit Models.’’ Journal of Econometrics, 39, 347–366.
Saczynski, J.S., Pfeifer, L.A., Masaki, K., Korf, E.S.C., Laurin, D., White, L., Launer, L.
(2006) ‘The effect of social engagement on incident dementia. The Honolulu-Asia
Aging Study.’ American Journal of Epidemiology, 163, 433–440.
Seeman, T.E., Lusignolo, T.M., Albert, M., Berkman, L. (2001) ‘Social relationships, social
support, and patterns of cognitive aging in healthy, high-functioning older adults:
MacArthur Studies of Successful Aging.’ Health Psychology, 20, 243–255.

34
Smith, J.P., McArdle, J.J., Willis, R.J. (2010) ‘Financial decision making and cognition in a
family context.’ The Economic Journal, 120, 363–380.
Stevens, F.C.J., Kaplan, C.D., Ponds, R.W.H.M., Jolles, J. (2001) ‘The importance of active
life styles for memory performance and memory self-knowledge.’ Basic and Applied
Social Psychology, 23,137–145.
Verghese, J., Lipton, R.B., Katz, M.J. et al. (2003) ‘Leisure activities and the risk of dementia
in the elderly.’ North England Journal of Medicine, 348, 2508–2516.
Wang, H.X., Karp, A., Winblad, B., Fratiglioni, L. (2002) ‘Late-life engagement in social and
leisure activities is associated with a decreased risk of dementia: A longitudinal study
from the Kungsholmen Project.’ American Journal of Epidemiology, 155(12), 1081-
1087.
Weiss, R.S. (1986) ‘Reflections on the present state of loneliness research’ In Loneliness:
Theory, research, and applications (Edited by: Hojat M, Crandall R) Newbury Park,
CA: Sage, 116.
Wilson, R.S., Barnes, L.L., Mendes de Leon, C.F., Aggarwal, N.T., Schneider, J.S., Bach, J.,
Pilat, J., Beckett, L.A., Arnold, S.E., Evans, D.A. Bennett, D.A. (2002a) ‘Depressive
symptoms, cognitive decline, and risk of AD in older persons.’ Neurology, 59(3), 364–
370.
Yeh, S.C.J., Liu, Y.Y., (2003) ‘Influence of social support on cognitive function in the
elderly.’ BMC Health Services Research, 3(9).
Zunzunegui, M-V., Alvarado B.E., Del Ser, T., Otero, A. (2003). ‘Social networks, social
integration, and social engagement determine cognitive decline in community-dwelling
Spanish older adults.’ The Journals of Gerontology. Series B, Psychological Sciences
and Social Sciences, 58(2), 93-100.

35
Table 1. Descriptive Statistics Sweden Denmark Germany Netherlands Belgium France Switzerland Austria Italy Spain Greece All Countries
Cognitive test scoresNumber of correctly answered numeracy questions 2.58 2.51 2.58 2.58 2.31 2.11 2.75 2.64 1.84 1.45 2.31 2.19Number of words in fluency test 22.63 21.53 20.19 19.58 19.70 19.31 20.30 21.10 14.25 14.16 14.36 17.98Number of words recalled immediately 5.20 5.42 5.30 5.17 4.94 4.53 5.29 5.22 4.15 3.54 4.72 4.67Number of words recalled with a delay 3.93 4.16 3.63 3.81 3.34 3.09 3.88 3.73 2.70 2.33 3.22 3.19
Social activitiesDone voluntary or charity work 0.112 0.124 0.076 0.177 0.110 0.103 0.090 0.041 0.045 0.014 0.013 0.072Follows an educational/training course 0.066 0.039 0.020 0.044 0.066 0.025 0.074 0.019 0.008 0.018 0.017 0.024Gone to a sport, social or other kind of club 0.208 0.305 0.162 0.267 0.166 0.157 0.246 0.109 0.053 0.057 0.042 0.132Taken part in a political or community-related organization 0.020 0.019 0.010 0.016 0.038 0.020 0.025 0.025 0.009 0.005 0.013 0.013Taken part in a religious organization (including religious attendance) 0.062 0.033 0.057 0.082 0.055 0.043 0.085 0.087 0.048 0.076 0.219 0.063Cared for a sick or disabled adult 0.065 0.040 0.058 0.070 0.078 0.061 0.065 0.058 0.028 0.022 0.043 0.049Provided help to family, friends or neighbors 0.247 0.160 0.089 0.142 0.187 0.138 0.129 0.103 0.066 0.032 0.068 0.098Number of often performed activities (narrow definition) 0.407 0.487 0.267 0.504 0.380 0.305 0.436 0.195 0.116 0.094 0.086 0.240Number of often performed activities (all) 0.781 0.721 0.471 0.797 0.699 0.547 0.714 0.444 0.257 0.223 0.416 0.450
Other variablesAge 67.1 66.0 67.1 65.7 66.1 65.7 66.4 67.0 67.9 68.0 67.2 67.0Female 0.539 0.535 0.553 0.548 0.538 0.550 0.552 0.557 0.566 0.566 0.542 0.555Has a spouse/partner 0.623 0.661 0.651 0.678 0.735 0.696 0.675 0.616 0.662 0.660 0.681 0.667Number of children 2.253 2.206 1.898 2.362 2.140 2.253 2.097 1.966 2.039 2.374 1.919 2.104Post-secondary education 0.211 0.349 0.247 0.215 0.245 0.198 0.107 0.209 0.064 0.085 0.133 0.173High schoold graduate 0.266 0.411 0.552 0.229 0.255 0.291 0.458 0.481 0.195 0.075 0.226 0.323Self-reported health fair or bad 0.222 0.255 0.413 0.296 0.283 0.354 0.175 0.320 0.449 0.461 0.299 0.386Number of limitations in activities of daily living 0.205 0.193 0.245 0.165 0.222 0.224 0.106 0.209 0.269 0.306 0.173 0.241Lives in a city or in the suburbs 0.357 0.333 0.261 0.448 0.263 0.301 0.179 0.289 0.195 0.318 0.460 0.282Median household income (PPP-adjusted euros) 24,685 24,589 23,598 28,397 21,662 25,498 31,555 23,617 16,938 13,826 15,001 21,247
Number of observations 5,691 4,123 5,436 5,461 6,688 5,875 2,362 3,168 5,411 4,499 5,701 54,415
Notes: All figures denote weighted averages, unless otherwise noted. Social activities are considered to be performed only if respondents answer that they engage in them at least once a week. Narrowly defined social activities include: i) doing voluntary or charity work; ii) following an educational/training course; iii) going to a sport, social or other kind of club; iv) taking part into a political or community-related organization.

36
Table 2. The impact of often performed social activities (narrow definition) on cognitive scores, various specifications
Coeff. Coeff. Coeff. Coeff.
Number of activities 0.102 0.008 *** 1.154 0.059 *** 0.209 0.013 *** 0.243 0.016 ***R2
Number of observations
Number of activities 0.101 0.012 *** 1.301 0.077 *** 0.263 0.019 *** 0.307 0.023 ***R2
Number of observations
Number of activities 0.104 0.011 *** 0.978 0.083 *** 0.156 0.018 *** 0.166 0.020 ***R2
Number of observations
Number of activities 0.034 0.013 *** 0.387 0.139 *** 0.036 0.022 0.234 0.066 ***R2
Number of observations
Number of activities 0.011 0.018 0.399 0.114 *** 0.064 0.031 ** 0.247 0.094 ***R2
Number of observations
Number of activities 0.081 0.028 *** 0.119 0.123 0.007 0.032 0.225 0.091 **R2
Number of observations
36,11836,10435,99636,0980.0800.0800.0900.069
Immediate Recall
Std. Error
Delayed Recall
Std. Error
Panel A. OLS
Magnitudes Numeracy
Std. Error
Fluency
Std. Error
A1. Whole Sample
A2. Females
0.286 0.350 0.263 0.287
54,7970.20954,894
0.26254,907
0.10254,917
0.318
30,455
0.260 0.277 0.258 0.220
A3. Males
30,430 30,398 30,451
24,487 24,399 24,443 24,452
B1. Whole SamplePanel B. Panel Fixed Effects
B2. Females
0.064 0.085 0.118 0.08220,102 20,088 20,138 20,144
0.063 0.069 0.019 0.02715,996 15,908 15,966 15,974
B3. Males
Notes: Marginal effects of the number of activities are shown. When a nonlinear specification in the number of social activities is preferred, the standard errors of the marginal effects are obtained using the delta method. ***,**,* denote statistical significance at the 1%, 5%, and 10% levels, respectively.
37
Table 3. Instrumental variables results
Coeff. Coeff. Coeff. Coeff.
Number of activities 1.970 0.517 *** 6.776 3.059 ** 2.191 0.712 *** 2.611 0.817 ***
F test for weak instruments from the first stage regressionHansen J-test of overidentifying restrictionsHansen J-test of overidentifying restrictions - P-valueC-test of endogeneityC-test of endogeneity - P-valueNumber of observations
Number of activities 1.347 0.598 ** 5.280 4.515 2.411 0.996 ** 2.330 1.101 **
F test for weak instruments from the first stage regressionHansen J-test of overidentifying restrictionsHansen J-test of overidentifying restrictions - P-valueC-test of endogeneityC-test of endogeneity - P-valueNumber of observations
Number of activities 2.702 0.931 *** 8.736 4.041 ** 2.039 0.972 ** 3.004 1.208 **
F test for weak instruments from the first stage regressionHansen J-test of overidentifying restrictionsHansen J-test of overidentifying restrictions - P-valueC-test of endogeneityC-test of endogeneity - P-valueNumber of observations
Magnitudes Numeracy Fluency Immediate Recall Delayed Recall
Std. Error Std. Error Std. Error Std. Error
Panel A. Whole Sample
34,027 33,957 34,002 34,011
0.034
0.853
21.4470.000
18.947 19.253 19.129 18.959
16,957 16,903 16,923 16,930
6.980
17,070 17,054 17,079 17,081
Panel C. Males
1.409
0.235
11.1050.001
13.449 13.488
0.037
0.848
3.9130.048
0.313
0.576
9.5550.002
Panel B. Females
0.265
5.5170.019
13.531
1.546
0.214
0.8140.367
1.241
0.806
5.6710.017
13.502
1.078
0.299
3.8610.049
0.060
0.649
0.420
18.9580.000
7.099
1.339
0.247
5.0500.025
6.924
0.455
0.500
9.0000.003
7.072
1.176
0.278
4.7350.030
Notes: ***,**,* denote statistical significance at the 1%, 5%, and 10% levels, respectively.

38
Table 4. The impact of social activities on cognitive scores when dummies for the number of activities are used in the estimating equation, fixed effects specification
Coeff. Coeff. Coeff. Coeff.
One activity 0.041 0.018 ** 0.327 0.113 *** 0.039 0.029 0.123 0.033 ***Two or more activities 0.067 0.031 ** 0.545 0.206 *** 0.068 0.056 0.088 0.062
R2
Number of observationsAkaike Information Criterion
One activity 0.012 0.024 0.488 0.145 *** 0.076 0.039 ** 0.114 0.045 **Two or more activities 0.030 0.042 0.721 0.278 *** 0.106 0.077 0.062 0.085
R2
Number of observationsAkaike Information Criterion
One activity 0.074 0.026 *** 0.131 0.170 -0.002 0.044 0.134 0.047 ***Two or more activities 0.108 0.044 ** 0.339 0.304 0.026 0.077 0.117 0.087
R2
Number of observationsAkaike Information Criterion
Magnitudes Numeracy Fluency Immediate Recall Delayed Recall
Std. Error Std. Error Std. Error Std. Error
Panel A. Whole Sample
36,098 35,996 36,104 36,1180.070 0.090 0.080 0.080
23,563.09 81,745.80 40,507.12 42,366.9615,996 15,908 15,966 15,974
52,574.54 183,580.05 90,956.52 96,727.61
29,005.68
Panel B. Females
20,102 20,088 20,138 20,144101,813.02 50,442.28 54,314.30
0.065 0.087 0.118 0.080
0.063 0.071 0.019 0.027
Panel C. Males
Notes: We display the marginal effects (which are equal to the regression coefficients in this case) of the dummy variables denoting the number of activities on the various cognition scores. ***,**,* denote statistical significance at the 1%, 5%, and 10% levels, respectively.

39
Table 5. The impact of social activities on cognitive scores when each activity enters separately in the estimating equation, fixed effects specification
Coeff. Coeff. Coeff. Coeff.
Done voluntary or charity work 0.041 0.027 0.443 0.168 *** -0.007 0.046 0.058 0.053Taken part in a political or community-related organization 0.065 0.042 -0.185 0.300 0.029 0.089 0.148 0.092
Follows an educational/training course 0.029 0.031 0.131 0.204 0.078 0.052 0.112 0.059 *Gone to a sport, social or other kind of club 0.025 0.019 0.297 0.126 ** 0.046 0.033 0.068 0.036 *
R2
Number of observationsAkaike Information Criterion
Done voluntary or charity work 0.037 0.027 0.402 0.168 ** -0.012 0.046 0.055 0.053Taken part in a political or community-related organization 0.064 0.042 -0.198 0.300 0.027 0.089 0.147 0.092
Follows an educational/training course 0.028 0.031 0.116 0.204 0.076 0.052 0.111 0.059 *Gone to a sport, social or other kind of club 0.025 0.019 0.284 0.126 ** 0.045 0.033 0.067 0.036 *Taken part in a religious organization (including religious attendance) 0.062 0.027 ** 0.394 0.160 ** 0.123 0.048 ** 0.035 0.052
Provided help to family, friends or neighbors -0.006 0.018 0.159 0.117 -0.029 0.031 0.003 0.033Cared for a sick or disabled adult 0.032 0.026 0.249 0.157 0.018 0.045 0.015 0.050
R2
Number of observationsAkaike Information Criterion 52,525.52 183,501.65 90,918.24 96,691.36
36,084 35,982 36,090 36,104
Panel A. Often performed activities, narrow definition
Panel B. Often performed activities, all
0.063 0.089 0.075 0.080
Magnitudes Numeracy Fluency Immediate Recall Delayed Recall
Std. Error Std. Error Std. Error Std. Error
52,578.64 183,578.83 90,956.72 96,736.23
0.069 0.088 0.080 0.07836,098 35,996 36,104 36,118
Notes: We display the marginal effects (which are equal to the regression coefficients in this case) of each activity on the various cognition scores. ***,**,* denote statistical significance at the 1%, 5%, and 10% levels, respectively.

40
Table 6. Ordered probit specification for the numeracy score
Marg. Eff.
1st Level of Numeracy -0.013 0.001 ***
2nd Level of Numeracy -0.013 0.001 ***
3d Level of Numeracy -0.006 0.001 ***
4th Level of Numeracy 0.012 0.001 ***
5th Level of Numeracy 0.020 0.002 ***
Number of observations
1st Level of Numeracy -0.226 0.049 ***
2nd Level of Numeracy -0.290 0.063 ***
3d Level of Numeracy -0.173 0.038 ***
4th Level of Numeracy 0.235 0.051 ***
5th Level of Numeracy 0.454 0.098 ***
Residual from First Stage Regression -2.023 0.458 ***
Number of observations
Panel B. Cross-Sectional Estimation with IV
34,027
Panel A. Cross-Sectional Estimation without IV
54,917
MagnitudesNumber of Often
Performed Activities
Std. Error
Notes: Marginal effects of the number of activities on the probability of reaching any given level of numeracy are displayed. Standard errors of the marginal effects are obtained using the delta method. ***,**,* denote statistical significance at the 1%, 5%, and 10% levels, respectively.

41
Table 7. Results using fixed-effects Poisson and Negative Binomial Models
Marg. Eff.
Marg. Eff.
Marg. Eff.
Marg. Eff.
Number of activities 0.029 0.011 *** 0.225 0.072 *** 0.030 0.019 0.062 0.020 ***
Number of observations
Number of activities 0.008 0.014 0.321 0.093 *** 0.052 0.026 ** 0.053 0.031 *
Number of observations
Number of activities 0.052 0.016 *** 0.106 0.108 0.006 0.029 0.074 0.031 **
Number of observations
Number of activities 1.182 0.163 *** 0.693 0.080 *** 0.837 0.115 *** 1.086 0.141 ***
Number of observations
Number of activities 0.900 0.213 *** 0.806 0.106 *** 0.931 0.161 *** 0.878 0.189 ***
Number of observations
Number of activities 1.505 0.251 *** 0.502 0.110 *** 0.736 0.208 *** 1.044 0.210 ***
Number of observations
Panel A. Poisson
A2. Females
A3. Males
15,750 15,902 15,912 15,422
19,434 20,080 20,084 19,474
35,184 35,982 35,996 34,896
MagnitudesNumeracy Fluency Immediate Recall Delayed Recall
Std. Error Std. Error Std. Error Std. Error
A1. Whole Sample
Panel B. Negative Binomial
B1. Whole Sample
35,184 35,982 35,996 34,896
B2. Females
19,434 20,080 20,084 19,474
B3. Males
15,750 15,902 15,912 15,422 Notes: We display the marginal effects of the number of activities on the various cognition scores. The standard errors of the marginal effects are obtained using the delta method. ***,**,* denote statistical significance at the 1%, 5%, and 10% levels, respectively.

42
Appendix
Table A1. Values of the Akaike Information Criterion for Various OLS and FE Specifications of the Number of Social Activities
Specifications
Linear SpecificationQuadratic SpecificationCubic Specification
Linear SpecificationQuadratic SpecificationCubic Specification
Linear SpecificationQuadratic SpecificationCubic Specification
Linear SpecificationQuadratic SpecificationCubic Specification
Linear SpecificationQuadratic SpecificationCubic Specification
Linear SpecificationQuadratic SpecificationCubic Specification
66,547.52 159,772.93 90,280.46 95,704.48
A1. Whole Sample
66,548.25 159,775.84 90,279.31 95,700.8066,545.91 159,772.95 90,278.66 95,702.52
A2. Females83,702.01 196,590.04 113,137.12 121,162.33
A3. Males
23,562.94 81,745.94 40,507.26 42,369.04
B2. Females29,004.01 101,812.48 50,439.88 54,315.7829,005.91 101,812.91 50,441.82 54,317.60
23,564.94 81,746.07 40,509.14 42,367.76
29,007.89 101,814.69 50,443.39 54,311.45
B3. Males23,563.14 81,744.92 40,505.33 42,369.17
52,574.76 183,580.01 90,956.12 96,733.0252,576.75 183,581.53 90,958.10 96,724.48
Panel B. Linear Fixed Effects
B1. Whole Sample52,574.10 183,580.93 90,954.13 96,732.68
83,696.53 196,578.89 113,136.94 121,161.3283,698.53 196,580.50 113,135.60 121,155.51
150,315.55 356,436.47 203,558.48 217,033.52
150,322.90 356,452.65 203,561.86 217,037.12150,313.74 356,436.75 203,557.81 217,035.68
Panel A. OLS
Numeracy Fluency Immediate Recall
Delayed Recall
Notes: Lower values of the Akaike criterion denote a better fit. We present in bold letters the values of the criterion for the preferred specifications.
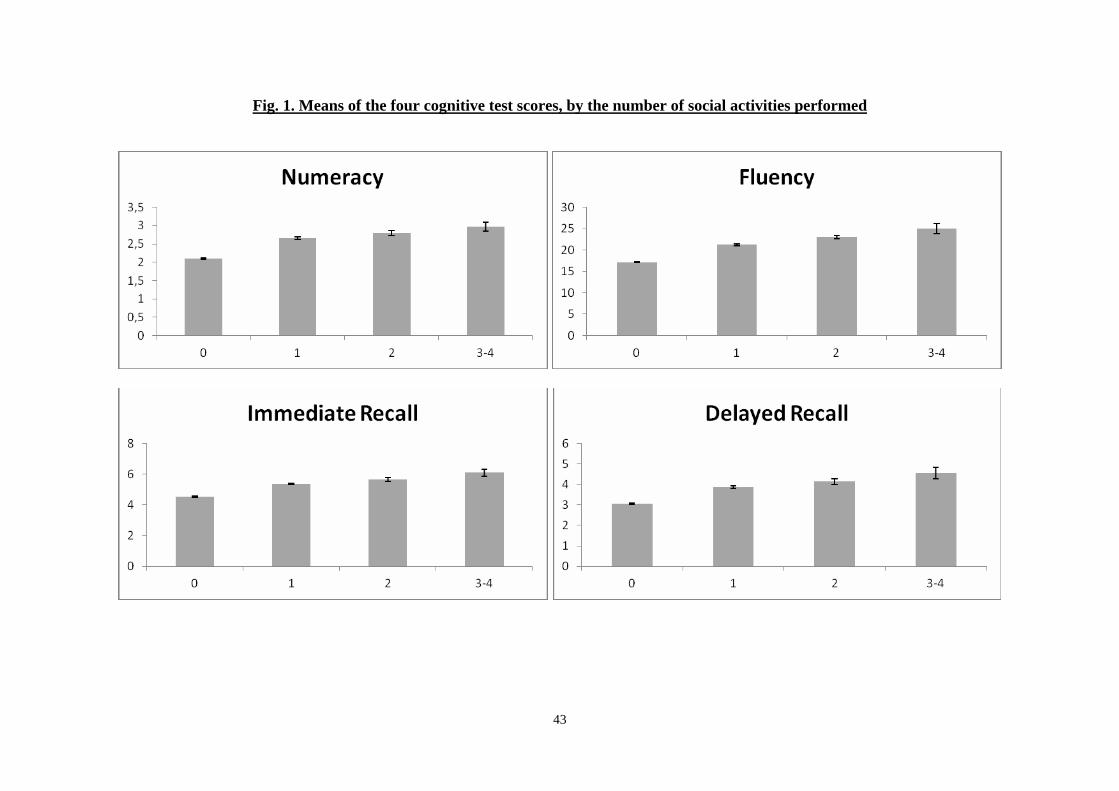
43
Fig. 1. Means of the four cognitive test scores, by the number of social activities performed