the impact of school board governance on academic
TRANSCRIPT

University of Wisconsin MilwaukeeUWM Digital Commons
Theses and Dissertations
August 2013
The Impact of School Board Governance onAcademic Achievement in Diverse StatesMichael FordUniversity of Wisconsin-Milwaukee
Follow this and additional works at: https://dc.uwm.edu/etdPart of the Other Education Commons, and the Public Affairs, Public Policy and Public
Administration Commons
This Dissertation is brought to you for free and open access by UWM Digital Commons. It has been accepted for inclusion in Theses and Dissertationsby an authorized administrator of UWM Digital Commons. For more information, please contact [email protected].
Recommended CitationFord, Michael, "The Impact of School Board Governance on Academic Achievement in Diverse States" (2013). Theses andDissertations. 329.https://dc.uwm.edu/etd/329
THE IMPACT OF SCHOOL BOARD GOVERNANCE ON ACADEMIC
ACHIEVEMENT IN DIVERSE STATES
by
Michael Ford
A Dissertation Submitted in
Partial Fulfillment of the
Requirements for the Degree of
Doctor of Philosophy
in Urban Studies
at
The University of Wisconsin-Milwaukee
August 2013

ii
ABSTRACT THE IMPACT OF SCHOOL BOARD GOVERNANCE ON ACADEMIC
ACHIEVEMENT IN DIVERSE STATES
by
Michael Ford
University of Wisconsin-Milwaukee, 2013 Under the Supervision of Professor Douglas Ihrke
The overwhelming majority of students receiving a publicly funded education in the
United States attend a public school in a district overseen by a democratically elected
school board. Despite the dominant market share of democratically elected school boards,
academic scholarship is increasingly focused on alternative governance structures such as
mayoral control, charter schools, and school vouchers. Much research on traditional
school boards is in fact skeptical of the capacity for such boards to positively impact
academic performance. This dissertation shifts focus back to the almost 14,000 elected
school boards in the United States, using original survey data from six strategically
chosen states to connect school board governance with district level academic outcomes.
The dissertation examines the connections between school board member backgrounds,
adherence to a set of best practices created by the National School Boards Association,
small group dynamics, and district graduation and dropout rates. The study finds that the
way in which school boards govern does affect district level performance. Specifically,
school boards that engage in strategic planning, view their superintendent as a
collaborator, and mitigate conflict, perform better on academic outcome indicators. The

iii
study also presents limited data on non-profit charter school boards, proposes a
theoretical model of school board governance, and reviews prior research on school
boards and performance. The overall conclusion is that traditional school boards can and
do influence academic outcomes, meaning, improving school board governance is a
legitimate approach to improving academic achievement.

iv
© Copyright by Michael Ford, 2013 All Rights Reserved

v
DEDICATION
To Ally, Charlie and John, for your support throughout this process.

vi
TABLE OF CONTENTS
Chapter I Chapter II Chapter III
The Problem of the American School Board A Brief Introduction to the School Board
History of the School Board and Literature Review Comparative Case Study Approach
Modeling School Board Governance Hypotheses and Descriptions of Data
Methodology
Conclusion and Next Steps
An Alternative View of the School Board: Role, Tasks, and Discretionary Zones The Role of School Boards
The Tasks of School Boards
School Boards and Zones of Discretion
Conclusions How School Board Governance Impacts District Performance: A Theoretical Model What is Governance?
The Importance of School Board Governance
School District Hygiene Factors
Inside the Black Box of Governance
The Role of Small Group Dynamics In School Board Governance
Conclusion
1
2
4
10
13
14
20
21
23
23
26
33
44
47
48
51
57
61
65
68

vii
Chapter IV Chapter V Chapter VI Chapter VII
Characteristics of and Comparisons Between Education Systems in Florida, Nevada, Utah, Michigan, Minnesota, and Wisconsin Group-to-Group Differences
Within State Predictors of Achievement
Other Achievement Data
Conclusion
Survey Design and Summary Results Survey Logistics
Aggregate Survey Results
Discussion and Conclusion
Connecting Board Governance to Outcomes: Testing the NSBA Key Work of School Boards Literature Review
Data
Results
Discussion and Conclusion
School Board Group Dynamics, Zones of Discretion and Academic Outcomes Literature Review
Data and Results
Discussion and Conclusion
71
72
82 86
91
94
96
98 112
116
118
119
124
130
135
136 137
153

viii
Chapter VIII Chapter IX
Characteristics of a Sample of Non-Profit Charter School Boards Background
Who Were the Survey Respondents?
What are the Governance Priorities of Survey Respondents? What are the Governance Behaviors of Survey Respondents?
Conclusion and Discussion
The Problem of the American School Board Revisited What Should School Boards Be Doing?
How Can the Connection Between Board Governance and Outcomes Be Utilized? Conclusion
157
160
161
163
166
165
167
167
170
171
References Appendix A: School Board Survey Questions and Results: Public School Board Members Only Appendix B: Survey Solicitation Letter Curriculum Vitae
173
182
203
206

ix
LIST OF FIGURES
Figure 1.1 Figure 2.1 Figure 2.2 Figure 2.3 Figure 3.1 Figure 3.2 Figure 5.1 Figure 6.1 Figure 7.1 Figure 7.2
Model Connecting School Board Governance to District Performance The Continuum of School Board Member Tasks The Continuum of School Board Tasks An Organizational Model for School Districts Key Linkages between School Boards and Student Learning (Delagardelle, 2008) Black Box Model of School Board Governance Histogram of Number of Respondents by Board Board Level Responses to School Board Governance Survey Mean Responses to Small Group Variables Does Your Board Exceed State Requirements in the Following Areas?
13
28
29
31
56
57
98
120 138
149
x
LIST OF TABLES
Table 1.1 Table 1.2 Table 2.4 Table 2.5 Table 3.1 Table 3.2 Table 4.1 Table 4.2 Table 4.3 Table 4.4 Table 4.5 Table 4.6 Table 4.7 Table 4.8 Table 4.9 Table 4.10 Table 4.11 Table 4.12 Table 4.13
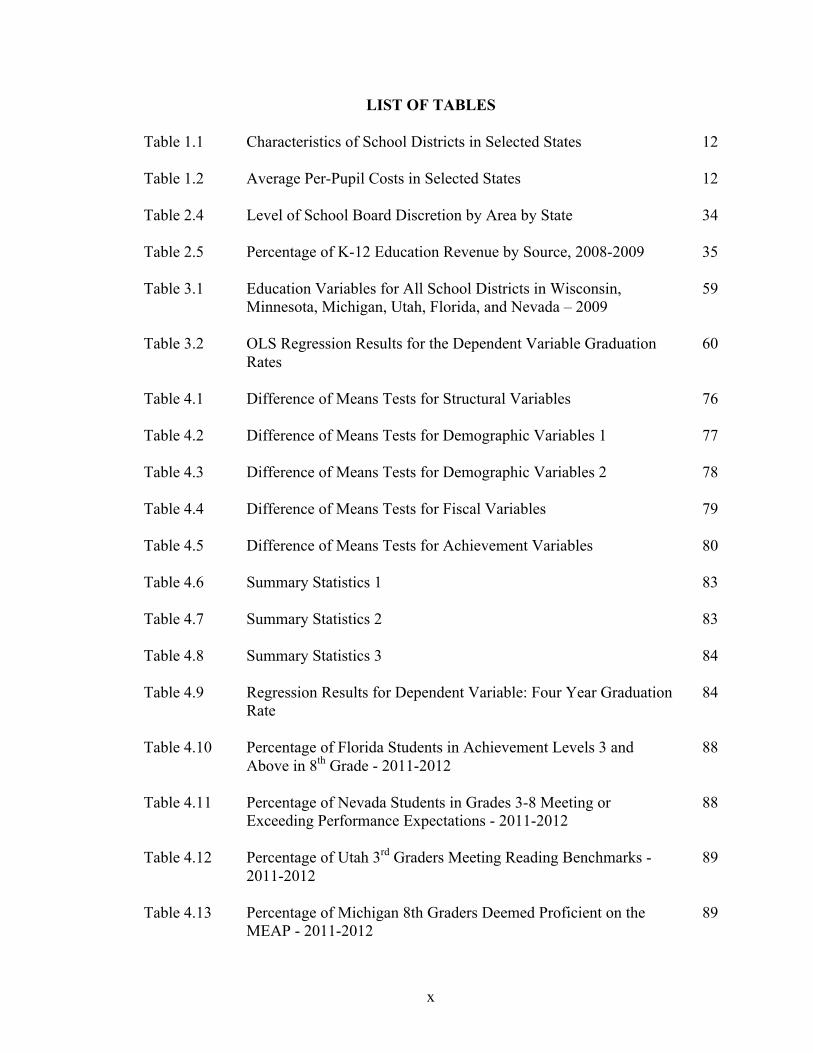
Characteristics of School Districts in Selected States Average Per-Pupil Costs in Selected States Level of School Board Discretion by Area by State Percentage of K-12 Education Revenue by Source, 2008-2009 Education Variables for All School Districts in Wisconsin, Minnesota, Michigan, Utah, Florida, and Nevada – 2009 OLS Regression Results for the Dependent Variable Graduation Rates Difference of Means Tests for Structural Variables Difference of Means Tests for Demographic Variables 1 Difference of Means Tests for Demographic Variables 2 Difference of Means Tests for Fiscal Variables Difference of Means Tests for Achievement Variables Summary Statistics 1 Summary Statistics 2 Summary Statistics 3 Regression Results for Dependent Variable: Four Year Graduation Rate Percentage of Florida Students in Achievement Levels 3 and Above in 8th Grade - 2011-2012 Percentage of Nevada Students in Grades 3-8 Meeting or Exceeding Performance Expectations - 2011-2012 Percentage of Utah 3rd Graders Meeting Reading Benchmarks - 2011-2012 Percentage of Michigan 8th Graders Deemed Proficient on the MEAP - 2011-2012
12
12
34
35
59
60
76
77
78
79
80
83
83
84
84
88
88
89
89

xi
Table 4.14 Table 4.15 Table 5.1 Table 5.2 Table 5.3 Table 5.4 Table 5.5 Table 5.6 Table 5.7 Table 5.8 Table 5.9 Table 5.10 Table 5.11 Table 5.12 Table 5.13 Table 5.14 Table 5.15 Table 5.16 Table 5.17 Table 5.18 Table 5.19
Percentage of Minnesota Students Meeting or Exceeding Expectations on the MCAs - 2011-2012 Percentage of Students Scoring Proficient or Advanced on the WKCE in 2011-2012 E-mail Addresses Mined by State Individual Response Rates for Public School Board Members Board-Level Response Rate Race of School Board Members Sex of School Board Members Mean Age of School Board Members Ideology of School Board Members Education Levels of School Board Members Have You Held Elected Office Before? Board Member Length of Service Was Your Last Election Opposed? Have You Ever Been Employed as a Teacher in Your District? Ranking Board Member Priorities from 1 - 10 Summary Statistics for Districts from all Board Member Respondents Summary Statistics for Districts from Group 1 Respondents Summary Statistics for Districts from Group 2 Respondents OLS Models Predicting High School Graduation Rates for All Board Members OLS Models Predicting High School Graduation Rates for Group One Board Members OLS Models Predicting High School Graduation Rates for Group
90
90
96
97
97
99
100
100
101
101
102
102
103
103
104
105
106
106
109
110
111

xii
Table 6.1 Table 6.2 Table 6.3 Table 6.4 Table 6.5 Table 6.6 Table 6.7 Table 6.8 Table 6.9 Table 6.10 Table 7.1 Table 7.2 Table 7.3 Table 7.4
Two Board Members Questions Linked to Key Works of School Boards Summary Statistics for Dependent Variables Significant Results for OLS Regression Models Testing Relationship Between Individual Key Works and Graduation Rates -1 Significant Results for OLS Regression Models Testing Relationship Between Individual Key Works and Graduation Rates – 2 Significant Results for OLS Regression Models Testing Relationship Between Individual Key Works and Dropout Rates -1 Significant Results for OLS Regression Models Testing Relationship Between Individual Key Works and Dropout Rates – 2 Summary Statistics for Combined Positive Keys OLS Regression Results for the Dependent Variable Graduation Rates OLS Regression Results for the Dependent Variable Dropout Rates Significant Result for OLS Regression Models Testing Relationship Between Individual Key Works and Reading WKCE Scores OLS Regression Results for the Dependent Variable Graduation Rates, Focal Variables Only OLS Regression Results for the Dependent Variable Dropout Rates, Focal Variables Only OLS Regression Results for the Dependent Variable Graduation Rates, Focal Significant Variables Only (with Board Member Controls) OLS Regression Results for Dependent Variable Graduation Rates with Interaction Terms
121
122
124
125
126
126
128
128
129
130
138
139
140
142
xiii
Table 7.5 Table 7.6 Table 7.7 Table 7.8 Table 7.9 Table 7.10 Table 7.11 Table 8.1 Table 8.2 Table 8.3 Table 8.4 Table 8.5 Table 8.6 Table 8.7
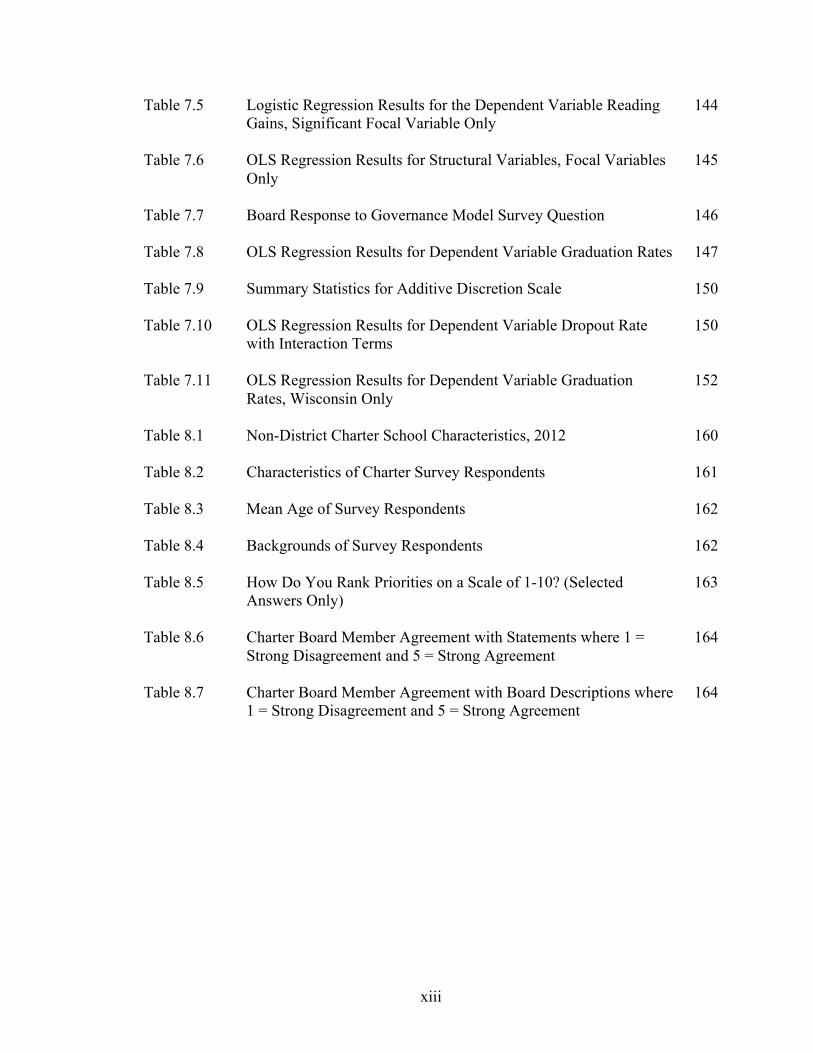
Logistic Regression Results for the Dependent Variable Reading Gains, Significant Focal Variable Only OLS Regression Results for Structural Variables, Focal Variables Only Board Response to Governance Model Survey Question OLS Regression Results for Dependent Variable Graduation Rates Summary Statistics for Additive Discretion Scale OLS Regression Results for Dependent Variable Dropout Rate with Interaction Terms OLS Regression Results for Dependent Variable Graduation Rates, Wisconsin Only Non-District Charter School Characteristics, 2012 Characteristics of Charter Survey Respondents Mean Age of Survey Respondents Backgrounds of Survey Respondents How Do You Rank Priorities on a Scale of 1-10? (Selected Answers Only) Charter Board Member Agreement with Statements where 1 = Strong Disagreement and 5 = Strong Agreement Charter Board Member Agreement with Board Descriptions where 1 = Strong Disagreement and 5 = Strong Agreement
144
145
146
147 150
150
152
160
161
162
162
163
164
164
1
Chapter I. The Problem of the American School Board
Are school boards needed? What do they do? How do they do it? More
importantly, does what they do affect student outcomes? If so, how can they do what
they do better? The goal of this dissertation is to better understand the relationship
between school board governance and academic achievement.
Specifically, quantitative methods are used to connect soft measures of the
governance behavior perceptions of public school board members with hard data on
district academic outcomes. The amorphous concept of governance is defined as the
process by which board members make a series of situation dependent decisions that
chart the trajectory of an organization.
Even more specifically this study seeks to better understand what makes the
decisions board members make the right ones. Is it who board members are? Is it the
concepts on which board members focus? Is it the way in which they make decisions? Is
it the environment in which those decisions are made? Or, is it come combination of all
of the above? Answering these questions will not only clarify the place of the school
board in an education reform environment increasingly hostile to traditional school
boards, but also give insight into how other types of boards, non-profit and government in
particular, might go about improving their effectiveness.
This dissertation seeks to answer the research question: How does school board
governance impact academic outcomes? That school board governance can impact
academic outcomes is supported. A major research study conducted by the Iowa School
Boards Foundation called the Lighthouse Inquiry established that boards overseeing high
achieving school districts demonstrate different sets of characteristics than those
2
overseeing low-achieving districts (Delagardelle, 2008; Rice et. al., 2000). In addition,
the literature on board governance generally shows a connection between governance
behaviors and organizational performance in the non-profit and government sectors
(Carver, 2006; Ihrke & Niederjohn, 2005; Gabris & Davis, 2006).
It is less clear exactly how school board governance impacts academic outcomes.
This study looks in-depth at the role of school board governance by utilizing originally
collected survey results of school board members serving in six states in order to:
1) Establish a modern working definition of the role of school boards: To
improve academic outcomes.
2) Propose an original theoretical model of governance explaining how
governance connects to outcomes.
3) Test the relationship between the demographics and backgrounds of board
members and outcomes.
4) Test the relationship between widely used school board governance best
practices and outcomes.
5) Test the relationship between group dynamics and outcomes.
6) Discuss the alternative governance structure of non-profit charter school
boards.
A Brief Introduction to the School Board
The basic purpose of public education is relatively simple: Provide students an
education that prepares them to be productive adults, and do so in an efficient manner.
Given this simple purpose the two groups most directly impacted by education policy are
public school pupils and taxpayers. These groups overlap and combine to include just

3
about every citizen of the United States. The wide reach of public education makes it a
policy area that is well measured, subject to political experiment, and frequently debated
among experts and novices alike.
Despite the high-visibility of education policy there remains no consensus on how
K-12 education should be delivered. The sheer diversity of student and community
populations and needs makes the existence of a single best method of delivering
education implausible; though this has not stopped well-meaning scholars and policy-
makers from looking. Classroom reforms like small-class sizes and the use of
technology, governance reforms such as mayoral control, and attempts to reform public
education from outside of the system such as school vouchers all have one thing in
common: Mixed results that are dependent on any number of variables.
Thus elected school boards, which oversee the education of the vast majority of
American students, face a basic problem: How do they go about maximizing the
academic success of the districts they represent? Is it by establishing the right district
culture? Education professors Kent Peterson and Terrence E. Deal summarize the
importance of school culture thusly: “[A] positive school culture improves school
effectiveness and productivity” (Peterson & Deal, 2009, p. II). In other words, things
like mission, management, and clarity of purpose in a school or district impact whether
that school or district can achieve its aims. The strength of a concept like culture is that
every organization has one that is, presumably, influenced by its governing board.
But boards are much more than elected bodies that set the tone of an organization.
They also make personnel decisions, serve as the microphone for an organization,
authorize charter schools, lobby for more resources, advocate for their students, and do

4
any number of other things that vary depending on the board members themselves and
the districts they represent.
There is, however, one place where all governance boards are alike. They are all
small groups of people. Previous work has focused on who serves on schools boards and
what they do (Hess & Weeks, 2011). However very little attention has been paid to the
way in which board members go about their work. Governance in this study is defined as
the process by which a small group of people collectively makes a series of situation
dependent decisions. It follows that it matters not only who board members are and the
issues upon which they focus, but also the way in which they go about making decisions.
The following chapters consider the role of demographics and best practices in
governance success, but adds the key missing component of small group dynamics. The
results show that who board members are matters only in the context of how it relates to
what they do and how they do it.
In other words, there is evidence that school district outcomes can be improved
through improved governance, but it is more complicated than getting better people to
serve on boards. Maximizing the potential of school boards requires making the right
decisions in the right way. It requires improved governance.
History of the School Board and Literature Review
The origins of the traditional American school board can be traced back to 1789,
when the Commonwealth of Massachusetts passed a state law that required every
Massachusetts town to open and support a local public school. The law also authorized
towns to employ a board to oversee the school (Callahan, 1975). The statute would
eventually be amended to make the board mandatory, and the City of Boston in particular
5
decided that the board be a democratically elected body insulated from “elitist
tendencies,” (Callahan, 1975 p. 19). What began in Massachusetts spread throughout the
republic, and a locally elected public school board became the norm throughout the
United States.
Notably, student academic outcomes have traditionally not been seen as a priority
of local school boards. In 1959 political scientist Thomas Eliot described the duties of
the American School board as “to hire and support a competent professional as
superintendent, defend the schools against public criticism, and persuade the people to
open their pocketbooks,” (Eliot, 1959, p. 1033). Eliot’s description accurately describes
the role of a school board for much of the institution’s history.
The roles and responsibilities of public school boards have however, evolved in
important ways in the 20th century. According to the National Center for Education
Statistics the number of American school districts declined dramatically from over
117,000 in 1940 to about 18,000 in 1971. Since then the number of districts has declined
slowly, today there are fewer than 14,000 school districts in the United States. As
previously mentioned, those districts almost universally have democratically elected
boards, something indicative of the long history of local control of education in the
United States (Peterson, 1981).
The governance of public schools changed dramatically in the 1990s as non-
district charter schools began to proliferate (Wong & Langevin, 2007). Charter schools
are technically public schools, but they operate outside the traditional public school
regulatory framework. Non-district charter schools are a focus of this study because they
are authorized by an entity other than a school district (such as a University) and
6
correspondingly have independent governing boards. Today a majority of U.S. states
have laws authorizing charter schools, but the laws vary widely (Wong & Langevin,
2007).
The early literature on the American school board is remarkably sparse and
focused on the demographics of board members. Lloyd Ashby’s 1968 work, The
Effective School Board Member best represents the scholarship on school boards up to
that point. Ashby advocates judging the effectiveness of a school board almost entirely
by inputs: Are schools fully staffed? Are classes provided for below average, average,
and above average students? Are staff qualified? etc. (Ashby, 1968, pp. 142-143).
Ashby suggests that business acumen is the ideal quality for a board member. However,
Ashby’s work uses limited empirical data in favor of theory and anecdotes.
The first wide-scope study of the American school board was commissioned by
the National School Boards Association and released as an edited volume in 1975 by
Peter J. Cistone. The volume, Understanding School Boards, focuses on the rapidly
changing environment school boards were facing as school segregation came to an end.
L. Harmon Zeigler (1975), in the volume, concludes that school boards administer a
service to a specific subset of urban society and do not serve the public at-large. He
questions the usefulness of elected boards given their high rate of specialization.
Zeigler’s conclusions are antiquated in the face of high profile fiscal crises and the
growing politicization of education reform; the actions of school boards are no longer
detached from urban political debate. The simple existence of taxing authority has
ensured that school boards remain political bodies exposed to special interest pressures.

7
Raymond Callahan (1975), also as part of the same National School Boards
Association project, concludes that there are three major roles and responsibilities for
school boards. First is the power to hire and fire superintendents and teachers, second is
the power to implement a curriculum, and third is the power to make budget decisions.
Mosher (1975) goes further than Callahan and states that finance and budget decisions
are the most prominent school board responsibility. However, both Callahan and Mosher
fail to consider the restrictions boards face as they make finance decisions. Overall, the
Cistone volume serves as a call for scholars to take seriously the role of American school
boards as a political institution.
Paul Peterson (1981) examined school boards from a federalism perspective,
concluding that boards are often in conflict with state government as they attempt to
maximize shared revenue while minimizing mandates. Murphy (1991) similarly
examines how districts seek to implement the mandates included in the Elementary and
Secondary Education Act in a way that maximizes positive impacts on student
achievement. Spillane (1996) offers a spirited defense of the school board, concluding
that local expertise is necessary for implementing state instructional programs. Peterson,
Murphy, and Spillane are typical of much of the research in the 1980s and 1990s; all
three sought to describe how school boards balance spending with mandates from higher
levels of government.
The turn of the century changed the tone of board scholarship, William G.
Howell’s 2005 edited volume, Besieged, describes the typical American school board as
under attack from school choice programs and mayoral governance reforms. Wong and
Shen (2005) in particular argue that mayoral control of school systems, under the right

8
circumstances, can increase levels of achievement. Viteritti (2005) went as far as to
declare local education politics obsolete. He cites low voter turnout in board elections as
evidence of school boards’ non-democratic tendencies.
Moe (2005), in Howell’s volume, conducts the first major study of special interest
politics in school board elections, finding that teacher unions are the most dominant force
in board elections. Wong and Shen (2005) draw broadly on Moe’s conclusion as
evidence that school board elections are dominated by special interests, plagued by low-
voter turnout, and can be impediments to increasing levels of academic achievement.
Policy debates in large cities across the country have been informed by Wong and Shen’s
conclusions that boards can be a hindrance to learning.
However, there is a significant research gap that leave Wong and Shen’s
conclusions unsatisfying. Hochschild (2005) points out that scholars do not have a full
understanding of what school boards can or cannot do. Is the perceived problem the
institution, or its actions? If special interest participation and low-voter turnout de-
legitimize school boards, why are other local and state governments whose elections have
low-turnouts and strong interest group participation not deemed illegitimate as well?
Economist Jason Grissom (2012) begins to fill in a research gap on school boards
by linking the level of conflict on California school boards to growth in district
performance. He finds that school board member conflict (as determined by surveys of
board members and superintendents) is generally negatively associated with student
achievement. Grissom concludes there is a need to better understand the pathways
connecting board governance and student achievement. My dissertation will better
conceptualize these pathways and look at aspects of governance beyond conflict.

9
A parallel track of scholarship has focused on the impact of racial and gender
representation on school boards. Melissa Deckman (2007), for example, finds basic
differences in the reasons men and women run for school board. Men are more likely to
say they want to impact government policy, and more likely to cite religious motivations
than women. These differing motivations provide reasons to suspect that the gender of
school board members relates to district performance. A preliminary study by this author
testing the relationship between board member gender and academic outcomes in
Wisconsin, for example, found that female majority boards generally govern over
comparably higher achieving school districts (Ford, 2012).
Melissa Marschall (2005) finds that minority parents in school districts with
minority school board members have higher levels of satisfaction with their schools than
minority parents in districts without minority board members. Given the significant role
that non-school home-life factors have in predicting academic outcomes, Marschall’s
findings are substantively significant.
Kenneth Meier has done significant work on the role of racial representation and
diversity on school boards. Meier & Stewart (1991) examine over 100 diverse school
districts and find that board members will often respond to board conflict by forming
race-based coalitions and/or multi-racial coalitions based on predictable patterns. Luis
Fraga, Meier, & Robert England (1986) use data from about three dozen school districts
to identify a link between Hispanic school board representation and Hispanic
employment levels in school districts. Meier & England (1984) also look at urban
districts specifically and find that African-American representation on school boards is
linked with more equitable district policies.

10
The body of research on gender and racial representation solidifies the need to
consider the demographics of board members in attempts to explain their behavior.
Though much emphasis in this study is on how school board members go about making
decisions, it is crucial to understand that demographics play a substantial part in forming
individual board members’ decision premises (Simon, 1972).
Comparative Case Study Approach
This study takes a comparative case study approach to answer the question of how
school board governance impacts student achievement. Specifically, survey results from
school board members from Wisconsin, Michigan, Minnesota, Utah, Florida, and Nevada
are pooled with archival data from the National Center for Education Statistic’s Common
Core Data Set and from individual state education agencies to identity and explain
meaningful commonalities and differences between states.
The logic of using a case study approach, as well as the logic of the chosen cases
is grounded in the nature of school boards. School boards are a creation of state
government and operate under unique laws that make an overall generalizable study more
difficult and likely less informative than comparative case studies. While there are
certainly commonalities among all school boards in the United States, there are vast state-
to-state differences that need to be considered to make valid conclusions about the
institution.
The relative strength of teacher unions is different in Nevada, Florida and Utah
compared to Michigan, Minnesota and Wisconsin (where recent events have made the
continued strength of unions unclear). The task of a school board member that must deal
heavily with unions is appreciably different than a school board member that does not
11
deal with organized labor and collective bargaining. School board members in the
included states also operate in very different accountability climates. A 2007 analysis of
standards used by states to measure their progress under No Child Left Behind (NCLB)
shows Wisconsin, Minnesota, and Michigan all have lax standards compared to Nevada,
Utah, and Florida (Carey, 2007). However, the recent granting of NCLB accountability
waivers in several states as well as the well-documented flaws of the NCLB
accountability framework make this too, an evolving issue.
A multi-state case study approach will allow for conclusions across groups of
similar and dissimilar states, as well as specific insights resulting from state-to-state
comparisons. According to Boston University Political Scientist John Gerring (2007) a
case study is appropriate when an intensive study of one or more cases can yield valuable
information about all cases. In this study, there is a potential for fifty different cases due
to the fact that state governments authorize school boards and all operate in a constricted
environment determined by the unique legal and demographic make-up of their
respective states. Conducting fifty different case studies is ideal, but logistically
prohibitive and unnecessary to answer the presented research question. Instead, two
dissimilar groups of three similar cases will be used. Two approaches to case study
research will be deployed: 1) The use of most-similar cases, and 2) The use of most-
different cases (Gerring, 2007, p. 88). The hybrid approach will allow for conclusions
through the study of commonalities between all cases, and the specific differences
between the dissimilar groupings.
As mentioned two groups of three states have been selected based on their
characteristics. Group one consists of less unionized states with a small number of large

12
school districts and significantly lower levels of per-pupil spending and employee benefit
costs (see Tables 1.2 and 1.2). Group Two consists of heavily unionized states in the
Great Lakes region that contain large numbers of small school districts and high levels of
per-pupil spending and employee benefit costs (see Tables 1.1 and 1.2). Their
geographic proximity is also relevant as specific education policies that impact school
boards, such as the use of charter schools, have diffused between these states (Wong &
Langevin, 2007).
Table 1.1: Characteristics of School Districts in Selected States
State Districts
Average Schools Per-District
Average Students Per-District
Average Teachers Per-District
Group 1 Nevada 17 36 25,352 1,289 Utah 41 28 13,311 560 Florida 67 67 39,150 2,762 Group 2
Wisconsin 424 5 2,035 138 Michigan 552 7 2,790 155 Minnesota 340 6 2,360 146
Table 1.2: Average Per-Pupil Costs in Selected States
State Total Per-Pupil Cost
Per-Pupil Fringe Benefit Cost
Group 1 Nevada $8,442 $1,917 Utah $6,356 $1,594 Florida $8,769 $1,649 Group 2 Wisconsin $11,078 $2,807 Michigan $11,098 $2,713 Minnesota $11,098 $3,140
13
In addition to the public school boards in the selected states, surveys were sent to
school board members governing charter schools operating in Wisconsin and Michigan.
Charter school boards differ from district school boards in several substantive ways.
Most important, board members are appointed and not elected. Second, charter school
boards usually oversee a single school rather than a system of schools. Third, charter
schools receive less state and local aids than traditional public schools.
Modeling School Board Governance
Figure 1.1 is an overly simplified model of the two basic relationships guiding
this dissertation. First, the skills and backgrounds of board members are assumed to
impact the manner in which board members govern. Second, the action of governance is
hypothesized to impact the academic performance of districts and schools. Crucial to
understanding these relationships is an examination of the activities that are decided upon
during the governance process. Clearly, Figure 1.1 fails to satisfy as an explanatory
model, it does however provide a starting point from which to discuss the subjects of the
situation dependent decisions made during the governance process.
Figure 1.1: Model Connecting School Board Governance to District Performance
Board Member Backgrounds Governance Performance
The aforementioned Lighthouse inquiry speculates that there are seven
characteristics of effective school board governance (Delagardelle, 2008):
1. Connections across the system
2. Knowing what it takes to change achievement
3. Workplace support
14
4. Professional development
5. A balance between direction and building-level autonomy
6. A strong community connection
7. Distributed leadership
Delagardelle’s list contains several important inputs (a basic knowledge of
education, connections to the community, etc) that might be theorized to predict the
performance of a board, as well as several structural conditions (distributed leadership,
workplace support, etc.) that bear further study. While the survey used for this
dissertation was designed to gather data that can be used to better understand the value of
the Lighthouse model, emphasis will also be placed on measuring the role of governance
beyond the inputs and conditions in which a board operates.
Hypotheses and Descriptions of Data
Guiding this project is the broad, informed, but preliminary assumption that
school board governance behavior relates to district performance in quantitatively
measurable ways. Three specific hypotheses will be the focus of the project.
Hypothesis 1: Greater adherence to the eight components of the National School Board
Association’s (NSBA) Key Work of School Boards positively impacts district level
academic outcomes.
The NSBA describes in detail the eight components it believes are essential to
using governance to raise academic achievement (Gemberling et. al., 2000). The
components on the list are:
• Vision
• Standards
15
• Assessment
• Accountability
• Alignment
• Climate
• Collaboration
• Community Engagement
• Continuous Improvement
The list, however, is the product of consensus, not research. Surveying board
members on the extent to which their board is adhering to the NSBA’s key components
provides data that can be connected to district outcomes; thereby verifying or calling into
question their use as best practices.
Hypothesis 2: The presence of dynamics typical to a high-functioning small group on a
school board positively impacts district level academic success.
As mentioned, small groups in government and non-profit agencies have been
shown to demonstrate predictable characteristics that can be measured via survey and
shown to affect group outcomes (Ihrke & Niederjohn, 2005; Gabris & Davis, 2006).
Theoretically, school boards should operate like other small groups and the presence or
lack of presence of factors typical of a high functioning group should be related to
organizational outcomes. Specific sub-hypotheses grounded in the following three
aspects of board governance will be tested: 1. Conflict 2. Board design, and 3.
Governance model.
Conflict
16
The impact of conflict within small groups differs depending on the type of
conflict and the way in which it manifests. Morton Deutsch (1973) for example theorizes
that the likelihood of conflict within a group is dependent on the timing of the
consequences of adopting a specific position. Deutsch also discusses the characteristics
of destructive and constructive conflict, arguing that the measurement of results is the
best way to determine the nature of conflict. Lewis Coser (1956) helpfully hypothesizes
on the determinants of destructive and constructive conflict, concluding that ideologically
tinged conflict is the most entrenched and destructive. However, he also concludes that
conflict can serve a positive social function by creating a mechanism to relieve tension
that enables better decision-making within groups.
Qualitative work by Karen Jehn (1997) furthers the understanding of small-group
conflict by dividing it into three types. The first, relationship conflict, appears as
personal animosity and/or frustration between board members. Such conflict could bog
down the governance process and negatively impact student achievement by preventing
timely policy-making. In other words, an unresponsive board may be unlikely to react
quickly to district and school challenges.
The second type of conflict is task conflict. Task conflict is when board members
have legitimate differences over the vision and policies of the board. Such conflict is
substantive, not personal. The presence of task conflict may be an indicator of an
engaged board and should be expected to increase school and district performance.
Conversely, the absence of task conflict likely means a board is disengaged, or bogged
down in relationship conflict. Either way, performance should be expected to suffer.

17
The third type of conflict is process conflict. Process conflict is disagreement
between board members on the way in which certain tasks should be done; for example
which committee should take up a specific policy proposal, how long a topic should be
debated, etc. There is reason to suspect the presence of process conflict on a board
negatively impacts school and district performance. Specifically, focus on process may
be a safe harbor for boards that are unable or unwilling to address education policy.
Board Design
The second relevant aspect of board governance is board design. Design matters
because board attributes such as stability, shared politics, and the nature by which board
members begin their service likely affects what board members care about and how they
interact (Renz, 2004). For example, a long serving board might be expected to make
policy in a more efficient (and responsive) manner due to familiarity. Also important is
the manner in which a board member is elected (or for charter school boards, appointed).
A board member that won a contested election is likely more sensitive to political
concerns than a board member that won an uncontested election.
Governance Model
The third aspect of board governance theorized to impact performance is the
governance model deployed by the board. Many boards likely use the traditional model,
which stresses top-down governance and process (Bradshaw et. al, 2007). Others likely
use the policy governance model, where a formal policy is created to deal with specific
governance questions (Carver, 2006). Still others likely use the corporate model of
governance.
Hypothesis 3: Boards with larger zones of discretion have better academic outcomes.

18
As discussed earlier, school boards face limits on their ability to make policy
(Kirst, 2008). Limiting factors includes state and federal mandates, teacher unions,
constituents, and spending caps (Howell, 2005). Surveying board members on their
proclivity to make policy decisions beyond what is required under state law will allow for
a quantitative analysis of whether enacting policies that go beyond what is required by
law is connected to better student outcomes.
Three types of data will be used to test the listed hypotheses. The first is archival
data on school districts from the Common Core of Data from the National Center for
Education Statistics. Several variables for all school districts in the country, and hence
the eventual sample, are available. The first set of variables is descriptive:
• Address;
• Phone numbers;
• Numbers of schools in the district;
• Numbers of students in the district;
• Number of teachers in the district;
• Teacher/student ratio in the district;
• Number of English Language Learners in the district;
• Numbers of students with IEPS in the district;
• Census classification of districts;
• Breakdown of total district staff including guidance counselors, librarians, district
and school administrators;
• District revenue by source;
19
• District expenditures broken down by category including instructional, students
and staff support, administration, operations, capital spending, interest on debt;
and
• District census data on the population served by the district; age race, etc.
The variables listed above are used to build a statistical portrait of school districts
and charter schools in my selected states, and then linked with original survey data
collected from public school board members.
The second major data source is the survey results from traditional and charter
school board members. A similar survey was used by Ihrke & Niederjohn (2006) to
measure the presence of conflict on Wisconsin city councils. The authors sent surveys to
617 board members on 57 councils, and achieved an overall response rate of 23.8%. A
similar response rate was obtained for this study.
The third data source consists of variables that indicate the level of academic
performance in school districts. NCES data on high school graduation and dropout rates,
as well as limited in-state test score data are used as indicators of attainment and
performance at the school district level.
Across state comparable standardized test score data is impossible to obtain
because of the widespread use of criterion reference tests developed by individual states.
The six states in my study all use different tests: The Wisconsin Knowledge and
Concepts Exam, Michigan Educational Assessment Program, Minnesota Comprehensive
Assessments, the Iowa Test of Basic Skills (used in Utah), the Nevada Proficiency
Examination Program, and the Florida Comprehensive Assessment Test. However, all
tests do have specific cut-off points that indicate proficiency; meaning the percentage of

20
students in each school district scoring proficient on the state test is sparsely used as a
common, though imperfect indicator of district achievement levels.
Another potential problem with connecting board governance with academic
outputs is the lag time between a governance decision and the time its impact (or lack of
impact) on district performance is felt. A multitude of methods, including the use of
statistical models restricted by a board stability variable, are used to mitigate the
possibility of a governance time lag.
Methodology
Quantitative methods are deployed to analyze the collected data. The specific
methodologies used include:
• Simple means comparisons tests to establish the demographic differences of
schools and districts, school and district performance, school board member
demographics, and school board member attitudes;
• Linear regression analyses explaining the relationship between school
demographics and resources, school demographics and performance, school
resources and performance, school board governance behavior and outcomes, and
various other relationships between board member behaviors and school and
district outcomes; and
• A logistic regression analysis predicting reading test score gains across states.
A study of school board governance in California by Jason Grissom (2012)
demonstrates how school board member survey response variables can be modeled with
academic outcome variables. Grissom surveyed 1,111 school board members and
obtained responses from 63 percent. He averaged out responses at the board level when

21
multiple members from a single board responded. Using district level testing results from
the California Department of Education as his dependent variable and survey responses
as independent variables Grissom conducted several multi-variate regression analyses.
The methodology deployed by Grissom informs some of the methodology used in this
analysis.
Conclusion and Next Steps
The preceding chapter included a literature review of school board governance, a
description of the research question, a brief overview of the data used in this study, and
the three hypotheses that are tested. But the title of this introductory chapter is The
Problem of the American School Board. So, what is the problem? Simply, there is no
consensus about what school boards should be doing, what they have the power to do,
what they actually do, or how they do it. The lack of consensus has led scholars to too
often dismiss or ignore the institution of the school board. Studies of alternative forms
of school district governance proliferate while the dominant structure governing the
delivery of public education in the United States is attacked as irrelevant.
The following chapters will show that school boards are not irrelevant by first
defining their role, tasks and limitations, second proposing an explanatory model linking
school board governance to academic outcomes, third establishing the variables which
affect academic outcomes in the six states of interest, fourth testing hypotheses linking
board governance to academic outcomes, and fifth exploring the alternative non-profit
charter school board. The overall approach is perhaps out-of-step with the title of this
chapter, as it is built on the premise that the American school board is not a problem, but
rather akin to a jigsaw puzzle - a very old jigsaw puzzle. Like an old jigsaw puzzle I

22
fully expect to end up with some missing pieces, some weathered pieces, and perhaps
even a final picture that is laughably out-of-date. Regardless, the following eight
chapters will provide an in depth understanding of how and why school board
governance affects student outcomes.
23
Chapter II.
An Alternative View of the School Board: Role, Tasks, and Discretionary Zones Why do school boards exist? It is a simple question on the surface, but one that
gets more complicated the deeper one digs. This chapter of the study argues that the
absence of widespread agreement on the proper role of school boards is due to confusion
between the tasks executed by school boards, and the role of school boards. Both are
important concepts, but both are fundamentally different. Going further, I argue that the
role of school boards, if they are to survive, must be universally understood as
maximizing the student achievement levels in their district. It is the tasks and ways in
which they engage in them that determine whether their role is met. Necessary in
understanding the tasks of school boards is recognizing the discretionary zones in which
they operate.
The Role of School Boards
As mentioned in Chapter One, Political Scientist Thomas Eliot opined in 1959
that the role of the school board is “to hire and support a competent professional as
superintendent, defend the schools against public criticism, and persuade the people to
open their pocketbooks,” (Eliot, 1959, p. 1033). Perhaps in 1959, when there were no
popular alternative structures to perform the basic tasks of school boards, this was an
adequate description. Plainly, in 1959 the tasks of school boards were the same as their
role because no alternative vision existed.
But things changed mightily after 1959. In particular, two occurrences in the
mid-1960s fundamentally altered the way in which local education was delivered in the
United States. First, the passage of the Elementary and Secondary Education Act
24
(ESEA) in 1965 dramatically increased the role of state and federal government in local
education. Second, the rising influence of two national teachers unions, the American
Federation of Teachers and the National Education Association, brought collective
bargaining rights to most districts, permanently changing the nature of school board
politics. Simply, the quaint idea of an apolitical board that solely performs an
administrative function ceased to exist (Epstein, 2004). Both the money flowing to and
mandates hoisted upon school districts increasingly originated from factors beyond the
control of local school boards. Yet, the academic literature on school boards for the most
part continued (and continues) to define the role of the school board as a series of tasks.
Deborah Land (2002) reviews existing literature on school board governance and
concludes the popularly understood function of the school board is to make policies.
Again, this may be what boards do, but is it their function?
Norman Kerr (1964) argues that the school board exists simply to legitimize the
actions of the district by showing that initiatives are vetted and approved by accountable
and democratically elected officials. The dissatisfaction theory of local governance
posits something similar, that school board members are voted out of office when the
public becomes dissatisfied with their policies (Lutz & Iannaccone, 2008). William
Howell and Christopher Berry (2005) find evidence of this in South Carolina, concluding
school board elections do serve a public accountability function. Jon Pierre (1999)
argues that local government boards, including school boards, exist to maximize state aid
to the community.
All of these explanations provide some idea of why school boards exist, but fail to
get at defining their core role. Accountability for academic performance, for example, is

25
increasingly a core function of state government. For example, the No Child Left Behind
Waiver approved in Wisconsin in 2012 allows the state to directly intervene in the
operations of low-performing schools. In Michigan, a special purpose government called
the Education Achievement System exists specifically to run low-performing schools.
Perhaps there is potential for school boards to serve a democratic accountability function,
but the continued widespread development of accountability systems that act more
swiftly than democracy suggest that this should not and cannot be the institution’s core
role if it is to survive.
Maximizing state aid also appears on the surface a logical role for school boards.
However the universal use of equalization and/or minimum foundation programs by
states to fund schools makes this role obsolete. In most states, state aid to school districts
is mostly determined by the number of students enrolled in district schools and some type
of formula that determines how much state aid is needed given the district’s local revenue
generating capacity. Sure, districts can seek to maximize enrollment, but that is hardly a
core governance function.
A tempting landing spot is to conclude that school boards exist to serve the
essential function of running schools. Or, school boards exist because of a lack of other
options. The proliferation of education vouchers for private schools, independent charter
schools that operate outside of traditional school districts, the emergence of special
purpose governments to run schools in Louisiana, Michigan and Tennessee, and the
elimination of traditional school boards in several large American cities show that school
boards are not in fact needed to deliver public education (Howell, 2005; Viteritti, 2005).
The emergence of public education options outside of school board authority, though still

26
the exception and not the rule, provides urgency to the task of defining the proper role of
the school board (Levin, 2002).
So what is the proper role of school boards? Ideally, to maximize the academic
output of the school districts they oversee. The rest of this chapter and the rest of this
dissertation will explore how school boards go about, and should go about, executing this
role. This defined role satisfies for many reasons. First, it is simple and vague enough
that it can apply to the over 14,000 school boards operating in diverse policy and
interpersonal environments. Second, it presumes that school boards are the school
governance agent most capable of ensuring American students are well educated. The
continued failure of alternative governance structures to deliver outcomes substantially
better than traditional school districts, as well as the overwhelming market share of
traditional school districts, makes this presumption logical (Wong et. al., 2007; Levin,
2004). Third, it is a role that is measurable, though imperfectly, using widely available
student performance data.
The Tasks of School Boards
Having defined the role of school boards the next logical questions to consider
are, what do school boards do? And what tasks do boards engage in? Here too the
answer is surprisingly complex and requires a discussion of the types of tasks school
boards generally execute, as well the development of a continuum of tasks from broad to
specific that together comprise the action of governance. First, however, it is necessary
to differentiate between the things that individual board members do in their official
capacities, and the things that boards do. In this study both the board and the board
27
member are relevant units of analysis, but it is impossible to understand one without
understanding the other.
According to a national survey of American school board members the average
board member is likely to be white, have a bachelor’s degree or higher, most likely
moderate and more likely conservative than liberal in their political views, slightly more
likely to be male than female, and likely be receiving a relatively little or no salary for
their service (Hess & Meeks, 2011). Boards members in general also are most likely to
have been elected to their position with relative ease in a campaign that spent less than
$1,000 (Hess & Meeks, 2011).
As can be seen in Figure 2.1, there are various board member tasks that sit on
different ends of a specific to broad continuum. For example, school board members, as
democratically elected officials, broadly represent the views of their constituents.
Though the task of representation may be markedly different for members representing
at-large positions on boards than district seats, and will likely manifest in different ways,
the overall concept of representation is consistent. Running for reelection is another
broad school board member task; all must do it but the specifics of how will vary. The
adoptions of formal and informal roles on the board are two more broad tasks (Smoley,
1999). Formal roles may include committee memberships and officer positions like
treasurer and board president. The formal roles taken and the ways in which they are
fulfilled will vary by member, but all will serve some formal role. The informal roles of
individual board member will also vary and be dependent on the way in which the group
interacts, but positions as peacemaker, listener, etc. are likely to develop within a board
and manifest in different ways (Smoley, 1999).

28
The more specific tasks of board members relate to the day-to-day work of
serving on a local government board. This includes meeting with constituents, attending
board meetings and committee meetings, and voting on district policies. The tasks
included in Figure 2.1 are not meant to be an exhaustive list, individual board members
engage in any number of activities that range from very specific to very broad.
Importantly, these individual board member tasks are not board governance tasks. They
may impact the governance process, they may be signs of an effective or ineffective
board member, but they are individual tasks.
Figure 2.1 – The Continuum of School Board Member Tasks Specific Broad <--------------------------------------------------------------------------------------------------------> Vote on district policies Represent constituents Meet with constituents Run for election Attend board member training Adopt formal board roles Attend board meetings Adopt informal board roles A school board, which in its most simple form is merely a group of school board
members engaging in formal duties, also performs collective tasks that can be placed on a
specific to broad continuum. Existing academic literature gives a general overview of
what school boards do. Paul Hill (2004) lists a multitude of oversight tasks school boards
engage in; specifically boards manage:
• Facilities;
• Professional staff and support staff;
• School and pupil funding;
• Curriculum;
• Transportation of pupils;

29
• School attendance;
• Dispute resolution;
• Implementation of state and federal categorical aid programs;
• Federal civil rights laws; and
• Vendor contracts.
Collectively Hill’s list comprises the specifics that go into the day-to-day
management of district operations. In other words, school boards work collectively to
make the trains run on time. Mary Delagardelle (2008) takes an alternative approach and
describes the tasks of school boards primarily through the broad lens of guiding student
learning. The specific tasks include creating a board “vision and direction for student
learning,” creating district policies, allocating resources, and monitoring academic
achievement initiatives (Delagardelle, 2008, p. 191).
Figure 2.2 – The Continuum of School Board Tasks Specific Broad <--------------------------------------------------------------------------------------------------------> Budgeting Management of district operations Creating a formal board vision Guiding student learning Monitoring student achievement Aligning resources with mission Hiring the superintendent Keeping the public informed Negotiating contracts with teachers Managing human capital
Raymond Callahan (1975) argues that school boards perform just three major
tasks: 1). Hiring and firing the superintendents and teachers 2) Implementing a
curriculum, and 3) Making budget decisions. Mosher (1975) argues that boards have
only one task – making finance and budget decisions. Deborah Land (2002), in a meta-
analysis of existing literature describes the tasks of school boards parenthetically, writing
that boards:

30
…appropriate overarching concerns, namely students’ academic achievement and policy, not administration; good relations with the superintendent, other agencies, local and state government, and the public, as well as between board members; effective performance in the areas of policy-making, leadership, and budgeting; and adequate evaluation and training/development. Two themes emerge from this discussion of school board tasks. First, the tasks of
school boards, as illustrated by Figure 2.2, range from very specific (i.e. voting on a
district budget) to very vague (i.e. monitoring district finances). Second, there is no clear
consensus of the tasks of school boards. Asking multiple people what a school board
does will likely yield many often-conflicting answers.
The lack of a unified consensus on what school boards actually do presents both a
practical and theoretical problem when attempting to research the institution. How can
the performance of school boards on whole be measured without first having standards
on which to gauge performance? If a clear list of what boards ought to be doing existed
measuring if they are doing it, and if they are doing it well, would be fairly
straightforward. If there was universal agreement with Mosher (1975) that financial
oversight is the sole task of school boards, a board with a clear and balanced budget
could be deemed successful, and a board without one unsuccessful. But alas, no
consensus exists.
Thus comes the second and more interesting theoretical problem: If no agreement
on what boards do exists, how can their existence ever be validated? This theoretical
problem lies at the heart of the growing strain of literature declaring that school boards
are an obstacle to learning and an obsolete relic of a bygone era (Viteritti, 2009). The
line of reasoning is that local control of education had its place in American history, but it
31
no longer reflects reality, and alternative structures for overseeing the delivery of K-12
education are necessary.
Both the described practical and theoretical problems provide an opportunity to
recast the tasks of school boards in the United States. Both the practitioner and academic
literature is too focused on solving the problem of how 14,000 complex local
governments should go about overseeing the education of American elementary and
secondary students. That problem is too large, too local, and too complex be solved with
a list of specific tasks, best practices, or model policies. Understanding the place of
school boards requires a much simpler and broader starting point.
As mentioned, the role of school boards is presumed to be maximizing the
academic performance of district students. Given that role, the universal task for all
school boards should be simply defined as overseeing the production of academic output.
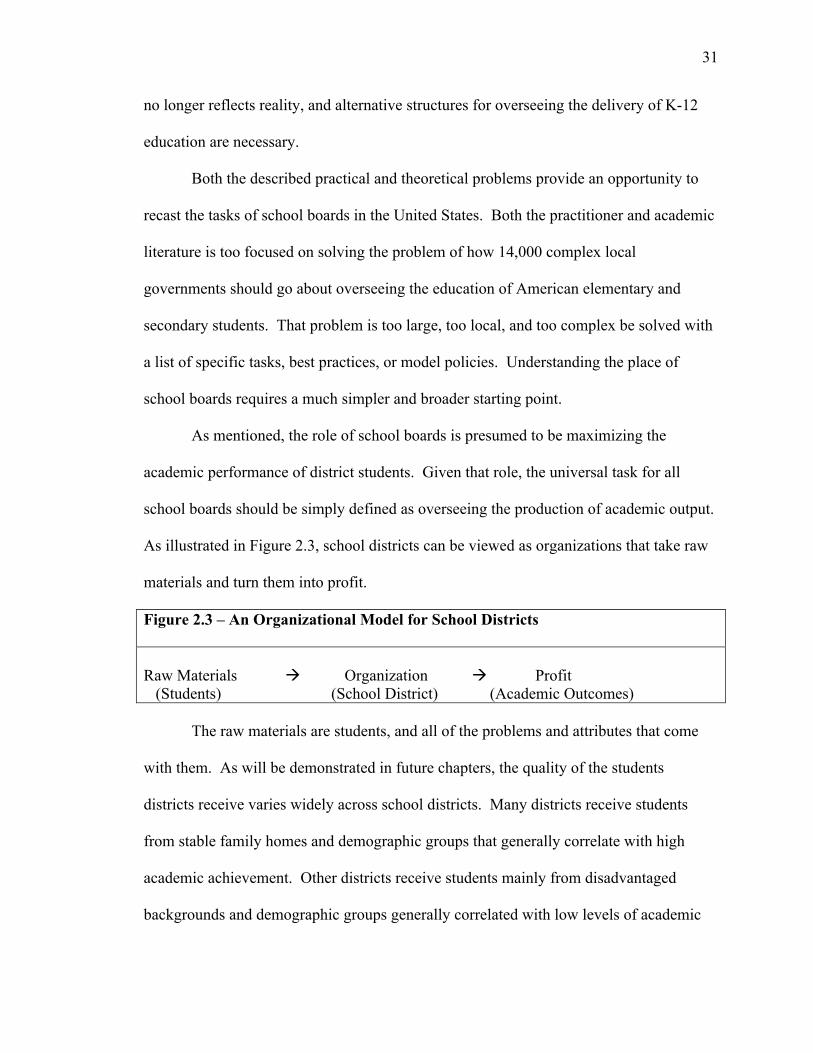
As illustrated in Figure 2.3, school districts can be viewed as organizations that take raw
materials and turn them into profit.
Figure 2.3 – An Organizational Model for School Districts
Raw Materials Organization Profit (Students) (School District) (Academic Outcomes)
The raw materials are students, and all of the problems and attributes that come
with them. As will be demonstrated in future chapters, the quality of the students
districts receive varies widely across school districts. Many districts receive students
from stable family homes and demographic groups that generally correlate with high
academic achievement. Other districts receive students mainly from disadvantaged
backgrounds and demographic groups generally correlated with low levels of academic

32
achievement. The optimal operations of a school district will necessarily depend on the
type of raw materials that go into it.
The organizations receiving the raw materials are school districts. American
school districts also vary widely in organization. Some districts serve tens of thousands
of students in hundreds of schools, while others serve less than 100 students in a single
schoolhouse. Some provide comprehensive services for special needs students; some
send their most needy students to other districts. Districts vary in the way they pay their
staffs, the way they spend their limited monetary resources, and in a countless number of
other observable and unobservable ways.
Profit in the organizational model for school districts is broadly described as
academic output. Though admittedly no perfect way to measure academic output exists,
the widespread use of standardized tests within states and a common measurement of
four-year high school graduation rates used by the National Center for Education
Statistics across states provide rich data from which to gauge and compare the quality of
academic output across school districts.
Collectively, the three-step model can be described as an exercise in public
administration. After all, education is a public good funded by taxpayers, staffed by
public employees, and available free of charge to all American children. Historically
scholars have often described the delivery of public education as a unique activity
markedly different than the activities performed by other local governments (Mosher,
1975; Land, 2002). Not applying the scholarship and lessons from the operations of other
local governments to school districts makes little sense given their significant shared
charge and characteristics.
33
So where do school boards fit into this process? Simply, school boards govern.
As previously mentioned school boards oversee the public administration task of
producing academic output. There is no single set of specific things they should be
doing; theirs is a broad charge of making the best of the raw materials received by the
school district. For example, a school board that oversees a district populated by highly
motivated students with engaged families might maximize student performance by
governing with as light of a touch as possible, seeking only to not pollute quality raw
materials. Another district with very challenging students with disengaged families may
need to design specific district policies to counteract the negative impact of a disengaged
or dysfunctional home environment. This may be something as simple as an extended
school day that keeps students in the care of teachers and other school staff for longer
parts of the day.
This hypothetical comparison suggests that knowing when to take or not take
specific action can be as important a part of governance as the specific actions taken. It
follows that the way in which school boards govern, though perhaps less obvious to the
naked eye, are more important than any specific set of board created district policies. In
the chapters that follow the connection between board governance characteristics and
behaviors, like the presence of conflict, cooperation, situational awareness, and academic
output, will be explored (Gabris & Davis, 2006; Svara, 1990). The presumptions going
into my quantitative analyses is that governance is a process conducted by school boards
rather than a set of policies, and that that process impacts academic performance in
school districts.
School Boards and Zones of Discretion

34
The specific connections between school board governance and academic output
will be probed in the following chapter. But first, a significant complicating factor not
limited to, but especially present in, school board governance must be discussed. As
described by Michal Kirst (2008), school boards operate in zones of discretion that
constrict the school board governance process. A review of state statutes informs Table
2.1, which contains the author’s summary of the level of discretion present in school
board’s operating in the six states of interest. The areas were chosen based on their
importance to the previously discussed organizational model of school districts. Student
quality refers to a school board’s ability to control who they educate, revenue and
personnel refer to the control school boards have over the resources essential to school
districts, and assessment refers to the level of control school districts have over the way
in which the academic output of school districts is measured.
Table 2.4 – Level of School Board Discretion by Area by State
Area Wisconsin Michigan Minnesota Florida Utah Nevada Revenue Low Low Low Medium Medium Low Personnel High Low Low Low Medium Medium Assessment Medium Medium Medium Medium Medium Medium Student Quality Low Low Low Low Low Low
Revenue
Revenue refers to the state, local, and federal funding used to finance public
school district operations. In all six states education funding is determined through an
equalization formula designed to match state funding with an individual school district’s
capacity to raise local revenue, or a minimum foundation program which provides
individual school districts with an amount of funding dependent on the unique
characteristics (i.e. level of poverty, number of special needs pupils) of that school
35
district. The general goal of both minimum foundation and equalization aid formulas is
to ensure that longstanding historical disparities in funding between low and high income
school districts, famously profiled in Jonathan Kozol’s (2012) Savage Inequalities, are
eliminated.
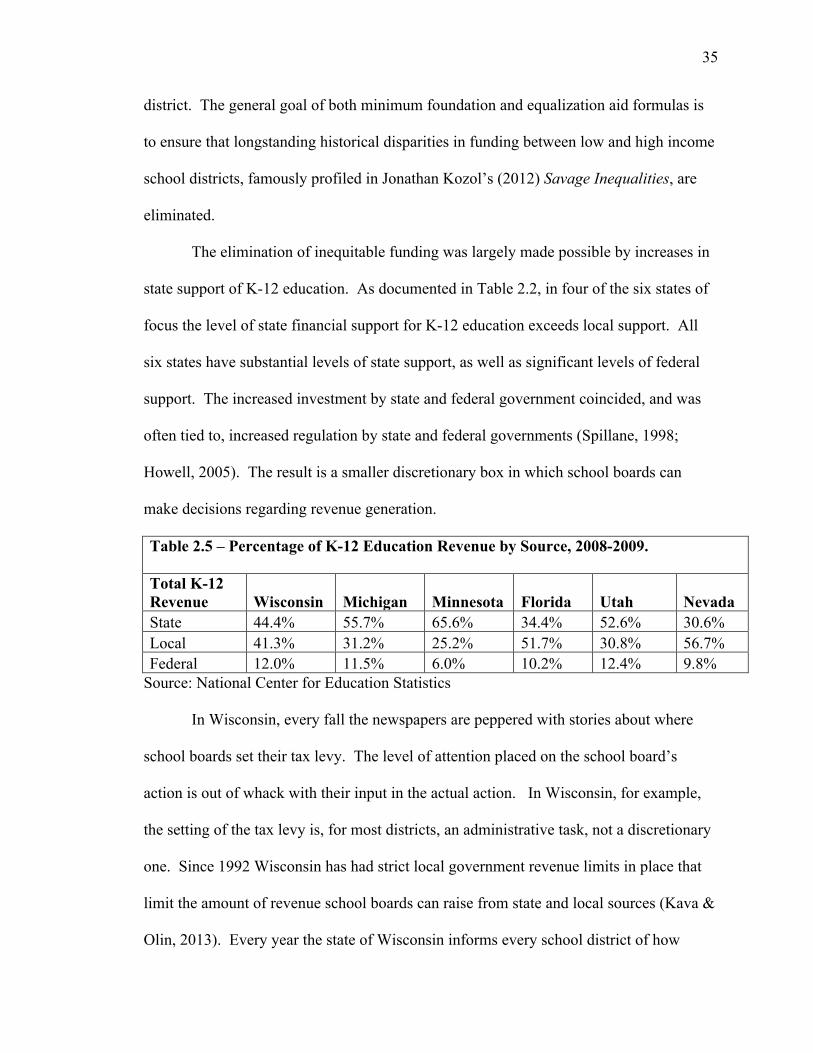
The elimination of inequitable funding was largely made possible by increases in
state support of K-12 education. As documented in Table 2.2, in four of the six states of
focus the level of state financial support for K-12 education exceeds local support. All
six states have substantial levels of state support, as well as significant levels of federal
support. The increased investment by state and federal government coincided, and was
often tied to, increased regulation by state and federal governments (Spillane, 1998;
Howell, 2005). The result is a smaller discretionary box in which school boards can
make decisions regarding revenue generation.
Table 2.5 – Percentage of K-12 Education Revenue by Source, 2008-2009.
Total K-12 Revenue Wisconsin Michigan Minnesota Florida Utah Nevada State 44.4% 55.7% 65.6% 34.4% 52.6% 30.6% Local 41.3% 31.2% 25.2% 51.7% 30.8% 56.7% Federal 12.0% 11.5% 6.0% 10.2% 12.4% 9.8%
Source: National Center for Education Statistics
In Wisconsin, every fall the newspapers are peppered with stories about where
school boards set their tax levy. The level of attention placed on the school board’s
action is out of whack with their input in the actual action. In Wisconsin, for example,
the setting of the tax levy is, for most districts, an administrative task, not a discretionary
one. Since 1992 Wisconsin has had strict local government revenue limits in place that
limit the amount of revenue school boards can raise from state and local sources (Kava &
Olin, 2013). Every year the state of Wisconsin informs every school district of how
36
much money they are able to raise (the number is based on enrollment), and how much
state aid the state will be sending to the district. The school board is then allowed to set a
tax levy that fills the gap between allowable revenue and state aid. A school board can
vote to levy less than allowed (which happens roughly 20% of the time), levy the
maximum allowable amount (which happens roughly 70% of the time), or vote to go to
referendum to exceed their revenue limit (which happens roughly 10% of the time). In
other words, Wisconsin school boards more often than not have zero control of their local
property tax levy. The other states of interest have somewhat similar systems in place.
Since 1994, Michigan schools have had no control over their local education
revenue; the amount of local and state aid to Michigan school districts is determined
entirely by state government (CRC, 2010). Minnesota school boards operate under a
system similar to Wisconsin, where the legislature set taxing limits in various areas and
gives boards the options of levying less than the limit, or going directly to the voters via
referendum for permission to exceed the limits.
Florida school boards have slightly more power. The state sets the local
education levy but does allow boards to levy additional taxes for operations and capital
expenses, but those two levies are also capped. In Nevada, about 80% of total education
funding comes from local and state sales tax. There is also a property tax levied for
education, but school boards have no control over either, the amounts are set by the state.
Finally, Utah, like Florida, allows school boards to levy for specific purposes but places
strict caps on the levies.
In general, school boards in my six states of interest are boxed in when it comes
to revenue decisions. Florida and Utah do have some controlled discretion to fund

37
specific programming, but the rest of the states are totally at the mercy of state
legislatures and referendum voters.
Personnel
Since the mid 1960s school boards across the country have ceded substantial
personnel authority via collectively bargained contracts with labor unions (Fuller &
Mitchell, 2006). In each of the six states over 3/4ths of teachers are members of labor
unions that collectively bargain with school boards. A review of the 2009-2013 Labor
Agreement between Wisconsin’s Racine Unified School District and the Racine
Education Association provides specific examples of the issues collectively bargained by
teachers unions and school boards (RUSD, 2009).
• Teachers rights to academic freedom;
• Teachers rights to participate in political activity;
• The right to be suspended with pay if accused of child abuse;
• Tenure;
• Grievance procedures;
• Class size;
• Preparation time;
• Class load;
• Use of Educational Assistants;
• Daily start and end times;
• Chaperoning compensation;
• Student discipline;
• Teacher contracts;

38
• Teacher pay;
• Teacher benefits;
• Procedures for teacher lay-offs;
• Teacher evaluations;
• School calendar;
• Length of school year;
• Parent teacher conferences;
• Lunchroom supervision responsibility;
• Packing days;
• Early retirement provisions;
• Sick leave;
• Leaves of absence;
• Teacher role in developing curriculum; and
• The existence of union bulletin boards.
All of these topics impact the specific manner in which children receive an
education, mainly because they all deal with public education’s most important
employees: Teachers, the front-line bureaucrats that actually teach kids (Lipsky, 2010).
Accordingly, policies and decisions related to teachers are the most important tool that
school boards have to influence student outcomes. The ability for school boards to hire,
strategically place, motivate, reward, and replace teachers is the most important and
obvious school board governance function affected by collective bargaining agreements.
Indeed, a national survey of school board members shows that a majority of
American school board members think the provisions in collectively bargained contracts

39
prevent them from dismissing ineffective teachers (Hess & Meeks, 2011). Significant
numbers of board members also point to contracts as an obstacle to proper teacher
placement and hiring.
The specific states of interest all face some type of general limits on personnel
policies. However, there is some variation. In Utah and Nevada, for example, unions are
required to be district level entities, and in Utah, cannot be favored above other teacher
organizations. In other words, school boards theoretically have more leverage over
unions in these states. In Michigan and Minnesota, teachers unions are strongly
organized at the state level and not limited in law in the same manner as those in Nevada
and Utah.
Wisconsin’s collective bargaining landscape looked much like Michigan and
Minnesota prior to the passage of Wisconsin 2011 Act 10, which limited collective
bargaining for most public employees, including teachers, to base wages (strictly defined
as the total pooled amount spent on teacher compensation). Issues like tenure, pay scales,
benefit contributions, and the other subjects listed from the teachers contract example can
be unilaterally manipulated by school boards in Wisconsin. Meaning, Wisconsin school
boards are unique in regards to personnel policies; they have an incredibly high level of
discretion.
Evaluation
Perhaps nowhere have school boards ceded more local control than the ways in
which they measure student performance. Prior to 1985, the assessment decisions of
school districts were almost universally decided by school boards (Archibald & Ford,
2012). Many school boards in Wisconsin, for example, chose not to administer any

40
standardized tests to their students (Archibald & Ford, 2012). However, the publishing of
A Nation at Risk is generally agreed to have spurred interest in quantitatively measuring
the academic performance of American pupils (Garnder, 1983).
However, it was not until the passage of the 2001 renewal of the Education and
Secondary Education Act, popularly known as No Child Left Behind, that federally
mandated testing began dictating school board assessment policies. Under No Child Left
Behind every student must be tested in reading and math in grades three through eight,
and once in high school. Students must also be tested in science at least three times over
their K-12 careers. The act did not mandate a specific test, meaning states were able to
design or adopt tests at their discretion. However, it did remove any power school boards
had over the most visible way in which they evaluate their students.
More recently all six states of interest have been granted No Child Left Behind
waivers, which shift many of the federal mandates of No Child Left Behind to the states.
However, from the school board’s point-of-view districts still have little power over their
official student evaluation system. But boards are not completely powerless. None of the
six states prohibit the use of additional assessment techniques by school districts. There
are examples of boards in all six states using formative assessments that measure student
achievement several times throughout a school year, test score growth measures, and
alternative assessment indicators like portfolios and graduation rates to measure student
outcomes. So, while school boards may have no flexibility regarding their official state
tests, they do have discretion to use alternative measures of academic output.
Student Quality
41
As will be demonstrated by a series of multi-variate regression analyses in chapter
four, the strongest predictors of K-12 standardized tests scores in all six states are socio-
economic and demographic factors beyond the control of schools. Turning back to the
organizational school district model, the lower the quality of the raw materials the lower
the likely level of profit. If public school boards could choose the students that they
educate, they would logically be expected to obtain higher district level academic
outcomes. In theory, all public school boards have no discretion over who attends their
school. In practice, some have a greater lack of discretion than others.
In Milwaukee, Wisconsin, for example, the local public school district enrolls a
significantly higher percentage of special needs pupils than schools participating in that
city’s fairly large private school voucher and charter programs (Wolf et. al., 2012). The
discrepancy is primarily due to the requirement that the Milwaukee Public Schools must
provide special needs services to pupils. Other school types do not face the same
requirement (Wolf et. al., 2012). Naturally, this causes high-needs students to be
overrepresented in the traditional public school system. Both Florida and Wisconsin
have significant private school voucher programs, and all six states have fairly strong
charter school laws, making it more likely that specific sub-groups of students are
relegated to traditional public schools that can cavalierly be called schools of last resort.
It also must be noted that many school boards oversee selective admission magnet
schools within their districts that offset some of the impact of the sorting that occurs
when non-district schooling options exists. However, these specific cases are less
important for explaining student performance than demonstrating that public school
boards have very little control over the quality of students that attend their district.

42
Assigning a number of one to three to each entry in Table 2.1 (one representing a
low level of discretion, two a medium, and three a high) enables a state-level ranking of
the zones of discretion in which school boards operate. Wisconsin and Utah boards have
the most discretion, followed by Florida and Nevada, with Michigan and Minnesota
facing the most constraints. Another less quantitative way of approaching the issue of
discretionary zones is to divide more specific school board activities into three categories:
1) Things they directly control;
2) Things they indirectly control; and
3) Things they do not control.
What school boards can directly control
Arguably the most important thing school boards can control is the hiring and firing
of a superintendent (Callahan, 1975). A superintendent is the Chief Executive Officer of
a school district and sets the tone of daily operations within the organization (Svara,
1990). Elected school boards approve the search process, the interview process, and
ultimately the contract for a superintendent. Boards also have the power to terminate or
non-renew a superintendent’s contract, making the board relationship with the
superintendent its most prominent way of controlling daily district operations.
School boards also have direct power over the nature of state-level required
policies. The states of interest, for example, require that districts have a policy to deal
with bullying and harassment of students, but it is the board that actually determines the
content of the policy.
In addition school boards in Wisconsin, Michigan, Minnesota, Utah, and Florida
have the power to authorize charter schools. Boards in all six states are able to
43
unilaterally set budget priorities, contract for services, and do an infinite number of
activities not specifically banned or required under state and federal law. This includes
conducting research on the performance of pupils, administering standardized tests that
go beyond what is required in state and federal law, and increasing graduation and/or
promotion requirements.
What boards can indirectly control
The things school boards can control only indirectly include those tied to
enrollment, and those tied to collective bargaining. As described, if school boards want
to spend more, their districts generally need more pupils. Districts obviously can and do
take action to maximize their student enrollment. An example might be the creation of
specialty offerings such as Montessori schools. More broadly, districts may simply try
their best to respond to parental demands to keep enrollment numbers strong.
What Boards Cannot Control
American school boards generally must comply with a long list of state and
federal mandates over which they have no control. Not the least of which is the
aforementioned accountability system mandated by the federal No Child Left Behind
Law. However accountability mandates only scratch the surface. School districts must
follow state guidelines regarding their minimal instruction time, the way in which
medication is administered at the school level, the standards that must be met by subject
area, and any number of specific curricular content requirements.
The discussion of discretionary zones is not meant to give school boards excuses
for poor district performance, but rather to provide context for the chapters that follow.
Jennifer Hochschild (2005) discusses the topic of school board expectations and
44
concludes that no real understanding of what boards can or cannot do exists, making
critiques of the institution misguided, or, at the very least pre-mature. As will be
discussed in the next chapter, school boards do have immense power to influence
academic achievement in their district. But, as illustrated above, the context in which
they operate must be taken into account when evaluating their performance.
More important for the validity of this study, the differences between the
discretionary zones of school boards in different states provide the framework for fruitful
comparative analyses. Consider, for example, the differences between personnel polices
in Wisconsin and Minnesota. If Minnesota and Wisconsin board members generally feel
they have similar levels of control over their staffing policies, the upheaval caused by
Wisconsin’s collective bargaining reforms should be seriously questioned. Similarly, if
the slightly more permissive revenue generating capacity of school boards in Utah and
Nevada can be linked to better overall board governance, it may mean loosening revenue
caps in other states is wise policy. At the very least, this exercise establishes that school
boards operate in a constricted, but not uniformly so, environment. Given this, future
chapters must account for different discretionary zones when making general
conclusions.
Conclusions
The preceding chapter proposes a new way of understanding the roles, tasks, and
capabilities of American school boards. Specifically, I argue that existing analyses of
school board performance focus on minute non-transferable details rather than the
commonalities that exist between all school boards. Most importantly, this chapter
defines the role of the American school board as maximizing student achievement
45
outcomes. This role is defined as such out of necessity. Consider, other administrative
arrangements including mayoral control, decentralized voucher and charters systems, and
state takeovers of school districts adequately demonstrate that other non-democratic
intuitions are capable of executing the administrative task of delivering a publicly funded
education. In fact, many have argued that these alternative structures have done more
than simply demonstrate they can deliver public education, but that they can deliver it
more efficiently than school boards (Viteritti, 2009; Wong et. al., 2007; Wong & Shen,
2003). If this is true, why must school boards survive?
Well, for one, to serve the nearly 50 million students attending district run schools.
Changing the administrative structure by which the vast majority of American students
receive an education might make sense if improved outcomes were promised, but the
existing research on alternative structures like mayoral control, vouchers, and charter
schools is underwhelming. Under very specific circumstances all three alternative have
shown the ability to create marginal improvements in outcomes, but nothing nearly
substantial enough to offset the upheaval caused by eliminating 14,000 bastions of local
democracy.
Most importantly, there is convincing evidence that school boards can better fulfill
the role of maximizing student performance through improved governance (Delagardelle,
2008). This chapter argues part of fulfilling the potential of school board governance is
understanding that the tasks of school boards sit on a specific to broad continuum, and
will and should vary across different school boards. Together, the tasks performed by
boards can be described as a single task of governance; or, the public administration of a
school district.
46
This chapter also establishes a simple organizational school district model which
explains the process which school boards oversee; that of taking raw materials (students)
and turning them into measurable profit (academic output). Finally, I establish that
school districts operate within different discretionary zones based on the state and federal
policy environments in which they operate, thus creating a framework for comparative
analyses.
The next chapter will go into the black box of school board governance in order to
demystify the link between school board governance and academic outcomes. Chapters
four through seven are data driven, giving a deep understanding of the states of interest,
and testing of the formal hypotheses listed in chapter one. Chapter eight looks at the
special case of public charter schools, providing greater understanding of one of the
alternative structures discussed in this chapter.

47
Chapter III. How School Board Governance Impacts District Performance: A Theoretical Model
The connection between governance and organizational performance is not a
common sense connection. Boards in the for-profit, non-profit, and government sectors
can all have varying degrees of engagement with the organization they are charged with
overseeing. The connection between school board governance and school district
outcomes is arguably even less inherent given the limitations on school board action, and
the lack of a clear set of specific tasks, as explained in the preceding chapter. But even
with the discussed limitations there is good reason to think school boards can and do
impact student outcomes. No, school board members do not directly educate students,
but they do govern the entire process, and do influence the results of this process. The
following chapter will explain exactly how.
Specifically, this chapter will argue that school board governance activities can be
split up in to two different groups. One, the things school boards must do to create the
necessary pre-conditions for their districts to deliver a quality education; or to borrow
from Frederick Herzberg, hygiene factors (Herzberg et. al., 1993). And two, the
activities within the black box of governance that actually determine the quality of
education provided by a school district. The hygiene factors generally can be directly
manipulated by school board action. The inside the black box activities often cannot,
and, as important, the actions necessary to manipulate them indirectly are situation
dependent.
This chapter will be organized as follows:
• First, a discussion of what is meant by the term governance;
48
• Second, a review of the limited scholarship demonstrating the linkages connecting
school board governance and academic output;
• Three, a review and discussion of hygiene factors in school districts;
• Fourth, a look at situation dependent black box factors in school districts; and
• Fifth, a review of how small group dynamics can influence the black box factors.
By the end of the chapter the reader should have a clear understanding of why
school board governance can be expected to impact academic achievement, and how the
forthcoming quantitative models will allow for an evaluation of how school boards are in
fact, influencing academic outcomes.
What is Governance?
The role of governance in any organization can easily be taken for granted. After
all, employees are the ones doing the daily business of an organization, and managers are
the ones directly responsible for overseeing employees. When an organization fails to
produce results it is the employees or management that most often face the blame.
Boards of directors usually only receive attention in cases of malfeasance, not cases of
underperformance.
Implicit in this reality is the idea that boards of directors serve a guarantor
function. Increasingly, however, the historic role of governance is being challenged.
John Carver, for example, argues in Boards that Make a Difference that governing boards
can increase organizational performance by focusing on setting broad policy goals,
creating and adhering to strict policies on how the board operates, placing clear limits on
executive authority, not communicating directly with staff, establishing clear
expectations for staff, and holding staff accountable for performance (Carver, 2006).
49
Though Carver’s ideas have had mixed results when actually implemented, his policy
governance model did increase mainstream acceptance of the idea that governing boards
can increase organizational performance.
But what exactly is governance? How does a board go about improving the
performance of an organization? Political Scientist James Svara offers a model for
understanding governance by defining a process consisting of four dimensions (Svara,
1990). The first three dimensions; mission, policy, and administration, are the
responsibility of a governing board. The fourth dimension, management, is influenced by
the governing board but is not their direct responsibility. Accordingly, governance can
be described as the process by which a governing board determines an organization’s
mission, policies, and administration activities.
Mission
Mission is the reason an organization exists. The model presented in chapter two
suggests the role of school boards, the primary reason they exist, is to maximize
academic output. Governing boards in general determine their organization’s mission by
outlining its primary goals. Failing to do so is a primary reason that boards fail (Smoley
Jr, 1999).
Policy
Broadly, policy is the tools and methods a board uses to execute its mission. A
major example of a policy initiative in the Svara framework is the budgeting process.
The way a board allocates limited funds can advance or inhibit the district’s mission.
Another example is the creation of specific programming such as professional

50
development for employees. An obvious wat that boards can fail in executing their
mission is by making policy decisions that do not align with their primary goals.
Administration
Administration is the way boards go about implementing their policies. For
example, say a school board decides to create a new classroom for disruptive students.
The policy idea is in place and budgeted, but someone needs to decide where the
classroom is placed, what constitutes a disruptive student, and the process by which a
student is actually moved into the classroom. All of these tasks are part of
administration.
Management
Management is the fourth element of the governmental process and the only one
beyond the direct control of a governing board. Once a board creates and implements a
program aligned to its mission someone needs to oversee the day-to-day execution of the
program, and give feedback to the board as to its success. Management in a school
district is the job of superintendents, principals, teachers, and other administrative staff.
Drawing from Svara, a simple satisfying definition of governance is:
The ways in which a board collectively determines, and oversees the execution of, an organization’s mission. A less satisfying, circular, but perhaps more realistic definition of governance is:
The things boards do. The former definition assumes a certain level of board
competence, the latter definition encompasses everything a board does or does not do. In
other words, a derelict board, under the first definition, might be described as one that is
not governing at all. Under the second definition, a derelict boards would be one that is
51
governing poorly. For the purposes of this study the latter definition of governance will
be used.
Why? Under the organizational school district model presented in chapter two
school boards seek to maximize the academic output of the raw materials, or students,
their organization receives. If a school district receives high quality students, maximizing
their output may be as simple as staying out of the way. In other words, a board may
seek to do very little in order to maintain a quality status quo. This absence of action, if
academic output is maximized, is effective school board governance.
The preceding discussion of governance was necessarily abstract. It provides a
general idea of what governance is, and how it interacts with the employees actually
executing the mission of an organization. The next section will specifically explain why
school board governance can impact school district academic outcomes.
The Importance of School Board Governance
The practitioner literature on school board governance offers no small number of
prescriptions for improved governance, taking for granted that governance is important.
The National School Boards Association (NSBA), for example, publishes a framework
consisting of eight different areas where boards are advised to focus their work. The Key
Work of School Boards, as the NSBA dubs them, are not research based, but do offer
board members an overview of how successful school boards should be approaching their
task (Gemberling et. al., 2000). The eight keys along with descriptive questions are:
1. Vision – Where does the board want the district to go?
2. Standards – Against what should student performance be measured?
52
3. Assessment – How should performance against agreed upon standards be
measured?
4. Accountability – Who does the board hold responsible for student outcomes, and
how?
5. Alignment – Are limited resources allocated in ways that aid achievement?
6. Climate and Culture – Is everything the district does focused on meeting its
vision?
7. Collaboration and Community Engagement – Who are the outside stakeholders
and how does the district interact with them?
8. Continuous Improvement – Does the board make informed decisions to keep
outcomes moving in the right direction.
A hypothetical exercise that digs deeper into these eight areas provides some insight
into how addressing them might impact academic achievement.
Vision
A passive board may point to a vague long-standing strategic plan as evidence
that they are executing a clear vision. However, board turnover and changing academic
realities demand continuous attention be paid to the district’s vision. An active board
may engage in formal strategic planning after each election, work with an outside
consultant to aid in determining vision, and work to obtain community buy-in of their
stated vision.
Standards
A passive board will merely use state and federal standards without discussion. An
active board will determine how existing standards align with their long-term vision, and
53
consider academic standards that go beyond existing standards and/or are more
specifically tailored to the needs of their students.
Assessment
Assessment is another area boards can choose to ignore by assuming state and
federal testing mandates are serving their students well. Many districts across the
country, however, have adopted value-added assessment models and mid-year
benchmark testing to use assessment as a tool for informing classroom instruction. An
action-oriented board will at the very least explore a variety of assessment strategies that
serve their ultimate aims.
Accountability
Again, a passive board may accept that state and federal accountability policy is
sufficient for their students’ needs. The wide range of performance in districts, as will be
illustrated in the next chapter, however, demonstrates that the state and federal
accountability framework does not guarantee positive outcomes. An active board will
fully engage the issue of accountability by setting clear goals for students, schools,
principals, and teachers, and take appropriate actions when goals are not realized.
Alignment
A passive board will take any additional revenue and simply fund every school
district department at a slightly higher rate than the previous year. An active board will
understand exactly where each dollar is going, evaluate both the usefulness and
efficiency of each department as it relates to executing its vision, and annually realign
resources based its evaluations.
Climate and Culture
54
A school board could easily examine quantitative data on police calls to schools, or
expulsions and suspensions and conclude that their schools are safe and orderly. An
active board would go deeper and engage parents, students, and staff to determine how
welcoming their schools actually are. The Wisconsin Department of Public Instruction,
for example, creates model school climate surveys to aid districts interested in
understanding how stakeholders view their schools. A high-functioning board would go
even further and work to build and improve school cultures through formal engagement
with teachers and principals.
Collaboration and Community Engagement
A passive school board may view school board elections and/or annual meetings
as the sole necessary forms of community engagement. An active board would offer
open houses for parents and non-parents alike, have a presence at community events, and
seek partners in the business and non-profit communities with a shared interest in K-12
education.
Continuous Improvement
A passive board finds the most recent piece of positive achievement data and uses
it to argue that its schools are moving in the right direction. An active board would call
attention to indicators that show the district could further improve student outcomes.
More importantly, an engaged board would use information not to defend or criticize the
district, but to inform personnel and policy decisions.
The preceding discussion is merely hypothetical and of little import absent
evidence that school boards can influence academic achievement. But, such evidence
has relatively recently come to light. The Iowa School Board Foundation’s Lighthouse

55
Inquiry was the first major study showing that school board governance in particular has
the capacity to influence student outcomes (Rice, et al., 2000; Delagardelle, 2008). The
inquiry began in 1998 with ethnographic case studies of school districts in southern states
with similar demographics but vastly different levels of student performance. The case
studies revealed that higher-achieving districts demonstrated common governance
behaviors that contrasted with governance behavior in low-achieving districts. For
example, board members in generally high achieving districts did not make excuses for
low achieving students. Board members in generally low-achieving districts consistently
blamed outside forces such as poverty and the poaching of good students by private
schools. In high achieving districts both school leaders and school board members
expressed common goals and unity of purpose. Low achieving districts did not.
Overall, high achieving districts were also more likely to have in place what the
project researchers called conditions for productive change:
1. Connections across the system;
2. Knowing what it takes to change achievement;
3. Workplace support;
4. Professional development;
5. A balance between district wide direction and building-level autonomy;
6. A strong community connection; and
7. Distributed leadership.
The Lighthouse Inquiry concluded that boards can help in establishing the
processes that create conditions for productive change, which in turn impact the teaching
and learning environment throughout the school district, and, in turn, impact the learning
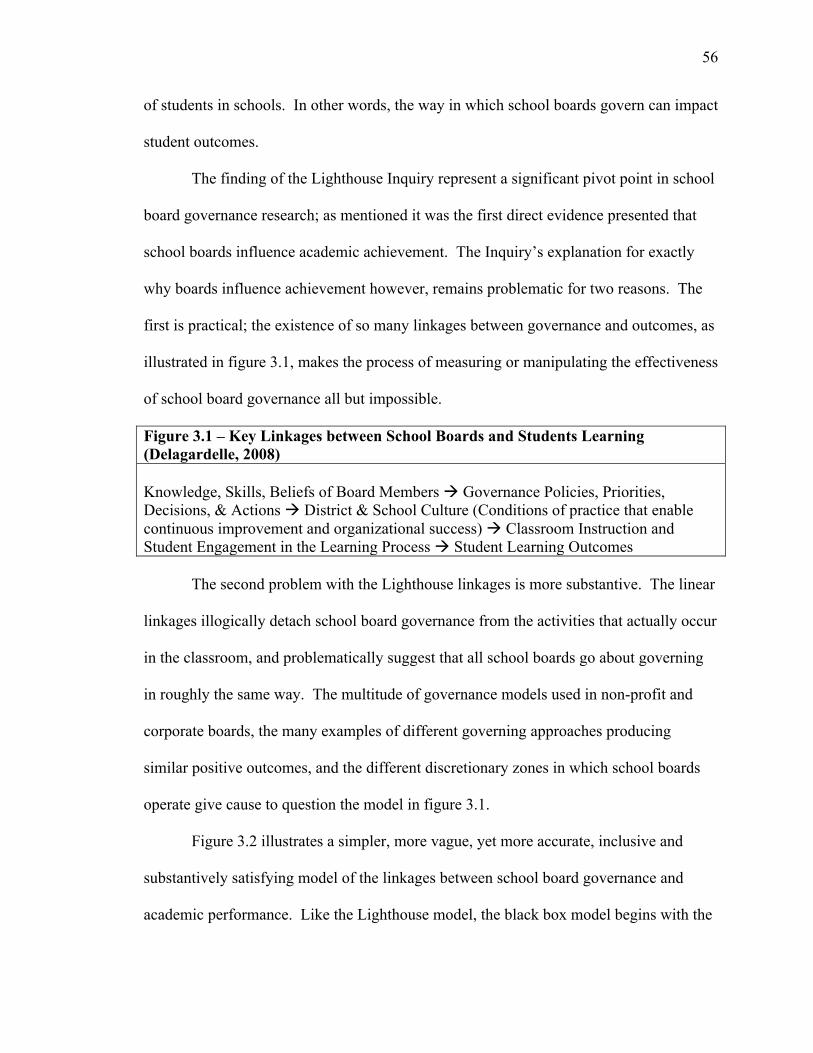
56
of students in schools. In other words, the way in which school boards govern can impact
student outcomes.
The finding of the Lighthouse Inquiry represent a significant pivot point in school
board governance research; as mentioned it was the first direct evidence presented that
school boards influence academic achievement. The Inquiry’s explanation for exactly
why boards influence achievement however, remains problematic for two reasons. The
first is practical; the existence of so many linkages between governance and outcomes, as
illustrated in figure 3.1, makes the process of measuring or manipulating the effectiveness
of school board governance all but impossible.
Figure 3.1 – Key Linkages between School Boards and Students Learning (Delagardelle, 2008) Knowledge, Skills, Beliefs of Board Members Governance Policies, Priorities, Decisions, & Actions District & School Culture (Conditions of practice that enable continuous improvement and organizational success) Classroom Instruction and Student Engagement in the Learning Process Student Learning Outcomes The second problem with the Lighthouse linkages is more substantive. The linear
linkages illogically detach school board governance from the activities that actually occur
in the classroom, and problematically suggest that all school boards go about governing
in roughly the same way. The multitude of governance models used in non-profit and
corporate boards, the many examples of different governing approaches producing
similar positive outcomes, and the different discretionary zones in which school boards
operate give cause to question the model in figure 3.1.
Figure 3.2 illustrates a simpler, more vague, yet more accurate, inclusive and
substantively satisfying model of the linkages between school board governance and
academic performance. Like the Lighthouse model, the black box model begins with the

57
background characteristics of school board members. There is good reason to suspect
that school board members do not enter the action of governance with a blank slate.
Deckman (2007), for example, finds basic differences in the reasons men and women run
for school board. Melissa Marschall (2005) finds that minority representation on school
boards influence the level of satisfaction minority parents have with their schools. Hess
& Meeks (2010) find broad ideological diversity across American school boards, and
Flinchbaugh (1993) finds that the operations of a school board reflect the qualities of
their members. Clearly, what board members believe and what they have a proclivity to
do influence what they actually do. Similarly, the policy environment in which they
operate logically influences their governance behavior. For example, a school board
member in Michigan, where the board has no say in setting their local tax levy, cannot
work to change their local tax levy.
Figure 3.2 – Black Box Model of School Board Governance
Briefly establishing that the backgrounds of school board members is relevant
leads first to the relatively simple discussion of hygiene factors, and then to the far more
difficult and important question: What is in the black box?
School District Hygiene Factors
Background of Board Members
Zones of Discretion
Black Box of Governance
Hygiene Factors
Academic Outcomes

58
The concept of hygiene factors is borrowed from Frederick Herzberg. Herzberg
was a member of the human relations school of organizational theory. Members of the
school, among other things, believe worker satisfaction is a key component in increased
job performance (Herzberg, et. al., 1993). In his book, The Motivation to Work, Herzberg
concludes that workplace satisfaction and dissatisfaction are two distinct concepts. In
other words, the opposite of satisfaction is not dissatisfaction, but rather a lack of
satisfaction. Motivation-Hygiene theory, as Herzberg deemed it, explains hygiene
factors, including things like work conditions and employee supervision polices, as those
factors that when properly manipulated by management at best eliminate dissatisfaction.
I adapt this basic concept to school board governance by arguing that there exists
a set of basic school board responsibilities that are necessary functions of boards, but do
not actually directly influence the academic outcomes of children. Examples of this
include facilities, social services such as providing meals for low-income pupils, and
even total levels of spending. All of these things are tasks school boards must do, but no
matter how well they execute them the maximum impact will not increase student
performance.
A quantitative illustration using pooled data from the six states of interest helps
illustrate the lack of connection between a prominent hygiene factor - per-pupil revenue -
and performance.
Hypothesis
Districts with higher levels of total revenue have higher graduation rates
Data

59
Descriptive data for the variables in Figure 3.3 are from a pooled data set
consisting of information from the National Center for Education Statistics. The
independent variable, revenue per-student, is the total amount of state, local, and federal
funding per-pupil school districts received in 2008-09. The dependent variable,
graduation rates, is a common indicator of the percentage of freshmen entering a high
school that graduated four years later in 2008-09.
The other variables listed in table 3.1 are control variables generally agreed to be
non-school influences on academic performance (Hanushek, 1997). This includes the
percentage of total district enrollment that is a member of a minority group, the
percentage of total district enrollment that is eligible for the federal free and reduced
lunch price program (a means-tested program that indicates the percentage of a district
with household incomes at or below 185% of the federal poverty level), the percentage of
students eligible for special needs services by virtue of having an individual education
plan, the district-wide student to teacher ratio, and the amount of funding spent on district
employee salaries per-pupil.
Table 3.1 – Education Variables for All School Districts in Wisconsin, Minnesota, Michigan, Utah, Florida, and Nevada - 2009
Variable N Mean Standard Deviation
Graduation Rate 1312 85.3 12.5 Total Revenue Per-Student 1435 11836.2 3653.3 Percent Minority 1432 16.9 18.7 Percent Low-Income 1432 41.5 17.5 Percent Special Needs 1432 14.1 4.0 Student-Teacher Ratio 1432 15.9 3.17 Salary Per-Student 1435 5642 1221.1
Source: National Center for Education Statistics
Results and Discussion
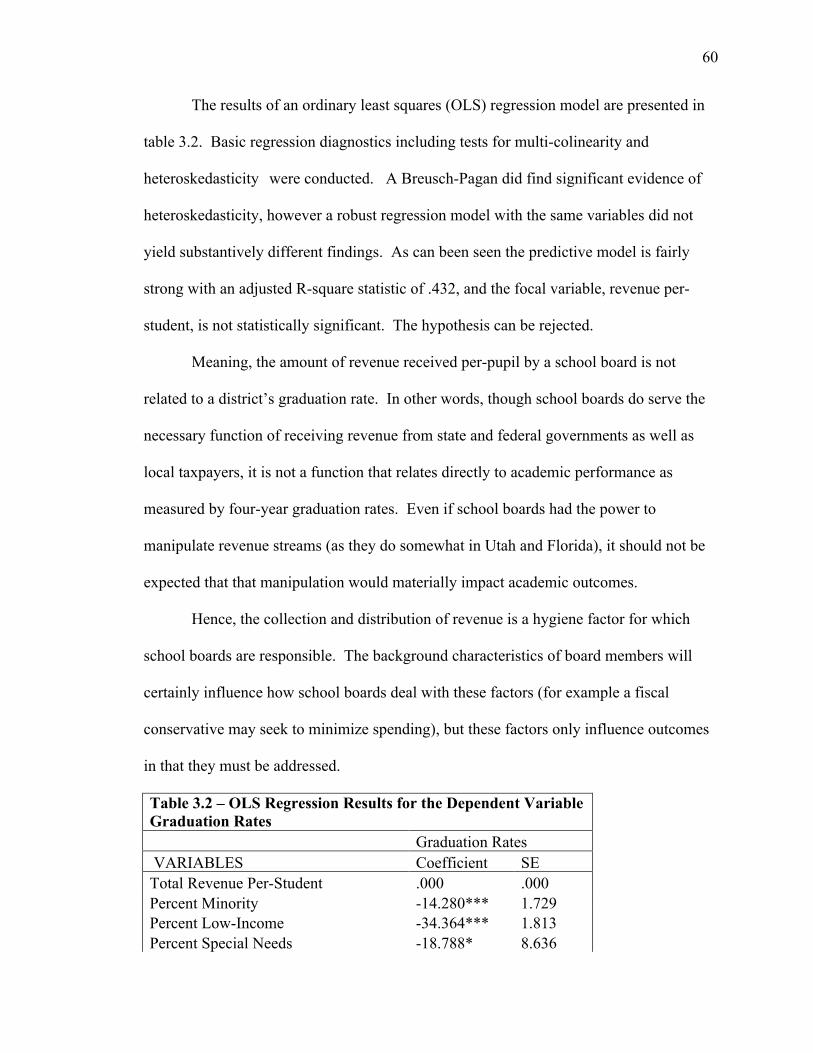
60
The results of an ordinary least squares (OLS) regression model are presented in
table 3.2. Basic regression diagnostics including tests for multi-colinearity and
heteroskedasticity were conducted. A Breusch-Pagan did find significant evidence of
heteroskedasticity, however a robust regression model with the same variables did not
yield substantively different findings. As can been seen the predictive model is fairly
strong with an adjusted R-square statistic of .432, and the focal variable, revenue per-
student, is not statistically significant. The hypothesis can be rejected.
Meaning, the amount of revenue received per-pupil by a school board is not
related to a district’s graduation rate. In other words, though school boards do serve the
necessary function of receiving revenue from state and federal governments as well as
local taxpayers, it is not a function that relates directly to academic performance as
measured by four-year graduation rates. Even if school boards had the power to
manipulate revenue streams (as they do somewhat in Utah and Florida), it should not be
expected that that manipulation would materially impact academic outcomes.
Hence, the collection and distribution of revenue is a hygiene factor for which
school boards are responsible. The background characteristics of board members will
certainly influence how school boards deal with these factors (for example a fiscal
conservative may seek to minimize spending), but these factors only influence outcomes
in that they must be addressed.
Table 3.2 – OLS Regression Results for the Dependent Variable Graduation Rates
Graduation Rates
VARIABLES Coefficient SE Total Revenue Per-Student .000 .000 Percent Minority -14.280*** 1.729 Percent Low-Income -34.364*** 1.813 Percent Special Needs -18.788* 8.636

61
Student-Teacher Ratio -.400** .118 Salary Per-Student .000 .000
Constant 107.569 3.797 Adjusted R2 .432
Observations 1308 *p<.05 **p<.01 ***p<.001
Inside the Black Box of Governance
The simplest explanation of what goes on inside the black box of governance is
the setting of school and district culture. The culture of an organization in general has
been described as the values and norms that guide its operations. School districts and the
individual schools within it specifically have been described as reflections of the policies
enacted by the school board (Flinchbaugh, 1993; Schein, 1987). More directly, the
setting of district policies that build high achieving school cultures should result in high
academic success. It is a straightforward concept that is beset by a major problem. There
is no single way to set a successful district culture, the steps for doing so are situation
dependent and only become clear when academic output is measured. Broadly, what
goes on inside the black box of governance can be described as the setting of
expectations, and the manipulation of factors to meet those expectations.
Though the broad concept is vague, the actual processes that occur within the
black box of governance are specific. The first major process is the setting of
expectations and the means by which to measure them. As clearly demonstrated in the
practitioner and academic school board literature, a board most have a vision for where it
wants its district to go before it can go about the task of moving it there (Flinchbaugh,
1993; Smoley, 1999; Gemberling et. al., 2000; Hochschild, 2005; Callahan, 1975;
Delagardelle, 2008).

62
Second, a district must have a clear way to measure progress towards its vision.
For example, if a board seeks to increase the number of its pupils that are college ready, it
would likely use ACT or SAT scores as indicators of progress towards that mission. In
contrast, if a board seeks to bring struggling students up to grade level, student growth
scores would be one way to measure progress.
It is important to differentiate between the role of a school board, previously
defined as maximizing student outcomes, and the vision of an organization, which is a
situation dependent goal or expectation of where a district is going. The vision of a board
is an operational concept, or, a way to go about maximizing student academic output.
Measuring progress towards a vision is a tool deployed by districts to better realize and
tweak approaches to better work towards realization of that vision. Measuring whether
and explaining why a board is fulfilling its role is not an operational concept, it is an
outside evaluation process reliant on student test scores and other academic indicators
such as graduation rates.
The second major action inside the black box is the setting of situation dependent
district-wide policies in the topic areas known to impact academic achievement. Though
not an exhaustive list, there are numerous areas where scholarly research shows district
wide policies can impact overall academic output.
Teacher Quality
Perhaps the most obvious factor influencing student learning in a classroom is the
quality of the teacher. Chetty et. al. (2011) reviewed two decades worth of data linking
outcomes to teacher quality in an urban school district and found that a highly qualified
teacher can lead to significant test score gains, as well as significantly better lifetime

63
earnings for students. The challenge a school district faces is how to go about
maximizing teacher quality. Research included in the National Center for Education
Statistics Institute of Education Sciences’ What Works Clearinghouse provides many
examples of how a school board might go about this, from introducing incentive plans, to
improved mentoring (Winters et. al., 2012; Glazerman & Seifullah, 2012). However,
both the policy environments of school boards as well as the current level of teacher
quality will dictate what a school board should do. Actually improving teacher quality in
a specific district requires a school board policy that fits with the unique needs of that
district.
Curriculum and Subject Time
What is taught obviously matters as well. School boards, though checked by state
requirements, do have plenty of leeway in deciding what textbooks and curricula are used
in their district. School boards also have the power to emphasize, above the amounts
required by state laws, instruction in specific subject areas of need. There exists no
shortage of academic research on the best way to teach core subjects like math and
reading to specific groups and sub-groups of pupils. School boards have great power to
influence academic outcomes simply be choosing what, how long, and in what manner
specific subjects are taught.
Discipline
How should a school district deal with behavior problems? Fabiano et. al. (2010)
find that the use of a daily behavior report card for problem elementary pupils
significantly improved behavior. Still other studies show that zero tolerance policies that
remove troubled students from the classroom are favored by many school districts (Skiba

64
& Peterson, 2000). The approach a board takes will likely be guided by the extent of its
discipline issues, and the community’s values. What is clear is that school boards face a
situation dependent choice.
Student Specific Interventions
What should a school district do with individual students who are not responding
to the regular curriculum? Some school boards create alternative schools, other turn to
hybrid education approaches that allow self-guided online learning, still others use
federal funds to pay for one-on-one instruction for certain pupils (Christensen et. al.,
2008). Whether a school district uses one or more of these approaches, whether they
delegate the decisions to principals, or whether it forgoes individual interventions are all
board level decisions that will impact the educational quality of the school district.
The preceding exercise was meant to show that school boards must make a
multitude of choices in order to answer the many questions that relate directly to
classroom instruction, yet have no single best answer. There are countless other
governance decisions that school boards must make inside that black box that are
situation dependent; what will work and/or be accepted by staff and students in one
school district may be rejected and not work in another district. It follows that the
decisions made inside the black box of governance need not just be made. They must be
made correctly (Or, at least as correctly as possible).
How can a board ensure the correct governance decisions are made? This
question sets up the final section of this chapter, which focuses on how school boards go
about making governance decisions, and how they can go about maximizing the positive
academic impact of those governance decisions.

65
The Role of Small Group Dynamics In School Board Governance
In its simplest form a school board is nothing more than a group people that
regularly gather to make decisions. The process by which they make decisions is dictated
in part by parliamentary rules and the structure of their boards, but much of the way in
which a school board makes decisions is dependent on the different personalities, formal
and informal roles, goals, biases, ambitions, conflicts and other attributes present in board
members’ group interactions. Given the discussion in the previous section of the
situation dependent nature of school board governance decisions that affect academic
outcomes, the small group dynamics present in a school board should be expected to
dictate the quality of key governance decision. Simply, a high functioning group is more
likely to make good constructive decisions, and a low-functioning group is more likely to
make poor destructive decisions. Accordingly, understanding the way in which school
board members make decisions is as important as the specific decisions they make. Later
chapters of this study present detailed data culled from surveys of school board members
in the six states of interest, but first a basic understanding of school group dynamics is
necessary.
John Carver (1997) demonstrates that there are key recognizable differences
between high-functioning and low-functioning small groups serving on boards. Carver
identifies over-dependence on organizational staff, unclear executive authority, the
failure to respond appropriately to problems, and the overuse of committees as clear
signals that a board is dysfunctional. Public Administration professor and local
government consultant Gerald T. Gabris (2006) sheds greater light into how the
interactions of government board members can inhibit or enhance organizational

66
performance. Gabris developed a diagnostic chart used to evaluate the level of
dysfunction on a local government board. He finds that dysfunctional boards are not
driven by consensus, have a short term planning horizon, lack shared values, conflict with
staff, hold stressful meetings, lack trust, and pursue vague goals. High functioning
boards exhibit exactly the opposite traits, they:
• Think long term;
• Share common goals and values;
• Get along with staff and the CEO;
• Have collegial relations with other board members;
• Trust other board members; and
• Engage in planning.
Other scholars identify many of the counter-productive traps that small-groups
fall into when interacting. Paul ’t Hart (1994), for example, argues that the positive
attribute of cohesiveness among a small government group can degrade into a destructive
state of groupthink, leading to policy failure. The typical signs of groupthink in
government are a sense of moral superiority, a devaluing of the seriousness or legitimacy
of opposing views, creation and demonization of an identifiable out-group, and a closed
circle of communication. A possible consequence of groupthink on a school board would
be a lack of situational awareness leading to the adoption of favored policies that are in
fact a poor fit with the needs of a school district.
Less specific than groupthink but just as important a concept in small group
dynamics is conflict. Conflict in any small group is natural and can actually be a
constructive way for a group to relieve tension (Coser, 1956). However, conflict can also

67
manifest in destructive ways, becoming so entrenched that it prevents basic board
activities (Deutsch, 1973). Karen Jehn (1997) provides a helpful framework in which to
study small group conflict. Her qualitative work identifies three specific types of conflict
in small groups.
The first, relationship conflict, refers to conflict that occurs because individual
board members simply do not get along. An expected consequence of relationship
conflict is a lack of productivity caused by time and energy wasted on issues irrelevant to
board business. In addition, personal conflict between board members is likely to raise
the stress level in a board meeting, an indicator of a low-functioning group.
The second type of conflict identified by Jehn is task conflict. A hypothetical
example of task conflict on a school board is disagreement over the proper way to assess
teacher quality. Unlike relationship conflict, task conflict can theoretically be productive
as it presumably leads to an eventual resolution. However, the resolution of task conflict
without board unity could in fact be a sign of a dysfunctional board (Smoley Jr, 1999).
The third type of conflict identified by Jehn is process conflict. This is conflict
regarding the way in which a small group conducts its business. On a school board,
process conflict might surface as a disagreement over which committee is to first evaluate
a potential policy change, or whether a public hearing is necessary prior to passage of a
major policy change.
Another dynamic present in small groups is cooperation. Kimberly Nelson and
Karl Nollenberger (2011) find that the structure of local government boards, including
the presence of citywide seats, can actually increase the level of cooperation on a board.
Many of the attributes of a high functioning board relate directly to the presence of a

68
high-level of cooperation, meaning the ability for the structure of boards to increase this
positive attribute is a significant finding.
The survey developed and deployed for this study focuses on the concepts of
small group dynamics in order to test the connection between the way in which a
governing board goes about its activities, and the overall performance of the organization.
It also asks specific questions regarding the NSBA’s eight key works of school board
governance to determine if these are the factors that boards should in fact be focusing on
to improve student achievement. There is substantial overlap between the qualities of
high-functioning small groups, listed previously in this section, and the NSBA’s keys,
giving reasons to think that school boards adhering to the eight keys are also seeing
academic benefit in their districts.
Conclusion
The preceding chapter establishes a basis for the testing of specific hypotheses on
the relationship between school board governance and academic outcomes in school
districts in Michigan, Minnesota, Wisconsin, Florida, Utah, and Nevada. First, I
reviewed existing scholarly research on public-sector governance to come up with a
simple working definition of governance: The things boards do. The discussion is critical
in that it establishes a basic all-encompassing starting point from which to approach more
specific study of school boards.
Second, the chapter reviewed the Lighthouse Inquiry, the first academic study to
provide direct evidence that school board governance can and does impact the academic
outcomes of a school district. I also reviewed the dominant best practice
recommendations used by American school boards, and critiqued the Lighthouse Inquiry

69
model identifying the linkages between school board governance and academic output as
too specific and narrow to explain the diversity of ways in which school boards can
govern successfully. I propose an alternative model that considers the backgrounds of
board members, but divides the actual governance activities into two categories, hygiene
factors, and black box factors.
Third, I explain what is meant by hygiene factors, as well as the origins of the
concept within the human relations school of Public Administration. Hygiene factors in
the proposed model are those that are necessary for the operations of school districts, but
cannot be manipulated in order to improve academic outcomes. School boards are
necessarily responsible for these factors. As an example I presented the results of a
multi-variate regression analysis testing the hypothesis that per-pupil revenue positively
impacts graduation rates in the six states of interest. The lack of a relationship confirms
that funding activities, though a responsibility of school boards, should not be expected to
improve graduation rates.
Fourth, I explain what is contained in the black box of school board governance.
Plainly, the vast array of situation dependent decisions made by school boards that impact
the academic outcomes of school districts fit into this category. Reviewing research in
the areas of teacher quality, discipline, curriculum, assessment, and student-level
intervention reveals that many board actions can improve academic outcomes, however it
is knowing when to make the right decision that ultimately leads to improved academic
outcomes.
The final section of Chapter Three uses the discussion of black box governance
factors as a foundation from which to propose that the dynamics of small groups plays a
70
role in whether school boards will make good decisions within the black box. Research
on small group dynamics in non-profit and other government boards is reviewed to
demonstrate what exactly is meant by small group dynamics.
The following chapters will build off of the mostly theoretical construct presented
thus far by first reviewing a large amount of academic performance and demographic
data on school districts in the six states of interest, and then using survey responses of
board members to test the specific hypotheses listed in Chapter one. The review of
existing school board research in Chapter one, the establishment of the existence of
discretionary zones in which school boards operate in Chapter two, and the presenting of
the theoretical justifications for testing the extent to which school board governance
affects school district outcomes lead into the main topic of Chapter four: The data.
71
Chapter IV. Characteristics of and Comparisons Between Education Systems in Florida,
Nevada, Utah, Michigan, Minnesota, and Wisconsin
The preceding chapter introduces a theoretical model that gives plausible reason
to suspect that school board governance is a key determinant of school district academic
outcomes. This chapter will use archival data to strengthen the case for looking closer at
school board member behavior by testing two hypotheses that justify the two-group
comparative analyses method deployed in this study:
Hypothesis 1: There are significant differences in the make-up of school districts in
the two groups of states.
Hypothesis 2: The major predictors of academic outcomes are similar across the six
states of interest.
Both of the hypotheses are tested using archival data, which are described in
detail, thereby presenting a detailed portrait of the education systems in all six states.
More important, establishing that school districts in the two groups of states are
substantially different both in structure and student population, yet share common
predictors of academic performance, supports the use of the situation dependent decision
making model of school board governance described in Chapter three. Why? Variations
in achievement cannot plausibly be explained away by state-to-state differences, allowing
the actions collectively known as governance to be tested as the source for variation in
achievement.
The first hypothesis is tested using a series of difference of means tests that
establish the various differences between the school districts in the two groups of states
that serve as the basis for the comparative case-study analysis. In total, there are 1,437
72
school districts in the six states of interest: 125 in Florida, Nevada, and Utah, and 1,312
in Michigan, Minnesota, and Wisconsin.
Group-to-Group Differences
The following section is guided by the research question: Are there substantial
differences in the district level education systems in the two groups of states? I
hypothesize that there are substantial differences. All the data used in the following
difference of means tests is archival, and publicly available from the National Center for
Education Statistics (NCES) common core database (USDOE, 2012). The variables are
divided into four categories, and explained in the subsections below.
Structural Variables
The structural variables are those that deal with the size and scope of school
districts. The variables are:
• Enrollment – The number of students enrolled in the school district in the 2010-
2011 school year;
• Number of schools – The number of schools serving students in each school
district in the 2010-11 school year;
• Percentage of charter schools – The number of schools authorized by and
operating in the district divided by the total number of schools in the district in the
2010-2011 school year; and
• Student teacher ratio – Total district enrollment divided by the number of district
teachers in the 2010-2011 school year.
Demographic Variables
73
The demographic variables consist of the student racial, socioeconomic, and
gender make-up of students served by, and the community wealth of residents living in, a
school district. The variables are:
• Percent male – The total percentage of district students that are male in the 2010-
2011 school year;
• Percent Black – The total percentage of district students that are African-
American in the 2010-2011 school year;
• Percent White – The total percentage of district students that are white in the
2010-2011 school year;
• Percent Hispanic – The total percentage of district students that are Hispanic in
the 2010-2011 school year;
• Percent non-White – The total percentage of district students that are minority in
the 2010-2011 school year;
• Percent eligible for federal free or reduced price lunch – The total percentage of
district students that qualified for the federal free and reduced lunch program in
the 2010-2011 school year. Eligibility is a proxy for low-income because
program eligibility is limited to students from families with incomes at or below
185% of the federal poverty level;
• Percent English Language Learners (ELL) - The total percentage of district
students “who were not born in the United States or whose native languages are
languages other than English” in the 2010-2011 school year (USDOE, 2012);
• Percent with Individualized Education Plans (IEP) – The total percentage of
district students with IEPs in the 2010-2011 school year. Students with special
74
needs are given IEPs, hence the variables serves as a proxy for often higher cost
special needs pupils; and
• Per-capita community income – Data from the 2000 United States census on the
average per-capita income of households served by the school district.
Fiscal Variables
The fiscal variables all relate to the amount of public revenue received by the
school district from various sources. The variables are:
• Revenue per-student – The total amount of public revenues received by the school
district in 2008-2009 divided by the district’s student enrollment;
• Local revenue per-student - The total amount of local public revenues received by
the school district in 2008-2009 divided by the district’s student enrollment.
Local revenues are generally from local property, sales, and excise taxes;
• State revenue per-student - The total amount of state revenues received by the
school district in 2008-2009 divided by the district’s student enrollment. State
revenues are generally those sent to the school district through the state’s
education funding formula, and through program-specific categorical aid
allocations; and
• Federal revenue per-student - The total amount of public federal revenues
received by the school district in 2008-2009 divided by the district’s student
enrollment. Federal revenues generally come to the district in the form of Title
funds for low-income pupils, funding for special needs pupils through the
Individuals with Disabilities Education Act, or general revenues sent through
federal stimulus programs.
75
Performance Variables
Though students in different state are not required to take the same standardized
tests, they do report two common variables that relate to performance. These variables
give a common, albeit imperfect, indicator of district level performance. These variables
are:
• Drop-out rate – Drop-out rate is defined by the NCES as: “the percentage of
public school students who were enrolled in grades 9–12 at some point during the
2008–09 school year, but were not enrolled in school in October 2009 and had not
earned a high school diploma or completed a state- or district-approved education
program” (Chapman et. al, 2011, p. 7); and
• Graduation rate – The number of students who graduated high school in the
district in 2008-2009 divided by the number of students who started their
freshman year four years prior.
The variables from the NCES have some obvious strengths, and one significant
weakness. The strengths are that the information is readily available, comparable across
states and districts due to common reporting requirements, and incredibly rich and
detailed. The weakness is that fiscal, demographic, and performance data often come
from different years. Accordingly, a necessary assumption for the validity of this
analysis is stability, meaning, there are not large year-to-year swings in the
demographics, performance, and fiscal characteristics of school districts. Such an
assumption is reasonable. A simple difference of mean-test, for example, finds that total
student enrollment in school districts in the six states of interest did not significantly
change from 2009-2010 to 2010-2011. The finding is logical given the general stability

76
of U.S. housing patterns over time (Cashin, 2004). In addition, the size of the dataset
ensures that wild swings in any individual district level data will not significantly alter
the overcall sample. Nonetheless, the difference in years is a weakness and the following
results should be interpreted knowing its existence.
Results of Difference of Means Tests
The five tables below show the results of a series of two-group means tests
between the two groups of states. Group One is comprised of Florida, Nevada, and Utah,
while Group Two is comprised of Michigan, Minnesota, and Wisconsin. In all of the
tables one to three stars are placed next to the mean of the variable in the group
determined to be significantly larger than the mean of other group. Before explaining the
results, it is worth nothing that Group Two contains many more districts (N), than Group
One. As mentioned in Chapter One, this difference gives reason to suspect there are
other differences between the school districts in the two groups of states, and was
purposely built into the research design.
Table 4.1 - Difference of Means Tests for Structural Variables Group 1 Group 2
N Standard Error Mean N
Standard Error Mean
Enrollment 125 5017.38 28891.27*** 1309 127.9 2383.9 Number of Schools 125 6.8 45.41*** 1312 0.27 5.7 Percentage of Charter Schools 125 0.005 .037*** 1307 0.002 0.014 Student Teacher Ratio 125 0.3122 16.75** 1307 0.086 15.78
*p<.05 **p<.01 ***p<.001
Table 4.1 shows several obvious differences between the two groups of states.
Districts in Group One are larger, in both the number of students served and the number
of schools operated, have fewer teachers per-students as indicated by a higher student

77
teacher ratio (though the difference is substantively small), and have a significantly larger
share of charter schools than the districts in Group Two. Substantively, the difference in
the percentage of charter schools between states is particularly significant.
Charter schools are public schools (in this case authorized by the district) that are
managed at the school level and generally free from a variety of state regulations. Most
important for this study is the different role that school boards play in the governance of
district-charter schools compared to traditional public schools (Teske et. al., 2005). The
budget, academic programming, and resource allocation for traditional public schools is
generally done at the school board level. In other words, elected school boards have
broad influence and input into the day-to-day operations of traditional public schools. In
contrast, the day-to-day operations of district charter schools are generally handled at the
school level. The district board is simply responsible for monitoring the performance of
the charter school and deciding whether to renew, revoke, or non-renew the school’s
charter (Teske et. al., 2005). It follows that boards in Group One might be expected to
engage in different governance behaviors dependent on the number of charter schools
they oversee.
Table 4.2 - Difference of Means Tests for Demographic Variables 1 Group 1 Group 2
N Standard Error Mean N
Standard Error Mean
Percent Male 125 0.001 .518* 1307 0.001 0.512 Percent Black 125 0.012 .107*** 1307 0.003 0.046 Percent White 125 0.018 0.67 1307 0.005 .847*** Percent Hispanic 125 0.012 .164*** 1307 0.002 0.048 Percent Non-White 125 0.018 .330*** 1307 0.005 0.153
*p<.05 **p<.01 ***p<.001
The demographics of the students served in the two groups of school districts
also, as shown in Table 4.2, vary significantly. Though Group One does have a slightly

78
higher percentage of male students than group two, the difference is statistically
significant but not substantively so (51.8% v. 51.2%). However, the racial differences
are particularly striking. Group One serves significantly more Black and Hispanic
students, and more minority students in general. On average Group One serves 33.0%
percent non-white students compared to 15.3% in Group Two. Likely, the differences are
attributable to the demographic make-up of the states. Group Two consists entirely of
northern states, while Group One is made up of southern and western states with higher
minority populations. Stubborn racial achievement gaps continue to plague the United
States, meaning the task of school boards in Group One could be viewed as more difficult
because they are enrolling more pupils from groups that on aggregate trail non-minority
groups on achievement tests (Smith, 2005; Holzman, 2012).
Table 4.3 -Difference of Means Tests for Demographic Variables 2 Group 1 Group 2
N Standard Error Mean N
Standard Error Mean
Percent Free/Reduced Lunch Eligible 125 0.013 .514*** 1307 0.005 0.406 Percent ELL 125 0.005 .055*** 1307 0.001 0.02 Percent IEP 125 0.003 0.144 1307 0.001 0.14 Per-Capita Income of Community 124 421.302 18030.34 1306 153.5 20254.63***
*p<.05 **p<.01 ***p<.001
Table 4.3 lists the differences in various non-racial demographic indicators
between the two groups. Most striking is the statistically significant difference between
free/reduced price lunch eligibility, a proxy for socio-economic status. Over half, 51.4%,
of the students served by districts in Group One are low-income. In comparison, only
40.6% of students served by districts in Group Two are low-income. Students from
poverty often come with additional challenges such as hunger and familial instability that
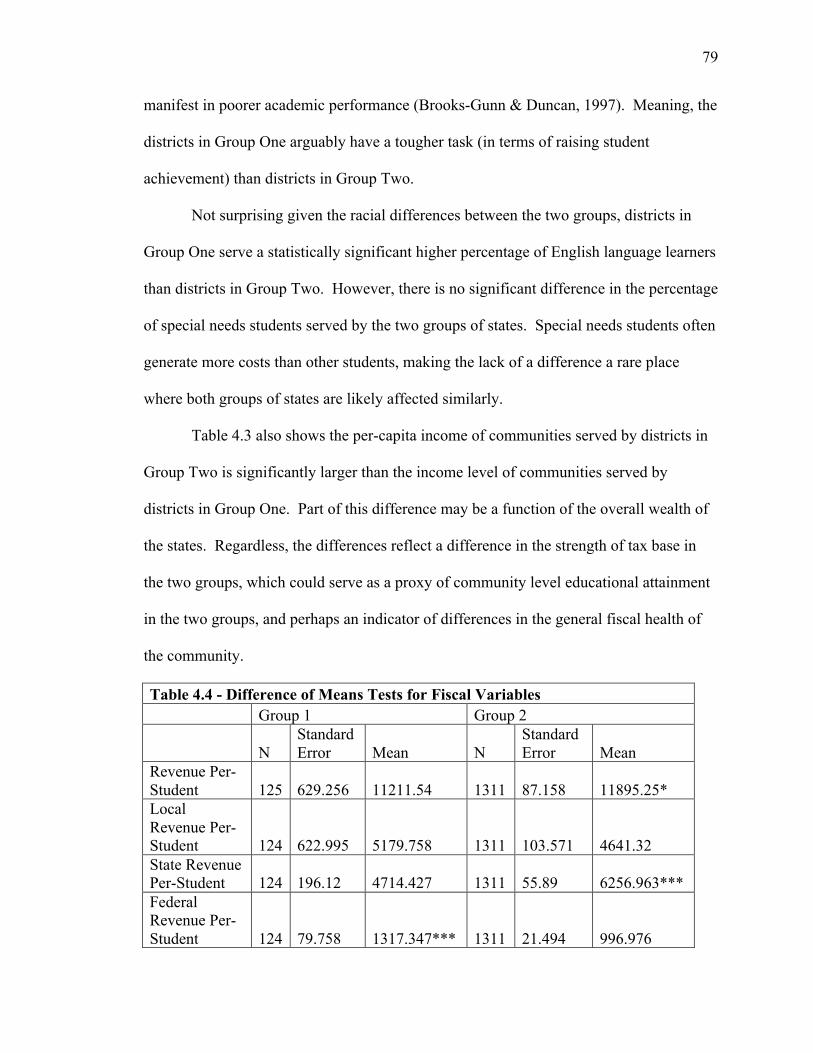
79
manifest in poorer academic performance (Brooks-Gunn & Duncan, 1997). Meaning, the
districts in Group One arguably have a tougher task (in terms of raising student
achievement) than districts in Group Two.
Not surprising given the racial differences between the two groups, districts in
Group One serve a statistically significant higher percentage of English language learners
than districts in Group Two. However, there is no significant difference in the percentage
of special needs students served by the two groups of states. Special needs students often
generate more costs than other students, making the lack of a difference a rare place
where both groups of states are likely affected similarly.
Table 4.3 also shows the per-capita income of communities served by districts in
Group Two is significantly larger than the income level of communities served by
districts in Group One. Part of this difference may be a function of the overall wealth of
the states. Regardless, the differences reflect a difference in the strength of tax base in
the two groups, which could serve as a proxy of community level educational attainment
in the two groups, and perhaps an indicator of differences in the general fiscal health of
the community.
Table 4.4 - Difference of Means Tests for Fiscal Variables Group 1 Group 2
N Standard Error Mean N
Standard Error Mean
Revenue Per-Student 125 629.256 11211.54 1311 87.158 11895.25* Local Revenue Per-Student 124 622.995 5179.758 1311 103.571 4641.32 State Revenue Per-Student 124 196.12 4714.427 1311 55.89 6256.963*** Federal Revenue Per-Student 124 79.758 1317.347*** 1311 21.494 996.976

80
*p<.05 **p<.01 ***p<.001
A closer looks specifically at revenue variables in Table 4.4 reveals two major
differences between the two groups. Group One receives significantly more federal
revenue than Group Two, and Group Two receives significantly more state revenue than
Group One. The difference in federal revenue is a logical by-product of Group One’s
significantly higher low-income population. A major source of federal funds to local
education is Title funds targeted toward schools serving low-income pupils. In other
words, more low-income pupils means more federal funding.
More interesting is the difference in state revenue per-student. In Group Two
districts on average receive $6,356.96 per-pupil, while district in Group One receive only
$4,714.43. This large difference is in indicator that the state governments on which local
school districts rely make a substantially smaller investment in education in Group One.
Surprisingly, total revenue per-student, though statistically higher in Group Two, is not
all that much higher (less than $1,000) than Group One; this is because federal revenues
are offsetting some of the difference in state revenues. Likely, the different governments
on which school boards rely on for funding affects the priorities of the school boards in
the different groups.
Table 4.5 - Difference of Means Tests for Achievement Variables Group 1 Group 2
N Standard Error Mean N
Standard Error Mean
Dropout Rate 102 0.187 2.817 859 0.126 2.441 Graduation Rate 107 1.066 73.785 1205 0.349 86.292***
*p<.05 **p<.01 ***p<.001
Finally, Table 4.5 lists the differences in achievement variables between the two
groups of school districts. It is important to note that the number of observations for both
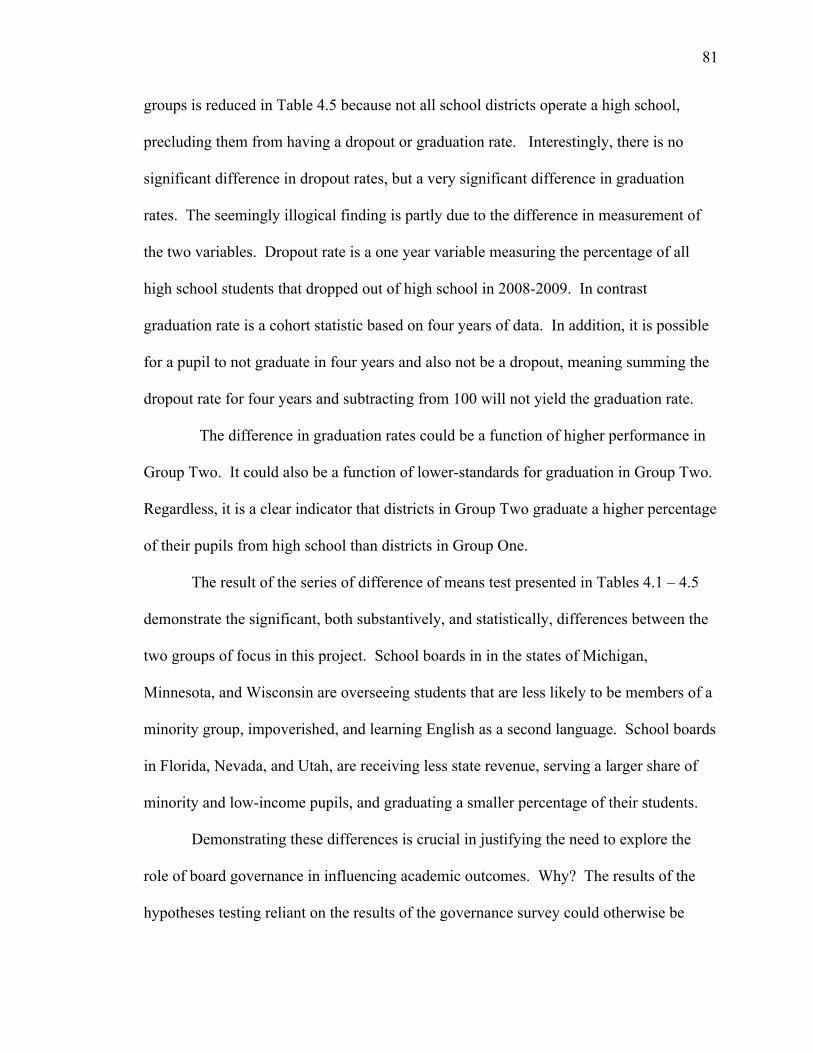
81
groups is reduced in Table 4.5 because not all school districts operate a high school,
precluding them from having a dropout or graduation rate. Interestingly, there is no
significant difference in dropout rates, but a very significant difference in graduation
rates. The seemingly illogical finding is partly due to the difference in measurement of
the two variables. Dropout rate is a one year variable measuring the percentage of all
high school students that dropped out of high school in 2008-2009. In contrast
graduation rate is a cohort statistic based on four years of data. In addition, it is possible
for a pupil to not graduate in four years and also not be a dropout, meaning summing the
dropout rate for four years and subtracting from 100 will not yield the graduation rate.
The difference in graduation rates could be a function of higher performance in
Group Two. It could also be a function of lower-standards for graduation in Group Two.
Regardless, it is a clear indicator that districts in Group Two graduate a higher percentage
of their pupils from high school than districts in Group One.
The result of the series of difference of means test presented in Tables 4.1 – 4.5
demonstrate the significant, both substantively, and statistically, differences between the
two groups of focus in this project. School boards in in the states of Michigan,
Minnesota, and Wisconsin are overseeing students that are less likely to be members of a
minority group, impoverished, and learning English as a second language. School boards
in Florida, Nevada, and Utah, are receiving less state revenue, serving a larger share of
minority and low-income pupils, and graduating a smaller percentage of their students.
Demonstrating these differences is crucial in justifying the need to explore the
role of board governance in influencing academic outcomes. Why? The results of the
hypotheses testing reliant on the results of the governance survey could otherwise be
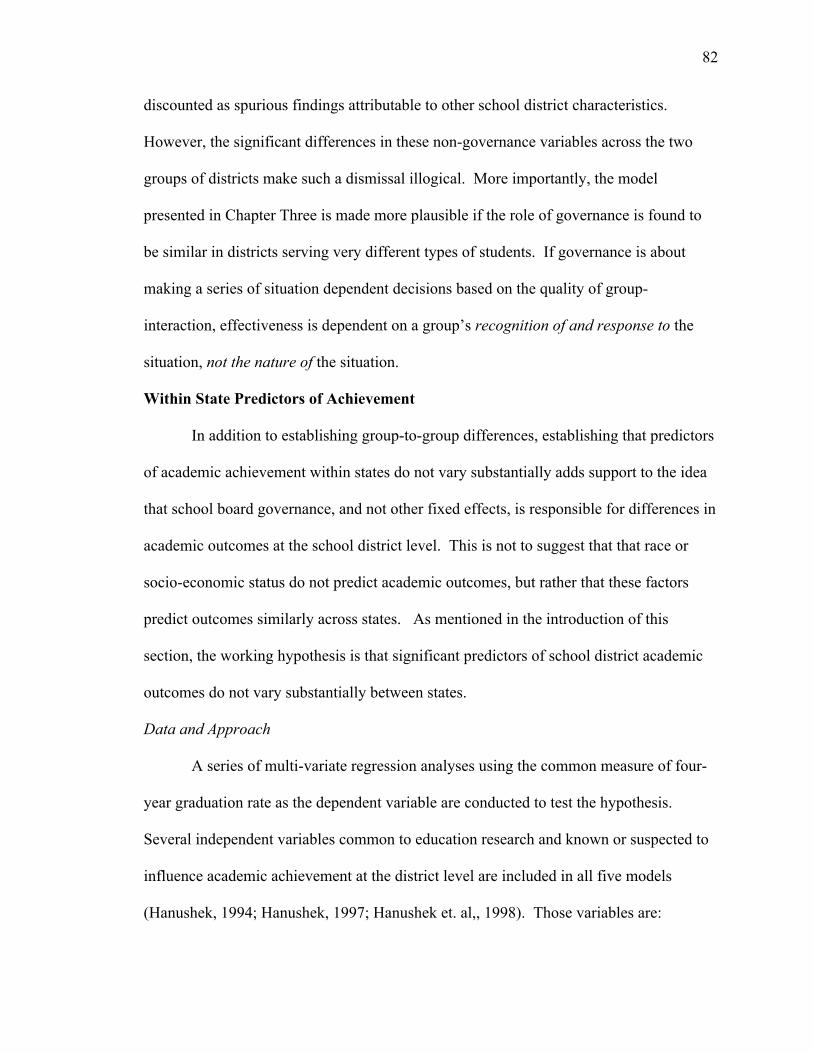
82
discounted as spurious findings attributable to other school district characteristics.
However, the significant differences in these non-governance variables across the two
groups of districts make such a dismissal illogical. More importantly, the model
presented in Chapter Three is made more plausible if the role of governance is found to
be similar in districts serving very different types of students. If governance is about
making a series of situation dependent decisions based on the quality of group-
interaction, effectiveness is dependent on a group’s recognition of and response to the
situation, not the nature of the situation.
Within State Predictors of Achievement
In addition to establishing group-to-group differences, establishing that predictors
of academic achievement within states do not vary substantially adds support to the idea
that school board governance, and not other fixed effects, is responsible for differences in
academic outcomes at the school district level. This is not to suggest that that race or
socio-economic status do not predict academic outcomes, but rather that these factors
predict outcomes similarly across states. As mentioned in the introduction of this
section, the working hypothesis is that significant predictors of school district academic
outcomes do not vary substantially between states.
Data and Approach
A series of multi-variate regression analyses using the common measure of four-
year graduation rate as the dependent variable are conducted to test the hypothesis.
Several independent variables common to education research and known or suspected to
influence academic achievement at the district level are included in all five models
(Hanushek, 1994; Hanushek, 1997; Hanushek et. al,, 1998). Those variables are:
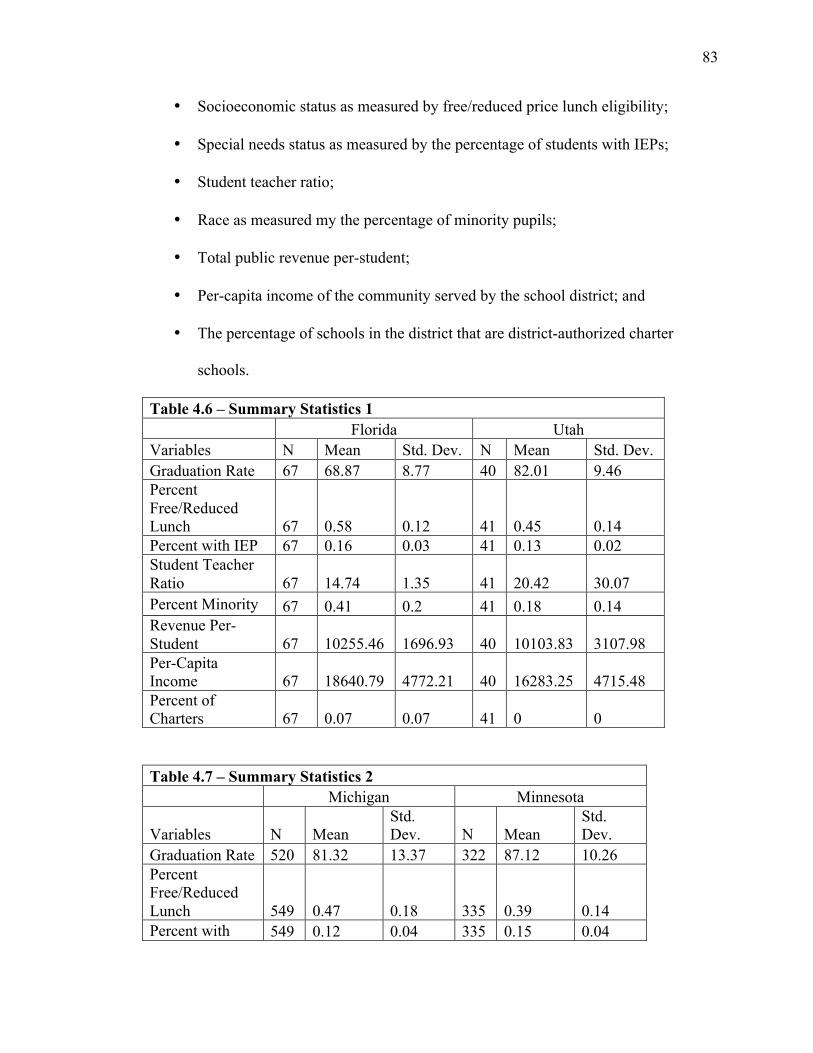
83
• Socioeconomic status as measured by free/reduced price lunch eligibility;
• Special needs status as measured by the percentage of students with IEPs;
• Student teacher ratio;
• Race as measured my the percentage of minority pupils;
• Total public revenue per-student;
• Per-capita income of the community served by the school district; and
• The percentage of schools in the district that are district-authorized charter
schools.
Table 4.6 – Summary Statistics 1 Florida Utah Variables N Mean Std. Dev. N Mean Std. Dev. Graduation Rate 67 68.87 8.77 40 82.01 9.46 Percent Free/Reduced Lunch 67 0.58 0.12 41 0.45 0.14 Percent with IEP 67 0.16 0.03 41 0.13 0.02 Student Teacher Ratio 67 14.74 1.35 41 20.42 30.07 Percent Minority 67 0.41 0.2 41 0.18 0.14 Revenue Per-Student 67 10255.46 1696.93 40 10103.83 3107.98 Per-Capita Income 67 18640.79 4772.21 40 16283.25 4715.48 Percent of Charters 67 0.07 0.07 41 0 0
Table 4.7 – Summary Statistics 2 Michigan Minnesota
Variables N Mean Std. Dev. N Mean
Std. Dev.
Graduation Rate 520 81.32 13.37 322 87.12 10.26 Percent Free/Reduced Lunch 549 0.47 0.18 335 0.39 0.14 Percent with 549 0.12 0.04 335 0.15 0.04
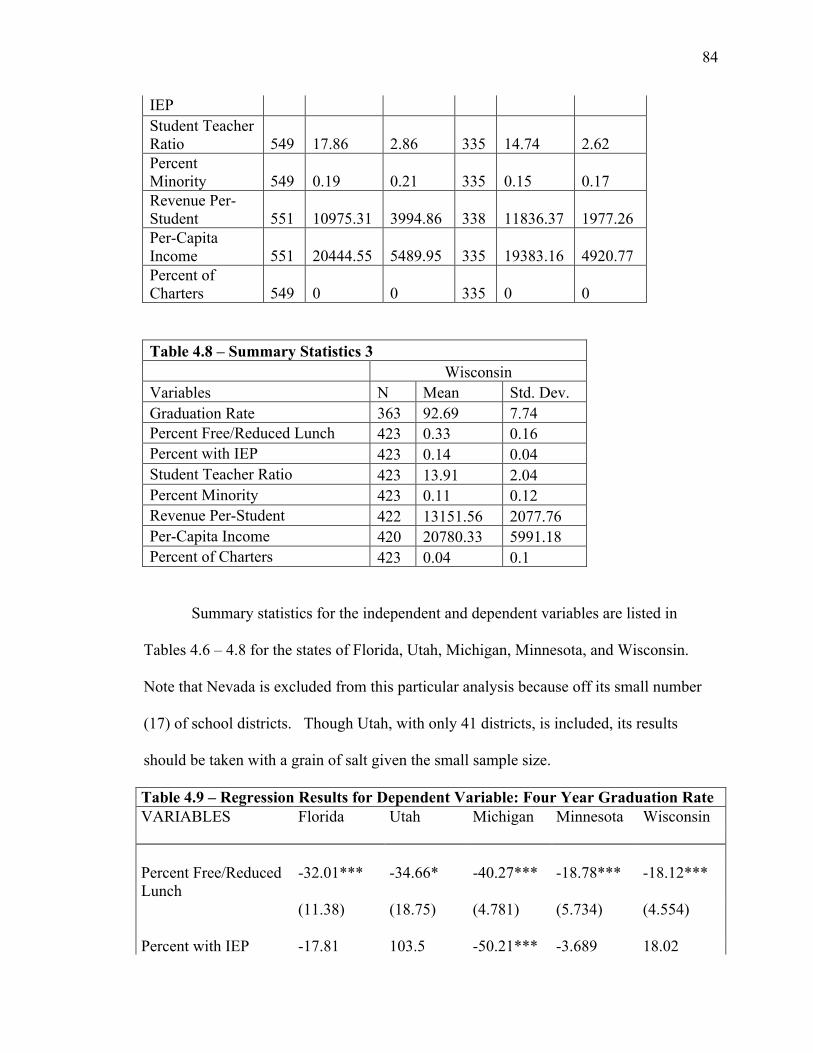
84
IEP Student Teacher Ratio 549 17.86 2.86 335 14.74 2.62 Percent Minority 549 0.19 0.21 335 0.15 0.17 Revenue Per-Student 551 10975.31 3994.86 338 11836.37 1977.26 Per-Capita Income 551 20444.55 5489.95 335 19383.16 4920.77 Percent of Charters 549 0 0 335 0 0
Table 4.8 – Summary Statistics 3 Wisconsin Variables N Mean Std. Dev. Graduation Rate 363 92.69 7.74 Percent Free/Reduced Lunch 423 0.33 0.16 Percent with IEP 423 0.14 0.04 Student Teacher Ratio 423 13.91 2.04 Percent Minority 423 0.11 0.12 Revenue Per-Student 422 13151.56 2077.76 Per-Capita Income 420 20780.33 5991.18 Percent of Charters 423 0.04 0.1
Summary statistics for the independent and dependent variables are listed in
Tables 4.6 – 4.8 for the states of Florida, Utah, Michigan, Minnesota, and Wisconsin.
Note that Nevada is excluded from this particular analysis because off its small number
(17) of school districts. Though Utah, with only 41 districts, is included, its results
should be taken with a grain of salt given the small sample size.
Table 4.9 – Regression Results for Dependent Variable: Four Year Graduation Rate VARIABLES Florida Utah Michigan Minnesota Wisconsin
Percent Free/Reduced Lunch
-32.01*** -34.66* -40.27*** -18.78*** -18.12***
(11.38) (18.75) (4.781) (5.734) (4.554)
Percent with IEP -17.81 103.5 -50.21*** -3.689 18.02
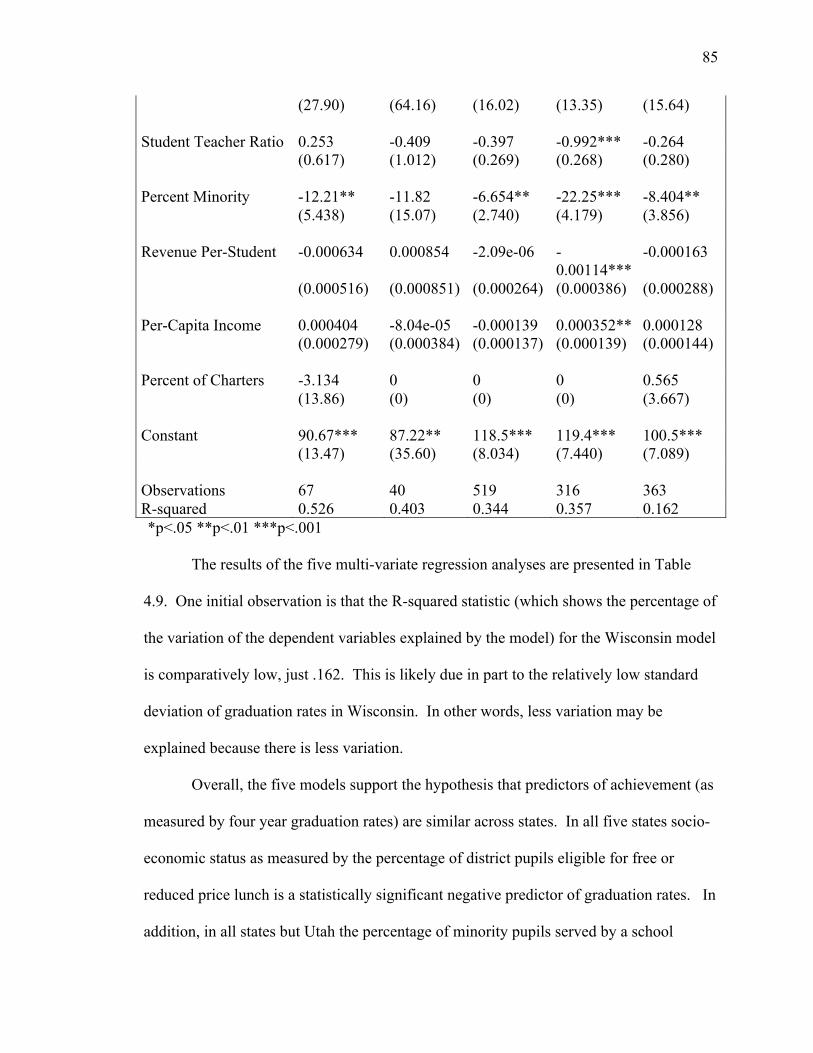
85
(27.90) (64.16) (16.02) (13.35) (15.64)
Student Teacher Ratio 0.253 -0.409 -0.397 -0.992*** -0.264
(0.617) (1.012) (0.269) (0.268) (0.280)
Percent Minority -12.21** -11.82 -6.654** -22.25*** -8.404**
(5.438) (15.07) (2.740) (4.179) (3.856)
Revenue Per-Student -0.000634 0.000854 -2.09e-06 -0.00114***
-0.000163
(0.000516) (0.000851) (0.000264) (0.000386) (0.000288)
Per-Capita Income 0.000404 -8.04e-05 -0.000139 0.000352** 0.000128
(0.000279) (0.000384) (0.000137) (0.000139) (0.000144)
Percent of Charters -3.134 0 0 0 0.565
(13.86) (0) (0) (0) (3.667)
Constant 90.67*** 87.22** 118.5*** 119.4*** 100.5*** (13.47) (35.60) (8.034) (7.440) (7.089) Observations 67 40 519 316 363 R-squared 0.526 0.403 0.344 0.357 0.162 *p<.05 **p<.01 ***p<.001
The results of the five multi-variate regression analyses are presented in Table
4.9. One initial observation is that the R-squared statistic (which shows the percentage of
the variation of the dependent variables explained by the model) for the Wisconsin model
is comparatively low, just .162. This is likely due in part to the relatively low standard
deviation of graduation rates in Wisconsin. In other words, less variation may be
explained because there is less variation.
Overall, the five models support the hypothesis that predictors of achievement (as
measured by four year graduation rates) are similar across states. In all five states socio-
economic status as measured by the percentage of district pupils eligible for free or
reduced price lunch is a statistically significant negative predictor of graduation rates. In
addition, in all states but Utah the percentage of minority pupils served by a school

86
district is a statistically significant negative predictor of graduation rates. The lack of
significance in Utah is likely due to both that state’s relatively homogenous population,
and the small sample size used in this analysis.
Only in Minnesota are student-teacher ratio, revenue per-student, and per-capita
community income significant predictors of graduation rates. While the size of the effects
attributable to revenue-per student and per-capita income are very small, the student
teacher ratio effects in Minnesota are both statistically and substantively significant. The
single anomaly should be kept in mind if the governance surveys of Minnesota school
boards differ substantially from the other states.
Overall, the five models support the hypothesis that significant predictors of
achievement as measured by graduation rates are similar in districts in the five states
included in the analysis. The strongest predictors of academic outcomes are socio-
economic status and membership in a racial minority group. These findings are not
surprising, and mirror the vast majority of research on academic achievement, and in
particular graduation rates, in the United States (Swanson, 2003). Thus, further credence
is given to the concept that within state characteristics as they relate to academic
achievement measured by graduation rates are similar enough to support a comparative
analysis between states.
Other Achievement Data
A problem with a district level analysis or academic achievement that looks
across states is the use of non-comparable criterion referenced state-specific standardized
tests. Fortunately, in the near future most U.S. states will be using one of two common
assessments; the results of which are comparable across states (Gewertz, 2012).

87
Unfortunately, those new tests have not yet been given, and their results are obviously not
available for this study. Nonetheless, standardized test data within states is available, and
can be used to measure performance in comparison to other districts within the same
state. Though the effects of board governance on standardized test scores cannot be
equally measured by different test data, the presence of a positive or negative effect on a
single state standardized test is certainly of interest, and can be used to enrich comparable
findings on the impact of governance on graduation rates.
Because of the non-comparable nature of state-specific standardized test, multi-
variate regression analysis, such as was used to predict graduation rates, is not used in
this chapter to predict test scores. However a description of each state test and summary
statistics for available state performance indicators on each test, are presented to create a
familiarity with the tests used in each state.
Florida
Florida uses the Florida Comprehensive Assessment Test, knows as the F-Cat, as
its official state standardized assessment. According to the Florida Department of
Education the state began in 2010-2011 using its second iteration of the assessment,
called the F-Cat 2.0. The test is given to all public school pupils in grades 3-8 in reading,
grades 3-10 in math, and grades 5 and 8 in science. For this study I am focusing on 8th
grade achievement on the F-Cat 2.0 in math and reading to serve as a satisfying
complement measure of district achievement.
Table 4.10 shows the percentage of students in Florida districts scoring at
achievement level 3 or above, which according to the Florida Department of Education,
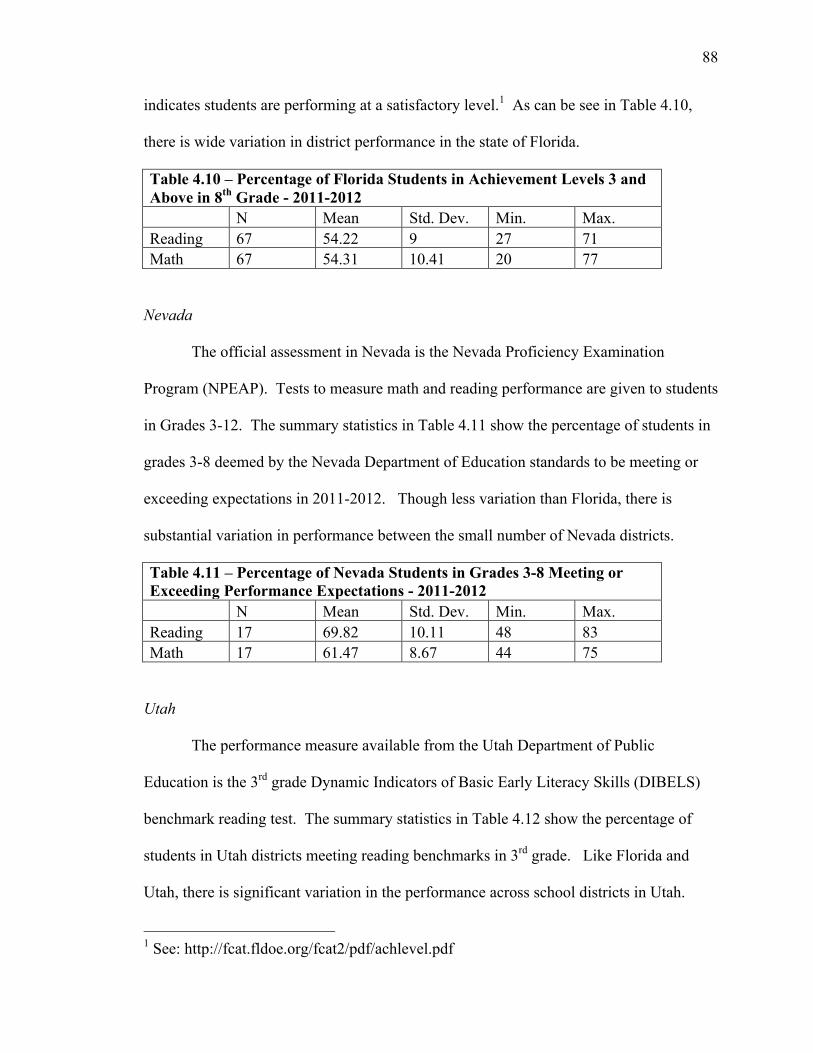
88
indicates students are performing at a satisfactory level.1 As can be see in Table 4.10,
there is wide variation in district performance in the state of Florida.
Table 4.10 – Percentage of Florida Students in Achievement Levels 3 and Above in 8th Grade - 2011-2012 N Mean Std. Dev. Min. Max. Reading 67 54.22 9 27 71 Math 67 54.31 10.41 20 77
Nevada
The official assessment in Nevada is the Nevada Proficiency Examination
Program (NPEAP). Tests to measure math and reading performance are given to students
in Grades 3-12. The summary statistics in Table 4.11 show the percentage of students in
grades 3-8 deemed by the Nevada Department of Education standards to be meeting or
exceeding expectations in 2011-2012. Though less variation than Florida, there is
substantial variation in performance between the small number of Nevada districts.
Table 4.11 – Percentage of Nevada Students in Grades 3-8 Meeting or Exceeding Performance Expectations - 2011-2012 N Mean Std. Dev. Min. Max. Reading 17 69.82 10.11 48 83 Math 17 61.47 8.67 44 75
Utah
The performance measure available from the Utah Department of Public
Education is the 3rd grade Dynamic Indicators of Basic Early Literacy Skills (DIBELS)
benchmark reading test. The summary statistics in Table 4.12 show the percentage of
students in Utah districts meeting reading benchmarks in 3rd grade. Like Florida and
Utah, there is significant variation in the performance across school districts in Utah.
1 See: http://fcat.fldoe.org/fcat2/pdf/achlevel.pdf

89
Table 4.12 – Percentage of Utah 3rd Graders Meeting Reading Benchmarks - 2011-2012 N Mean Std. Dev. Min. Max. Reading 40 73.23 11.83 44 93
An obvious shortcoming of the Utah test score data is that it is an indicator of
performance early in the academic career of students. Accordingly, in addition to the
differences in tests between states the differences in what tests are designed to measure in
individual states must be considered when interpreting the impact of governance on
achievement indicators. Nonetheless, the 3rd reading test does adequately serve the
purpose of supplementing the uniform performance measure of graduation rates.
Michigan
Students in Michigan take the Michigan Educational Assessment Program
(MEAP) assessments, known as the MEAP exams, in grades 3 – 9 in math and reading.
The Michigan Department of Education reports the percentage of students deemed
proficient by school district in each of these grades. Note that the summary statistics in
Table 4.13, which indicate wide variation, include non-district charter schools which, for
purposes of state testing, are treated as if they are their own independent school district.
Table 4.13 – Percentage of Michigan 8th Graders Deemed Proficient on the MEAP - 2011-2012 N Mean Std. Dev. Min. Max. Reading 684 57.45 14.88 0 94.7 Math 684 23.96 15.41 0 89.5
Minnesota
The official state assessments in Minnesota are called the Minnesota
Comprehensive Assessments (MCAs). The MCAs are given in math in grades 3-8 and
11, and in reading in grades 3-8 and 10. The summary statistics below show the mean
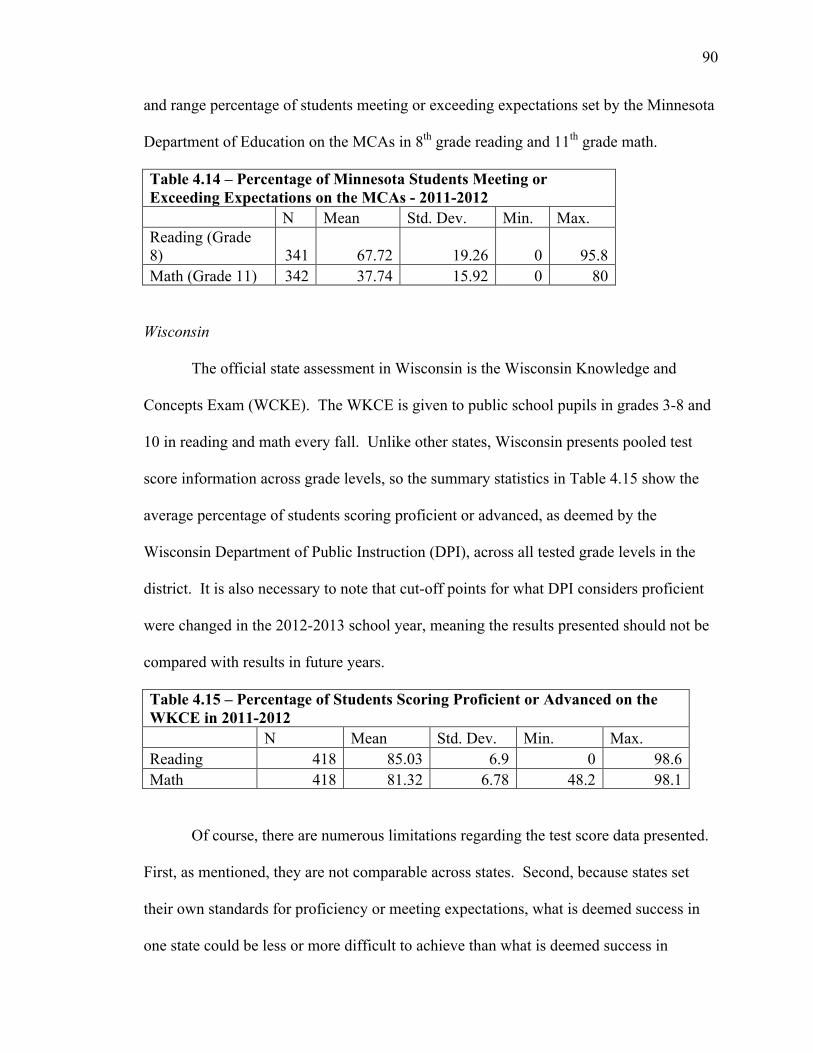
90
and range percentage of students meeting or exceeding expectations set by the Minnesota
Department of Education on the MCAs in 8th grade reading and 11th grade math.
Table 4.14 – Percentage of Minnesota Students Meeting or Exceeding Expectations on the MCAs - 2011-2012 N Mean Std. Dev. Min. Max. Reading (Grade 8) 341 67.72 19.26 0 95.8 Math (Grade 11) 342 37.74 15.92 0 80
Wisconsin
The official state assessment in Wisconsin is the Wisconsin Knowledge and
Concepts Exam (WCKE). The WKCE is given to public school pupils in grades 3-8 and
10 in reading and math every fall. Unlike other states, Wisconsin presents pooled test
score information across grade levels, so the summary statistics in Table 4.15 show the
average percentage of students scoring proficient or advanced, as deemed by the
Wisconsin Department of Public Instruction (DPI), across all tested grade levels in the
district. It is also necessary to note that cut-off points for what DPI considers proficient
were changed in the 2012-2013 school year, meaning the results presented should not be
compared with results in future years.
Table 4.15 – Percentage of Students Scoring Proficient or Advanced on the WKCE in 2011-2012 N Mean Std. Dev. Min. Max. Reading 418 85.03 6.9 0 98.6 Math 418 81.32 6.78 48.2 98.1
Of course, there are numerous limitations regarding the test score data presented.
First, as mentioned, they are not comparable across states. Second, because states set
their own standards for proficiency or meeting expectations, what is deemed success in
one state could be less or more difficult to achieve than what is deemed success in

91
another state. Third, test scores do not show growth in achievement over-time, so a low-
achieving district could merely look low performing because of the difficult students
served. Fourth, no single test score can encompass the success or failure of a student;
students may get test anxiety, may have areas of strength that do not show up in a
standardized test score, etc. However, the use of achievement scores in measuring school
and district performance is common practice, and can yield useful information.
For example, though student growth is not included in any of the presented
achievement scores the use of pooled-data, or 8th grade data when available, will ensure
that district scores have time to grow (i.e. from when a student starts testing grade 3 to
grade 8). More importantly, the regression analyses used to draw conclusions about the
impact of governance on outcomes controls for factors, such as socio-economic status,
commonly known to negatively affect achievement on standardized tests. Comparisons
across grade levels, i.e grade three to eight, are particularly problematic due to factors
such as the growth of racial gaps over time, and should be interpreted with caution.
Conclusion
In this chapter two hypotheses are tested using archival data from the NCES, and
from the Departments of Educations (or Public Instructions) in Florida, Nevada, Utah,
Michigan, Minnesota, and Wisconsin. The first hypothesis, that their are significant
differences in the make-up and structure of school districts in the two groups of states, is
well supported. The second hypothesis - that the major predictors of school district
academic outcomes in the six states of interest do not vary significantly by state - is also
well supported. Finally, test score data for each state was presented demonstrating that
there is significant variation in scores within states.

92
As mentioned in the introduction to the chapter, the accepting of these hypotheses
supports the methodology of a most-different case-study approach for understanding the
link between school board governance and academic achievement using the black box
model of school board governance. Within the black box governance model it is
theorized that school board members make a series of situation dependent decisions.
Hence, the governance survey presented in later chapters seeks to measure the quality of
group decision-making on school boards, rather than understand the specific policies
pursued by boards. Because the two groups of states are serving substantially different
populations, it is expected that school boards in either group will be making decisions
regarding significantly different situations. For example, a school board in Nevada
overseeing a district with a large ELL population will face a very different set of potential
decisions than a board in Minnesota overseeing a homogeneous English speaking student
body. However, if board performance is dependent on the quality of decision-making as
theorized, a high-functioning board should be expected to make a positive impact in both
situations. In other words, quality board governance affects outcomes across different
types of governance situations. If the two groups were homogenous, the lone conclusion
might be that quality governance matters only for specific situations.
The confirmation of the second hypothesis also validates the research design by
demonstrating that achievement as measured by graduation rates in all six states studied
is predicted by common factors. There are enough similarities to make a group-to-group
comparison that is valid. So, for example, while the extent of poverty might differ by
state, the effect of poverty in all six states is comparable. Knowing this enables a
common set of control variables to be used in the state groupings when attempting to
93
isolate the impact of school board governance on variations in academic achievement
variables.
In addition to testing these two hypotheses, this chapter presented and explained
the summary statistics for the numerous archival variables used in quantitative models in
the next chapter. As discussed there are notable limitations in the presented data that
must be considered when interpreting the results of the regression analyses presented thus
far, and those to follow. However, these limitations are noted and not serious enough to
undermine the overall conclusions, or contributions made by this study.

94
Chapter V. Survey Design and Summary Results
The previous sections of this dissertation establish why school boards can be
theorized to impact school district performance, describe ways in which this relationship
might work, and justify the comparative case study design focus on school boards in the
states of Florida, Michigan, Minnesota, Nevada, Utah, and Wisconsin. This section
describes the process by which the original survey data to test the three major hypotheses
were collected. In addition to describing the process, a summary of survey data,
including an analysis of the characteristics of school board members in the six states of
interest, is presented.
Survey Design
The survey instrument used to collect data was developed by the author in
collaboration with Douglas Ihrke and Barbara Duffy of the Helen Bader Institute at the
University of Wisconsin-Milwaukee. The instrument was developed and fine-tuned over
the course of approximately nine months, from April 2012 to February 2013. The
original draft survey contained over 130 questions, and was gradually reduced to 39
questions. The survey questions were adapted from a previous survey conducted by the
National School Boards Association (Meeks & Hess, 2011), from a municipal
government survey in Michigan (Irhke et. al., 2003), and drafted by the author. The
survey instrument in full can be viewed in Appendix A.
Units of Analyses
The units of analyses targeted by the survey were individual school boards, and
the school board as a unit. Some survey questions were worded to provide basic
information about board members (i.e. sex, ideological leanings, years of service), while
95
others were worded to obtain information from individual school board members on their
perceptions of the board as a whole. A similar strategy was used in previous school
board surveys by Grissom (2012) and Hess & Meeks (2011).
Given these units of analyses, the goal of the survey is to maximize both the
number of individual school board member respondents, and the number of school boards
from which at least one response was obtained. This strategy does introduce a
measurement problem for districts where multiple school board members respond. The
previous surveys by Grissom (2012) and Hess & Meeks (2011) countered this by
averaging out the responses for all responding school board members for every relevant
question. This does introduce the possible risk that a minority viewpoint on the board is
the only represented view, distorting the way in which the board actually functions.
Though there is no practical way to counter this problem, data on the number of
responses per-board is reported.
Sampling strategy
The goal of the survey design was to sample the universe of school boards in
Florida, Michigan, Minnesota, Nevada, Utah, and Wisconsin, as well as non-profit
independent charter school boards in Michigan and Wisconsin. As can be seen in table
5.1, there are 1,655 boards in the sampling frame. Between August, 2012 and December,
2012 a total of 5,175 e-mail addresses for board members were mined from school
district websites, the directory of the Florida School Boards Association, and charter
school directories publicly available from the Wisconsin Department of Public
Instruction and the Florida Department of Education. In total, contact information was
obtained for at least one board member or board secretary in 83% of the sampling frame.

96
In total, 4,775 e-mails for traditional school boards and 400 for non-profit charter school
boards were obtained.
Table 5.1 – E-mail Addresses Mined by State
Districts
Valid E-Mail Addresses Mined
Wisconsin 424 1,379 Michigan 552 1,568
Minnesota 340 1,238 Nevada 17 62
Utah 41 163 Florida 67 365
Michigan Charter 206 331
Wisconsin Charter 18 69
Total 1,665 5,175
Survey Logistics
The author obtained Institutional Review Board (IRB) approval from the IRB
board at the University of Wisconsin Milwaukee on February 19, 2013. The study was
ruled expedited, and assigned IRB# 13.275. After approval the survey was sent to all e-
mail addresses along with a solicitation letter, and notice of informed consent on
February 25, 2013 (A copy of the letter can be viewed in Appendix B). A follow-up
solicitation was sent to non-responding board members two weeks later, and the survey
was closed for good on April 15, 2013.
The initial overall school board member response rate was 27.35%. In
comparison the response rate of the national school board member survey conducted by
Hess & Meeks (2011) was 23.6%. However, as shown in Table 5.2, after data cleanup
the usable board member response rate was 23.9%. In addition, the overall number of
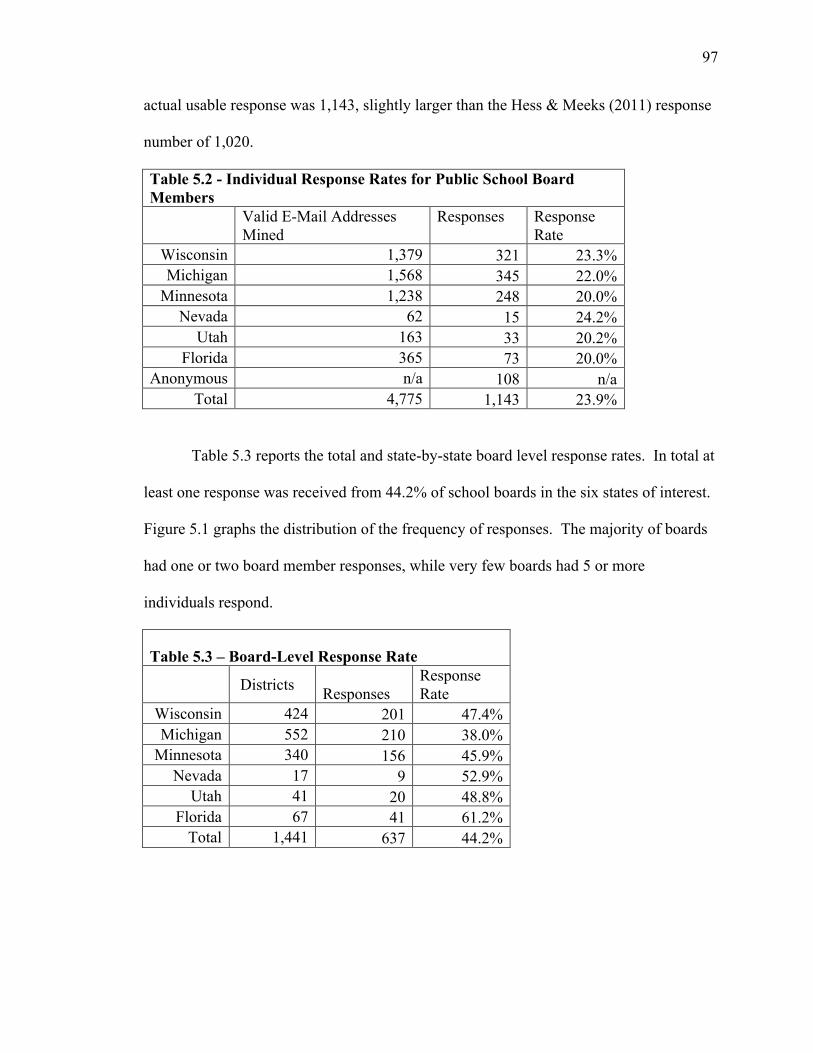
97
actual usable response was 1,143, slightly larger than the Hess & Meeks (2011) response
number of 1,020.
Table 5.2 - Individual Response Rates for Public School Board Members Valid E-Mail Addresses
Mined Responses Response
Rate Wisconsin 1,379 321 23.3% Michigan 1,568 345 22.0%
Minnesota 1,238 248 20.0% Nevada 62 15 24.2%
Utah 163 33 20.2% Florida 365 73 20.0%
Anonymous n/a 108 n/a Total 4,775 1,143 23.9%
Table 5.3 reports the total and state-by-state board level response rates. In total at
least one response was received from 44.2% of school boards in the six states of interest.
Figure 5.1 graphs the distribution of the frequency of responses. The majority of boards
had one or two board member responses, while very few boards had 5 or more
individuals respond.
Table 5.3 – Board-Level Response Rate
Districts Responses Response Rate
Wisconsin 424 201 47.4% Michigan 552 210 38.0%
Minnesota 340 156 45.9% Nevada 17 9 52.9%
Utah 41 20 48.8% Florida 67 41 61.2%
Total 1,441 637 44.2%

98
Unfortunately the response rate for independent non-profit charter board members
was much lower, just 7.75%. Though the number of initial responses, 31, allows for
some descriptive data analysis, (presented in Chapter Eight), they must be taken with a
grain of salt. Accordingly, unless otherwise identified, all presented data refers only to
responses from public school boards.
Aggregate Survey Results
A full listing of aggregate survey results for all 89-survey fields is available in
Appendix A. However, in the remainder of this chapter survey results will be presented
that shows the basic characteristics of school board members in Wisconsin, Michigan,
Minnesota, Utah, Nevada, and Florida, and identifies key differences in school board
membership in the two groups of states.
Who serves on boards?
322
197
79
27 6 3 1
0
50
100
150
200
250
300
350
1 2 3 4 5 6 7
Frequency
Number of Responses
Figure 5.1 Histogram of Number of Respondents by Board
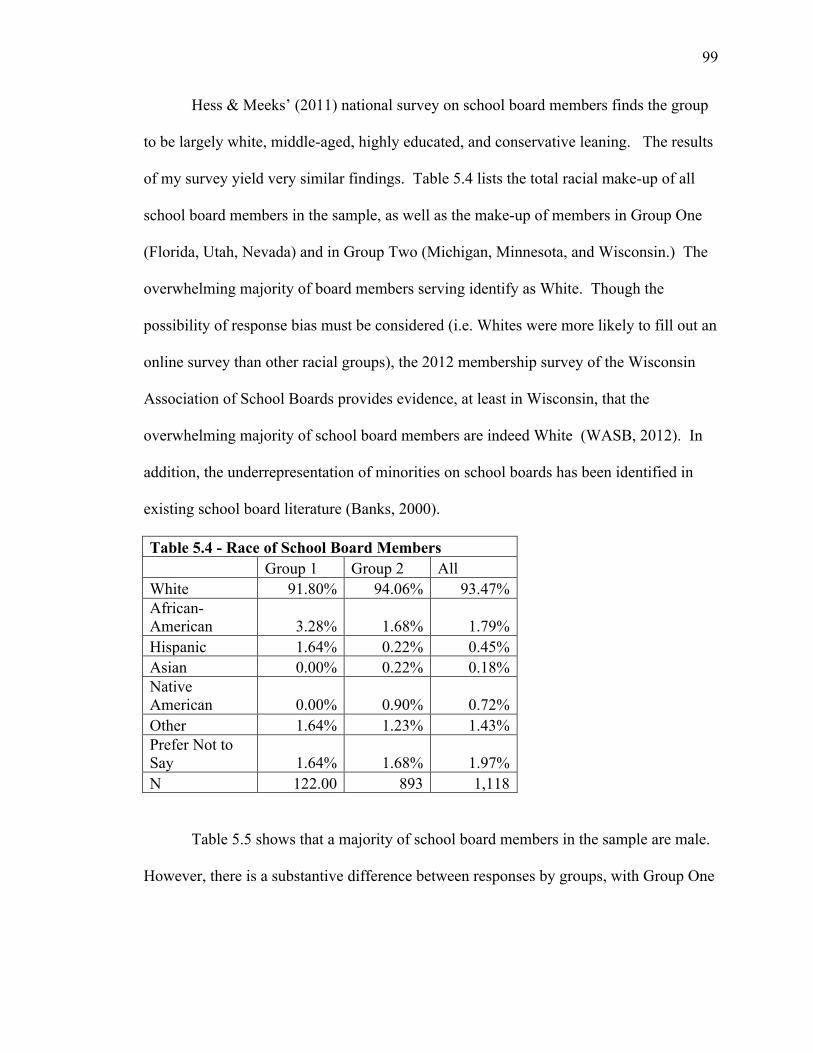
99
Hess & Meeks’ (2011) national survey on school board members finds the group
to be largely white, middle-aged, highly educated, and conservative leaning. The results
of my survey yield very similar findings. Table 5.4 lists the total racial make-up of all
school board members in the sample, as well as the make-up of members in Group One
(Florida, Utah, Nevada) and in Group Two (Michigan, Minnesota, and Wisconsin.) The
overwhelming majority of board members serving identify as White. Though the
possibility of response bias must be considered (i.e. Whites were more likely to fill out an
online survey than other racial groups), the 2012 membership survey of the Wisconsin
Association of School Boards provides evidence, at least in Wisconsin, that the
overwhelming majority of school board members are indeed White (WASB, 2012). In
addition, the underrepresentation of minorities on school boards has been identified in
existing school board literature (Banks, 2000).
Table 5.4 - Race of School Board Members Group 1 Group 2 All White 91.80% 94.06% 93.47% African-American 3.28% 1.68% 1.79% Hispanic 1.64% 0.22% 0.45% Asian 0.00% 0.22% 0.18% Native American 0.00% 0.90% 0.72% Other 1.64% 1.23% 1.43% Prefer Not to Say 1.64% 1.68% 1.97% N 122.00 893 1,118
Table 5.5 shows that a majority of school board members in the sample are male.
However, there is a substantive difference between responses by groups, with Group One

100
consisting of more females than males. However, a test comparing the group responses
does fall just short of statistical significance at the 95% level of confidence.
Table 5.5 - Sex of School Board Members Group 1 Group 2 All Male 46.28% 55.49% 53.38% Female 52.72% 44.51% 46.62% N 121 901 1,124
The average age of board members, shown in Table 5.6, is 53.25. However there
is a large range of board member ages, with members ranging from the ages of 19 to 80.
Members in Group One are slightly older than members in Group Two. Difference of
means test reveals that within the sample board members in Group One are significantly
older than members in Group Two at the 99% level of confidence. However, the average
board member in both of the groups can safely be described as middle-aged.
Table 5.6 - Mean Age of School Board Members Group 1 Group 2 All 57.33 52.72 53.25 N 111 841 1,042
In terms of ideology the average board member in the sample identifies himself or
herself as conservative or moderate more often than liberal or non-partisan (see Table
5.7). This basic difference holds true across groups, however in Group One very few
board members identify themselves as liberal, while almost half (45%) identify
themselves as conservative. Meaning, the average board member (in the sample) serving
in Florida, Utah, and Nevada is more likely to be conservative than the average board
member serving in Wisconsin, Michigan, and Minnesota. Given the overall ideological
representation of the population in these states, the difference is not surprising. In the
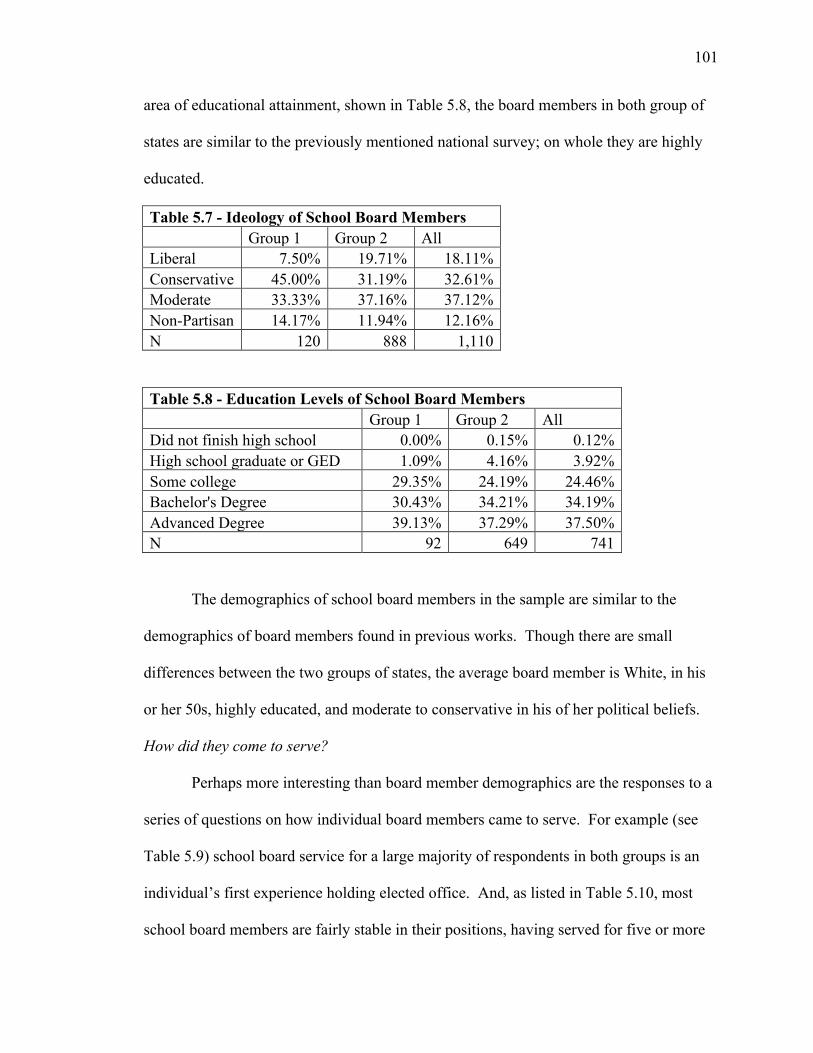
101
area of educational attainment, shown in Table 5.8, the board members in both group of
states are similar to the previously mentioned national survey; on whole they are highly
educated.
Table 5.7 - Ideology of School Board Members Group 1 Group 2 All Liberal 7.50% 19.71% 18.11% Conservative 45.00% 31.19% 32.61% Moderate 33.33% 37.16% 37.12% Non-Partisan 14.17% 11.94% 12.16% N 120 888 1,110
Table 5.8 - Education Levels of School Board Members Group 1 Group 2 All Did not finish high school 0.00% 0.15% 0.12% High school graduate or GED 1.09% 4.16% 3.92% Some college 29.35% 24.19% 24.46% Bachelor's Degree 30.43% 34.21% 34.19% Advanced Degree 39.13% 37.29% 37.50% N 92 649 741
The demographics of school board members in the sample are similar to the
demographics of board members found in previous works. Though there are small
differences between the two groups of states, the average board member is White, in his
or her 50s, highly educated, and moderate to conservative in his of her political beliefs.
How did they come to serve?
Perhaps more interesting than board member demographics are the responses to a
series of questions on how individual board members came to serve. For example (see
Table 5.9) school board service for a large majority of respondents in both groups is an
individual’s first experience holding elected office. And, as listed in Table 5.10, most
school board members are fairly stable in their positions, having served for five or more
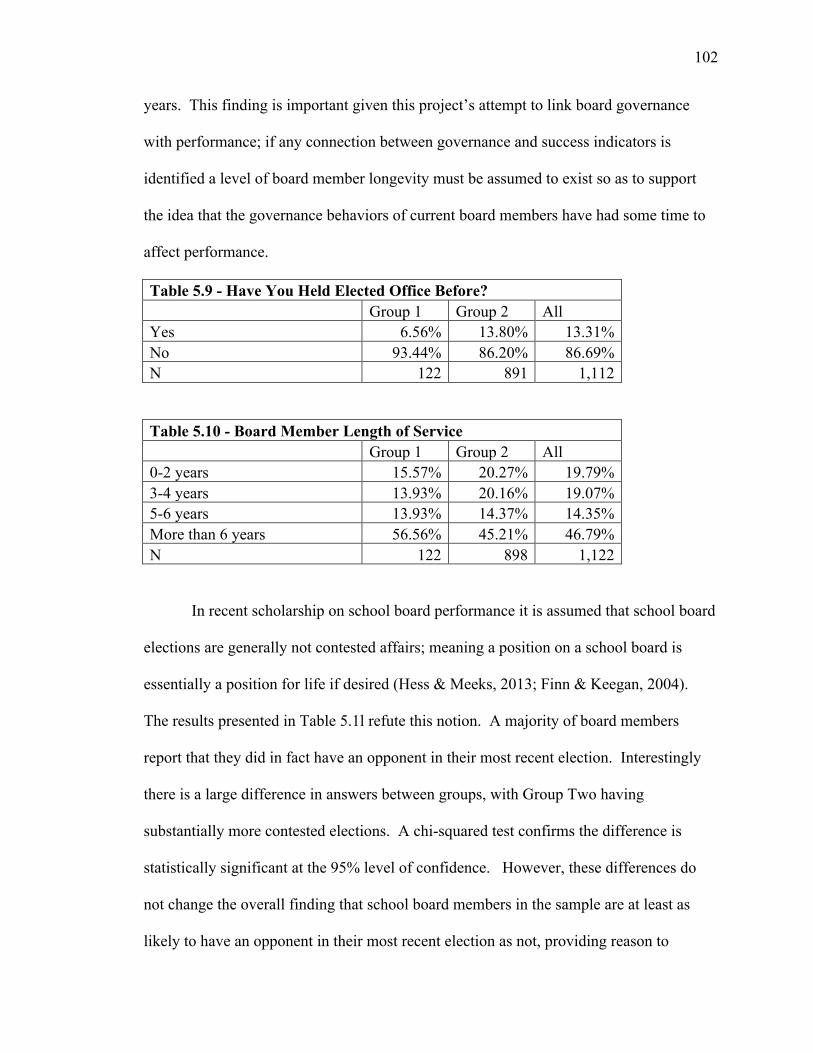
102
years. This finding is important given this project’s attempt to link board governance
with performance; if any connection between governance and success indicators is
identified a level of board member longevity must be assumed to exist so as to support
the idea that the governance behaviors of current board members have had some time to
affect performance.
Table 5.9 - Have You Held Elected Office Before? Group 1 Group 2 All Yes 6.56% 13.80% 13.31% No 93.44% 86.20% 86.69% N 122 891 1,112
Table 5.10 - Board Member Length of Service Group 1 Group 2 All 0-2 years 15.57% 20.27% 19.79% 3-4 years 13.93% 20.16% 19.07% 5-6 years 13.93% 14.37% 14.35% More than 6 years 56.56% 45.21% 46.79% N 122 898 1,122
In recent scholarship on school board performance it is assumed that school board
elections are generally not contested affairs; meaning a position on a school board is
essentially a position for life if desired (Hess & Meeks, 2013; Finn & Keegan, 2004).
The results presented in Table 5.1l refute this notion. A majority of board members
report that they did in fact have an opponent in their most recent election. Interestingly
there is a large difference in answers between groups, with Group Two having
substantially more contested elections. A chi-squared test confirms the difference is
statistically significant at the 95% level of confidence. However, these differences do
not change the overall finding that school board members in the sample are at least as
likely to have an opponent in their most recent election as not, providing reason to
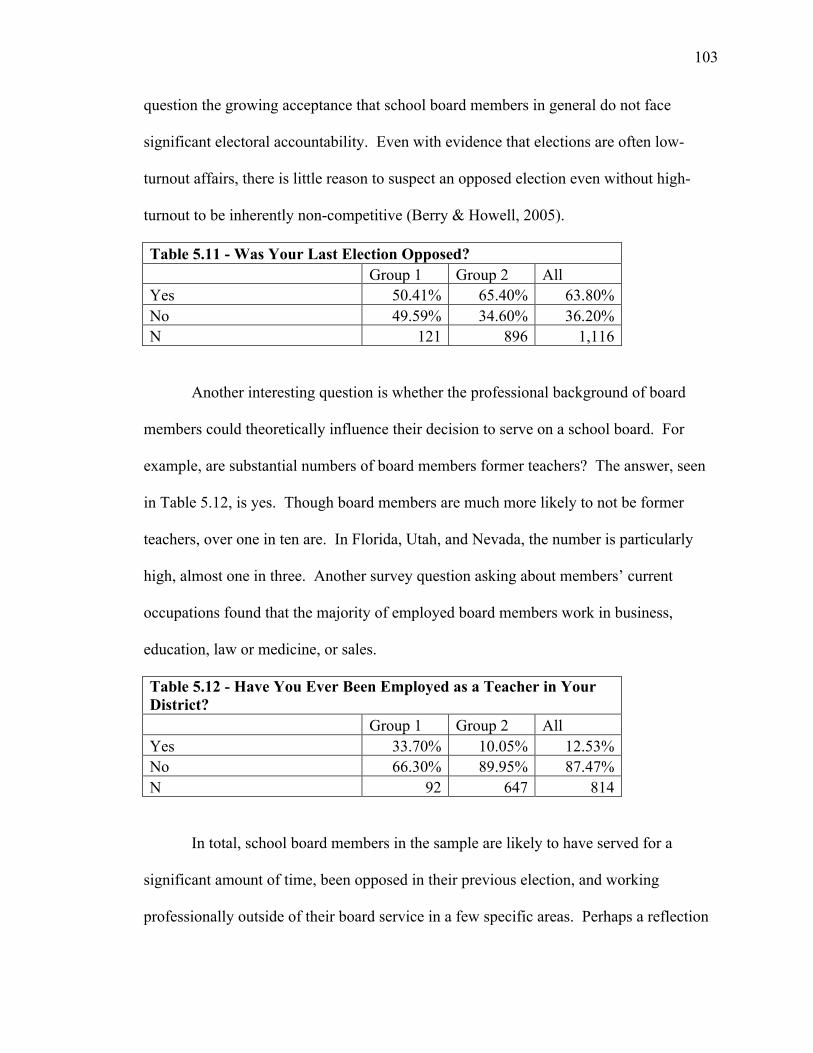
103
question the growing acceptance that school board members in general do not face
significant electoral accountability. Even with evidence that elections are often low-
turnout affairs, there is little reason to suspect an opposed election even without high-
turnout to be inherently non-competitive (Berry & Howell, 2005).
Table 5.11 - Was Your Last Election Opposed? Group 1 Group 2 All Yes 50.41% 65.40% 63.80% No 49.59% 34.60% 36.20% N 121 896 1,116
Another interesting question is whether the professional background of board
members could theoretically influence their decision to serve on a school board. For
example, are substantial numbers of board members former teachers? The answer, seen
in Table 5.12, is yes. Though board members are much more likely to not be former
teachers, over one in ten are. In Florida, Utah, and Nevada, the number is particularly
high, almost one in three. Another survey question asking about members’ current
occupations found that the majority of employed board members work in business,
education, law or medicine, or sales.
Table 5.12 - Have You Ever Been Employed as a Teacher in Your District? Group 1 Group 2 All Yes 33.70% 10.05% 12.53% No 66.30% 89.95% 87.47% N 92 647 814
In total, school board members in the sample are likely to have served for a
significant amount of time, been opposed in their previous election, and working
professionally outside of their board service in a few specific areas. Perhaps a reflection
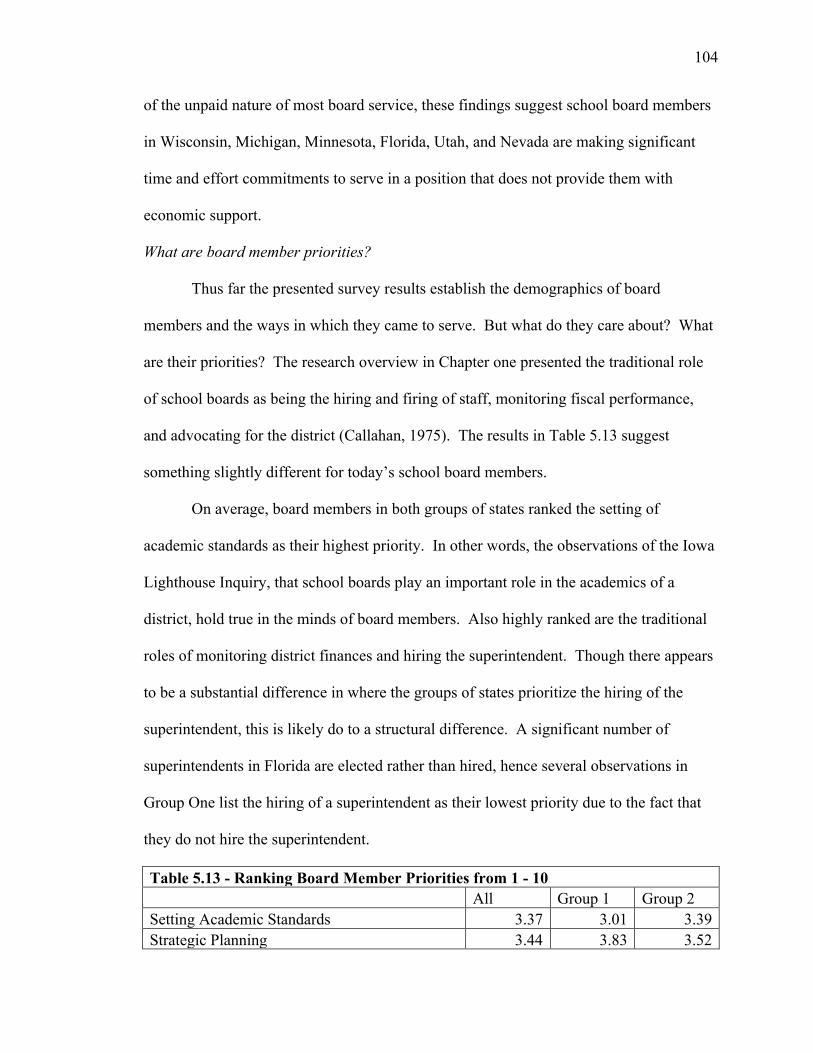
104
of the unpaid nature of most board service, these findings suggest school board members
in Wisconsin, Michigan, Minnesota, Florida, Utah, and Nevada are making significant
time and effort commitments to serve in a position that does not provide them with
economic support.
What are board member priorities?
Thus far the presented survey results establish the demographics of board
members and the ways in which they came to serve. But what do they care about? What
are their priorities? The research overview in Chapter one presented the traditional role
of school boards as being the hiring and firing of staff, monitoring fiscal performance,
and advocating for the district (Callahan, 1975). The results in Table 5.13 suggest
something slightly different for today’s school board members.
On average, board members in both groups of states ranked the setting of
academic standards as their highest priority. In other words, the observations of the Iowa
Lighthouse Inquiry, that school boards play an important role in the academics of a
district, hold true in the minds of board members. Also highly ranked are the traditional
roles of monitoring district finances and hiring the superintendent. Though there appears
to be a substantial difference in where the groups of states prioritize the hiring of the
superintendent, this is likely do to a structural difference. A significant number of
superintendents in Florida are elected rather than hired, hence several observations in
Group One list the hiring of a superintendent as their lowest priority due to the fact that
they do not hire the superintendent.
Table 5.13 - Ranking Board Member Priorities from 1 - 10 All Group 1 Group 2 Setting Academic Standards 3.37 3.01 3.39 Strategic Planning 3.44 3.83 3.52
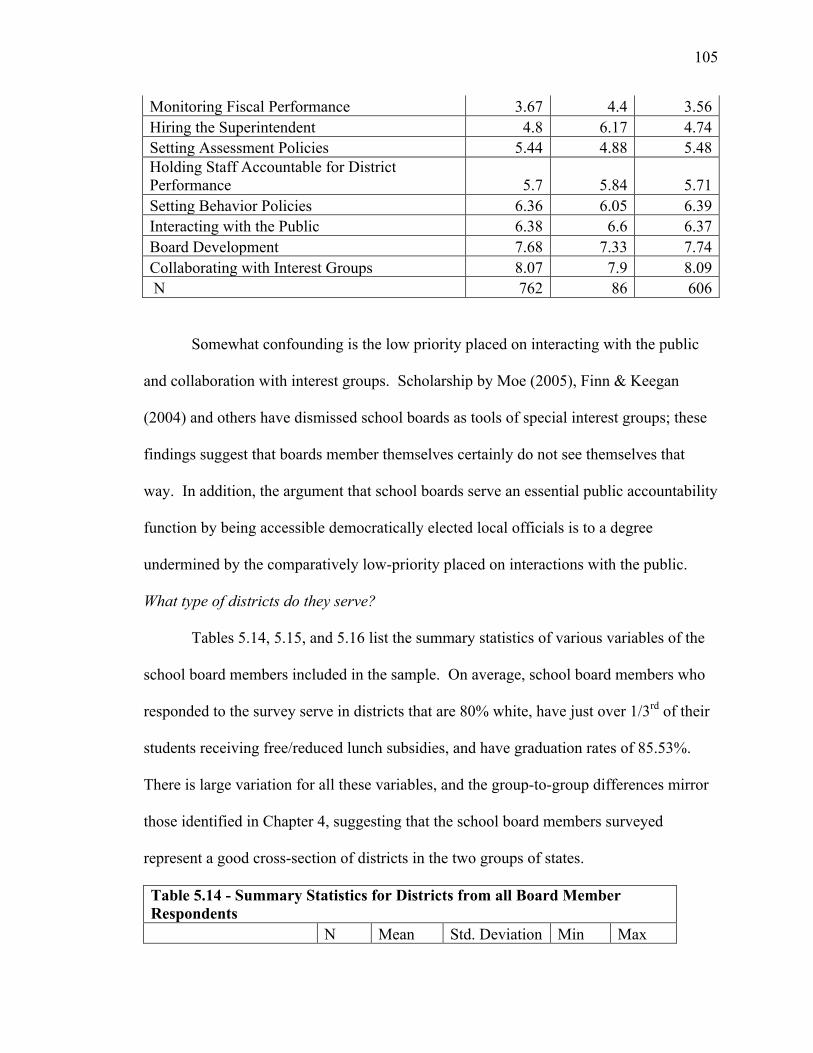
105
Monitoring Fiscal Performance 3.67 4.4 3.56 Hiring the Superintendent 4.8 6.17 4.74 Setting Assessment Policies 5.44 4.88 5.48 Holding Staff Accountable for District Performance 5.7 5.84 5.71 Setting Behavior Policies 6.36 6.05 6.39 Interacting with the Public 6.38 6.6 6.37 Board Development 7.68 7.33 7.74 Collaborating with Interest Groups 8.07 7.9 8.09 N 762 86 606
Somewhat confounding is the low priority placed on interacting with the public
and collaboration with interest groups. Scholarship by Moe (2005), Finn & Keegan
(2004) and others have dismissed school boards as tools of special interest groups; these
findings suggest that boards member themselves certainly do not see themselves that
way. In addition, the argument that school boards serve an essential public accountability
function by being accessible democratically elected local officials is to a degree
undermined by the comparatively low-priority placed on interactions with the public.
What type of districts do they serve?
Tables 5.14, 5.15, and 5.16 list the summary statistics of various variables of the
school board members included in the sample. On average, school board members who
responded to the survey serve in districts that are 80% white, have just over 1/3rd of their
students receiving free/reduced lunch subsidies, and have graduation rates of 85.53%.
There is large variation for all these variables, and the group-to-group differences mirror
those identified in Chapter 4, suggesting that the school board members surveyed
represent a good cross-section of districts in the two groups of states.
Table 5.14 - Summary Statistics for Districts from all Board Member Respondents N Mean Std. Deviation Min Max
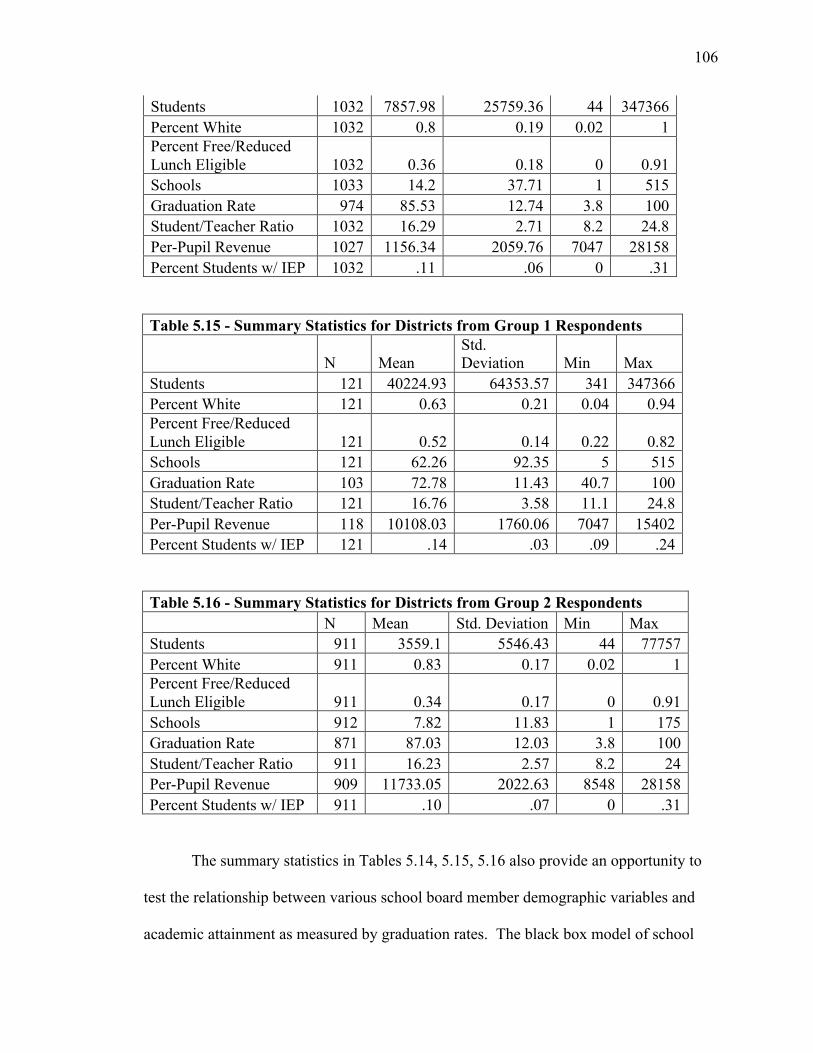
106
Students 1032 7857.98 25759.36 44 347366 Percent White 1032 0.8 0.19 0.02 1 Percent Free/Reduced Lunch Eligible 1032 0.36 0.18 0 0.91 Schools 1033 14.2 37.71 1 515 Graduation Rate 974 85.53 12.74 3.8 100 Student/Teacher Ratio 1032 16.29 2.71 8.2 24.8 Per-Pupil Revenue 1027 1156.34 2059.76 7047 28158 Percent Students w/ IEP 1032 .11 .06 0 .31
Table 5.15 - Summary Statistics for Districts from Group 1 Respondents
N Mean Std. Deviation Min Max
Students 121 40224.93 64353.57 341 347366 Percent White 121 0.63 0.21 0.04 0.94 Percent Free/Reduced Lunch Eligible 121 0.52 0.14 0.22 0.82 Schools 121 62.26 92.35 5 515 Graduation Rate 103 72.78 11.43 40.7 100 Student/Teacher Ratio 121 16.76 3.58 11.1 24.8 Per-Pupil Revenue 118 10108.03 1760.06 7047 15402 Percent Students w/ IEP 121 .14 .03 .09 .24
Table 5.16 - Summary Statistics for Districts from Group 2 Respondents N Mean Std. Deviation Min Max Students 911 3559.1 5546.43 44 77757 Percent White 911 0.83 0.17 0.02 1 Percent Free/Reduced Lunch Eligible 911 0.34 0.17 0 0.91 Schools 912 7.82 11.83 1 175 Graduation Rate 871 87.03 12.03 3.8 100 Student/Teacher Ratio 911 16.23 2.57 8.2 24 Per-Pupil Revenue 909 11733.05 2022.63 8548 28158 Percent Students w/ IEP 911 .10 .07 0 .31
The summary statistics in Tables 5.14, 5.15, 5.16 also provide an opportunity to
test the relationship between various school board member demographic variables and
academic attainment as measured by graduation rates. The black box model of school
107
board governance presented in Figure 3.2 theorizes that the background of school board
members is a factor in determining the decision premise upon which school board
members go about the actions of governance (Simon, 1957).
Existing literature on school boards and local politics gives specific reason to
suspect that the gender of school board members affects their priorities, methods, and
ultimately performance. Vijayalakshmi (2002) argues from a feminist perspective that
women have specific unique interests tied to their gender that influence the performance
of organized institutions. Verba, Burns, and Schlozman (1997) give some context to the
diversity of political interests among different genders by presenting evidence of a gender
gap in political engagement, concluding the area female political engagement is most
prominent is education politics.
Deckman (2007) identifies differences in the reasons why men and women,
respectively, run for school board. Men, for example, are more likely to say they want to
impact government policy, and more likely to cite religious motivations than women.
Fox and Scuhmann (1999) look at local city officials and find that female officials are
more likely than men to say they want to serve the community. Perhaps most interesting,
Grogan (1999) finds women in education fields are more likely than men to have a strong
instructional background, and to seek consensus rather than control in group settings.
Though dated, a 1974 NSBA study gives very specific reasons to suspect gender
representation plays a role in school district performance. That survey asked board
members to cite their accomplishments during their service by area, specifically the
NSBA asked board members to share the areas in which they feel they made the greatest
contribution. A higher number of male board members than female cited
108
“Finance/Budget,” and a higher number of female than male board members cited
“Instructional,” (NSBA, 1974, p. 35).
In addition to gender, there is ample research suggesting that ideology plays a
significant role in the way in which people make both governance decisions and
decisions in general (Gruenfeld, 1995; March, 1994; Hackworth, 2007). Also of interest
is the way school board member age might impact school board performance as
measured by academic attainment. Given the rapid changes in the use of technology and
management techniques in education there is good reason to suspect that younger board
members are more adept at governing for higher performance (Peterson, 2010;
Christensen et. al., 2008; Moe & Chubb, 2009; Odden, 2011).
The three tables below, 5.17, 5.18, and 5.19, contain the results of OLS regression
models testing the hypothesis that there exists a relationship between school board
member demographics and background characteristics and school district performance as
defined by high school graduation rates.2 Table 5.17 shows the results of three OLS
regression models using data for all school board respondents where the dependent
variable is high school graduation rates. The only significant focal variable in these three
models is the dummy variable indicating that a board member was formerly a teacher
employed by the district. Interestingly the relationship is negative, indicating that
districts with former teachers serving on their school board have lower high school
graduation rates. However, comparisons of beta weights in each model show that the
strength of this relationship is dwarfed by the negative relationships between race and
2 Note that a control variable for the number of schools per-district was dropped due to multicolinearity. The reference variable for ideology was Moderate, and the reference variable for education was Some College.

109
socioeconomic status and high school graduation rates. In the All Variables model, for
example, the former teacher dummy has a beta weight of -.07 while the Pct.
Free/Reduced Lunch variable has a beta weight of -.52.
Table 5.17 – OLS Models Predicting High School Graduation Rates for All Board Members All Variables Background Age and
Gender VARIABLES Graduation
Rate Graduation
Rate Graduation
Rate Age 0.0116 0.00299 (0.0389) (0.0382) Female Dummy -0.852 -0.784 (0.742) (0.725) Conservative Dummy 0.458 0.694 (0.869) (0.831) Liberal Dummy 0.231 -0.0304 (1.037) (0.990) Non-Partisan Dummy 1.502 1.644 (1.211) (1.168) High School Graduate Dummy -1.580 -1.460 (1.981) (1.841) Bachelor’s Degree Dummy 1.085 0.675 (0.966) (0.924) Advanced Degree Dummy 0.537 0.308 (0.994) (0.932) Former Teacher Dummy -2.903* -2.785* (1.185) (1.146) Pct. Free/Reduced Lunch -38.22*** -37.23*** -38.41*** (3.016) (2.883) (2.915) Pct. IEP -8.233 -7.818 -6.103 (7.490) (7.269) (7.370) Pupil/Teacher Ratio -0.341* -0.312 -0.362* (0.168) (0.163) (0.166) Revenue Per-Pupil 0.000201 0.000316 0.000278 (0.000250) (0.000244) (0.000243) Pct. Minority -15.35*** -16.65*** -14.98*** (2.683) (2.569) (2.655) Number of Students in District -1.43e-05 -1.80e-05 -1.33e-05 (1.54e-05) (1.36e-05) (1.54e-05) Constant 106.1*** 104.3*** 106.7*** (5.562) (5.094) (5.360)
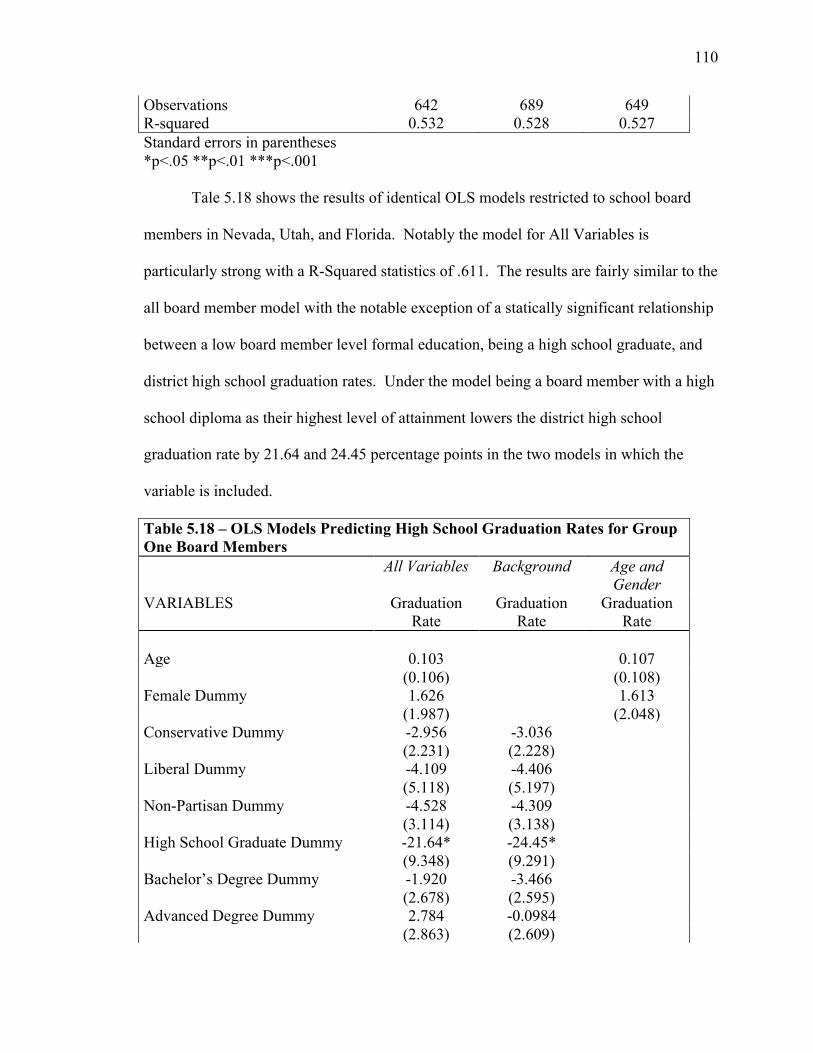
110
Observations 642 689 649 R-squared 0.532 0.528 0.527 Standard errors in parentheses *p<.05 **p<.01 ***p<.001
Tale 5.18 shows the results of identical OLS models restricted to school board
members in Nevada, Utah, and Florida. Notably the model for All Variables is
particularly strong with a R-Squared statistics of .611. The results are fairly similar to the
all board member model with the notable exception of a statically significant relationship
between a low board member level formal education, being a high school graduate, and
district high school graduation rates. Under the model being a board member with a high
school diploma as their highest level of attainment lowers the district high school
graduation rate by 21.64 and 24.45 percentage points in the two models in which the
variable is included.
Table 5.18 – OLS Models Predicting High School Graduation Rates for Group One Board Members All Variables Background Age and
Gender VARIABLES Graduation
Rate Graduation
Rate Graduation
Rate Age 0.103 0.107 (0.106) (0.108) Female Dummy 1.626 1.613 (1.987) (2.048) Conservative Dummy -2.956 -3.036 (2.231) (2.228) Liberal Dummy -4.109 -4.406 (5.118) (5.197) Non-Partisan Dummy -4.528 -4.309 (3.114) (3.138) High School Graduate Dummy -21.64* -24.45* (9.348) (9.291) Bachelor’s Degree Dummy -1.920 -3.466 (2.678) (2.595) Advanced Degree Dummy 2.784 -0.0984 (2.863) (2.609)
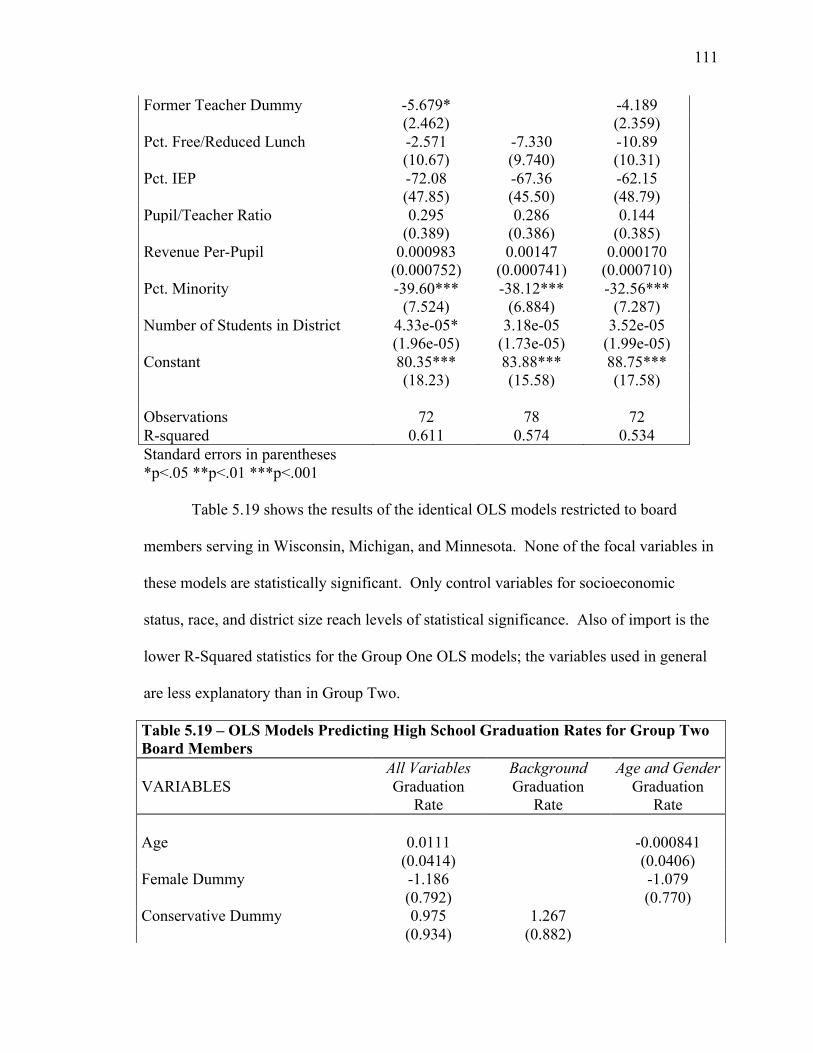
111
Former Teacher Dummy -5.679* -4.189 (2.462) (2.359) Pct. Free/Reduced Lunch -2.571 -7.330 -10.89 (10.67) (9.740) (10.31) Pct. IEP -72.08 -67.36 -62.15 (47.85) (45.50) (48.79) Pupil/Teacher Ratio 0.295 0.286 0.144 (0.389) (0.386) (0.385) Revenue Per-Pupil 0.000983 0.00147 0.000170 (0.000752) (0.000741) (0.000710) Pct. Minority -39.60*** -38.12*** -32.56*** (7.524) (6.884) (7.287) Number of Students in District 4.33e-05* 3.18e-05 3.52e-05 (1.96e-05) (1.73e-05) (1.99e-05) Constant 80.35*** 83.88*** 88.75*** (18.23) (15.58) (17.58) Observations 72 78 72 R-squared 0.611 0.574 0.534 Standard errors in parentheses *p<.05 **p<.01 ***p<.001
Table 5.19 shows the results of the identical OLS models restricted to board
members serving in Wisconsin, Michigan, and Minnesota. None of the focal variables in
these models are statistically significant. Only control variables for socioeconomic
status, race, and district size reach levels of statistical significance. Also of import is the
lower R-Squared statistics for the Group One OLS models; the variables used in general
are less explanatory than in Group Two.
Table 5.19 – OLS Models Predicting High School Graduation Rates for Group Two Board Members All Variables Background Age and Gender VARIABLES Graduation
Rate Graduation
Rate Graduation
Rate Age 0.0111 -0.000841 (0.0414) (0.0406) Female Dummy -1.186 -1.079 (0.792) (0.770) Conservative Dummy 0.975 1.267 (0.934) (0.882)

112
Liberal Dummy 0.628 0.255 (1.060) (1.002) Non-Partisan Dummy 2.021 2.118 (1.291) (1.235) High School Graduate Dummy -0.914 -0.790 (2.014) (1.860) Bachelor’s Degree Dummy 1.854 1.382 (1.016) (0.967) Advanced Degree Dummy 1.075 1.001 (1.053) (0.984) Former Teacher Dummy -2.658 -2.507 (1.355) (1.312) Pct. Free/Reduced Lunch -40.54*** -39.63*** -40.88*** (3.178) (3.033) (3.089) Pct. IEP -3.968 -4.643 -1.603 (7.752) (7.464) (7.638) Pupil/Teacher Ratio -0.602** -0.570** -0.627** (0.200) (0.193) (0.198) Revenue Per-Pupil -6.14e-05 -4.17e-05 2.45e-05 (0.000285) (0.000277) (0.000279) Pct. Minority -9.020** -9.638** -8.451** (3.147) (3.025) (3.135) Number of Students in District -0.000198* -0.000198** -0.000202** (8.36e-05) (7.06e-05) (8.21e-05) Constant 113.0*** 112.0*** 114.4** (6.255) (5.816) (6.078) Observations 570 611 577 R-squared 0.486 0.488 0.477 Standard errors in parentheses *p<.05 **p<.01 ***p<.001
Discussion and Conclusion
The presented results yield several interesting insights and questions into the
relationship between school board member backgrounds and district level attainment.
Overall, there is very limited evidence of a general relationship between school board
member demographics and backgrounds and district level attainment. For example, a
connection between gender and higher district level outcomes, identified by the author in
a previous study of Wisconsin, does not appear to exist when Wisconsin results are
113
pooled with the five other states of interest (Ford, 2012). In addition, ideology and age,
both of which present a myriad of theoretical reasons to suspect a relationship with
performance yield no statistically significant relationship in any of the presented models.
The only two statistically significant independent variables were the dummy
variables for being a former teacher (though only in the all board member and Group One
models), and the variable indicating high school graduate as the highest level of
educational attainment (also restricted to Group One). Somewhat surprisingly, the
dummy for being a former teacher is negatively related to attainment in Group One.
Intuitively, one might suspect that being a former teacher would bode well for school
board performance given their experience on the ground in the district.
Consideration was given to the possibility that former teachers, perhaps
disheartened with the academic direction of the district, run for school board in an
attempt to change things. To test this possibility the author restricted the models in
Tables 5.17 and 5.18 to school board members with three or more, and five or more,
years of experience. The logic being that once a former teacher had longevity on the
board, his or her experience would begin to have a positive impact. However, the results
were not substantially different in the restricted models. It is possible that the skills
needed to manage a classroom do not translate well to board governance. Or, because the
negative impact was only in Group One, comprised of states with lower teacher pay and
benefits, that former teachers serving on these boards ran primarily to improve the
comparatively worse compensation packages in their states.
114
The negative relationship between low board member education levels and district
attainment observed in Group One is a meaningless finding. It is driven be a single
observation from a very low-performing district.
While the extensive original data presented on school board member
characteristics in the six states of interest paint a picture of a typical school board
member - White, in his or her 50s, politically moderate to conservative, elected in a
contested election – the findings in Tables 5.17, 5.18 and 5.19 show that there is no ideal
school board member in terms of demographics and background. Even the finding of a
negative link between being a former teacher serving on a school board and district
graduation rates presents, at best, a flimsy case.
This begs the question: Does it matter who serves on school boards? Clearly
school boards perform certain tasks as described in previous chapters, and intuitively the
skills and background members bring to those tasks are important. However, the primary
finding in this chapter, that no ideal prototype of a school board member exists, is on the
surface problematic. The outgrowth of this conclusion is that improving the performance
of school boards as it relates to affecting academic outcomes is not as easy as finding
better people to serve on school boards. Hence, the increasingly popular notion that the
primary failing of school board members is that they are merely interest group pawns
elected in low-turnout elections is inherently flawed (Maeroff, 2010; Keegan & Finn,
2004). The challenge of improving school board performance is more complex than
moving elections to increase turnout, recruiting better candidates, or limiting the role of
Democracy.

115
The following chapter switches the unit of analysis from the individual school
board member to the school board as a group. This shift in the unit of analysis reflects
prior research by Grissom (2012), but also assumes that when measuring the effects of
adherence to the key work of school boards the board itself is greater than the sum of its
parts. While the demographics and backgrounds of school board members may not, on
aggregate, directly affect district performance, they do affect the governance process. In
other words, as stated previously, the way in which board members go about performing
the essential tasks of school boards matter in the context of the school board as a whole.
We should not expect an ideal board member prototype to exist in an institution as
localized and situation dependent as school boards. So yes, the backgrounds of school
board member do matter, but primarily as they relate to the school board as a whole.

116
Chapter VI. Connecting Board Governance to Outcomes: Testing the NSBA Key Work of School
Boards
A school board member serving in the United States looking to maximize the
effectiveness of his or her governance behavior can draw upon any number of scholarly
and non-scholarly sets of best practices. Most of these best practices focus on common
good government themes long present in existing literature on governance. However, as
the primary role of school boards is more universally recognized as raising student
achievement there grows a need to better understand the connections between the best
practice and good governance literature and academic outcomes.
The most prominent set of best practices is the Key Work of School Boards
created by the National School Boards Association (NSBA). As will be explained in the
literature review, the Key Works consist of a several policy areas established through
consensus that to which, the NSBA suggests, boards looking to improve academic
achievement should adhere. The following chapter operationalizes adherence to the key
works of school boards with 17 survey items answered by school board members on a
five point Likert scale. The goal is to establish whether boards indicating greater levels
of adherence to the Key Work areas also have better academic outcomes. This chapter
tests the following hypothesis:
Greater adherence to the eight components of the NSBA’s Key Work of School
Boards positively impacts district level academic outcomes.
There are several notable limitations to the methodologies deployed in this
chapter. First, the questions operationalizing the degree of adherence to individual Key
Works were generated by the author. Though questions were tweaked, reviewed by
117
school board experts, fellow students, and faculty, there is no way to guarantee that they
perfectly align with the Key Works. However, the significant overlap between the survey
questions and many of the concepts highlighted in the school board literature ensure that
the responses at the very least contribute new and meaningful knowledge on the
connection between board governance perceptions and academic outcomes.
Second, the survey responses are only measures of school board member
perceptions, not actual observations. Though survey answers for boards with multiple
respondents were averaged out in a methodology employed by Grissom (2012), they still
must be taken as perceptions. It is also possible that certain items were prone to response
bias, but there is no reason to believe that any biases differed by sub-group, suggesting
they were consistent. The limited impact of individual board member characteristics on
academic outcomes established in the previous chapter lends a degree of support to this
conclusion.
Third, the academic outputs used to measure board performance are flawed out of
necessity. Though high school graduation rates is an intuitively satisfying indicator of
school district success reported to the National Center for Education Statistics, the
standards and requirements for graduation vary across states. Similar limitations exist
with the use of high school dropout rate as a dependent variable. Whenever possible
group-to-group comparisons and the use of test achievement data in Wisconsin are used
to strengthen (or give cause to question) identified links between governance and
outcomes.
Finally, the largest limitation is the difficulty in proving with a high-degree of
confidence that adherence to these keys actually caused better or worse district academic
118
outcomes. To offset this limitation, models restricted to boards with a self-identified high
level of stability in terms of board turnover, control variables for district level
demographics, and control variables for board member characteristics are used. Though
the use of these methods still precludes concluding with absolute certainty that board
governance characteristics directly changed academic outcomes, they do allow for a high-
degree of confidence in conclusions that certain governance behaviors are linked to
higher school district-level outcomes.
Literature Review
Gemberling et. al. (2000) authored the official Key Work of School Boards
document with their stated goal as answering “[w]hat can board members do to ensure
that their school boards meet the demands for increased student achievement” and “what
are the actions boards need to take.” (Gemberling et. al., 2000, p. 1.)” Much emphasis in
the document is placed on systems thinking; in other words all of Key Works are
described with the other Key Works in mind. The specific Works are:
• Vision;
• Standards;
• Assessment;
• Accountability;
• Climate;
• Collaboration; and
• Continuous Improvement
Importantly the NSBA does not claim that their recommendations are research
based, however the organization does state (Gemberling et. al., 2000, p. 1):

119
The purpose of the Key Work is to help school boards engage their communities and improve student achievement through effective governance. The better these eight essential areas are integrated into a systematic process, the better the results will be for all stakeholders.
In other words a very specific claim is made that adherence to these areas should
be expected to improve district level results. The best practices highlighted by the NSBA
mirror best practice recommendations for school boards made by other organizations.
The Center for Public Education’s “Eight Characteristics of Effective School Boards,” for
example, emphasize that effective boards work together, work closely with their
superintendent, use data, and collaborate with staff and the community (Devariecs &
O’Brein, 2011).
Others, including Rice et. al (2000), Walser (2009) and Smoley (2009) offer up
very similar best practices emphasizing collaboration with stakeholders, staff
accountability, and systems thinking. But in all of these best practices there is limited
research that higher achieving boards actually focus on the highlighted topics or exhibit
highlighted characteristics. The following section attempts to fill this research gap by
building on the evidence identifying the importance of school boards unearthed by the
Iowa Lighthouse Inquiry by specifically linking each Key Work of board governance to
the survey answers of school board members in Wisconsin, Michigan, Minnesota,
Nevada, Florida and Utah.
Data
Figure 6.1 lists the numbers of board level responses by state and group, as well
as the number of districts in each category. As stated earlier the board level response
rate, defined as the number of school boards where at least one board member responded
to the survey, was 44.2%. By design this project is a case study, meaning the results
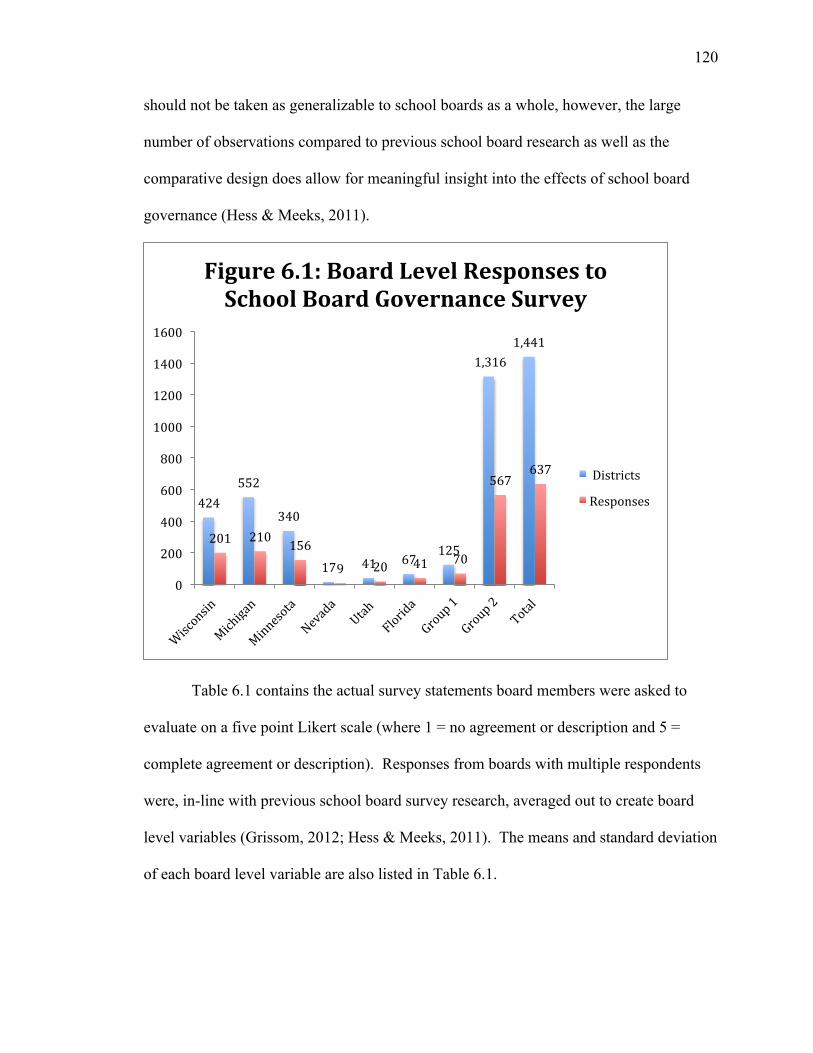
120
should not be taken as generalizable to school boards as a whole, however, the large
number of observations compared to previous school board research as well as the
comparative design does allow for meaningful insight into the effects of school board
governance (Hess & Meeks, 2011).
Table 6.1 contains the actual survey statements board members were asked to
evaluate on a five point Likert scale (where 1 = no agreement or description and 5 =
complete agreement or description). Responses from boards with multiple respondents
were, in-line with previous school board survey research, averaged out to create board
level variables (Grissom, 2012; Hess & Meeks, 2011). The means and standard deviation
of each board level variable are also listed in Table 6.1.
424 552
340
17 41 67 125
1,316 1,441
201 210 156
9 20 41 70
567 637
0
200
400
600
800
1000
1200
1400
1600
Figure 6.1: Board Level Responses to School Board Governance Survey
Districts
Responses

121
Table 6.1 – Questions Linked to Key Works of School Boards Vision Obs. Mean SD We engage in continuous strategic planning, our plan is frequently updated
482 2.99 1.23
We engage in planning when the academic and/or fiscal direction of the district needs to be changed.
482 3.22 1.08
Standards We set and tweak district academic standards in response to
student needs. 483 3.31 1.01
Assessment We set and tweak district assessment policies in response to student needs. For example, if we see our students struggling in math we will increase the use of math assessments.
481 3.29 .99
Accountability We support and defend the decisions of the Superintendent until concerns with those decisions arise.
478 3.00 1.16
We allow the Superintendent to manage the district as he or she sees fit, but regularly monitor and review his or her performance
479 3.90 .96
Members take responsibility for past decisions. 488 3.63 .78 Alignment My school district has adopted a performance budgeting process. Programs must show and document activities and levels of program success in order to continue receiving current levels of funding.
488 1.96 .92
Climate Members are open about how they feel about other members’ preferences.
487 3.29 .84
Members are open about their own preferences. 488 3.81 .70 Members willingly try new things without fear of ridicule. 488 3.47 .87 Members willingly try new things without fear of retribution. 487 3.55 .88 Collaboration and Engagement We look for a superintendent (or principal if a charter board) that shares the values of, and is willing to be a collaborator with, the school board.
478 3.94 1.03
We regularly listen to the ideas of organized interest groups and act on their input when we deem it appropriate.
478 2.83 1.05
We regularly listen to the ideas of community members and act on their input when we deem it appropriate.
478 3.52 .84
Continuous Improvement We frequently and consistently engage in board development activities.
475 2.90 1.30
We do not engage in any formal board development 479 2.04 1.11 All variables on 1 to 5 scale where 1 = No agreement or description and 5 = Complete agreement or description

122
Table 6.2 contain summary statistics for the district-level outcomes variables
sorted by group, where Group One = boards in Nevada, Utah, and Florida, Group Two =
boards in Wisconsin, Michigan, Minnesota, and Stable = boards where the board level
response to the statement “In the past five years our school board has had very little board
turnover” is at or above three. The use of the stable board restriction is an attempt to
gauge any differences between boards with a mutual governance history and those where
governance behaviors which may not have had time to actually affect outcomes. As
explained earlier, the two dependent variables measure two fundamentally different
things. High school graduation rate represents a long-term achievement and is an
intuitive measure of district academic health (Swanson, 2003). Dropout rates are a single
year variable measuring a district failing; the inability, for whatever reason, to keep a
child enrolled in school.
Table 6.2 – Summary Statistics for Dependent Variables Graduation Rate N Mean Std. Dev. All Boards 597 85.33 12.92 Group One 60 72.63 11.09 Group Two 537 86.75 12.33 Stable Boards 414 85.08 13.06 Drop Out Rate All Boards 593 2.47 3.19 Group One 67 2.64 1.73 Group Two 524 2.46 3.34 Stable Boards 414 2.52 3.39
In all models the following district level control variables are used unless
otherwise noted:

123
• Percent of students eligible for free/reduced lunch: A proxy for low-income
status;
• Percent white student population;
• The percent of students with special needs as indicated as being assigned an
individual educational plan;
• The pupil-teacher ratio, an indication of school level staffing; and
• The total amount of public revenue per-pupil received by the district.
All of these control variables are well established to have an effect on academic
achievement outside of the control of school districts (socio-economic status, special
needs status) or offer intuitive potential relationships with academic outcomes even if
research is mixed (pupil-teach ratio and total revenue per-pupil). Additional control
variables were considered and excluded. The percentage of district students with English
Language Learner status was excluded due to high multicolinearity with race. The
number of schools operated by the district as well as the location (urban, rural, suburban,
or town) were excluded due to high multicolinearity with number of students served.
Board member control variables for race, background, age, and sex were excluded
in board level models due to a low degree of certainty that the demographics of a subset
of board members across districts represents the demographics of the board as a whole.
While this problem may be present in any board level variable, there is more reason to
assume, including in the results linking board member demographics to outcomes in the
previous chapter, that perceptions of board members and any potential perception bias are
evenly distributed (Hess & Meeks, 2011; Grissom, 2012).
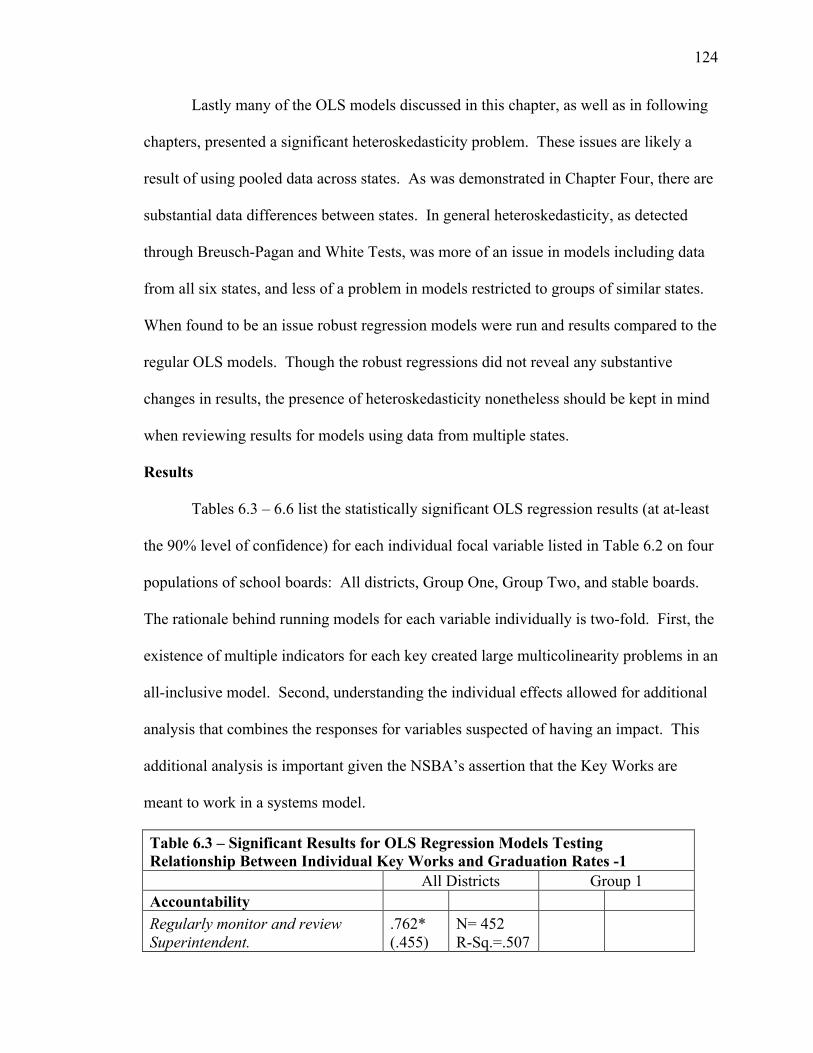
124
Lastly many of the OLS models discussed in this chapter, as well as in following
chapters, presented a significant heteroskedasticity problem. These issues are likely a
result of using pooled data across states. As was demonstrated in Chapter Four, there are
substantial data differences between states. In general heteroskedasticity, as detected
through Breusch-Pagan and White Tests, was more of an issue in models including data
from all six states, and less of a problem in models restricted to groups of similar states.
When found to be an issue robust regression models were run and results compared to the
regular OLS models. Though the robust regressions did not reveal any substantive
changes in results, the presence of heteroskedasticity nonetheless should be kept in mind
when reviewing results for models using data from multiple states.
Results
Tables 6.3 – 6.6 list the statistically significant OLS regression results (at at-least
the 90% level of confidence) for each individual focal variable listed in Table 6.2 on four
populations of school boards: All districts, Group One, Group Two, and stable boards.
The rationale behind running models for each variable individually is two-fold. First, the
existence of multiple indicators for each key created large multicolinearity problems in an
all-inclusive model. Second, understanding the individual effects allowed for additional
analysis that combines the responses for variables suspected of having an impact. This
additional analysis is important given the NSBA’s assertion that the Key Works are
meant to work in a systems model.
Table 6.3 – Significant Results for OLS Regression Models Testing Relationship Between Individual Key Works and Graduation Rates -1
All Districts Group 1
Accountability Regularly monitor and review Superintendent.
.762* (.455)
N= 452 R-Sq.=.507
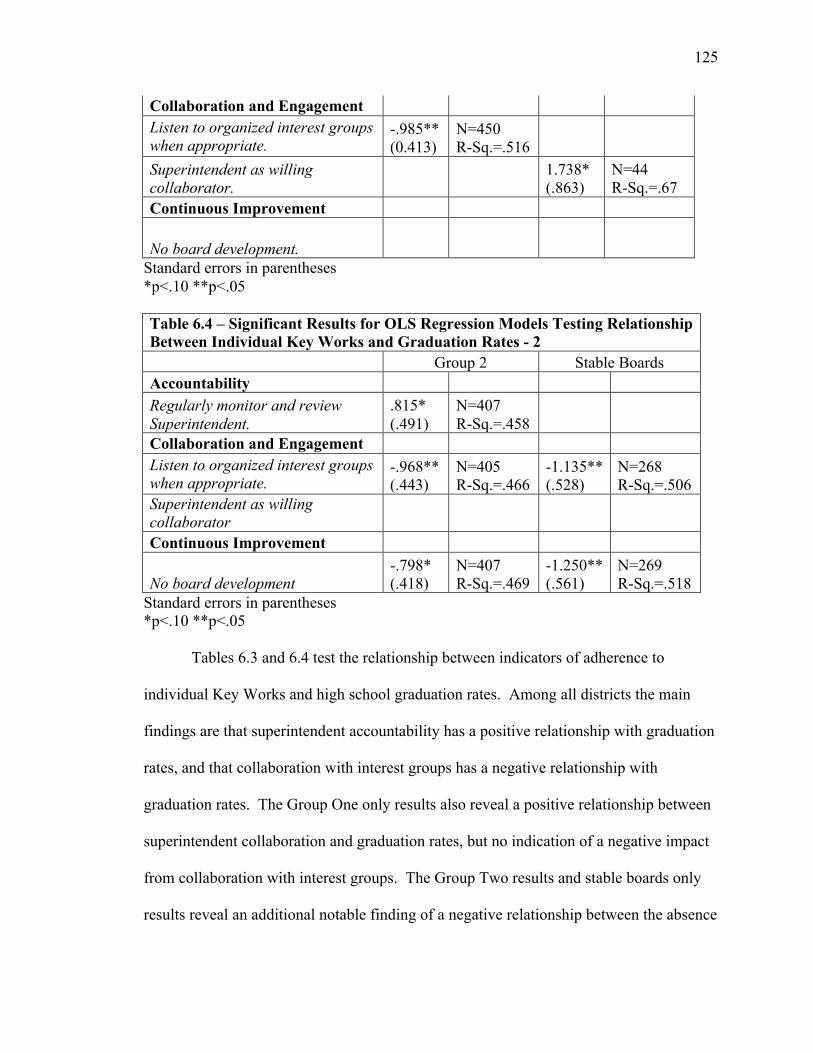
125
Collaboration and Engagement Listen to organized interest groups when appropriate.
-.985** (0.413)
N=450 R-Sq.=.516
Superintendent as willing collaborator.
1.738* (.863)
N=44 R-Sq.=.67
Continuous Improvement
No board development. Standard errors in parentheses *p<.10 **p<.05
Table 6.4 – Significant Results for OLS Regression Models Testing Relationship Between Individual Key Works and Graduation Rates - 2
Group 2 Stable Boards
Accountability Regularly monitor and review Superintendent.
.815* (.491)
N=407 R-Sq.=.458
Collaboration and Engagement Listen to organized interest groups when appropriate.
-.968** (.443)
N=405 R-Sq.=.466
-1.135** (.528)
N=268 R-Sq.=.506
Superintendent as willing collaborator Continuous Improvement
No board development -.798* (.418)
N=407 R-Sq.=.469
-1.250** (.561)
N=269 R-Sq.=.518
Standard errors in parentheses *p<.10 **p<.05
Tables 6.3 and 6.4 test the relationship between indicators of adherence to
individual Key Works and high school graduation rates. Among all districts the main
findings are that superintendent accountability has a positive relationship with graduation
rates, and that collaboration with interest groups has a negative relationship with
graduation rates. The Group One only results also reveal a positive relationship between
superintendent collaboration and graduation rates, but no indication of a negative impact
from collaboration with interest groups. The Group Two results and stable boards only
results reveal an additional notable finding of a negative relationship between the absence

126
of formal board development and graduation rates. Also, the positive relationship
between the superintendent and board disappeared when restricted to stable boards only.
Table 6.5 – Significant Results for OLS Regression Models Testing Relationship Between Individual Key Works and Dropout Rates -1
All Districts Group 1
Accountability Support and defend Superintendent until concerns arise.
-.212** (.092)
N=447 R-Sq.=.213
Regularly monitor and review Superintendent
-.234** (.110)
N=448 R-Sq.=.212
Collaboration and Engagement Listen to organized interest groups when appropriate.
.197** (.098)
N=447 R-Sq.=.197
Continuous Improvement Consistently engage in board development.
-.139* (.084)
N=444 R-Sq.=.213
Standards
Set standards in response to needs
.425* (.228)
N=49 R-Sq.=.478
Collaboration and Engagement Superintendent as willing collaborator
-.314** (.125)
N=473 R-Sq.=.163
Standard errors in parentheses *p<.10 **p<.05
Table 6.6 – Significant Results for OLS Regression Models Testing Relationship Between Individual Key Works and Dropout Rates - 2
Group 2 Stable Boards
Accountability Support and defend Superintendent until concerns arise.
-.206** (.100)
N=398 R-Sq.=.215
-.213** (.108)
N=269 R-Sq.=.238
Regularly monitor and review Superintendent
-.250** (.121)
N=398 R-Sq.=.217
Collaboration and Engagement Listen to organized interest groups when appropriate.
.237** (.107)
N=397 R-Sq.=.203
.242** (.109)
N=269 R-Sq.=.217
Continuous Improvement Consistently engage in board development. Standards Set standards in response to needs

127
Collaboration and Engagement Superintendent as willing collaborator
-.268** (.136)
N=422 R-Sq.=.156
Standard errors in parentheses *p<.10 **p<.05
Tables 6.5 and 6.6 list the results of OLS regression models for indicators of
adherence to the Key Work of School Boards and high school dropout rates. The results
across groups are very similar to the results presented for the dependent variable
graduation rates. Among all boards support and even collaboration with the
superintendent is related to lower dropout rates, as is engagement in continuous strategic
planning. Also present is the negative impact of collaboration with interest groups.
The one confounding finding is the presence of a positive relationship between
dropout rates and setting standards in response to student needs on Group One boards; in
other words setting standards in response to student needs relates to higher dropout rates.
One plausible explanation is that because Florida, Utah, and Nevada all use high stake
testing that can result in grade retention, struggling students are discouraged and drop
out. Even simpler, increasing standards could drive away some students that are unable
to meet these higher standards. So, while dropout rates go up students remaining in
school may be better served, or at least show better aggregate results.
The OLS regression results presented show some initial findings. First, none of
the indicators of the Key Works have a negative relationship with district level outcomes
except collaboration with interest groups. Second, two concepts appear to have a positive
relationship with district outcomes:
1) Planning and development; and
2) Superintendent accountability and collaboration.
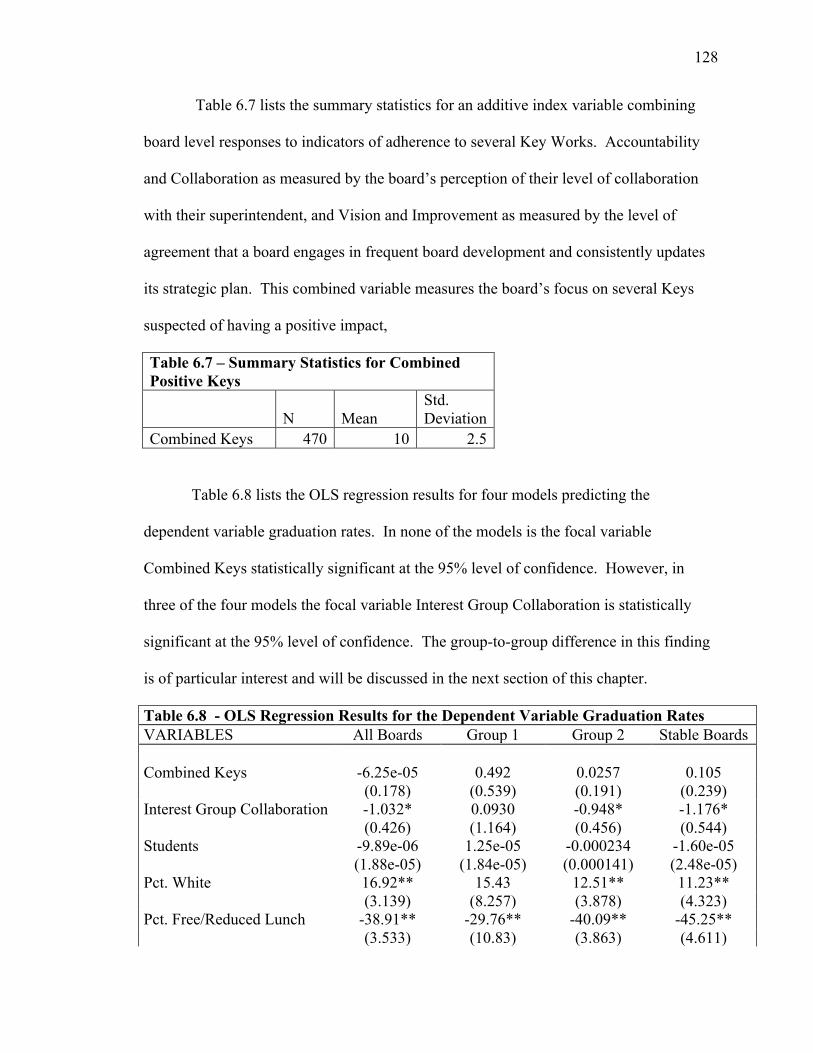
128
Table 6.7 lists the summary statistics for an additive index variable combining
board level responses to indicators of adherence to several Key Works. Accountability
and Collaboration as measured by the board’s perception of their level of collaboration
with their superintendent, and Vision and Improvement as measured by the level of
agreement that a board engages in frequent board development and consistently updates
its strategic plan. This combined variable measures the board’s focus on several Keys
suspected of having a positive impact,
Table 6.7 – Summary Statistics for Combined Positive Keys
N Mean Std. Deviation
Combined Keys 470 10 2.5
Table 6.8 lists the OLS regression results for four models predicting the
dependent variable graduation rates. In none of the models is the focal variable
Combined Keys statistically significant at the 95% level of confidence. However, in
three of the four models the focal variable Interest Group Collaboration is statistically
significant at the 95% level of confidence. The group-to-group difference in this finding
is of particular interest and will be discussed in the next section of this chapter.
Table 6.8 - OLS Regression Results for the Dependent Variable Graduation Rates VARIABLES All Boards Group 1 Group 2 Stable Boards Combined Keys -6.25e-05 0.492 0.0257 0.105 (0.178) (0.539) (0.191) (0.239) Interest Group Collaboration -1.032* 0.0930 -0.948* -1.176* (0.426) (1.164) (0.456) (0.544) Students -9.89e-06 1.25e-05 -0.000234 -1.60e-05 (1.88e-05) (1.84e-05) (0.000141) (2.48e-05) Pct. White 16.92** 15.43 12.51** 11.23** (3.139) (8.257) (3.878) (4.323) Pct. Free/Reduced Lunch -38.91** -29.76** -40.09** -45.25** (3.533) (10.83) (3.863) (4.611)
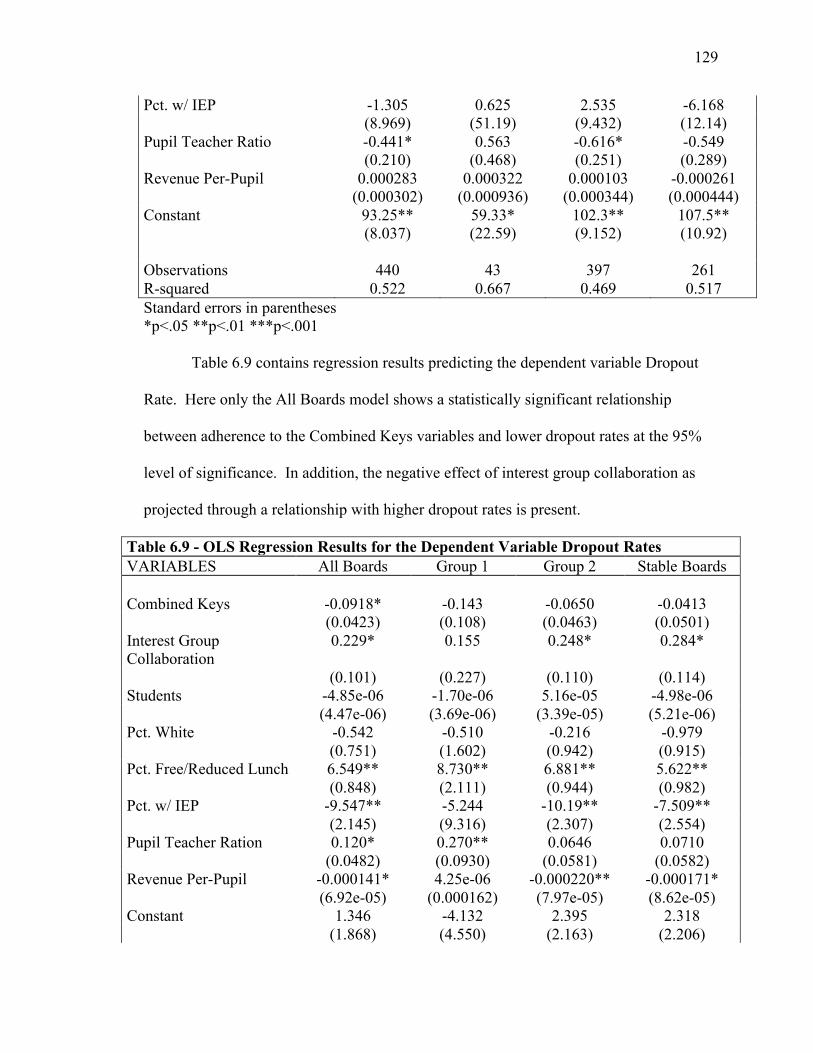
129
Pct. w/ IEP -1.305 0.625 2.535 -6.168 (8.969) (51.19) (9.432) (12.14) Pupil Teacher Ratio -0.441* 0.563 -0.616* -0.549 (0.210) (0.468) (0.251) (0.289) Revenue Per-Pupil 0.000283 0.000322 0.000103 -0.000261 (0.000302) (0.000936) (0.000344) (0.000444) Constant 93.25** 59.33* 102.3** 107.5** (8.037) (22.59) (9.152) (10.92) Observations 440 43 397 261 R-squared 0.522 0.667 0.469 0.517 Standard errors in parentheses *p<.05 **p<.01 ***p<.001
Table 6.9 contains regression results predicting the dependent variable Dropout
Rate. Here only the All Boards model shows a statistically significant relationship
between adherence to the Combined Keys variables and lower dropout rates at the 95%
level of significance. In addition, the negative effect of interest group collaboration as
projected through a relationship with higher dropout rates is present.
Table 6.9 - OLS Regression Results for the Dependent Variable Dropout Rates VARIABLES All Boards Group 1 Group 2 Stable Boards Combined Keys -0.0918* -0.143 -0.0650 -0.0413 (0.0423) (0.108) (0.0463) (0.0501) Interest Group Collaboration
0.229* 0.155 0.248* 0.284*
(0.101) (0.227) (0.110) (0.114) Students -4.85e-06 -1.70e-06 5.16e-05 -4.98e-06 (4.47e-06) (3.69e-06) (3.39e-05) (5.21e-06) Pct. White -0.542 -0.510 -0.216 -0.979 (0.751) (1.602) (0.942) (0.915) Pct. Free/Reduced Lunch 6.549** 8.730** 6.881** 5.622** (0.848) (2.111) (0.944) (0.982) Pct. w/ IEP -9.547** -5.244 -10.19** -7.509** (2.145) (9.316) (2.307) (2.554) Pupil Teacher Ration 0.120* 0.270** 0.0646 0.0710 (0.0482) (0.0930) (0.0581) (0.0582) Revenue Per-Pupil -0.000141* 4.25e-06 -0.000220** -0.000171* (6.92e-05) (0.000162) (7.97e-05) (8.62e-05) Constant 1.346 -4.132 2.395 2.318 (1.868) (4.550) (2.163) (2.206)

130
Observations 437 47 389 262 R-squared 0.205 0.491 0.204 0.220
Standard errors in parentheses *p<.05 **p<.01 ***p<.001
All of the models thus far focus on graduation rates and high school drop-out
rates, but what about test scores? As explained earlier the use of test scores as a
dependent variable is problematic in a multi-state study due to the non-comparability of
tests between states. However, for the sake of exploratory research models were run for
each Key Work indicator using the percentage of students scoring advanced or proficient
on the Wisconsin Knowledge and Concepts Reading Exam as the dependent variable.
Table 6.10 shows the lone significant finding at the 95% level of confidence was the
negative effect of the absence of board development on Reading proficiency levels.
Results were similar when 2008 test scores were used a control variable, meaning that at
least in Wisconsin the absence of board development is a negative predictor of reading
test score proficiency, as well as a negative predictor of changes in test score proficiency
since 2008.
Table 6.10 – Significant Result for OLS Regression Models Testing Relationship Between Individual Key Works and Reading WKCE Scores
No board development. -1.37* (.542)
N=149 R-Sq.=.256
Standard errors in parentheses *p<.05
Discussion and Conclusion
On whole it is possible to accept the hypothesis that yes, adherence to the Key
Work of School Boards has a generally positive impact on academic outcomes. Of
course, this conclusion comes with many caveats that merit further discussion.

131
First, of all the keys only accountability, vision, and continuous improvement
yield a generally positive effect. There is clear evidence holding the superintendent
accountable for performance, and planning through the use of a strategic plan and board
development yields positive outcomes compared to boards that are less focused on these
things. However, the effect of collaboration is trickier.
Collaboration with the superintendent is a positive form of collaboration. In
contrast to some recommendations in the governance literature that boards should
maintain a hands-off relationship with their CEO, close relations and collaboration
between the superintendent and school boards in the states of interest serve a positive
function (Carver, 2007). However, collaboration with interest groups has a clear negative
effect on student outcomes. Interestingly this negative effect appears to be driven by the
school boards in Wisconsin, Michigan, and Minnesota, as well as boards that have a
higher level of stability. There are many reasons to theorize why school board
collaboration with interest groups has a negative effect on outcomes in these situations.
First, it is possible that interest groups dedicated to employee issues as opposed to
student issues shift board member attention away from improving student performance.
For example, if the primary policy issue in a district is teacher pay it is possible that
student achievement concerns will be made secondary, if not ignored. It is also possible
that interest groups dedicated to lowering the property tax levy or increasing the use of
charter schools have a similar impact of moving student achievement concerns to the
bottom of the priority list.
Second, the larger number of school districts and more localized nature of district
in Wisconsin, Michigan, and Minnesota may increase the number and scope of interest

132
groups which board members in these states have to deal with. Simply, interest group
collaboration may be a time-suck for hyper-localized districts dealing with hyper-
localized concerns that fall out of the scope of daily work for board members overseeing
large districts.
Third, the negative effect of interest group collaboration on stable boards may be
related to the politicization of school board elections. The longer a board member serves,
the more they may feel indebted to the interest groups that supported them in their most
recent election. If those interest groups are pushing issues unrelated to student
achievement academic improvement may become a lower priority.
The theoretical explanations for the positive relationships between good
superintendent-board relations and board development and improved outcomes fits nicely
with the theorized black box model of school board governance in Chapter Three. In that
chapter school board governance is described as a series of situation dependent decisions,
which if made correctly, positively impact district academic performance. Not only
must board members be in tune to what is possible, wanted, and beneficial in their local
context, they must be high functioning with each other to enable them to even begin their
decision making process under the correct premise. Engaging in strategic planning is an
easily identifiable way to determine that a school board is working to understand what it
wants to be, thereby understanding how it might get there. Engaging in board
development is a clear indicator that a board is seeking to improve the way in which it
goes about decision-making. Together it increases the odds that a board understands
what it wants to do and is working actively to ensure the governing processes are in place
that allow the board to accomplish its goals. It follows that good relations with the

133
superintendent are a positive. The ground game of education is constantly shifting and
some sort of connection between the man or woman making decisions influencing that
ground game is in tune with improving the situation dependent decision-making ability of
the school board.
The fact that many of the indicators of the Key Work of School Boards did not
have a direct relationship with academic outcomes is not reason to discount the individual
concepts or to mothball the entire document. The fact that the only negative finding was
a very specific type of collaboration should lead to a high degree of confidence that
boards adhering to the best-practices presented by the NSBA are experiencing better
outcomes than those that are not.
Potential future work to further these findings includes observational research of a
sample of school board meetings testing actual adherence to these best practices by a
neutral observer as opposed to a survey of member perceptions. Additional work digging
deeper into the content of specific strategic plans and better understanding of the range of
board development processes can also further these findings. However, the presented
results provide good evidence that:
1) Specific concepts highlighted by the NSBA – accountability, vision, and
continuous improvement – are positively related to improved district level
outcomes; and
2) Collaboration with interest groups is generally correlated with negative district
level academic outcomes.
Thus far it has been established that what board members bring to the governance
process has a minimal direct connection to district academic outcomes but where they

134
focus their efforts does impact district academic outcomes. The next chapter will look
beyond the topic areas of focus for school boards in the six states to their perceptions of
how they actually go about the governing process.

135
Chapter VII. School Board Group Dynamics, Zones of Discretion and Academic Outcomes
In its most romantic form a school board is the ultimate exercise in local control
and democracy. Citizens of communities win elections for unpaid positions to gather
with other citizens to decide how best to educate the children in their community.
Elections are non-partisan, so the institution is not poisoned by party politics. The lack of
pay ensures people view the position as public service; the desire to do good outweighs
the desire for power. But reality is not so romantic.
Sometimes board members disagree on the appropriate direction of a district; both
sides convinced they are right. Sometimes board members form coalitions. Sometimes
board members do not like each other. Sometimes non-partisan board elections are non-
partisan in name only. Sometimes board members have radically different
constituencies and agendas, i.e. taxpayers versus public employees. And more times than
not local control is undermined by state and federal policies.
This chapter attempts to explain the relationship between the small group
dynamics of publicly elected school boards and academic outcomes. Unlike the previous
chapter, the unit of analysis will be the individual board member rather than the board as
a whole. This approach, used in previous research on the small group dynamics present
in city councils, still allows for connections to be made between board member
perceptions and the performance of the school districts they represent, but also for the use
of board member control variables that allow for a better isolation of the connection
between small group dynamics and outcomes (Ihrke & Niederjohn, 2005; Nelson &
Nollenberger, 2011).
Specifically this chapter tests two hypotheses:
136
1) The presence of dynamics typical to a high-functioning small group on a school
board positively impacts district level academic outcomes; and
2) Boards exercising larger zones of discretion have comparatively better academic
outcomes.
Literature Review
The sociologist Lewis Coser (1956) laid out a basic framework for understanding
the positive and negative functions of social conflict in small groups. Coser argued that
not all conflict is bad, in fact conflict can often be a way for people to blow-off steam,
say in an argument, without damaging the quality of work at the task at-hand. To put in
another way, conflict is more complicated than a good-bad dichotomy.
Almost fifty years after Coser Jehn (1997 & 1999) used qualitative work to
identify three specific types of conflict; relationship, task, and process. A school board
can conflict over a process such as who should be the board president, a task such as
which superintendent to hire, or over a personal relationship where two people do not get
along. All three of the types of conflict identified by Jehn were shown by Heidbreder et.
al. (2011) and Ihrke & Niederjohn (2005) to have slightly different effects on city
councils in Michigan and Wisconsin.
But small group interaction is more than conflict. Gabris (2006) identified several
characteristics of high-functioning small groups, including sharing common goals and
values, and getting along with the CEO or superintendent in the case of school boards.
Small group interactions also are driven by governance structure. How did a board
member come to serve? For example was it through a contested election? Or does the
board adapt a specific governance model as identified by Gill (2002).
137
And what about the environment in which boards operate? What is their capacity
to make decisions? Michael Kirst (2009) and Jennifer Hochschild (2005) argue that
school boards have a very small zone of discretion that limits their ability to make
decisions that impact district academic outcomes.
The following sections of this chapter will explore the role of small group
dynamics on school boards. Unlike many non-profit boards or city councils, school
boards have the advantage of having simple to understand intuitive indicators of the
success of the organization they oversee: graduation rates, drop-out rates, and test sores.
As explained in Chapter one this study accepts that the primary role of school boards is to
maximize academic achievement. Hence, quantitative methods are used to better
understand the relationship between the small group dynamic perceptions of school board
members in Michigan, Minnesota, Wisconsin, Utah, Nevada, and Florida, and district-
level academic outputs.
Data and Results
School board members in the six states of interest were asked their level of
agreement with a series of statements related to small group dynamics. All questions
were adapted, word-for-word whenever possible, from previous surveys of city councils
conducted by Heidbreder et. al. (2011) and Ihrke & Niederjohn (2005). The survey had a
total individual board member response of rate of 23.9% (See Table 5.2). The mean
responses are presented in Figure 7.1; the total number of observations with valid
responses range from 808 to 814 (Note that the 5 point Likert scale is reversed for the
regression models so that 5 = strong agreement and 1 = strong disagreement, for the ease
of interpretation).

138
To partially test the first hypothesis, using the same district level control variables
as the previous chapter, a series of OLS regression models for all board members testing
the relationship between graduation rates and indicators of overall, relationship, task, and
process conflict were run. Like in the previous chapter, the decision to run individual
models for each small group dynamic variable was made due to high muticolinearity in
an all-inclusive model. The results in Table 7.1 indicate that board members perceiving
higher levels of overall conflict and having higher levels of agreement that prior conflicts
resurface have a significantly lower graduation rate at the 95% level of confidence.
Table 7.1 – OLS Regression Results for the Dependent Variable Graduation Rates, Focal Variables Only Overall Conflict Coefficient N R-Squared High conflict -.774**(.290) 696 0.529
0
0.5
1
1.5
2
2.5
3
3.5
Figure 7.1 -‐ Mean Responses to Small Group Variables
(5= Strong Agreement and 1= Strong Disagreement
All
Group 1
Group 2
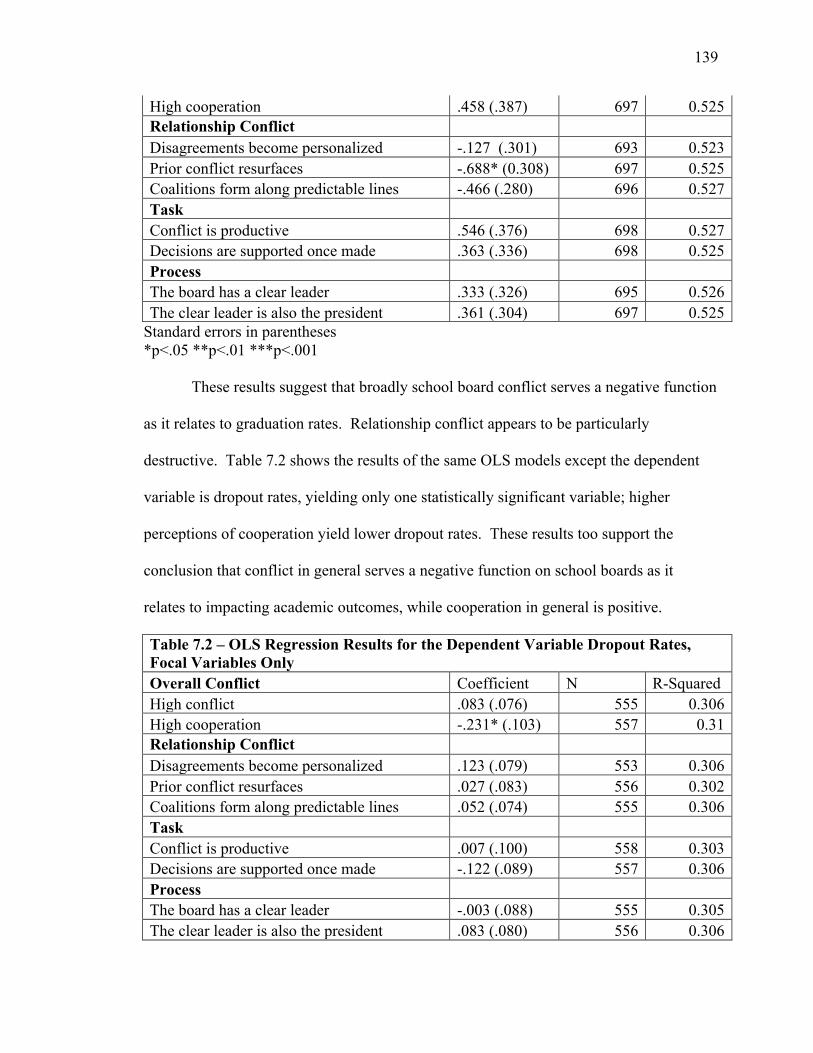
139
High cooperation .458 (.387) 697 0.525 Relationship Conflict Disagreements become personalized -.127 (.301) 693 0.523 Prior conflict resurfaces -.688* (0.308) 697 0.525 Coalitions form along predictable lines -.466 (.280) 696 0.527 Task Conflict is productive .546 (.376) 698 0.527 Decisions are supported once made .363 (.336) 698 0.525 Process The board has a clear leader .333 (.326) 695 0.526 The clear leader is also the president .361 (.304) 697 0.525
Standard errors in parentheses *p<.05 **p<.01 ***p<.001
These results suggest that broadly school board conflict serves a negative function
as it relates to graduation rates. Relationship conflict appears to be particularly
destructive. Table 7.2 shows the results of the same OLS models except the dependent
variable is dropout rates, yielding only one statistically significant variable; higher
perceptions of cooperation yield lower dropout rates. These results too support the
conclusion that conflict in general serves a negative function on school boards as it
relates to impacting academic outcomes, while cooperation in general is positive.
Table 7.2 – OLS Regression Results for the Dependent Variable Dropout Rates, Focal Variables Only Overall Conflict Coefficient N R-Squared High conflict .083 (.076) 555 0.306 High cooperation -.231* (.103) 557 0.31 Relationship Conflict Disagreements become personalized .123 (.079) 553 0.306 Prior conflict resurfaces .027 (.083) 556 0.302 Coalitions form along predictable lines .052 (.074) 555 0.306 Task Conflict is productive .007 (.100) 558 0.303 Decisions are supported once made -.122 (.089) 557 0.306 Process The board has a clear leader -.003 (.088) 555 0.305 The clear leader is also the president .083 (.080) 556 0.306

140
Standard errors in parentheses *p<.05 **p<.01 ***p<.001
But what about the impacts of board member characteristics? The same models
were run incorporating the following series of board member control variables (See
Chapter Five for summary statistics):
• Board member race;
• Board member age;
• Board member sex;
• Board member ideology through a dummy variable indicating identification as a
conservative or moderate;
• Education level as indicated by a dummy variable for being a college graduate;
and
• Dummy variables for employment in education or business.
The significant results for the focal variables presented in Table 7.3 shows that
controlling for board member backgrounds yielded very similar results as the models
without board member controls. Two focal variables, high conflict and the prior conflict
resurfaces indicator of relationship conflict, are negatively related to graduation rates.
The lack of influence of control variables is not surprising given the findings in chapter
five on the relationship between board member backgrounds and academic outcomes.
However, several models yielded a statistically significant relationship between board
member employment in business or education sector and graduation rates, suggesting the
possibility of an interaction between conflict and employment sector.
Table 7.3 – OLS Regression Results for the Dependent Variable Graduation Rates, Focal Significant Variables Only (with Board Member Controls) Overall Conflict Coefficient N R-Squared

141
High conflict -.886**(.309) 639 .534 Relationship Conflict Prior conflict resurfaces -.886**(.327) 640 .533
Standard errors in parentheses *p<.05 **p<.01 ***p<.001
There are logical theoretical reasons to suspect that experience in the business or
education sector may interact with board conflict. Traditionally businessmen were
viewed as the ideal school board members given boards’ perceived role as the guarantor
of public monies and the desire for public entities be run more like private business
(Ashby, 1967; Ostrom, 2007; Goodsell, 2003; Stillman, 1990). It is possible that board
members with business backgrounds (25.4% of survey respondents) and members with
education backgrounds (15.84% of survey respondents) see the functions of the school
board in different ways. Indeed, when comparing rankings of priorities for board
members those employed in the business sector rank monitoring district finances at a
higher level (3.19 out of 10) than those with an education background (3.51 out of 10).
Conversely those employed in education rank the setting of academic standards at a
higher rate (3.30 out of 10) than members employed in business (3.90 out of 10). It is
easy to see how these differences in priorities interact with perceptions of conflict and
cooperation. In addition, the significant findings regarding relationship conflict give
reason to suspect that long-serving board members, by virtue of having had more time to
form relationship conflicts, may also present an interaction effect.
Table 7.4 contains the results of two OLS models predicting graduation rates with
several interaction terms. In Model One, the interaction term for high levels of
cooperation and being employed in the business sector is statically significant at the 90%
level of confidence (falling just short of the 95% threshold with a P-value of .056).
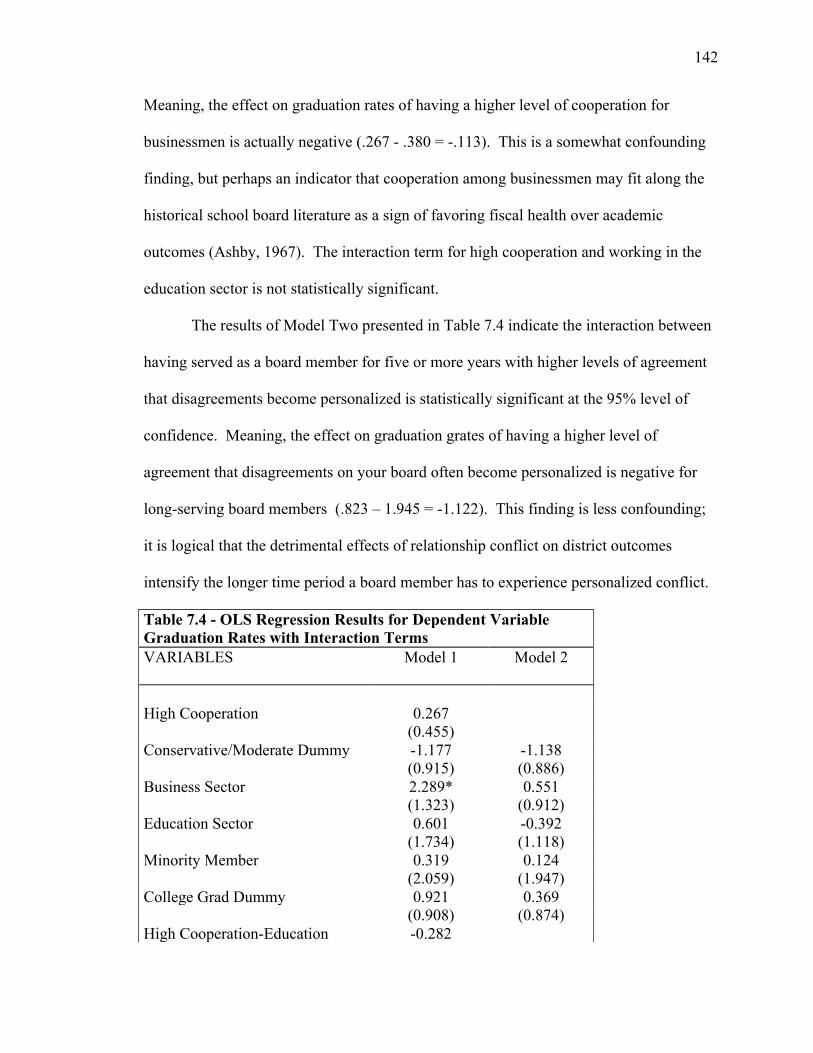
142
Meaning, the effect on graduation rates of having a higher level of cooperation for
businessmen is actually negative (.267 - .380 = -.113). This is a somewhat confounding
finding, but perhaps an indicator that cooperation among businessmen may fit along the
historical school board literature as a sign of favoring fiscal health over academic
outcomes (Ashby, 1967). The interaction term for high cooperation and working in the
education sector is not statistically significant.
The results of Model Two presented in Table 7.4 indicate the interaction between
having served as a board member for five or more years with higher levels of agreement
that disagreements become personalized is statistically significant at the 95% level of
confidence. Meaning, the effect on graduation grates of having a higher level of
agreement that disagreements on your board often become personalized is negative for
long-serving board members (.823 – 1.945 = -1.122). This finding is less confounding;
it is logical that the detrimental effects of relationship conflict on district outcomes
intensify the longer time period a board member has to experience personalized conflict.
Table 7.4 - OLS Regression Results for Dependent Variable Graduation Rates with Interaction Terms VARIABLES Model 1 Model 2
High Cooperation 0.267 (0.455) Conservative/Moderate Dummy -1.177 -1.138 (0.915) (0.886) Business Sector 2.289* 0.551 (1.323) (0.912) Education Sector 0.601 -0.392 (1.734) (1.118) Minority Member 0.319 0.124 (2.059) (1.947) College Grad Dummy 0.921 0.369 (0.908) (0.874) High Cooperation-Education -0.282
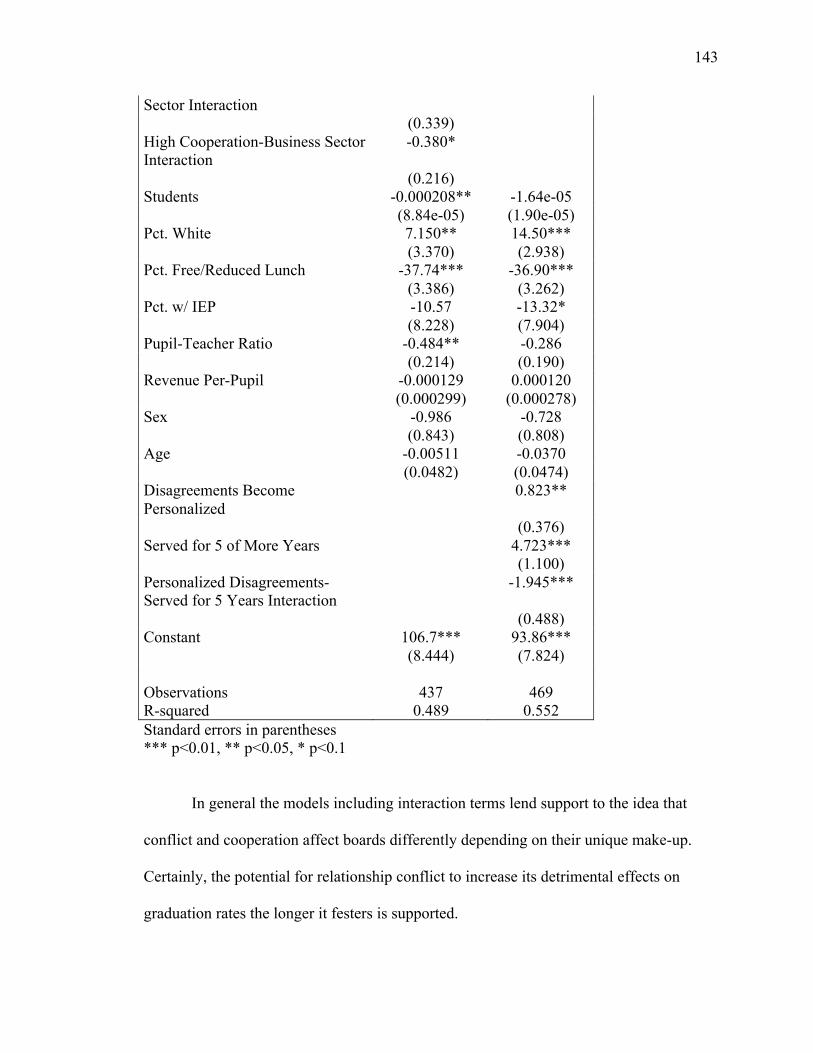
143
Sector Interaction (0.339) High Cooperation-Business Sector Interaction
-0.380*
(0.216) Students -0.000208** -1.64e-05 (8.84e-05) (1.90e-05) Pct. White 7.150** 14.50*** (3.370) (2.938) Pct. Free/Reduced Lunch -37.74*** -36.90*** (3.386) (3.262) Pct. w/ IEP -10.57 -13.32* (8.228) (7.904) Pupil-Teacher Ratio -0.484** -0.286 (0.214) (0.190) Revenue Per-Pupil -0.000129 0.000120 (0.000299) (0.000278) Sex -0.986 -0.728 (0.843) (0.808) Age -0.00511 -0.0370 (0.0482) (0.0474) Disagreements Become Personalized
0.823**
(0.376) Served for 5 of More Years 4.723*** (1.100) Personalized Disagreements-Served for 5 Years Interaction
-1.945***
(0.488) Constant 106.7*** 93.86*** (8.444) (7.824) Observations 437 469 R-squared 0.489 0.552 Standard errors in parentheses *** p<0.01, ** p<0.05, * p<0.1
In general the models including interaction terms lend support to the idea that
conflict and cooperation affect boards differently depending on their unique make-up.
Certainly, the potential for relationship conflict to increase its detrimental effects on
graduation rates the longer it festers is supported.
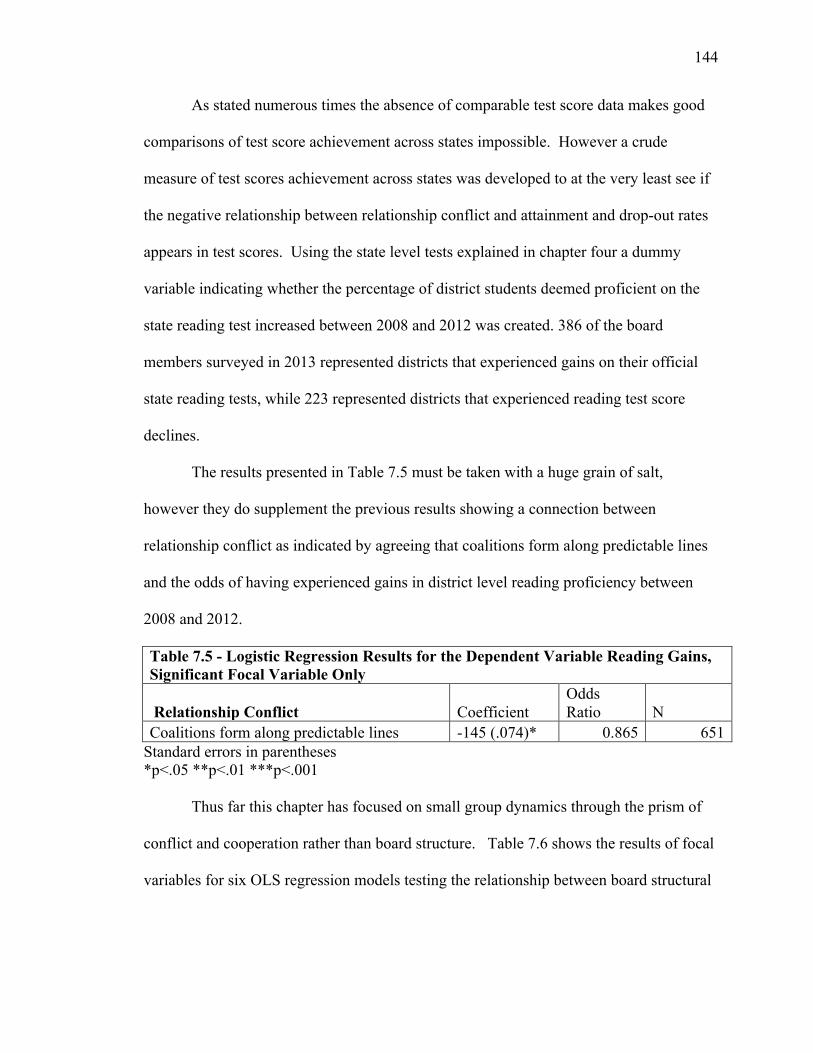
144
As stated numerous times the absence of comparable test score data makes good
comparisons of test score achievement across states impossible. However a crude
measure of test scores achievement across states was developed to at the very least see if
the negative relationship between relationship conflict and attainment and drop-out rates
appears in test scores. Using the state level tests explained in chapter four a dummy
variable indicating whether the percentage of district students deemed proficient on the
state reading test increased between 2008 and 2012 was created. 386 of the board
members surveyed in 2013 represented districts that experienced gains on their official
state reading tests, while 223 represented districts that experienced reading test score
declines.
The results presented in Table 7.5 must be taken with a huge grain of salt,
however they do supplement the previous results showing a connection between
relationship conflict as indicated by agreeing that coalitions form along predictable lines
and the odds of having experienced gains in district level reading proficiency between
2008 and 2012.
Table 7.5 - Logistic Regression Results for the Dependent Variable Reading Gains, Significant Focal Variable Only
Relationship Conflict Coefficient Odds Ratio N
Coalitions form along predictable lines -145 (.074)* 0.865 651 Standard errors in parentheses *p<.05 **p<.01 ***p<.001
Thus far this chapter has focused on small group dynamics through the prism of
conflict and cooperation rather than board structure. Table 7.6 shows the results of focal
variables for six OLS regression models testing the relationship between board structural

145
variables and academic outcomes (Note all models included district control variables).
The three structural categorical variables are:
1) Stability – Has the board member served for five or more years (686 of 1,143
members have)?;
2) Opposed in the most recent election (712 of 1,116 respondents were)?; and
3) Shared politics – Does the board member at least somewhat agree that they share
political beliefs with their fellow board members (835 of 1,43 respondents
agreed)?
Table 7.6 – OLS Regression Results for Structural Variables, Focal Variables Only Dependent Variable: Grad Rate Coefficient N R-Squared Stable Board -.207 (.245) 668 0.535 Opposed Election .739 (.603) 956 0.527 Shared Politics -272 (.648) 974 0.524 Dependent Variable: Dropout Rate Stable Board .057 (.065) 534 0.309 Opposed Election -.243 (.218) 765 0.254 Shared Politics -.515* (.238) 778 0.264
Standard errors in parentheses *p<.05 **p<.01 ***p<.001
Overall these structural variables had little impact on district outcomes, the
notable exception being the positive impact of shared politics on dropout rates. Agreeing
that you shared politics with most of your fellow board members lowered the dropout rate
by over half a percentage point.
Another structural characteristic of school boards potentially influencing
academic outcomes is their governance model. Unfortunately there is little widespread
agreement on best how to measure or characterize board governance models. After
several attempts to operationalize the characteristics of certain models into a governance
model scale the decision was made to simply to use the descriptions of several
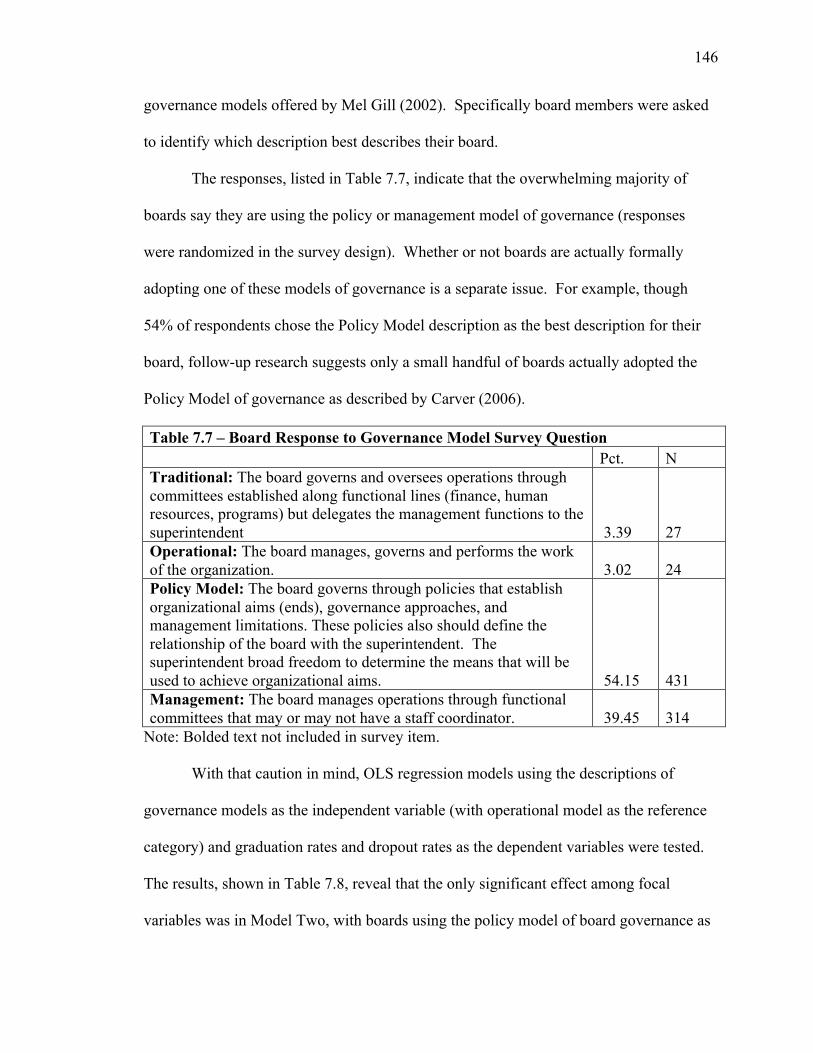
146
governance models offered by Mel Gill (2002). Specifically board members were asked
to identify which description best describes their board.
The responses, listed in Table 7.7, indicate that the overwhelming majority of
boards say they are using the policy or management model of governance (responses
were randomized in the survey design). Whether or not boards are actually formally
adopting one of these models of governance is a separate issue. For example, though
54% of respondents chose the Policy Model description as the best description for their
board, follow-up research suggests only a small handful of boards actually adopted the
Policy Model of governance as described by Carver (2006).
Table 7.7 – Board Response to Governance Model Survey Question Pct. N Traditional: The board governs and oversees operations through committees established along functional lines (finance, human resources, programs) but delegates the management functions to the superintendent 3.39 27 Operational: The board manages, governs and performs the work of the organization. 3.02 24 Policy Model: The board governs through policies that establish organizational aims (ends), governance approaches, and management limitations. These policies also should define the relationship of the board with the superintendent. The superintendent broad freedom to determine the means that will be used to achieve organizational aims. 54.15 431 Management: The board manages operations through functional committees that may or may not have a staff coordinator. 39.45 314
Note: Bolded text not included in survey item.
With that caution in mind, OLS regression models using the descriptions of
governance models as the independent variable (with operational model as the reference
category) and graduation rates and dropout rates as the dependent variables were tested.
The results, shown in Table 7.8, reveal that the only significant effect among focal
variables was in Model Two, with boards using the policy model of board governance as
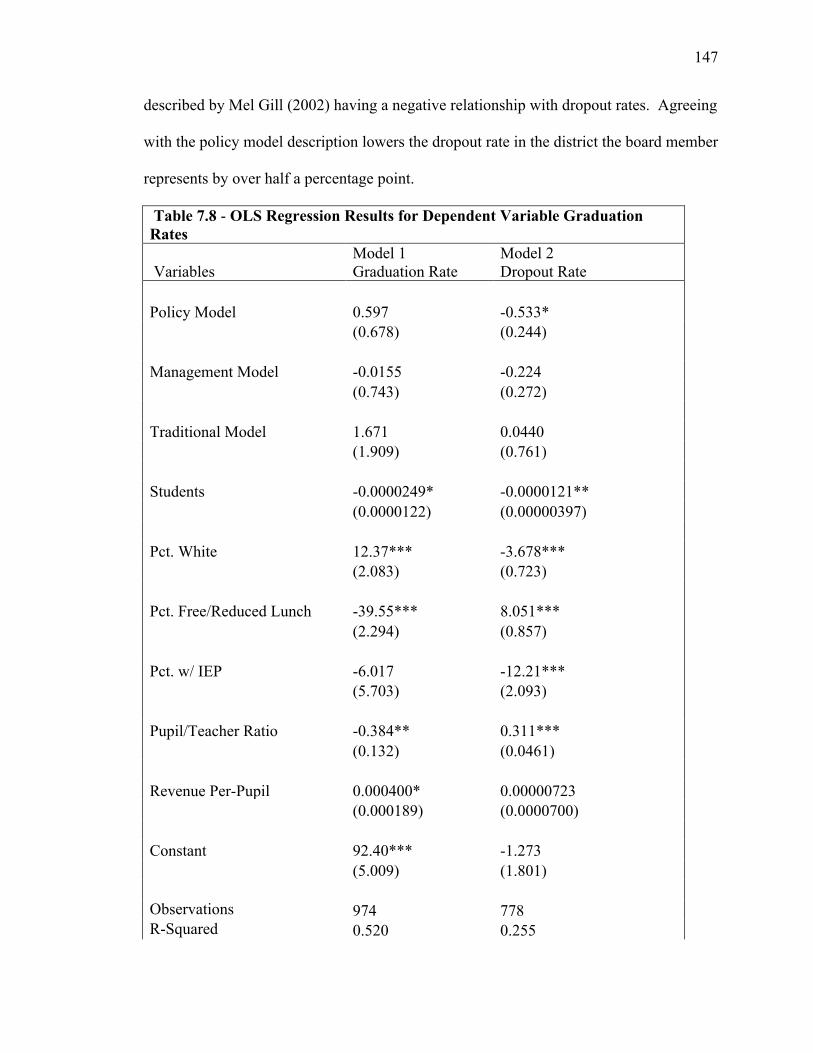
147
described by Mel Gill (2002) having a negative relationship with dropout rates. Agreeing
with the policy model description lowers the dropout rate in the district the board member
represents by over half a percentage point.
Table 7.8 - OLS Regression Results for Dependent Variable Graduation Rates
Variables Model 1 Graduation Rate
Model 2 Dropout Rate
Policy Model 0.597 -0.533* (0.678) (0.244) Management Model -0.0155 -0.224 (0.743) (0.272) Traditional Model 1.671 0.0440 (1.909) (0.761) Students -0.0000249* -0.0000121** (0.0000122) (0.00000397) Pct. White 12.37*** -3.678*** (2.083) (0.723) Pct. Free/Reduced Lunch -39.55*** 8.051*** (2.294) (0.857) Pct. w/ IEP -6.017 -12.21*** (5.703) (2.093) Pupil/Teacher Ratio -0.384** 0.311*** (0.132) (0.0461) Revenue Per-Pupil 0.000400* 0.00000723 (0.000189) (0.0000700) Constant 92.40*** -1.273 (5.009) (1.801) Observations 974 778 R-Squared 0.520 0.255

148
Standard errors in parentheses *p<.05 **p<.01 ***p<.001
This finding should not suggest that adaptation of the formal Carver model of
board governance should be expected to lower drop-out rates, as mentioned very few
boards in the six states of interest actually formally adopt the Carvel model. However, it
does suggest that board use of policies to define goals has a positive impact on outcomes.
This finding is line with previous results in Chapter Six showing the connection between
board vision and academic outcomes.
The presented results give no reason to reject the hypothesis that the dynamics
typical to a high-functioning small group on a school board positively impact district
level academic success. The evidence is strong that minimizing overall conflict,
encouraging cooperation, minimizing relationship conflict, and sharing political views
with fellow board members had a general positive impact on district level academic
outcomes. However, these effects are influenced in part by the professional experience
of board members who serve, and the length of time in which board members serve.
But what about board members capacity to make decisions? What about their
zones of discretion? In Table 2.4 basic state-to-state differences in board member levels
of discretion in different policy areas are presented. Understanding these differences is
important, but simply comparing achievement outcomes across the states and drawing
connections between their levels of discretion in certain policy areas and those outcomes
is unlikely to pick up the level of micro-and-macro restrictions that boards face. For
example two boards in the same state policy environment might have different local
policies, some enacted by a prior board, that restrict their capacity to make decisions.

149
Instead, the impact of zones of discretion exercised by school board members is tested by
modeling for the effects of going above what is required by state policy in the areas listed
in Figure 7.2. The tested hypothesis is:
Boards exercising larger zones of discretion have better academic outcomes.
Figure 7.2 shows the board level average scores on a five point Likert scale
asking board members to state their level of agreement that their board went beyond state
requirements when setting academic standards, student assessment policies, behavior
policies, and fiscal policies. In other words, the higher their score the more they agreed
3.2
3.15
3.21
3.38
3
3.05
3.1
3.15
3.2
3.25
3.3
3.35
3.4
Academic Standards N=482
Assesment Policies N=482
Behavior Policies N=471
Fiscal Policies N=474
Figure 7.2 -‐ Does Your Board Exceed State Requirements in the Following Areas? (1= Strong Disagreement and 5= Strong Agreement)

150
they were exercising discretion in key policy areas. The lower the scores, the more likely
they were to be simply following policies required under state law.
The board-level responses to each of these four survey items were added together
to create a single variable indicating that boards in general exercise a high-level of
discretion in key policy areas. The summary statistics for that variable can be seen in
Table 7.9. In addition, a high discretion variable was created in the data set containing all
board members with valid survey responses. This allows for additional analyses with
board member control variables and interaction terms.
Table 7.9 - Summary Statistics for Additive Discretion Scale N Mean Std. Dev. Min. Max Board Level 463 12.98 3.56 4 20 Individual Level 744 13.00 3.91 4 20
OLS regression model with the dependent variables graduation rates and dropout
rates with school district control variables showed no significant relationship between the
board-level variable for high discretion and outcomes. However, shifting to the school
board member unit of analysis revealed an interesting interaction term between high
discretion and being employed in the business sector. As discussed earlier in this chapter,
there are reasonable reasons to suspect that board members employed in the business or
education sector have unique roles in board governance. Table 7.10 shows the results of
an OLS regression model predicting the dependent variable dropout rate; in the model the
interaction between the high discretion variable and business sector dummy variable is
statistically significant at the 95% level of confidence.
Table 7.10 - OLS Regression Results for Dependent Variable Dropout Rate with Interaction Terms VARIABLES High School Dropout Rate

151
High Discretion -0.0360 (0.0440) Students -2.01e-06 (5.57e-06) Pct. White -0.160 (0.930) Pct. Free/Reduced Lunch 9.751*** (1.149) Pct. w/ IEP -12.47*** (2.773) Pupil-Teacher Ratio 0.250*** (0.0629) Revenue Per-Pupil -6.45e-05 (9.12e-05) Conservative/Moderate Dummy -0.847*** (0.301) Business Sector -2.075** (1.051) Education Sector -0.325 (0.376) Minority Member -0.666 (0.587) College Grad Dummy 0.147 (0.301) Age -0.00479 (0.0159) Sex 0.368 (0.280) High Discretion-Business Background Interaction
0.154**
(0.0773) Constant -2.373 (2.636) Observations 340 R-squared 0.326 Standard errors in parentheses *** p<0.01, ** p<0.05, * p<0.1
Specifically, being employed in the business sector has a negative effect on the
relationship between exercising a high zone of discretion and dropout rate (-.0360 + .154

152
= .118); a businessman exercising a higher zone of discretion raises dropout rates
compared to non-businessmen exercising a large zone of discretion. There are several
plausible reasons to explain this finding; businessmen may be more active in fiscal
policies and hence paying less attention to academic policies, or businessmen might be
very active in setting strong behavior policies, which may drive disruptive students to
drop out. Regardless, it is clear that businessmen exercising high levels of discretion
have a slightly different effect on dropout rates than non-businessmen.
Two additional models testing the relationship between high board level
discretion and test score proficiency on the Wisconsin state tests did find a significant
relationship between boards exercising higher levels of discretion and the percentage of
students scoring at least proficient on Wisconsin’s state math test. The results, presented
in Table 7.10, are a very specific case. But they do suggest, at least in Wisconsin, that
school boards going beyond what is required in state law in setting key policies has a
positive effect on test sores that is not seen in high school graduation or dropout rates.
Table 7.11 – OLS Regression Results for Dependent Variable Graduation Rates, Wisconsin Only VARIABLES Pct. Proficient
Math 2012 Pct. Proficient Reading 2012
High Discretion 0.314*** 0.155 (0.0825) (0.199) 2008 Math Proficiency 0.622*** (0.0654) Students -1.40e-05 5.57e-05 (9.83e-05) (0.000235) Pct. White 2.689 -5.429 (4.395) (10.40) Pct. Free/Reduced Lunch -11.08** -9.185 (3.849) (8.869) Pct. IEP 18.02 8.536 (9.344) (22.70) Pupil Teacher Ratio -0.135 -0.242

153
(0.185) (0.451) Revenue Per-Pupil 5.88e-05 0.000337 (0.000226) (0.000540) 2008 Reading Proficiency 0.844*** (0.208) Constant 28.79** 15.56 (8.793) (26.33) Observations 139 139 R-squared 0.764 0.299 Standard errors in parentheses *p<.05 **p<.01 ***p<.001
Overall there is insufficient evidence to support the hypothesis that school boards
or individual board members exercising high zones of discretion in key policy areas are
positively impacting academic outcomes. Though the Wisconsin specific results cannot
be used to make conclusions beyond Wisconsin, as more states move towards a common
comparable testing framework the possible connection between high exercising of
discretion and math scores should be explored. In addition the effects of business sector
employees on school board governance is worthy of future research.
Discussion and Conclusion
This chapter tested two hypotheses and found compelling support for one; that the
districts overseen by school board members with positive group dynamic attributes are
higher performing than those without such attributes. This finding has several
implications.
First, school boards should work to minimize conflict and maximize cooperation.
Though this recommendation is somewhat obvious, the direct connection between high-
conflict and lowered graduation rates can cast the connection in a new light. Not only
should conflict be reduced because it may create an unpleasant work environment, it may
also be hurting a school district academically. The negative effects of relationship

154
conflict in particular fit into the framework of the black box model of school board
governance. The task of making good situation dependent decisions is made more
difficult if not impossible when a board is dominated by personal conflict. The finding
that the negative effects of relationship conflict are enhanced when board members serve
for long periods of time suggest that periodic turnover on boards, whether voluntary or
enforced through term-limits, may have a positive impact on district outcomes.
The relationship between board members’ use of the policy model of governance
and lower dropout rates lends further support to the findings in the previous chapter that
board planning and vision are linked to enhanced outcomes. Simply, when boards have
an idea of what they want to be, when they are cohesive, their districts have better
outcomes.
The failure to find compelling support for the second hypothesis - that boards
going beyond state requirements do not have improved outcomes - is still a substantively
interesting finding. Boards should not expect to make better policy decision simply
because they are making more policy decisions. Indeed, in some situations the policy
dictated by the state may in fact be the best medicine for the district. Consistently going
beyond state requirements in key policy areas may also lead to incoherent policies that
change frequently over time. Though measuring frequent changes in policy over time is
beyond the scope of the single-point survey used in this analysis, archival research on the
policy coherence of school boards over time may be a useful future endeavor.
Perhaps the most relevant question stemming from the findings of this chapter is
how? How can boards reduce conflict, particularly relationship conflict? How can
boards be encouraged to have a coherent vision? How can boards find the right balance
155
between the quantity and quality of decisions in important policy areas? There are formal
and informal answers to these questions.
Informally school board members can be aware of the presence of conflict on
their board. A more formal approach is for board members to take a planning retreat, or
dedicate a closed session every few months to the mitigation of board conflict. A
statutory approach is for the legislature to proscribe that boards overseeing consistently
low achieving districts be subject to a governance intervention where the board engages
in a period of self-study with a governance consultant, or the more extreme action of
forced term-limits. States could also build in use-or-lose-it funding for boards to spend
on board development or strategic planning. Though in a period of tight state budgets
such an approach is likely to face opposition, the potential pay-off in terms of improved
district academic performance may actually make it preferable to other costly academic
interventions yielding similar if not less-impressive academic gains.
It is more difficult to prescribe specific ways for boards to balance between high-
action and actual high-productivity. The best approach to ensuring that the exercise of
discretion yields academic gains is through the use of board development and strategic
planning so the creation of policies that go beyond state requirements are made with
measurable goals in mind. In other words, a new academic standard is not considered a
governance end, but rather a tool to meet a measurable goal, such as test score
improvement, prior to the implementation of the policy. Therefore, it will be easy to
identify if a policy had or did not have its intended affect.
Further discussion of the implications of the findings in this chapter and those that
preceded it will be presented in the concluding remarks in chapter nine. However it is
156
becoming clear by this point that public school board governance is linked to measures of
academic outcomes in meaningful ways in Wisconsin, Michigan, Minnesota, Utah,
Nevada, and Florida. Thought subtle differences between these groups of different states
do reflect the localized nature of school board governance, the many common findings
support the notion that governance is important in influencing academic achievement in
in very different contexts. But first, I will take a brief look at a very different type of
school board member; one representing a non-profit non-district charter school.
157
Chapter VIII. Characteristics of a Sample of Non-Profit Charter School Boards
What is a charter school? Ask 100 people this question and it would not be
surprising to get 100 different answers. Nor would it be unreasonable. According to the
National Alliance for Public School Charter Schools, a national advocacy group, 42 U.S.
states have a charter law. However these laws differ dramatically by, and even within,
states (Renzulli & Roscigno, 2005). For example, the stat of Wisconsin has three distinct
types of charter schools:
1) Instrumentality charter schools authorized by public school boards and staffed by
school district employees;
2) Non-instrumentality charter schools authorized by public school boards and
staffed by non-district (and usually non-unionized) employees; and
3) Non-instrumentality independent charter schools authorized by the City of
Milwaukee, the University of Wisconsin-Milwaukee, and the University of
Wisconsin-Parkside.
The general concept behind charter schools, however, is common across different
states and types (Mintrom, 1997). The basic idea is that charter schools are public
schools that are given a degree of freedom from school district and sometimes state
policies in exchange for meeting performance targets spelled out in a contract between
the school and the authorizing entity, be it a school board or not. Charter schools often
develop their own curriculum, engage in their own budgeting, and hire and fire their own
staff. Though there is intense political and research debate on whether charter schools in
general actually fulfill their promise of increased outcomes in return for increased

158
autonomy, the basic goals and concepts underlying the charter school movement are clear
(Witte et. al, 2007; Hoxby et. al., 2009).
Most research on charter school governance refers to the macro idea of shifting
the oversight of public schools away from traditional public school boards and towards
independent authorizers (Hall & Lake, 2006). This strain of research leaves a huge gap
in understanding the micro-governance of charter schools. Consider again the case of
Milwaukee. The City of Milwaukee common council authorizes several schools, and
much attention is paid to the way in which that board chooses which non-profits to enter
into chartering contracts with. But what about the non-profits to which contracts are
given? They too have boards, but are generally not in current popular discussion of
education governance.
This chapter, using limited evidence, seeks to open a new-line of scholarly inquiry
on the way in which non-profit charter school boards oversee this unique subset of public
schools. Though some of the non-profit literature on board governance can be applied to
the case of charter schools, they are unique enough to warrant a sub-field in the area of
non-profit board governance (Houle, 1989; Carver, 2006; Cornforth, 2003).
First, non-profit charter school boards not only are reliant on government revenue,
but are defined specifically as public institutions in both the public discourse and state
statutes (Merrifield, 2013). This unique tension puts charter schools in an undefined
space between private and public. It follows that there is intense political debate over
whether or not charter schools are indeed public institution, despite their officially
defined status. While many non-profits are forced to defend their productivity with
public dollars they rarely are expected to have to defend their status as public entities; in

159
fact one would suspect many non-profits would actively resist being defined as public
entities.
Second, non-profit charter schools engage in forum shopping in a way that
parallels non-profit grant seeking behavior, but fundamentally differs from it. Most non-
profits obtain funding from either selling a service, applying for foundation and
government support, or some combination of both (Seltzer, 2001). Non-profit charter
schools may do these same things, but the bulk of their funding comes from government
payments which the schools only become eligible for if they find an entity willing to
authorize them. Where most non-profits might submit grant applications to several
foundations, a non-profit charter school submits applications to several charter
authorizing bodies. In other words the connection between government and the non-
profit charter school is always mitigated through a middleman.
Third, it is very difficult if not impossible for non-profit charter schools to change
their mission. They may modify it terms of the types of students they want to serve, but
their basic mission will always be the education of students. At least in theory, a school
struggling at this mission will lose its charter, thereby ceasing to be a non-profit charter
school. So, any significant change in mission equates to no longer being a charter school.
Originally, I planned to compare the relationship between governance and
academic outcomes on non-profit charter school boards and traditional public school
boards. However, a low-survey response rate (just under eight percent of the 400 board
members surveyed responded compared to 24% of public school board members) forced
a shift in the research question. Instead of comparing the relationship between
governance and outcomes on non-profit charter boards, I attempt to answer: Who serves

160
on non-profit charter school boards in Wisconsin and Michigan, what are their beliefs,
and what do the descriptive statistics say about their status as “public” entities?
Background
Charter school board members in the states of Michigan and Wisconsin were
chosen for this analysis due to the sizable number of non-district non-profit charter
schools in these states. As can bee seen in Table 8.1, in 2012 Wisconsin had 18 non-
district independent charter schools in operation while Michigan had 206. Under
Wisconsin law independent charter schools may only be authorized by the University of
Wisconsin-Milwaukee, the City of Milwaukee, the University of Wisconsin-Parkside, or
the Milwaukee Area Technical College (Merrifield, 2013). However, the University of
Wisconsin-Parkside may only authorize a single school in Racine, and the Milwaukee
Area Technical College has never acted upon its chartering authority. In Michigan
universities and community colleges may authorize independent charter schools.
Currently 11 institutions are authorizing 206 schools.
Table 8.1: Non-District Charter School Characteristics, 2012
Wisconsin Michigan Non-district charter schools 18 206 Active charter school authorizers
3 11
Funding source Dedicated appropriation State education funding formula
Unionized No School-by-school basis Teachers Licensed by the state Licensed and deemed
“highly effective” under No Child Left Behind law. College faculty may teach without licensure
Funding level $7,775 per-pupil Variable Location Milwaukee and Racine Statewide

161
Though there are variations in some of the structural characteristics of
independent charter schools in both states, both share the common characteristic of being
overseen by a board. Surveys were sent to the universe of independent school board
members in theses state, but as mentioned less than eight percent were returned.
Accordingly the following sections should be understood as an exploratory review of
descriptive statistics rather than a representative sample of charter school board members
in Michigan and Wisconsin.
Who Were the Survey Respondents?
The descriptive statistics in Tables 8.2, 8.3, and 8.4 detail the characteristics of
survey respondents. A strong majority were male and White. Very few identified as
liberals, like public school board respondents charter board respondents were generally
conservative or moderate. Not surprisingly given the independent charter school board
members are chosen rather then elected, only three had held elected office prior to their
term on the board. The average age was 58, and the length of service was varied.
Overall charter survey respondents looked very similar to public school board
respondents: White males in their 50s who identify as conservative or moderate.
Table 8.2 – Characteristics of Charter Survey Respondents Sex N Pct. Male 19 73.1 Female 7 26.9 Race N Pct. White 21 77.8 African-American 5 18.5 Prefer Not to Say 1 3.7 Ideology N Pct. Liberal 4 14.8 Conservative 8 29.6 Moderate 13 48.2

162
Non-Partisan 2 7.4 Held Political Office Before N Pct. Yes 3 11.5 No 23 88.5 Length of Service N Pct. 0-2 Years 6 22.2 3-4 Years 8 29.6 5-6 Years 6 22.2 More than 6 Years 7 25.9
Table 8.3 – Mean Age of Survey Respondents N Mean Std. Dev.
24 58 11.8
Also like public school board respondents, many charter school board member
respondents were employed in the education and business sector, and highly educated.
The sheer number of respondents with advanced degrees does raise some concern. It is
possible that charter school board members in general are highly educated. However, it
also could be a sign of response bias. While public school board members may have felt
compelled to answer the survey because of their commitment to public service (a
sentiment communicated to the author via e-mail by several respondents), charter board
members may have been disproportionately compelled out of sympathy for a student
seeking an advanced degree. This possibility is further supported by the way in which
board members viewed their interactions with the public.
Table 8.4 – Backgrounds of Survey Respondents Job Type Education 8 40 Business 5 25 Labor 1 5 Professional (Law, Medicine, 4 20
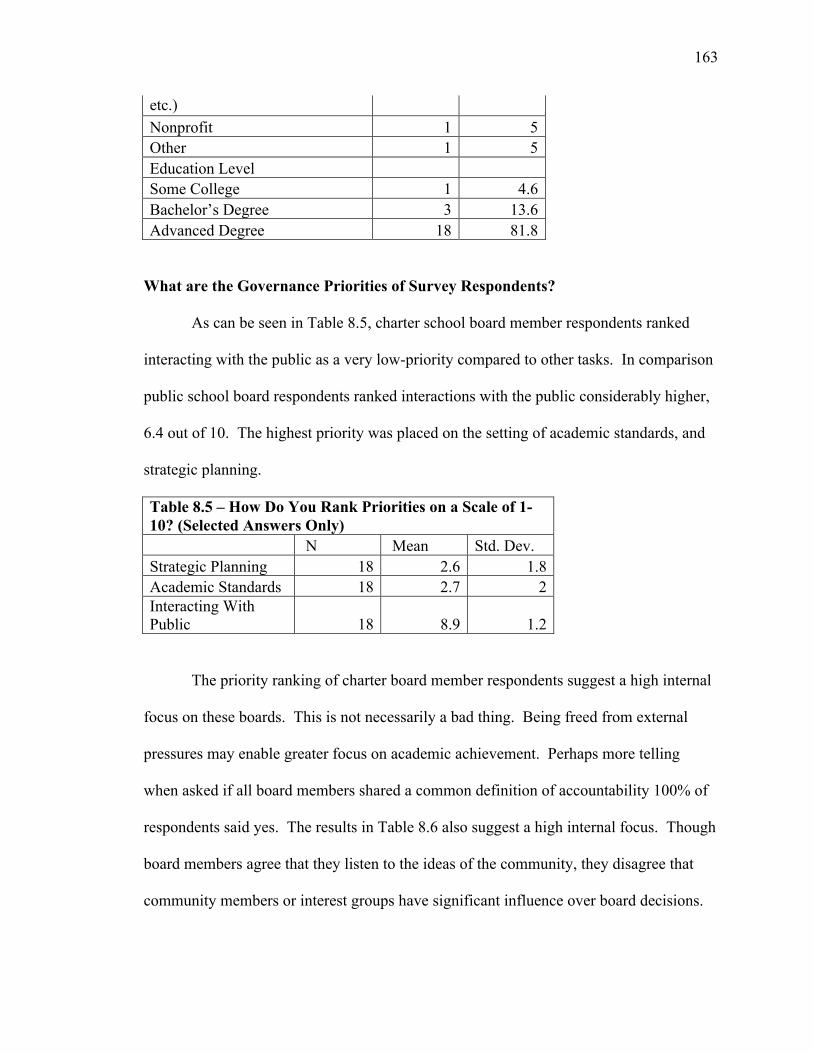
163
etc.) Nonprofit 1 5 Other 1 5 Education Level Some College 1 4.6 Bachelor’s Degree 3 13.6 Advanced Degree 18 81.8
What are the Governance Priorities of Survey Respondents?
As can be seen in Table 8.5, charter school board member respondents ranked
interacting with the public as a very low-priority compared to other tasks. In comparison
public school board respondents ranked interactions with the public considerably higher,
6.4 out of 10. The highest priority was placed on the setting of academic standards, and
strategic planning.
Table 8.5 – How Do You Rank Priorities on a Scale of 1-10? (Selected Answers Only) N Mean Std. Dev. Strategic Planning 18 2.6 1.8 Academic Standards 18 2.7 2 Interacting With Public 18 8.9 1.2
The priority ranking of charter board member respondents suggest a high internal
focus on these boards. This is not necessarily a bad thing. Being freed from external
pressures may enable greater focus on academic achievement. Perhaps more telling
when asked if all board members shared a common definition of accountability 100% of
respondents said yes. The results in Table 8.6 also suggest a high internal focus. Though
board members agree that they listen to the ideas of the community, they disagree that
community members or interest groups have significant influence over board decisions.
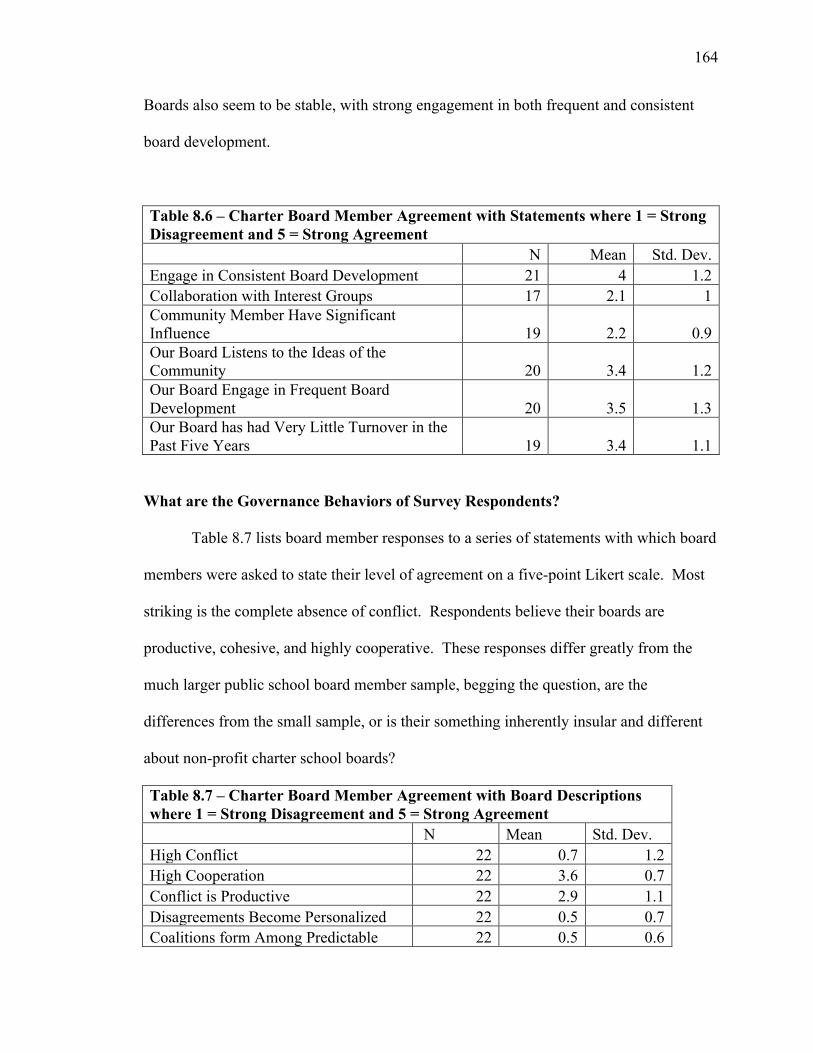
164
Boards also seem to be stable, with strong engagement in both frequent and consistent
board development.
Table 8.6 – Charter Board Member Agreement with Statements where 1 = Strong Disagreement and 5 = Strong Agreement N Mean Std. Dev. Engage in Consistent Board Development 21 4 1.2 Collaboration with Interest Groups 17 2.1 1 Community Member Have Significant Influence 19 2.2 0.9 Our Board Listens to the Ideas of the Community 20 3.4 1.2 Our Board Engage in Frequent Board Development 20 3.5 1.3 Our Board has had Very Little Turnover in the Past Five Years 19 3.4 1.1
What are the Governance Behaviors of Survey Respondents?
Table 8.7 lists board member responses to a series of statements with which board
members were asked to state their level of agreement on a five-point Likert scale. Most
striking is the complete absence of conflict. Respondents believe their boards are
productive, cohesive, and highly cooperative. These responses differ greatly from the
much larger public school board member sample, begging the question, are the
differences from the small sample, or is their something inherently insular and different
about non-profit charter school boards?
Table 8.7 – Charter Board Member Agreement with Board Descriptions where 1 = Strong Disagreement and 5 = Strong Agreement N Mean Std. Dev. High Conflict 22 0.7 1.2 High Cooperation 22 3.6 0.7 Conflict is Productive 22 2.9 1.1 Disagreements Become Personalized 22 0.5 0.7 Coalitions form Among Predictable 22 0.5 0.6

165
Lines Prior Conflicts Resurface 22 0.9 1.2 Board has a Clear Leader 22 3.4 0.7 Board is Productive 22 3.4 0.7 Decisions are Supported Once Made 22 3.4 0.7
Conclusion and Discussion
As discussed the low-sample size makes any definitive conclusions, much less the
deployment of any meaningful quantitative analysis, impossible. However, the limited
evidence does give good reason to suspect that though non-profit charter school may be
public by definition, their boards are far from public entities. There are obvious
differences including the absence of electoral accountability and the protection of charter
school boards from open-records laws. But the way in which these differences manifest
in governance – high internal focus, low conflict, high levels of agreement, limited
engagement with the public – warrants further study.
The obvious problem with the high internal focus is that significant amounts of
public money, and the provision of a public good by entities accepted to be public bodies,
is being overseen by boards that are far from public. While unelected special purpose
public boards are commonplace, an unelected non-profit board is shielded from both
electoral accountability and some of the accountability provided by public oversight.
However charter boards are not completely free of monitoring. State agencies like the
Wisconsin Department of Public Instruction do keep close tabs on schools’ finances and
use bureaucratic authority to watch and sanction deficient schools.
I should note these critiques of charter school boards are not original; high profile
academics such as education historian Diane Ravitch vocally question the public
accountability of the charter school model. But the clearness in which some of the

166
critiques of the charter school model are supported in even limited survey results (as well
as the comparatively low-response rate itself) support the need for further study of the
role of non-profit school boards in the charter school accountability framework.
The greater potential weakness of the non-profit charter school board model is
that the benefit of good governance on academic outcomes identified in previous chapters
may be inaccessible to highly cohesive insular boards. The black box model of school
board governance presented in Chapter Two argues that the situation dependent decisions
crucial to governance success in the hyper-localized context of education requires the
ability to understand the context in which a board is operating. An insular board, public
or non-profit, is likely lacking this context. If insularity is a structural characteristic of
non-profit charter boards, it may become a real obstacle to improving charter school
academic outcomes. As more national charter school operators export their academic
models to other states there lies a genuine risk that the charter model itself will be undone
by stubborn adherence to a one best way line of thinking (Stillman, 1990; Hall & Lake,
2011).
The main conclusion from this chapter is that the micro-governance of non-profit
charter schools deserves higher-scrutiny by the academic community. The limited survey
results presented give good reason to suspect fundamental differences between the
governance behavior of non-profit charter school board members and public school board
members exist. Additional research is needed to find out exactly how these differences
limit or enhance the potential of the charter school model to yield strong academic
outcomes.
167
Chapter IX. The Problem of the American School Board Revisited
The first chapter of this piece is titled The Problem of the American School
Board. The problem of the American school board is more about perception than reality.
No doubt there are school boards that do a poor job, but that is not, as some have
claimed, reason to scrap the institution as a whole. The connections between governance
and district academic performance identified and explored in the preceding chapters gives
no reason to support the notion that democratically elected school boards are
fundamentally flawed. The common finding across the groups in the comparative case-
study design reveals the school board to be a flexible institution capable of effectiveness
in very different situations precisely because there is no one best way to improve
academic outcomes.
In this concluding chapter the problem posed in chapter one; that there is no
consensus about what school boards should be doing, will be addressed. In addition the
key findings of this dissertation will be reviewed, the many remaining unknowns will be
addressed, and topics for future study on school board governance will be proposed.
What Should School Boards Be Doing?
A simple yet accurate answer to the question posed in the subsection title is that
school boards should be governing. The black box model of school board governance
described in chapter two serves as a theoretical guide for how board governance can
impact academic outcomes. Accepting that there is no one best way to govern a school
district and that in fact the key to educational success is making the right decision in the
right way at the right time provides space for the unique role of democratically elected
school boards in the broader field of education reform. No single canned set of education
168
reform strategies should be expected to raise academic outcomes in every situation; the
long unsatisfying track record of well-intentioned education reform efforts bears out this
reality.
The democratically elected school board provides a tried and true model for
improving school district success. It is true that some of the historical functions of
school boards, such as fiscal oversight and human relations, have become less important
over time. However, school boards did for years serve these important functions because
they were considered primarily a local concern, and the public understood that an elected
board of flexible public servants was well positioned to oversee these functions in an
accountable and acceptable manner. As increased unionization reduced board control of
human resources, and as state and federal funding and revenue caps were enacted, it is
only logical that boards shifted their focus.
The presented findings provide further evidence that school boards can and do
impact district academic outcomes through their governance behaviors. Districts that
show a commitment to board development and strategic planning, exercise close relations
with the superintendent, minimize conflict and maximize cooperation, and minimize
relationship conflict in particular oversee districts with higher graduation rates and lower
dropout rates. And these attributes, at-least in Wisconsin, also have a positive effect on
test score proficiency in certain subject areas.
The comparative case study design lends further heft to these finding despite it
being a case study. The education environment faced by school boards in Utah, Florida,
Nevada, and Michigan, Minnesota, Wisconsin, are vastly different. Yet, the common
positive impacts of minimizing conflict, focusing on vision and continuous improvement

169
through policy-setting and strategic planning, and good superintendent-board relations
hold true across the groups of states. Notably, the negative relationship between interest
group collaboration and academic outcomes is isolated to boards in Michigan, Minnesota,
and Wisconsin. This too suggests that state policy environments play a role in the
governance-outcomes relationship.
But there is also much more to be discovered about school board governance and
school district outcomes. In particular the relationship between governance and test score
performance identified to a mild degree here and in other recent work demands more
attention (Grissom, 2012). The relationship between board governance and academics is
complex and continued improvement in the quality and comparability of standardized
tests scores will enable future research to dig deeper into that complexity. For example,
does board governance influence performance in certain areas i.e. math or reading, more
than others?
The clear presence of interaction effects for board members with different
professional backgrounds and lengths of service on school boards also reveals a complex
relationship between certain types of board members and the impact of small group
behavior. Better understanding how different personality types mitigate or increase the
negative effects of conflict or positive effects of planning can better inform sitting board
members of how best to govern for results in their specific governance context.
The next steps in school board governance research should focus on the collection
of longitudinal school board data comparable to the snapshot data used in this study and
further individual board case studies similar to those conducted by the Iowa Lighthouse
Inquiry in order to gain a better understanding of how manipulations to school board
170
governance changes academic outcomes over time. Understanding the role of school
board governance in explaining variation in district level performance is necessary and
practical for boards looking to improve outcomes. But more specific understanding of
changes over time could go one step further and enable the creation of hyper-specific
roadmaps for districts looking to improve outcomes through governance reform.
Finally, more needs to be known about non-profit charter school boards. The
limited data obtained give good reason to suspect that they are very distinct creatures
compared to public school boards. As charter reform efforts increase in number, a better
understanding of what is gained, or lost, through this still new accountability framework
is warranted.
How Can the Connection Between Board Governance and Outcomes Be Utilized?
Much discussion in this study has been dedicated to explaining how and why the
institution of the school board can serve its role of maximizing academic output. But
what lessons can individual boards, legislatures, and education reformers take from this
dissertation?
The lessons for school boards are easy. If your board is adhering to the NSBA’s
Key Work of School Boards, continue to do so. Adherence to the concepts embedded in
the Keys has a positive or neutral effect on graduation and dropout rates. Particular focus
should be placed on relations with the superintendent, board development, and creation
and frequent updating of a strategic plan. In addition boards should work to reduce
conflict, particularly personal conflict, and be wary of collaboration with interest groups.
Doing all these things is likely to yield district academic gains.
171
The lessons for state legislatures are more complicated. First, do not dismiss the
potential of the elected school board. While there may be situations where global
governance reforms are warranted the potential positives of the governance reform must
be weighed against the established potential for school boards to add academic value.
The assumption that democratic representation is the lone or dominant positive attribute
of elected school boards is a false one. Legislators should also consider strategies to
encourage better governance and consider intervention responses to poor governance.
For example, most public school districts receive a fiscal audit from the state at
least once every three years; a board governance audit could go along with these fiscal
audits to gauge the performance of the school board. Developing a framework for
identifying board dysfunction in chronically low-performing districts could be a first step
to meaningful interventions such as board development or forced turnover for struggling
boards.
Education reformers should exercise caution in universally dismissing the
democratically elected school board as an obstacle to education reform. It is
demonstrably not an inherent obstacle. Sure, abolishing elected school boards would
solve the problem of dysfunctional boards, but only at the expense of high-functioning
boards that are having a positive impact on academic outcomes. Further, recognition that
improving school board governance behavior is a potentially fruitful approach to
improving academic performance is warranted. School boards deserve a place in the
broad field of education reform.
Conclusion
172
The original survey data and extensive analysis in the preceding chapters and
pages establish a connection between board governance and performance. If the reader
takes one thing way from this study it should be that governance matters. Sometimes
governance fails, sometimes it is irrelevant, but the capacity of small groups of diverse
people to oversee organizations in ways that increase results – however defined – should
not be dismissed. Boards are vehicles for human interaction and decision-making with
the goal of providing oversight to an organization. Boards are flawed because humans
are flawed, not because the concept, in education or elsewhere, is flawed. Or to put it
another way, the American school board is not a problem. It is a solution.
173
References 'T Hart, P. (1994). Groupthink in government: A study of small groups and policy failure.
Baltimore: Johns Hopkins University Press. Alsbury, T.L. (2008). School Board Politics and Student Achievement. In T. L. Alsbury
(Ed.), The Future of School Board Governance (pp. 247-272). Lanham, MD: Roman & Littlefield.
Archibald, S. & Ford, M. (2012) Using Value-Added Analysis to Raise Student
Achievement. Hartland, WI: Wisconsin Policy Research Institute. Ashby, L. (1968). The effective school board member. Danville, IL: Interstate Printers &
Publishers. Banks, C. A. M. (2000). Gender and race as factors in educational leadership and
administration. The Jossey-Bass reader on educational leadership, 217-256. Bradshaw, P., Hayday, B., & Armstrong, R. (2007). Non-profit Governance Models:
Problems and Prospects. The Public Sector Innovation Journal, 12(3), 1 - 22. Berry, C. & Howell, W. (2005). Democratic Accountability in Public Education. In W. G.
Howell (Ed.), Besieged: School Boards and the Future of Education Politics (pp.150-172). Washington D.C.: Brookings Institution.
Brooks-Gunn, J., & Duncan, G. J. (1997). The Effects of Poverty on Children. The
Future of Children, 7(2), 55-71. Burke, W. (1982). Organizational Development: Principals and Practices. Boston, MA:
Little, Brown. Callahan, R. E. (1975). The American board of education, 1789-1960 Understanding
school boards: Problems and prospects (pp. 19-46). Lexington, MA: Lexington Books.
Carey, K. (2007). The Pangloss Index: How States Game the No Child Left Behind Act
The Evidence Suggests Otherwise. Washington D.C.: Education Sector.
Carver, J. (2007). The Promise of Governance Theory: beyond codes and best practices1. Corporate Governance: An International Review, 15(6), 1030-1037.
Carver, J. (2006). Boards that make a difference. San Francisco: Jossey-Bass. Cashin, S. (2004). The Failures Of Integration: How Race and Class Are Undermining
the American Dream. New York: PublicAffairs.

174
Chetty, R., Friedman, J. N., & Rockoff, J. E. (2011). The long-term impacts of teachers: Teacher value-added and student outcomes in adulthood (No. w17699). National Bureau of Economic Research.
Christensen, C. M., Horn, M. B., & Johnson, C. W. (2008). Disrupting class: How disruptive innovation will change the way the world learns (Vol. 98). New York: McGraw-Hill.
Cistone, P. J. (Ed.). (1975). Understanding school boards: Problems and prospects. Lexington, MA: Lexington Books.
Citizens Research Council of Michigan (CRC) (2010). State and Local Revenues for
Public Education in Michigan. Livonia, MI. Cornforth, C. (Ed.). (2003). The governance of public and non-profit organisations: What
do boards do?. London: Routledge. Coser, L. (1956). The Functions of Social Conflict. New York: The Free Press. Deckman, M. (2007). Gender differences in the decision to run for school board.
American Politics Research, 35(4), 541-563. Delagardelle, M.L. (2008). The Lighthouse Inquiry: Examining the Role of School Board
Leadership in the Improvement of Student Achievement. In T. L. Alsbury (Ed.), The Future of School Board Governance (pp. 191-224). Lanham, MD: Roman & Littlefield.
Deutsch, M. (1973). The resolution of conflict: Constructive and destructive processes.
New Haven: Yale University Press. Devariecs, C., & O”Brien, E. (2011). Eight characteristics of effective school boards.
Alexandria, VA: Center for Public Education. Eliot, T. (1959). Toward an understanding of public school politics. The American
Political Science Review, 53(4), 1032-1051. Epstein, N. (2004). Who's in charge here?: The tangled web of school governance and
policy. Washington D.C.: Brookings Institution Press. Fabiano, G. A., Vujnovic, R. K., Pelham, W. E., Waschbusch, D. A., Massetti, G. M.,
Pariseau, M. E., & Volker, M. (2010). Enhancing the Effectiveness of Special Education Programming for Children with Attention Deficit Hyperactivity Disorder Using a Daily Report Card. School Psychology Review, 39(2), 219-239.
Ford, M. (2012). The Impact of School Board Gender Representation on K-12 Fiscal and
Academic Outcomes in Wisconsin School Districts. Paper presented at the
175
Conference of the Urban Affairs Association. Fox, R., & Schuhmann, R. (1999). Gender and local government: A comparison of
women and men city managers. Public Administration Review, 59(3), 231-242.
Flinchbaugh, R. W. (1993). The 21st century board of education: Planning, leading, transforming. Technomic Publishing Company.
Fraga, L., Meier, K., & England, R. (1986). Hispanic Americans and educational policy:
Limits to equal access. Journal of Politics, 48(4), 850-76. Fuller, H., & Mitchell, G. (2006). A Culture of Complaint. Education Next (Summer). Gabris, G. T., & Davis, T. J. (2006). The City Council as a Small Group: Toward a
Diagnostic Model of Governing Board Behavior. Paper presented at the Annual Meeting of the Southeastern Conference for Public Administration.
Gardner, D. P. (1983). A nation at risk. Washington, D. C.: The National Commission on
Excellence in Education, US Department of Education. Gemberling, K. W., Smith, C. W., & Villani, J. S. (2000). The Key Work of School
Boards Guidebook. Alexandria, VA: National School Boards Association. Gerring, J. (2007). Case study research: principles and practices. Cambridge: Cambridge
University Press. Gewertz, C. (2012, September 17). Two Versions of 'Common' Test Eyed by State
Consortium. Education Week. Gill, M. (2002). Building effective approaches to governance. Nonprofit Quarterly, 9(2),
46-49. Glazerman, S., & Seifullah, A. (2012). An Evaluation of the Chicago Teacher
Advancement Program (Chicago TAP) After Four Years. Washington, DC: Mathematica Policy Research.
Goodsell, C. T. (2003). The Case For Bureaucracy: A Public Administration Polemic,
Author: Charles T Goodsell, Publisher: CQ Press. Grissom, J. A. (2012). Is discord detrimental? Using institutional variation to identify the
impact of public governing board conflict on outcomes. Journal of Public Administration Research and Theory.
Grogan, M. (1999). Equity/Equality Issues of Gender, Race, and Class. Educational
Administration Quarterly, 35(4), 518-536.

176
Gruenfeld, D. H. (1995). Status, ideology, and integrative complexity on the US Supreme Court: Rethinking the politics of political decision making. Journal of Personality and Social Psychology, 68(1), 5-20.
Hackworth, J. R. (2007). The neoliberal city: Governance, ideology, and development in
American urbanism. ILR Press. Hall, K., & Lake, R. (2011). The $500 Million Question: Can Charter Management
Organizations Deliver Quality Education at Scale?. Education Next, 11(1), 64-73. Hanushek, E. A. (1994). Making schools work: Improving performance and controlling
costs. Washington, DC: Brookings Institution. Hanushek, E., Kain, J., & Rivkin, S. (1998). Teachers, schools, and academic
achievement. NBER working paper. Hanushek, E. (1997). Assessing the effects of school resources on student performance:
An update. Educational evaluation and policy analysis, 19(2), 141-164. Heidbreder, B., Grasse, N., Ihrke, D., & Cherry, B. D. (2011). Determinants of Policy
Conflict in Michigan Municipalities. State and Local Government Review, 43(1), 32-45.
Herzberg, F., Mausner, B., & Snyderman, B. B. (1993). The Motivation to Work.
Piscataway, New Jersey: Transaction Publishers. Hess, F., & Leal, D. (2005). School House Politics: Expenditures, Interests, and
Competition in School Board Elections. In W. G. Howell (Ed.), Besieged: School Boards and the Future of Education Politics. Washington D.C.: Brookings Institution.
Hess, F., & Meeks, O. (2011). School Boards Circa 2010: Governance in an
Accountability Era. Washington D.C.: National School Board Association. Hill, P. T. (2004). Recovering from an Accident: Repairing Governance with
Competitive Advantage. In N. Epstein (Ed.), Who's in Charge Here. Washington D.C.: Brookings Institution.
Hochschild, J. (2005). What school boards can and cannot (or will not) accomplish. In W.
G. Howell (Ed.), Besieged: School boards and the future of education politics (pp. 308-323). Washington D.C.: The Brookings Institution.
Holzman, M. (2012). The Urgency of Now. Cambridge, MA: Schott Foundation for
Public Education. Honegger, S. (2010). Revenues and Expenditures for Public Elementary and Secondary

177
School Districts: School Year 2007-08 (Fiscal Year 2008). First Look. NCES 2010-323. National Center for Education Statistics, 28.
Houle, C. (1989). Governing boards: Their nature and nurture: Jossey-Bass San
Francisco. Hoxby, C. M., Murarka, S., & Kang, J. (2009). How New York City’s Charter Schools
Affect Achievement. Cambridge, MA: The New York City Charter Schools Evaluation Project.
Howell, W. (2005). Besieged: School boards and the future of education politics:
Brookings Institution Press. Ihrke, D., Proctor, R., & Gabris, J. (2003). Understanding innovation in municipal
government: City council member perspectives. Journal of Urban Affairs, 25(1), 79-90.
Ihrke, D., & Scott Niederjohn, M. (2005). Conflict on city councils in Wisconsin. Journal
of Urban Affairs, 27(4), 453-462. Jehn K.A. (1997). A qualitative analyses of conflict types and dimensions in
organizational groups. Administrative Science Quarterly, 42, 530-557. Kava, R., & Olin, R. (2013). Local Government Expenditure and Revenue Limits.
Madison, WI: Wisconsin Legislative Fiscal Bureau. Keegan, L. G., & Finn Jr, C. E. (2004). Lost at Sea. Education Next, 4(3), 15-17 Kerr, N. (1964). The school board as an agency of legitimation. Sociology of Education,
38(1), 34-59. Kingdon, J. (1995). Agendas, alternatives, and public policies. The University of
Michigan: Harper Collins College Publishers. New York. Kirst, M. (2008). The Evolving Role of School Boards: Retrospect and Prospect. In T. L.
Alsbury (Ed.), The Future of School Board Governance (pp. 37-60). Lanham, MD: Roman & Littlefield.
Kozol, J. (2012). Savage inequalities: Children in America's schools. Broadway. Land, D. (2002). Local school boards under review: Their role and effectiveness in
relation to students’ academic achievement. Review of Educational Research, 72(2), 229-278.
Levin, H. (2002). A comprehensive framework for evaluating educational vouchers.
Educational Evaluation and Policy Analysis, 24(3), 159.

178
Levin, H. M. (2004). Multiple choice questions: The road ahead. In N. Epstein (Ed.),
Who’s in charge here: The tangled web of school governance and policy (pp. 228-255). Washington D.C.” Brookings Institution Press.
Lipsky, M. (2010). Street-Level Bureaucracy: Dilemmas of the Individual in Public
Service, 30th Anniversary Expanded Edition. New York: Russell Sage Foundation. Lutz, F. W., & Iannoccone, L. (2008). The dissatisfaction theory of American
Democracy. In T. L. Alsbury (Ed.), The Future of School Board Governance (pp. 3-24). Lanham, MD: Roman & Littlefield.
Maeroff, G. I. (2010). School Boards in America Flawed, But Still Significant. Phi Delta
Kappa, 91(6), 31-34. March, J. G. (1994). Primer on decision making: How decisions happen. Free Press. Marschall, Melissa H. (2005). Minority incorporation and local school boards. In W. G. Howell
(Ed.), Besieged: School boards and the future of education politics (pp. 173-198). Washington D.C.: Brookings Institution Press.
Meier, K. J., & England, R. E. (1984). Black representation and educational policy: are they
related?. The American Political Science Review, 392-403. Meier, K. J., & Stewart Jr, J. (1991). Cooperation and conflict in multiracial
school districts. The Journal of Politics, 53(4), 1123-33. Merrifield, L. (2013). Charter Schools. Madison, WI: Wisconsin Legislative Fiscal
Bureau. Mintrom, M. (1997). The state-local nexus in policy innovation diffusion: The case of
school choice. Publius: The Journal of Federalism, 27(3), 41. Moe, T. M., & Chubb, J. E. (2009). Liberating learning: Technology, politics, and the future of
American education. Jossey-Bass. Moe, T. (2005). Teacher unions and school board elections. In W. G. Howell (Ed.), Besieged:
School boards and the future of education politics (pp. 254-287). Washington D.C.: Brookings Institution Press.
Mosher, E. (1975). The school board in the family of governments. In P. J. Cistone (Ed.),
Understanding school boards: Problems and prospects (pp. 79). Lexington, MA: Lexington Books.
Murphy, J. (1991). I of ESEA: The Politics of Implementing Federal Education Reform. Education policy implementation, 13.

179
Nelson, K. L., & Nollenberger, K. (2011). Conflict and Cooperation in Municipalities Do
Variations in Form of Government Have an Effect?. Urban Affairs Review, 47(5), 696-720.
NSBA. (1974). Women on School Boards. Washington D.C.: National School Boards
Association. Odden, A. R. (2011). Strategic Management of Human Capital in Education. New York:
Routledge. Ostrom, V. (2011). The Intellectual Crisis in American Public Administration.
Tuscaloosa, AL: The University of Alabama Press. Peterson, K. D., & Deal, T. E. (2009). The Shaping School Culture Field book. San
Francisco, CA: Jossey-Bass. Peterson, P. E. (1981). City Limits. Chicago: University of Chicago Press. Peterson, P. E. (2010). Saving schools: From Horace Mann to virtual learning. Harvard
University Press. Peterson, P. (1976). School Politics Chicago Style. Chicago: University of Chicago Press. Pierre, J. (1999). Models of urban governance. Urban Affairs Review, 34(3), 372. Racine Unified School District (RUSD), (2009). 2009-2013 Labor Agreement between
the Racine Unified School District and the Racine Education Association. Renz, D. O. (2004). Exploring the puzzle of board design: What’s your type? The
Nonprofit Quarterly, 11(4). Renzulli, L., & Roscigno, V. (2005). Charter school policy, implementation, and
diffusion across the United States. Sociology of Education, 78(4), 344. Rice, R., Delagardelle, M., Buckton, M., Jons, C., Lueders, W., Vens, M. J., et al. (2000).
THE LIGHTHOUSE INQUIRY: School Board/Superintendent Team Behaviors in School Districts with Extreme Differences in Student Achievement. Paper presented at the American Educational Research Association 2001 Annual Meeting.
Schein, E. H. (1987). The art of managing human resources. Oxford University Press,
USA. Simon, H. A. (1972). Theories of bounded rationality. Decision and organization, 1, 161-

180
176. Skiba, R. J., & Peterson, R. L. (2000). School discipline at a crossroads: From zero
tolerance to early response. Exceptional Children, 66(3), 335-396. Smith, R. (2005). Saving black boys. School Administrator, 62(1),16-25. Smoley, E. R. (1999). Effective School Boards: Strategies for Improving Board
Performance San Francisco, CA: Jossey-Bass. Spillane, J. (1996). School districts matter: Local educational authorities and state
instructional policy. Educational Policy, 10(1), 63. Stillman, R. J. (1999). Preface to public administration: A search for themes and
direction. Burke, VA: Chatelaine Press. Svara, J. (1990). Official Leadership in the City: Patterns of Conflict and Cooperation.
New York: Oxford University Press, USA. Swanson, C. B. (2003). Who Graduates? Who Doesn’t? A Statistical Portrait of Public
High School Graduation, Class of 2001. Washington D.C.: The Urban Institute. Teske, P., Schneider, M., & Cassese, E. (2005). Local school boards as authorizers of
charter schools. In W. G. Howell (Ed.), Besieged: School boards and the future of education politics, (pp. 129-149). Washington D.C.: Brooking Institution Press.
U.S. Department of Education (USDOE). Institute of Education Sciences, National
Center for Education Statistics. Verba, S., Burns, N., & Schlozman, K. (1997). Knowing and caring about politics:
Gender and political engagement. Journal of Politics, 59(4), 1051-1072. Vijayalakshmi, V. (2002). Gender Accountability and Political Representation in Local
Government. Institute for Social and Economic Change, Working Paper, 1-29. Viteritti, J. (Ed.). (2009). When mayors take charge: School governance in the city.
Washington D.C.: Brookings Institution Press. Viteritti, J. (2005). The end of local politics. In W. G. Howell (Ed.), Besieged: School boards
and the future of education politics (pp. 308-323). Washington D.C.: Brookings Institution Press.
Walser, N. (2009). The Essential School Board Book: Better Governance in the Age of
Accountability. Cambrige, MA: Harvard Education Press.

181
Winters, M. A., Dixon, B. L., & Greene, J. P. (2012). Observed characteristics and teacher quality: Impacts of sample selection on a value added model. Economics of Education Review, 31(1), 19-32.
Wisconsin Association of School Boards (WASB). (2012). Membership Survey. Madison,
WI. Wisconsin State Constitution (Wisconsin Legislative Reference Bureau 2011). Witte, J., Weimer, D., & Shober, A. (2007). The Performance of Charter Schools in
Wisconsin. Journal of Policy Analysis and Management, 26(3), 557-572. Wong, K., & Langevin, W. (2007). Policy expansion of school choice in the American
states. Peabody Journal of Education, 82(2), 440-472. Wong, K. K., Shen, F., Anagnostopoulous, D., & Rutledge, S. (2007). The education
mayor: improving America's schools. Washington D.C.: Georgetown University Press.
Wong, K., & Shen, F. (2005). When mayors lead urban schools: Assessing the effects of
takeover. In W. G. Howell (Ed.), Besieged: School boards and the future of education politics (pp. 81-101). Washington D.C.: Brookings Institution Press.
Wong, K., & Shen, F. (2003). Measuring the effectiveness of city and state takeover as a school reform strategy. Peabody Journal of Education, 78(4), 89-119. Zeigler, L.H. (1975). School board research: The problems and prospects. In P. J. Cistone (Ed.),
Understanding school boards: Problems and prospects (pp. 3-16). Lexington, MA: Lexington Books.
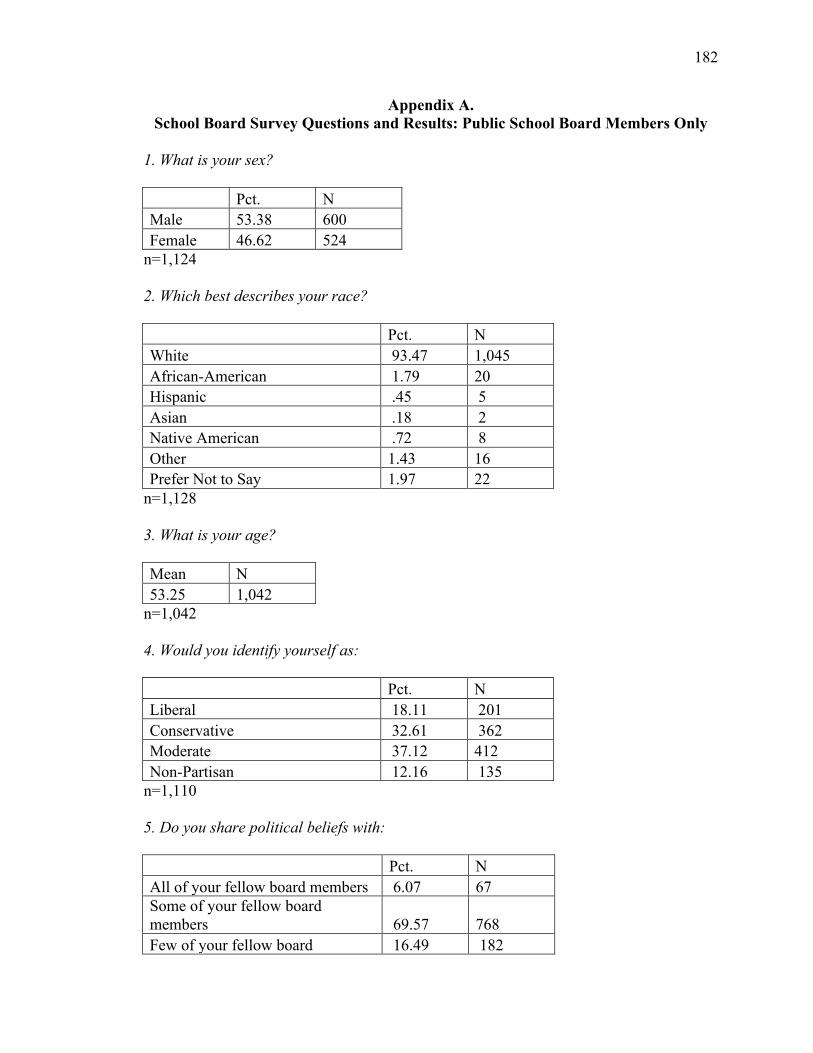
182
Appendix A. School Board Survey Questions and Results: Public School Board Members Only
1. What is your sex?
Pct. N
Male 53.38 600 Female 46.62 524
n=1,124 2. Which best describes your race? Pct. N White 93.47 1,045 African-American 1.79 20 Hispanic .45 5 Asian .18 2 Native American .72 8 Other 1.43 16 Prefer Not to Say 1.97 22
n=1,128 3. What is your age? Mean N 53.25 1,042
n=1,042 4. Would you identify yourself as: Pct. N Liberal 18.11 201 Conservative 32.61 362 Moderate 37.12 412 Non-Partisan 12.16 135
n=1,110 5. Do you share political beliefs with: Pct. N All of your fellow board members 6.07 67 Some of your fellow board members 69.57 768 Few of your fellow board 16.49 182

183
members None of your fellow board members 7.88 87
n=1,104 6. Have you held elected office prior to serving on your school board? Pct. N Yes 13.31 148 No 86.69 964
n=1,112 7. Do members of your board serve under term limits? Pct. N Yes 32.26 359 No 67.74 754
n=1,113 8. How long have you served on your school board? Pct. N 0-2 years 19.79 222 3-4 years 19.07 214 5-6 years 14.35 161 More than six years 46.79 525
n=1,122 9. In your last election did you have an opponent? Pct. N Yes 63.80 712 No 36.20 1,116
n=1,116 10. Do you have a job outside of the school board? Pct. N Yes 76.83 859 No 23.17 259
n=1,118 11. If yes, which best describes the nature of your non-school board job?
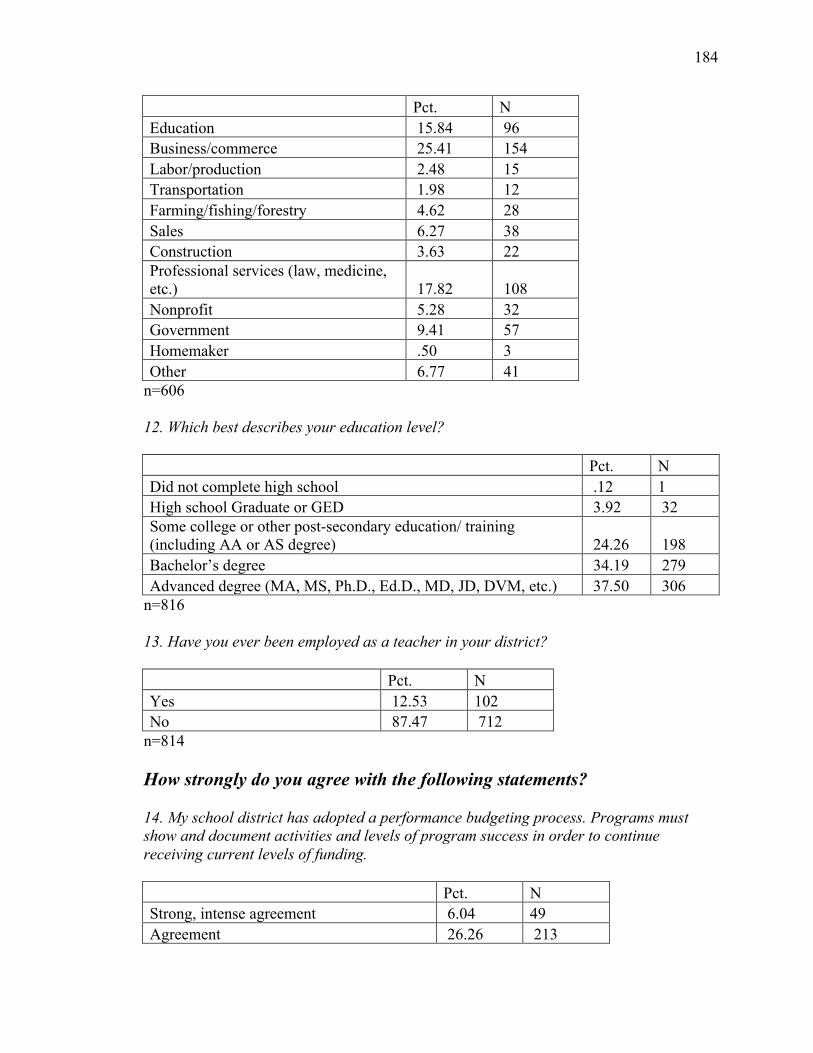
184
Pct. N Education 15.84 96 Business/commerce 25.41 154 Labor/production 2.48 15 Transportation 1.98 12 Farming/fishing/forestry 4.62 28 Sales 6.27 38 Construction 3.63 22 Professional services (law, medicine, etc.) 17.82 108 Nonprofit 5.28 32 Government 9.41 57 Homemaker .50 3 Other 6.77 41
n=606 12. Which best describes your education level? Pct. N Did not complete high school .12 1 High school Graduate or GED 3.92 32 Some college or other post-secondary education/ training (including AA or AS degree) 24.26 198 Bachelor’s degree 34.19 279 Advanced degree (MA, MS, Ph.D., Ed.D., MD, JD, DVM, etc.) 37.50 306
n=816 13. Have you ever been employed as a teacher in your district? Pct. N Yes 12.53 102 No 87.47 712
n=814 How strongly do you agree with the following statements? 14. My school district has adopted a performance budgeting process. Programs must show and document activities and levels of program success in order to continue receiving current levels of funding. Pct. N Strong, intense agreement 6.04 49 Agreement 26.26 213
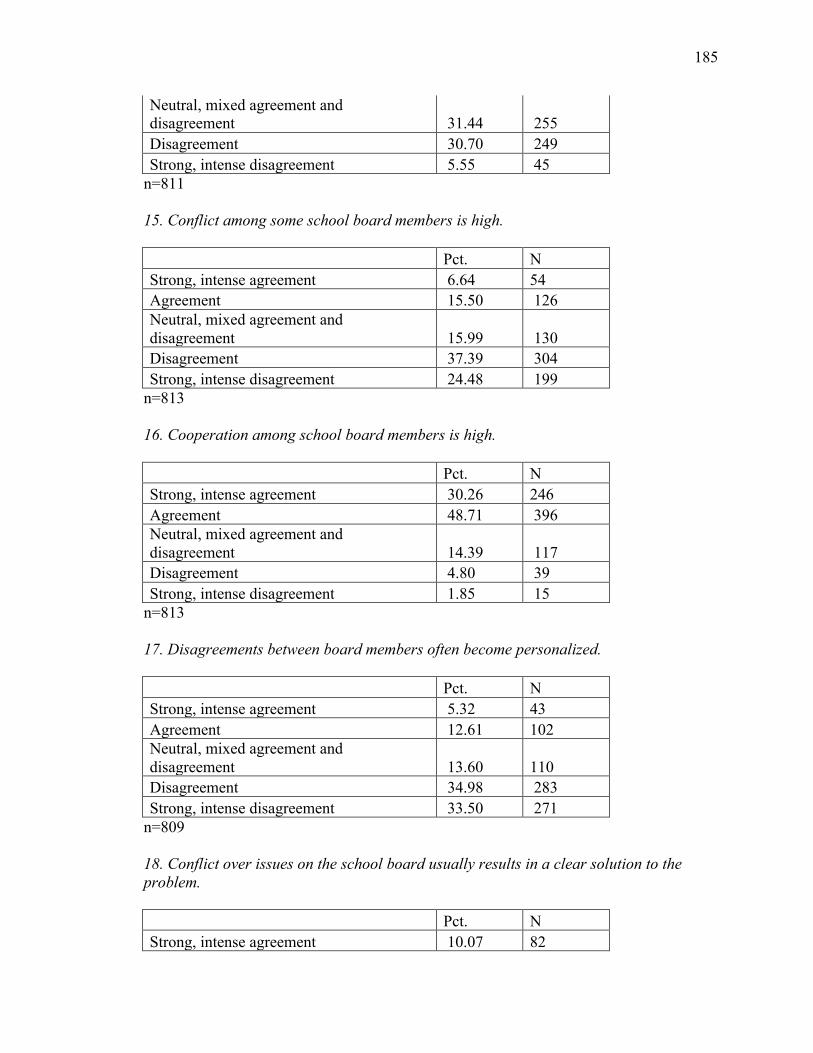
185
Neutral, mixed agreement and disagreement 31.44 255 Disagreement 30.70 249 Strong, intense disagreement 5.55 45
n=811 15. Conflict among some school board members is high. Pct. N Strong, intense agreement 6.64 54 Agreement 15.50 126 Neutral, mixed agreement and disagreement 15.99 130 Disagreement 37.39 304 Strong, intense disagreement 24.48 199
n=813 16. Cooperation among school board members is high. Pct. N Strong, intense agreement 30.26 246 Agreement 48.71 396 Neutral, mixed agreement and disagreement 14.39 117 Disagreement 4.80 39 Strong, intense disagreement 1.85 15
n=813 17. Disagreements between board members often become personalized. Pct. N Strong, intense agreement 5.32 43 Agreement 12.61 102 Neutral, mixed agreement and disagreement 13.60 110 Disagreement 34.98 283 Strong, intense disagreement 33.50 271
n=809 18. Conflict over issues on the school board usually results in a clear solution to the problem. Pct. N Strong, intense agreement 10.07 82

186
Agreement 49.14 400 Neutral, mixed agreement and disagreement 26.78 218 Disagreement 11.18 91 Strong, intense disagreement 2.83 23
n=814 19. School board coalitions (two or more individual members joining forces) tend to form along predictable lines (e.g. political party, male/female, etc.) Pct. N Strong, intense agreement 8.12 66 Agreement 21.65 176 Neutral, mixed agreement and disagreement 20.42 166 Disagreement 31.49 256 Strong, intense disagreement 18.33 149
n=813 20. During board negotiations, prior conflicts often resurface. Pct. N Strong, intense agreement 4.05 33 Agreement 18.18 148 Neutral, mixed agreement and disagreement 20.64 168 Disagreement 37.96 309 Strong, intense disagreement 19.16 156
n=814 21. The school board has a clear leader. Pct. N Strong, intense agreement 17.86 145 Agreement 39.78 323 Neutral, mixed agreement and disagreement 25.37 206 Disagreement 13.55 110 Strong, intense disagreement 3.45 28
n=812 22. The clear board leader is also the board president. Pct. N

187
Strong, intense agreement 18.30 149 Agreement 33.17 270 Neutral, mixed agreement and disagreement 27.03 220 Disagreement 16.22 132 Strong, intense disagreement 5.28 43
n=814 23. The board is highly productive. Pct. N Strong, intense agreement 23.51 190 Agreement 49.50 400 Neutral, mixed agreement and disagreement 17.57 142 Disagreement 7.43 60 Strong, intense disagreement 1.98 16
n=808 24. Board decisions are supported by all members once made. Pct. N Strong, intense agreement 28.62 233 Agreement 45.82 373 Neutral, mixed agreement and disagreement 12.65 103 Disagreement 10.07 82 Strong, intense disagreement 2.83 23
n=814 25. How often do you meet as a board? Pct. N Less than Once a Month .12 1 Once a Month 38.07 311 2-3 Times a Month 57.53 470 More than 3 Times a Month 4.28 35
n=817 26. Do you think your fellow board members share your definition of accountability as it relates to academic outcomes in your district? Pct. N Yes 79.92 605

188
No 152 20.08 n=757 27. Please rank the following topics in order of your school board's priority.
Mean Rank N
Strategic Planning 3.44 762 Setting Academic Standards 3.38 762 Making Assessment Policies 5.44 762 Making Student Behavior Policies 6.36 762 Hiring the Superintendent 4.89 762 Holding School Staff Accountable for District Performance 5.70 762 Collaborating with Interest Groups 8.07 762 Interacting with the Public 6.38 762 Board Development 7.68 762 Monitoring Fiscal Performance 3.67 762
28. Which best describes the way in which your board governs? Pct. N The board governs and oversees operations through committees established along functional lines (finance, human resources, programs) but delegates the management functions to the superintendent 3.39 27 The board manages, governs and performs the work of the organization. 3.02 24 The board governs through policies that establish organizational aims (ends), governance approaches, and management limitations. These policies also should define the relationship of the board with the superintendent. The superintendent broad freedom to determine the means that will be used to achieve organizational aims. 54.15 431 The board manages operations through functional committees that may or may not have a staff coordinator. 39.45 314
n=796 How much do the following statements describe the members of your board? 29. Members take responsibility for past decisions. Pct. N Very Little 2.98 24

189
Little 6.08 49 Some 28.91 233 Greatly 49.75 401 Very Greatly 12.28 99
n=806 30. Members freely admit when they are wrong. Pct. N Very Little 8.29 67 Little 13.37 108 Some 44.06 356 Greatly 28.34 229 Very Greatly 5.94 48
n=808 31. Members can take each other at their word Pct. N Very Little 3.72 30 Little 5.70 46 Some 24.41 197 Greatly 42.50 343 Very Greatly 23.67 191
n=807 32. Members do what they say they will do. Pct. N Very Little 2.72 22 Little 3.84 31 Some 23.51 190 Greatly 51.86 419 Very Greatly 18.07 146
n=808 33. Members willingly try new things without fear of ridicule. Pct. N Very Little 4.60 37 Little 9.32 75 Some 35.03 282 Greatly 38.88 313
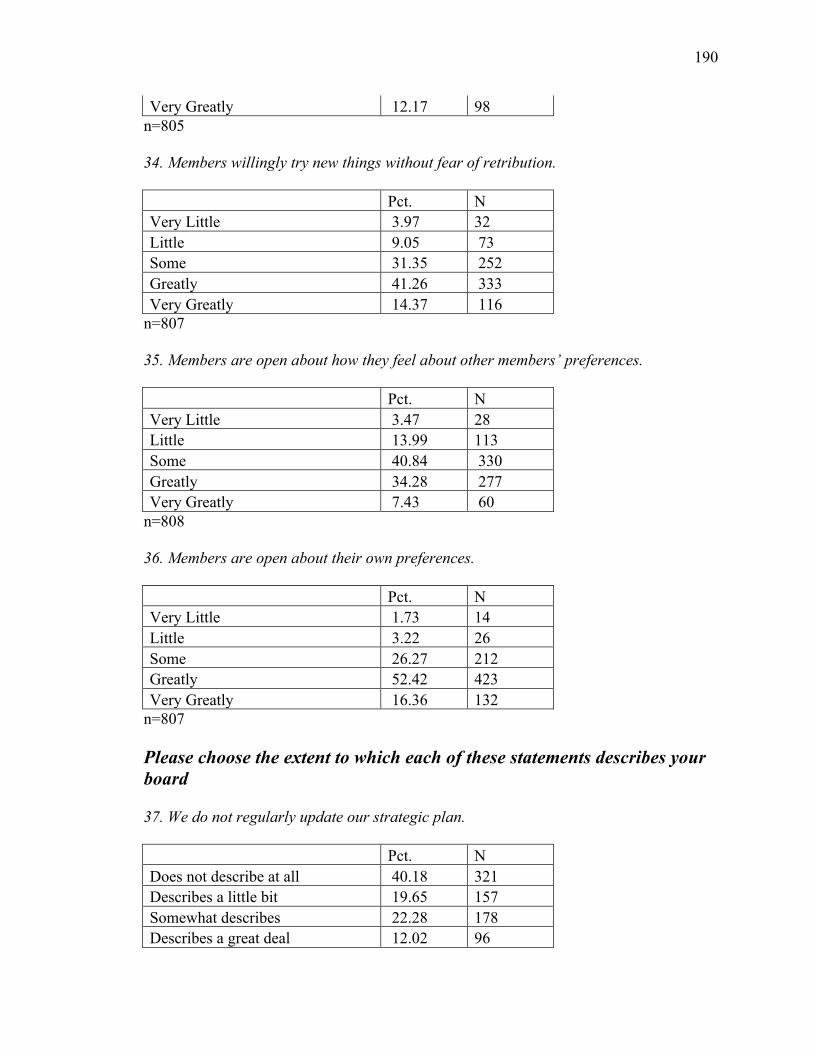
190
Very Greatly 12.17 98 n=805 34. Members willingly try new things without fear of retribution. Pct. N Very Little 3.97 32 Little 9.05 73 Some 31.35 252 Greatly 41.26 333 Very Greatly 14.37 116
n=807 35. Members are open about how they feel about other members’ preferences. Pct. N Very Little 3.47 28 Little 13.99 113 Some 40.84 330 Greatly 34.28 277 Very Greatly 7.43 60
n=808 36. Members are open about their own preferences. Pct. N Very Little 1.73 14 Little 3.22 26 Some 26.27 212 Greatly 52.42 423 Very Greatly 16.36 132
n=807 Please choose the extent to which each of these statements describes your board 37. We do not regularly update our strategic plan. Pct. N Does not describe at all 40.18 321 Describes a little bit 19.65 157 Somewhat describes 22.28 178 Describes a great deal 12.02 96
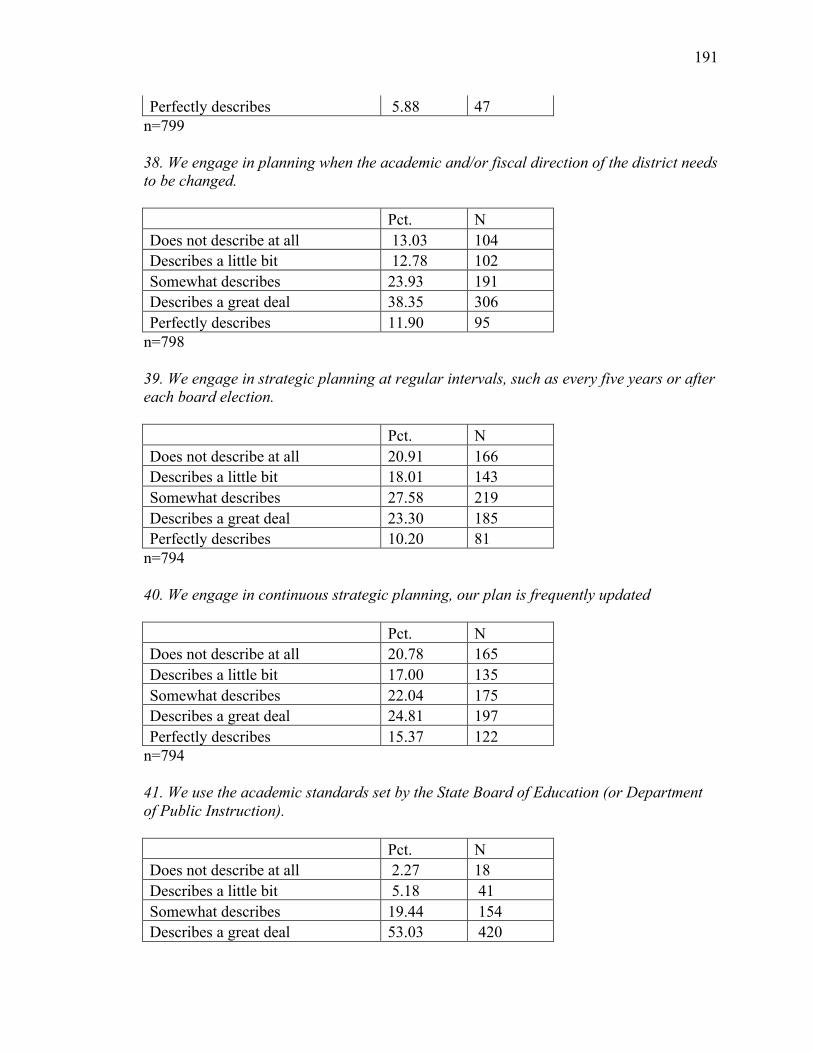
191
Perfectly describes 5.88 47 n=799 38. We engage in planning when the academic and/or fiscal direction of the district needs to be changed. Pct. N Does not describe at all 13.03 104 Describes a little bit 12.78 102 Somewhat describes 23.93 191 Describes a great deal 38.35 306 Perfectly describes 11.90 95
n=798 39. We engage in strategic planning at regular intervals, such as every five years or after each board election. Pct. N Does not describe at all 20.91 166 Describes a little bit 18.01 143 Somewhat describes 27.58 219 Describes a great deal 23.30 185 Perfectly describes 10.20 81
n=794 40. We engage in continuous strategic planning, our plan is frequently updated Pct. N Does not describe at all 20.78 165 Describes a little bit 17.00 135 Somewhat describes 22.04 175 Describes a great deal 24.81 197 Perfectly describes 15.37 122
n=794 41. We use the academic standards set by the State Board of Education (or Department of Public Instruction). Pct. N Does not describe at all 2.27 18 Describes a little bit 5.18 41 Somewhat describes 19.44 154 Describes a great deal 53.03 420

192
Perfectly describes 20.08 159 n=792 42. We set and tweak district academic standards in response to student needs. Pct. N Does not describe at all 10.18 81 Describes a little bit 11.93 95 Somewhat describes 26.38 210 Describes a great deal 38.82 309 Perfectly describes 12.69 101
n=796 43. We set and update district academic standards at regular intervals, such as every five years or after each board election. Pct. N Does not describe at all 25.98 206 Describes a little bit 20.18 160 Somewhat describes 23.83 189 Describes a great deal 24.09 191 Perfectly describes 5.93 47
n=793 44. We consistently set academic standards more rigorous than those required by the State Board of Education (or Department of Public Instruction). Pct. N Does not describe at all 15.45 123 Describes a little bit 13.69 109 Somewhat describes 25.75 205 Describes a great deal 26.51 211 Perfectly describes 18.59 148
n=796 45. We solely use standardized tests required by the State Board of Education (or Department of Public Instruction). Pct. N Does not describe at all 32.58 258 Describes a little bit 17.68 140 Somewhat describes 25.76 204 Describes a great deal 17.42 138

193
Perfectly describes 6.57 52 n=792 46. We set and tweak district assessment policies in response to student needs. For example, if we see our students struggling in math we will increase the use of math assessments. Pct. N Does not describe at all 9.13 72 Describes a little bit 13.94 110 Somewhat describes 29.15 230 Describes a great deal 36.88 291 Perfectly describes 10.90 86
n=789 47. We set and update district standardized assessment policies at regular intervals, such as every five years or after each board election. Pct. N Does not describe at all 22.11 174 Describes a little bit 21.22 167 Somewhat describes 30.50 240 Describes a great deal 22.36 176 Perfectly describes 3.81 30
n=787 48. We consistently use standardized assessments that are more rigorous than those required by the State Board of Education (or Department of Public Instruction). We also use student portfolios and/or alternative ways to measure student performance. Pct. N Does not describe at all 12.93 102 Describes a little bit 16.98 134 Somewhat describes 25.35 200 Describes a great deal 29.40 232 Perfectly describes 15.34 121
n=789 49. We use the behavior policies required by the State Board of Education (or Department of Public Instruction). Pct. N Does not describe at all 10.39 80 Describes a little bit 17.53 135
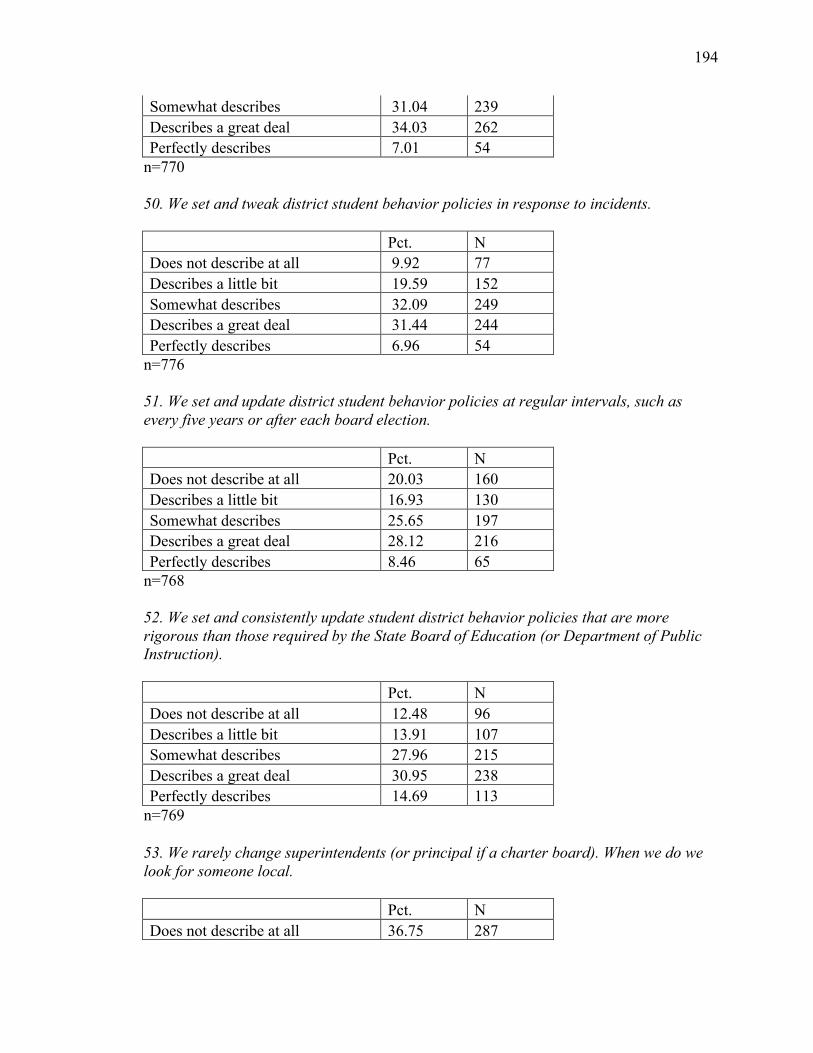
194
Somewhat describes 31.04 239 Describes a great deal 34.03 262 Perfectly describes 7.01 54
n=770 50. We set and tweak district student behavior policies in response to incidents. Pct. N Does not describe at all 9.92 77 Describes a little bit 19.59 152 Somewhat describes 32.09 249 Describes a great deal 31.44 244 Perfectly describes 6.96 54
n=776 51. We set and update district student behavior policies at regular intervals, such as every five years or after each board election. Pct. N Does not describe at all 20.03 160 Describes a little bit 16.93 130 Somewhat describes 25.65 197 Describes a great deal 28.12 216 Perfectly describes 8.46 65
n=768 52. We set and consistently update student district behavior policies that are more rigorous than those required by the State Board of Education (or Department of Public Instruction). Pct. N Does not describe at all 12.48 96 Describes a little bit 13.91 107 Somewhat describes 27.96 215 Describes a great deal 30.95 238 Perfectly describes 14.69 113
n=769 53. We rarely change superintendents (or principal if a charter board). When we do we look for someone local. Pct. N Does not describe at all 36.75 287

195
Describes a little bit 20.36 159 Somewhat describes 21.00 164 Describes a great deal 14.85 116 Perfectly describes 7.04 55
n=781 54. We conduct a broad search for a superintendent (or principal if a charter board) with expertise on the pressing needs of our district. Pct. N Does not describe at all 11.42 89 Describes a little bit 8.86 69 Somewhat describes 19.77 154 Describes a great deal 36.33 283 Perfectly describes 23.62 184
n=779 55. We tend to hire a new superintendent (or principal if a charter board) at regular intervals, such as once every five years of after a board election. Pct. N Does not describe at all 81.84 640 Describes a little bit 8.57 67 Somewhat describes 5.75 45 Describes a great deal 2.81 22 Perfectly describes 1.02 8
n=782 56. We look for a superintendent (or principal if a charter board) that shares the values of, and is willing to be a collaborator with, the school board. Pct. N Does not describe at all 6.92 54 Describes a little bit 4.87 38 Somewhat describes 13.72 107 Describes a great deal 37.82 295 Perfectly describes 36.67 286
n=780 57. We primarily support and defend the decisions of the Superintendent (or principal if a charter board). Pct. N

196
Does not describe at all 1.53 12 Describes a little bit 6.39 50 Somewhat describes 15.71 123 Describes a great deal 56.32 441 Perfectly describes 20.05 157
n=783 58. We support and defend the decisions of the Superintendent (or principal if a charter board) until concerns with those decisions arise. Pct. N Does not describe at all 16.18 127 Describes a little bit 17.83 140 Somewhat describes 20.64 162 Describes a great deal 34.78 273 Perfectly describes 10.57 83
n=785 59. We allow the Superintendent (or principal if a charter board) to manage the district as he or she sees fit, but regularly monitor and review his or her performance. Pct. N Does not describe at all 4.83 38 Describes a little bit 6.36 50 Somewhat describes 15.01 118 Describes a great deal 42.49 334 Perfectly describes 31.30 246
n=786 60. We view the Superintendent (or principal if a charter board) as a full partner in the governing process. Pct. N Does not describe at all 2.41 19 Describes a little bit 6.59 52 Somewhat describes 10.90 86 Describes a great deal 39.80 314 Perfectly describes 40.30 318
n=789 61. Organized interest groups have significant influence over board decisions. Pct. N

197
Does not describe at all 45.34 355 Describes a little bit 32.69 256 Somewhat describes 13.03 102 Describes a great deal 6.90 54 Perfectly describes 2.04 16
n=783 62. We regularly listen to the ideas of organized interest groups and act on their input when we deem it appropriate. Pct. N Does not describe at all 13.14 103 Describes a little bit 24.49 192 Somewhat describes 31.38 246 Describes a great deal 24.87 195 Perfectly describes 6.12 48
n=784 63. Organized interest groups are generally only active during board elections. Pct. N Does not describe at all 49.43 387 Describes a little bit 25.42 199 Somewhat describes 14.56 114 Describes a great deal 8.43 66 Perfectly describes 2.17 17
n=783 64. We do not consider the input of organized interest groups when making board decisions. Pct. N Does not describe at all 45.07 352 Describes a little bit 24.71 193 Somewhat describes 17.54 137 Describes a great deal 9.22 72 Perfectly describes 3.46 27
n=781 65. Community members have significant influence over board decisions. Pct. N Does not describe at all 17.90 140
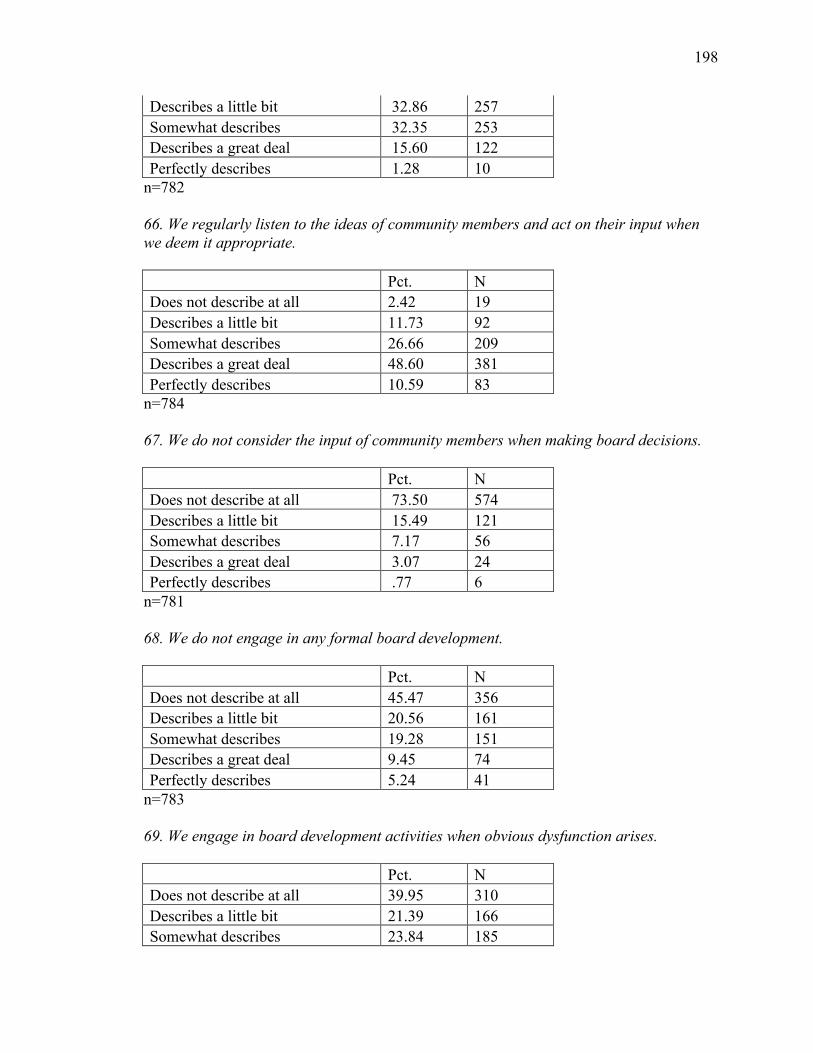
198
Describes a little bit 32.86 257 Somewhat describes 32.35 253 Describes a great deal 15.60 122 Perfectly describes 1.28 10
n=782 66. We regularly listen to the ideas of community members and act on their input when we deem it appropriate. Pct. N Does not describe at all 2.42 19 Describes a little bit 11.73 92 Somewhat describes 26.66 209 Describes a great deal 48.60 381 Perfectly describes 10.59 83
n=784 67. We do not consider the input of community members when making board decisions. Pct. N Does not describe at all 73.50 574 Describes a little bit 15.49 121 Somewhat describes 7.17 56 Describes a great deal 3.07 24 Perfectly describes .77 6
n=781 68. We do not engage in any formal board development. Pct. N Does not describe at all 45.47 356 Describes a little bit 20.56 161 Somewhat describes 19.28 151 Describes a great deal 9.45 74 Perfectly describes 5.24 41
n=783 69. We engage in board development activities when obvious dysfunction arises. Pct. N Does not describe at all 39.95 310 Describes a little bit 21.39 166 Somewhat describes 23.84 185
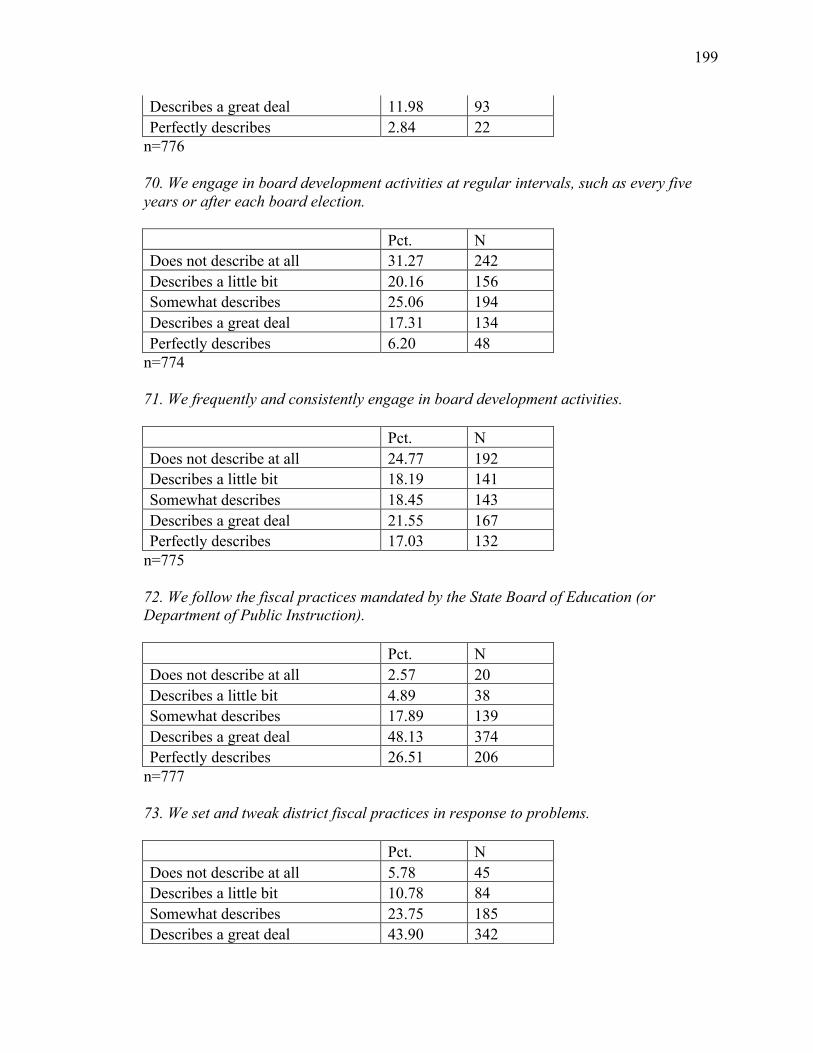
199
Describes a great deal 11.98 93 Perfectly describes 2.84 22
n=776 70. We engage in board development activities at regular intervals, such as every five years or after each board election. Pct. N Does not describe at all 31.27 242 Describes a little bit 20.16 156 Somewhat describes 25.06 194 Describes a great deal 17.31 134 Perfectly describes 6.20 48
n=774 71. We frequently and consistently engage in board development activities. Pct. N Does not describe at all 24.77 192 Describes a little bit 18.19 141 Somewhat describes 18.45 143 Describes a great deal 21.55 167 Perfectly describes 17.03 132
n=775 72. We follow the fiscal practices mandated by the State Board of Education (or Department of Public Instruction). Pct. N Does not describe at all 2.57 20 Describes a little bit 4.89 38 Somewhat describes 17.89 139 Describes a great deal 48.13 374 Perfectly describes 26.51 206
n=777 73. We set and tweak district fiscal practices in response to problems. Pct. N Does not describe at all 5.78 45 Describes a little bit 10.78 84 Somewhat describes 23.75 185 Describes a great deal 43.90 342
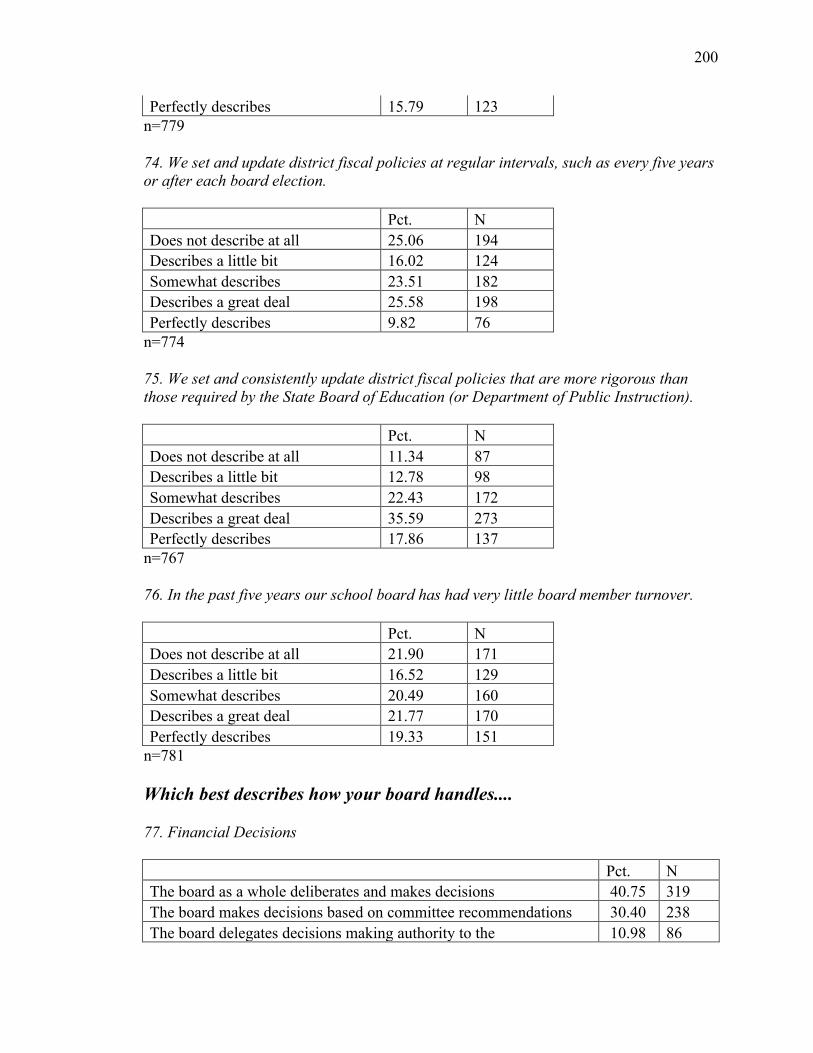
200
Perfectly describes 15.79 123 n=779 74. We set and update district fiscal policies at regular intervals, such as every five years or after each board election. Pct. N Does not describe at all 25.06 194 Describes a little bit 16.02 124 Somewhat describes 23.51 182 Describes a great deal 25.58 198 Perfectly describes 9.82 76
n=774 75. We set and consistently update district fiscal policies that are more rigorous than those required by the State Board of Education (or Department of Public Instruction). Pct. N Does not describe at all 11.34 87 Describes a little bit 12.78 98 Somewhat describes 22.43 172 Describes a great deal 35.59 273 Perfectly describes 17.86 137
n=767 76. In the past five years our school board has had very little board member turnover. Pct. N Does not describe at all 21.90 171 Describes a little bit 16.52 129 Somewhat describes 20.49 160 Describes a great deal 21.77 170 Perfectly describes 19.33 151
n=781 Which best describes how your board handles.... 77. Financial Decisions Pct. N The board as a whole deliberates and makes decisions 40.75 319 The board makes decisions based on committee recommendations 30.40 238 The board delegates decisions making authority to the 10.98 86

201
superintendent (or principal if a charter board) The board follows its established policies when making decisions 17.88 140
n=783 78. Personnel Decisions Pct. N The board as a whole deliberates and makes decisions 12.63 99 The board makes decisions based on committee recommendations 20.03 157 The board delegates decisions making authority to the superintendent (or principal if a charter board) 48.60 381 The board follows its established policies when making decisions 18.75 147
n=784 79. Decisions about the academic direction of the district Pct. N The board as a whole deliberates and makes decisions 25.26 196 The board makes decisions based on committee recommendations 26.68 207 The board delegates decisions making authority to the superintendent (or principal if a charter board) 31.70 246 The board follows its established policies when making decisions 16.37 127
n=776 80. Decisions regarding the public perception of the district Pct. N The board as a whole deliberates and makes decisions 51.48 400 The board makes decisions based on committee recommendations 15.19 118 The board delegates decisions making authority to the superintendent (or principal if a charter board) 18.28 142 The board follows its established policies when making decisions 15.06 117
n=777 81. Decisions regarding interactions with state government Pct. N The board as a whole deliberates and makes decisions 29.65 231 The board makes decisions based on committee recommendations 10.65 83 The board delegates decisions making authority to the superintendent (or principal if a charter board) 42.11 328 The board follows its established policies when making decisions 17.59 137
n=779
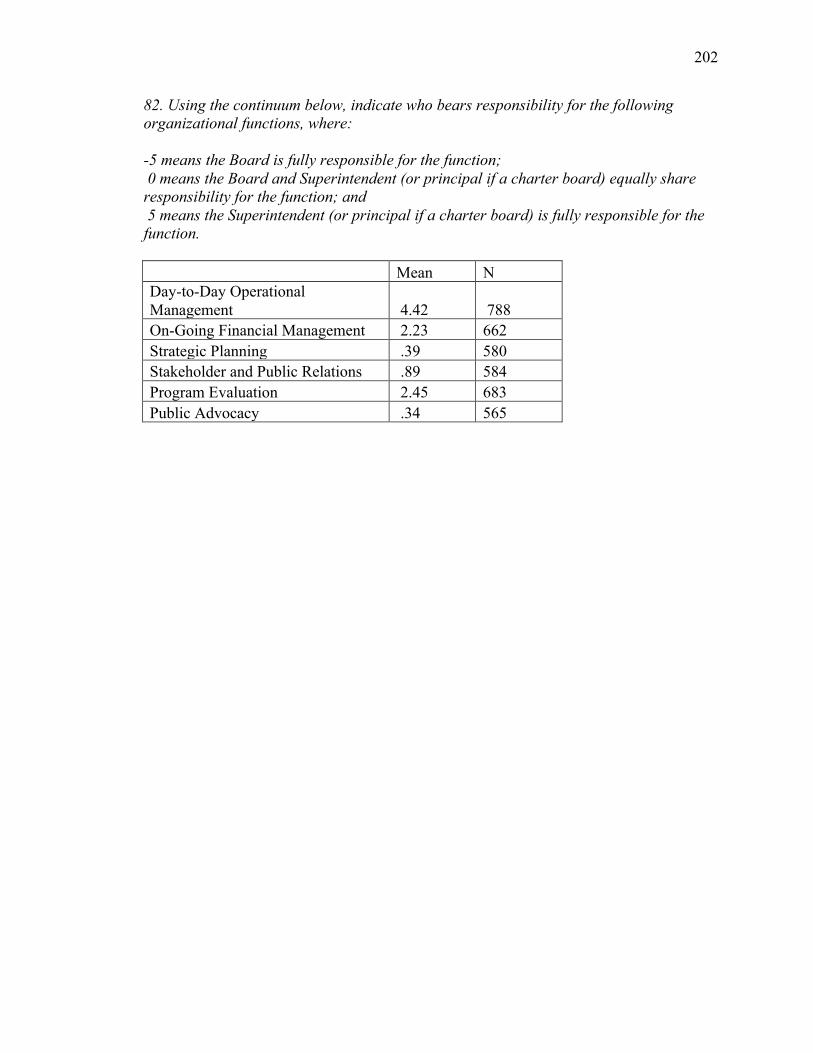
202
82. Using the continuum below, indicate who bears responsibility for the following organizational functions, where: -5 means the Board is fully responsible for the function; 0 means the Board and Superintendent (or principal if a charter board) equally share responsibility for the function; and 5 means the Superintendent (or principal if a charter board) is fully responsible for the function. Mean N Day-to-Day Operational Management 4.42 788 On-Going Financial Management 2.23 662 Strategic Planning .39 580 Stakeholder and Public Relations .89 584 Program Evaluation 2.45 683 Public Advocacy .34 565

203
Appendix B. Survey Solicitation Letter
Dear School Board Member,
We invite you to take part in a survey of decision-making on school boards in Wisconsin, Minnesota, Michigan, Utah, Florida, and Nevada. You were selected due to your position as a school board member in one of these states. While your participation is voluntary, we would greatly appreciate your assistance. Included in the e-mail is a link to an online survey. If you prefer to receive a paper survey, please e-mail Michael Ford at [email protected] with your address, and a paper survey will be mailed. We are seeking to understand the experiences and characteristics of school board members. We recognize the sensitive nature of many of the questions we have asked. We want to assure you that your responses will remain strictly confidential. No individual board or board member information will be released. Also, given the complexity of the issues being addressed, the questionnaire may take you about twenty minutes to complete. We are confident that you will find many of our questions interesting and will want to know what we have found out from all the school boards studied. The deadline for completing the survey is important for our research. Please complete and submit online by April 15, 2013.
There are no known risks associated with your participating in this study, other than the discomfort you may experience when answering what may be awkward questions about board dynamics. Possible benefits are that you will learn, from the results of this research, more about the decision-making processes used by other boards. PLEASE DO NOT INPUT YOUR NAME ANYWHERE ON THE SURVEY. If you have any questions about this research please contact Michael Ford using the information below: Michael Ford Doctoral Student, Urban Studies University of Wisconsin-Milwaukee 3835 S. Herman Street Milwaukee, WI 53207 414-803-2162 [email protected] This study was received IRB approval on February 19, 2013, IRB# 13.275. If you have any complaints about your experience as a participant in this study, please call or write: Melissa Spadanuda IRB Administrator University Safety and Assurances University of Wisconsin - Milwaukee P.O. Box 413, Engelmann 270 Milwaukee, WI 53201 Phone: 414-229-3173

204
Fax: 414-229-6729 www.irb.uwm.edu Although Ms. Spadanuda will ask your name, all complaints are kept in confidence. Thank you so much for your contribution to knowledge in this area. Sincerely, Michael Ford and Douglas Ihrke University of Wisconsin – Milwaukee Consent to Participate in Online Survey Research Study Title: The Impact of School Board Governance Behavior on Academic Achievement in Diverse States Person Responsible for Research: Douglas Ihrke and Michael Ford Study Description: The purpose of this research study is to better understand how school board governance affects academic achievement in diverse policy environments. Approximately 9,600 subjects will participate in this study. If you agree to participate, you will be asked to complete an online survey that will take approximately 20 minutes to complete. The questions will ask you about your background, your experiences as a school board member, and your relationships with other school board members and district personnel. Risks / Benefits: Risks to participants are considered minimal. Survey respondents may expect some psychological discomfort. The questions contained in the survey instrument are of a sensitive nature in the sense that the subject matter is the relationships and interactions within groups of which the participants are all members. Collection of data and survey responses using the internet involves the same risks that a person would encounter in everyday use of the internet (such as breach of confidentiality). While the researchers have taken every reasonable step to protect your confidentiality, there is always the possibility of interception or hacking of the data by third parties that is not under the control of the research team. There will be no costs for participating. There are no benefits to you other than to further research. Limits to Confidentiality Identifying information such as your school district will be collected for purposes of linking your Reponses, and those of your colleagues to district financial and academic performance data. Your responses will be treated as confidential and all reasonable efforts will be made so that no individual participant will be identified with his/her

205
answers. Data will be retained on the Qualtrics website server for on year and will be deleted after this time. However, data may exist on backups or server logs beyond the timeframe of this research project. Data transferred from the survey site will be saved in an encrypted format indefinitely. Only three people, the PI, student PI, and study staff will have access to the data collected by this study. The research team will remove your identifying information after linking the data and all study results will be reported without identifying information so that no one viewing the results will ever be able to match you with your responses. Voluntary Participation: Your participation in this study is voluntary. You may choose to not answer any of the questions or withdraw from this study at any time without penalty. Your decision will not change any present or future relationship with the University of Wisconsin Milwaukee. Who do I contact for questions about the study: For more information about the study or study procedures, contact Douglas Ihrke at [email protected]. Who do I contact for questions about my rights or complaints towards my treatment as a research subject? Contact the UWM IRB at 414-229-3173 or [email protected]. This study was approved on February 19, 2013, IRB# 13.275. Research Subject’s Consent to Participate in Research: By entering this survey, you are indicating that you have read the consent form, you are age 18 or older and that you voluntarily agree to participate in this research study. Thank you!

206
CURRICULUM VITAE
Michael Ford EDUCATION University of Wisconsin-Milwaukee M.A. Political Science Masters Paper: “Graduation Rates and Market Share in the Milwaukee Public Schools” Marquette University B.A. Political Science Cum Laude
May 2008
May 2004
TEACHING EXPERIENCE University of Wisconsin-Milwaukee Teaching Assistant to Douglas Ihrke, Ph.D. Political Science 763: Scope and Dynamics of Public Administration University of Wisconsin-Milwaukee Associate Lecturer – Urban Studies Program Urban Studies 360: Technology and the City University of Wisconsin-Milwaukee Associate Lecturer – Urban Studies Program Urban Studies 250: Exploring the Urban Environment University of Wisconsin-Milwaukee Teaching Assistant – Urban Studies Program Urban Studies 250: Exploring the Urban Environment
Fall 2012
Spring 2012
Fall 2011
Spring 2011
PROFESSIONAL EXPERIENCE Wisconsin Policy Research Institute Director of Research Hartland, WI School Choice Wisconsin Vice-President of Operations Milwaukee, WI School Choice Wisconsin Research Associate
September 2011-present
June 2008-September 2011
September 2004-June 2008

207
Milwaukee, WI Jason Fields for Wisconsin 11th Assembly District Campaign Manager/Consultant Milwaukee, WI
Fall 2006, Fall 2008
PEER-REVIEWED JOURNAL PUBLICATIONS “School Exits in the Milwaukee Parental Choice Program: Evidence of a Marketplace?” Journal of School Choice, 2011 5:2 182 – 204. “School Choice Legislation: Impact Assessment and Fiscal Notes.” Journal of School Choice, 2013 7:1 37 – 60. Co-authored with John Merrifield. OTHER PUBLICATIONS “An Overview of Milwaukee’s K-12 Education System,” Book Chapter in Pathway to Success for Milwaukee Schools, Wisconsin Policy Research Institute, June 2013. “Understanding School Finance in Wisconsin: A Primer.” Wisconsin Policy Research Institute, May 2013. “The Impact of Disruptive Students in Wisconsin School Districts.” Wisconsin Policy Research Institute, April, 2013. “Diane Ravitch’s Divisive Point of View.” Milwaukee Journal Sentinel, January 18, 2013. “MPS Wisely Embracing Charter Schools.” Milwaukee Journal Sentinel, September 15, 2012 “Using Value-Added Analysis to Raise Student Achievement in Wisconsin.” Wisconsin Policy Research Institute, June 2012. Co-authored with Sarah Archibald. “MPS’ Looming Fiscal Crack-Up.” Wisconsin Interest Magazine, July 2012. “A Modern Teacher Compensation System for Wisconsin.” Wisconsin Policy Research Institute, January 2012. “How to Deal with State’s School Wake-Up Call.” Madison Capital Times, June 11, 2012. Co-authored with Sarah Archibald. “Education Wake-Up Call is Looming.” Milwaukee Journal Sentinel, June 5, 2012. Co-authored with Sarah Archibald. “Milwaukee’s Lessons for Madison Prep.” Capital Times, Madison, WI, December 16, 2011. CONFERENCE PRESENTATIONS

208
“The Impact of the Release of Test Scores on Enrollment Patterns in Milwaukee’s School Voucher Program.” 71st Midwest Political Science Association Political Science Conference, Chicago, IL. April 2013. “Governing For Results On a Post-Collective Bargaining Wisconsin School Board.” 43rd Annual Urban Affairs Association Conference, San Francisco, CA. April 2013. “School Choice Legislation: Impact Assessment and Fiscal Notes.” Annual Conference of the Southern Economics Association, New Orleans, LA. November 2012 with Dr. John Merrifield. “The Impact of School Board Gender Representation on K-12 Fiscal and Academic Outcomes.” 42nd Annual Urban Affairs Association Conference, Pittsburgh, PA. April, 2012. “School Board Gender Representation and Fiscal and Academic Outcomes.” 17th Annual University of Wisconsin-Milwaukee Urban Studies Forum. April 2012. “School Choice Legislation: Impact Assessment and Fiscal Notes.” International School Choice and Reform Conference, Fort Lauderdale, FL. January 2012 with Dr. John Merrifield. “School Exits in the Milwaukee Parental Choice Program: Evidence of a Marketplace?” at the 41st Annual Urban Affairs Association Conference in New Orleans: March, 2011. OTHER PRESENTATIONS/MEDIA APPEARANCES Guest on Lake Effect, WUWM Milwaukee, April 18, 2013. Topic: The impact of disruptive students on K-12 education. Panelist at the 2012 Midwest Catholic Education Advocate Conference at Marquette University, July 12, 2012. “Milwaukee K-12 Education,” Presented at the 2012 Alliance for Catholic Education Parental Choice Symposium: Marquette University, June 15, 2012. “Independent Charter School Per-Pupil Payments: Projections and Policy Options.” Presented at the Milwaukee Charter School Advocates Seminar Number One, June 27, 2012. Appearance on Eau Claire, WI WEAU News, “Could Wisconsin Interstates Become Tollways?” February 13, 2012 “Wisconsin’s Economy and the Public Mood,” Presented at the Wisconsin Counties Association 2012 Legislative Exchange, February 7, 2012. Guest on UpFront with Mike Gousha, WISN Milwaukee, January 15, 2012. Topic: Teacher compensation policies. Panelist at the Illinois Policy Institute Vouchers and the Future of Education in Illinois discussion in Chicago, IL: Feb. 5, 2010. Guest on WGN Radio’s Milt Rosenberg show: September 21, 2009. Topic: Education reform.

209
Guest on Wisconsin Public Radio’s Conversations with Kathleen Dunn: February 28, 2008. Topic: Milwaukee education research. Presenter at the American Legislative Exchange Council School Choice Academy in Salt Lake City: June 14, 2008. DISCIPLINE SERVICE/AWARDS Peer Reviewer, SAGE Open 2012 Urban Affairs Association Conference Volunteer University of Wisconsin-Milwaukee Urban Studies Dissertation Research Grant University of Wisconsin-Milwaukee Urban Studies Graduate Teaching Fellow
April 2013
April 2012
Awarded April 28, 2012
2011-2012
PROFESSIONAL MEMBERSHIPS American Political Science Association American Society for Public Administration Southern Economics Association Urban Affairs Association