the impact of maldistribution and undersupply on the accreditation of international medical...
TRANSCRIPT

The Impact of Maldistribution and Undersupply on the Accreditation of International Medical Graduates
in Australia
ARC Health Governance Conference (Brisbane)Professor Lesleyanne Hawthorne
Associate Dean (International)OECD and Faculty of Medicine, Dentistry and Health Sciences
University of Melbourne
10 December 2007

Australia’s Evolving Medical Workforce
Who?
1. Australia-born
2. First generation migrants:
a. Permanent medical migrants
b. Temporary medical migrants
c. The children of migrants/refugees in medicine
3. International medical students
The latest Australian migration developments

Case Study 1: Migrant/Refugee Youth in Australian Medical and Dentistry Course Enrolments (2004)
Country of Birth Medical No.
% Dentistry No.
%
Australia 5,298 69.8% 504 48.4% UK 227 3.0% 25 2.4% Malaysia 190 2.5% 48 4.6% China 170 2.2% 47 4.5% HK 170 2.2% 41 3.9% India 169 2.2% 31 3.0% Sri Lanka 163 2.1% 29 2.8% Taiwan 146 1.9% 72 6.9% New Zealand 119 1.6% 12 1.2% South Africa 100 1.3% 4 0.4% Singapore 76 1.0% 9 0.9% USA 71 0.9% 4 0.4% South Korea 63 0.8% 42 4.0% Vietnam 56 0.7% 28 2.7% Iran 43 0.6% 17 1.6% Canada 34 0.4% 7 0.7% Other countries 493 6.5% 121 11.6% Total 7,588 100.0% 1,041 100.0% Source: I Dobson & B Birrell, People and Place Vol 13 No 4 2005

Case Study 2: International Medical Students in Australia
Numbers: Around 1500 per year
Internship outcomes (late 1990s versus 2006)
Student goals (privately funded versus scholarship students)
Changing Australian policy (shortage-driven)
Victoria, South Australia, NSW
Potential internship ‘area of need’ permanent resident pathway
New skilled migration policy: Medicine = ‘migration occupation in demand’ (20 bonus points)
Variations by state
Source: J Hamilton & L Hawthorne forthcoming (2008)

The Demographic Context of International Medical Graduates (IMGs) in Australia
The Registration and Training Status of Overseas Trained Doctors in Australia: L Hawthorne, G Hawthorne & B Crotty (Department of Health and Ageing 2007)
Growing global competition for doctors (West, Gulf States, Africa)
Temporary flows ↑
– Attraction to government/ employers– Multiple players (eg ‘Recruit-a-Doc)– Comparison: Canada, UK (NHS and Skilled Temporary Migration Program)– Different accreditation requirements
Permanent flows ↑
– Migration Occupations in Demand List
Differential patterns and strategies by state:
– Eg WA ‘adventure medicine’
Net gains versus losses in OTD retention:
– Highest retention for Middle East, South Asia, SE Asia, NE Asia
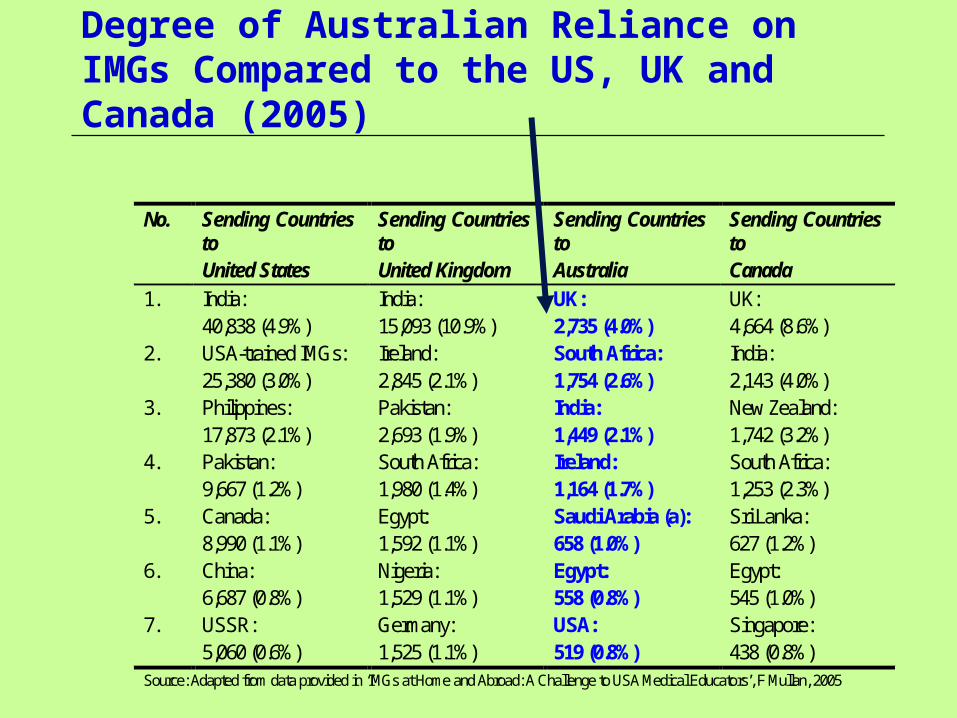
Degree of Australian Reliance on IMGs Compared to the US, UK and Canada (2005)
No. Sending Countries to United States
Sending Countries to United Kingdom
Sending Countries to Australia
Sending Countries to Canada
1. India: 40,838 (4.9%)
India: 15,093 (10.9%)
UK: 2,735 (4.0%)
UK: 4,664 (8.6%)
2. USA-trained IMGs: 25,380 (3.0%)
Ireland: 2,845 (2.1%)
South Africa: 1,754 (2.6%)
India: 2,143 (4.0%)
3. Philippines: 17,873 (2.1%)
Pakistan: 2,693 (1.9%)
India: 1,449 (2.1%)
New Zealand: 1,742 (3.2%)
4. Pakistan: 9,667 (1.2%)
South Africa: 1,980 (1.4%)
Ireland: 1,164 (1.7%)
South Africa: 1,253 (2.3%)
5. Canada: 8,990 (1.1%)
Egypt: 1,592 (1.1%)
Saudi Arabia (a): 658 (1.0%)
Sri Lanka: 627 (1.2%)
6. China: 6,687 (0.8%)
Nigeria: 1,529 (1.1%)
Egypt: 558 (0.8%)
Egypt: 545 (1.0%)
7. USSR: 5,060 (0.6%)
Germany: 1,525 (1.1%)
USA: 519 (0.8%)
Singapore: 438 (0.8%)
Source: Adapted from data provided in ‘IMGs at Home and Abroad: A Challenge to USA Medical Educators’, F Mullan, 2005
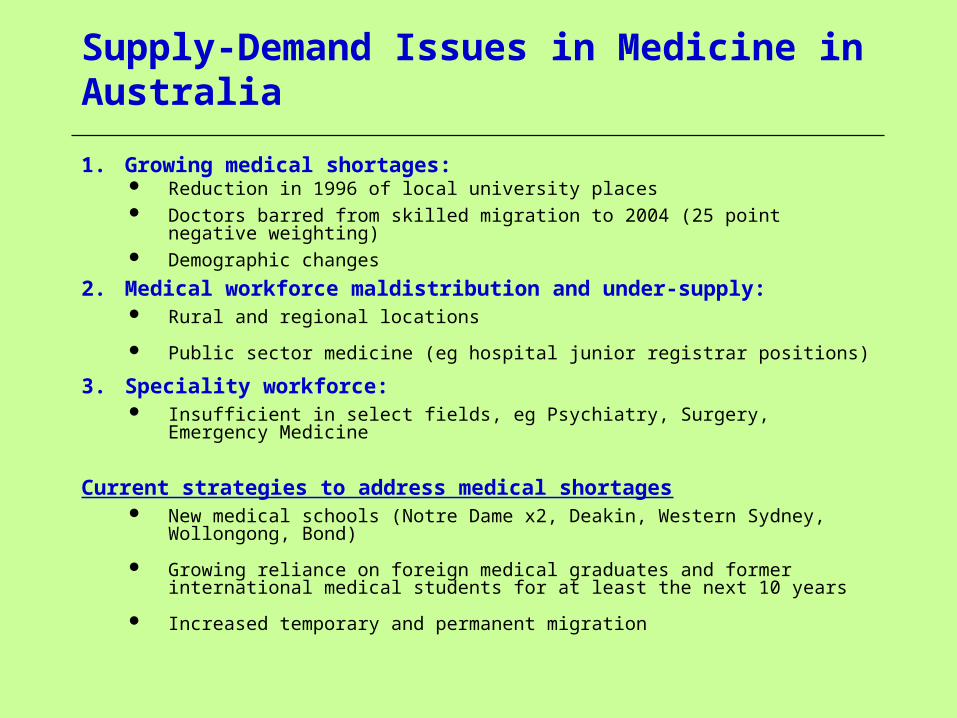
Supply-Demand Issues in Medicine in Australia
1. Growing medical shortages: Reduction in 1996 of local university places Doctors barred from skilled migration to 2004 (25 point negative weighting) Demographic changes
2. Medical workforce maldistribution and under-supply: Rural and regional locations
Public sector medicine (eg hospital junior registrar positions)
3. Speciality workforce: Insufficient in select fields, eg Psychiatry, Surgery, Emergency Medicine
Current strategies to address medical shortages New medical schools (Notre Dame x2, Deakin, Western Sydney, Wollongong, Bond)
Growing reliance on foreign medical graduates and former international medical students for at least the next 10 years
Increased temporary and permanent migration
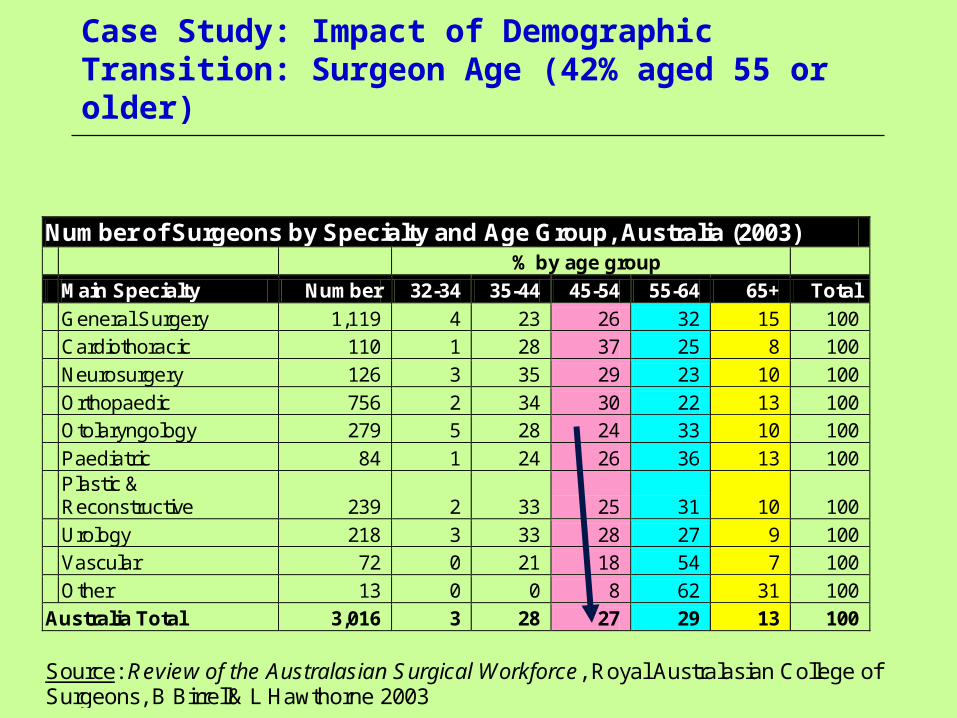
Case Study: Impact of Demographic Transition: Surgeon Age (42% aged 55 or older)
Number of Surgeons by Specialty and Age Group, Australia (2003) % by age group
Main Specialty Number 32-34 35-44 45-54 55-64 65+ Total
General Surgery 1,119 4 23 26 32 15 100
Cardiothoracic 110 1 28 37 25 8 100
Neurosurgery 126 3 35 29 23 10 100
Orthopaedic 756 2 34 30 22 13 100
Otolaryngology 279 5 28 24 33 10 100
Paediatric 84 1 24 26 36 13 100
Plastic & Reconstructive 239 2 33 25 31 10 100
Urology 218 3 33 28 27 9 100
Vascular 72 0 21 18 54 7 100
Other 13 0 0 8 62 31 100
Australia Total 3,016 3 28 27 29 13 100
Source: Review of the Australasian Surgical Workforce, Royal Australasian College of Surgeons, B Birrell& L Hawthorne 2003

Impact of Demographic Transition: Number of Surgical Operations by Patient Age (2001 versus 1991)
Rate of Surgical Procedures Per Thousand Persons by Age Group, Victoria, 1993-94 Compared to 2000-01
Age Group 1993-94 2000-01 00-04 51 54 05-09 36 35 10-14 27 26 15-19 43 41 20-24 54 48 25-29 63 57 30-34 70 70 35-39 72 79 40-44 75 80 45-49 80 86 50-54 87 99 55-59 94 113 60-64 114 133 65-69 137 166 70-74 149 208 75-79 178 254 80-84 175 263 85+ 157 222 Total 75 87
Source: ‘The Outlook for Surgical Services in Australasia’, B Birrell, L Hawthorne and V Rapson, Royal Australasian College of Surgeons, May 2003
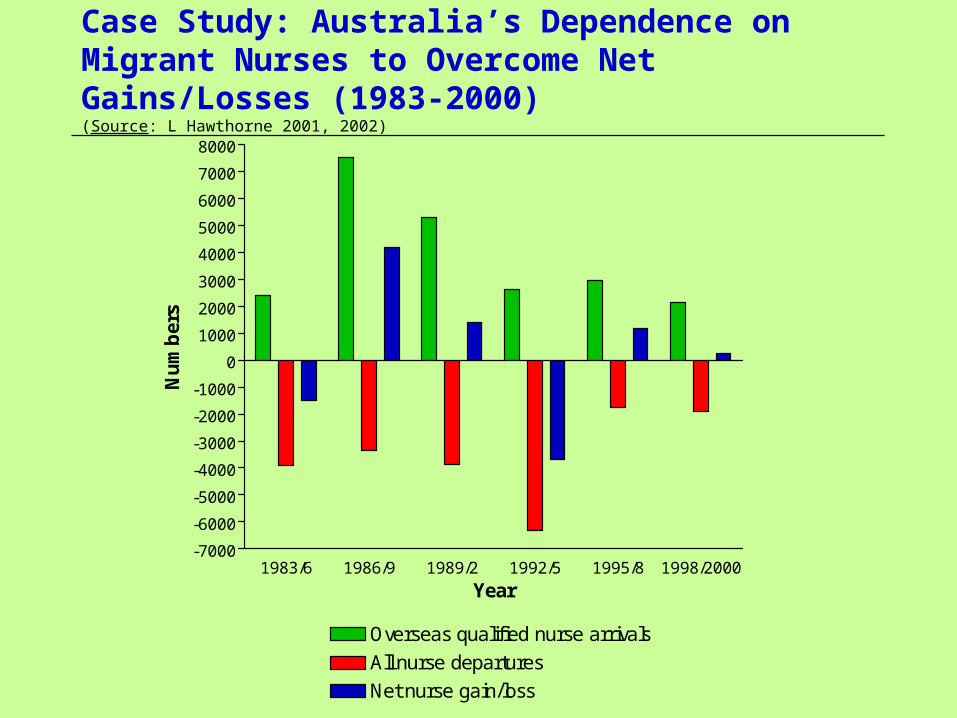
Case Study: Australia’s Dependence on Migrant Nurses to Overcome Net Gains/Losses (1983-2000)(Source: L Hawthorne 2001, 2002)
1983/6 1986/9 1989/2 1992/5 1995/8 1998/2000-7000
-6000
-5000
-4000
-3000
-2000
-1000
0
1000
2000
3000
4000
5000
6000
7000
8000
Overseas qualified nurse arrivals
All nurse departures
Net nurse gain/loss
Year
Nu
mb
ers

The Impact of Migration on Australia’s Medical Workforce: 1991-2006
By 2001 46% of Australia’s medical workforce was overseas-born (cf 40% in 1991 and 44% in 1996)
Permanent migration: By 2001 22,191 overseas-born doctors, with medical migration continuing unabated (1,263 new permanent resident arrivals in 2001-02)
‘Area of need’ arrivals: By June 2005 c5,500 temporary entrant overseas-trained doctors per year (including specialists), cf c500 mid-90s
Occupational Trainees: Eg in surgery, 457 arrivals in 18 months (January 2002-June 2003); 1200 in NSW alone by June 2005
Within select specialties: Growing dependence on overseas trained doctors (eg psychiatry, emergency medicine, surgery)
Sources:
Birrell & Hawthorne 1997, 1999, 2004; Hawthorne & Birrell 2002; Barton, Hawthorne, Singh & Little 2003.

Proportion of Overseas-Born Doctors in Australia 2001 (Compared to 36% in Canada)
Occupation Australia-Born Overseas-Born Engineering 52% 48% Computing 51% 48% Medicine 54% 46% Science 63% 37% Commerce/ business 64% 36% Architecture 64% 36% Accountancy 64% 36% Dentistry 65% 35% Arts/ humanities 69% 31% Nursing 76% 24% Teaching 80% 20% Source: L Hawthorne, Australian 2001 Census data.

Sources of Medical Migration to Australia (1996-2001) and Employment Outcomes by 2001
Employed Other Arrival Date
Birth Country Med
Other Prof/Man
Other Work
Sub- Total Unemp NLF Number
Australia/NZ 82.3 8.4 3.6 94.3 0.6 5.1 26658 1996/2001 UK/Ireland 83.3 8.7 1.8 93.8 0.7 5.5 857 USA/Canada 52.9 11.6 8.7 73.2 5.8 18.3 104 South Africa 80.7 5.8 5.0 91.5 0.8 7.7 363 South Eastern Europe 35.5 5.8 14.8 56.1 12.3 31.6 155 Eastern Europe 23.5 5.3 18.2 47.0 12.4 40.6 170 North West Europe 52.4 20.9 5.9 79.2 1.5 19.4 206 India 65.8 6.5 4.2 76.5 10.2 12.6 430 Other S/Central Asia 39.0 2.3 13.8 55.1 10.9 32.4 516 HK/Malaysia/Singapore 58.6 4.3 6.4 69.3 2.1 28.6 140 China (exc. Taiwan) 5.1 20.4 26.8 52.3 8.4 39.1 489 Taiwan 57.1 0.0 0.0 57.1 0.0 42.9 21 Philippines 33.3 7.4 13.6 54.3 7.4 38.3 81 Iraq 36.9 3.8 3.8 44.5 24.4 31.3 160 Other M East/N Africa 36.1 11.6 12.5 60.2 12.4 27.4 241 Central & South Americas 45.7 8.6 8.6 62.9 0.0 37.1 35 Other 36.1 7.4 10.4 53.9 5.9 40.2 424
TOTAL MIGRANTS (Exc. NZ) 4392
Source: L Hawthorne, from Australia Census data (2001)

Growth in Temporary Entry Medical Visas
Visa subclass 422 (‘Area of need’): (Birrell & Schwartz 2005)
1,419 in 1999-2000
2,496 in 2003-03
2,428 in 2003-04
3,074 in June 2005 (up from 1,636 in June 2003 and 1,237 as of June 2001)
Visa subclass 442 (‘Occupational Trainee’): ↑2,437 in June 2005 (cf 1,237 in June 2001), primarily to
Queensland, WA and Victoria
Recent increase in NSW: June 2004 = 1,202 (Most as HMOs)

Variations in State Reliance on Temporary Medical Migration (Visa 422 ‘Area of Need’ Category)
Number of 422 Nominations by State 2000-2001 to 2002-2003
State 2000-01
2001-02
2002-03
WA 456 472 597 Victoria 406 508 581 NSW 58 89 176 Tasmania 94 82 89 SA 60 68 133 ACT 7 12 50 NT 84 98 97 Queensland 899 716 1,016 Total 2,062 2,045 2,739 Source: DIMIA 2004, prepared for Hawthorne, Birrell & Young 2003

Major Source Countries of ‘Area of Need’ Temporary Doctors by 2001
Over 27 countries (growing diversity):By-pass ‘mandatory’ credential examination requirements
UK/Ireland (1226)India (423)Malaysia (230)Sri Lanka (191)China (94)Germany (83)USA (56)Philippines (55)South Africa (45)Canada (35)Etc!

Issue 1: Differential Training Systems
Ranking of top 500 world universities (Shanghai Jiao Tong 2006:
206 in Europe (overwhelmingly located in North West Europe), including 43 in the UK, and 40 in Germany
197 in the Americas (167 in the US, 22 in Canada, and just 7 in all Central or South America [including 1 in the top 150])
92 in the Asia-Pacific (32 in Japan, 16 in Australia, 14 in China (none ranked in the top 150, and with 2 of the top 4 ranked institutions in Hong Kong), 9 in South Korea, 7 in Israel, 5 in New Zealand, 4 in Taiwan, 2 in Singapore, and just 2 in India (neither ranked in the top 300)
5 in the Africas (4 in South Africa, 1 in Egypt, with no other African or Middle Eastern country listed) (Jiao Tong University 2006)

AMC Exam Results for Migrant Doctors by Select Country of Origin (2002)
Australian Medical Council Examination Outcomes by Select Origin (2002) Country of Candidate Candidate
Numbers % Passing
MCQ (1st or Repeat)
Candidate Numbers
% Passing Clinical
(1st or Repeat)
South Africa 17 88 23 91 Iraq 54 87 65 66 Sri Lanka 34 82 34 65 Bangladesh 81 80 63 48 Pakistan 36 75 19 53 Egypt 48 46 30 73 UK 38 74 34 88 China 69 51 35 57 India 133 47 49 63 Poland 4 50 3 33 Former Yugoslavia 17 47 17 47 Philippines 33 33 23 39 Other 307 45 164 61 Total candidates 871 56 559 62 Source: Derived from Australian Medical Council Incorporated. Annual Report, 2002, Australian Medical Council Incorporated, Canberra, 2003
Methodology of Hawthorne, Hawthorne & Crotty Study (2007)
Migration Flows: Analysis of all DIMA arrivals and departures data, and Census data related to OTDs
AMC Exams: Analysis of all AMC examination outcomes by key variables 1978-October 2005, plus analysis of RACGP outcomes
New Data: Mailout survey of 3,000 fairly recently arrived OTDs active in AMC (ie at least one MCQ attempt)
State Variations: Analysis of all categories of OTDs in State Medical Registration Board databases (NSW, Victoria and WA) to capture ‘invisible’ OTDs, plus 30 interviews

Number of 1st Time MCQ and Clinical Candidates by Year (1978-late 2005)
0
100
200
300
400
500
600
700
CEMCQ
Year
N. o
f ca
nd
idat
es e
ach
yea
r

Number of Candidates Passing the MCQ at Each Attempt
1 2 3 4 5 6 7 8 9 10 11 12 13 14 15 16 17 18 190
1000
2000
3000
4000
5000
7300
N. Attempts
Nu
mb
er p
assi
ng
AMC MCQ Outcomes 1978-2005
Candidates: 139 source countries
Top 10 sources: India (14%), Sri Lanka (8%), Egypt (7%), Bangladesh (5%), China (5%), UK (5%),
Iraq (4%), South Africa (4%), Philippines (4%), Pakistan (3%)
Highest % of first time presenters: S Asia, N Africa/M East, SE Asia and E Europe
Pass rates: 51% on 1st attempt, 47% on 2nd attempt, 81% overall
Highest pass rates: UK/Ireland (95%), South Africa (86%), North America (86%)
Lowest pass rates: Other Americas (67%), SE Asia non-Commonwealth (70%), East Europe (70%)
Age, English, gender and recency of training highly significant: Harder to pass for older candidates

AMC Clinical Outcomes 1978-2005
Overall pass rate: 86% of attempters (but just 53% of all MCQ attempters go on to pass)
Highest pass rates: South Africa (66%), UK/Ireland (64%)
Lowest pass rates: Other Americas (41%), SE Asia non-Commonwealth (38%), South East
Europe (49%), Central Asia (49%)
Middle East/ North Africa: Just as likely to pass as OTDs from English speaking backgrounds
(OTDs from Eastern Europe and non-Commonwealth countries the most disadvantaged)
Age: Highly significant (candidates requiring 3+ attempts older!)
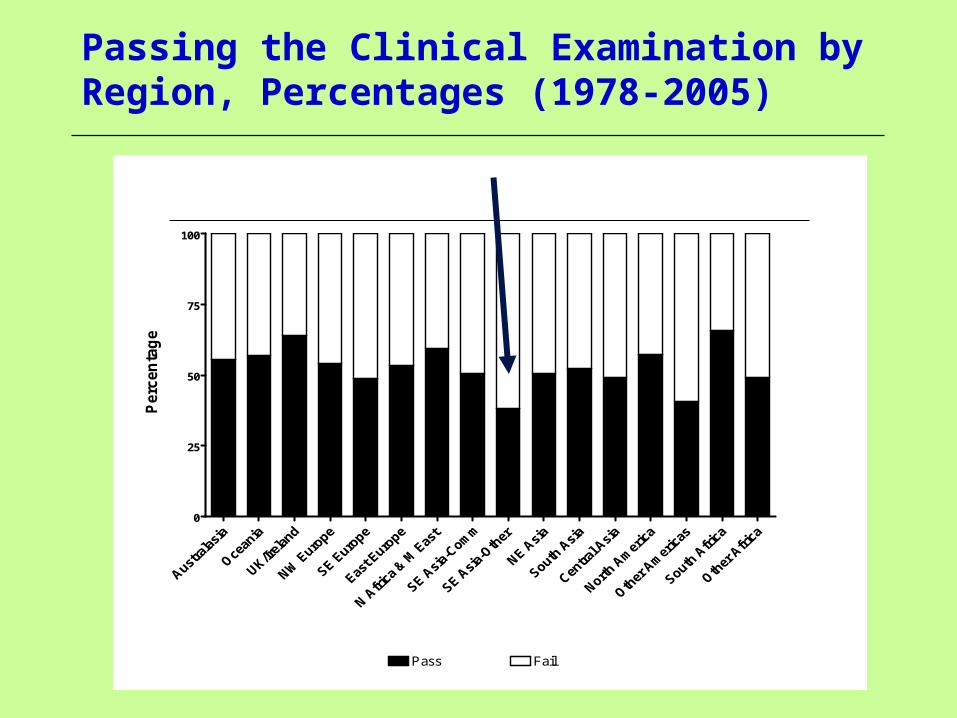
Passing the Clinical Examination by Region, Percentages (1978-2005)
0
25
50
75
100
Pass Fail
Perc
en
tag
e

OTDs, Age and AMC Pass Rates - MCQ
Table 3.6: CE pass rate by region and MCQ age tertile, percentages
Region Age at 1st MCQ, tertiled
<32 32 to 36 37+
Australasia 57% 60% 50%
Oceania 63% 59% 51%
UK/Ireland 66% 69% 50%
North West Europe 66% 56% 34%
South East Europe 59% 56% 40%
East Europe 60% 60% 44%
North Africa/ & Middle East 71% 63% 46%
South East Asia-Commonwealth 61% 52% 39%
South East Asia-Other 40% 50% 31%
North East Asia 63% 57% 41%
South Asia 60% 59% 44%
Central Asia 54% 46% 50%
North America 73% 55% 51%
Other Americas 45% 47% 34%
South Africa 74% 65% 47%
Other Africa 65% 67% 18%

Accreditation Pathways and IMGs in the Context of Maldistribution and Undersupply
Does full registration matter in Australia?
Just 26-33% of OTDs encounter the AMC
Growing use of RACGP and specialist pathways
Minimal impact on employment outcomes (high demand)
Future access to supervised training places?
Issues:
Variability of data!Number and origin of OTDs conditionally registered by
statesCharacteristics (country of training, AMC status, actual
credentials etc) Practice status

Which IMGs by Region of Origin are Working With Conditional Registration? (IMG Survey)
N Type of medical registration
General Conditional/ Specific
Not registered
English-speaking background 171 51% 36% 14% Europe 153 33% 41% 25% North Africa/Middle East 154 38% 39% 23% Asia-Commonwealth 386 28% 39% 33% All other 255 24% 35% 41%
Total 1119 33% 38% 29%
Statistics: 2 = 60.14, df = 8, p < 0.01
Major Findings: IMG Survey
Focused on OTDs deemed ‘active’ in the AMC pathway: 99% had attempted the MCQ exam (68% once, 21% twice, 11% 3+
times)
83% had passed it (doctors from ME/North Africa higher pass rates than ESB doctors (UK/Ire, South Africa, US, Canada, NZ)
61% had attempted the CE (no difference by country of origin in the number of attempts made)
41% of those attempting the CE had passed it
Gender matters: Males 63% less likely to have passed the CE than females)
Region of origin matters: Compared with ESB doctors, OTDs from Europe twice as likely to fail, those from Asia-Commonwealth 2.8 times as likely, those from ME/N Africa 2.9 times as likely, and those from ‘other’ backgrounds 4 times as likely
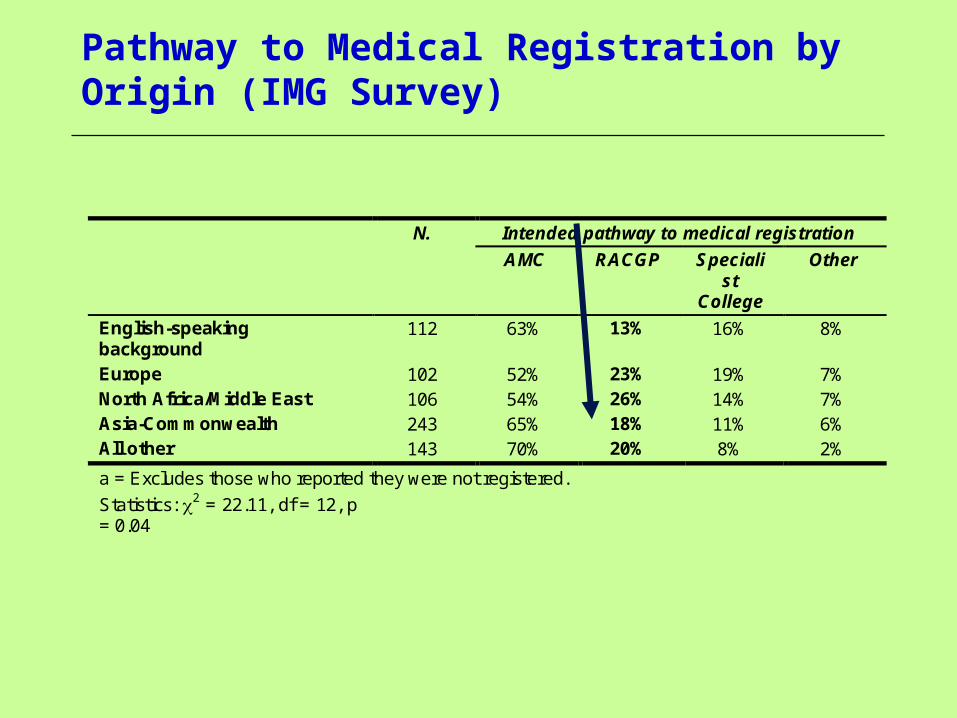
Pathway to Medical Registration by Origin (IMG Survey)
N. Intended pathway to medical registration
AMC RACGP Specialist
College
Other
English-speaking background
112 63% 13% 16% 8%
Europe 102 52% 23% 19% 7% North Africa/Middle East 106 54% 26% 14% 7% Asia-Commonwealth 243 65% 18% 11% 6% All other 143 70% 20% 8% 2%
a = Excludes those who reported they were not registered.
Statistics: 2 = 22.11, df = 12, p = 0.04
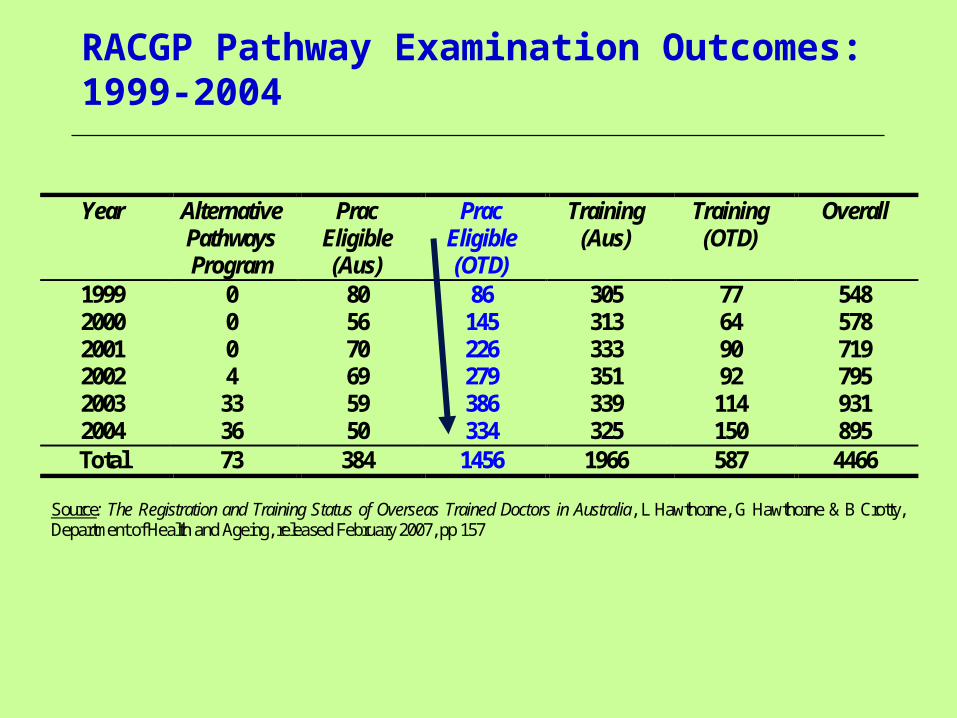
RACGP Pathway Examination Outcomes: 1999-2004
Year Alternative Pathways Program
Prac Eligible (Aus)
Prac Eligible (OTD)
Training (Aus)
Training (OTD)
Overall
1999 0 80 86 305 77 548 2000 0 56 145 313 64 578 2001 0 70 226 333 90 719 2002 4 69 279 351 92 795 2003 33 59 386 339 114 931 2004 36 50 334 325 150 895 Total 73 384 1456 1966 587 4466
Source: The Registration and Training Status of Overseas Trained Doctors in Australia, L Hawthorne, G Hawthorne & B Crotty, Department of Health and Ageing, released February 2007, pp 157

RACGP Examination Outcomes: 1999-2004
Year Other Prac Eligible (Aus)
Prac Eligible (OTD)
Training (Aus)
Training (OTD)
Overall
1999 79% 61% 96% 72% 85% 2000 86% 64% 98% 83% 87% 2001 74% 39% 95% 71% 72% 2002 25% 87% 55% 96% 87% 79% 2003 73% 78% 47% 96% 80% 72% 2004 58% 78% 40% 90% 63% 65% Source: The Registration and Training Status of Overseas Trained Doctors in Australia, L Hawthorne, G Hawthorne & B Crotty, Department of Health and Ageing, released February 2007, pp 157

Medical Employment Outcomes by Region
% of OTDs working in medicine in Australia: 78% (despite only 41% holding general registration)
ESB doctors (95%) compared to North Africa/ M East (82%), Asia-Commonwealth (74%), and Other doctors (68%)
When compared with ESB doctors, respondents from: Europe and ME/ N Africa = 3 times less likely to have obtained
work in medicine
Asia-Commonwealth = 4.7 times less likely
Other backgrounds = 7.6 times less likely
Current key barrier to medical practice: English language testing
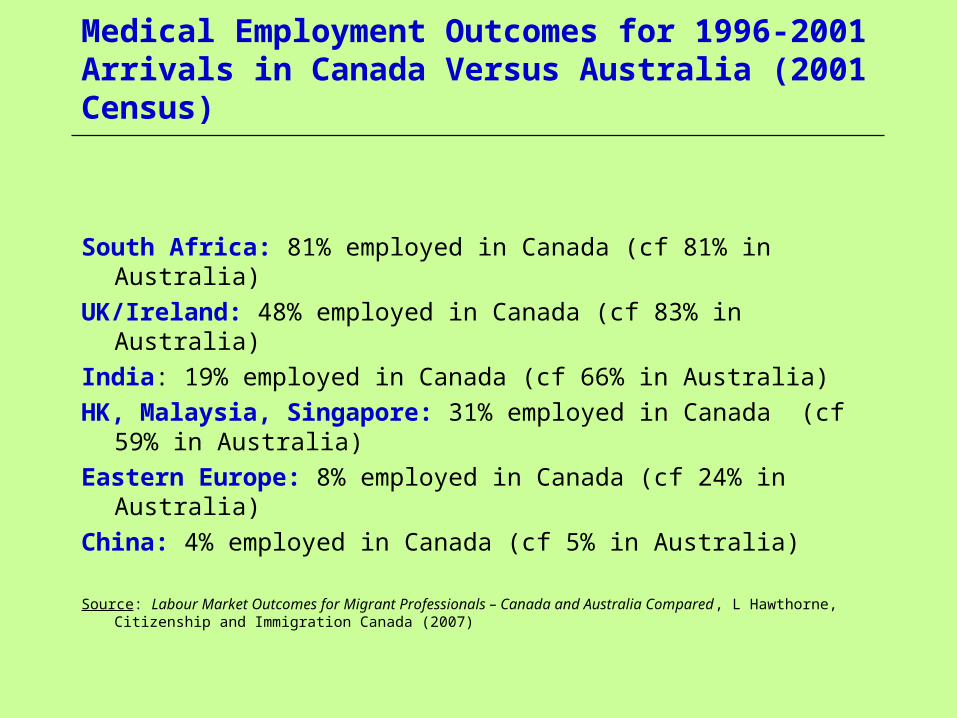
Medical Employment Outcomes for 1996-2001 Arrivals in Canada Versus Australia (2001 Census)
South Africa: 81% employed in Canada (cf 81% in Australia)
UK/Ireland: 48% employed in Canada (cf 83% in Australia)
India: 19% employed in Canada (cf 66% in Australia)
HK, Malaysia, Singapore: 31% employed in Canada (cf 59% in Australia)
Eastern Europe: 8% employed in Canada (cf 24% in Australia)
China: 4% employed in Canada (cf 5% in Australia)
Source: Labour Market Outcomes for Migrant Professionals – Canada and Australia Compared , L Hawthorne, Citizenship and Immigration Canada (2007)

The Impact of OET Testing on Medical Candidates: Pass Rates 1989-1995 (Hawthorne & Toth 1996)
Number of Attempts
Pass (% of all
candidates)
Fail (% of all candidates)
Total Candidates n
1 57.4 16.2 1532 2 16.6 3.5 419 3 2.6 1.3 82 4 1.4 0.3 36 5 or more 0.2 0.2 10 Total 78.3 21.6 2079

The Impact of OET Testing on Medical Candidates: Location (1989-1996 Data: Hawthorne & Toth 1996)
Pass %
Fail %
No. of Attempts
Total No.
Overseas candidates
67
33
1.16
439
Australian candidates 81 19 1.41 1640 All candidates 78 22 1.35 2079

The Impact of Occupational English Testing on Medical and Nursing Registration by Select Origin & Location: 1989-1995 Data (Hawthorne & Toth 1996)
Candidates in Australia (%)
Pass Rate (All %)
Total No.
Doctors India 79 91 200 China 99 59 191 Former USSR 96 77 133 Egypt 82 84 126 Philippines 66 78 93
Nurses
Philippines 32 41 413 Hong Kong 38 50 96 India 57 55 51 Former Yugos. 96 35 51 Fiji 40 70 37
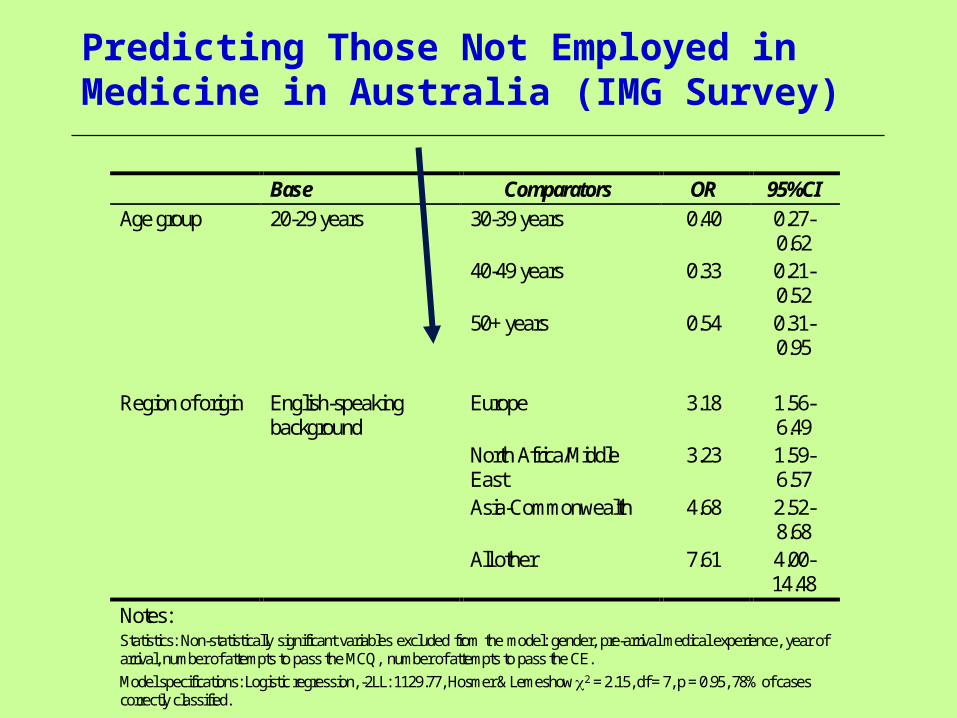
Predicting Those Not Employed in Medicine in Australia (IMG Survey)
Base Comparators OR 95%CI Age group 20-29 years 30-39 years 0.40 0.27-
0.62 40-49 years 0.33 0.21-
0.52 50+ years 0.54 0.31-
0.95 Region of origin English-speaking
background Europe 3.18 1.56-
6.49 North Africa/Middle
East 3.23 1.59-
6.57 Asia-Commonwealth 4.68 2.52-
8.68 All other 7.61 4.00-
14.48 Notes: Statistics: Non-statistically significant variables excluded from the model: gender, pre-arrival medical experience, year of arrival, number of attempts to pass the MCQ, number of attempts to pass the CE. Model specifications: Logistic regression, -2LL: 1129.77, Hosmer & Lemeshow 2 = 2.15, df = 7, p = 0.95, 78% of cases correctly classified.

Type of Medical Employment in Australia by Origin (OTD Survey)
Hospital resident
Hospital registrar
Hospital Other
Community (a)
Specialist Other GP
ESB Background 174 18% 45% 9% 4% 2% 14% 88% Europe 155 34% 21% 5% 8% 1% 19% 72% North Africa/Middle East 156 40% 19% 3% 4% 1% 21% 70% Asia-Commonwealth 395 32% 20% 4% 4% 3% 14% 75% All other 259 33% 10% 4% 3% 2% 14% 70%
Statistics: 2 : 20.13 75.34 8.72 5.37 - 7.24 21.36 df: 4 4 4 4 - 4 4 p: <0.01 <0.01 0.07 0.25 0.66 (b) 0.12 <0.01 a = Resident or registrar b = Fisher Exact Test
The Link Between Accreditation Status and Employment
State-specific differences: Western Australia
New South Wales
Victoria

State Variations in Relation to OTDs: NSW, Victoria, WA
Data consistency: Minimal, just 10/27 variables in common (eg country of origin, AMC
status)
Screening and selection variability: ‘Recruit-a-doc’ versus RWAV (etc)
State competition for OTDs (sticks and carrots), $ incentives
Recruitment and bridging support: WA (‘adventure medicine’, invisibility, retention)
NSW (65% of OTDs conditionally registered; focus x 12 OTDs per year)
Victoria (RWAV focus)
Future displacement of OTDs from supervised clinical training: Rank order (domestic graduates, international students, OTDs)
Case study: WA

Financial Incentives to IMGs by State (2006)
State Relocation
Orientation Other Support
Total Package
Victoria $0 $550 course $1,000 in practice
$2,000 contract of immigration support
Up to $3,500
New South Wales $10,000 for permanent residents going to higher area of need
$2,000 to practice $3,000 for site visits $1,500 Medical Board costs
Up to $16,500 fopr PR IMGs moving to higher areas of need
Northern Territory $20,000 $5,000 $3,000 for site visits Up to $28,000 Queensland $0 $3,000 $0 (though heavy
salary incentives to attract IMGs into the state)
$3,000+ salary packaging incentives
South Australia $10,000 $4,000-$7,000 $3,000 to spouse $10,000 isolation grant $2/hr for childcare
Up to $34,000 plus childcare subsidy
Tasmania $10,000 $2,000 and 1 week orientation
Up to $12,000
Western Australia $20,000 single or $30,000 couple
3 day orientation Remote area for some locations of $20,000 or $40,000 plus 2 week bonus after 6 months
Up to $70,000 plus orientation and bonuses
Source: ‘White Paper on the Viability of Rural and Regional Communities: Resolving Victoria’s Rural Medical Workforce Crisis’, Rural Workforce Agency Victoria, 10 August 2006.

Conclusion: Individual Agency and Global Health Workers
Motivations:
Rural → urban
Public → private
Poor → rich
Unsafe → secure (disease, law and order)
Employment conditions → remuneration, quality of practice, training, workload, facilities, promotion, health service quality etc
Living conditions
Family choice → children’s education, spouse career (etc)
Medical Migration and Global Migration Trends (OECD 2007)
Source: Working Together for Health – The World Health Report 2006, WHO, Geneva; International Migration Outlook, OECD 2007, Paris

Impacts of Migration on Health Workforce Shortages ( WHO 2006)
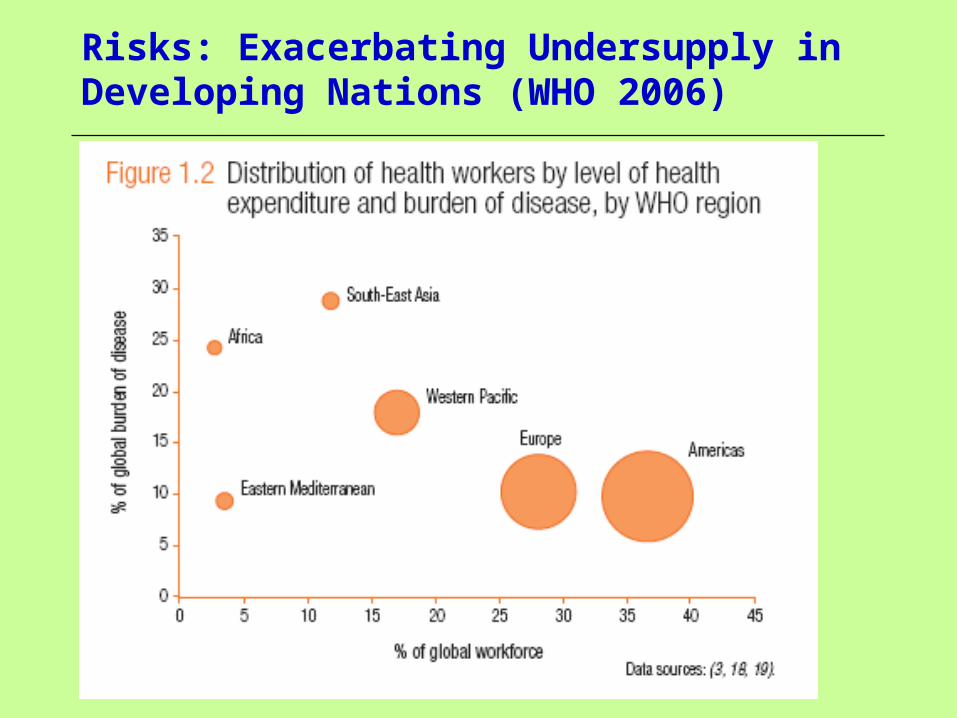
Risks: Exacerbating Undersupply in Developing Nations (WHO 2006)

Future Medical Migration: Migration Occupations in Demand List (2007)
Skill migration: Raised from 33,000 97,500 per year and ↑
Regional migration schemes
International student flows
Which priority professions listed apart from health sciences? Accountant, Engineers, IT
All other fields on the list = health sciences:General Practitioner, Anaesthetist, Dermatologist, O&G, Ophthalmologist, Emergency, Paediatrician, Pathologist, Psychiatrist, Specialist Physician, Radiologist, Surgeon, Registered Nurse, Midwife, Mental Health Nurse, Dentist, Dental Specialist, Hospital Pharmacist, Retail Pharmacist, Occupational Therapist, Physiotherapist, Speech Therapist, Podiatrist, Radiographer, radiation Therapist, Nuclear Medicine Technologist, Sonographer

The Demographic Transformation: Western and Select Asian Nations
Traditional population structure Emerging population structure