the impact of harvesting age/tree size on sawing, drying
TRANSCRIPT

Man
ufac
turi
ng &
Pro
duct
sP
roje
ct N
o. P
N03
.131
6
The Impact of Harvesting Age/TreeSize on Sawing, Drying and SolidWood Properties of Key RegrowthEucalypt Species

© 2005 Forest & Wood Products Research & Development Corporation All rights reserved. Publication: The Impact of Harvesting Age/Tree Size on Sawing, Drying and
Solid Wood Properties of Key Regrowth Eucalypt Species The Forest and Wood Products Research and Development Corporation (“FWPRDC”) makes no warranties or assurances with respect to this publication including merchantability, fitness for purpose or otherwise. FWPRDC and all persons associated with it exclude all liability (including liability for negligence) in relation to any opinion, advice or information contained in this publication or for any consequences arising from the use of such opinion, advice or information. This work is copyright and protected under the Copyright Act 1968 (Cth). All material except the FWPRDC logo may be reproduced in whole or in part, provided that it is not sold or used for commercial benefit and its source (Forest and Wood Products Research and Development Corporation) is acknowledged. Reproduction or copying for other purposes, which is strictly reserved only for the owner or licensee of copyright under the Copyright Act, is prohibited without the prior written consent of the Forest and Wood Products Research and Development Corporation. Project no: PN3.1316 Researchers: T. Innes Timber Research Unit University of Tasmania Locked Bag 1324, Launceston TAS 7250 M Armstrong Horticulture and Forestry Sciences Department of Primary Industries and Fisheries PO Box 631, Indooroopilly QLD 4068 G Siemon Forest Products Commission Locked Bag 888, Perth Business Centre, WA 6849 Final report received by the FWPRDC in December 2005 Forest and Wood Products Research and Development Corporation PO Box 69, World Trade Centre, Victoria 8005 Phone: 03 9614 7544 Fax: 03 9614 6822 Email: [email protected] Web: www.fwprdc.org.au

The Impact of Harvesting Age/Tree Size on Sawing, Drying and Solid Wood Properties of Key Regrowth Eucalypt
Species
Prepared for the
Forest & Wood Products Research & Development Corporation
by
T. Innes, M. Armstrong and G. Siemon

i
Summary Younger and faster grown regrowth eucalypt forests are an increasingly important source of hardwood in Australia. The wood quality of this resource is largely unknown. This work quantifies the effect of age (or tree size) on sawing, drying and solid wood quality properties of regrowth Tasmanian messmate, Western Australian jarrah, Queensland spotted gum and Victorian silvertop ash.
Three batches of jarrah, spotted gum and silvertop ash logs and four batches of messmate logs were each processed together following best commercial practice in sawing, drying and milling for each species. They were evaluated during and after processing. Processing was carried out in the source state except for silvertop ash, which was sent to Tasmania for drying and further processing following sawing in Victoria. Jarrah was batched by size class as jarrah is selectively logged, so determination of age is not possible. Spotted gum was also selected by size, but assessment of crown vigour indicated that the batches were also of distinct age.
Younger messmate logs had lower heartwood proportion than older logs. There was no trend with age of basic density, initial moisture content, drying rate, strength or hardness. Boards cut from younger material shrank less than older but yield of select grade was substantially lower due to gum vein. It appears that the oldest logs had the highest growth stress, as those logs had the most end splitting and boards cut from them the most spring. The youngest messmate (1967 regrowth) underwent significant internal checking and its properties were generally more variable. Regrowth messmate had substantially lower differences between radial and tangential unconfined shrinkage than published figures. Strength properties measured were equivalent to those published for mature timber, while hardness was lower.
Heartwood proportion in larger jarrah logs was higher than in smaller logs. Larger logs had lower initial moisture content and higher basic density. However, there was no significant difference between groups when comparing endsplit, stiffness, strength, grade, distortion or hardness. Strength properties measured were superior to those published for mature timber, while hardness was equivalent.
Recovery of select grade boards was lower from smaller logs of spotted gum. There was no trend with log diameter of basic density, end splitting, surface checking, stiffness, strength, or hardness. Strength and hardness properties measured were superior to those published for mature timber.
Younger logs of silvertop ash had lower heartwood proportion and produced timber of lower basic density and higher initial moisture content than that from older logs. There was no trend with tree age of unconfined shrinkage, drying rate, dried quality, strength or hardness. The oldest age batch produced timber of very poor quality, with large amounts of surface checking, end splitting, kino, insect attack, stain and decay. Despite being the oldest, this age batch produced logs of medium size only, indicating that the site was probably poor. Over 90% of boards from all batches suffered internal checking despite mild drying conditions.
This work demonstrates that for regrowth messmate, there was a decrease in select grade recovery from younger logs along with higher variability in some properties and significant internal checking. Smaller spotted gum logs produced a lower yield of select grade boards. There were no substantial differences between timber cut from the three log sizes of jarrah. The youngest trees of silvertop ash had significantly higher heartwood proportion and produced timber with higher initial moisture content and lower basic density than that from trees ten years older. Dried quality of silvertop ash was very poor, particularly that cut from the oldest age class.

ii
Sawing volume recovery and wide board recovery will generally be lower from smaller logs given a similar sawing pattern (due to simple geometry), recovery of higher grades may be lower in some species due to natural defect such as gum vein and batching technologies may be required to reduce variability. It was not possible to specify an optimum age or range of ages for harvest of the species studied.

iii
Contents
INTRODUCTION ................................................................................................................................................. 1
1. TASMANIAN REGROWTH MESSMATE (EUCALYPTUS OBLIQUA).............................................. 2 1.1. METHODOLOGY .................................................................................................................................... 2 1.2. RESULTS ............................................................................................................................................... 5 1.3. ANALYSIS ........................................................................................................................................... 25
2. WESTERN AUSTRALIAN REGROWTH JARRAH (EUCALYPTUS MARGINATA) ..................... 27 2.1. METHODS............................................................................................................................................ 27 2.2. RESULTS AND DISCUSSION.................................................................................................................. 30 2.3. BOARD EVALUATION........................................................................................................................... 32 2.4. STRENGTH AND HARDNESS TESTING ................................................................................................... 33 2.5. ANALYSIS ........................................................................................................................................... 41
3. QUEENSLAND REGROWTH SPOTTED GUM (CORYMBIA CITRIODORA) ................................ 45 3.1. METHODOLOGY .................................................................................................................................. 45 3.2. RESULTS ............................................................................................................................................. 49
4. VICTORIAN REGROWTH SILVERTOP ASH (EUCALYPTUS SIEBERI)...................................... 69 4.1. METHODOLOGY .................................................................................................................................. 69 4.2. RESULTS ............................................................................................................................................. 73 4.3. ANALYSIS ........................................................................................................................................... 90
5. RECOMMENDATIONS AND FURTHER WORK............................................................................... 92
6. REFERENCES........................................................................................................................................... 93
7. APPENDIX 1. REPORT ON ‘RING COUNTS’ FROM SELECTED SPECIMENS OF TASMANIAN EUCALYPTUS OBLIQUA ......................................................................................................... 94
8. APPENDIX 2. REPORT ON ‘RING COUNTS’ FROM SELECTED SPECIMENS OF EUCALYPTUS SIEBERI FROM VICTORIA.................................................................................................. 98

1
Introduction Under the Regional Forest Agreements, younger and faster grown regrowth eucalypt forests will be an increasingly important source of commercial hardwood in Australia. The wood quality of this resource is largely unknown but is expected to be different from that of currently harvested mature native forests. Knowledge of the wood quality of this resource is of interest for its efficient utilisation and will affect the economic viability of the timber industry.
Processing and utilisation of this comparatively new resource may present problems typically associated with reduced log diameter, higher levels of growth stresses and a larger proportion of juvenile wood. Growth stresses result in end splitting of logs following tree harvesting and distortion of boards following sawing of logs. As end splits in logs and distortion of boards requires trimming they reduce sawn timber recovery and also the average dimensions of sawn boards. Sawn timber yield losses resulting from growth stresses are reported to exceed 10% in some Australian and South African sawmills.
Seasoned regrowth timber is used for a range of applications including flooring, decking, structural, panelling, mouldings and furniture. Wood quality requirements for these applications include: (1) strength properties such as stiffness and hardness; (2) dimensional stability such as low distortion, shrinkage, collapse; (3) biological performance such as durability and consistent colour; and (4) manufacturing performance such as good machining. These wood quality requirements are important traits for evaluating the sawing properties and wood quality of a resource for solid timber utilisation.
Strength, dimensional stability and biological performance are wood quality requirements thought to increase with tree age and it has also been suggested that extending harvesting age may reduce the effects of growth stresses. An understanding of the influence of age on these wood quality properties is therefore critical in maximising recovery and determining the suitability of the timber for particular applications and hence the harvesting age. This work quantifies the impact of age (or tree size) on sawing, drying and solid wood quality properties of regrowth Tasmanian messmate (Eucalyptus obliqua), Queensland spotted gum (Corymbia citriodora), Western Australian jarrah (Eucalyptus marginata) and Victorian silvertop ash (Eucalyptus sieberi). Work in Tasmania (on messmate and silvertop ash) was performed by the Timber Research Unit, University of Tasmania; that in WA by the Forest Products Commission and that in Queensland by the Department of Primary Industries and Fisheries.

2
1. Tasmanian regrowth messmate (Eucalyptus obliqua) Trevor Innes
Timber Research Unit, University of Tasmania
Note that all work on the 1901 batch described below was funded separately by the Tasmanian industry (through the Forests and Forest Industry Council, FFIC) as a control group, additional to the FWPRDC funded study on the other three age classes.
1.1. Methodology
1.1.1. Sample Material Four different age classes were sampled; see Table 1.1. A minimum of 100 sample boards for each experimental group was required, with no more than ten boards cut from any log. The 1949 age group required eleven logs, with ten sampled for each of the other age classes.
The butt log only was sampled for each tree. Trees were either co-dominant or dominant and not edge trees. Coupes were selected with the assistance of Forestry Tasmania as being representative of the resource of that age, with coupes consisting of trees of uniform age resulting from wildfires. Trees were selected as being generally representative of the stand, without limits on size or sweep etc. Age of trees was taken from the fire history for each coupe.
Each log was identified by a colour (from Table 1.1) and a number.
1.1.2. Pre-felling Prior to felling, breast height diameter over bark was measured for each tree
1.1.3. Post-felling For each tree:
• date of felling was recorded;
• total height, height to 30cm under bark small end diameter and height to 20cm under bark small end diameter were measured;
• a 3.1 m butt log (clear of butt swell) was cut for 1967 logs; other logs were delivered full length and cut to length at the sawmill;
• both ends of logs were painted with appropriate colour from Table 1.1;
• each log was marked with an identification label of tree number;
• large and small end diameters of log were measured; and
• length of longest endsplit up log on both small and large ends was measured.
Logs were then transported to the appropriate mill and stored separately from general mill stock under waterspray, until sawing. 1967 logs were cut in a thinning operation and delivered to Clennetts sawmill, Dover, in short lengths via tip truck, see Plates 1.1 and 1.2. 1901 and 1934 logs were delivered as part of commercial loads to McKay Timber, Glenorchy (Plate 1.3), generally in long lengths. 1949 logs were delivered to Kelly Timbers, Dunalley, in mixed lengths.
3
1.1.4. Log processing • endsplit of both ends of each log was re-measured prior to sawing;
• 50 mm thick discs were cut from the butt end of each log, labelled and transported to the laboratory (these discs were all taken from approximately similar heights in the tree;
• over-length logs were docked to 3.0 m by removing the top end;
• logs were re-end coated and colour coded with a different colour on the freshly cut end so that individual logs could be tracked through the sawmill; and
• logs were quartersawn at the three locations described above (see Plates 1.4 - 1.6) during normal commercial operation, with all boards cut clear of sapwood. Boards were cut to 25 mm thickness, width from 125 mm down to 75 mm (all dimensions are nominal dry). Where possible, boards were selected from throughout each log, rather than from one or two flitches. Experimental groups were kept separate.
Sawn recovery was not recorded since the logs were sawn at three different mills. Useful comparisons of recovery could only have been made if each mill was set up to produce optimal recovery from the logs processed there.
Boards were block stacked, tightly wrapped on all sides with plastic (Plate 1.7) and transported to the Neville Smith Tasmania (NST) site at Mowbray (Launceston).
1.1.5. Drying • for each board the following measurements were made: Length, Width, Thickness,
Endsplit (numbered end), Endsplit (other end), Spring (if greater than 10mm), Length degraded by surface check. Endsplit was measured as the length of board affected by the longest end split at each end of the board. This is the length of board that would have to be docked to remove all endsplitting;
• racks were hand built on site at NST by TRU staff, see Plate 1.8;
• racks were end-coated;
• six 300 mm long sample boards were used per rack of approximately 100 boards. MC, width and thickness were monitored throughout the trial;
• an additional 100 mm long sample was cut adjacent to each MC sample board for determination of unconfined shrinkage, initial MC and basic density; and
• another 14 boards were randomly selected from each pack for determination of unconfined shrinkage (four boards only), initial MC and basic density.
Boards were dried in a 10 m3 kiln belonging to the FFIC, located at on the NST site at Mowbray – see Plate 1.9. The kiln was constructed specifically for experimental predrying of Tasmanian eucalypts and so generally controls very well at low temperatures (typically within 0.5°C).The predrying schedule used is shown in Table 1.6.
When sample boards indicated that MC had fallen to approximately 20%, timber was reconditioned and final dried to the schedules shown in Table 1.6.
1.1.6. Dry measurements • sample boards were measured, oven dried and weighed;
4
• following removal of samples for strength and hardness testing, boards were machined to 19 mm thickness, Plate 1.10, by removing 2 mm from the bottom surface and the rest from the top;
• boards were measured for: Endsplit (numbered end), Endsplit (other end), Spring (if greater than 10mm), Length degraded by surface check on each face, Length degraded by skip on each face, Grade to Australian Standard AS 2796 (Standards Australia 1999) and Moisture content (by resistance meter); and
• a 100 mm long section was then cut from the end of the board or clear of endsplit (whenever present) and the freshly cut end evaluated for internal check and sawing orientation.
End split was measured using the same methodology as when green; the length of the longest end split at each end of the board.
Australian Standard AS 2796 (Standards Australia 1999) describes four grades based on features and desired aesthetic appearance. The three grades commonly used are select, Medium Feature – Standard and High Feature Grade. Grading was performed by a qualified commercial grader, who assigned the full length of each wide face a single grade, ignoring length affected by end splits and ignoring machining skip. Note that AS 2796 is generally applied on all four faces. For this study, the edges were not graded as they were not machined since boards were of varying width. The two wide faces were graded separately as many products expose only one face, for example flooring or architraves.
Amount of spring (edgewise distortion) allowable in various products is also specified by AS 2796 (Standards Australia 1999) as a function of board width and length. A minimum of 10 mm over a board length of 2.4 m was recorded, as this is acceptable for the widths of boards studied for all products except joinery and dressed boards. Boards were only dressed on wide faces, so spring on the same boards dressed to width would have been lower than the figures recorded.
Boards were scored with either no internal check, or internal check present, without attempting to categorise severity. Backsawn orientation was defined as all growth rings making an angle of less than 45° with the wide surfaces; quartersawn was defined as this angle being less than 45°; transitional sawn was defined as having a mixture of backsawn and quartersawn parts.
1.1.7. Disc measurements • A dendrochronologist performed a count of growth rings on several discs to verify that
the age classes were indeed distinct and that tree age was consistent with recorded fire history; and
• pith, heartwood and sapwood width were measured on each disc across two diameters at right angles.
1.1.8. Green measurements • initial MC and basic density were measured on twenty randomly selected board
samples per group (see “Drying” section above); and
• unconfined shrinkage in the radial and tangential directions were measured for ten of the twenty samples from each group.

5
Unconfined shrinkage is the shrinkage undergone by a thin slice of wood (approximately 0.8 mm thick) allowed to dry naturally in the laboratory, unaffected by drying gradients and stresses. Board shrinkage is lower than unconfined shrinkage due to the restraining effect resulting from moisture gradients due to drying; early in drying, the surface of boards is under tension, while later in drying the middle parts are under tension. This tension induces a “set” in the board, reducing overall shrinkage.
From each curve of shrinkage versus moisture content, three points were selected for reporting: green MC (zero shrinkage), and shrinkage and moisture content at both FSP and EMC.
1.1.9. Strength and hardness measurements • 10 dry samples per experimental group were used for hardness and strength testing.
They were cut from the same boards as the MC sample boards, plus another four taken randomly from the 14 boards initially sampled for shrinkage, initial MC and basic density. They were cut prior to machining as 20 mm thickness was required for strength testing;
• 400 mm long samples were cut 100 mm clear of endsplit, at least 200 mm from the board end. They were then machined to give a 100 mm long hardness sample and a 20 × 20 × 300 mm MOE/MOR sample;
• strength and stiffness testing was carried out as described by (Mack 1979), in the section “Static bending, centre point loading”, as specified in Australian Standard 2878:2000. Samples were loaded in the radial direction; and
• hardness was measured using the Janka hardness test as described by Mack (1979). Two points were tested for each sample.
Samples rejected because of defect were replaced with other samples cut from the same board if possible, otherwise replacement samples were cut from boards from the same log.
Strength testing was performed on a calibrated Instron tensile testing machine located at FurnTech, Launceston; see Plates 1.13 and 1.14. Modulus of elasticity (MOE) was calculated by fitting a straight line by eye to the first part of the load-deflection trace. Modulus of rupture (MOR) was also calculated. These were corrected to values at 12% MC based on the oven-dry MC (Standards Australia 1997) of each sample by adjusting bending strength by 4% for each 1% difference in MC and MOE by 1.5% for each 1% difference in MC. Adjustments were negative for MC below 12% and positive for MC above 12%. This complies with the rules of Australian Standard AS 2878 (Standards Australia 2000). A strength group was calculated for each sample and experimental group using the rules of AS 2878.
Janka hardness testing was also conducted using FurnTech’s Instron; see Plates 1.15 and 1.16. Oven dry MC was measured for each sample, as was sawing orientation, that is, whether the test face was a radial or tangential surface.
1.2. Results
1.2.1. Logs Coupe and log details for the four batches are shown in Table 1.1. The varying log lengths may have affected end splitting results, but were forced by practical constraints. No measurements could be made on 1949 logs prior to delivery to the sawmill due to practical constraints.

6
It was not possible to remove confounding effects from any site or silvicultural factors. Single-aged regrowth forests are not common. They generally arise in Tasmania as a result of fire, but fires sufficiently intense to kill all trees in a forest are unusual. Locating forests of different uniform ages on similar sites with similar silvicultural histories proved impossible.
A dendrochronologist (Dr K. Allen; see report in Appendix 1) examined nine discs in an attempt to verify tree age. Note that dating of eucalypts by ring counting is generally not highly accurate; uncertainty in this case was approximately ±15-20 years. Dating was performed in this instance to ensure that the ages of each group were distinct and consistent with the fire history.
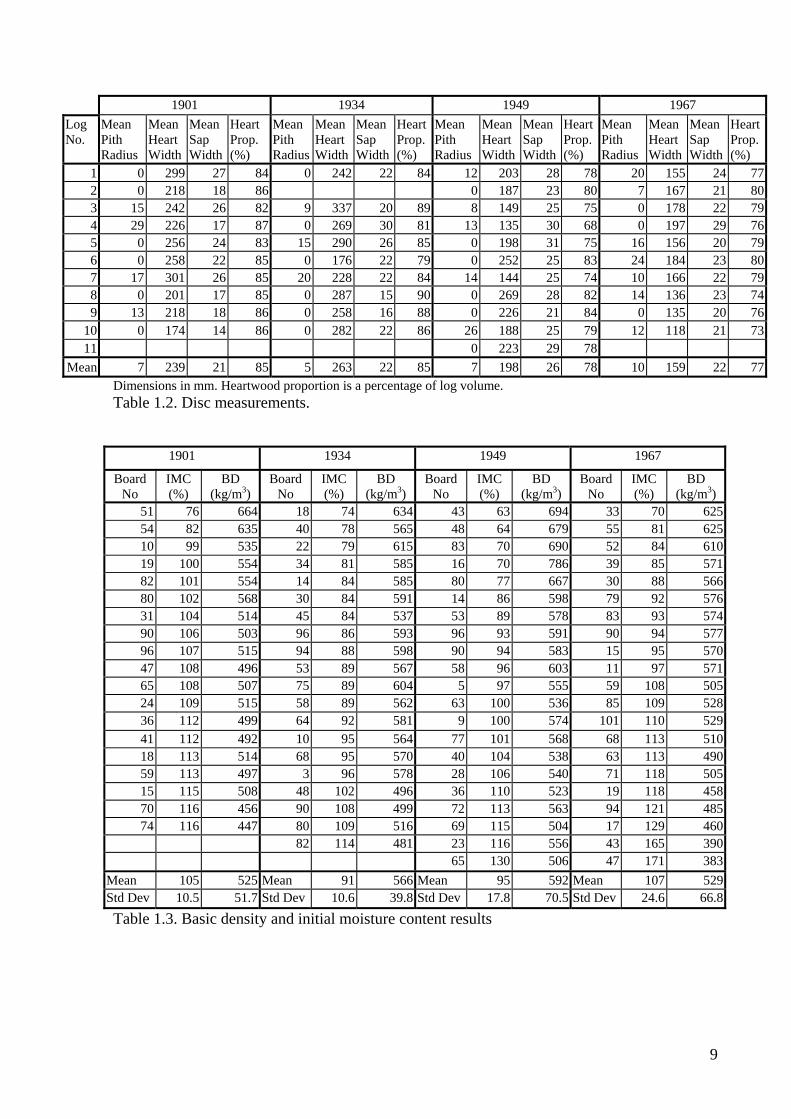
1.2.2. Disc measurements Disc measurement results, averaged over the four radii, are presented in Table 1.2. Heartwood proportion is calculated as a percentage of the disc surface area.
1.2.3. Sawing Summary sawing data is shown in Table 1.5.
1.2.4. Green timber properties Basic density and initial moisture content results are shown in Table 1.3. Fit points to the measured unconfined shrinkage curves are shown in Table 1.4.
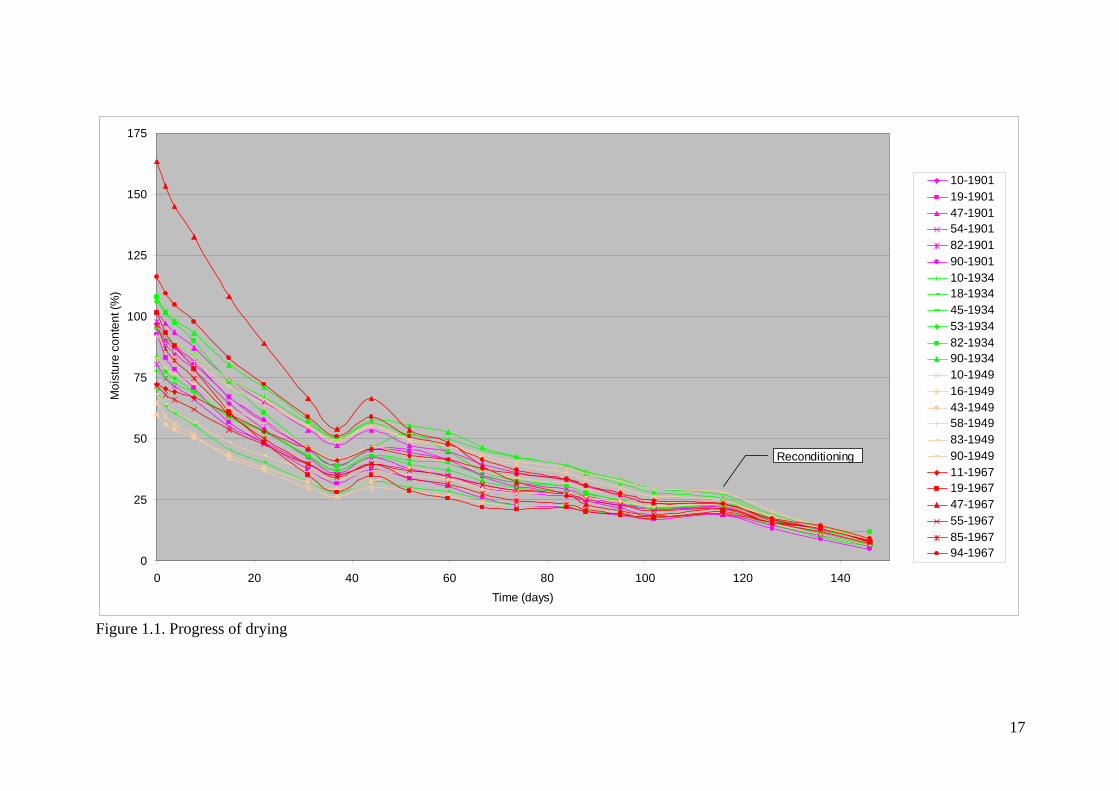
1.2.5. Drying Unfortunately some kiln control problems were experienced for this trial. The humidification sprays had become partially blocked and the tuning parameters altered to suit. Replacement of the sprays was necessary to achieve the desired humidity level; unfortunately the humidity then remained well above setpoint until the control system was retuned. This slowed the drying significantly in the early stages (see hump at around 37 days drying in Figure 1.1 and following decreased drying rate). The kiln is situated on a commercial site that does not have steam on weekends or public holidays. The kiln was shut down for these periods.
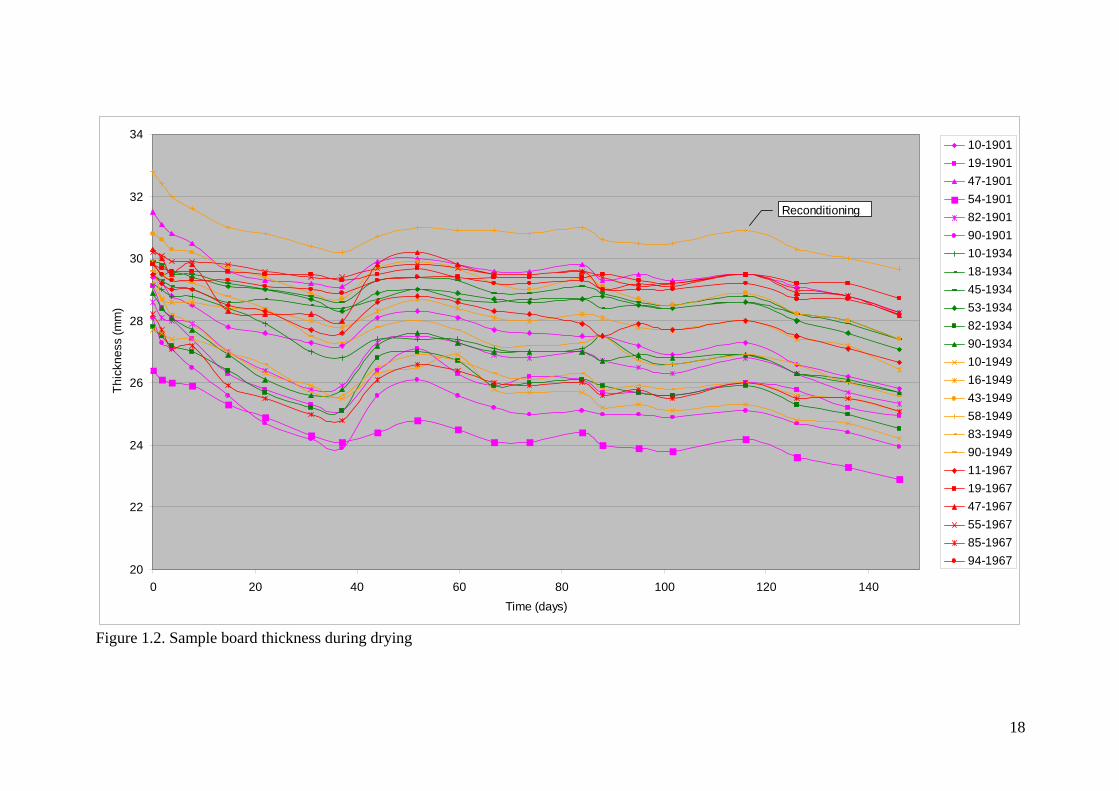
Moisture content samples in each experimental rack were regularly monitored. Drying progress of the samples is plotted in Figure 1.1. Thickness of the sample boards is plotted in Figure 1.2 to give an indication of shrinkage in thickness and recovery from reconditioning. Dry width and thickness of all boards is shown in Table 1.7.
1.2.6. Machining and dry grading Unfortunately, removal of 2 mm from the bottom surface was insufficient, and led to significantly greater machining skip on that surface.
Grading results are shown in Table 1.8. Boards were assessed in the laboratory for total length degraded by endsplit (Table 1.9), machining skip or surface check on each side, Plate 1.12 and Table 1.10. Spring (if greater than 10mm) was measured over a 2.4 m length of each board (Table 1.11). There was no significant twist or cup in any of the boards.
A 100 mm length was then removed from the end of each board and the freshly cut end evaluated for internal check (Table 1.10) and sawing orientation (Table 1.5).

7
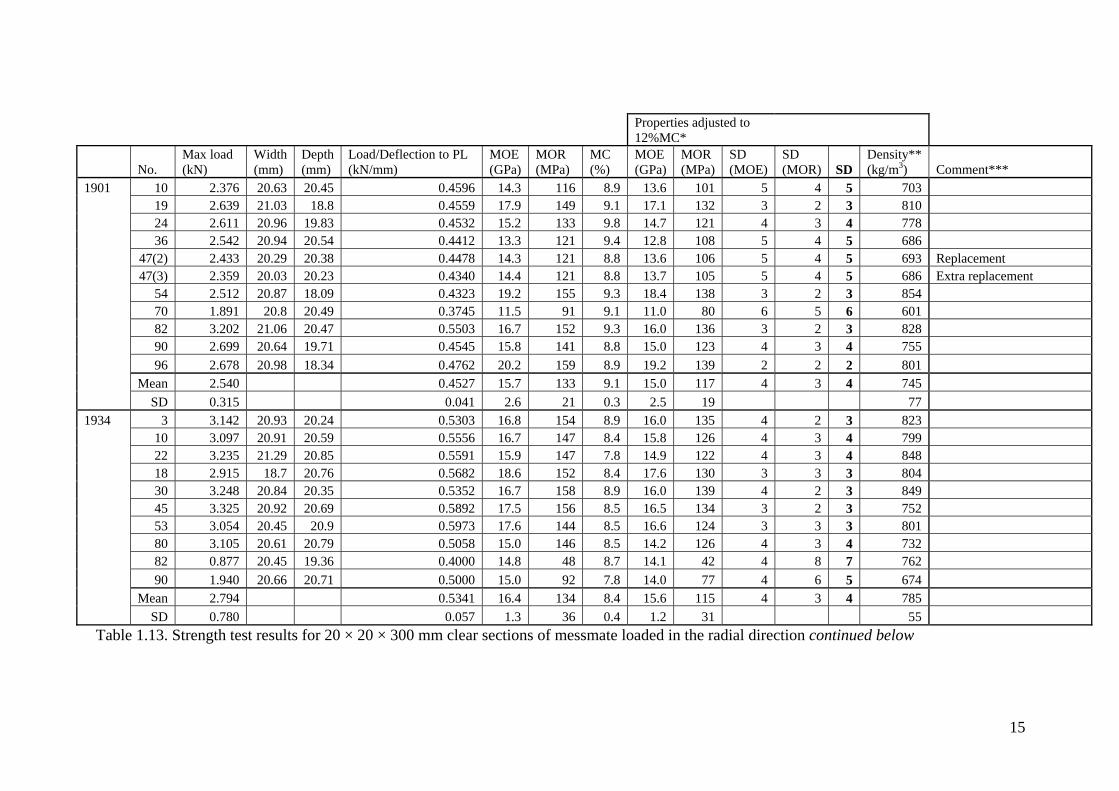
1.2.7. Strength testing Strength test results are shown in Table 1.13.
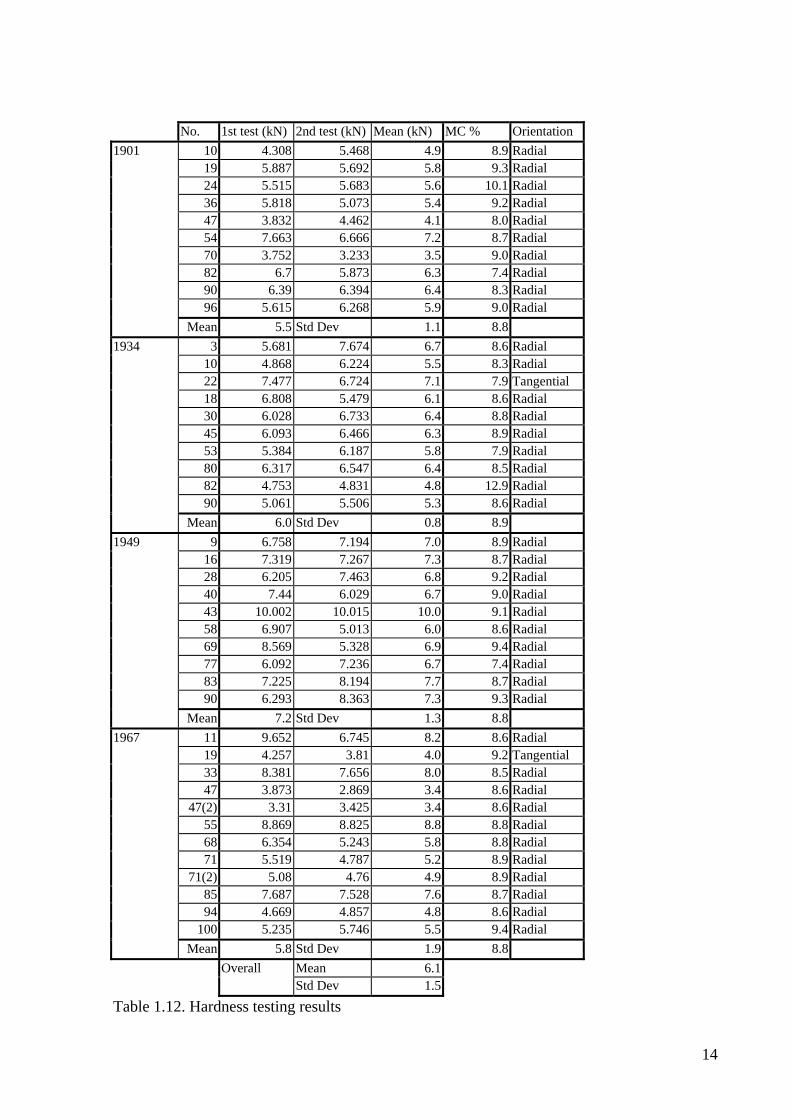
1.2.8. Hardness testing Janka hardness test results are shown in Table 1.12.

8
3m Log Prior to sawing
Log details Log no.
Breast height dia over bark (mm)
Height to 200 SED underbark (m)
Height to 300 SED underbark (m)
Small end diameter (mm)
Large end diameter (mm)
Endsplit length small end (mm)
Endsplit length large end (mm)
Coupe: Franklin 23b 1901 1 860 33.6 640 750 * 450End-colour: Pink 2 795 38.4 32.0 580 600 * 650Sawmill: McKay Timber, Glenorchy 3 670 24.4 480 550 * 700GPS: 55G 0492752 4 700 28.0 21.0 400 500 280 700UTM: 5229992 (Tree # 1) 5 750 29.3 560 600 * 610Average overall height: 48m 6 730 31.4 580 600 * 660Logs not end-coated at all. 7 925 37.0 34.0 650 800 780 1270Logs felled: 13/5/03 8 670 33.1 26.5 460 500 * 1470Logs sawn: 3/6/03 9 795 160 600 600 490Packs delivered: 5/6/03 10 510 25.0 16.0 380 400 300 350
Mean 740 32.3 27.6 489 590 490 735Coupe: Arve 27c 1934 1 670 26.0 23.0 525 650 * 450End-colour: Green 2 795 635 750 * 170Sawmill: McKay Timber, Glenorchy 3 955 27.0 25.0 730 900 * 880GPS: 55G 0484761 4 810 32.5 29.0 635 700 * 1140UTM: 5225916 (Tree # 4) 5 860 670 800 * 480Average overall height: 47m 6 555 18.2 6.2 415 500 * 0Logs not end-coated at all. 7 765 550 650 1020 1370Logs felled: 14/5/03 8 860 635 800 * 130Logs sawn: 3/6/03 9 635 23.0 19.0 460 550 * 290Packs delivered: 5/6/03 10 685 555 600 * 1140
Mean 759 25.3 20.4 581 690 1020 605Coupe: Taranna 5d 1949 1 420 510 * 580End-colour: Orange 2 484 525 * 0Sawmill: Kelly Timbers, Dunalley 3 372 465 * 0GPS: 55G 0571834 4 353 439 * 390UTM: 5231264 (General area only) 5 458 573 * 0Average overall height 42m 6 551 653 * 850Logs not end-coated at all. 7 423 519 * 0Logs felled: Late May, Early June 2003 8 595 743 * 0Logs sawn: 12/6/03 9 493 605 * 0Packs delivered: 12/6/03 10 470 600 * 0
11 480 580 * 600 Mean 464 565 220
Coupe: Esperance 1f 1967 1 525 18.0 15.0 400 500 130 0End-colour: Red 2 540 20.0 16.0 400 450 300 140Sawmill: Clennetts, Dover 3 525 15.5 12.8 405 480 100 160GPS: 55G 0494686 4 605 23.0 19.0 455 480 120 230UTM: 5201927 (Tree # 6) 5 540 19.5 15.5 390 460 130 460Average overall height: 33m 6 635 26.0 23.0 470 500 400 500Logs end-coated at mill. 7 575 22.9 18.3 410 450 540 300Logs felled: 28/5/03 8 475 18.0 14.3 350 420 290 540Logs sawn: 4/6/03 9 445 16.0 10.3 320 390 630 140Packs delivered: 5/6/03 10 445 14.6 7.4 310 370 370 100
Mean 531 19.3 15.16 391 450 301 257Notes: *Delivered to mill as logs >3m length, small end docked down to get 3m log
Average overall height includes stump. No measurements possible on 1949 logs prior to sawmill. Logs with no height to 200 or 300 SED did not taper down as far as that diameter
Table 1.1. Summary log data for Tasmania
9
1901 1934 1949 1967 Log No.
Mean Pith Radius
Mean Heart Width
Mean Sap Width
Heart Prop. (%)
Mean Pith Radius
Mean Heart Width
Mean Sap Width
Heart Prop. (%)
Mean Pith Radius
Mean Heart Width
Mean Sap Width
Heart Prop. (%)
Mean Pith Radius
Mean Heart Width
Mean Sap Width
Heart Prop. (%)
1 0 299 27 84 0 242 22 84 12 203 28 78 20 155 24 772 0 218 18 86 0 187 23 80 7 167 21 803 15 242 26 82 9 337 20 89 8 149 25 75 0 178 22 794 29 226 17 87 0 269 30 81 13 135 30 68 0 197 29 765 0 256 24 83 15 290 26 85 0 198 31 75 16 156 20 796 0 258 22 85 0 176 22 79 0 252 25 83 24 184 23 807 17 301 26 85 20 228 22 84 14 144 25 74 10 166 22 798 0 201 17 85 0 287 15 90 0 269 28 82 14 136 23 749 13 218 18 86 0 258 16 88 0 226 21 84 0 135 20 76
10 0 174 14 86 0 282 22 86 26 188 25 79 12 118 21 7311 0 223 29 78
Mean 7 239 21 85 5 263 22 85 7 198 26 78 10 159 22 77Dimensions in mm. Heartwood proportion is a percentage of log volume. Table 1.2. Disc measurements.
1901 1934 1949 1967
Board No
IMC (%)
BD (kg/m3)
Board No
IMC (%)
BD (kg/m3)
Board No
IMC (%)
BD (kg/m3)
Board No
IMC (%)
BD (kg/m3)
51 76 664 18 74 634 43 63 694 33 70 62554 82 635 40 78 565 48 64 679 55 81 62510 99 535 22 79 615 83 70 690 52 84 61019 100 554 34 81 585 16 70 786 39 85 57182 101 554 14 84 585 80 77 667 30 88 56680 102 568 30 84 591 14 86 598 79 92 57631 104 514 45 84 537 53 89 578 83 93 57490 106 503 96 86 593 96 93 591 90 94 57796 107 515 94 88 598 90 94 583 15 95 57047 108 496 53 89 567 58 96 603 11 97 57165 108 507 75 89 604 5 97 555 59 108 50524 109 515 58 89 562 63 100 536 85 109 52836 112 499 64 92 581 9 100 574 101 110 52941 112 492 10 95 564 77 101 568 68 113 51018 113 514 68 95 570 40 104 538 63 113 49059 113 497 3 96 578 28 106 540 71 118 50515 115 508 48 102 496 36 110 523 19 118 45870 116 456 90 108 499 72 113 563 94 121 48574 116 447 80 109 516 69 115 504 17 129 460
82 114 481 23 116 556 43 165 390 65 130 506 47 171 383
Mean 105 525 Mean 91 566 Mean 95 592 Mean 107 529Std Dev 10.5 51.7 Std Dev 10.6 39.8 Std Dev 17.8 70.5 Std Dev 24.6 66.8
Table 1.3. Basic density and initial moisture content results

10
Radial shrinkage slices Tangential shrinkage slices Green FSP EMC Green FSP EMC
Batch Board no. MC % MC % Sr % MC % Sr % MC % MC % St % MC % St % 1901 10 99 39 0.4 10 4.9 99 *44 *1.9 *10 *8.5 19 100 24 0.4 10 4.4 100 37 0.4 10 6.5 24 110 30 0.5 10 3 110 38 0.4 10 5 36 112 26 0.4 10 3.2 109 Broken 47 109 32 0.6 10 3.6 109 Broken 54 82 30 0.5 10 4.8 82 32 0.8 13 5.2 70 116 28 0.5 10 3.6 116 Broken 82 101 39 0.4 10 5.4 100 37 0.8 10 5 90 106 38 0.2 10 5 106 27 0.8 10 4 96 107 27 0.6 10 4.2 107 34 1 10 5 Mean 104 31 0.5 10 4.2 104 34 0.7 11 5.1 1934 3 96 33 0.6 10 3.2 96 36 0.8 10 4.7 10 95 35 0.4 11 3 95 Broken 22 79 34 0.5 12 3.3 79 27 0.6 13 5.9 18 74 38 0.3 10 4.7 74 36 0.6 12 6 30 84 31 0.4 10 3.3 84 Broken 45 84 23 0.3 8 3.6 84 32 1 10 5.1 53 89 30 0.3 10 3.1 89 35 0.7 10 6.5 80 109 35 0.6 10 2.6 109 42 0.4 13 4 82 114 35 0.5 12 4.5 *34 *1.2 *10 *6 90 108 35 0.3 10 3.7 108 38 0.7 10 4.7 Mean 93 33 0.4 10 3.5 91 35 0.7 11 5.3 1949 9 100 35 0.5 10 3.3 100 44 0.4 11 5.1 16 70 36 0.4 13 5.4 70 *30 *1.9 *12 *7.8 28 106 32 0.7 10 3.7 106 *36 *1.5 *11 *6.1 40 104 36 0.7 11 4.3 104 *42 *1.1 *10 *8 43 63 36 0.1 11 6.5 63 *36 *2.9 *11 *10.5 58 96 37 0.8 12 4.6 96 *37 *1.5 *10 *6.4 69 115 31 0.2 10 2.7 115 48 0.4 10 5 77 101 35 0.2 10 3.6 101 30 0.7 11 5 83 70 34 0.5 14 5.4 70 *35 *1.6 *10 *6.9 90 94 30 0.4 10 3.7 94 *30 *2 *8 *9.3 Mean 92 34 0.5 11 4.3 92 41 0.5 11 5.0 1967 11 96 31 0.3 11 3.4 96 *38 *1.6 *13 *8.6 19 117 35 0.1 10 3.2 117 32 0.8 9 5.9 33 68 *29 *4 *10 *5.7 68 36 0.7 8 8.1 47 169 35 0.3 7 2.4 169 41 0.7 7 5.7 55 78 35 0.7 7 5 78 30 0.6 8 9.6 68 114 41 0.3 8 3.3 114 40 0.9 12 4.9 71 131 38 0.8 12 2.9 131 35 0.9 11 5.2 85 99 Broken 94 *29 *3.5 *10 *6.8 94 123 35 0.5 7 2 123 *39 *3.8 *8 *9 101 104 *31 *1 *8 *3.5 101 41 0.2 7 6.4 Mean 111 36 0.4 9 3.2 110 36 0.8 9 6.6 “Broken” means slice was physically broken; no measurement possible *These slices underwent collapse shrinkage; measurements not used in calculation of means.
Table 1.4. Shrinkage measurements

11
Batch Thickness mm Nominal board widths for trial. % of boards
Orientation. % of boards
Min Max Mean StdDev 75mm 100mm 125mm Backsawn Quartersawn Transitional 1901 25.5 31.7 29.1 1.28 13 59 28 0 62 381934 26.8 32.3 29.6 0.97 8 44 48 2 73 251949 25.5 33.8 29.8 1.81 2 33 65 6 63 311967 28.2 32.4 30.6 0.67 41 41 18 0 50 41Table 1.5. Summary green sawing data for Tasmania
Time (days) Dry bulb temperature (deg C) Wet bulb temperature (deg C) Air speed (m/s)
0 23.0 21.5 0.5 7 23.0 21.0 0.5
14 24.0 21.5 0.5 21 24.0 21.0 0.5 28 24.0 21.0 0.5 35 25.0 20.5 0.5 42 25.0 20.0 0.5 49 25.0 20.0 0.5 54 25.0 20.0 0.5
Predrying schedule
Time (hours) Temperature (deg C) Comments 0-2 Ambient-98 Weights fitted, heat up 2-6 98
Doors opened, charge allowed to cool for 14 hours Reconditioning schedule
Time (hours) Dry bulb temperature (deg C) Wet bulb temperature (deg C) Air speed (m/s)0.0 19.0 17.0 1.30.5 31.0 28.0 1.51.0 33.0 29.0 1.81.5 39.0 34.0 2.02.0 43.0 38.0 2.02.5 45.0 40.0 2.03.0 48.0 41.0 2.03.5 55.0 45.5 2.04.0 59.0 50.0 2.04.5 61.0 51.0 2.05.0 66.0 54.0 2.06.0 65.0 52.0 2.07.0 65.0 50.5 2.0
8.0-49.0 65.0 50.0 2.0Final drying schedule
Table 1.6. Drying schedule

12
Green (mm) Dry (mm) Shrinkage (%) Thickness Width Thickness Width Thickness Width
1901 Min 25.5 10.0 21.2 72.2 2.5 4.3 Max 31.7 144.0 29.9 133.1 23.7 15.1 Mean 29.1 115.7 25.3 106.8 13.3 8.6 StdDev 1.3 20.5 1.7 16.6 4.1 2.31934 Min 26.8 81.0 21.5 74.9 3.4 3.8 Max 32.3 164.0 30.0 155.3 27.1 17.1 Mean 29.6 124.0 25.9 114.0 12.3 8.4 StdDev 1.0 18.2 1.4 17.6 3.9 2.61949 Min 25.5 83.0 21.4 72.2 5.5 4.1 Max 33.8 146.0 30.7 133.3 28.0 17.3 Mean 29.8 128.6 25.6 117.3 14.4 8.8 StdDev 1.8 16.1 1.9 15.8 4.1 2.31967 Min 28.2 82.0 24.6 72.8 2.3 1.9 Max 32.4 146.0 29.1 134.5 18.0 12.4 Mean 30.6 107.4 27.4 99.8 10.4 7.1 StdDev 0.7 19.2 0.9 18.1 3.2 2.4Table 1.7. Summary of dry dimensional recovery of all boards.
Grade Top surface Bottom surface Both sides
1901 select 92 92 92 Standard 8 8 High Feature 0 0
1934 select 87 85 78 Standard 13 15 High Feature 0 0
1949 select 51 58 44 Standard 49 41 High Feature 0 1
1967 select 22 24 20 Standard 65 63 High Feature 5 5
Table 1.8. Percentage of boards in each grade (to AS 2796, disregarding skip) on each face and percentage of boards with both faces select.
Green Dry Loss to endsplit Loss to endsplit Total length
m length
m % of overall
length Total length
m length
m % of overall
length 1901 291.8 6.7 2.3 286.4 20.8 7.3 1934 298.3 7.5 2.5 293.4 15.3 5.2 1949 314.8 5.9 1.9 308.2 19.5 6.3 1967 299.1 7.3 2.4 294.2 14.8 5.0 Table 1.9. Total length of board processed and length lost to endsplit.

13
Top surface Bottom surface Surface check Skip Surface check Skip Internal check
1901 1.0 2.9 4.1 40.8 0.01934 2.1 2.6 2.7 59.2 4.01949 0.9 0.4 0.7 69.9 0.01967 5.1 0.6 4.4 40.3 15.3Table 1.10. Percentage of overall board length (disregarding endsplit) degraded by surface check or machining skip on both surfaces and percentage of boards affected by internal check.
Green Dry % boards outside AS 2796
Spring>10mm % of boards
Mean spring mm
Spring>10mm % of boards
Mean spring mm Flooring Lining
1901 23.5 14.3 34.7 14.6 3.1 15.31934 6.0 12.9 14.0 15.4 2.0 9.01949 1.9 10.5 14.3 12.5 1.0 4.81967 5.4 10.8 9.0 11.1 0.0 0.9
Table 1.11. Percentage of boards with spring greater than 10mm over 2.8m length, mean spring for those boards, and percentage of boards exceeding the AS 2796 allowance for spring in flooring and in lining.
14
No. 1st test (kN) 2nd test (kN) Mean (kN) MC % Orientation
1901 10 4.308 5.468 4.9 8.9 Radial 19 5.887 5.692 5.8 9.3 Radial 24 5.515 5.683 5.6 10.1 Radial 36 5.818 5.073 5.4 9.2 Radial 47 3.832 4.462 4.1 8.0 Radial 54 7.663 6.666 7.2 8.7 Radial 70 3.752 3.233 3.5 9.0 Radial 82 6.7 5.873 6.3 7.4 Radial 90 6.39 6.394 6.4 8.3 Radial 96 5.615 6.268 5.9 9.0 Radial Mean 5.5 Std Dev 1.1 8.8
1934 3 5.681 7.674 6.7 8.6 Radial 10 4.868 6.224 5.5 8.3 Radial 22 7.477 6.724 7.1 7.9 Tangential 18 6.808 5.479 6.1 8.6 Radial 30 6.028 6.733 6.4 8.8 Radial 45 6.093 6.466 6.3 8.9 Radial 53 5.384 6.187 5.8 7.9 Radial 80 6.317 6.547 6.4 8.5 Radial 82 4.753 4.831 4.8 12.9 Radial 90 5.061 5.506 5.3 8.6 Radial Mean 6.0 Std Dev 0.8 8.9
1949 9 6.758 7.194 7.0 8.9 Radial 16 7.319 7.267 7.3 8.7 Radial 28 6.205 7.463 6.8 9.2 Radial 40 7.44 6.029 6.7 9.0 Radial 43 10.002 10.015 10.0 9.1 Radial 58 6.907 5.013 6.0 8.6 Radial 69 8.569 5.328 6.9 9.4 Radial 77 6.092 7.236 6.7 7.4 Radial 83 7.225 8.194 7.7 8.7 Radial 90 6.293 8.363 7.3 9.3 Radial Mean 7.2 Std Dev 1.3 8.8
1967 11 9.652 6.745 8.2 8.6 Radial 19 4.257 3.81 4.0 9.2 Tangential 33 8.381 7.656 8.0 8.5 Radial 47 3.873 2.869 3.4 8.6 Radial 47(2) 3.31 3.425 3.4 8.6 Radial 55 8.869 8.825 8.8 8.8 Radial 68 6.354 5.243 5.8 8.8 Radial 71 5.519 4.787 5.2 8.9 Radial 71(2) 5.08 4.76 4.9 8.9 Radial 85 7.687 7.528 7.6 8.7 Radial 94 4.669 4.857 4.8 8.6 Radial 100 5.235 5.746 5.5 9.4 Radial Mean 5.8 Std Dev 1.9 8.8 Overall Mean 6.1 Std Dev 1.5
Table 1.12. Hardness testing results
15
Properties adjusted to 12%MC*
No. Max load (kN)
Width (mm)
Depth (mm)
Load/Deflection to PL (kN/mm)
MOE (GPa)
MOR (MPa)
MC (%)
MOE (GPa)
MOR (MPa)
SD (MOE)
SD (MOR) SD
Density** (kg/m3) Comment***
1901 10 2.376 20.63 20.45 0.4596 14.3 116 8.9 13.6 101 5 4 5 703 19 2.639 21.03 18.8 0.4559 17.9 149 9.1 17.1 132 3 2 3 810 24 2.611 20.96 19.83 0.4532 15.2 133 9.8 14.7 121 4 3 4 778 36 2.542 20.94 20.54 0.4412 13.3 121 9.4 12.8 108 5 4 5 686 47(2) 2.433 20.29 20.38 0.4478 14.3 121 8.8 13.6 106 5 4 5 693 Replacement 47(3) 2.359 20.03 20.23 0.4340 14.4 121 8.8 13.7 105 5 4 5 686 Extra replacement 54 2.512 20.87 18.09 0.4323 19.2 155 9.3 18.4 138 3 2 3 854 70 1.891 20.8 20.49 0.3745 11.5 91 9.1 11.0 80 6 5 6 601 82 3.202 21.06 20.47 0.5503 16.7 152 9.3 16.0 136 3 2 3 828 90 2.699 20.64 19.71 0.4545 15.8 141 8.8 15.0 123 4 3 4 755 96 2.678 20.98 18.34 0.4762 20.2 159 8.9 19.2 139 2 2 2 801 Mean 2.540 0.4527 15.7 133 9.1 15.0 117 4 3 4 745 SD 0.315 0.041 2.6 21 0.3 2.5 19 77 1934 3 3.142 20.93 20.24 0.5303 16.8 154 8.9 16.0 135 4 2 3 823 10 3.097 20.91 20.59 0.5556 16.7 147 8.4 15.8 126 4 3 4 799 22 3.235 21.29 20.85 0.5591 15.9 147 7.8 14.9 122 4 3 4 848 18 2.915 18.7 20.76 0.5682 18.6 152 8.4 17.6 130 3 3 3 804 30 3.248 20.84 20.35 0.5352 16.7 158 8.9 16.0 139 4 2 3 849 45 3.325 20.92 20.69 0.5892 17.5 156 8.5 16.5 134 3 2 3 752 53 3.054 20.45 20.9 0.5973 17.6 144 8.5 16.6 124 3 3 3 801 80 3.105 20.61 20.79 0.5058 15.0 146 8.5 14.2 126 4 3 4 732 82 0.877 20.45 19.36 0.4000 14.8 48 8.7 14.1 42 4 8 7 762 90 1.940 20.66 20.71 0.5000 15.0 92 7.8 14.0 77 4 6 5 674 Mean 2.794 0.5341 16.4 134 8.4 15.6 115 4 3 4 785 SD 0.780 0.057 1.3 36 0.4 1.2 31 55
Table 1.13. Strength test results for 20 × 20 × 300 mm clear sections of messmate loaded in the radial direction continued below

16
1949 9 2.790 20.86 20.32 0.4695 14.7 136 9.0 14.1 120 4 3 4 842 16(3) 2.851 20.32 18.93 0.4823 19.2 164 10.3 18.7 153 2 1 2 826 28 3.172 20.9 19.93 0.5050 16.8 160 8.8 15.9 140 4 2 3 881 40 3.476 20.84 20.29 0.5731 18.1 170 8.1 17.0 144 3 2 3 829 43 3.924 20.94 20.56 0.6901 20.8 186 9.4 20.0 167 2 1 2 958 58 3.060 20.69 21.02 0.5279 15.1 141 9.4 14.5 126 4 3 4 796 69 2.993 20.9 20.53 0.5102 15.5 143 9.0 14.8 126 4 3 4 874 77 2.900 20.57 20.91 0.5776 16.9 135 8.5 16.0 117 4 3 4 857 83 2.051 20.85 18.47 0.5252 21.9 121 8.2 20.7 103 2 4 3 987 90 3.467 20.85 20.5 0.5658 17.3 166 9.1 16.5 147 3 2 3 867 Mean 3.093 0.5494 17.4 151 8.9 16.6 132 3 2 3 867 SD 0.501 0.064 2.4 20 0.6 2.3 19 59 1967 11 2.954 20.72 20.29 0.5255 16.7 145 9.6 16.1 131 3 2 3 801 19(2) 1.856 20.41 19.65 0.3436 12.2 99 8.6 11.6 85 6 5 6 574 33 3.431 20.67 20.35 0.6645 20.9 168 9.2 20.1 150 2 2 2 838 47(3) 1.343 19.13 19.81 0.2339 8.6 75 8.7 8.2 65 8 6 7 547 55 3.589 20.9 20.4 0.6557 20.3 173 9.3 19.5 155 2 1 2 886 68 2.823 20.98 20.48 0.5319 16.2 135 9.2 15.5 120 4 3 4 688 71(3) 2.522 19.41 20.41 0.3876 12.9 131 8.9 12.3 115 5 3 4 666 85 3.482 20.6 20.39 0.5935 18.7 171 9.2 17.9 152 3 1 2 821 94 2.280 20.72 20.45 0.4464 13.8 111 9.4 13.3 99 5 4 5 640 100 2.130 20.45 19.67 0.3676 13.0 113 9.6 12.5 102 5 4 5 683 Mean 2.641 0.4750 15.3 132 9.2 14.7 117 4 3 4 714 SD 0.750 0.143 3.9 33 0.4 3.8 30 116 Overall Mean 15.4 120.2 4 3 4 *MOE adjusted to 12% MC at 1.5% per 1%MC; MOR at 4% per 1%MC SD 2.6 25**Exceptionally low density is defined in AS 2082 as 578kg/m3 at 12% MC for E. obliqua. Specimens of lower density are unacceptable for the existing strength rating of SD3 ***AS 2878 specifies that samples are to be rejected if slope of grain is greater than 1 in 10
Table 1.13. Strength test results for 20 × 20 × 300 mm clear sections of messmate loaded in the radial direction continued from above.
17
0
25
50
75
100
125
150
175
0 20 40 60 80 100 120 140Time (days)
Moi
stur
e co
nten
t (%
)
10-190119-190147-190154-190182-190190-190110-193418-193445-193453-193482-193490-193410-194916-194943-194958-194983-194990-194911-196719-196747-196755-196785-196794-1967
Reconditioning
Figure 1.1. Progress of drying
18
20
22
24
26
28
30
32
34
0 20 40 60 80 100 120 140Time (days)
Thic
knes
s (m
m)
10-190119-190147-190154-190182-190190-190110-193418-193445-193453-193482-193490-193410-194916-194943-194958-194983-194990-194911-196719-196747-196755-196785-196794-1967
Reconditioning
Figure 1.2. Sample board thickness during drying

19
Plate 1.1. Handling of 1967 logs
Plate 1.2. Trucking of 1967 logs
Plate 1.3. 1934 logs, McKay Timber
Plate 1.4. Break down, Kelly Timber
Plate 1.5. Breaking down, Clennett’s
Plate 1.6. Re-saw, Clennett Timber
Plate 1.7. Pack wrapped for transport
Plate 1.8. Racking, Neville Smith Tas.

20
Plate 1.9. FFIC kiln, Mowbray.
Plate 1.10. Machining, NST, Mowbray
Plate 1.11. Grading, NST, Mowbray
Plate 1.12. Board measurement
Plate 1.13. Strength testing
Plate 1.14. Strength test detail
Plate 1.15. Hardness testing
Plate 1.16. Hardness test detail

21
Plate 1.17. Typical 1901 regrowth Eucalyptus obliqua boards
22
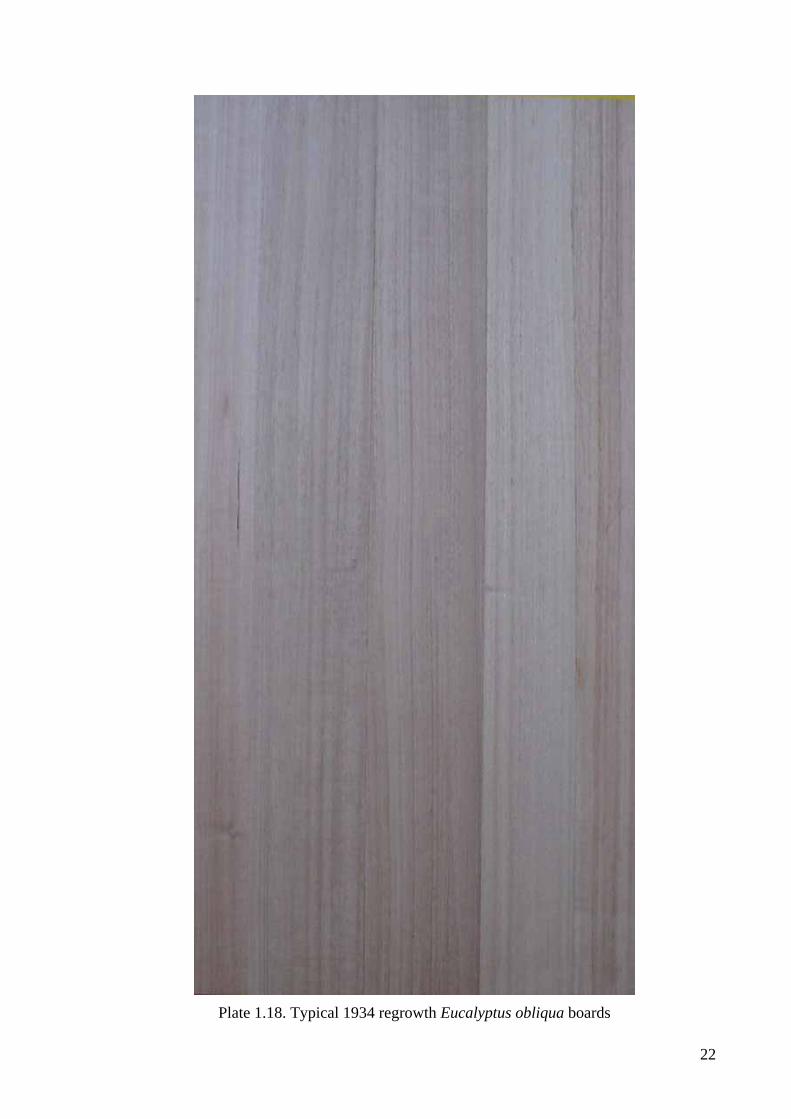
Plate 1.18. Typical 1934 regrowth Eucalyptus obliqua boards
23
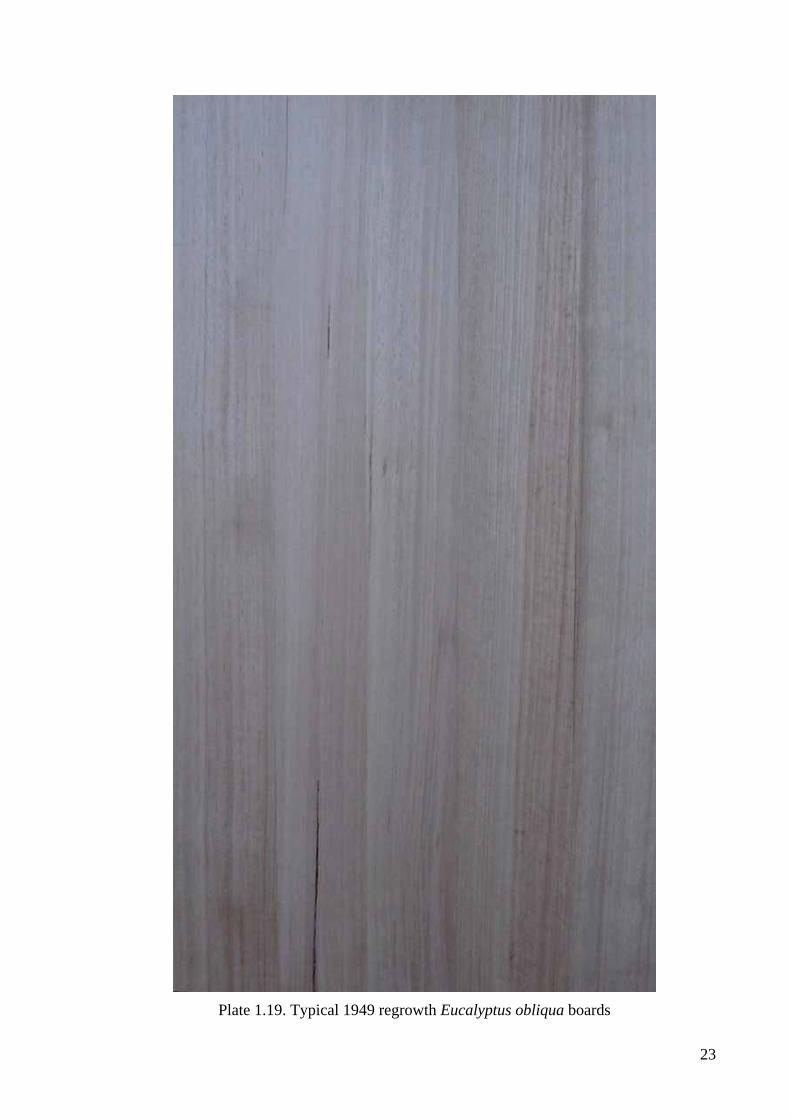
Plate 1.19. Typical 1949 regrowth Eucalyptus obliqua boards
24
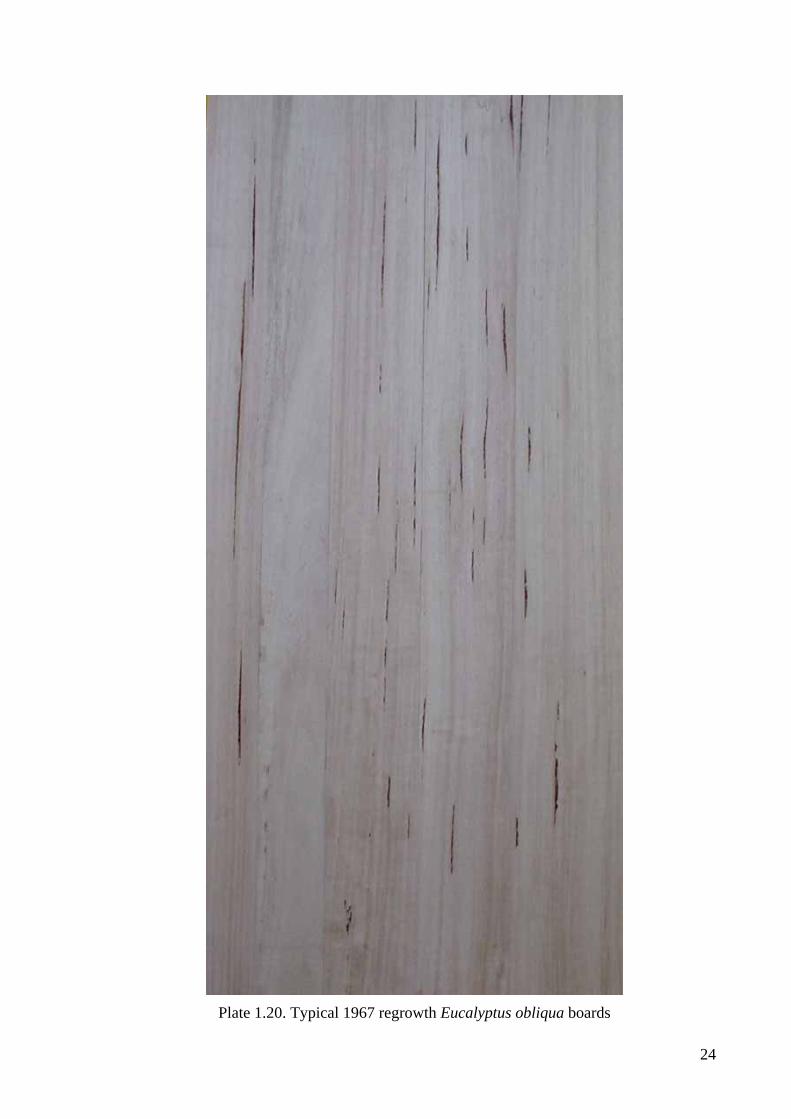
Plate 1.20. Typical 1967 regrowth Eucalyptus obliqua boards

25
1.3. Analysis
1.3.1. Logs and discs There was a significant difference (ANOVA) between heartwood proportion for the four groups, except when comparing 1949 and 1967 discs, and 1901 and 1934 discs.
There was significantly more endsplit in 1901 logs than in 1949 or 1967 logs (comparing the butt end only since logs were delivered in non-uniform lengths) with more than three times the log length subjected to splitting. This difference is not apparent in green board endsplit figures; this is most likely due to the skill of the sawyer in sawing around the log endsplits.
1.3.2. Green timber properties There was no consistent variation between initial moisture content of the four groups; 2 of the 6 pairwise comparisons showed a difference based on ranks (unequal variances).
There was a significant difference (ANOVA) in three of the six pairwise comparisons of basic density measurements but not between the oldest and youngest groups.
There was no significant difference in radial shrinkage between groups. There were insufficient samples for comparison of tangential shrinkage as several were discarded due to collapse or breakage. Summary results corrected to 12% by assuming linear shrinkage between FSP and EMC, and comparison with published data are shown in Table 1.14. The tangential:radial shrinkage ratio is generally taken to be close to 2 for this timber; results measured here suggest a ratio closer to 1.5.
Radial shrinkage (%) Tangential shrinkage (%) Mean SD Mean SD
1901 3.8 0.83 4.9 2.64 1934 3.2 0.66 5.1 2.45 1949 4.2 1.16 4.8 N/A 1967 2.9 1.43 5.8 1.70
mature 3.3 6.3 regrowth- 15-25yr 3.4 6.6
Table 1.14. Radial and tangential unconfined shrinkage and comparison with published values for mature timber and young regrowth (Kingston and Risdon 1961)
1.3.3. Drying Figure 1.1 shows no noticeable difference in drying rate between the four groups. Moisture content variation decreased as drying progressed. There was a poor correlation between moisture meter reading and oven dry moisture content from the final dried sample boards and from hardness samples.
1.3.4. Dry evaluation There was a significant difference between shrinkage in thickness for all pairwise comparisons except for 1901 and 1934 groups. Mean shrinkage in thickness was lowest in 1967 material.
Shrinkage in width was significantly lower in 1967 material than in all other groups (analysis based on ranks; data failed normality test) with a mean of 7.1% as compared to 8.1 to 8.6%.
There was no significant difference in dry endsplit figures, although the nature of this data makes analysis problematic (most boards have no endsplit, so distribution is non-normal).

26
Percentage of overall length of board lost to endsplit from the 1967 boards was 5.0% as compared to 7.3% from the 1901 boards.
The proportion of select grade material was strongly related to age, with proportion of select increasing from 20% in 1967 boards to 92% in 1901 boards. Downgrade was almost exclusively as a result of gum vein.
1.3.5. Strength There was no significant difference between groups for either MOE or MOR. Summary results and comparison with published figures for mature timber are shown in Table 1.15.
MOE and MOR correlated closely with both density at 12% moisture content (MC) and basic density. The strongest relationship was between density at 12% and MOE with an R2 value of 0.67.
Properties adjusted to 12%MC*
MC (%)
MOE (GPa)
MOR (MPa)
Group (MOE)
Group (MOR) Group
Density (kg/m3)
1901 Mean 9.1 15.0 117 4 3 4 738 SD 0.3 2.5 19 77
1934 Mean 8.4 15.6 115 4 3 4 776 SD 0.4 1.2 31 54
1949 Mean 8.9 16.6 132 3 2 3 868 SD 0.6 2.3 19 58
1967 Mean 9.2 14.7 117 4 3 4 588 SD 0.4 3.8 30 325 Overall Mean 15.4 120 4 3 4 SD 2.6 25
: mature 15.5 118 Table 1.15. Summary strength properties, comparison with published data for mature timber (Bolza and Kloot 1963)
1.3.6. Hardness There was a significant difference (P=0.017) between two of the groups (1901 and 1949), but only based on ranks (unequal variances). It cannot be concluded that there was a significant affect of age on hardness. Summary results and comparison with published data for mature timber are shown in Table 1.16.
There were strong relationships between hardness and basic density (R2= 0.597), and hardness and density at 12% MC (R2=0.719).
Janka hardness (kN) MC % Mean Std Dev
1901 8.8 5.5 1.11934 8.4 6.0 0.81949 8.8 7.2 1.31967 8.7 5.8 1.9
Overall 6.1 1.5 mature: 7.3
Table 1.16. Summary hardness properties, comparison with published figures for mature timber (Bolza and Kloot 1963).

27
2. Western Australian regrowth jarrah (Eucalyptus marginata) G.R. Siemon
Forest Products Commission, Western Australia.
2.1. Methods
2.1.1. Selection of area With changes in Government policy over recent years, a large proportion of the 1.4 Mha jarrah (Eucalyptus marginata) forest is in conservation areas and National Parks. The areas available for timber harvesting were assessed to find a suitable area for providing logs for this trial, but it was essential that it was representative of the resource.
Various areas were considered. The area selected was Willowdale, situated about 100 km south of Perth and east of Waroona, which is part of the zone available to Alcoa World Alumina Australia for bauxite mining. Forest Products Commission’s production staff gave the opinion that it was a good example of the northern jarrah forest, which produces high quality timber on lateritic soils. There was little variation in the site and factors such as variations in silvicultural treatment and fire history were not an issue. The major understorey species is WA sheoak (Allocasuarina fraseriana).
2.1.2. Tree selection Log size batches were used rather than age class batches, because selective felling procedures result in the development of dominant naturally regenerated seedlings, while jarrah growth rings are difficult to identify. The project required a sample of ten trees from each of an average 25 cm, 40 cm and 55 cm when measured at diameter breast height over bark (dbhob). The dbhob and height of each of the sample trees were measured to the nearest centimetre and metre respectively. The shape of the crowns with often several spreading branches at the apex made this level of accuracy appropriate when assessing height.
Each tree was marked so that identification could be maintained during processing. The three size classes were identified by a specific colour, and trees were numbered 1 to 10.
Estimates of the number of stems/ha (sph) in the three different size classes were made in two separate assessments of the area.
2.1.3. Harvesting Following new standard practices, the trees were harvested as whole bole lengths on 3rd September. The boles were then transported to the sawmill where logs were docked to the required lengths, with the butt log to be used in the trial. Jarrah is a stable species, and industry practice in the field is to leave log ends untreated.
2.1.4. Sawmilling The 2.4 m log taken from the butt of each bole log was milled at the Inglewood Products Group’s sawmill at Mundijong, about 35 km south of Perth. The 2.4 m log length (rather than 3 m) was approved by the University of Tasmania as project manager because the batch kilns at Timber Technology could take this length while ensuring better control over drying than can be achieved in other kilns at the centre.

28
While ash-type eucalypt species can have growth rings counted to assess age, this is not possible with jarrah. Measurements of total diameter under bark and heartwood were made across the major and minor axes. It was not necessary to cut a 25 mm thick disc from each end, which would normally be used for estimates of age based on growth rings. Length of any end splits was then measured.
Log volumes were estimated from the large and small end diameter measurements and log length, using Smalian’s formula (i.e. the mean of the large and small end cross-sectional areas under bark is multiplied by log length). Percentage heartwood was estimated similarly.
Each log was backsawn into 100 x 28 mm boards, with the smaller dimensions of 80 x 28 mm or 60 x 28 mm sawn when the major dimension could not be achieved. The boards were tallied and volume calculated to estimate green sawn recoveries.
2.1.5. Wood properties assessment (shrinkage and density) Each of the ten boards randomly selected for preparation of the sample boards also had a 100 mm long section docked for assessment of shrinkage and wood density, taken from beside the sample board location. Briefly, a 25 mm cube was cut from a strip cut 25 mm from the end of the 100 mm section. The residual 50 mm section was used for moisture content and basic density assessment. Density was estimated using mass from weighing to 0.01 g, and volume estimated from water displacement.
The 25 mm cube had a tangential slice and a radial slice (approximately 1 mm thick) taken from it to measure unconfined shrinkage, i.e. the shrinkage from green to equilibrium moisture content. The slice was restrained in a wire frame and measurements made using a microscope and vernier calipers. The mean values and standard deviations of each variable from green to equilibrium moisture content were calculated.
2.1.6. Kiln drying and board evaluation As stated above, ten boards were randomly selected from the timber milled from each log for drying. The boards were end-painted with the appropriate colour for each log diameter class, and each board numbered for identification. Three packs of 100 boards each were prepared (i.e. one pack for each log diameter class). Obviously all boards milled from the smallest diameter class were needed for the trial.
Ten sample boards were prepared from each pack according to the University of Tasmania specification, with one from each tree in the sample. The dimension cut was 300 mm length, with both ends of the board sealed. The kiln drying schedule supplied by the University of Tasmania is given in Table 2.1. Jarrah timber is very stable, and it was anticipated that pre- and post-treatments would not be required. However, delays in drying a previous charge and electrical equipment problems with batch kilns caused the delay in drying the jarrah.

29
Time (days)
Dry bulb temperature
(º C)
Wet bulb temperature (º C)
EMC (%)
Air speed (m/s)
0 23.0 21.5 20 0.5 7 23.0 21.0 17.5 0.5
14 24.0 21.5 16 0.5 21 24.0 21.0 15 0.5 28 24.0 21.0 15 0.5 35 25.0 20.5 12 0.5 42 25.0 20.0 11 0.5 49 25.0 20.0 11 0.5 54 25.0 20.0 11 0.5
Table 2.1. Kiln drying schedule used for drying jarrah regrowth boards
Drying was not commenced until December 2003, and was done in two batch kilns, each designed to take 1 m3 of timber. However, in the high ambient temperatures of the Western Australian summer it was not possible to use the Schedule in Table 2.1, and after the first weeks the schedule was modified to use higher temperatures, while using the same equilibrium moisture content levels for each step in drying (Table 2.2).
Time (days)
Dry bulb temperature
(º C)
Wet bulb temperature (º C)
EMC (%)
Air speed (m/s)
0 23.0 21.5 20 0.5 7 25.0 22.7 18 0.5
30 25.0 22.5 16.5 0.5 42 25.0 22.0 15 0.5 62 33.0 28.3 12.5 0.5 71 33.0 27.5 11.5 0.5 99 35.0 26.5 8.8 1.0
120 Finish Table 2.2. Kiln drying schedule actually used for drying jarrah regrowth boards in batch kilns
The predominantly 110 x 28 mm boards were assessed for defect before drying, measuring end splits at the numbered and other end, spring greater than 10 mm, surface checks and grade. It was necessary to keep the timber in temporary wet storage before drying following kiln problems due to extended drying of other timber and electrical equipment faults.
After drying and dressing by straightening planer to 90 x 20 mm, a standard size recommended by FIFWA (1992), the drying behaviour of each board was assessed by measuring end splits at each end, spring greater than 10 mm, surface checks (splits resulting from heart were noted here), skip, grade and percentage moisture content. Moisture content was measured using a capacitance type moisture meter to avoid the probe damage to the timber that occurs with resistance type meters and insertion of prongs.
Thirty sample boards were used, with fifteen in each batch kiln. Jarrah is a high density species, and therefore drying times were expected to be significantly greater than for mountain ash. The drying times were further extended due to failure of solenoids in both batch kilns, but fortunately this occurred when the moisture contents were below fibre saturation point and timber quality was not disadvantaged.

30
2.2. Results and Discussion
2.2.1. Tree dimensions The mean values and standard deviations of dbhob and height of the sample trees in each of the three size classes are given in Table 2.3.
Tree No. DBHOB (cm) Height (m) 25/1 30.0 19.0 25/2 28.0 17.0 25/3 32.0 19.0 25/4 30.0 20.0 25/5 29.0 22.0 25/6 26.0 19.0 25/7 28.0 19.0 25/8 31.0 20.0 25/9 31.0 18.0
25/10 25.0 22.0 Mean 29.0 (2.3) 19.5 (1.6)
40/1 43.0 22.0 40/2 36.0 21.0 40/3 40.0 24.0 40/4 39.0 17.0 40/5 35.0 20.0 40/6 36.0 18.0 40/7 45.0 22.0 40/8 42.0 25.0 40/9 41.0 20.0
40/10 46.0 22.0 Mean 40.3 (3.8) 21.1 (2.5)
55/1 48.0 23.0 55/2 60.0 25.0 55/3 58.0 24.0 55/4 51.0 23.0 55/5 55.0 24.0 55/6 59.0 26.0 55/7 52.0 23.0 55/8 53.0 30.0 55/9 54.0 26.0
55/10 59.0 26.0 Mean 54.9 (4.0) 25.0 (2.2)
Table 2.3. Dimensions of trees sampled from Willowdale mine site for jarrah sawmilling and drying study (means and standard deviation)
2.2.2. Stems per hectare (sph) Two estimates of the number of jarrah stems per hectare (sph) above 25 cm dbhob, in each of the three size classes nominated, were made over quarter hectare selections.
The results indicated that overall stocking varied from 45 sph to 50 sph. The mean percentage of trees in different size classes were as follows:
25 (20 – 32.5 cm) 45 per cent
40 (33 – 47.5 cm) 30 per cent
55 (>48 cm) 25 per cent.

31
2.2.3. Harvesting The trees were harvested as whole bole lengths to the standard 200 mm small end diameter under bark on 3rd September 2003. The logs were identified to maintain identity, and then transported to the sawmill where logs were docked to the required lengths. The butt log was retained for the trial. Jarrah is a stable species, and standard industry practice is to leave log ends untreated.
2.2.4. Sawmilling The log volumes required for the trial were estimated from the large and small end diameter measurements and log length, using Smalian’s formula.
The logs in each size class were backsawn to standard dimensions of 100 x 28 mm, with 80 x 28 mm or 60 x 28 mm as recovery sizes.
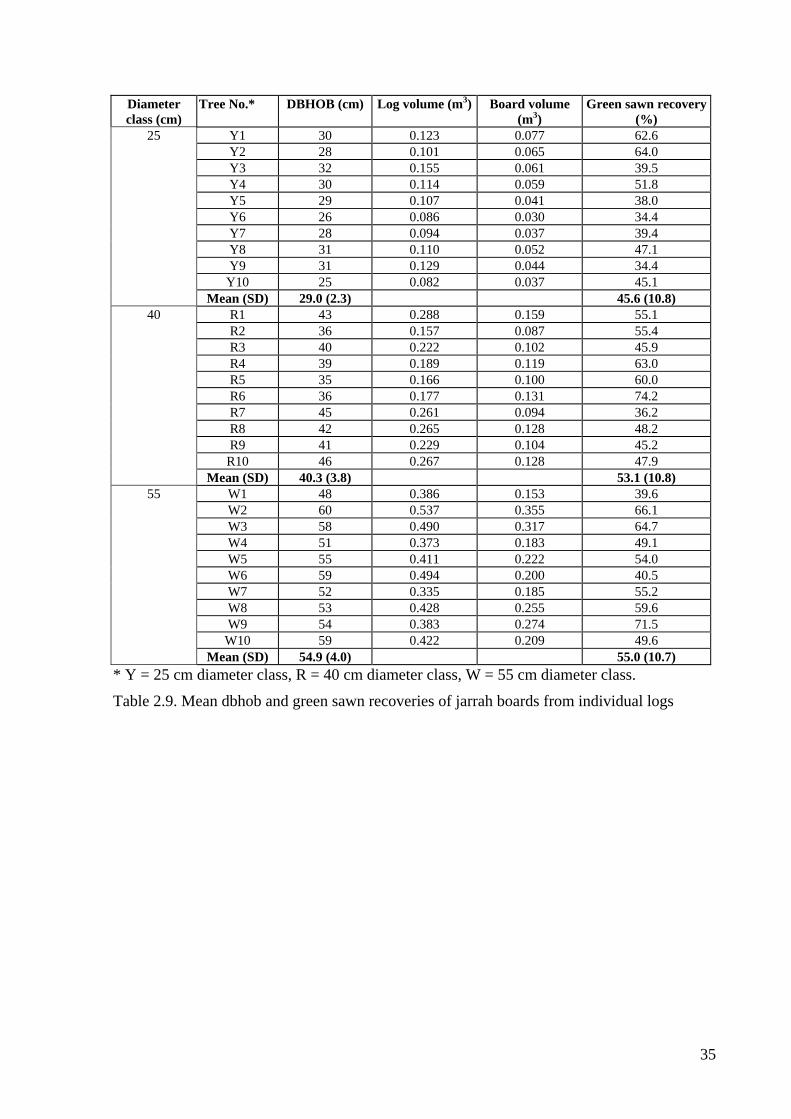
The combined log volumes and board volumes, mean percentage heartwood and green sawn recoveries from logs in each of the three size classes are given in Table 2.4. Full results are in Table 2.8 and Table 2.9.
Diameter class (cm)
Total log volume (m3)
Mean (SD) % heartwood
Board volume (m3)
Mean (SD) green sawn recovery (%)
25 (20 to 32.5) 1.100 76.5 (7.8) 0.502 45.6 (10.8) 40 (33 to 47.5) 2.222 80.7 (3.5) 1.151 53.1 (10.8) 55 (48 to 60) 4.259 85.8 (4.5) 2.354 55.0 (10.7) Table 2.4. Combined log volumes and board volumes, mean percentage heartwood and mean green sawn recoveries of boards from ten logs in each of three size classes of jarrah logs
Mean percentage heartwood shows the expected increasing trend with increasing log size, because sapwood width tends to remain constant and sapwood will become a decreasing proportion of the cross-sectional area. It is well documented that green sawn recovery increases with increasing log diameter (assuming similar log quality).
2.2.5. Wood density and shrinkage The green density, basic density, and moisture content of samples from each treatment are given in Table 2.5. Full results are in Table 2.11.
MC% Green density (kg/m3) Basic density (kg/m3) Diameter class (cm) Mean SD Mean SD Mean SD
25 (20 – 32.5) 88.9 8.6 1162 40 616 27 40 (33 – 47.5) 90.2 11.1 1173 23 619 37 55 (48 – 60) 79.8 10.9 1193 43 666 58
Table 2.5. Moisture content, green and basic density of jarrah samples from three diameter classes
The results indicated significantly lower basic density in the two smaller diameter classes, resulting in a higher green density in the 55 cm class because the density of wood is approximately 50 per cent greater than that of water. Moisture content in that class was lower because of the greater proportion of wood.
Unrestrained tangential and radial shrinkage were measured on 1 mm thick slices. The grain of the wood prevented slicing thinner than this with the guillotine used at Timber Technology for drying research. The results indicated significant differences between diameter classes, although the proportions of tangential shrinkage to radial shrinkage were similar to those reported by Kingston and Risdon (1961) for 25 mm (1 inch) square sections (Table 2.6). Jarrah obviously behaves differently to the ash-type eucalypts with regard to unrestrained

32
shrinkage of thin slices, because the latter have significantly greater shrinkage than pieces with larger dimensions.
Tangential shrinkage (%) Radial shrinkage (%) Diameter class
(cm) Mean SD Mean SD 25 (20 – 32.5) 7.4 2.5 4.3 1.4 40 (33 – 47.5) 8.0 2.8 4.5 1.9 55 (48 – 60) 5.5 1.3 3.5 0.8 Mature* 7.4 4.8
*Published data from Kingston and Risdon (1961)
Table 2.6. Unrestrained tangential and radial shrinkage of jarrah from three diameter classes
The samples from the largest diameter class had lowest shrinkage and least variation, with a coefficient of variation of 22.9 per cent. In comparison, the coefficients for 25 cm and 40 cm diameter classes were 32.6 per cent and 42.2 per cent respectively. It should be taken into account that a single board was randomly selected from the ten boards milled from each log, but overall it is logical that the largest trees had lower and more uniform shrinkage.
2.3. Board evaluation Board evaluation results are given in Table 2.12
2.3.1. Boards downgraded because of wood quality The hundred boards from each of the three diameter classes were graded before stripping for drying, taking into account that if wood quality was below grade, drying could not improve that grade. Boards were separated by a commercial grader into select and non-select grades, and a major objective was to monitor the effects of drying on boards that were originally graded as select. Grades are shown in Table 2.7
2.3.2. End splits (before drying) With end splits, the data confirmed the variation between trees, with only a few trees in each diameter class having boards with end splits. It was anticipated that there would be a gradation based on diameter class in the number of boards affected by end splits, with the highest level of stress in boards from the smallest diameter class. However, the 40 cm class was most affected by end splits, with 43 boards with end splits compared with 22 boards in the 25 cm class and 20 boards in the 55 cm class.
There was a gradation in the mean length of splits from the 25 cm class to the 55 cm class, ranging from 156 mm (25 cm class) to 221 mm (40 cm class) to 309 mm (55 cm class). A better indication of the occurrence of end splits in the three diameter classes is the total length (3432 mm, 9503 mm and 6180 mm respectively from smallest to largest diameter class).
2.3.3. End splits (after drying) The mean length of end splits increased in each of the three diameter classes, as would be expected with the effect of drying stresses. However, the greatest increase (35 per cent) was in the boards from the 25 cm class logs, compared with 23 per cent from the 40 cm class and 13 per cent from the 55 cm class.
33
2.3.4. Spring Although most of the sawn production was backsawn boards, there are inevitably some quartersawn and ‘intermediate’ boards (growth rings between 30º and 60º angle to the face), and the random sampling of ten boards from the production from the largest diameter class was expected to be a factor. However, the numbers of boards with 10 mm or greater spring were three, four and seven respectively in the 25 cm, 40 cm and 55 cm classes.
Boards with spring cannot be straightened during drying, unlike those with bow, but dressing the boards on a straightening planer removed the effect. The exceptions were one board in the 40 cm class and two boards in the 55 cm class where dressing apparently upset the balance of stresses caused by drying. Twist and cupping were not a problem.
2.3.5. Surface checks Surface checks were not a problem, except where included heart was involved. Every board with included heart had drying defects, and the 25 cm class had 16 boards with heart, the 40 cm class 14 boards and the 55 cm class only two boards.
2.3.6. Skip The boards were milled at a nominal 28 mm thickness, however there were some with skip after drying and dressing to 90 x 20 mm dimensions. The number of boards with skip were six, four and five respectively in the smallest to largest classes.
2.3.7. Upgrading boards Some boards originally downgraded because of low wood quality could be upgraded by docking, dressing further or ripping along the length. Before drying, the boards downgraded to non-select due to included heart, gum veins and pockets and knots (based on AS 2796:1999). In some boards the split heart was along one edge of the board, and ripping to 70 mm width produced select material. Similarly, some boards could be dressed to 15 mm thickness to remove skip from the initial dressing, while others would not benefit. The number of boards that could be upgraded to select are also given in Table 2.12.
% of boards: % with spring exceeding AS 2796: Diameter class (cm) select upgraded with included
heart Flooring Lining
25 82 25 17 3.2 3.2 40 76 23 14 2.0 3.0 55 92 18 2 4.0 4.0
Table 2.7. Grade by diameter class and spring.
2.4. Strength and hardness testing Strength testing was performed on 10 samples from each size class, each 20×20×300 mm. 3 point bending tests loaded on a radial face as detailed by Mack (1979), specified in Australian Standard 2878:2000 were performed by the University of Tasmania. Results are shown in Table 2.13.
Janka hardness tests were performed at two sites on each of ten specimens from each size class. Results are shown in Table 2.14.

34
Size class Log No. Mean dub Mean diam heartwood Mean dub Mean diam heartwood Log volume Vol heart % heart (cm) butt (mm) butt (mm) crown (mm) crown (mm) (m3) (m3) 25 1 275 255 235 210 0.123 0.103 83.4
2 255 220 205 165 0.101 0.071 70.6 3 315 290 255 215 0.155 0.123 79.3 4 265 215 225 180 0.114 0.074 65.1 5 255 230 220 180 0.107 0.080 75.2 6 230 210 195 180 0.086 0.072 84.1 7 245 220 200 170 0.094 0.073 77.3 8 265 235 215 185 0.110 0.084 76.8 9 290 280 230 205 0.129 0.113 87.9 10 225 180 190 155 0.082 0.053 65.1 Total / Mean (SD) 1.100 0.847 76.5 (7.8)
40 1 420 380 360 325 0.288 0.236 81.7 2 315 280 260 225 0.157 0.122 77.3 3 365 330 320 285 0.222 0.179 80.7 4 350 310 280 240 0.189 0.145 76.5 5 325 290 265 235 0.166 0.131 79.2 6 330 290 280 240 0.177 0.134 75.7 7 410 380 330 295 0.261 0.218 83.5 8 380 345 370 335 0.265 0.218 82.2 9 395 375 295 265 0.229 0.199 86.8 10 410 370 340 315 0.267 0.223 83.2 Total / Mean (SD) 2.222 1.803 80.7 (3.5)
55 1 465 435 440 415 0.386 0.341 88.2 2 570 550 495 475 0.537 0.498 92.7 3 555 525 460 425 0.490 0.430 87.8 4 490 455 395 360 0.373 0.317 85.0 5 505 460 425 380 0.411 0.336 81.7 6 555 520 465 430 0.494 0.429 86.8 7 455 400 385 345 0.335 0.263 78.5 8 535 515 410 380 0.428 0.386 90.2 9 480 450 420 390 0.383 0.334 87.2 10 495 450 450 395 0.422 0.338 80.1 Total / Mean (SD) 4.259 3.671 85.8 (4.5)
Table 2.8. Mean log diameters, volumes and percentage heartwood of jarrah from three diameter classes
35
Diameter class (cm)
Tree No.* DBHOB (cm) Log volume (m3) Board volume (m3)
Green sawn recovery (%)
25 Y1 30 0.123 0.077 62.6 Y2 28 0.101 0.065 64.0 Y3 32 0.155 0.061 39.5 Y4 30 0.114 0.059 51.8 Y5 29 0.107 0.041 38.0 Y6 26 0.086 0.030 34.4 Y7 28 0.094 0.037 39.4 Y8 31 0.110 0.052 47.1 Y9 31 0.129 0.044 34.4 Y10 25 0.082 0.037 45.1 Mean (SD) 29.0 (2.3) 45.6 (10.8)
40 R1 43 0.288 0.159 55.1 R2 36 0.157 0.087 55.4 R3 40 0.222 0.102 45.9 R4 39 0.189 0.119 63.0 R5 35 0.166 0.100 60.0 R6 36 0.177 0.131 74.2 R7 45 0.261 0.094 36.2 R8 42 0.265 0.128 48.2 R9 41 0.229 0.104 45.2 R10 46 0.267 0.128 47.9 Mean (SD) 40.3 (3.8) 53.1 (10.8)
55 W1 48 0.386 0.153 39.6 W2 60 0.537 0.355 66.1 W3 58 0.490 0.317 64.7 W4 51 0.373 0.183 49.1 W5 55 0.411 0.222 54.0 W6 59 0.494 0.200 40.5 W7 52 0.335 0.185 55.2 W8 53 0.428 0.255 59.6 W9 54 0.383 0.274 71.5 W10 59 0.422 0.209 49.6 Mean (SD) 54.9 (4.0) 55.0 (10.7)
* Y = 25 cm diameter class, R = 40 cm diameter class, W = 55 cm diameter class.
Table 2.9. Mean dbhob and green sawn recoveries of jarrah boards from individual logs
36
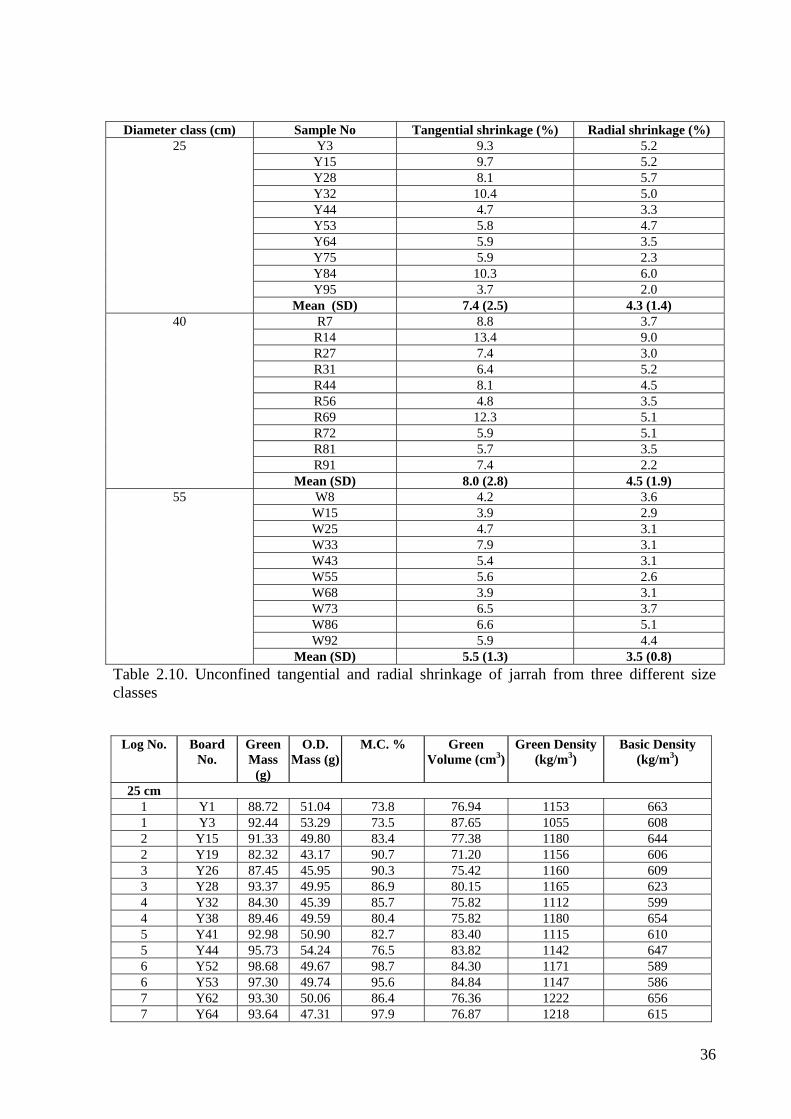
Diameter class (cm) Sample No Tangential shrinkage (%) Radial shrinkage (%)
25 Y3 9.3 5.2 Y15 9.7 5.2 Y28 8.1 5.7 Y32 10.4 5.0 Y44 4.7 3.3 Y53 5.8 4.7 Y64 5.9 3.5 Y75 5.9 2.3 Y84 10.3 6.0 Y95 3.7 2.0 Mean (SD) 7.4 (2.5) 4.3 (1.4)
40 R7 8.8 3.7 R14 13.4 9.0 R27 7.4 3.0 R31 6.4 5.2 R44 8.1 4.5 R56 4.8 3.5 R69 12.3 5.1 R72 5.9 5.1 R81 5.7 3.5 R91 7.4 2.2 Mean (SD) 8.0 (2.8) 4.5 (1.9)
55 W8 4.2 3.6 W15 3.9 2.9 W25 4.7 3.1 W33 7.9 3.1 W43 5.4 3.1 W55 5.6 2.6 W68 3.9 3.1 W73 6.5 3.7 W86 6.6 5.1 W92 5.9 4.4 Mean (SD) 5.5 (1.3) 3.5 (0.8)
Table 2.10. Unconfined tangential and radial shrinkage of jarrah from three different size classes
Log No. Board
No. Green Mass
(g)
O.D. Mass (g)
M.C. % Green Volume (cm3)
Green Density (kg/m3)
Basic Density (kg/m3)
25 cm 1 Y1 88.72 51.04 73.8 76.94 1153 663 1 Y3 92.44 53.29 73.5 87.65 1055 608 2 Y15 91.33 49.80 83.4 77.38 1180 644 2 Y19 82.32 43.17 90.7 71.20 1156 606 3 Y26 87.45 45.95 90.3 75.42 1160 609 3 Y28 93.37 49.95 86.9 80.15 1165 623 4 Y32 84.30 45.39 85.7 75.82 1112 599 4 Y38 89.46 49.59 80.4 75.82 1180 654 5 Y41 92.98 50.90 82.7 83.40 1115 610 5 Y44 95.73 54.24 76.5 83.82 1142 647 6 Y52 98.68 49.67 98.7 84.30 1171 589 6 Y53 97.30 49.74 95.6 84.84 1147 586 7 Y62 93.30 50.06 86.4 76.36 1222 656 7 Y64 93.64 47.31 97.9 76.87 1218 615

37
8 Y71 89.03 44.78 98.8 77.78 1145 576 8 Y75 87.81 45.27 94.0 75.09 1169 603 9 Y84 98.30 51.69 90.2 79.89 1230 647 9 Y86 89.68 46.74 91.9 76.08 1179 614
10 Y93 90.11 44.30 103.4 76.12 1184 582 10 Y95 96.75 49.28 96.3 82.99 1166 594
MEAN 88.9 1162 616 SD 8.6 40 27
40 cm 1 R2 93.76 51.33 82.7 79.95 1173 642 1 R7 89.26 49.33 80.9 75.15 1188 656 2 R14 92.37 41.27 123.8 79.41 1163 520 2 R16 97.24 50.11 94.1 80.23 1212 625 3 R23 87.74 45.42 93.2 77.17 1137 589 3 R27 95.71 47.15 103.0 80.86 1184 583 4 R31 94.69 49.02 93.2 81.39 1163 602 4 R35 92.74 48.55 91.0 80.61 1150 602 5 R44 86.61 49.37 75.4 75.27 1151 656 5 R49 98.50 50.00 97.0 83.31 1182 600 6 R52 87.53 45.25 93.4 75.28 1163 601 6 R56 90.81 49.77 82.5 78.48 1157 634 7 R63 94.28 49.51 90.4 78.79 1197 628 7 R69 96.35 51.33 87.7 80.41 1198 638 8 R72 81.07 42.27 91.8 71.01 1142 595 8 R76 82.35 42.70 92.9 72.47 1136 589 9 R81 83.47 47.76 74.8 69.96 1193 683 9 R84 99.85 55.28 80.6 83.51 1196 662
10 R91 91.82 46.47 97.6 76.19 1205 610 10 R97 91.93 51.73 77.7 78.68 1168 657
MEAN 90.2 1173 619 SD 11.1 23 37
55cm. 1 W3 80.71 42.60 89.5 69.33 1164 614 1 W8 99.85 51.25 94.8 81.70 1222 627 2 W15 88.76 50.56 75.6 72.12 1231 701 2 W19 86.01 50.87 69.1 71.22 1208 714 3 W21 84.99 47.52 73.1 73.06 1163 650 3 W25 93.35 48.59 92.1 78.32 1192 620 4 W33 96.21 51.46 87.0 80.87 1190 636 4 W37 82.04 44.16 85.8 70.10 1170 630 5 W43 92.06 46.25 99.0 78.08 1179 592 5 W47 84.95 45.59 86.3 76.68 1108 595 6 W55 88.61 53.53 65.5 71.44 1240 749 6 W60 83.23 51.15 62.7 66.71 1248 767 7 W65 89.61 53.21 68.4 73.66 1217 722 7 W68 96.43 55.42 74.0 77.72 1241 713 8 W71 81.19 45.43 78.7 71.61 1134 634 8 W73 85.51 45.62 87.4 72.16 1185 632 9 W83 101.48 62.67 61.9 81.92 1239 765 9 W86 85.22 48.17 76.9 68.29 1248 705
10 W92 86.67 47.54 82.3 74.78 1159 636 10 W94 85.32 45.90 85.9 75.68 1127 607
MEAN 79.8 1193 666 SD 10.9 43 58
Table 2.11. Moisture content, green density and basic density of jarrah

38
25 cm class (yellow) 40 cm class (red) 55 cm class (white) Before drying After drying Before drying After drying Before drying After drying
Property
No. boards
Mean (SD)
No. boards
Mean (SD)
No. boards
Mean (SD)
No. boards
Mean (SD)
No. boards
Mean (SD)
No. boards
Mean (SD)
End splits: Numbered end Other end Total splits No. split both ends Total length of end splits
17
13 22
8
119 (89)
109 (49) 156 (98)
3432
16
10 19
7
173 (125)
185 (85)
243 (158)
4617
26
34 43
17
168 (128)
154 (116) 221 (165)
9503
25
33 42
16
224 (132)
184 (104) 278 (185)
11676
12
12 20
4
257 (189)
258 (217) 309 (278)
6180
15
11 24
2
288 (202)
243 (121) 291 (195)
6984
Spring
3 25 (-)* - - 4 16 (-) 1 20 7 18 (8) 2 10 (-)
Surface checks
- - 16** Full length
- - 14** Full length-
- - 2** Full length
Skip
- - 6 1017 (598)
- - 4 1125 - - 5 650 (269)
MC%
- - 95 12.7 (1.0) - - 100 12.8 (1.0) - - 100 12.5 (1.1)
Downgraded (heart, gum, knots) Upgraded
17 Dock 11 Dress 5 Rip 8
31 Dock 18 Dress 1 Rip 4
13 Dock 15 Dress 1 Rip 2
• * Standard deviation was not calculated for fewer than five boards. • ** Almost exclusively the effect of included heart
Table 2.12. Effect of drying on wood quality of regrowth jarrah boards

39
Adjusted to 12% MC* No Max load
(kN) Width (mm)
Depth (mm)
Load/Deflection to PL (kN/mm)
MOE (GPa)
MOR (MPa)
MC (%)
MOE (GPa)
MOR (MPa)
SD (MOE)
SD (MOR) SD Density at
12% (kg/m3)Comment
Yellow (25 cm) 3 2.676575 20.30 18.75 0.4918 20.2 158 10.7 19.8 149 2 2 2 978 15 2.835542 20.22 20.48 0.5505 17.4 140 12.6 17.6 144 3 2 3 880 28 2.471579 20.31 20.66 0.4644 14.2 120 12.3 14.3 121 4 3 4 766 32 2.545067 20.58 20.68 0.4710 14.2 121 11.7 14.1 120 4 3 4 756 44 2.621108 20.89 20.54 0.3429 10.4 125 10.8 10.2 119 7 3 6 753 Half sapwood? (pale) 53 3.32256 20.50 20.33 0.5512 17.6 165 12.0 17.6 165 3 1 2 951 64 3.259232 20.57 20.51 0.5410 16.7 158 10.7 16.4 150 3 1 2 874 Half sapwood? (pale) 75 2.437491 20.36 19.88 0.4335 14.9 127 12.1 14.9 128 4 3 4 788 Half sapwood? (pale) 84 3.388728 20.56 20.70 0.4938 14.9 162 9.3 14.3 144 4 2 3 841 95 3.820874 20.70 20.83 0.6285 18.4 179 10.3 18.0 166 3 1 2 967
Mean 2.94 0.4969 15.9 145 11.3 15.7 141 4 2 3 856 Red (40 cm) 7 2.139296 20.18 20.81 0.3698 11.2 103 12.9 11.3 107 6 4 5 840
14 1.264908 19.90 21.08 0.3836 11.3 60 10.8 11.1 57 6 7 7 753 "Carroty" grain. Brittle failure. 27 2.742936 20.54 21.01 0.4717 13.6 127 10.3 13.3 119 5 3 4 802 31 2.406299 20.40 20.83 0.4243 12.6 114 11.6 12.6 112 5 3 4 782 44 3.659554 20.30 20.90 0.6250 18.5 173 11.8 18.4 172 3 1 2 975 56 2.71211 20.34 20.89 0.4594 13.6 128 12.5 13.7 131 5 2 4 818 69 3.593025 20.49 20.91 0.6135 18.0 168 10.3 17.5 157 3 1 2 963 72 2.675084 20.56 20.76 0.4298 12.8 127 12.2 12.9 128 5 3 4 815 81 2.583114 20.50 20.80 0.4464 13.3 122 10.6 13.0 115 5 3 4 900 91 3.002272 20.64 20.80 0.5117 15.1 141 10.6 14.8 133 4 2 3 920
Mean 2.68 0.4735 14.0 126 11.4 13.9 123 5 3 4 857 White (55 cm) 8 2.669489 20.64 20.73 0.4498 13.4 126 10.6 13.1 119 5 3 4 823
15 3.295434 20.94 20.65 0.5700 17.0 155 13.9 81 5 5 5 896 25 2.31908 20.61 20.75 0.3958 11.8 110 10.8 11.6 104 6 4 5 750 33 2.742593 20.37 20.83 0.4688 14.0 130 10.7 13.7 123 5 3 4 807 43 1.86075 20.52 20.74 0.4386 13.1 89 10.3 12.8 83 5 5 5 804 55 3.097045 20.11 20.89 0.5573 16.7 148 10.8 16.4 141 3 2 3 979 73 2.171703 20.46 20.29 0.4139 13.3 108 11.4 13.2 106 5 4 5 845 86 3.762443 20.45 20.58 0.6231 19.2 182 10.3 18.7 170 2 1 2 978 92 2.624671 20.46 20.74 0.4637 13.9 125 10.7 13.7 119 5 3 4 853
Mean 2.73 0.4868 14.7 130 10.7 14.1 116 4 3 4 840 Mean 14.6 127 4 3 4
Overall Std Dev 2.5 26.7
*MOE adjusted to 12% MC at 1.5% per 1%MC; MOR adjusted at 4% per 1%MC as per AS 2878 Table 2.13. Jarrah strength testing results summary - measurements by Timber Research Unit, University of Tasmania

40
No 1st test kN 2nd test kN Mean kN MC % Orientation Yellow (25 cm) 3 11.015 10.767 10.9 10.4 Tangential
15 8.677 8.277 8.5 11.1 Tangential 28 8.144 7.468 7.8 11.3 Tangential 32 6.569 7.452 7.0 10.3 Tangential 45 5.800 6.796 6.3 9.7 Radial 53 6.022 7.692 6.9 10.8 Radial 64 9.606 8.035 8.8 9.6 Radial 75 7.036 7.251 7.1 10.5 Tangential 84 8.503 10.427 9.5 9.3 Tangential 84(2) 11.467 10.794 11.1 10.4 Tangential Mean 8.390 Std Dev 1.7 10.3 Mean
Red (40 cm) 7 7.710 8.344 8.0 12.4 Tangential 14 8.840 8.521 8.7 10.7 Radial 18 9.693 8.970 9.3 10.6 Radial 27 7.409 8.276 7.8 10.3 Tangential 31 7.972 7.782 7.9 10.5 Tangential 44 12.112 10.375 11.2 10.5 Tangential 56 8.374 8.216 8.3 11.2 Tangential 69 8.626 9.311 9.0 9.4 Tangential 72 8.241 8.053 8.1 10.7 Tangential 91 8.298 10.062 9.2 10.0 Tangential Mean 8.759 Std Dev 1.1 10.6 Mean
White (55 cm) 8 7.545 8.050 7.8 10.5 Tangential 15 9.434 8.626 9.0 10.5 Radial 25 6.589 5.664 6.1 10.4 Tangential 33 7.923 8.006 8.0 10.4 Tangential 43 7.976 7.833 7.9 9.6 Tangential 55 11.257 10.896 11.1 10.7 Tangential 68 7.714 8.662 8.2 9.6 Tangential 73 9.038 9.512 9.3 11.4 Tangential 86 10.869 11.593 11.2 9.7 Tangential 92 10.447 9.516 10.0 9.8 Tangential Mean 8.9 Std Dev 1.6 10.3 Mean Overall Mean 8.7 Std Dev 1.5 Radial Mean 7.5 Tangential Mean 8.8
“Radial” means hardness of a quartersawn face “Tangential” means hardness of a tangentially sawn (backsawn) face
Table 2.14. Jarrah Janka hardness testing results measurements by the Timber Research Unit, University of Tasmania

41
Plate 2.1. Typical regrowth jarrah
Plate 2.2. 4-sided planing
2.5. Analysis
2.5.1. Heartwood proportion There was a significant difference (ANOVA) between heartwood proportion in the three groups, except when comparing 25 and 40 cm groups. Heartwood proportion was higher in larger logs.
2.5.2. Green timber properties There was a significant difference (ANOVA) between initial moisture content in the three groups, except when comparing 25 and 40 cm groups. Initial MC was lower in larger logs.
There was a significant difference (on ranks) between basic density in the smallest and largest log groups only, with higher density in the larger logs.
There was no significant difference in tangential unconfined shrinkage at 10% MC between groups.
2.5.3. Drying There was no noticeable difference in drying rate between the three groups.
2.5.4. Dry evaluation Shrinkages in thickness and width were not measured prior to machining.
There was no trend with board size of dry endsplit, although the nature of this data makes analysis problematic (most boards have no endsplit, so distribution is non-normal).
2.5.5. Strength There was no significant difference between groups for either MOE or MOR. Summary results and comparison with published data for mature jarrah are shown in Table 2.15.
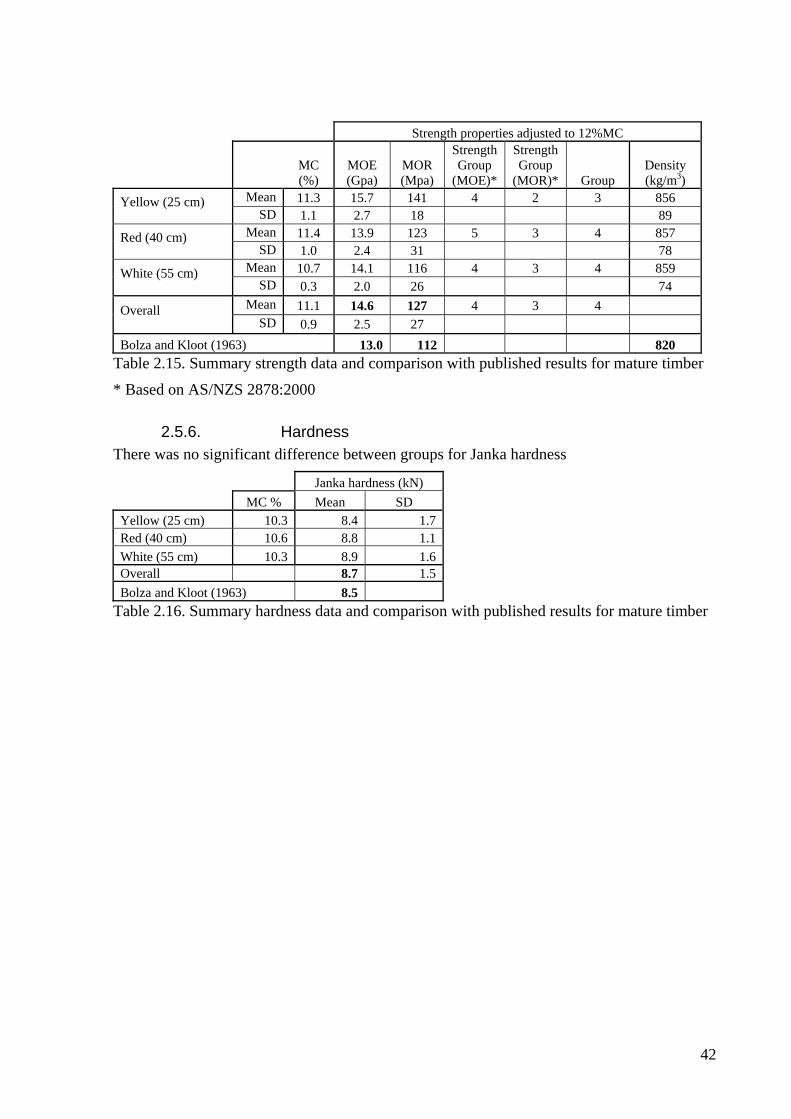
42
Strength properties adjusted to 12%MC
MC (%)
MOE (Gpa)
MOR (Mpa)
Strength Group
(MOE)*
Strength Group
(MOR)* Group Density (kg/m3)
Mean 11.3 15.7 141 4 2 3 856 Yellow (25 cm) SD 1.1 2.7 18 89
Mean 11.4 13.9 123 5 3 4 857 Red (40 cm) SD 1.0 2.4 31 78
Mean 10.7 14.1 116 4 3 4 859 White (55 cm) SD 0.3 2.0 26 74
Mean 11.1 14.6 127 4 3 4 Overall SD 0.9 2.5 27
Bolza and Kloot (1963) 13.0 112 820 Table 2.15. Summary strength data and comparison with published results for mature timber
* Based on AS/NZS 2878:2000
2.5.6. Hardness There was no significant difference between groups for Janka hardness
Janka hardness (kN) MC % Mean SD Yellow (25 cm) 10.3 8.4 1.7Red (40 cm) 10.6 8.8 1.1White (55 cm) 10.3 8.9 1.6Overall 8.7 1.5Bolza and Kloot (1963) 8.5
Table 2.16. Summary hardness data and comparison with published results for mature timber
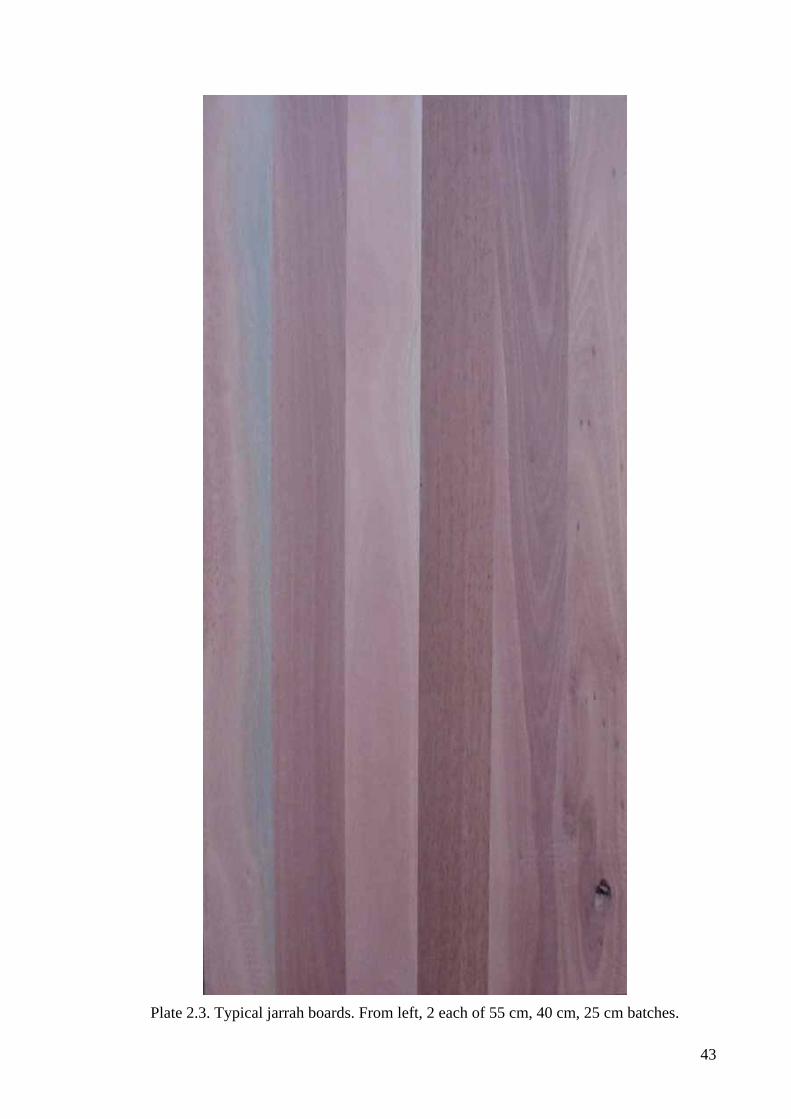
43
Plate 2.3. Typical jarrah boards. From left, 2 each of 55 cm, 40 cm, 25 cm batches.

44
Plate 2.4. Typical jarrah boards. From left, 2 each of 55 cm, 40 cm, 25 cm batches.
45
3. Queensland regrowth spotted gum (Corymbia citriodora) Matt Armstrong
Horticulture and Forestry Sciences
Department of Primary Industries and Fisheries, Queensland Government.
3.1. Methodology
3.1.1. Site Thirty-three trees were selected from a current sale area of Allies Creek State Forest (S26 06 249 E151 05 141), 90 km north-west of Kingaroy, Queensland. The logs were milled at Queensland Sawmills Pty Ltd, Allies Creek (Plates 3.1, 3.2).
3.1.2. Tree selection As Queensland’s regrowth hardwood forests are generally not made up of even-aged stands, tree selection for the Queensland component of the project was based on diameter class. Three distinct diameter classes were selected: 45-40 cm, 35-30 cm and 25-20 cm DBHOB. These diameter classes respectively represent: the majority of the current cut, trees that will increasingly make up a larger proportion of the cut, and the type of tree that may have to be harvested to sustain current log yields.
Crown assessment, using the Grimes technique (Grimes 1978), was utilised for the identification of suitable study trees. The Grimes technique was developed as a simple crown assessment method for use in spotted gum – ironbark forests. The technique uses five crown factors to assess a tree’s ‘vigour’. They are:
– Crown position, scored out of 5;
– Crown size, scored out of 5;
– Crown density, scored out of 9;
– Dead branches, scored out of 5;
– Epicormic growth, scored out of 3 (with ½ increments).
Each of the factors are first scored independently and then totalled. In past research (Grimes 1978), regression analysis has indicated that all these factors are correlated with diameter increment. Total crown scores can be used to predict Diameter: Mean Annual Increment (d.m.a.i), using the equation:
d.m.a.i. = 0.5861 – 0.09103t + 0.004170 t2 (R2 = 0.8309), where t = total score
To classify the tree’s growth based on general qualitative groupings, Grimes (1978) assigned total crown scores to the following groupings:
• Less than 12 points - Very poor d.m.a.i.
• 12 – 15.9 - Poor
• 16 – 19.9 - Average
• 20 – 23.9 - Good
• 24 – 27 - Excellent

46
While this system was designed to assess current standing trees and predict future increments, it is possible to use the system to make generalisations about past growth rates. It can be assumed that trees of similar diameter and total crown score have had similar growth rates and are therefore of a similar age, and that trees fitting into distinctly different diameter classes with similar total crown scores (as in this study) are distinctly younger or older. It is for this purpose that the Grimes crown assessment method has been used in this study, that is, to ensure that the trees within each diameter class are of a similar age, and that between groups, the trees are of a distinctly different enough age to allow data comparison with the greater national data set. The assessments were also made to ensure that trees of similar vigour and growth habit were selected. For this study only dominant and co-dominant trees were selected. Suppressed, slow growing trees, and bendy trees were excluded due to the possibility that such trees could have properties uncharacteristic of the species.
All of the study trees were selected from a current sale area within Allies Creek State Forest. Ten trees from each of the diameter classes were selected. A further three trees were selected from the 25-20 cm diameter class group, to ensure that 100 boards from each group would be produced. Each tree was marked and assessed for Grimes score, DBHOB (cm) and total height (m).
3.1.3. Harvesting Upon felling each tree was assessed for pipe, bend, spiral grain and other potential defects in accordance with the allowable defects detailed in Table 3.1. Also measured were total tree height, height to 30cm underbark diameter (UB) & 20 cm UB and the worst face split and log split, on the large-end log face.
The selected trees were snigged prior to the commercial harvest of the sale area. Each tree that was assessed as a suitable study tree had a batch and tree number scribed onto the large-end log face, along with a bush number and the merchandised log centre diameter. To avoid leaving suitable logs in the forest, the trees were merchandised in the bush to a variety of lengths depending on form and diameter, with a minimum set at 3.8 m (Bush logs).
Logs were left with the bark on and stored in the mill’s log yard for two weeks before processing. Water sprays are not commonly used in Queensland and were therefore not used in this instance.
Size Class (cm)
Pipe – max. (cm)
Allowable bend – max.
Spiral grain – max.
Non-pipe defect including limbs – max.
(% of circumference)
20-25 0 1:10 1 in 8 20
30-35 2 1:7 1 in 8 25
40-45 5 1:5 1 in 8 30
Table 3.1: Allowable limits for log defect
3.1.4. Pre-processing measurements Eighteen hours prior to processing, end-splitting was re-measured on the large-end log face, before each bush log was merchandised into a 3.8 m butt log (study log), and an extra log (which had no further part in the study). From the 3.8 m butt log a disc was removed from each end to produce a 3.6 m study log. All discs were numbered with the tree number and either a B or T for Butt end or Top end, respectively. Each log was not re-numbered but colour-coded by painting both log ends with either: Blue for the 25-20 cm batch; Red for the

47
35-30 cm batch; or Green for the 45-40 cm batch. Each log was then sorted into their respective batches for processing (Plates 3.1 and 3.2). Immediately before processing, log-end splitting was measured on the small-end log face.
3.1.5. Processing Sawing took place on a Saturday when the mill was not commercially operating; the logs were processed batch by batch. All logs were sawn predominately into either 100 x 25 or 75 x 25 mm boards (nominal), with a small amount of 50 x 25 mm material to reduce waste. The logs were initially broken down on a Canadian ‘single-saw line-bar carriage system’ and then sent to a ‘one-man single-saw line-bar’ resaw bench before going past a docking saw. Boards were only docked for severe wane or want or for any other defect that compromised the structural integrity of the board, which could have posed a risk to machinery or staff.
Similar sawing patterns were used for the 45-40 cm & 35-30 cm batches. On the break-down saw the log was continuously rotated, removing a flitch and/or slab each side of the log until a nominal 100 mm sized cant was produced. All logs from these batches were taper sawn using the line-bar. The flitches, slabs and tapered cant were re-sawn on the bench. The objective of this sawing pattern was to remove, in full lengths, the maximum amount of good wood from the outer zones of the logs.
Logs from the smallest diameter class (25-20 cm) were sawn using an alternative sawing pattern due to their size. Figure 3.1 represents the sawing pattern used. Saw cuts 1 & 2 were done on the break-down saw. Both cuts were put in parallel to the pith, with saw cut 2 being approximately 50 mm or 37.5 mm off the pith. The resultant cant was then sent to the bench where saw-cut 3 was put in, parallel to the pith, to create a sized cant of either 100 or 75 mm width. The cant was then sawn through from the round-back for the first couple of passes and then later from the alternate sawn face, as it was easier to put the sawn face against the fence. The cant was sawn through and through, i.e. not taper sawn.
Figure 3. 1. Sawing pattern used for the small diameter logs (25 – 20 cm class).
1
2 3

48
3.1.6. Racking Prior to racking each board was tallied and assessed for:
• Length (m);
• Width and Thickness (mm) – measured in approximately the middle of the board using vernier callipers;
• End-splits (mm) – length of the longest split was measured at both ends (‘numbered’ and ‘other’), end-split on pith boards was not assessed due to the confounding factor of heartshake;
• Bow (mm) - if greater than 10mm (bow less than 10 mm is well within the limitations set by Australian Standards);
• Surface checking (length of board downgraded) – measured on the top (inner) and bottom (outer) surface.
Only 100 boards from each batch required the full assessment, however to avoid bias in batches where the number of boards was well in excess of 100, all boards were assessed and then 100 were randomly selected for inclusion in the study and analysis. Board number, from 1-100 for each batch, was scribed onto each board during racking. Spring was not measured as boards were backsawn, so any spring was minimal and within the allowances of Australian Standards.
Boards from each batch were racked out separately. Within a batch, the 100 and 75 mm boards were sorted prior to racking to minimise handling when the boards were machined.
3.1.7. Sample boards Five sample boards were used per pack. Ten sample boards would have been preferred, however due to the design of the kilns only one side of the pack is accessible during drying. The five sample boards were located as indicated in Figure 3.2. Each sample board was approximately 350 mm long, colour coded and numbered.
Figure 3.2: Positioning of Sample Boards within a pack.
An additional 100 mm sample, adjacent to the sample board, was also cut, colour coded, numbered and wrapped in plastic for later assessment of basic density and unconfined shrinkage. A further 15 100 mm samples were cut from randomly selected boards for later assessment of basic density.
3.1.8. Treatment Each pack of timber was then vacuum-pressure treated with CCA preservative formulation to H3 in accordance with the Timber Utilisation and Marketing Act (TUMA). After treatment all sample boards were removed from the pack and had a 25mm section removed from either end for green MC calculation. They were then weighed, end-sealed and placed back in the rack.

49
All boards were then end-sealed with a clear wax emulsion to slow drying and reduce drying related defects.
3.1.9. Drying schedule Following air drying, the pack was placed in a gas assisted solar kiln. Two MC probe were inserted into the boards within the pack to monitor MC (kiln probe No 5 & 6). Sample boards were regularly weighed and measured during drying to monitor moisture loss and associated board shrinkage.
3.1.10. Grading After drying the boards were dressed to either 82x19mm T&G flooring or 65x19mm DAR decking. Sawmill employees graded the dressed boards on site to Australian Standard AS 2796-1999 Timber-Hardwood-Sawn and milled products, using a minimum grade length of 0.9m. Grade lengths were demarcated on each board by the use of crayon marks, using a similar code to that used for automatic docking saws. The boards were then stacked and sent to the Department of Primary Industries and Fisheries Salisbury Research Centre. At the Salisbury Research Centre each board’s graded length and reason for downgrade were recorded, along with end-split (both ends), distortion (Spring & Bow >10mm and Twist), length degraded by surface checking and length degraded by skip.
3.1.11. Mechanical properties Twenty five small clears were tested for MoE and MoR in accordance with the Mack Australian Method (Mack, J.J. 1979) which is based on BS 373:1957 – Methods of Testing Small Clear Specimens of Timber.
Ten samples were tested for Janka hardness in accordance with the Mack Australian Method (Mack, J.J. 1979) which is based on BS 373:1957 – Methods of Testing Small Clear Specimens of Timber.
3.1.12. Moisture content, density & heartwood proportion From each batch of boards twenty samples were assessed for basic density and moisture content. Basic density was measured using the volume displacement method. Further to this, basic density was also assessed on samples cut from discs. A disc was taken from the top and bottom of each log. The heartwood/sapwood proportions were then measured at two locations on each disc. Two diametrically opposed wedges were cut from each disc, with each wedge being cut into a sapwood section and three heartwood sections of equal length. The basic density of each section was assessed using the volume displacement method. The heartwood sections were labelled H1 (outer heartwood section), H2 (middle heartwood section) and H3 (inner heartwood section).
3.2. Results
3.2.1. Tree selection In total 33 trees were selected. Upon felling no tree was assessed as unsuitable. Excessive pipe is not uncommon in typical spotted gum resource, however the fact that each selected tree was of vigorous growth and form would most likely indicate that the trees were not of sufficient age to have developed excessive pipe.

50
Grimes scores, as presented in Table 3.2, show that the average total crown score was 19, which represents ‘average’ bordering on ‘good’ growth. Overall there was no significant difference (p=0.01) in total Grimes scores between the batches, indicating similar vigour and growth habit.
Individual Grimes
Assessments
Batch DBHOB
(cm) Total Tree Height (m) CP CS CD DB E Total Grimes Score
32.4 25.5 4.0 3.8 5.0 3.8 2.5 19.1 Mean 20.8 20.1 3.0 3.0 4.0 2.0 2.0 15.0 Min. All
45.8 33.0 5.0 4.0 6.0 4.0 3.0 20.5 Max. 22.9 23.5 3.7 3.6 5.2 3.8 2.5 18.8 Mean 20.8 21.3 3.0 3.0 5.0 3.0 2.0 17.0 Min.
20-25 (13 trees)
25.0 28.9 4.0 4.0 6.0 4.0 2.5 20.5 Max. 32.0 24.6 4.0 3.9 4.9 4.0 2.6 19.4 Mean 30.5 20.1 3.0 3.0 4.0 4.0 2.5 18.0 Min.
30-35 (10 trees)
34.7 27.6 5.0 4.0 6.0 4.0 3.0 20.5 Max. 42.4 28.3 4.2 3.8 4.9 3.7 2.5 19.1 Mean 40.0 22.2 4.0 3.0 4.0 2.0 2.0 15.0 Min.
40-45 (10 trees)
45.8 33.0 5.0 4.0 6.0 4.0 2.5 20.5 Max. Table 3.2: Grimes Assessment Scores
3.2.2. Log data Table 3.3 summarises the data for the bush logs.
Height (m) to (including stump) Diameter u.b.(mm) at:
Batch Full log length (m) 30cm ub 20cm ub large end mid small Vol (m3)
20-25 5.0 na 2.6 223 200 166 0.155 30-35 5.6 1.3 8.8 293 258 232 0.306 40-45 7.8 7.7 17.4 400 345 300 0.742
All 6.1 4.5 9.6 305 268 233 0.401 Note: volume was calculated using Newton’s formula; length value was rounded down to 0.1 m intervals in volume calculations.
Table 3.3: ‘Bush Log’ Data – Mean values
Study log data are summarised in Table 3.4. Whilst the mean large end diameter for the 20-25 cm diameter class batch of logs was within the targeted values, the mean large end diameters for the next two batches was slightly under the targeted values. This is most likely due to the disparity between over-bark and under-bark measurements. The logs in each batch are still distinctly different enough, based on diameter and log volume, to meet the project’s objectives.

51
Diameter UB(mm) at:
(3.6m log) Batch Large end Small
Vol (m3)
20-25 224 188 0.123 30-35 291 245 0.206 40-45 398 338 0.389
All 304 257 0.239 Note: volume was calculated using Smalian’s formula; length value was rounded down to 0.1 m intervals in volume calculations
Table 3.4: ‘Study Log’ Data – Mean values
Mean end-split data for each batch are summarised in Table 3.5. Due to the differing mean log diameters in each class, the severity of the log face end-splits can be difficult to determine when looking at the raw data. By calculating the proportional length of the mean log face end-split to the mean log face radius, expressed as a percentage of radius (Table 3.6), for each batch, it can be seen that there was a trend of worsening (longer) splits with increasing diameter. A similar trend was found for log splitting up the log bole (Table 3.5).
End - splits (mm) - large end End - splits (mm) - small end felling Batch
log face up log log face up log log face up log 20-25 4 0 78 108 18 142 30-35 3 0 111 132 24 146 40-45 5 0 180 171 36 113
All 4 0 123 137 26 133
Table 3.5: Mean Log End-split Data – Mean values
Batch Large end (%)
Small end (%)
20-25 70 19 30-35 76 20 40-45 90 21
Table 3.6: Proportional length of the log face end-splits measured on the logs just prior to processing
3.2.3. Green-off-saw (GOS) tally and recovery Green-off-saw (GOS) recovery was calculated for each batch by dividing the tallied sawn volume (based on nominal dimensions and with restricted docking as described in section 3.3.5) by log volume. The smallest diameter class batch of logs, 20-25 cm, had the highest GOS recovery of 39%. This is contrary to anecdotal evidence and empirical data from several previous hardwood sawing studies which showed that small diameter logs generally result in lower GOS recovery. The next two batches produced GOS recoveries of 33%. One explanation for the variation in GOS recovery across the batches may be that the alternate sawing pattern used for the logs in the 20-25cm batch resulted in less waste. This may

52
indicate that sawing parallel to the pith results in higher GOS recovery, however, parallel sawing maximises the number of boards being produced from the inner heartwood zone, where the greatest amount of defect normally occurs.
05
1015202530354045
20-25 30-35 40-45
Group (cm)
Gre
en o
ff sa
w re
cove
ry (%
)
Figure 3.3: Green off saw recovery
3.2.4. Green board assessment Between the batches there were no significant differences in length, width, thickness or end-split. However the boards from the 20-25 cm batch had significantly more bow (p=0.05) than the other two batches. As the occurrence of bow is often linked to growth stress (Armstrong 1999), this may indicate that the smaller diameter logs have higher levels of growth stress. Bow is more tolerable than spring for milled products.
Surface checking occurred predominately in boards from the 20-25 cm batch and only on the outer backsawn surface (ie surface on bark side). These results indicate that surface checking could potentially become an issue of increasing significance to industry as it shifts towards a smaller diameter resource.
Batch Boards Length (m)
Width (mm)
Thickness (mm)
End split numbered end (mm)
End split other end
(mm)
Bow >10mm (mm)
Surface check - Outer
surface (m)
Surface check - Inner
surface
Mean - 3.5 103.9 80.1 28.3 16 13 13 0.1 0 20-25
Count 94 - - - 22 20 50 10
Mean - 3.4 103.9 80 28.1 9 5 6 0.0 0 30-35
Count 96 - - - 15 12 37 1 0
Mean - 3.5 102.8 79.1 28.2 10 12 7 0.0 0 40-45
Count 100 - - - 23 20 45 0 0
Mean - 3.5 103.5 79.7 28.2 11.7 10.1 8.8 0.1 0 All
Count 290 60 52 132 11 0 Table 3.7: Green Board Assessment Data. Mean thickness separated for two widths sawn, nominally 100 and 75mm.
Even though there were no significant differences in width or thickness between the groups it is still worth assessing the data. Figures 3.4 to 3.7 show the frequency with which boards from

53
each batch were sawn to a specific dimension. It can be seen that boards from the 20-25 cm batch (Blue) were consistently sawn to wider and thicker dimensions than boards from the 30-35 cm batch (Red) and 40-45 cm batch (Green). This may indicate sizing and handling difficulties with the smaller logs. Besides the actual dimension of the logs in this size class, another contributing factor may have been the significantly higher levels of distortion (found in the boards from this batch) or the different sawing pattern. These factors could potentially have a negative effect on the productivity level of mills cutting smaller dimensioned logs, which are not specifically set up to handle the smaller resource.
0%10%20%30%40%50%60%
102
103
104
105
More
mm
20-25
30-35
40-450%
20%40%60%80%
76 77 78 79 80 81 82More
mm
20-25
30-35
40-45
Figure 3.4. Width variation, 100mm boards Figure 3.5. Width variation, 75mm boards
0%10%20%30%40%50%
26 27 28 29 30 31 32More
mm
20-25
30-35
40-450%
10%20%30%40%50%
26 27 28 29 30 31 32More
mm
20-25
30-35
40-45
Figure 3.6. Thickness variation, 100mm boards Figure 3.7. Thickness variation, 75mm boards
3.2.5. Drying The processed green boards were air-dried for 30 days under cover prior to being put into the gas-assisted solar kiln. The average moisture content of the boards upon entering the kiln was 19.5% as calculated using the sample boards, or 30.5% as measured using the kiln’s MC probes. As the standard deviation of the MC of the sample boards was only 1.8%, it would appear that the kiln’s probes might not be accurate at relatively high MCs. The boards were dried in the kiln for a further 23 days with a final average MC of 11.3%. It should be noted that as the boards continued to lose moisture the difference between the average MC reading from the kiln’s probes and the average MC of the sample boards narrowed until both were at 11.3% when the timber was removed from the kiln (Figure 3.8). Between batches there was a small amount of variation in MC both prior to and after kiln drying. The boards from the 20-25 batch had the lowest initial and final moisture contents of 17.4% and 10.4% respectively. Batches 30-35 and 40-45 dried down to a similar final MC of approximately 11.5% (Table 3.8).

54
Mean MC during kiln drying
0.0
5.0
10.0
15.0
20.0
25.0
30.0
35.0
21/04/
2004
23/04/
2004
25/04/
2004
27/04/
2004
29/04/
2004
01/05/
2004
03/05/
2004
05/05/
2004
07/05/
2004
09/05/
2004
11/05/
2004
13/05/
2004
MC Kiln's probes 5+6
MC sample boards
Figure 3.8. Mean moisture content loss during kiln drying – All batches
Batch 21/04/2004 26/04/2004 3/05/2004 10/05/2004 14/05/2004 20-25 17.4% 14.5% 12.6% 11.2% 10.4% 30-35 21.2% 15.3% 14.3% 12.5% 11.6% 40-45 19.6% 16.9% 14.3% 12.6% 11.8% Table 3.8: Mean moisture content loss during kiln drying – Separate batches
The mean dimensional change in the width and thickness of the sample boards during kiln drying is presented in Figure 3.9. It should be noted that as the sample boards were a combination of 100 and 75mm wide boards the means appears as a nominal figure only.
87.00
88.00
89.00
90.00
91.00
92.00
93.00
21/04
/2004
26/04
/2004
03/05
/2004
10/05
/2004
14/05
/2004
Wid
th (m
m)
26.8027.0027.2027.4027.6027.8028.0028.2028.4028.60
Thic
knes
s (m
m)
ThicknessWidth
Figure 3.9: Width & thickness of all sample boards during kiln drying
Figures 3.10 and 3.11 present the data for thickness measurements alone. No clear trend can be seen between batches.

55
25.0025.5026.0026.5027.0027.5028.0028.5029.0029.50
21/4 26/4 3/5 10/5 14/5
20-2530-3540-45
-0.6
-0.5
-0.4
-0.3
-0.2
-0.1
0.0
26/4 3/5 10/5 14/5
20-25
30-35
40-45
Figure 3.10 Thickness of sample boards Figure 3.11: Change in thickness
3.2.6. Recovery
Overall, the sawn recovery (proportion of green off saw material making grade to Australian Standard AS 2796-1999 Timber-Hardwood-Sawn and milled products) was relatively high, with recoveries of 87.3%, 84.8% and 91.6% for batches 20-25, 30-35 and 40-45 respectively (Figure 3.12). By grade, batch 20-25 had a proportionally lower volume of select grade boards and a higher proportion of High Feature grade boards when compared to the two other batches (made up of larger diameter logs – see Figure 3.13). Whilst the trees from the 20-25 batch produced a similar volume of GOS material, the lower proportion of boards meeting the grade requirements for select grade would significantly devalue the timber sawn from this batch of logs. Conversely, Batch 30-35 had the highest recovery of select grade boards while having the lowest GOS recovery.
0.0%10.0%20.0%30.0%40.0%50.0%60.0%70.0%80.0%90.0%
100.0%
20-25 30-35 40-45
Figure 3.12: Sawn recovery by batch to AS 2796-1999
18.5%
75.2%
18.3%
6.4%
25.3%
5.4%
50.9%
30.6%
69.3%
0%
20%
40%
60%
80%
Select Medium Feature High feature
Proportion of total sawn volume in grade
20-2530-3540-45
Figure 3.13: Recovery – Grade by batch
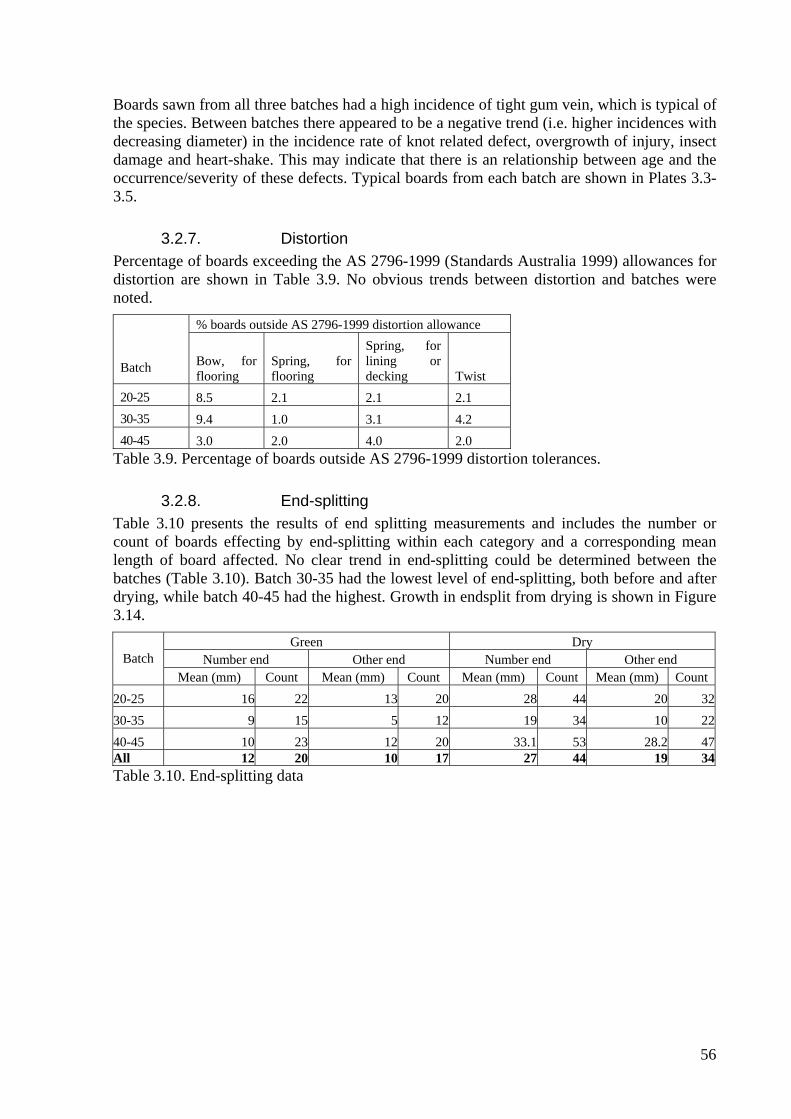
56
Boards sawn from all three batches had a high incidence of tight gum vein, which is typical of the species. Between batches there appeared to be a negative trend (i.e. higher incidences with decreasing diameter) in the incidence rate of knot related defect, overgrowth of injury, insect damage and heart-shake. This may indicate that there is an relationship between age and the occurrence/severity of these defects. Typical boards from each batch are shown in Plates 3.3-3.5.
3.2.7. Distortion Percentage of boards exceeding the AS 2796-1999 (Standards Australia 1999) allowances for distortion are shown in Table 3.9. No obvious trends between distortion and batches were noted.
% boards outside AS 2796-1999 distortion allowance
Batch Bow, for flooring
Spring, for flooring
Spring, for lining or decking Twist
20-25 8.5 2.1 2.1 2.1 30-35 9.4 1.0 3.1 4.2 40-45 3.0 2.0 4.0 2.0
Table 3.9. Percentage of boards outside AS 2796-1999 distortion tolerances.
3.2.8. End-splitting Table 3.10 presents the results of end splitting measurements and includes the number or count of boards effecting by end-splitting within each category and a corresponding mean length of board affected. No clear trend in end-splitting could be determined between the batches (Table 3.10). Batch 30-35 had the lowest level of end-splitting, both before and after drying, while batch 40-45 had the highest. Growth in endsplit from drying is shown in Figure 3.14.
Green Dry Number end Other end Number end Other end Batch
Mean (mm) Count Mean (mm) Count Mean (mm) Count Mean (mm) Count 20-25 16 22 13 20 28 44 20 3230-35 9 15 5 12 19 34 10 2240-45 10 23 12 20 33.1 53 28.2 47All 12 20 10 17 27 44 19 34Table 3.10. End-splitting data
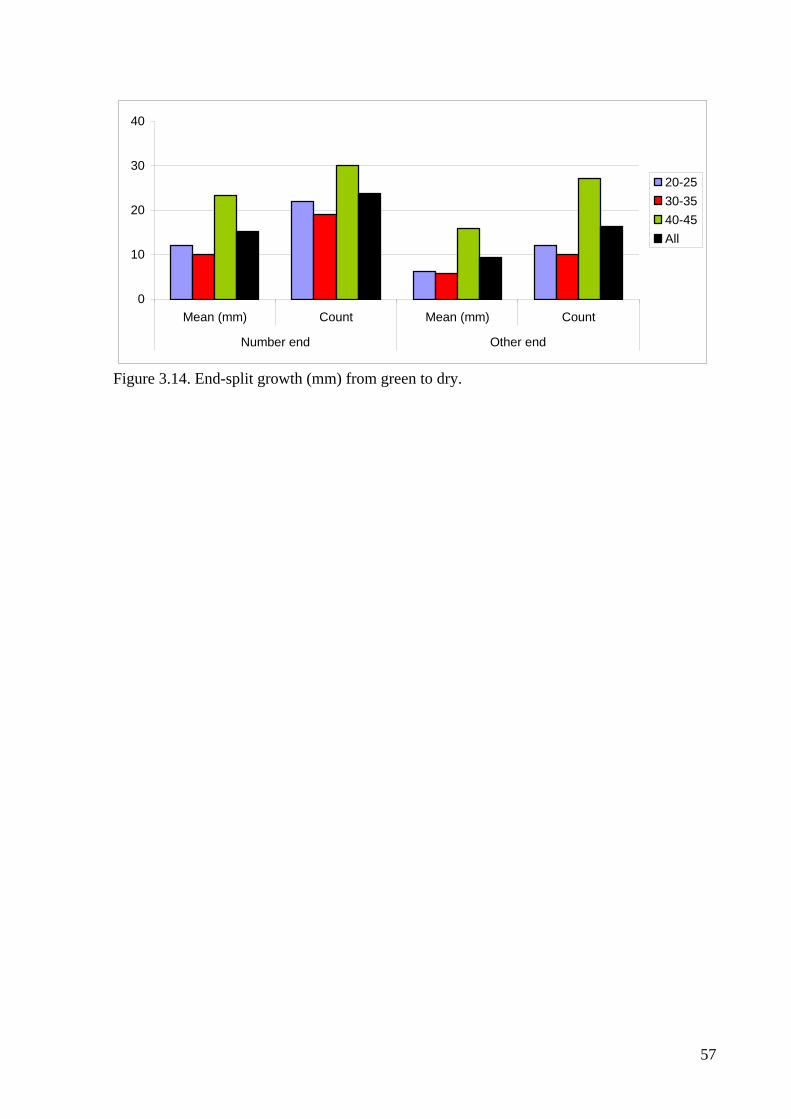
57
0
10
20
30
40
Mean (mm) Count Mean (mm) Count
Number end Other end
20-2530-3540-45All
Figure 3.14. End-split growth (mm) from green to dry.
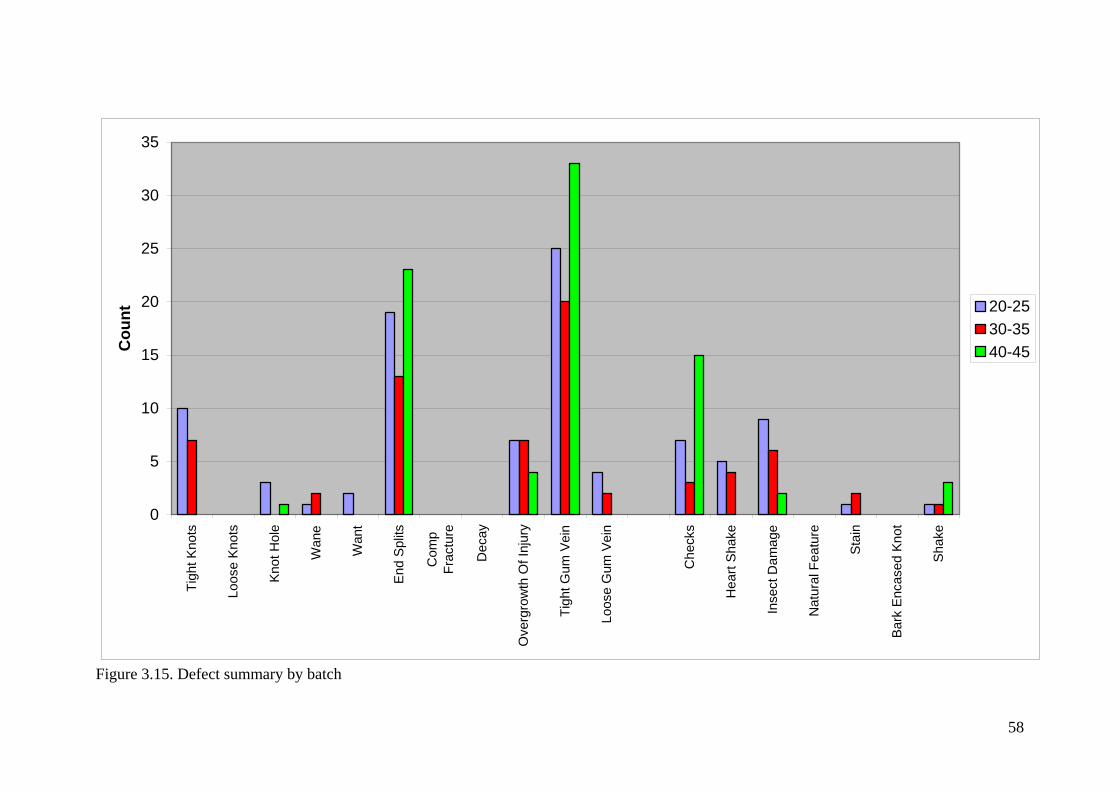
58
0
5
10
15
20
25
30
35
Tigh
t Kno
ts
Loos
e Kn
ots
Knot
Hol
e
Wan
e
Wan
t
End
Split
s
Com
pFr
actu
re
Dec
ay
Ove
rgro
wth
Of I
njur
y
Tigh
t Gum
Vei
n
Loos
e G
um V
ein
Che
cks
Hea
rt S
hake
Inse
ct D
amag
e
Nat
ural
Fea
ture
Stai
n
Bark
Enc
ased
Kno
t
Shak
e
Cou
nt 20-2530-3540-45
Figure 3.15. Defect summary by batch

59
3.2.9. Surface checking No clear trend in surface checking could be determined between the batches (Table 3.11). Batch 20-25 had the highest level of surface checking when green, while batch 40-45 went from not having any surface checking in the green state to having the highest level after drying and dressing. Growth in surface checking from drying is shown in Figure 3.16.
Green Dry Top Surface Other Surface Top Surface Other Surface Batch
Mean (cm) Count Mean (cm) Count Mean (cm) Count Mean (cm) Count20-25 14.89 10 0.00 0 25.74 19 15.53 1330-35 1.56 1 0.00 0 11.72 14 10.10 1040-45 0.00 0 0.00 0 42.40 26 47.10 28All 0.05 4 0.00 0 26.62 20 24.25 17Table 3.11: Surface checking data
05
101520253035404550
Mean (cm) Count Mean (cm) Count
Top Surface Other Surface
20-2530-3540-45All
Figure 3.16. Change in length of board degraded by Surface Checking from green to dry
3.2.10. Skip Similarly to end-splitting and surface checking, batch 30-35 had the lowest level of skip after dressing (Table 3.12).
Dry Top Surface Other Surface
Batch Mean (cm) Count Mean (cm) Count 20-25 3.30 14 3.30 12 30-35 3.07 11 2.86 10 40-45 4.15 8 4.18 14 All 3.51 11 3.45 12 Table 3.12: Length of board degraded by skip
Overall, the boards sawn from the logs of batch 30-35 had the highest recovery of select grade material and the lowest level of negative attributes such as end-split, surface checking and skip. Boards sawn from the logs of Batch 40-45 had the highest levels of negative attributes, however the batch still produced a reasonable proportion of select grade material. The boards

60
sawn from the smallest diameter batch of logs, batch 20-25, had a good GOS recovery, however only a low proportion of the boards made select grade due to higher incidences of knots, heart shake and insect damage. The boards also had relatively high levels of combined end-splits, indicating that the material may have had relatively high levels of internal stresses that were released during processing.
3.2.11. Mechanical properties Bending tests on small clears indicated that the samples from each batch were strength group SD2. As can be seen from the MOE and MOR means presented in Table 3.13 (complete results in Table 3.19), there was a trend of decreasing MOE and MOR with increasing diameter, however the differences between the groups did not prove significant (p=0.05).
Batch MOE (Gpa) MOR (Mpa) 20-25 21.3 187.1 30-35 20.8 185.0 40-45 20.6 180.3
Bolza and Kloot (1963) 18.8 142 Table 3.13: Summary strength data and comparison with published values for mature material.
The Janka hardness tests (Table 3.14, 3.20) indicated that the samples from each batch were of a similar hardness with no significant difference between groups (p=0.05).
Batch Janka hardness (kN) 20-25 11.90 30-35 11.50 40-45 11.40
Bolza and Kloot (1963) 10.1 Table 3.14: Summary Janka hardness data and comparison with published values for mature material.
3.2.12. Moisture content, density and heartwood proportion. Table 3.15 presents the moisture content and density data assessed on the twenty samples cut from the boards of each batch. No trend between groups is evident.
batch MC Oven Dried Basic Density
20-25 36.37% 83130-35 35.83% 88240-45 35.91% 864Table 3.15: MC and Density data
Table 3.16 presents the disc basic density data. The data indicate that there is a positive trend between density and log diameter. Other trends that are evident are: decreasing density up the log, relatively lower sapwood density, and decreasing density towards the pith.
Sample Batch Butt discs Top discs Sap H1 (outer) H2 (middle) H3 (inner) Mean 20-25 843 804 796 890 848 760 823 30-35 853 818 796 894 868 782 835 40-45 854 825 773 902 880 804 840 Table 3.16: Basic density from discs
Table 3.17 presents the heartwood/sapwood proportion data. The data indicate a slight trend towards decreasing heartwood proportion with decreasing diameter.

61
Heartwood/sapwood proportion Butt disc Top Disc Average
Batch Heart Sap Heart Sap Heart Sap 20-25 74% 26% 74% 26% 74% 26% 30-35 76% 24% 73% 27% 74% 26% 40-45 80% 20% 78% 22% 79% 21% Table 3.17: Heartwood proportion
3.2.13. Unconfined shrinkage Unconfined shrinkage was measured on five slices in the radial and tangential directions. Fit points at FSP and EMC are shown in Table 3.21. Summary results and comparison with published data are shown in Table 3.18. Tangential shrinkage (shrinkage across the width of backsawn boards) and shrinkage ratio (tangential : radial shrinkage) were much higher than the published values for mature timber, indicating that this regrowth may be less stable in terms of both width and cupping when subjected to atmospheric changes in service.
Radial shrinkage @ EMC Tangential shrinkage @ EMC Class Mean % Std Dev Mean % Std Dev 20-25 3.5 1.2 8.9 0.3 30-35 4.3 1.5 8.7 1.4 40-45 4.7 1.3 9.1 0.3 Kingston and Risdon (1961) 4.3 6.1
Table 3.18: Unconfined shrinkage summary and comparison with published data.
Plate 3.1. Experimental logs
Plate 3.2. Queensland Sawmills

62
Report No: Date of Issue: Client: Modulus of Elasticity and Modulus of Rupture of Small, Clear Timber Samples in Bending to BS 373
(modified by JJ Mack 1979)
The results reported herein apply only to this sample of specimens as provided by client.
Testing Machine Defln Device Load Range (kN)
Upper Span (mm) Lower Span (mm)
Nom. Width (mm)
Nom. Th'ss (mm)
Amsler 9 5 280 20 20 Adjusted to 12% MC: Sample No. M.C. (%) Breadth (mm) Depth (mm) MOE (Gpa) MOR (Mpa) Adj MOE Adj MOR
B1 9 20.1 20.1 17.85 142.82 17.05 125.68 B10 9 20.1 20.0 22.73 194.52 21.70 171.18 B11 9 20.0 20.1 21.18 144.00 20.23 126.72 B12 10 20.1 20.2 20.70 201.44 20.08 185.32 B13 10 19.9 19.9 20.04 170.36 19.44 156.73 B14 10 20.0 20.0 20.87 190.81 20.24 175.55 B15 10 20.1 20.0 21.33 209.58 20.69 192.81 B16 10 20.1 20.1 21.18 202.03 20.55 185.86 B17 10 20.0 20.0 24.39 199.95 23.66 183.95 B18 10 20.1 20.1 21.76 204.29 21.11 187.94 B19 9 20.1 20.1 25.60 195.79 24.45 172.30 B2 10 19.8 19.9 23.14 190.44 22.45 175.21
B20 9 20.0 19.7 20.09 186.05 19.19 163.72 B21 10 20.1 20.2 20.21 205.44 19.60 189.01 B22 9 20.0 20.1 19.94 169.20 19.05 148.90 B23 9 20.0 19.9 24.30 212.33 23.21 186.85 B24 9 20.0 20.1 22.26 173.09 21.26 152.32

63
B25 10 20.0 20.1 19.37 166.45 18.79 153.14 B3 10 20.0 19.8 21.45 177.66 20.81 163.45 B4 10 19.9 20.0 18.75 181.83 18.19 167.29 B5 11 20.2 19.9 21.59 161.95 21.26 155.48 B6 9 20.1 20.1 20.64 203.37 19.71 178.97 B7 9 20.1 20.1 20.95 184.94 20.01 162.75 B8 9 20.1 20.1 20.11 209.78 19.21 184.61 B9 9 20.1 20.0 21.23 199.35 20.27 175.43 R1 10 20.1 20.1 22.34 222.80 21.67 204.98
R10 9 20.1 20.0 20.92 172.31 19.98 151.63 R11 10 20.0 20.1 21.72 210.19 21.07 193.38 R12 10 20.0 20.1 20.45 213.74 19.84 196.64 R13 9 20.1 20.1 19.70 176.45 18.82 155.28 R14 10 20.1 20.1 20.60 222.07 19.98 204.30 R15 10 20.1 20.1 22.87 202.73 22.18 186.51 R16 10 20.1 20.0 24.67 195.73 23.93 180.07 R17 10 20.0 20.1 23.79 220.50 23.08 202.86 R18 9 20.1 20.1 20.28 156.40 19.37 137.63 R19 10 19.8 19.9 21.65 211.47 21.00 194.55 R2 10 20.1 20.0 21.25 186.21 20.62 171.32
R20 9 20.1 20.1 22.21 177.04 21.21 155.79 R21 10 20.1 20.1 16.83 147.11 16.32 135.34 R22 11 20.0 19.9 20.45 179.58 20.15 172.39 R23 10 20.1 20.1 21.97 216.43 21.31 199.11 R24 11 20.1 20.1 17.27 160.09 17.02 153.69 R25 9 20.1 20.1 22.59 198.90 21.57 175.03 R3 10 20.1 20.1 22.47 216.53 21.79 199.21 R4 9 20.2 20.2 23.25 196.23 22.21 172.68 R5 9 20.1 20.1 23.90 186.06 22.82 163.73 R6 11 20.1 20.1 16.16 141.95 15.92 136.27 R7 8 20.1 20.2 16.64 120.19 15.64 112.98 R8 8 20.2 20.1 16.09 139.40 15.13 117.09 R9 9 20.0 19.9 21.09 154.07 20.14 135.58 G1 10 20.0 20.0 21.71 172.04 21.06 158.27
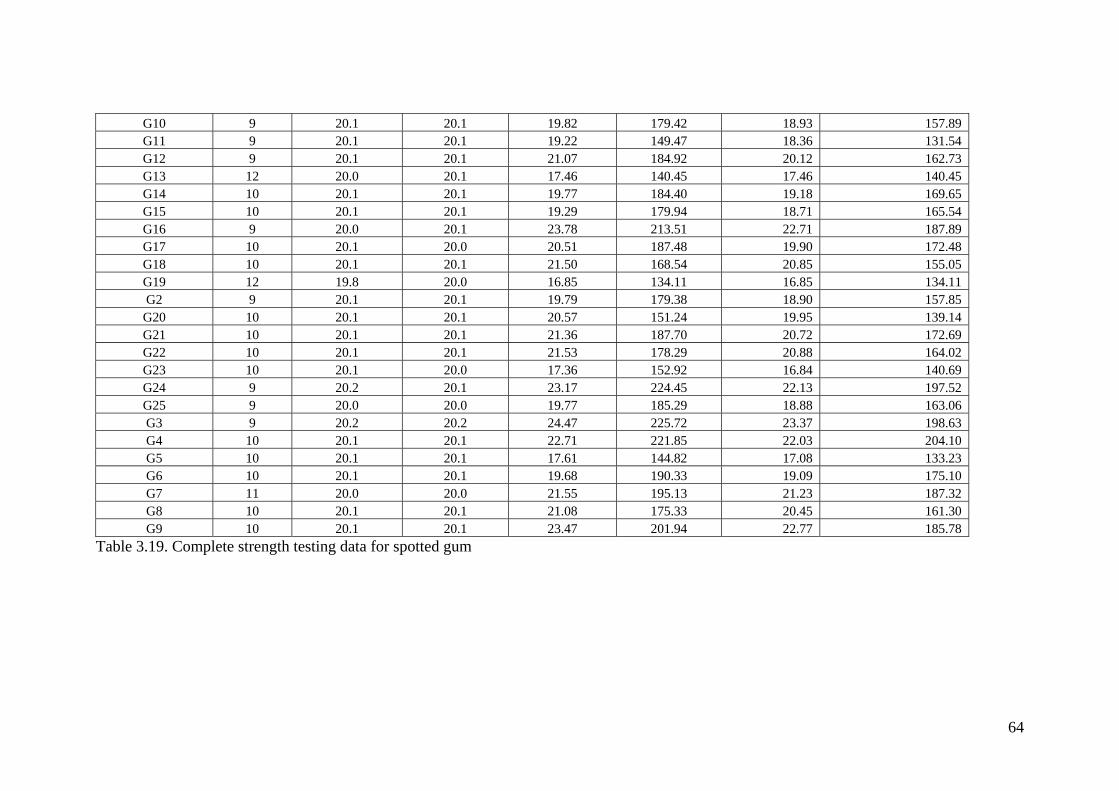
64
G10 9 20.1 20.1 19.82 179.42 18.93 157.89 G11 9 20.1 20.1 19.22 149.47 18.36 131.54 G12 9 20.1 20.1 21.07 184.92 20.12 162.73 G13 12 20.0 20.1 17.46 140.45 17.46 140.45 G14 10 20.1 20.1 19.77 184.40 19.18 169.65 G15 10 20.1 20.1 19.29 179.94 18.71 165.54 G16 9 20.0 20.1 23.78 213.51 22.71 187.89 G17 10 20.1 20.0 20.51 187.48 19.90 172.48 G18 10 20.1 20.1 21.50 168.54 20.85 155.05 G19 12 19.8 20.0 16.85 134.11 16.85 134.11 G2 9 20.1 20.1 19.79 179.38 18.90 157.85 G20 10 20.1 20.1 20.57 151.24 19.95 139.14 G21 10 20.1 20.1 21.36 187.70 20.72 172.69 G22 10 20.1 20.1 21.53 178.29 20.88 164.02 G23 10 20.1 20.0 17.36 152.92 16.84 140.69 G24 9 20.2 20.1 23.17 224.45 22.13 197.52 G25 9 20.0 20.0 19.77 185.29 18.88 163.06 G3 9 20.2 20.2 24.47 225.72 23.37 198.63 G4 10 20.1 20.1 22.71 221.85 22.03 204.10 G5 10 20.1 20.1 17.61 144.82 17.08 133.23 G6 10 20.1 20.1 19.68 190.33 19.09 175.10 G7 11 20.0 20.0 21.55 195.13 21.23 187.32 G8 10 20.1 20.1 21.08 175.33 20.45 161.30 G9 10 20.1 20.1 23.47 201.94 22.77 185.78
Table 3.19. Complete strength testing data for spotted gum

65
B1 13.2 13.3 B2 14.6 14.6 B3 12.9 12.5 B4 12.6 12.4 B5 9.5 9.4 B6 11.9 10.2 B7 12.8 12.8 B8 11.1 10.1 B9 9.6 9.0
B10 11.6 10.4 Mean 12.0 11.5 11.9
R1 12.4 11.4 R2 12.1 11.1 R3 12.0 12.7 R4 14.4 13.9 R5 15.5 13.6 R6 11.1 13.0 R7 11.7 10.5 R8 14.3 11.4 R9 11.4 10.5
R10 11.9 11.5 Mean 12.7 12.0 11.5
G1 11.7 11.6 G2 9.9 11.1 G3 11.0 11.4 G4 10.0 10.4 G5 11.5 12.0 G6 12.7 12.4 G7 10.7 10.1 G8 12.3 12.1 G9 11.1 11.1
G10 12.1 13.2 Mean 11.3 11.5 11.4
Table 3.20. Complete Janka hardness (kN) results for spotted gum
FSP EMC FSP EMC Batch Sample # Shrink (%) MC (%) Shrink (%) MC (%) Shrink (%) MC (%) Shrink (%) MC (%)20-25 1 0.4 19 2 8.9 0.2 35 8.9 8.9 2 0.1 26 4.6 9.1 0.1 35 9.1 9.1 3 0.1 22 3 8.9 0.1 25 8.9 8.9 4 0.1 28 4.7 9.1 0.1 19 9.1 9.1 5 0.1 26 3.1 8.3 0.1 25 8.3 8.330-35 1 0.1 22 2.6 8.3 0.1 30 8.5 8.5 2 0.1 20 4.8 6.9 0.2 25 6.9 6.9 3 0.1 27 5 13.1 0.1 32 10.7 10.7 4 0.1 26 2.9 11.4 0.2 30 8 8 5 0.1 20 6 8.9 0.1 30 9.5 9.540-45 1 0.5 35 5.9 9.3 0.3 27 9.3 9.3 2 0.1 35 4 8.8 0.1 35 8.8 8.8 3 0.5 31 3.1 9.3 0.4 32 9.3 9.3 4 0.5 27 6.2 8.7 0.1 32 8.7 8.7 5 0.1 32 4.2 9.5 0.1 33 9.5 9.5Table 3.21. Complete unconfined shrinkage results

66
Plate 3.3. Typical boards from 40-45 cm DBHOB logs

67
Plate 3.4. Typical boards from 30-35 cm DBHOB logs

68
Plate 3.5. Typical boards from 20-25 cm DBHOB logs
69
4. Victorian regrowth silvertop ash (Eucalyptus sieberi) Trevor Innes
Timber Research Unit, University of Tasmania
4.1. Methodology
4.1.1. Sample Material Three age classes were sampled; see Table 4.1. A minimum of 100 sample boards for each experimental group was required, with no more than 10 boards cut from any log. Twelve logs were sampled for the 1955 batch, ten for the 1965 batch and twenty for the 1975 batch. Trees were either co-dominant or dominant and not edge trees, and were selected as being representative of the stand. A suitable size class was chosen for each stand, with all of the logs selected being within that size class; see Table 4.1. The three age classes were from three separate coupes, chosen for being single-aged with trees of appropriate size for sawlog.
Each log was identified by a colour (from Table 4.1) and a number. Year 1955 1965 1975 Size class DBHOB (cm) 40-45 50-55 30-35 Colour green pink blue Table 4.1. Colour codes for Victorian timber
4.1.2. Pre-felling Prior to felling, the following measurements were made for trees:
• breast height diameter over bark;
• tree stems/ha; and
• approximate tree height.
4.1.3. Post-felling For each tree:
• total height, height to 30 cm under bark small end diameter and height to 20 cm under bark small end diameter were measured;
• most logs were sawn over-length to suit the forwarder and then recut to 3.1 m length on the small end once loaded on the truck;
• both ends of logs were painted with appropriate colour from Table 4.1 above and end-sealed following felling and cross-cutting;
• each log was marked with tree number; and
• length of longest endsplit up log on both small and large ends was measured.
Logs were then transported to Fenning’s Bairnsdale sawmill and stored under waterspray, separately from general mill stock, until sawing.
4.1.4. Log processing at sawmill • endsplit of both ends of each log was re-measured prior to sawing;

70
• approximately 50 mm thick discs were cut from the butt end of each log, labelled and transported to the laboratory;
• logs were re-end coated and colour coded with a different colour on the freshly cut end so that individual logs could be tracked through the sawmill (Plate 4.1);
• logs were backsawn to 28 mm thickness, width of 100, 75 or 50 mm (nominal dry) following standard practice. Experimental groups were kept separate;
• log breaking down was by single bandsaw to 28 mm thickness with boards cut on a single circular saw (Plates 4.2 and 4.3) to 100, 75 or 50 mm nominal width. Each of the three log batches was processed individually, with all boards free of want and wane for their whole length bundled for later selection of trial boards (Plate 4.4). Fall-down boards were recovered by the mill for docking. Immediately after removal from the sorter, boards were moved under cover for selection of trial material; and
• a maximum of 10 boards per log were selected with wider boards preferred, block stacked, tightly wrapped on all sides with plastic and transported to the TRU laboratory, Launceston.
4.1.5. Drying • for each board the following measurements were made: Length, Width, Thickness,
Endsplit (numbered end), Endsplit (other end), Bow (if greater than 10 mm), Spring (if greater than 10 mm), Twist (if greater than 2.5 mm per 25 mm width), Length degraded by surface check on each side. Endsplit was measured as the length of board affected by the longest end split at each end of the board. This is the length of board that would have to be docked to remove all end-splitting;
• racks were hand built by TRU staff with rack sticks at 350 mm centres;
• six 300 mm long sample boards were used per rack of 100 boards, 3 on each side of the rack. MC, width and thickness were monitored throughout the trial;
• an additional 100 mm long sample was cut adjacent to each MC sample board for determination of unconfined shrinkage, initial MC and basic density; and
• another 14 boards were randomly selected from each pack for determination of unconfined shrinkage (four boards only), initial MC and basic density. Either one or two samples were cut from each log (number of logs per batch varied due to requirement for numbers of boards).
Boards were dried in a 10 m3 kiln belonging to the Forests and Forest Industry Council (FFIC) located at Neville Smith Timber’s (NST) Mowbray, Tasmania site – see Plate 4.5. The kiln was constructed specifically for experimental predrying of Tasmanian eucalypts and so generally controls very well at low temperatures (typically within 0.5°C).
The predrying schedule used is shown in Table 4.2. When sample boards indicated that MC had fallen to approximately 20%, timber was reconditioned and final dried to the schedules shown in Table 4.2.
Following final drying, racks were transported to the TRU laboratory.
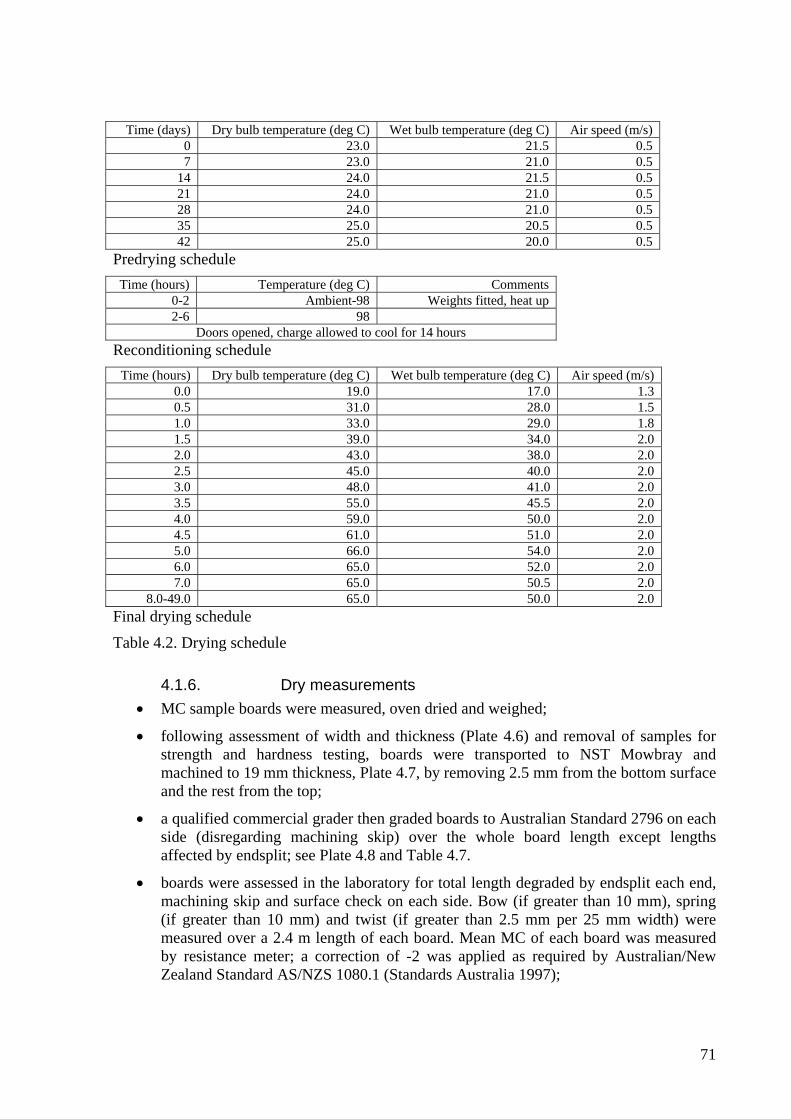
71
Time (days) Dry bulb temperature (deg C) Wet bulb temperature (deg C) Air speed (m/s)
0 23.0 21.5 0.5 7 23.0 21.0 0.5
14 24.0 21.5 0.5 21 24.0 21.0 0.5 28 24.0 21.0 0.5 35 25.0 20.5 0.5 42 25.0 20.0 0.5
Predrying schedule Time (hours) Temperature (deg C) Comments
0-2 Ambient-98 Weights fitted, heat up 2-6 98
Doors opened, charge allowed to cool for 14 hours Reconditioning schedule
Time (hours) Dry bulb temperature (deg C) Wet bulb temperature (deg C) Air speed (m/s) 0.0 19.0 17.0 1.3 0.5 31.0 28.0 1.5 1.0 33.0 29.0 1.8 1.5 39.0 34.0 2.0 2.0 43.0 38.0 2.0 2.5 45.0 40.0 2.0 3.0 48.0 41.0 2.0 3.5 55.0 45.5 2.0 4.0 59.0 50.0 2.0 4.5 61.0 51.0 2.0 5.0 66.0 54.0 2.0 6.0 65.0 52.0 2.0 7.0 65.0 50.5 2.0
8.0-49.0 65.0 50.0 2.0 Final drying schedule
Table 4.2. Drying schedule
4.1.6. Dry measurements • MC sample boards were measured, oven dried and weighed;
• following assessment of width and thickness (Plate 4.6) and removal of samples for strength and hardness testing, boards were transported to NST Mowbray and machined to 19 mm thickness, Plate 4.7, by removing 2.5 mm from the bottom surface and the rest from the top;
• a qualified commercial grader then graded boards to Australian Standard 2796 on each side (disregarding machining skip) over the whole board length except lengths affected by endsplit; see Plate 4.8 and Table 4.7.
• boards were assessed in the laboratory for total length degraded by endsplit each end, machining skip and surface check on each side. Bow (if greater than 10 mm), spring (if greater than 10 mm) and twist (if greater than 2.5 mm per 25 mm width) were measured over a 2.4 m length of each board. Mean MC of each board was measured by resistance meter; a correction of -2 was applied as required by Australian/New Zealand Standard AS/NZS 1080.1 (Standards Australia 1997);

72
• a 100 mm length was then removed from the end of each board and the freshly cut end evaluated for internal check (Plate 4.12) and sawing orientation. Boards were scored with either no internal check, or internal check present without attempting to categorise severity; and
• oven dry MC was measured on a 25 mm long full cross-section sample from each board.
Australian Standard AS 2796 (Standards Australia 1999) describes four grades based on features and desired aesthetic appearance. The three grades commonly used are select, Medium Feature – Standard and High Feature Grade. Grading was performed by a qualified commercial grader, who assigned the full length of each wide face a single grade, ignoring length affected by end splits and ignoring machining skip. Note that AS 2796 is generally applied on all four faces. For this study, the edges were not graded as they were not machined since boards were of varying width. The two wide faces were graded separately as many products expose only one face, for example flooring or architraves. Amount of distortion allowable in various products is also specified by AS 2796 (Standards Australia 1999).
Backsawn orientation was defined as all growth rings making an angle of less than 45° with the wide surfaces; quartersawn was defined as this angle being less than 45°; transitional sawn was defined as having a mixture of backsawn and quartersawn parts. An additional 25 mm long full-width sample was cut for measurement of oven-dry MC.
4.1.7. Disc measurements • a count of growth rings was made on discs to verify age. Radial sections cut from
several disc samples were assessed by a dendrochronologist; and
• sapwood, heartwood and heart width were measured across two diameters at right angles on each disc.
4.1.8. Green measurements • initial MC and basic density were measured on twenty samples per group (see
“Drying” section above); and
• unconfined shrinkage in radial and tangential directions were measured for ten of the twenty samples from each group.
Unconfined shrinkage is the shrinkage undergone by a thin slice of wood (approximately 0.8 mm thick) allowed to dry naturally in the laboratory, unaffected by drying gradients and stresses. Board shrinkage is lower than unconfined shrinkage due to the restraining effect resulting from moisture gradients due to drying; early in drying, the surface of boards is under tension, while later in drying the middle parts are under tension. This tension induces a “set” in the board, reducing overall shrinkage.
From each curve of shrinkage versus moisture content, three points were selected for reporting: green MC (zero shrinkage), and shrinkage and moisture content at both FSP and EMC.
4.1.9. Strength and hardness measurements • ten dry samples per experimental group (a maximum of one per log) were used for
hardness and strength testing. They were cut from the same boards as the MC sample boards, plus another four taken from the 14 boards initially sampled for shrinkage,

73
initial MC and basic density. Each sample originated from a different source log. They were cut prior to machining as 20 mm thickness was required for strength testing;
• 400 mm samples were cut 100 mm clear of endsplit, at least 200 mm from the board end. They were then machined to give a 100 mm long hardness sample and a 20 × 20 × 300 mm MOE/MOR sample;
• strength and stiffness testing was carried out as described by Mack (1979), in the section “Static bending, centre point loading”, as specified in Australian Standard 2878:2000 (Standards Australia 2000). Timber was loaded in the radial direction; and
• hardness was measured using the Janka hardness test as described by Mack (1979). Two points were tested for each sample.
Samples rejected because of defect were replaced with other samples cut from the same board if possible, otherwise replacement samples were cut from boards from the same log.
Strength testing was performed on a calibrated Instron tensile testing machine located at FurnTech, Launceston. Modulus of elasticity (MOE) was calculated by fitting a straight line by eye to the first part of the load-deflection trace. Modulus of rupture (MOR) was also calculated. These were corrected to values at 12% MC based on the oven-dry MC of each sample by adjusting bending strength by 4% for each 1% difference in MC and MOE by 1.5% for each 1% difference in MC. Adjustments were negative for MC below 12% and positive for MC above 12%. This complies with the rules of Australian Standard AS 2878 (Standards Australia 2000). A strength group was calculated for each sample and experimental group using the rules of AS 2878.
Janka hardness testing was also conducted using FurnTech’s Instron. Oven dry MC was measured for each sample, as was sawing orientation, that is, whether the test face was a radial or tangential surface.
4.2. Results
4.2.1. Logs Trees were felled on the 24th of January 2005. They were end-sealed before transport to Fenning’s Bairnsdale sawmill the following morning. Logs were stored there under waterspray until sawing. Tree and log measurements are shown in Table 4.3.
Logs were all graded as D+ under Victorian log grading rules. No A or B grade was possible due to presence of Amrosia spp. stain and pinhole. Only one log had endsplitting at falling (1965 log number 2, split length 18 cm). Some logs had falling shakes, which were disregarded for this study.

74
3 m sawlog Prior to sawing Sawn logs
Log no.
Dom/ Co-dom stem
DBH OB (cm)
Total height (m)
Height to 200 SED UB (m)
Height to 300 SED UB (m)
SED (cm)
LED (cm)
Endsplit length small end (cm)
Endsplit length large end (cm)
Length (cm)
Mean dia scanned (mm)
Vol (m3)
E. sieberi 1955. South East Fibre Exports Private Property. Harvested and regenerated 1955/1960. Thinned from below 1999/2000 to approx 350 stems/ha. Log grade C & D. GPS 0650665/5833703:GREEN
**1 C 42 30-35 25.1 6.3 32 36 6 0 308 346 0.2902 C 43 30-35 23.9 5.8 40 33.4 0 0 300 371 0.3243 C 44 30-35 25.5 6.6 32.7 42.2 7 0 311 378 0.3494 C 45 30-35 24.9 6.8 38 0 *68 312 363 0.3235 C 42 30-35 24.9 6.8 33.5 41 0 0 315 382 0.3616 D 44 30-35 22.9 7.4 32.2 37.6 44 0 304 353 0.2987 C 45 30-35 26.6 6.6 34 41.6 0 0 310 375 0.3428 C 41 30-35 22.4 3 29.8 38 0 0 310 339 0.2809 C 42 30-35 24.5 4 31 37.3 0 0 307 333 0.267
10 C 41 30-35 17.3 1.8 34.7 0 0 309 318 0.24511 D 42 30-35 31.8 3.4 30.2 39.1 0 33 316 344 0.29412 C 45 30-35 36.1 6.1 32.6 40.7 15 0 305 372 0.331
Mean 43.0 25.5 5.4 32.8 38.3 6.0 3.0 308.9 356.2 0.309E. sieberi 1965. Brunts Tk, (831/506/0002). Harvested and regenerated 1965/66. Thinned from below 1990/1991 to approx 350 stems/ha. Log grade C. GPS 0651673/5832326: PINK.
1 C 54 29-31 27 17.4 42 51 2 0 307 445 0.4772 D 50 29-31 23.5 18.9 38.1 45 46 25 302 433 0.4453 D 51 29-31 16.5 41 49 32 5 305 444 0.4724 D 54 29-31 28 21 40 49 0 0 297 447 0.4665 D 55 29-31 28.9 21.6 42.1 52.4 15 0 297 473 0.5226 D 55 29-31 28.7 19.4 50 0 24 301 469 0.5207 D 53 29-31 26.6 20.5 42.5 49.5 10 0 303 460 0.5048 C 55 29-31 23.2 20.4 42.2 53 18 0 302 460 0.5029 D 50 29-31 24.8 18.9 33.5 42.5 32 0 290 378 0.325
10 D 53 29-31 25.1 21 44.2 54.3 26 0 302 469 0.522Mean 53.0 26.2 19.56 40.6 49.6 18.1 5.4 300.6 447.8 0.475Table 4.3. Summary log data. DBHOB – diameter at breast height over bark; SED – small end diameter; LED – large end diameter; UB – under bark continued below
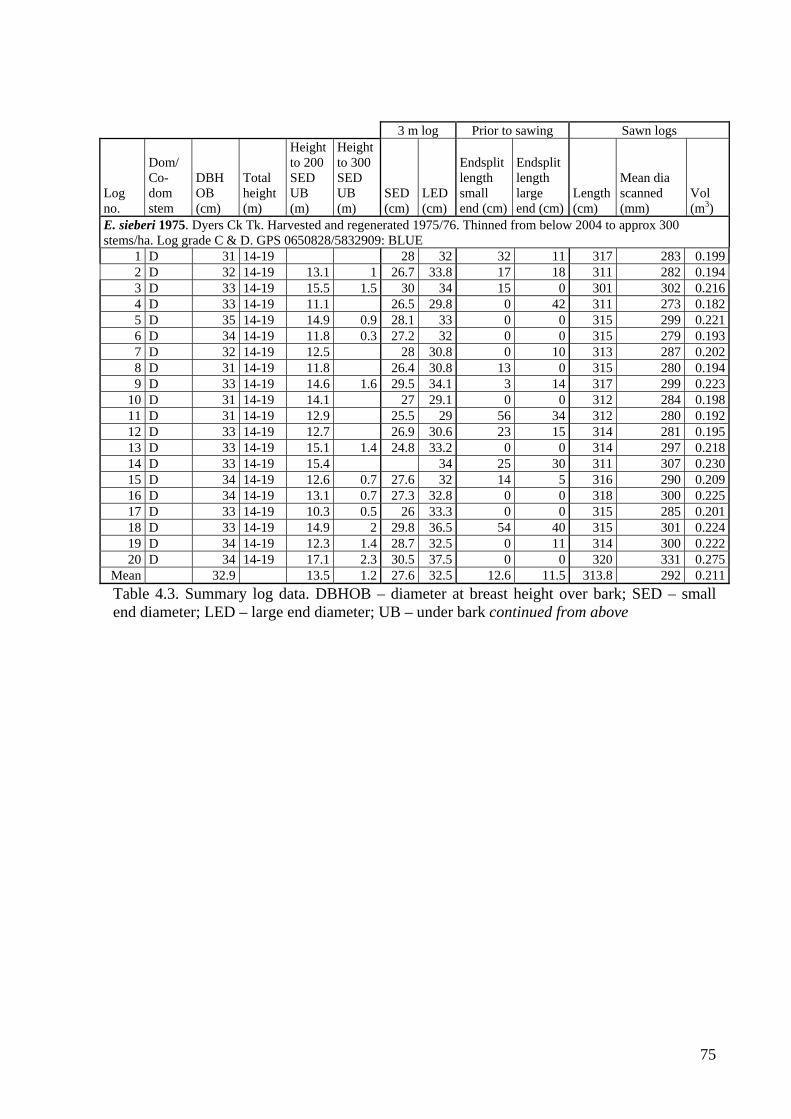
75
3 m log Prior to sawing Sawn logs
Log no.
Dom/ Co-dom stem
DBH OB (cm)
Total height (m)
Height to 200 SED UB (m)
Height to 300 SED UB (m)
SED (cm)
LED (cm)
Endsplit length small end (cm)
Endsplit length large end (cm)
Length (cm)
Mean dia scanned (mm)
Vol (m3)
E. sieberi 1975. Dyers Ck Tk. Harvested and regenerated 1975/76. Thinned from below 2004 to approx 300 stems/ha. Log grade C & D. GPS 0650828/5832909: BLUE
1 D 31 14-19 28 32 32 11 317 283 0.1992 D 32 14-19 13.1 1 26.7 33.8 17 18 311 282 0.1943 D 33 14-19 15.5 1.5 30 34 15 0 301 302 0.2164 D 33 14-19 11.1 26.5 29.8 0 42 311 273 0.1825 D 35 14-19 14.9 0.9 28.1 33 0 0 315 299 0.2216 D 34 14-19 11.8 0.3 27.2 32 0 0 315 279 0.1937 D 32 14-19 12.5 28 30.8 0 10 313 287 0.2028 D 31 14-19 11.8 26.4 30.8 13 0 315 280 0.1949 D 33 14-19 14.6 1.6 29.5 34.1 3 14 317 299 0.223
10 D 31 14-19 14.1 27 29.1 0 0 312 284 0.19811 D 31 14-19 12.9 25.5 29 56 34 312 280 0.19212 D 33 14-19 12.7 26.9 30.6 23 15 314 281 0.19513 D 33 14-19 15.1 1.4 24.8 33.2 0 0 314 297 0.21814 D 33 14-19 15.4 34 25 30 311 307 0.23015 D 34 14-19 12.6 0.7 27.6 32 14 5 316 290 0.20916 D 34 14-19 13.1 0.7 27.3 32.8 0 0 318 300 0.22517 D 33 14-19 10.3 0.5 26 33.3 0 0 315 285 0.20118 D 33 14-19 14.9 2 29.8 36.5 54 40 315 301 0.22419 D 34 14-19 12.3 1.4 28.7 32.5 0 11 314 300 0.22220 D 34 14-19 17.1 2.3 30.5 37.5 0 0 320 331 0.275
Mean 32.9 13.5 1.2 27.6 32.5 12.6 11.5 313.8 292 0.211Table 4.3. Summary log data. DBHOB – diameter at breast height over bark; SED – small end diameter; LED – large end diameter; UB – under bark continued from above
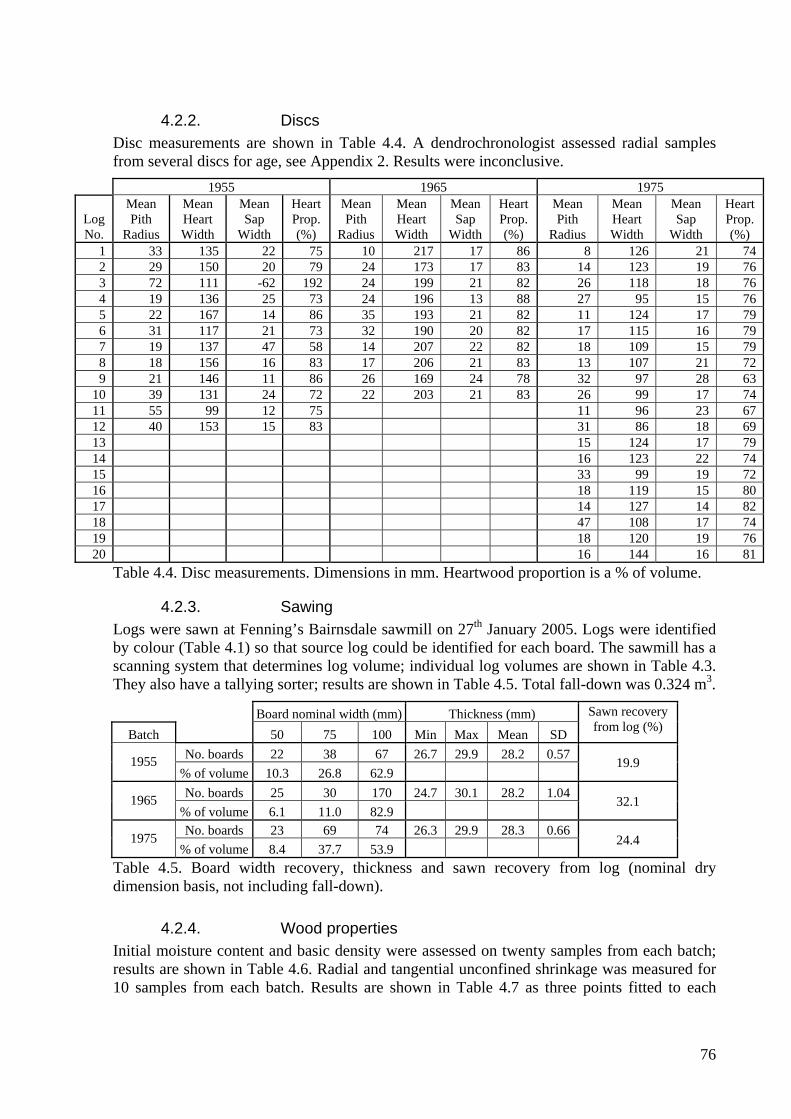
76
4.2.2. Discs Disc measurements are shown in Table 4.4. A dendrochronologist assessed radial samples from several discs for age, see Appendix 2. Results were inconclusive.
1955 1965 1975
Log No.
Mean Pith
Radius
Mean Heart Width
Mean Sap
Width
Heart Prop. (%)
Mean Pith
Radius
Mean Heart Width
Mean Sap
Width
Heart Prop. (%)
Mean Pith
Radius
Mean Heart Width
Mean Sap
Width
Heart Prop. (%)
1 33 135 22 75 10 217 17 86 8 126 21 742 29 150 20 79 24 173 17 83 14 123 19 763 72 111 -62 192 24 199 21 82 26 118 18 764 19 136 25 73 24 196 13 88 27 95 15 765 22 167 14 86 35 193 21 82 11 124 17 796 31 117 21 73 32 190 20 82 17 115 16 797 19 137 47 58 14 207 22 82 18 109 15 798 18 156 16 83 17 206 21 83 13 107 21 729 21 146 11 86 26 169 24 78 32 97 28 63
10 39 131 24 72 22 203 21 83 26 99 17 7411 55 99 12 75 11 96 23 6712 40 153 15 83 31 86 18 6913 15 124 17 7914 16 123 22 7415 33 99 19 7216 18 119 15 8017 14 127 14 8218 47 108 17 7419 18 120 19 7620 16 144 16 81
Table 4.4. Disc measurements. Dimensions in mm. Heartwood proportion is a % of volume.
4.2.3. Sawing Logs were sawn at Fenning’s Bairnsdale sawmill on 27th January 2005. Logs were identified by colour (Table 4.1) so that source log could be identified for each board. The sawmill has a scanning system that determines log volume; individual log volumes are shown in Table 4.3. They also have a tallying sorter; results are shown in Table 4.5. Total fall-down was 0.324 m3.
Board nominal width (mm) Thickness (mm) Batch 50 75 100 Min Max Mean SD
Sawn recovery from log (%)
No. boards 22 38 67 26.7 29.9 28.2 0.57 1955 % of volume 10.3 26.8 62.9
19.9
No. boards 25 30 170 24.7 30.1 28.2 1.04 1965 % of volume 6.1 11.0 82.9
32.1
No. boards 23 69 74 26.3 29.9 28.3 0.66 1975 % of volume 8.4 37.7 53.9
24.4
Table 4.5. Board width recovery, thickness and sawn recovery from log (nominal dry dimension basis, not including fall-down).
4.2.4. Wood properties Initial moisture content and basic density were assessed on twenty samples from each batch; results are shown in Table 4.6. Radial and tangential unconfined shrinkage was measured for 10 samples from each batch. Results are shown in Table 4.7 as three points fitted to each

77
shrinkage curve: initial MC, and shrinkage and MC at fibre saturation point and at equilibrium.
1955 1965 1975
Board
Initial MC (%)
Basic density (kg/m3) Board
Initial MC (%)
Basic density (kg/m3) Board
Initial MC (%)
Basic density (kg/m3)
10 115 536 10 60 648 9 93 597 18 127 470 18 74 641 17 104 582 48 142 458 46 65 562 55 135 459 56 99 641 54 56 654 62 109 549 85 104 564 85 53 598 103 134 435 94 81 655 93 61 617 110 116 528 23 85 630 22 124 523 11 135 477 33 87 641 30 80 623 13 107 572 43 91 624 68 120 541 23 120 526 59 86 634 78 76 645 47 78 658 11 126 517 12 94 625 30 87 639 16 89 637 15 87 655 39 98 596 26 88 616 25 97 601 41 100 592 39 86 652 38 108 548 50 106 566 45 84 668 49 83 660 59 98 576 51 132 483 57 95 616 65 90 622 62 125 470 71 80 687 69 92 619 68 74 698 81 110 560 77 121 514 72 74 690 86 85 650 87 128 497 78 91 612 97 75 684 116 125 501
Mean 99 595 Mean 84 617 Mean 109 555 SD 20.7 77.8 SD 20.7 48.1 SD 17.2 61.5
Table 4.6. Initial moisture content and basic density of randomly selected samples
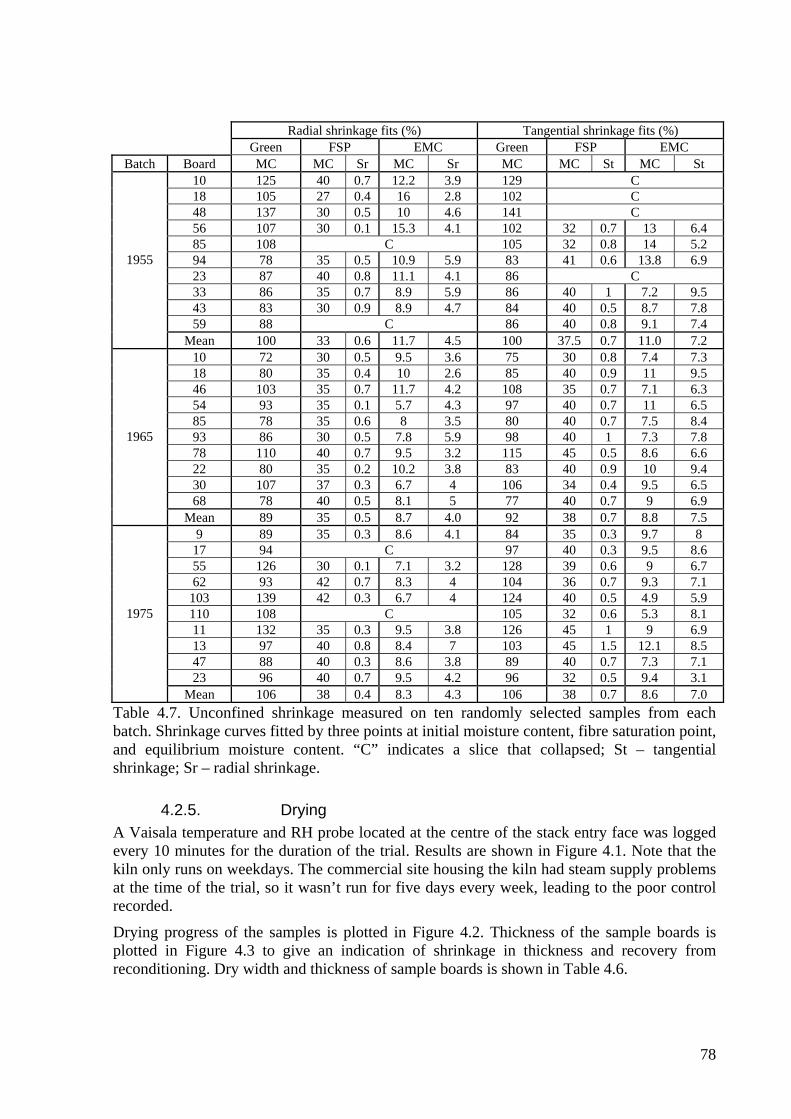
78
Radial shrinkage fits (%) Tangential shrinkage fits (%) Green FSP EMC Green FSP EMC
Batch Board MC MC Sr MC Sr MC MC St MC St 10 125 40 0.7 12.2 3.9 129 C 18 105 27 0.4 16 2.8 102 C 48 137 30 0.5 10 4.6 141 C 56 107 30 0.1 15.3 4.1 102 32 0.7 13 6.4 85 108 C 105 32 0.8 14 5.2 94 78 35 0.5 10.9 5.9 83 41 0.6 13.8 6.9 23 87 40 0.8 11.1 4.1 86 C 33 86 35 0.7 8.9 5.9 86 40 1 7.2 9.5 43 83 30 0.9 8.9 4.7 84 40 0.5 8.7 7.8 59 88 C 86 40 0.8 9.1 7.4
1955
Mean 100 33 0.6 11.7 4.5 100 37.5 0.7 11.0 7.2 10 72 30 0.5 9.5 3.6 75 30 0.8 7.4 7.3 18 80 35 0.4 10 2.6 85 40 0.9 11 9.5 46 103 35 0.7 11.7 4.2 108 35 0.7 7.1 6.3 54 93 35 0.1 5.7 4.3 97 40 0.7 11 6.5 85 78 35 0.6 8 3.5 80 40 0.7 7.5 8.4 93 86 30 0.5 7.8 5.9 98 40 1 7.3 7.8 78 110 40 0.7 9.5 3.2 115 45 0.5 8.6 6.6 22 80 35 0.2 10.2 3.8 83 40 0.9 10 9.4 30 107 37 0.3 6.7 4 106 34 0.4 9.5 6.5 68 78 40 0.5 8.1 5 77 40 0.7 9 6.9
1965
Mean 89 35 0.5 8.7 4.0 92 38 0.7 8.8 7.5 9 89 35 0.3 8.6 4.1 84 35 0.3 9.7 8
17 94 C 97 40 0.3 9.5 8.6 55 126 30 0.1 7.1 3.2 128 39 0.6 9 6.7 62 93 42 0.7 8.3 4 104 36 0.7 9.3 7.1
103 139 42 0.3 6.7 4 124 40 0.5 4.9 5.9 110 108 C 105 32 0.6 5.3 8.1 11 132 35 0.3 9.5 3.8 126 45 1 9 6.9 13 97 40 0.8 8.4 7 103 45 1.5 12.1 8.5 47 88 40 0.3 8.6 3.8 89 40 0.7 7.3 7.1 23 96 40 0.7 9.5 4.2 96 32 0.5 9.4 3.1
1975
Mean 106 38 0.4 8.3 4.3 106 38 0.7 8.6 7.0 Table 4.7. Unconfined shrinkage measured on ten randomly selected samples from each batch. Shrinkage curves fitted by three points at initial moisture content, fibre saturation point, and equilibrium moisture content. “C” indicates a slice that collapsed; St – tangential shrinkage; Sr – radial shrinkage.
4.2.5. Drying A Vaisala temperature and RH probe located at the centre of the stack entry face was logged every 10 minutes for the duration of the trial. Results are shown in Figure 4.1. Note that the kiln only runs on weekdays. The commercial site housing the kiln had steam supply problems at the time of the trial, so it wasn’t run for five days every week, leading to the poor control recorded.
Drying progress of the samples is plotted in Figure 4.2. Thickness of the sample boards is plotted in Figure 4.3 to give an indication of shrinkage in thickness and recovery from reconditioning. Dry width and thickness of sample boards is shown in Table 4.6.

79
0
10
20
30
40
50
60
70
80
90
100
0 10 20 30 40 50 60 70 80 90
Time (days)
Tem
pera
ture
(deg
C) a
nd R
elat
ive
Hum
idity
(%
Relative HumidityTemperature
Figure 4.1. Recorded temperature and relative humidity during the trial.
4.2.6. Dry evaluation and grading Summary board shrinkage and moisture content results are shown in Table 4.6. Grading results are shown in Table 4.7, endsplit results in Table 4.8, surface checking, machining skip and internal checking results in Table 4.9, distortion results in Table 4.10 and sawn orientation results in Table 4.11.
Thickness (mm) Shrinkage (%) Moisture content (%) Green Dry Width Thickness Meter Oven dry
Min 26.7 19.2 4.1 5.1 7.0 11.9 Max 29.9 27.9 20.0 30.2 38.0 24.9
Mean 28.2 24.3 11.3 14.3 18.6 16.7 1955
Std Dev 0.6 1.7 3.6 5.8 8.4 3.0 Min 24.7 21.2 1.9 2.3 5.0 10.5 Max 30.1 28.8 15.8 20.6 36.0 20.8
Mean 28.2 25.7 6.3 9.0 12.0 13.2 1965
Std Dev 1.0 1.4 2.3 3.9 6.1 2.0 Min 26.3 20.9 2.9 1.3 5.0 9.7 Max 29.9 28.1 17.7 24.8 20.0 27.2
Mean 28.3 25.7 8.4 9.0 8.5 12.1 1975
Std Dev 0.7 1.3 2.8 3.9 2.9 1.8 Table 4.6. Summary of dry dimensional recovery and moisture content measured by resistance meter and oven drying of all boards
Grade Top surface Bottom surface Both sides select 0 1 0Standard 7 11 1955 High Feature 90 85
select 37 39 25Standard 28 31 1965 High Feature 29 25
select 24 24 16Standard 24 23 1975 High Feature 50 50
Table 4.7. Percentage of boards in each grade (to AS 2796) on each face and percentage of boards with both faces graded select

80
Green Dry Loss to endsplit Loss to endsplit
Total length (m)
Length (m)
% of overall length
Total length (m)
Length (m)
% of overall length
1955 306.7 4.9 1.6 295.2 26.0 8.8 1965 300.3 5.9 2.0 284.7 16.3 5.7 1975 374.8 11.9 3.2 362.7 32.2 8.9
Table 4.8. Total length of board processed and length lost to endsplit
Top surface Bottom surface Surface check Skip Surface check Skip Internal check
1955 55.2 7.0 34.7 26.1 97.1 1965 16.1 4.3 10.2 3.5 92.2 1975 32.9 1.3 17.8 13.2 91.1
Table 4.9. Percentage of overall board length (disregarding endsplit) degraded by surface check or machining skip on both surfaces and percentage of boards affected by internal check.
Green Dry Bow Spring Twist Bow Spring Twist
1955 11.8 0.0 0.0 1.0 0.0 2.91965 3.9 0.0 0.0 0.0 0.0 0.01975 23.6 2.4 0.0 0.8 0.0 2.4
Table 4.10. Percentage of boards with distortion exceeding AS 2796 allowance for 19 mm thick flooring.
Backsawn Quartersawn Transitional1955 51.5 7.1 41.41965 33.0 24.7 42.31975 40.0 5.8 54.2
Table 4.11. Percentage of each batch by sawing orientation.
4.2.7. Strength testing Results are shown in Table 4.12.

81
4.2.8. Hardness Results are shown in Table 4.13. No. 1st test (kN) 2nd test (kN) Mean (kN) MC % Orientation
10 4.04 4.84 4.4 6.1 R18 5.35 5.8 5.6 9.0 T23 6.06 5.98 6.0 11.2 T33 8.81 8.77 8.8 11.0 T43 6.43 7.12 6.8 10.9 T48 4.38 3.8 4.1 8.9 T56 6.56 6.13 6.3 10.3 T59 5.77 5.88 5.8 9.0 T85 5.24 4.36 4.8 8.8 T94 7.28 8.24 7.8 9.5 T
1955
Mean 6.0, Std Dev 1.5 9.5 18 6.81 6 6.4 9.8 R68 6.35 6.33 6.3 10.1 R78 4.83 5.26 5.0 11.9 R10 5.87 6.26 6.1 9.0 T22 6.38 7.25 6.8 10.5 T30 5.45 6.48 6.0 11.0 T46 5.26 5.08 5.2 8.6 T54 6.19 6.65 6.4 9.0 T85 7.8 7.91 7.9 9.5 T93 6.69 5.79 6.2 10.5 T
1965
Mean 6.2, Std Dev 0.8 10.0 11 3.27 3.45 3.4 8.9 R17 4.64 5.12 4.9 8.6 R47 6.81 6.07 6.4 9.2 R
9 5.66 5.46 5.6 8.4 T13 6.44 5.76 6.1 10.7 T23 5.96 6.22 6.1 11.2 T55 3.79 4.76 4.3 9.0 T62 6.58 6.21 6.4 9.1 T
103 3.43 2.51 3.0 9.1 T110 4.09 5.41 4.8 9.0 T
1975
Mean 5.1, Std Dev 1.3 9.3 Overall: Mean 5.8, Std Dev 1.3 Table 4.13. Hardness test results. Orientation “R” indicates that a radial face was tested; “T” indicates a tangential face.

82
Properties adjusted to 12%MC*
Batch No. Max load
(kN) Width (mm)
Depth (mm)
Load/Deflection to PL (kN/mm)
MOE (GPa)
MOR (MPa)
MC (%)
MOE (GPa)
MOR (MPa)
SD (MOE)
SD (MOR) SD
Density (kg/m3)
10 2.784 19.74 20.12 0.4724 16.1 146 9.0 15.4 129 4 3 4 74618 1.686 19.79 19.94 0.3883 13.6 90 8.9 13.0 79 5 5 5 74123 2.850 19.97 20.61 0.5556 17.4 141 15.1 18.2 158 3 1 2 91233 2.306 18.85 20.15 0.4167 14.8 127 15.3 15.6 143 4 2 3 98048 1.388 18.89 19.95 0.3089 11.3 78 7.1 10.5 62 7 7 7 58556 2.980 19.82 19.94 0.5000 17.5 159 12.0 17.5 159 3 1 2 89159 2.861 20.12 19.92 0.4667 16.1 150 10.2 15.7 139 4 2 3 73785 3.146 20.19 20.01 0.4861 16.5 163 9.9 16.0 150 4 2 3 76294 2.748 19.86 20.01 0.5217 18.0 145 9.4 17.3 130 3 2 3 897
1955
Mean 2.463 0.4616 15.8 130 12.5 15.4 128 4 3 4 80610 3.079 19.98 19.95 0.4563 15.8 163 7.7 14.8 134 4 2 3 70118 2.899 20.17 19.94 0.5147 17.7 152 11.4 17.5 148 3 2 3 82222 2.905 20.09 20.14 0.5036 16.8 150 15.0 17.6 168 3 1 2 88230 2.579 20.17 20.08 0.4559 15.3 133 12.2 15.4 134 4 2 3 78346 3.020 19.99 20.2 0.4717 15.7 156 7.7 14.7 128 4 3 4 69654 2.758 18.94 20.03 0.4348 15.7 152 7.1 14.5 123 4 3 4 71768 2.310 20.16 20.11 0.4808 16.1 119 12.0 16.1 119 3 3 3 80785 3.193 20.04 20.19 0.5556 18.5 164 8.8 17.6 143 3 2 3 77393 2.932 20.2 20.07 0.5224 17.6 151 9.2 16.8 134 3 2 3 730
1965
Mean 2.761 0.476 16.1 144 12.1 16.1 137 3 2 3 7689 3.896 20.69 20.48 0.6000 18.5 189 8.7 17.6 163 3 1 2 761
11 1.949 19.78 20.17 0.3650 12.3 102 8.9 11.8 89 6 5 6 54413 2.854 20.15 20.17 0.5263 17.5 146 11.7 17.4 145 3 2 3 78817 3.134 20.59 20.8 0.5691 16.9 148 9.5 16.2 133 3 2 3 73423 1.290 20.13 19.86 0.3836 13.4 68 13.6 13.7 73 5 6 6 83747 3.127 19.98 19.94 0.5147 17.8 165 9.7 17.2 150 3 1 2 77455 2.268 20.39 20.02 0.4065 13.6 117 8.4 12.9 100 5 4 5 59962 2.836 19.89 20.11 0.4545 15.4 148 9.3 14.8 132 4 2 3 721
103 1.377 20.08 19.99 0.3168 10.8 72 8.2 10.2 61 7 7 7 554110 2.810 20.04 19.95 0.5085 17.5 148 8.9 16.7 130 3 3 3 738
1975
Mean 2.554 0.465 15.4 130 9.7 14.8 117 4 3 4 705*MOE adjusted to 12% MC at 1.5% per 1%MC; MOR adjusted at 4% per 1%MC Overall Mean 15.4 127 4 3 4 Std Dev 2.2 30 Table 4.12. Strength test results for silvertop ash 20 × 20 × 300 mm clears loaded in the radial direction
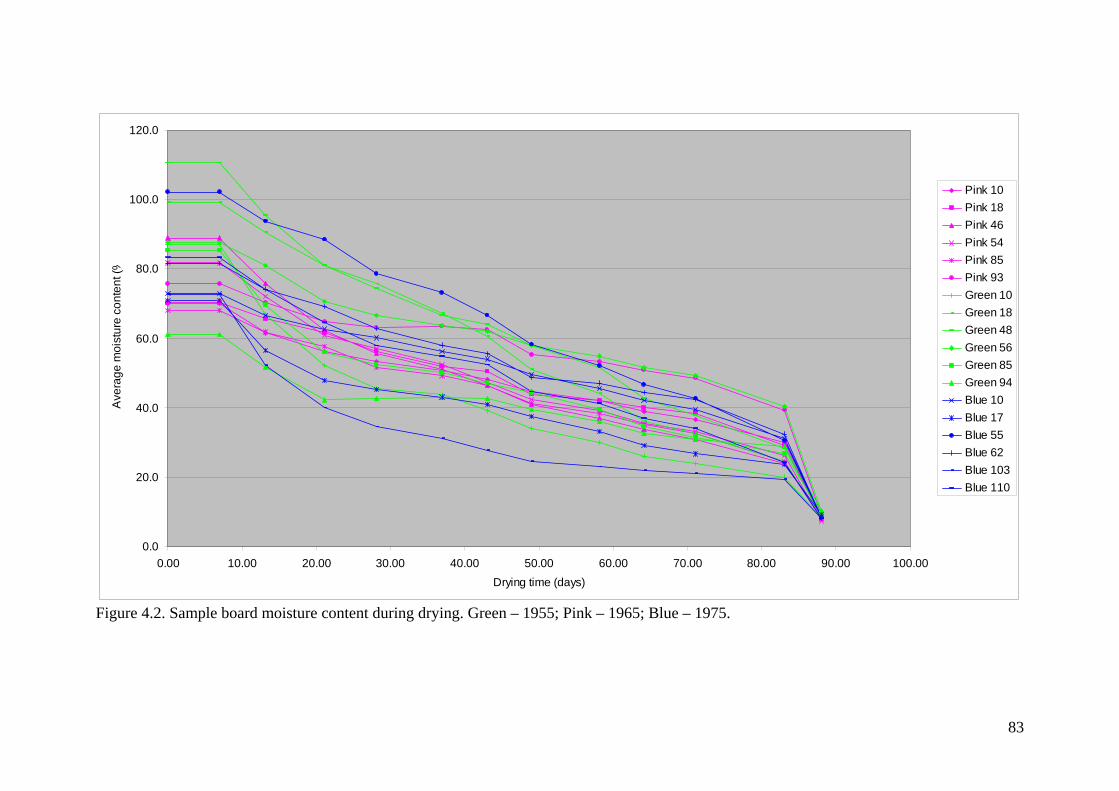
83
0.0
20.0
40.0
60.0
80.0
100.0
120.0
0.00 10.00 20.00 30.00 40.00 50.00 60.00 70.00 80.00 90.00 100.00Drying time (days)
Ave
rage
moi
stur
e co
nten
t (%
Pink 10Pink 18Pink 46Pink 54Pink 85Pink 93Green 10Green 18Green 48Green 56Green 85Green 94Blue 10Blue 17Blue 55Blue 62Blue 103Blue 110
Figure 4.2. Sample board moisture content during drying. Green – 1955; Pink – 1965; Blue – 1975.

84
0.0
20.0
40.0
60.0
80.0
100.0
120.0
0.00 10.00 20.00 30.00 40.00 50.00 60.00 70.00 80.00 90.00 100.00Drying time (days)
Wid
th (m
m)
Pink 10Pink 18Pink 46Pink 54Pink 85Pink 93Green 10Green 18Green 48Green 56Green 85Green 94Blue 10Blue 17Blue 55Blue 62Blue 103Blue 110
Figure 4.3. Sample board width during drying. Green – 1955; Pink – 1965; Blue – 1975

85
0
5
10
15
20
25
30
35
0.00 10.00 20.00 30.00 40.00 50.00 60.00 70.00 80.00 90.00 100.00Drying time (days)
Thic
knes
s (m
m
Pink 10Pink 18Pink 46Pink 54Pink 85Pink 93Green 10Green 18Green 48Green 56Green 85Green 94Blue 10Blue 17Blue 55Blue 62Blue 103Blue 110
Figure 4.4. Sample board thickness during drying. Green – 1955; Pink – 1965; Blue – 1975.

86
Plate 4.1. Log sealing after cutting discs
Plate 4.2. Log breaking down
Plate 4.3. Resaw
Plate 4.4. Bundled boards prior to selection
Plate 4.5. Racked timber ready for predrier
Plate 4.6. Pre-machining evaluation
Plate 4.7. Machining
Plate 4.8. Commercial grading to AS 2796
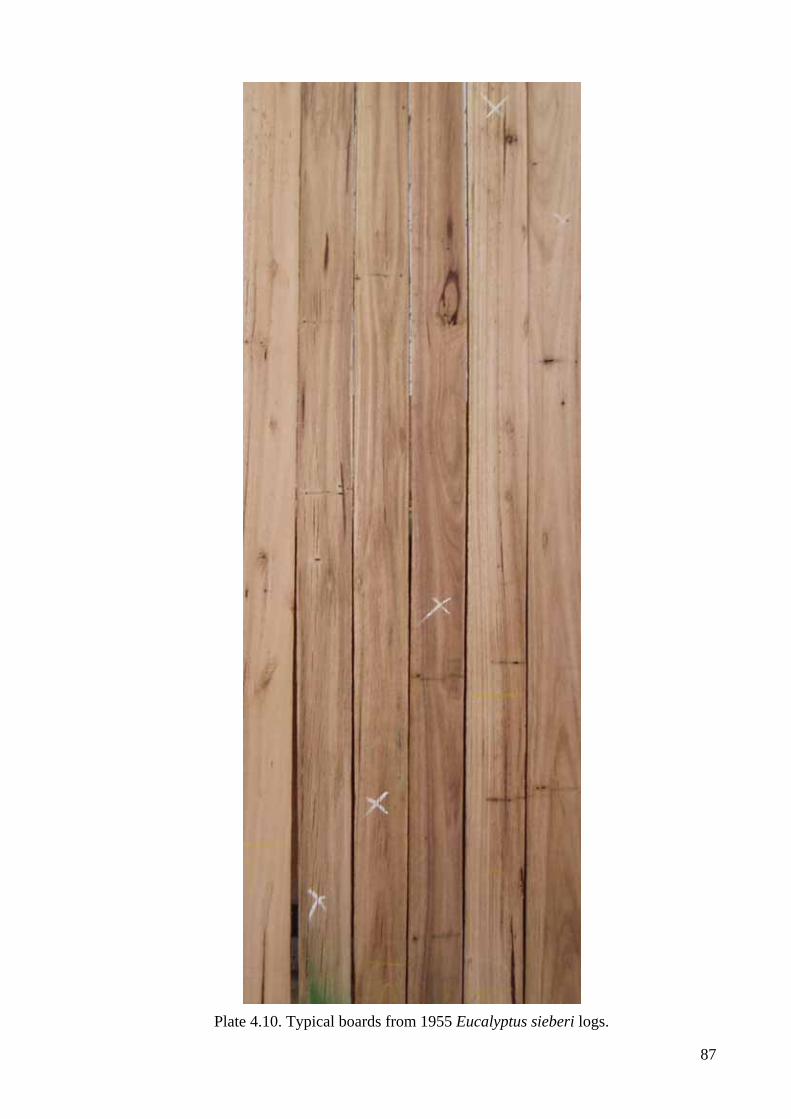
87
Plate 4.10. Typical boards from 1955 Eucalyptus sieberi logs.

88
Plate 4.9. Typical boards from 1965 Eucalyptus sieberi logs

89
Plate 4.11. Typical boards from 1975 Eucalyptus sieberi logs.
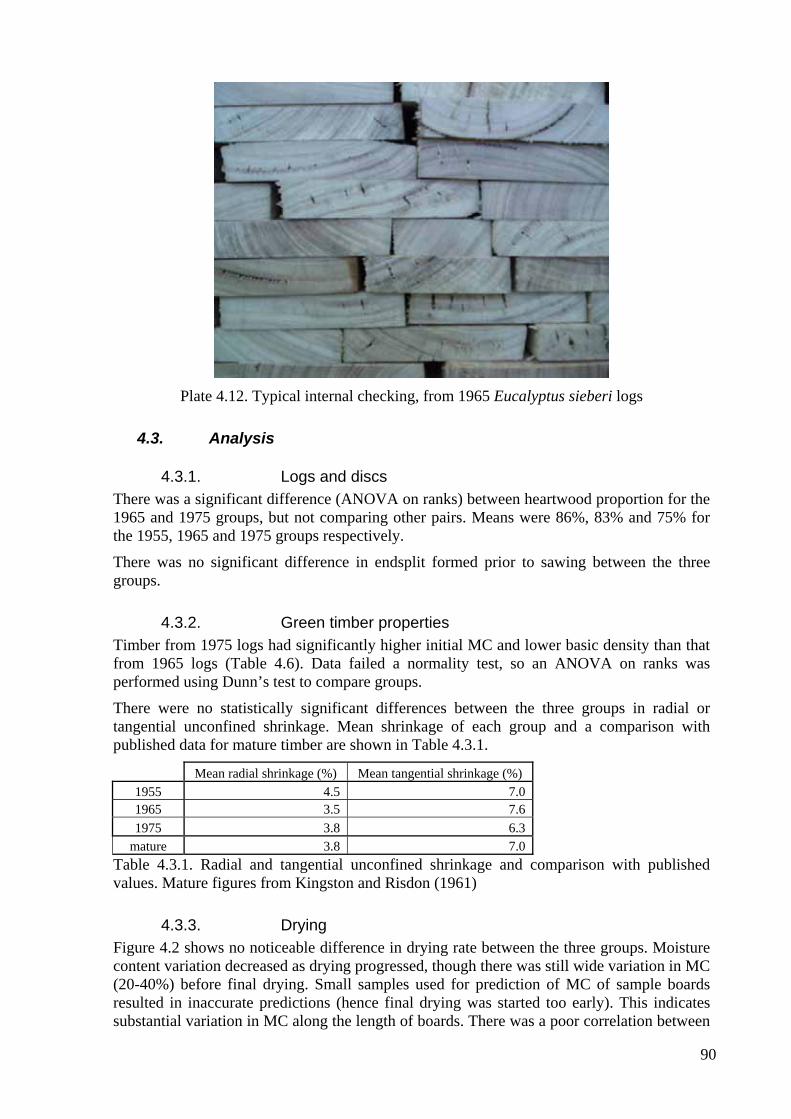
90
Plate 4.12. Typical internal checking, from 1965 Eucalyptus sieberi logs
4.3. Analysis
4.3.1. Logs and discs There was a significant difference (ANOVA on ranks) between heartwood proportion for the 1965 and 1975 groups, but not comparing other pairs. Means were 86%, 83% and 75% for the 1955, 1965 and 1975 groups respectively.
There was no significant difference in endsplit formed prior to sawing between the three groups.
4.3.2. Green timber properties Timber from 1975 logs had significantly higher initial MC and lower basic density than that from 1965 logs (Table 4.6). Data failed a normality test, so an ANOVA on ranks was performed using Dunn’s test to compare groups.
There were no statistically significant differences between the three groups in radial or tangential unconfined shrinkage. Mean shrinkage of each group and a comparison with published data for mature timber are shown in Table 4.3.1.
Mean radial shrinkage (%) Mean tangential shrinkage (%) 1955 4.5 7.0 1965 3.5 7.6 1975 3.8 6.3
mature 3.8 7.0 Table 4.3.1. Radial and tangential unconfined shrinkage and comparison with published values. Mature figures from Kingston and Risdon (1961)
4.3.3. Drying Figure 4.2 shows no noticeable difference in drying rate between the three groups. Moisture content variation decreased as drying progressed, though there was still wide variation in MC (20-40%) before final drying. Small samples used for prediction of MC of sample boards resulted in inaccurate predictions (hence final drying was started too early). This indicates substantial variation in MC along the length of boards. There was a poor correlation between

91
moisture meter reading and oven dry moisture content from the final dried boards (Table 4.6).
4.3.4. Dry evaluation There was a significant difference in shrinkage in thickness between groups, except when comparing 1965 with 1975. Data failed a normality test, so an ANOVA on ranks was performed using Dunn’s test to compare groups. There was a significant difference in shrinkage in width between all groups. Data failed an equal variance test, so an ANOVA on ranks was performed using Dunn’s test to compare groups. Shrinkage in both width and thickness was approximately 50% higher in timber from the 1955 batch than in timber from the other batches.
There was no consistent relationship between tree age and board grade. Timber cut from the oldest log batch (1955) was of consistently poorer quality with large amounts of surface checking, end splitting, kino, insect attack, stain and decay. Yield of select grade was very low for all batches. Over 90% of boards from each batch (98% of boards from the 1955 batch) suffered internal check, often severe.
4.3.5. Strength There was no statistically significant difference in MOE between groups (one way ANOVA) or in MOR (one way ANOVA on ranks). Summary results and comparison with published figures for mature timber are shown in Table 4.3.2.
Properties adjusted to 12%MC MC (%) MOE (GPa) MOR (MPa) SD (MOE) SD (MOR) SD Density (kg/m3)
Mean 12.5 15.4 127.7 4 3 4 8061955 SD 6.2 2.4 34.4 123
Mean 12.1 16.1 137.0 3 2 3 7681965 SD 6.8 1.3 14.7 63
Mean 9.7 14.8 117.5 4 3 4 7051975 SD 1.7 2.6 34.6 102
Mean 11.4 15.4 127.0 4 3 4 Overall SD 5.4 2.2 29.7
Bolza and Kloot (1963) 17.3 137 Table 4.3.2. Summary strength properties; comparison with published data for mature timber.
4.3.6. Hardness Timber from the 1975 group had significantly lower hardness than that of the other two groups (one way ANOVA). Hardness of all groups is much lower than published values for mature timber, see Table 4.3.3.
Janka hardness (kN) MC (%) Mean Std Dev 1955 9.5 6.0 1.51965 10.0 6.2 0.81975 9.3 5.1 1.3Overall 9.6 5.8 1.3Bolza and Kloot (1963) 9.8 Table 4.3.3. Summary hardness properties, comparison with published figures for mature timber.

92
5. Recommendations and further work This work found that differences in timber properties due to age are not consistent between species. There were no consistent differences in timber properties between the three size classes of jarrah or spotted gum, whereas younger messmate tended to be more variable with a significant incidence of internal checking. Non-destructive evaluation (NDE) technologies may be required for batching of this material to eliminate weaker, softer or low density timber. The youngest trees of silvertop ash produced timber of significantly lower basic density and higher initial moisture content than that from trees ten years older. The oldest trees produced logs of smaller size than trees ten years younger and timber of very poor quality, with extensive natural feature and drying defect. This is presumably due to site conditions.
Strength testing was performed on standard small clear samples 20 × 20 × 300 mm. This may not be an accurate representation of likely strength of typical structural sizes as these are not likely to be clear of natural features. A more extensive testing program examining typical structural sizes would be required to confirm this.
Accelerated durability assessments are currently being undertaken on spotted gum. Durability is being assessed on four replicate samples from each H2 disc section. The results from these assessments will be presented as an addendum to this report.
The jarrah processed for this project looked substantially different (Plates 2.3 and 2.4) to the mature jarrah consumers are accustomed to. Hence some effort may be required in marketing this timber. Similarly, younger trees of both messmate and spotted gum produced lower recoveries of select grade timber. All size classes of silvertop ash produced timber of poor dried quality, with extensive natural feature and drying degrade, particularly internal check. Efforts may be needed in promoting grades with more natural feature than has traditionally been seen as desirable.
The sample size for this study was limited by practical and financial constraints. Only ten to twenty trees of each batch were sampled with only one log per tree and ten boards per log. It was not possible to eliminate all other variables, such as site and silvicultural variables, as forests of known distinct ages of similar silviculture often do not exist. This study demonstrates, however, that variability in processing and material properties is likely to depend as or more strongly on silvicultural variables than it does on tree age. It was not possible to recommend an optimum age for harvest for any of the regrowth native forest species studied.
In general, the part that native forest regrowth plays as a component of a sustainable timber industry needs highlighting, as anecdotally consumers only seem to differentiate between two types of Australian grown hardwood; native forest (ie. mature) and plantation.
93
6. References Armstrong, M. (1999). The effect of growth stresses on the stem, and wood characteristics of Eucalyptus cloeziana (F. Muell.). Honours Thesis, Australian National University.
Bolza, E. and Kloot, N.H. (1963). The mechanical properties of 174 Australian timbers. CSIRO Division of Forest Products Technological Paper No. 25
FIFWA (1992). Industry standard for seasoned, sawn and skip-dressed Western Australian hardwoods. Forest Industries Federation Western Australia.
Grimes, R.F. (1978). Crown Assessment of Natural spotted gum-ironbark Forest. Queensland. Department of Forestry. Technical Paper No. 7.
Kingston, R.S.T. and Risdon, C. June E. (1961). Shrinkage and density of Australian and other South-west Pacific woods. CSIRO Division of Forests Products. Technological Paper No.13.
Mack JJ (1979) Australian Methods for Mechanically Testing Small Clear Specimens of Timber. CSIRO Australian Division of Building Research Technical Paper (Second Series) No 31, 1-19, CSIRO Australia.
Standards Australia (1997). Australian/New Zealand Standard AS/NZS 1080.1 Timber – Methods of test – Moisture content. Standards Australia, Sydney.
Standards Australia (1999). Australian Standard AS 2796 Timber – Hardwood – Sawn and milled products. Standards Australia, Sydney.
Standards Australia (2000). Australian Standard 2082: Timber – Hardwood – Visually stress graded.
Standards Australia (2000). Australian/New Zealand Standard AS/NZS 2878 Timber – Classification into strength groups. Standards Australia, Sydney.

94
7. Appendix 1. Report on ‘ring counts’ from selected specimens of Tasmanian Eucalyptus obliqua
K.Allen
It was not possible to confirm tree age from ring counts for a number of reasons:
♦ Depending on incident light and magnification, the numbers of apparent rings in samples varied between passes over an individual sample.
♦ Boundaries of apparent rings were, at times, difficult to define, meaning measurement (done in an attempt to establish cross-dating which can then be used as a partial argument in favour of annual rings) was difficult and not necessarily consistent between samples or even at times, within samples.
♦ A far greater number of samples (and more than one sample from each tree) would be required in order to properly establish cross-dating and hence tentative evidence of annual rings.
♦ Limited number of rings in all samples – in order to cross-date some species, longer series are desirable. This may be the case with these samples, but cannot be determined at this stage.
Method
Samples were re-sanded in order to obtain greater ring clarity.
Casual observation
Samples from the same site were visually compared.
Ring counts
Two non-magnified passes were then made over the samples, under different light conditions, to count the apparent rings (samples marked with dots and crosses). A third and final pass was made when measuring apparent rings and this was under magnification.
Skeleton plotting
When the first pass was done, skeleton plots were made as part of an initial investigation of cross-dating potential of samples. On the plots enclosed, upright bars from the horizontal indicate narrow rings, the larger the upright bar, the narrower the ring. Downward bars in contrast indicate wider than ‘average’ rings. When considering what constitutes an ‘average’ ring in the context of the skeleton plot, the 5 rings either side of the subject ring were considered. Fire scars were marked with an ‘x’.
The plots from samples from the same site were then compared by moving them backwards and forwards against one another as this can help detect ‘missing’ or ‘false’ rings providing patterns are sufficiently apparent.
Measuring
Each sample was measured, with the aid of magnification and a sliding measuring stage attached to a computer and linear encoder. Magnification, in almost all cases, meant that the

95
third pass ‘ring count’ on samples differed from BOTH passes 1 and 2 as apparent ring boundaries became less clear (or more clear in some cases) under magnification.
After samples were measured, COFECHA, a cross-dating program was used to examine the samples.
Results Casual observation
The samples from site ‘P’ looked the most promising with similar patterns appearing to exist across samples. This was not as obvious for the remaining two sites, although G10 and G7 appeared hopeful, at least in parts.
Ring Counts
The following are notes made during the different passes over the samples. Notable is the fact that different numbers of rings were obtained for the different passes for all samples, indicating a low degree of reliability in the way a ring appears in a sample.
Note that term ‘false rings’ is generally used to indicate rings that are not annual. The occurrence of a false ring can indicate that conditions (probably moisture availability) ‘mimicked’ conditions the tree might generally experience at the end of its growing season. In this case however, I have used the term simply to indicate a ‘ring’ that is considerably less convincing than other rings in that sample. (First pass 1, second pass 2, third pass 3).
P10 – 1 year total difference between (1) and (2). (3) different again.
P1 – Large differences between samples in ‘the 60’s’. False ring around ‘1950’?. Not at all good under ‘scope, looks like lots of false rings towards inner. Lots of ‘false rings’ in early ‘70s’?
P9 – About 5 years difference. Pretty awful. Not great under ‘scope either.
P8 – Only 1 year difference between (1) and (2). Under ‘scope, perhaps false rings in ‘50s’ and ‘70s’.
G3 – More than 10 years difference between (1) and (2). Not good under ‘scope – lots of false rings?
G10 – Again, more than 10 years difference between (1) and (2). Vague under ‘scope but note that ‘G’ samples very similar to previous count.
G12 – 12 years difference between (1) and (2)
O2 – Note outermost rings look like they may be missing. Under ‘scope, false ring at ‘1943’?
O8 – 4 years difference between passes.

96
Skeleton plots
For all three sites, there were no obvious patterns: results were therefore inconclusive. This is interesting for site P in particular.
Measuring and crossdating
Results indicate that samples from ‘O’ (Taranna) do not cross date. However, three of four samples from ‘P’ (Franklin) show some evidence of weak cross-dating, suggesting it is possible, but not assured, that these samples have annual rings. It is also possible the trees reacted in the same manner to externally imposed environmental stresses (one reason for this may be very close proximity to one another) to produce the same ‘false rings’ or ‘missing rings’.
The actual number of rings (in measured file) varies from 78 to 87 for site P (excluding P10 which did not show any evidence of cross-dating with the other samples). If these rings are indeed annual and assuming an outer date of 2002 (growing season began in 2002), this suggests that the trees date from approximately 1915. Factors such as establishment time (eg. perhaps trees did not immediately establish after fire) need to be considered (unless known to have been planted, and date of planting known, after fire).
If rings are annual this would suggest some variation in establishment time.
However, there is one major issue in relation to this. There is no evidence from P1 or P8 that outer rings are not present (according to COFECHA output the outer ring of P1 is 4 short of P9 and P8 is 6 short. Therefore if all trees were felled during 2003 and were all live, the above apparent cross-dating is spurious. Dave Robson, Forestry Tasmania, has stated his belief that trees were harvested over a 12-18 month period which does not allow for the apparent variation suggested by COFECHA. Rerunning COFECHA with a different segment length did not clarify matters.
From results obtained from other sites, it is impossible to even suggest age based on dendrochronological techniques. This is despite the promise indicated by G10 and G7 when looking at 50 year segments. When making use of 30 year segments, the results are not clear, and probably spurious (for the earlier part of the series, COEFHA suggests that subtracting 6 years from G007 will enable cross-dating with G10, but COFECHA then indicates that 25 years should be subtracted from the latter part of the series. In a timber known to produce annual rings, this would most likely result in the samples being discarded with for any further analysis. It would either suggest that G7 has a lot of ‘false rings’, G10 has a lot of missing rings, or that, given the short series involved, that the results are entirely spurious. Certainly in this case, it would not be wise to rely entirely on ring counts to provide stand/specimen age.
The two sets of files attached to the emailed version of this report include the measurement files for the three sites, examples of cross-dating, or lack of.
Attached files should include: Gfile2.txt, Ofile2.txt, Pfile4.txt, Ofile2out.txt, G3othersout.txt, Pfile4out.txt. Software limitations meant there was a need to shift series to have an ‘artificial’ end date prior to 2000. For the same reasons, it is not easy to shift the dates back to where they should be (ie. 2002/3 growing season). This does not affect the software’s ability to cross-date based on measurements.

97
Conclusions
Ring counts for at least two of the three sites (O and G) cannot be relied on to provide the age of a site. However, it should be noted that ‘ring counts’ obtained from site G samples in particular fall in the ‘ball park’ of the 1934 fire date. This may imply that this date (or 1935) is a very reasonable estimate of sample age.
O site samples show least evidence for cross-dating, but this does not necessarily imply that no samples from O would cross-date. Even in species known to have annual rings, it is perfectly possible for any two individual samples not to show any evidence of cross-dating.
Although measurements are suggestive of weak cross-dating for site P, serious reservations exist if indeed all samples were live when felled and felled at the same time.
This said, it may be worth looking at some sites similar to ‘P’ at some future date if it is intended to pursue an investigation of the potential for ageing samples of E. obliqua from ‘ring counts’. More samples from a single site and species would be required to establish whether or not it is, or could be, possible to date some species in some locations from their rings. This would obviously be a time consuming and expensive task. Greater knowledge of the tree species’ physiology would also be helpful. In this context, it would be best to initially search for trees most likely to be limited by a single factor, one of the most obvious being temperature (using altitude as a proxy). Williams and Potts (1996) state that although occurring above 600m ASL, E. obliqua generally occurs below this altitude. E. obliqua specimens obtained from plantations at about 500-600m ASL may therefore be a good starting point.
In all cases, ring counts may provide a very rough idea of sample age, but this must be treated with caution and a +/- figure supplied. For the samples analysed here, I would be loathe to suggest a +/- figure of less than 15-20 years.
References
Williams, K.J., and Potts, B.M., 1996. The natural distribution of Eucalyptus species in Tasmania TasForests 8, 39-149

98
8. Appendix 2. Report on ‘ring counts’ from selected specimens of Eucalyptus sieberi from Victoria
Kathryn Allen
Method Samples were sanded with an orbital sander to 80 grit. Rings were first counted without knowledge of fire/regeneration dates and in a random order. A second count was undertaken after having looked at the regeneration information supplied. This information, however, was not deliberately taken into account. Light conditions were also different.
Please note that there were 2 samples labelled as Blue11.
Results Sample Count 1 Count 2 Comments (only taken from count 1) Pink 4 21 39 Centre not well sanded (‘dip’) – more? Kino at rings 4, 6 Pink 5 23 31 3 more? Kino at rings 8, 9 Pink 8 34 35 Not nice. Kino at rings 6, 14. Rings 15-19, could be
several false rings Green 2 28 38 Kino at rings 6, 21/22, 23. Green 5 32 37 Kino at rings 3, 14 Green 7 22 33 Pith missing – 1 more ring? Green 10 22 23 No kino Blue 11 20 26 Pith missing. 1-3 more? Blue 11 (2) 23 28 No kino Blue 14 28 29 No kino, parts not well sanded (dips) Blue 17 16 25 Kino at ring 5 Blue 19 25 26 Kino at rings 13 / 14. Pith missing
Conclusions Results indicate that a ring count for E. sieberi is an imprecise manner to estimate age – this is consistent with circumstantial findings by others for a number of Eucalyptus species. However, an interval age estimate would seem reasonable, especially if there is another source of information such as regeneration dates.
It should be noted, however, that although it was not intended that knowledge of the regeneration dates would make any difference to the counts, it may have done. Therefore, ring counts should be done without prior knowledge of confirmation data such as fire and regeneration dates. This would assist in determining whether or not ring counting was a reliable method of estimating tree age.

99
Acknowledgments The authors gratefully acknowledge the following for their contribution:
Tasmania • Richard and John Clennett, Clennett Industries
• Dave Robson, Forestry Tasmania
• Peter Bennett, ex Forests and Forest Industry Council (FFIC)
• Ike and Page Kelly, Kelly Timbers
• Tony Jaeger, McKay Timber
• Michael Lee and Ian Whiteroad, Neville Smith Tasmania
• Stephen Wright and Stephen Aitken, Timber Research Unit
• FFIC for funding the control batch of messmate
Western Australia • Craig Gardiner and Steve Davis (FPC) - selecting trees and arranging harvesting
• Inglewood Products Group - sawmilling
• Timber Technology staff - sawn timber inventory.
• Timber Technology staff for their assistance in the initial grading, and Peter Piper for his assistance with monitoring kilns during drying of the timber
Queensland • Peter Crooke, Queensland Sawmills
• Neale Fredericks, Queensland Sawmills
• Thomas Lelievre, Department of Primary Industries and Fisheries
• Eric Littee, Department of Primary Industries and Fisheries
• Allie Muneri, Brisbane Forestry Research Centre (formerly Department of Primary Industries and Fisheries)
Victoria • South East Fibre Exports
• Leonard Fenning and Rodney Natty, Fenning Investments Pty Ltd
• Anne Geary, Department of Sustainability and Environment
• Michael Theobald, Vic Forests