the impact of frying aerosol on human brain activity · pattern changes associated with exposure to...
TRANSCRIPT

Contents lists available at ScienceDirect
Neurotoxicology
journal homepage: www.elsevier.com/locate/neuro
Full Length Article
The impact of frying aerosol on human brain activityMotahareh Naseria, Mojtaba Jouzizadehb, Mahsa Tabeshb, Milad Malekipirbazaric,Raikhangul Gabdrashovaa,d, Sholpan Nurzhana,d, Hamta Farrokhib, Reza Khanbabaieb,Hossein Mehri-Dehnavib, Zhibek Bekezhankyzya,e, Aidana Gimnkhana,e, Maryam Dareinia,Akbota Kurmangaliyevaa,d, Nazia Islama,d, Byron Crapef, Giorgio Buonannog, Flemming Casseeh,Mehdi Amouei Torkmahalleha,i,⁎
a Chemical and Aerosol Research Team, School of Engineering, Nazarbayev University, Nur-Sultan 010000, KazakhstanbDepartment of Physics, Babol Noshirvani University of Technology, Shariati Ave., Babol, 47148-71167, Iranc Department of Industrial Engineering, Bilkent University, 06800 Bilkent, Ankara, TurkeydDepartment of Biology, School of Engineering, Nazarbayev University, Nur-Sultan 010000, Kazakhstane Department of Chemistry, School of Engineering, Nazarbayev University, Nur-Sultan 010000, KazakhstanfDepartment of Medicine, School of Medicine, Nazarbayev University, Nur-Sultan 010000, Kazakhstang Department of Civil and Mechanical Engineering, University of Cassino and Southern Lazio, via Di Biasio 43, Cassino 03043, ItalyhNational Institute for Public Health and the Environment, Bilthoven, The Netherlandsi The Environment and Resource Efficiency Cluster, Nazarbayev University, Nur-Sultan 010000, Kazakhstan
A R T I C L E I N F O
Keywords:Brain EEGFryingUltrafine particlesTranslocationNeurodegenerative disease
A B S T R A C T
Knowledge on the impact of the exposure to indoor ultrafine particles (UFPs) on the human brain is restricted.Twelve non-atopic, non-smoking, and healthy adults (10 female and 7 male, in average 22 years old) weremonitored for brain physiological responses via electroencephalographs (EEGs) during cooking. Frying groundbeef meat in sunflower oil using electric stove without ventilation was conducted. UFPs, particulate matter (PM)(PM1, PM2.5, PM4, PM10), CO2, indoor temperature, RH, oil and meat temperatures were monitored continuouslythroughout the experiments. The UFP peak concentration was recorded to be approximately 2.0× 10⁵ particles/cm3. EEGs were recorded before exposure, at end of cooking when PM peak concentrations were observed, and30min after the end of the cooking session (post-exposure). Brain electrical activity statistically significantlychanged during post-exposure compared to the before exposure, suggesting the translocation of UFPs to thebrain, occurring solely in the frontal and temporal lobes of the brain. Study participants older than 25 were moresusceptible to UFPs compared to those younger than 25. Also, the brain abnormality was mainly driven by malerather than female study participants. The brain slow-wave band (delta) decreased while the fast-wave band(Beta3) increased similar to the pattern found in the literature for the exposure to smoking fumes and dieselexhaust.
1. Introduction
Exposure to indoor aerosol is important since the vast majority ofpeople spend most of their time indoors (Wallace et al., 2004). Indoorparticulate matter (PM) sources are typically short-term events that canproduce high ultrafine particles (UFPs) (particles less than 100 nmaerodynamic diameter) concentrations (Long et al., 2000) such asburning candles and cooking.
The cooking emission in residential or commercial kitchens is one ofthe main indoor PM sources that results in human exposure to highconcentrations of ultrafine particles (Abdullahi et al., 2013; Amouei
Torkmahalleh et al., 2017a). Exposure to cooking PM was found to bealmost one order of magnitude higher than the exposure to PM frommost other everyday activities (Wallace and Howard-Reed, 2002;Wallace and Ott, 2010). He et al. (2004) investigated PM2.5 and ultra-fine particle (7 nm to 808 nm) emission rates in 15 houses in Australiawhile performing 20 indoor activities such as cooking (frying, grilling,toasting, microwaving, oven use, kettle), smoking, sweeping floor, va-cuuming, candle burning and hair drying. They found cooking as thelargest source of indoor air pollution with the highest level of PM2.5
(2.78 ± 17.8mg.min−1). Wallace and Ott (2010) conducted a 3-yearstudy in a variety of indoor environments in the United States including
https://doi.org/10.1016/j.neuro.2019.06.008Received 23 April 2019; Received in revised form 14 June 2019; Accepted 24 June 2019
⁎ Corresponding author at: Chemical and Aerosol Research Team, School of Engineering, Nazarbayev University, Nur-Sultan 010000, Kazakhstan.E-mail address: [email protected] (M. Amouei Torkmahalleh).
Neurotoxicology 74 (2019) 149–161
Available online 26 June 20190161-813X/ © 2019 Elsevier B.V. All rights reserved.
T

two occupied homes, one test home, two cars as well as 22 restaurants.They found that cooking using gas or electric stoves and toaster ovenswere among the major sources of UFP exposure with peak concentra-tions up to more than 100,000 particles/cm3. Among different cookingactivities, such as boiling, stewing, oven cooking, microwaving,toasting, sautéing, grilling, charbroiling, and frying, the highest particleemission was registered to frying (McDonald et al., 2003; Nasir et al.,2013; See and Balasubramanian, 2008, 2006; He et al., 2004).
Several factors including cooking additives (Amouei Torkmahallehet al., 2013, 2017b; 2017d), meat (Amouei Torkmahalleh et al., 2017c;Gorjinezhad et al., 2017), cooking oil and cooking temperature(Amouei Torkmahalleh et al., 2012; Gao et al., 2013a, b; Buonannoet al., 2009), and cooking pan (Amouei Torkmahalleh et al., 2018;Wallace et al., 2014) contributed to the UFP and PM productions.
The particle mode diameter values (the diameter representing thehighest particle concentration) during cooking were reviewed byAbdullahi et al. (2013) and reported to be between 20–100 nm. It wasfound that heating an electric stove itself without any cooking materialssuch as (pan, food, oils and additives) could be a source of UFPs smallerthan 10 nm with the peak diameter around 6 nm (Wallace et al., 2008).Additionally, a very high particle number concentration (in the order of106 particles/cm3) close to the cooking source is expected (AmoueiTorkmahalleh et al., 2017a). Therefore, cooking in pans produces largeconcentrations of small particles offering higher surface areas whichcould in turn increase the risk of particle toxicity.
Several studies conducted in the literature addressing the translo-cation of different types of aerosol particles including gold, C-13, po-liovirus, and manganese oxide to the nervous system (Nel et al., 2006;Stone et al., 2017). It is suggested in the literature that one of the routesthrough which UFPs can reach the brain is the nasopharyngeal region(Elder et al., 2006). The particles are deposited on olfactory mucosa ofthe nasal region where they translocate by axonal transport along theolfactory nerve into the olfactory bulb which is a part of the brain in-volved in the sense of smell. From there, the particles have access to thebrain tissue and the central nervous system (CNS), respectively(Lucchini et al., 2012). Another potential pathway through which theparticles can reach the brain is the tracheobronchial and alveolar regionwhere the inhalation into lungs is followed by the diffusion of particlesinto the blood circulation and further flowing into the brain. In thisroute, depending on the size, charge, chemistry, etc of the nano-particles, they can pass the Blood-Brain Barrier (BBB) and reach thebrain (Calderón-Garcidueñas et al., 2007).
Electroencephalograph (EEG) is a device that detects and recordsthe electrical brain activity generated by the cortex. EEG measures thebrain’s voltage fluctuations in the neuron system of the brain resultedfrom an ionic current. EEG includes an electrode board with a set ofseparate channels that are connected to the electrodes placed on thescalp surface. Through these electrodes the electrical signals are re-ceived. The EEG method has been widely utilized to better understandbrain related disease by comparing EEG signals of patients to those ofhealthy subjects. For example, Parkinson’s and Alzheimer's patientsshowed significant changes in the brain theta band compared to healthycontrol groups (Stevens et al., 2001, Prichep et al., 2006, and Soikkeli Ret al., 1991).
To our knowledge, no peer-reviewed published study has previouslyexamined the associated of short-term exposures to general indoor PMand cooking PM with measured activity in the human brain.
The main objective of this study was to investigate brain wavepattern changes associated with exposure to cooking aerosols for 12healthy adults, using EEG. Previous exposure studies have identifiedfactors in reducing the exposure to cooking UFPs and PM (AmoueiTorkmahalleh et al., 2017a). However, no investigation exists in theliterature to investigate if such reductions in exposure to the cookingUFPs and PM are sufficient to reduce its potential impact on humanhealth. Although not yet fully understood if there is a link betweenexposure to cooking particles and brain diseases such as Alzheimer and
Parkinson, the present study might provide new insight for future re-search for diagnosis of UFP-related brain disorders.
2. Materials and methods
2.1. Study participants
Seventeen (10 female and 7 male, in average 22 years old) non-atopic, non-smoking, physically and mentally healthy adults residing inBabol city, Iran were invited to the cooking experiments with no re-muneration or benefits offered. The selected study participants werestudents and faculty. The physical and mental health conditions of theparticipants were evaluated using a questionnaire. The weight of theparticipants ranged from 42 to 83 and the average BMI of the partici-pants was 22.66. Thus, no overweighed participant was selected as suchparticipants have low grade inflammation and altered cognition(Lasselin et al., 2016). The health condition of the study participantswere evaluated using a questionnaire asking the following matter: To-bacco consumption (cigarettes, electronic cigarettes, shisha, etc), drugconsumption, any medical pills, neurological discomfort associatedwith the nervous system, level of stress in life, pulmonary sensitivity orpulmonary disease (cough, asthma, lung disease, swelling, etc). As aresult, 17 sets of experimental data were obtained from the exposureassessment study. However, among the 17 study participants, 12 ofthem (seven female participants with the average age and BMI of 25and 21.3, respectively, and 5 male participants with the average ageand BMI of 33 and 19.92, respectively.
Six participants older than 18 years and younger than 25 and sixparticipants older than 25 years) whose average age was 22 were se-lected for further analyses of EEG measurements. Before providingwritten consent, all study participants were given information about theobjectives of the study, cooking recipe, and the instruments used duringthe study. The study participants were given a questionnaire to learnabout their cooking habit (gas vs. electric stove). They were asked tohave sufficient rest before the test particularly before the experimentsconducted in the morning. To eliminate the effects of stress on the brainactivities, the study participants attended the experiments on a day thatthey had no stress and anxiety, and took no medications or exams. Thisstudy did not increase study participant exposure to cooking aerosolsbeyond their normal cooking activities. The study participants weretasked to frying ground beef on an electric stove in an experimentallycontrolled house setting, of which they consumed as a replacement forone of their regular meals which required cooking.
2.2. Experimental design
During the controlled experimental study, all windows and doorswere closed to eliminate the transport of outdoor contamination intothe experimentally-controlled houses. However, indows and doors wereleft open between experiments to reduce indoor particle concentrationsto background concentrations. Four size fractions of PM mass con-centrations (PM1, PM2.5, PM4, PM10, and total PM), UFP number con-centrations, meat temperature, oil temperature, indoor temperature,and relative humidity (RH) were recorded continuously before thecooking (background), during cooking and after cooking. The samplingport of the PM instrument was located approximately at the breathingzone of the participants to assess their exposure. New and clean gloveswere used to prepare the cooking materials before each experiment toassure hygienic conditions. Typically, three persons, including a re-search participant, were present during the experiments. The EEG brainactivity was monitored at three steps during the experiments withparticipants’ eyes closed. The experiments were initiated at time ofarrival to the test house, with EEG measurements taken 20min beforecooking (step 1), at the end of cooking (step 2) which corresponds tomaximum particulate concentrations, and 30min after the terminationof cooking (post-cooking or step 3)- during the period when particulate
M. Naseri, et al. Neurotoxicology 74 (2019) 149–161
150

matter is decaying and background conditions are returning. DuringEEG tests, study participants were seated on a chair and remain still toreplicate resting. The duration of each EEG test was five minutes. In theperiods between EEG measurements, study participants were restingand in an upright position. All electrical appliances were unplugged andoperated on battery power to prevent interference with EEG measure-ments.
Heart rate (HR), systolic blood pressure (SBP) and diastolic bloodpressure (DBP) were measured after each of the three EEG tests.Measurements were taken according to criteria provided in the docu-ment “Recommendations for Blood Pressure Measurement in Humansand Experimental Animals proposed by American Heart AssociationCouncil on High Blood Pressure Research” (Pickering et al., 2005).
Low-fat ground beef meat was purchased for the experiments toreduce overall cooking emissions as higher fat contributes to particleproduction (Amouei Torkmahalleh et al., 2017d). The experimentswere conducted in a one-bedroom apartment which included a kitchenequipped with an electric stove. The kitchen’s dimension was 21.77m3
with a height of 275 cm, length of 355 cm and width of 223 cm. Nomechanical ventilation was operated while cooking. One hundredgrams of the meat was mixed with 20 g of shredded onions, one gram ofsalt, one gram of pepper, and one gram of turmeric. The seasoned meatwas then divided into three 40 g pieces of rounded meat (pan-kebabs)in preparation for the experiments. A PTFE-coated aluminum pan thatwas 25 cm in diameter was heated in an electric stove at a medium heatsetting. After heating the empty pan for two minutes, 21mL sunfloweroil was poured into the pan. After eight minutes of the start of theexperiment (six minutes after the addition of the oil), the three pieces ofpan-kebab were placed into the pan. At minutes 11, 14 and 17, the pan-kebabs were turned over with a wooden spatula. The stove was swit-ched off after 20min and at minute 25 the window was open. Samplingcontinued until the concentration reached background (at minute 50).Figure S1 shows the test house where the experiments were conducted.
2.3. Exposure assessment
A TSI (St. Paul, MN, USA) IAQ Model 7545 instrument was used tomeasure CO2 concentration, indoor temperature, and humidity. A TSIDustTrak DRX Model 8533 was used to simultaneously monitor PM1,PM2.5, PM4, and PM10. The DustTrak's logging interval was one second.A TSI condensation particle counter (CPC) Model 3007, capable ofmeasuring particle number concentrations down to 10 nm (105 parti-cles/cm3), was employed with a logging interval of one second. TheCPC 3007 counts the particles up to 3× 10⁴-4× 10⁴ particles/cm3.However, the accuracy of the counter decreases beyond 1×10⁴ par-ticles/cm3, requiring a correction. An Aerasense (Netherlands)NanoTracer capable of quantifying particle number concentrations upto 106 particles/cm3 for UFPs down to 10 nm was utilized. TheNanoTracer provides the average particle diameter and estimates theparticle surface area concentration based on a user-defined particledensity. In this study we assumed the particle density to be 1 gm/cm3. Adigital thermometer (Model 54IIB, Fluke, Everett, USA) was employedto measure the temperature of the oil and the temperature of the meatat its surface during cooking. The thermometer is capable of measuringtemperatures in the range of −200 to 1372 °C using a K type probe. A Ktype probe (THS-103–020, ThermoWorks, USA) was employed in thisstudy. All instruments were operated in close proximity to the stove tomeasure the exposures to the study participants while they werecooking, except for the NanoTracer which was placed in the living roomwhere study participants stayed during the post-cooking period.
2.4. Physiological responses
The brain electrical waves were recorded using quantitative elec-troencephalography (QEEG) (Brain Master Discovery 24 amplifier) atdifferent sites of the scalp. An electro-cap (eci) fitted with 19 scalp
electrodes (Fp1, Fp2, F3, F4,C3, C4, P3, P4, O1, O2, F7, F8, T3, T4, T5,T6, Fz, Cz, and Pz) was placed on the head according to the 10–20international systems. Two electrodes were placed at the left and rightears as a linked-ear reference (Rotondi et al., 2016). The EEG mea-surements were taken at 256 Hz. The online filter with 0.1–40 Hz bandpass filter was applied. Five minutes resting-state EEGs with studyparticipants’ eyes closed were recorded during the three steps (beforecooking, at the immediate end of cooking and after cooking). TheNeuro-guide® software was used for pre-processing. The visual selectionwas first utilized by an expert to avoid eye blinking, muscle and cardiacartifacts and then, the automatic artifact rejection algorithm based on z-scores was applied. Thirty four seconds of artifact free signals werereserved for each step to compute the relative power of the signals. TheEEG data were processed offline by Neuroguide software for six fre-quency bands including Delta (1–3.5 Hz), Theta (4.5–7 Hz), Alpha(7.5–12 Hz), Beta1 (12–15 Hz), Beta2 (15–17.5 Hz), and Beta3(18–25 Hz). Then, we considered the percentage of a given power inany band relative to the total power as relative power (RP). The brain isdivided into several lobes including frontal (right and left), temporal(right and left), central, parietal and occipital. Each lobe is representedby several electrodes, and the average of the RP of these electrodes wasrecorded as the average RP over the given lobe. Electrodes F4, F8 andFp2, electrodes F3, F7, Fp1, electrodes T4, T6, electrodes, T3, T5,electrodes C3, C4, Cz, electrodes P3,P4,Pz, and electrodes O1,O2 re-presented right frontal, left frontal, right temporal, left temporal, cen-tral, parietal, and occipital lobes, respectively.
Blood pressures and heart rates were monitored using a 10 seriesblood pressure monitor Model BP786 N (Omron, USA). This digitalblood pressure monitor is capable of recording systolic blood pressure(SBP), diastolic blood pressure (DBP) and heart rate (HR).
2.5. Data analysis
The Friedman test was utilized in our study given that data for therelative power (RP) values of the brain was not normally distributedThe Friedman test is a non-parametric statistical tool employed tomeasure the same characteristic on each subject at different time orunder several different conditions (Friedman, 1937).
If the Friedman test showed statistically significant differences, werun a post hoc test which indicates which means are different. In ourexperiments, we employed the Wilcoxon Test as our post-hoc test(Wilcoxon, 1945).
Since Dusttrak DRX employs a laser scattering method, the esti-mated PM concentrations by this instrument need to be corrected usinga correction factor (CF) obtained through the gravimetric mass mea-surements. In this study, the CF value of 0.7 for frying the ground beefwas obtained from Dacunto et al. (2013).
Hameri et al. (2002) studied the particle detection efficiency for theCPC TSI model 3007. It was reported that a correction needs to be madeto CPC measurements for the concentration range of 105 – 4× 10⁵
particles/cm3. Equation 1 presents the correction. This correction wasapplied to all CPC measurements higher than 105 particles/cm3 in thisstudy.
y=6×10−19 x4 – 10-12 x3 - 4× 10-8 x2 + 0.9 x + 9660.1 1
where x is the CPC measured concentration above 105 particles/cm3,and y is the corrected concentration (particles/cm3).
3. Results
3.1. Exposure assessment
Fig. 1 presents the average oil temperature variations with timeduring the frying of the beef pan-kebabs. Time zero in Fig. 1 corre-sponds to the moment that the pan was placed on the stove and the
M. Naseri, et al. Neurotoxicology 74 (2019) 149–161
151

stove was switched on. When the oil was poured into the pan, thetemperature of the oil reached 70 °C quickly because the pan was al-ready heated for two minutes. The temperature of the oil increasedsteadily with two different rates. During the first seven minutes of theexperiments, the temperature of the oil increased approximately from70 °C to 140 °C. At minute 8, the three pieces of pan-kebabs were placedinto the pan. They were already taken out from the fridge and kept atroom temperature during the experiments until frying at minute 8.Placing the pan-kebabs on the pan produced a slight drop in the oiltemperature and altered the rate of the temperature rise. The oil tem-perature increased to approximately 157 °C at minute 20 when thestove was switched off. Then, the oil temperature dropped to almost70 °C within 10min. The oil temperature variations were reproducedwith a small standard deviation during the 17 experiments, suggestingthat there was very limited variability in the heating system of the stoveand it consistently produced reliable and repeatable outputs during all
experiments.Fig. 2. Meat temperature variations with time during frying pan-
kebab using an electric stoveFrom the time the meat pieces were placed in the pan at minute 8,
the meat temperature at its surface increased from 25 °C (room tem-perature) to approximately 52 °C at minute 11, while the oil tempera-ture was almost constant. At minute 11 the meat was turned for the firsttime. The heating continued until the meat temperature reached ap-proximately 62 °C at minute 14. time and the meat pieces were turnedfor the second time. Heating continued until the temperature reachedapproximately 65 °C at minute 17, at which point the meat pieces wereflipped for the third time. From minute 17,the temperature was de-creased until it reached approximately 45 °C at minute 20, at whichtime the stove was switched off. At this time, the meat was well-doneand thermal equilibrium was established between the oil and the meatat 69 °C. However, since the room temperature above the pan was only
Fig. 1. Oil temperature variations with time during frying pan-kebab using an electric stove.
Fig. 2. shows the meat temperature changes with time during the frying pan-kebab.
M. Naseri, et al. Neurotoxicology 74 (2019) 149–161
152

approximately 30 °C from minute 16, then the surface of the meat re-leased heat to the environment. This observation is consistent with theincreasing trend observed for the indoor air temperature above the panfrom minute 16 to minute 20 (Figure S2), where the meat temperaturedropped while the indoor air temperature above the pan continued toincreased. The convective heat transfer to the environment decreasedthe meat temperature to approximately 45 °C within three minutes.
Figure S2 presents the temperature change above the pan at thebreathing zone representing the indoor air temperature at that height. Itshows that the indoor air temperature above the pan continued to in-crease. The room temperature was recorded to be approximately 27 °Cbefore the start of the experiments at time zero. The indoor air tem-perature underwent three temperature regimes. For the first 8min be-fore the addition of the meat pieces, the rate of the temperature in-crease was larger as compared to the rate during the period of the meatfrying. The air temperature gradually increased during the meat fryinguntil minute 20, at which time the stove was switched off. After thismoment the air temperature remained almost unchanged until the endof the experiments, which followed a mild decrease.
Fig. 3 shows the temporal variations of relative humidity (RH)above the pan at the breathing zone. The RH value at time zero(background) was recorded approximately 32%. The RH decreasedcontinually for the first 8min of the experiments. At minute 8, the RHwas recorded to be 28%. This decrease in RH was likely due to theincreased indoor air temperature over this period (Fig. 3). However, atminute 8 when the meat pieces were placed into the pan, the RHslightly increased even as the room temperature continued to increase.This observation could be attributed to the released moisture from themeat at the elevated temperature the water evaporation from the oilitself could contribute to the increased RH and the subsequent fluc-tuations. The RH fluctuated afterward until minute 17 when the meatwas turned for the third time. At this time point, the RH was recorded tobe approximately 31%. Then, the RH decreased to approximately 27%at minute 22 due to the continuous increase of the indoor air tem-perature. Afterwards, the RH increased towards the end of the experi-ments as the oil cooled down and the room temperature declined.
Fig. 4 presents PM2.5 concentration variations with time in thebreathing zone. When the empty pan was heated for the first twominutes, no contribution to PM concentration was observed. This
observation is consistent with the findings of Amouei Torkmahallehet al. (2018) and Wallace et al. (2014). The heated empty pan con-tributes to particle number concentration rather than particle massconcentration (Wallace et al., 2014). The PM concentration remainedalmost unchanged until the oil temperature reached 140 °C at minute 6.The PM2.5 concentration increased approximately from 0.018 to0.048mg/m3 between minutes 6 and 8 of the experiments. However, atminute 8 when meat was added to the oil, the PM2.5 concentrationdropped. This decreasing trend continued until minute 12 when thePM2.5 concentration reached approximately 0.038mg/m3. Betweenminute 8 and minute 12, during which the PM concentration declined,several influential factors for PM concentration changed. These factorsinclude but are not limited to oil temperature, meat temperature, meatwater content (which affects indoor RH), and surface area of the oil andmeat (Amouei Torkmahalleh et al., 2017a). PM concentration increaseswith oil and meat temperature. In our experiments, meat temperatureincreased from minute 8 to minute 12 (Fig. 2) and oil temperature wasalmost constant (Fig. 1) Thus, an increased PM concentration would beexpected rather than the observed decreasing trend (Fig. 1).
Furthermore, bubble burst at the surface of the oil may have oc-curred. When water in oils evaporates it forms bubbles of oil that burstat the oil surface generating many smaller droplets (Dua and Hopke,1996) that contribute to PM mass concentration. Direct evaporation ofthe water from the meat surface contributes to PM as well. An increasedof RH over this period (Fig. 3) could be due to these phenomena.
Nevertheless, none of the discussed factors support the observeddecreasing trend of PM concentration between minute 8 and 12, in thecurrent study. There could be another critical factor prevailing theother factors including oil and meat temperature, water evaporationand bubble bursts. When the three pieces of the meat were added to theoil, the surface area of the oil available for the evaporation of the oilconstituents were replaced with the meat surface area. It is critical tounderstand which component of frying (oil vs. meat) is more influentialin particle emission. The data from Buonanno et al. (2011) and AmoueiTorkmahalleh et al. (2017a) show that a heated oil produces moreparticles compared to heated meat. Thus, a plausible reason for thereduction in PM concentration between minute 8 to minute 12 could bethe replacement of oil surface with meat surface. From minute 12 tominute 14, when the meat was turned for the second time, the PM
Fig. 3. RH changes with time above the pan at the breathing zone during cooking using an electric stove.
M. Naseri, et al. Neurotoxicology 74 (2019) 149–161
153

concentration increased.In contrast to the first flipping, during the second flipping some oils
could be absorbed to the top and bottom surfaces of the meat. Thus, noopportunity would exist for a decline in PM concentrations.Additionally, during this period oil and meat temperatures continued toincrease, adding to particle emissions. However, no bubble bursts fromthe oil or water evaporation from the meat would be expected as the oiland meat temperatures were sufficiently high (between 130 °C to 139 °Cand between 52 °C to 62 °C, respectively) such that one could assume nowater was left in the oil and meat for bubble bursts and evaporation,respectively. The RH showed no change in this period, confirming thisconcept.
Finally, during the third flipping (minute 14 to minute 17) and to-wards the end of the experiments (minute 20), the PM2.5 concentrationcontinually decreased from approximately 0.055mg/m3 to 0.035mg/m3. After 30min of the experiments, the PM concentration almostreached the background level (0.025mg/m3). The decay in PM con-centration could be due to the continuous reduction in the amount of oiland its surface area during frying. The oil partly evaporated and partlywas absorbed into the meat. The meat surface was well cooked andtherefore there was limited opportunity for particle emission from thesurface of the meat.
Previous studies showed that frying meat produces particles withconcentrations in the order of 105 particles/cm3 (Zhang et al., 2010;Jorgensen et al., 2013; Yeung and To, 2008; Dennekamp et al., 2001;Amouei Torkmahalleh et al., 2017d). Zhang et al. (2010) conducted acontrolled study to understand the influence of stove type on PM2.5 andparticle number concentrations emitted during frying chicken. Theirresults showed that while the ventilation was off and the heating levelwas at medium, frying chicken on an electric stove resulted in particlenumber and mass concentrations to be 0.35× 10⁵ particles/cm3 and10 μg/m3, respectively. The heating duration was reported to be 28min(Zhang et al., 2010). Buonanno et al. (2011) obtained 2.8×10⁵ par-ticles/cm3 and 2.7×10⁴ particles/cm3 particle concentration fromfrying bacon and other pork meat, respectively. Similar experimentswere done by Zhang et al (2010). They observed a total particle numberconcentration from 5 nm to few microns using a water-based Con-densation Particle Counter (Model 3785, TSI Inc). The authors reported6.04×105 particles/cm3 UFP concentration from frying chicken.
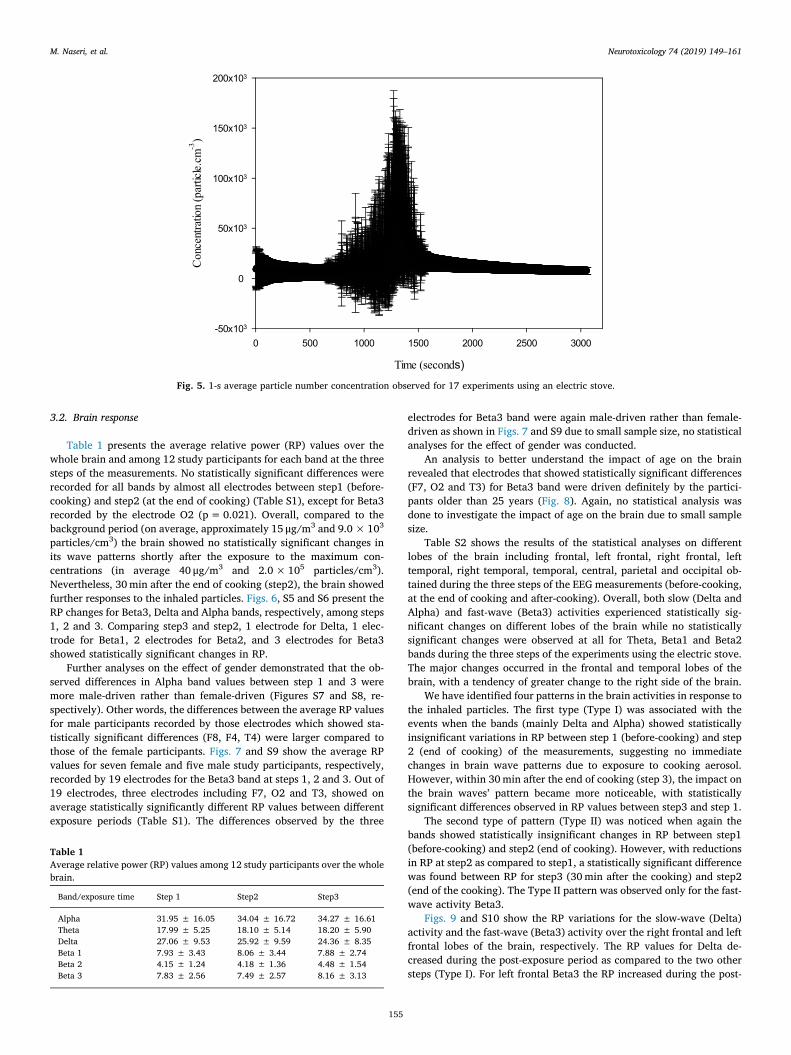
Fig. 5 presents the average (N=17) UFP concentration variations(1 s logging intervals) for 51min of the experiments for the frying pan-
kebab using an electric stove. The first 20min indicates the cookingtime and the last 30min indicates the post-exposure time. We can seethat the initial background concentration is approximately 9.0× 10³
particles/cm3, while the highest concentration was recorded to be ap-proximately 2.0×10⁵ particles/cm3. After approximately 27min(1600 s) of the experiments, the background concentration was re-es-tablished. Figure S3 presents the 1-minute averaged UFP concentra-tions. The concentration rate reported in Fig. 5 and Figure S3 are dif-ferent due to the different logging intervals (1 s vs 1min). The highestconcentration reported to be 7.0× 10⁴ particles/cm3 (averaged over1min for 12 experiments) was reached with two minutes delay (atminute 22) after the completion of the cooking (when the stove wasoff). This delayed peak concentration can be explained by the coagu-lation of particles smaller than 10 nm that are below the detection limitof the CPC. However, due to the coagulation, the particles can grow tolarger than 10 nm and be detected by the CPC. The average particlediameter and the total surface area concentration in the current studywere estimated to be 52 nm and 26.7 μm2/cm3, respectively, implyingthe emission of UFPs. The range of PM and UFP concentrations reportedin the literature reviewed by Abdullahi et al. (2013) varies from8×10−3 to 1.40mg/m3 and from 5.7×10³ particles/cm3 to8.9×106 particles/cm3, respectively. This review shows that fryingpan-kebab using an electric stove in the current study could be con-sidered as low- exposure cooking, as compared to the literature. Thewide range of variability observed in concentration values in the lit-erature could be influenced by the type of PM sources, ventilationconditions, the volume of the house, location of the sampling port,outdoor particle infiltration and environmental conditions such surfacematerials, indoor temperature and humidity.
Figure S4 presents the increases in CO2 concentrations with timeduring the experiments using an electric stove. The CO2 concentrationcontinuously increased at all stages of the experiments from approxi-mately 720 ppm (background) to 820 ppm (when the stove was turnedoff). This trend continued until the end of the measurements when theconcentration reached approximately 880 ppm. The CO2 concentrationsin this study are in agreement with those findings of AmoueiTorkmahalleh et al. (2018) which were obtained during grilling groundbeef. The results of the present study show no particular impact on CO2
concentrations when the meat is added or turned. In addition to thefrying, the presence of the humans in the room could add to the ac-cumulation of CO2 during the experiments.
Fig. 4. PM2.5 changes with time above the pan at the breathing zone (N=17) during the experiments using the electric stove.
M. Naseri, et al. Neurotoxicology 74 (2019) 149–161
154
3.2. Brain response
Table 1 presents the average relative power (RP) values over thewhole brain and among 12 study participants for each band at the threesteps of the measurements. No statistically significant differences wererecorded for all bands by almost all electrodes between step1 (before-cooking) and step2 (at the end of cooking) (Table S1), except for Beta3recorded by the electrode O2 (p=0.021). Overall, compared to thebackground period (on average, approximately 15 μg/m3 and 9.0×10³
particles/cm3) the brain showed no statistically significant changes inits wave patterns shortly after the exposure to the maximum con-centrations (in average 40 μg/m3 and 2.0×10⁵ particles/cm3).Nevertheless, 30min after the end of cooking (step2), the brain showedfurther responses to the inhaled particles. Figs. 6, S5 and S6 present theRP changes for Beta3, Delta and Alpha bands, respectively, among steps1, 2 and 3. Comparing step3 and step2, 1 electrode for Delta, 1 elec-trode for Beta1, 2 electrodes for Beta2, and 3 electrodes for Beta3showed statistically significant changes in RP.
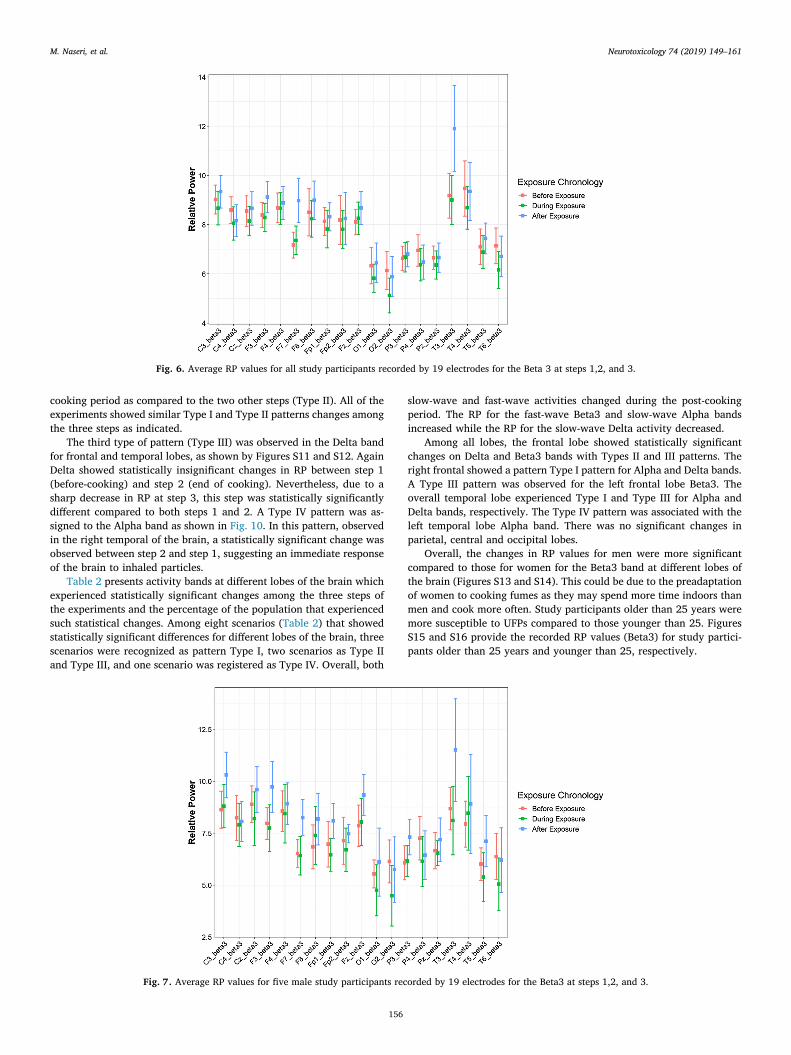
Further analyses on the effect of gender demonstrated that the ob-served differences in Alpha band values between step 1 and 3 weremore male-driven rather than female-driven (Figures S7 and S8, re-spectively). Other words, the differences between the average RP valuesfor male participants recorded by those electrodes which showed sta-tistically significant differences (F8, F4, T4) were larger compared tothose of the female participants. Figs. 7 and S9 show the average RPvalues for seven female and five male study participants, respectively,recorded by 19 electrodes for the Beta3 band at steps 1, 2 and 3. Out of19 electrodes, three electrodes including F7, O2 and T3, showed onaverage statistically significantly different RP values between differentexposure periods (Table S1). The differences observed by the three
electrodes for Beta3 band were again male-driven rather than female-driven as shown in Figs. 7 and S9 due to small sample size, no statisticalanalyses for the effect of gender was conducted.
An analysis to better understand the impact of age on the brainrevealed that electrodes that showed statistically significant differences(F7, O2 and T3) for Beta3 band were driven definitely by the partici-pants older than 25 years (Fig. 8). Again, no statistical analysis wasdone to investigate the impact of age on the brain due to small samplesize.
Table S2 shows the results of the statistical analyses on differentlobes of the brain including frontal, left frontal, right frontal, lefttemporal, right temporal, temporal, central, parietal and occipital ob-tained during the three steps of the EEG measurements (before-cooking,at the end of cooking and after-cooking). Overall, both slow (Delta andAlpha) and fast-wave (Beta3) activities experienced statistically sig-nificant changes on different lobes of the brain while no statisticallysignificant changes were observed at all for Theta, Beta1 and Beta2bands during the three steps of the experiments using the electric stove.The major changes occurred in the frontal and temporal lobes of thebrain, with a tendency of greater change to the right side of the brain.
We have identified four patterns in the brain activities in response tothe inhaled particles. The first type (Type I) was associated with theevents when the bands (mainly Delta and Alpha) showed statisticallyinsignificant variations in RP between step 1 (before-cooking) and step2 (end of cooking) of the measurements, suggesting no immediatechanges in brain wave patterns due to exposure to cooking aerosol.However, within 30min after the end of cooking (step 3), the impact onthe brain waves’ pattern became more noticeable, with statisticallysignificant differences observed in RP values between step3 and step 1.
The second type of pattern (Type II) was noticed when again thebands showed statistically insignificant changes in RP between step1(before-cooking) and step2 (end of cooking). However, with reductionsin RP at step2 as compared to step1, a statistically significant differencewas found between RP for step3 (30min after the cooking) and step2(end of the cooking). The Type II pattern was observed only for the fast-wave activity Beta3.
Figs. 9 and S10 show the RP variations for the slow-wave (Delta)activity and the fast-wave (Beta3) activity over the right frontal and leftfrontal lobes of the brain, respectively. The RP values for Delta de-creased during the post-exposure period as compared to the two othersteps (Type I). For left frontal Beta3 the RP increased during the post-
Fig. 5. 1-s average particle number concentration observed for 17 experiments using an electric stove.
Table 1Average relative power (RP) values among 12 study participants over the wholebrain.
Band/exposure time Step 1 Step2 Step3
Alpha 31.95 ± 16.05 34.04 ± 16.72 34.27 ± 16.61Theta 17.99 ± 5.25 18.10 ± 5.14 18.20 ± 5.90Delta 27.06 ± 9.53 25.92 ± 9.59 24.36 ± 8.35Beta 1 7.93 ± 3.43 8.06 ± 3.44 7.88 ± 2.74Beta 2 4.15 ± 1.24 4.18 ± 1.36 4.48 ± 1.54Beta 3 7.83 ± 2.56 7.49 ± 2.57 8.16 ± 3.13
M. Naseri, et al. Neurotoxicology 74 (2019) 149–161
155
cooking period as compared to the two other steps (Type II). All of theexperiments showed similar Type I and Type II patterns changes amongthe three steps as indicated.
The third type of pattern (Type III) was observed in the Delta bandfor frontal and temporal lobes, as shown by Figures S11 and S12. AgainDelta showed statistically insignificant changes in RP between step 1(before-cooking) and step 2 (end of cooking). Nevertheless, due to asharp decrease in RP at step 3, this step was statistically significantlydifferent compared to both steps 1 and 2. A Type IV pattern was as-signed to the Alpha band as shown in Fig. 10. In this pattern, observedin the right temporal of the brain, a statistically significant change wasobserved between step 2 and step 1, suggesting an immediate responseof the brain to inhaled particles.
Table 2 presents activity bands at different lobes of the brain whichexperienced statistically significant changes among the three steps ofthe experiments and the percentage of the population that experiencedsuch statistical changes. Among eight scenarios (Table 2) that showedstatistically significant differences for different lobes of the brain, threescenarios were recognized as pattern Type I, two scenarios as Type IIand Type III, and one scenario was registered as Type IV. Overall, both
slow-wave and fast-wave activities changed during the post-cookingperiod. The RP for the fast-wave Beta3 and slow-wave Alpha bandsincreased while the RP for the slow-wave Delta activity decreased.
Among all lobes, the frontal lobe showed statistically significantchanges on Delta and Beta3 bands with Types II and III patterns. Theright frontal showed a pattern Type I pattern for Alpha and Delta bands.A Type III pattern was observed for the left frontal lobe Beta3. Theoverall temporal lobe experienced Type I and Type III for Alpha andDelta bands, respectively. The Type IV pattern was associated with theleft temporal lobe Alpha band. There was no significant changes inparietal, central and occipital lobes.
Overall, the changes in RP values for men were more significantcompared to those for women for the Beta3 band at different lobes ofthe brain (Figures S13 and S14). This could be due to the preadaptationof women to cooking fumes as they may spend more time indoors thanmen and cook more often. Study participants older than 25 years weremore susceptible to UFPs compared to those younger than 25. FiguresS15 and S16 provide the recorded RP values (Beta3) for study partici-pants older than 25 years and younger than 25, respectively.
Fig. 6. Average RP values for all study participants recorded by 19 electrodes for the Beta 3 at steps 1,2, and 3.
Fig. 7. Average RP values for five male study participants recorded by 19 electrodes for the Beta3 at steps 1,2, and 3.
M. Naseri, et al. Neurotoxicology 74 (2019) 149–161
156

4. Discussions
UFPs could reach the brain via olfactory, axonal transport and ca-pillary direct transport. The nasal mucosa is highly vascularized forrapid absorption of chemicals and drugs. Both soluble and insolubleparticles should be able to reach the brain through this pathway. Thecapillary transport is a faster and more effective pathway, and mainlyinsoluble particles should translocate to the brain through this pathway.The smaller UFPs the more effective in crossing the alveolar/capillarybarrier (McMartin et al., 1987). Additionally, particles can affect thebrain by inflammatory spillover to the Central Nervous System (CNS),which is mainly recognized by the production of cytokine in the blood(Balasubramanian et al., 2013; Elder et al., 2006). The translocationfrom blood to the brain was observed in animal studies as early as 1 h,6 h and 1 day for, 195Au, 192Ir, and 13C UFPs, respectively (Kreylinget al., 2017b, 2002; Oberdörster et al., 2004). The kinetics of the UFPtranslocation to the brain through the olfactory bulb in rats was alsoaddressed in the literature. Oberdörster et al. (2004) reported thetransport of the elemental 13C UFPs (36 nm in diameter and at theconcentration of 160 μg/m3) to the Olfactory bulb of rats within oneday after the 6 -h exposure. A similar observation was made by Elderet al. (2006) such that within 30min after intranasally instilled ex-posure to Mn oxide by rats, 0.2% of the UFPs deposited in the olfactory
mucosa were translocated to the olfactory bulb, and this fraction in-creased to 6.8% after 24 h post-exposure (Elder et al., 2006).
Three major observations can be made using the results obtainedduring the electric stove experiments in the current study.
Firstly, the results showed that during the electric stove experimentsalmost no immediate significant changes to the brain were observedexcept for the Alpha band at right temporal lobe, while significantchanges took place with a delay (up to 30min) after the exposure tocooking aerosol.
Secondly, only the frontal and temporal lobes of the brain wereresponded while occipital, parietal and central lobes of the brain werenot affected during electric stove experiments. Black Carbon (BC)emissions from cooking fumes were addressed in several studies, typi-cally when solid fuels were used (Rupakhetia et al., 2019; Buonannoet al., 2013a,b; Ravindra, 2019). However, no information is availableregarding the emission rates of black carbon from different cookingcomponents such as oil, meat, and gas flame during cooking. The majorconstitutes of the oil particles could be organic carbon (OC) (AmoueiTorkmahalleh et al., 2017b). Also, it is not yet clear whether the oilparticles are soluble or insoluble or both. Soluble particles should washout from the body, while insoluble particles are more likely to trans-locate to the secondary organs. Another existing gap in the literature isthe morphology of the cooking particles which helps to better
Fig. 8. Average RP values for study participants older than 25 (N=6) recorded by 19 electrodes for the Beta3 at steps 1,2, and 3.
Fig. 9. RP values obtained for Beta3 band on the left frontal lobe at three steps of the measurements.
M. Naseri, et al. Neurotoxicology 74 (2019) 149–161
157

understand the particle transport in the respiratory system and also theparticle translocation in the blood circulation. Buonanno et al., 2009,studied the morphology of particles from grilling using a gas stove.They reported the presence of the aggregates of particles with chain-like structures as the major structure. However, single spherical nan-ometer size particles were also observed. The aggregate structure of the
particles might be an obstacle to pass the blood-air barrier and alsoblood-brain barrier.
Assuming there exist insoluble UFPs among oil particles (for ex-ample black carbon) and also not aggregated, the translocation of suchparticles to the frontal and temporal part of the brain could occur viathe olfactory pathway as well as the Anterior Cerebral Artery (ACA).
Fig. 10. RP values obtained for Alpha band on the right temporal lobe at steps1, 2, and 3.
Table 2Different types of brain wave patterns recorded at the different lobes.
Number Lobe Statistically significant Before-During
Statistically significant Before-After
Statistically significant During-After
Statistically increase ordecrease
Pattern Type
1 Frontal – Delta Delta Decrease (83%) III2 Frontal – – Beta3 Increase (67%) II3 Right Frontal – Delta – Decrease (83%) I4 Right Frontal – Alpha – Increase (83%) I5 Left Frontal – – Beta3 Increase (75%) II6 Temporal – Delta (92%) Delta (83%) Decrease III7 Temporal – Alpha – Increase (92%) I8 Right Temporal Alpha Alpha – Increase (75%) IV
Fig. 11. Changes in average SBP, DBP, and HR of the 12 participants at steps 1, 2, and 3.
M. Naseri, et al. Neurotoxicology 74 (2019) 149–161
158

The ACA arises from the internal carotid at nearly a right angle. It sendsdeep penetrating branches to supply the most anterior portions of thebasal ganglia. It then sweeps forward into the interhemispheric fissure,and then runs up and over the genu of the corpus callosum beforeturning backwards along the corpus callosum. As it runs backwards itforms one branch that stays immediately adjacent to the corpus cal-losum while a second branch runs in the cingulate sulcus (just superiorto the cingulate gyrus).
If we assume that oil UFPs are soluble or are aggregate that cannotenter the blood circulation, then the olfactory pathway could be themajor pathway for UFPs to reach the brain. In this case, again thefrontal and temporal lobes could be the main targets for the UFPs.
Thirdly, the fast-wave frequency band (Beta3) increased after ex-posure to cooking aerosol. These three major findings in the presentstudy are consistent with the observations made by Cruts et al. (2008).The authors exposed ten study participants to diesel engine (DE) for 1 hoffering 1.2× 10⁶ particles/cm3 (300 μg/m3), and studied the effect ofthe exposure on the study participants brain using EEG. The authorsobserved increases in fast-wave frequency bands (beta) at the frontallobe while no changes occurred for slow-wave bands (delta, theta andalpha). The statistically significant changes mainly occurred during thepost-exposure. Also, no changes to the parietal and central parts of thebrain were observed.
It is certain that during the electric stove cooking, the exposure toUFPs until the second EEG did not affect the brain, which could be dueto the relatively low concentration of UFPs up to minute 20, as shownby Figs. 5 and S3, although the PM2.5 concentration already almostreached its peak at minute 15 (Fig. 4). The concentration of PM2.5 wasat the background level almost after the second EEG, and thus no ex-posure to particle mass occurred between the second and third EEGmeasurements. This observation demonstrates that particle numberconcentration could be more influential on human health than particlemass concentration. Figs. 5 and S3 demonstrate that the participantswere still exposed to particles even after the completion of the secondEEG measurement (end of cooking), conducted at minute 20. As shownat minute 20, the UFP concentration continued to rise such that a de-layed peak in UFP concentrations was observed at minute 25. After-wards, particle decay commenced and ended at minute 30. The ex-posure to UFPs continued to take place during the decay period untilthe concentration reached the background level, approximately atminute 30. This was almost 20min before the third EEG measurement.
No statistically significant changes (p < 0.05) were observed inDBP, SBP, and HR of the participants during the three steps of themeasurements (Fig. 11). This observation is consistent with Cruts et al.(2008) who reported no changes in HR of the study participants ex-posed to DE.
Both gaseous compounds and UFPs might be responsible for theobserved changes in the brain’s functions in the present study.However, the threshold concentrations at which the cooking gases andUFPs exert significant changes to the brain’s wave pattern are unknown.The produced gases could be smelled through the olfactory bulb andwould be expected to alter the wave patterns of the brain in the frontaland temporal lobes. It was reported that olfactory sensitization tochemical stimulation is usually recognized by increases in the activityof the slow-wave bands such as Delta (Bell et al., 1999) and in Alpha(Bell et al., 2013). In this study, increases in Alpha were observed.However, Delta band activities decreased. Future research is needed tobetter understand the relative importance of exposure to the cookinggases and UFPs on brain activity. The current study was limited tomeasuring only CO2 as a gas. The CO2 measurements were intended toensure that there was no gaseous compounds between the two cookingexperiments which can interfere with experimental results. No inter-ference of CO2 between the two following experiments was observed.
Increased activities of Delta and Theta are associated with vigilance(Coull, 1998). Frontal and parietal are most often associated with at-tentional tasks (Coull, 1998). Nevertheless, we observed decreases inTa
ble3
Compa
risonbe
twee
nthediag
noseddiseases
usingEE
G,a
ndothe
rPM
expo
sure
stud
ieswith
thepresen
tstud
y.
Disea
seDelta
Theta
Alpha
Beta
Commen
tRe
ferenc
e
Alzhe
imer
increa
seincrea
sede
crea
sede
crea
seOccipita
lalpha
ispreserve
d.Increa
sedslow
-wav
eat
leftTe
mpo
rallob
e–
Amplitu
dean
dEE
Gpo
wer
weremea
sured
Jeon
get
al.(
2004
);Mican
ovic
andPa
l(201
4);M
alek
etal.(
2017
)Va
scular
Dem
entia
(VAD)
increa
seincrea
seTe
mpo
ral
Rosénet
al.(
1997
);Ca
lzetti
etal.,20
02)
Dem
entia
with
LewyBo
dies
(DLB
)increa
seincrea
seLo
ssof
Alpha
Mican
ovic
andPa
l(20
14)
Obsessive
–Com
pulsiveDisorde
r(O
CD)
decrea
seBu
ccie
tal.(
2004
)Pa
rkinson
increa
seincrea
sede
crea
sede
crea
seRigh
ttempo
ral,left
fron
tal,left
tempo
ral,left
centrala
ndleft
occipital-
relativ
epo
wer
was
mea
sured.
Malek
etal.(
2017
);So
ikke
liet
al.(
1991
);Han
etal.(
2013
)Sc
hizo
phrenia
increa
seOccipita
l,fron
tala
ndleft
tempo
ral
Mientus
etal.(
2002
)Ex
posure
todiesel
exha
ust
Noch
ange
Noch
ange
Noch
ange
increa
sesin
Beta2
Smok
ing-1
decrea
sede
crea
seIncrea
se(alpha
2)Decrease
(alpha
1)increa
seMea
suremen
tson
smok
ers
Dom
ino,
2003
Smok
ing-2
decrea
sede
crea
seincrea
seMea
suremen
tson
smok
ers
Golding
,198
8Sm
oking-4
increa
seMea
suremen
tsaftersm
oking-
Onlyalph
aba
ndwas
repo
rted
Dom
inoet
al.,20
09Sm
oking-5
decrea
sede
crea
seincrea
seMea
suremen
tsaftersm
oking
Knott,19
88Co
okingon
electric
stov
ede
crea
seNoch
ange
increa
seIncrea
sesinBe
ta3
Thepresen
tstudy
M. Naseri, et al. Neurotoxicology 74 (2019) 149–161
159

the activities of the Delta and no changes in Theta, suggesting no effecton the brain due to boredom and lowered vigilance experienced by thestudy participants after an almost 80min stay in the experimentalapartment.
Table 3 compares the results of the current study with other clinicalexposure and neurodegenerative disorders diagnosed using the EEG. Alowering of brain activity based on EEG results was observed in neu-rodegenerative diseases (Table 3), including Alzheimer’s and Parkin-son’s such that delta and theta bands mainly increased and the betaband decreased. Exposure to electric stove cooking aerosol showed areverse impact on the brain such that fast-wave frequency Beta3 in-creased and slow-wave frequency Delta decreased. However, it is pos-sible that the brain wave patterns for neurodegenerative disorder pa-tients may also change over the time as their diseases progress.
Exposure to diesel exhaust (DE) has shown increases in the fast-wave Beta, suggesting a similar pattern between exposure to DE andelectric stove cooking aerosol with respect to fast-wave bands.However, the DE study reported no changes in slow-wave bands whilethe electric stove study observed decreases in slow-wave Delta. Thegreatest similarity in EEG patterns was observed between smokingstudies and cooking using electric stove such that the both caused de-creases and increases in several cases in the activity of the Delta andAlpha bands, respectively, and the fast-wave bands increased for bothof them.
5. Conclusion
Exposure to aerosol (both UFPs and gases) from electric stove fryinghas a significant impact on human brain particularly on the frontal andtemporal lobes. There is a 30min delay on average in brain response.Also, gender is a key factor in the brain responses to the aerosol fromelectric stove frying. People with sustained exposures such as thoselikely present in occupational settings, or during prolonged homecooking are of concern given the long term effects due to chronic ex-posures.
We found that exposure to aerosol from electric stove frying showedsimilar patterns in the slow-wave (decreased) and fast-wave (increased)bands of the brain as those of smokers and also as those who wereexposed to smoking aerosol. No similarity to neurodegenerative dis-eases in EEG patterns was observed. No definitive conclusion can bemade on the pathways (blood circulation vs. olfactory pathway) for theparticle translocation to the brain in the present study as some keyinformation such as morphology and solubility of the frying particlesare required.
Acknowledgment
The authors of this study would like to acknowledge NazarbayevUniversity for providing the Faculty Small Grant (No: 090118FD5315)to the authors of this manuscript to conduct this study.
Appendix A. Supplementary data
Supplementary material related to this article can be found, in theonline version, at doi:https://doi.org/10.1016/j.neuro.2019.06.008.
References
Abdullahi, K., Delgado-Saborit, J., Harrison, R., 2013. Emissions and indoor concentra-tions of particulate matter and its specific chemical components from cooking: areview. Atmos. Environ. 71, 260–294.
Amouei Torkmahalleh, M., Goldasteh, I., Zhao, Y., Udochu, N., Rossner, A., Hopke, P.,Ferro, A., 2012. PM2.5 and ultrafine particles emitted during heating of commercialcooking oils. Indoor Air 22, 483–491.
Amouei Torkmahalleh, M., Zhao, Y., Rossner, A., Hopke, P., Ferro, A., 2013. Additiveimpacts on particle emissions from heating low emitting cooking oils. Atmos.Environ. 74, 194–198.
Amouei Torkmahalleh, M., Ospanova, S., Baibatyrova, S., Nurbay, S., Zhanakhmet, G.,
Shah, D., 2018. Contributions of burner, pan, meat and salt to PM emission duringgrilling. Environ. Res. 164, 11–17.
Amouei Torkmahalleh, M., Gorjinezhad, S., Unluevcek, H.S., Hopke, P.K., 2017a. Reviewof factors impacting emission/concentration of cooking generated particulate matter.Sci. Total Environ. 586, 1046–1056.
Amouei Torkmahalleh, M., Gorjinezhad, S., Keles, M., Ozturk, F., Hopke, P.K., 2017b. Sizesegregated PM and its chemical composition emitted from heated corn oil. Environ.Res. 154, 101–108.
Amouei Torkmahalleh, M., Kaibaldiyeva, U., Kadyrbayeva, A., 2017c. A new computermodel for the simulation of particulate matter formation from heated cooking oilsusing Aspen Plus. Build. Simul. 10 (4), 535–550.
Amouei Torkmahalleh, M., Gorjinezhad, S., Keles, M., Unluevcek, H.S., Azgin, C., Cihan,E., Tanis, B., Soy, N., Ozaslan, N., Ozturk, F., Hopke, P.K., 2017d. A controlled studyfor the characterization of PM2.5 emitted during heating ground beef meat. J. AerosolSci. 103, 132–140.
Balasubramanian, S.K., Poh, K.W., Ong, C.N., Kreyling, W.G., Ong, W.Y., Yu, L.E., 2013.The effect of primary particle size on biodistribution of inhaled gold nano-agglom-erates. Biomaterials 34 (22), 5439–5452. https://doi.org/10.1016/j.biomaterials.2013.03.080. PMID: 23639527.
Bell, I.R., Szarek, M.J., Dicenso, D.R., Baldwin, C.M., Schwartz, G.E., Bootzin, R.R., 1999.Patterns of walking EEG spectral power in chemically intolerant individuals duringrepeated chemical exposures. Int. J. Neurosci. 97 (1-2), 41–59.
Bell, I.R., Brooks, A.J., Howerter, A., Jackson, N., Schwartz, G.E., 2013. Acute electro-encephalographic effects from repeated olfactory administration of homeopathicremedies in individuals with self-reported chemical sensitivity. Alternm Ther HealthMed 19 (1), 46–57.
Bucci, P., Mucci, A., Volpe, U., Merlotti, E., Galderisi, S., Maj, M., 2004. Executive hy-percontrol in obsessive–compulsive disorder: electrophysiological and neuropsycho-logical indices. Clin. Neurophysiol. 115 (6), 1340–1348.
Buonanno, G., Johnson, G., Morawska, L., Stabile, L., 2011. Volatility characterization ofcooking-generated aerosol particles. Aerosol Sci. Technol. 45, 1069–1077.
Buonanno, G., Morawska, L., Stabile, L., 2009. Particle emission factors during cookingactivities. Atmos. Environ. 43, 3235–3242.
Buonanno, G., Marks, G., Morawska, L., 2013a. Health effects of daily airborne particledose in children: direct association between personal dose and respiratory healtheffects. Environ. Pollut. 180, 246–250.
Buonanno, G., Stabile, L., Morawska, L., Russi, A., 2013b. Children exposure assessmentto ultrafine particles and black carbon: the role of transport and cooking activities.Atmos. Environ. 79, 53–58.
Calderon-Garciduenas, L., Franco-Lira, M., Torres-Jardon, R., Henriquez-Roldan, C.,Barragan-Mejia, G., Valencia-Salazar, G., Gonzalez-Maciel, A., Reynoso-Robles, R.,Villarreal-Calderon, R., Reed, W., 2007. Pediatric respiratory and systemic effects ofchronic air pollution exposure: nose, lung. Heart, and brain pathology. Toxicol.Pathol. 35 (1), 154–162.
Coull, J.T., 1998. Neural correlates of attention and arousal: insights from electro-physiology, functional neuroimaging and psychopharmacology. Prog. Neurobiol. 55(4), 343–361.
Cruts, B., Driessen, A., van Etten, L., Törnqvist, H., Blomberg, A., Sandström, T., Mills,N.L., Borm, P.J., 2008. Exposure to diesel exhaust induces changes in EEG in humanvolunteers. Part. Fibre Toxicol. 5:4. https://doi.org/10.1186/1743-8977-5-4.
Dacunto, P.J., et al., 2013. Real-time particle monitor calibration factors and PM2.5emission factors for multiple indoor sources. Environ. Sci.: Processes Impacts 15,1511.
Dennekamp, M., Howarth, S., Dick, C., Cherrie, J., Donaldson, K., Seaton, A., 2001. Ul-trafine particles and nitrogen oxides generated by gas and electric cooking. Occup.Environ. Med. 58, 511–516.
Domino, E.F., 2003. Effects of tobacco smoking on electroencephalographic, auditoryevoked and event related potentials. Brain Cogn. 53 (1), 66–74.
Domino, E.F., Ni, L., Thompson, M., Zhang, H., Shikata, H., Fukai, H., Sakaki, T., Ohya, I.,2009. Tobacco smoking produces widespread dominant brain wave alpha frequencyincreases. Int. J. Psychophysiol. 74 (3), 192–198.
Dua, S., Hopke, P., 1996. Hygroscopic growth of assorted indoor aerosols. Aerosol Sci.Technol. 24, 151–160.
Elder, A., Gelein, R., Silva, V., et al., 2006. Translocation of inhaled ultrafine manganeseoxide particles to the central nervous system. Environ. Health Perspect. 114 (8),1172–1178. https://doi.org/10.1289/ehp.9030.
Friedman, Milton, 1937. The use of ranks to avoid the assumption of normality implicit inthe analysis of variance. J. Am. Stat. Assoc. 32 (200), 675–701.
Gao, J., Cao, C., Wang, L., Song, T., Zhou, X., Yang, J., Zhang, X., 2013a. Determination ofsize-dependent source emission rate of cooking-generated aerosol particles at the oil-heating stage in an experimental kitchen. Aerosol Air Qual. Res. 13, 488–496.
Gao, J., Cao, C., Zhang, X., Luo, Z., 2013b. Volume-based size distribution of accumu-lation and coarse particles (PM0.1-10) from cooking fume during oil heating. Build.Environ. 59, 575–580.
Golding, J.F., 1988. Effects of cigarette smoking on resting EEG, visual evoked potentialsand photic driving. Pharmacol Biochem Behave 29 (1), 23–32.
Gorjinezhad, S., Kerimray, A., Amouei Torkmahalleh, M., Keles, M., Ozturk, F., Hopke,P.K., 2017. Quantifying trace elements in the emitted particulate matter duringcooking and health risk assessment. Environ. Sci. Pollut. Res. - Int. 24 (10),9515–9529.
Hameri, K., Koponen, I., Aalto, P., Kulmala, M., 2002. The particle detection efficiency ofthe TSI-3007 condensation particle counter. Aerosol Science 33, 1463–1469.
Han, C.X., Wang, J., Yi, G.S., Che, Y.Q., 2013. Investigation of EEG abnormalities in theearly stage of Parkinson’s disease. Cogn. Neurodyn. 7 (4), 351–359.
He, C., Morawska, L., Hitchins, J., Gilbert, D., 2004. Contribution from indoor sources toparticle number and mass concentrations in residential houses. Atmos. Environ. 38,
M. Naseri, et al. Neurotoxicology 74 (2019) 149–161
160

3405–3415.Jeong, J., 2004. EEG dynamics in patients with Alzheimer’s disease. Clin. Neurophysiol.
115 (7), 1490–1505.Jorgensen, R., Strandberg, B., Sjaastad, A., Johansen, A., Svendsen, K., 2013. Simulated
restaurant cook exposure to emissions of pahs, mutagenic aldehydes, and particlesfrom frying bacon. J. Occup. Environ. Hyg. 10, 122–131.
Knott, V.J., 1988. Dynamics EEG changes during cigarette smoking. Neuropsychobiology19 (1), 54–60.
Kreyling, W.G., Semmler, M., Erbe, F., Mayer, P., Takenaka, S., Schulz, H., Oberdorster,G., Ziesenis, A., 2002. Translocation of ultrafine insoluble iridium particles from lungepithelium to extrapulmonary organs is size dependent but very slow. J. Toxicol.Environ. Health Part A 65 (20), 1513–1530.
Kreyling, W.G., Holzwarth, U., Haberl, N., Kozempel, J., Wenk, A., Hirn, S., Schleh, S.,Schaffler, M., Lipka, J., Semmler-Behnke, M., Gibsen, N., 2017b. Quantitative bio-kinetics of titanium dioxide nanoparticles after intratracheal instillation in rats: (Part3). Nanotoxicology 11 (4), 454–464.
Lasselin, J., Magne, E., Beau, C., Aubert, A., Dexpert, S., Carrez, J., Layé, S., Forestier, D.,Ledaguenel, P., Capuron, L., 2016. Low-grade inflammation is a major contributor ofimpaired attentional set shifting in obese subjects. Brain Behav. Immun. 58, 63–68.
Long, C., Suh, H., Koutrakis, P., 2000. Characterization of indoor particle sources usingcon- tinuous mass and size monitors. J. Air Waste Manage. Assoc. 50, 1236–1250.
Lucchini, R.G., Dorman, D.C., Elder, A., Veronesi, B., 2012. Neurological impacts frominhalation of pollutants and the nose-brain connection. Neurotoxicology 33 (4),838–841.
Malek, N., Baker, M.R., Mann, C., Greene, J., 2017. Electroencephalographic markers indementia. Acta Neuro Scand 135, 388–393.
McDonald, J., Zielinska, B., Fujita, E., Sagebiel, J., Chow, J., Watson, J., 2003. Emissionsfrom charbroiling and grilling of chicken and beef. J. Air Waste Manage. Assoc. 53,185–194.
McMartin, C., Hutchinton, L.E., Hyde, R., Peters, G.E., 1987. Analysis of structural re-quirements for the absorption of drugs and macromolecules from the nasal cavity. J.Pharm. Sci. 76, 535–540.
Micanovic, C., Pal, S., 2014. The diagnostic utility of EEG in early-onset dementia: asystematic review of the literature with narrative analysis. J. Neural Transm. 121,59–69.
Mientus, S., Gallinat, J., Wuebben, Y., Pascual-Marqui, R.D., Mulert, C., Frick, K., Dorn,H., Herrmann, W.M., Winterer, G., 2002. Cortical hypoactivation during resting EEGin schizophrenics but not in depressives and schizotypal subjects as revealed by lowresolution electromagnetic tomography (LORETA). Psychiatry Res. 116, 95–111.
Nasir, Z., Colbeck, I., 2013. Particulate pollution in different housing types in a uk sub-urban location. Sci. Total Environ. 445–446, 165–176.
Nel, A., Xia, T., Madler, L., Li, N., 2006. Toxic potential of materials at the nanolevel.Science 311 (5761), 622–627.
Oberdörster, G., Sharp, Z., Atudorei, V., Elder, A., Gelein, R., Kreyling, W., Cox, C., 2004.Translocation of ultrafine particles to the brain. Inhalation Toxicology InternationalForum for Respiratory Research. 16 (6–7), 437–445.
Pickering, T.G., Hall, J.E., Appel, L.J., Falkner, B.E., Graves, J., Hill, M.N., Jones, D.W.,Kurtz, T., Sheps, S.G., Roccella, E.J., 2005. Recommendations for blood pressuremeasurement in humans and experimental animals: part 1: blood pressure
measurement in humans: a statement for professionals from the Subcommittee ofProfessional and Public Education of the American Heart Association Council on HighBlood Pressure Research. Circulation 111 (5), 697–716.
Ravindra, K., 2019. Emission of black carbon from rural households kitchens and as-sessment of lifetime excess cancer risk in villages of North India. Environ. Int. 122,201–212.
Rosén, I., 1997. Electroencephalography as a diagnostic tool in dementia. Dement.Geriatr. Cogn. Disord. 8 (2), 110–116.
Rotondi, F., Franceschetti, S., Avanzini, G., Panzica, F., 2016. Altered EEG resting-stateeffective connectivity in drug-naïve childhood absence epilepsy. Clin. Neurophysiol.127 (2), 1130–1137.
Rupakhetia, D., Oanha, N.T.K., Rupakheti, M., Kumar, R.S.H., Panday, A.K., Puppala,S.P., Lawrence, M.G., 2019. Indoor levels of black carbon and particulate matters inrelation to cooking activities using different cook stove-fuels in rural Nepal. EnergySustain. Dev. 48, 25–33.
See, S., Balasubramanian, R., 2006. Physical characteristics of ultrafine particles emittedfrom different gas cooking methods. Aerosol Air Qual. Res. 6, 82–92.
See, S., Balasubramanian, R., 2008. Chemical characteristics of fine particles emitted fromdifferent gas cooking methods. Atmos. Environ. 42, 8852–8862.
Soikkeli, R., Partanen, J., Soininen, H., Paakkonen, A., Riekkinen, P., 1991. Slowing ofEEG in Parkinson’s disease. Electroencephalogr. Clin. Neurophysiol. 79 (3), 159–165.
Stone, V., Mark, R.M., Martin, J.D.C., Alison, E., Nicholas, L.M., Peter, M., Roel, P.F.S.,Ulla, V., Wolfgang, G.K., Keld, A.J., Thomas, A.J.K., Per, E.S., Peter, H., Antonio, P.,Andrea, D.V.-R., Armelle, B.-S., João, P.T., Lang, T.C., Flemming, R.C., 2017.Nanomaterials versus ambient ultrafine particles: an opportunity to exchange tox-icology knowledge. Environ. Health Perspect. https://doi.org/10.1289/EHP424. CID:106002.
Wallace, L., Howard-Reed, C., 2002. Continuous monitoring of ultrafine, fine, and coarseparticles in a residence for 18 months in 1999-2000. J. Air Waste Manage. Assoc. 52,828–844.
Wallace, L., Ott, W., 2010. Personal exposure to ultrafine particles. J. Expo. Sci. Environ.Epidemiol. 21, 20–30.
Wallace, L., Emmerich, S., Howard-Reed, C., 2004. Source strengths of ultrafine and fineparticles due to cooking with a gas stove. Environ. Sci. Technol. 38, 2304–2311.
Wallace, L., Ott, W., Weschler, C., 2014. Ultrafine particles from electric appliances andcooking pans: experiments suggesting desorption/nucleation of sorbed organics asthe primary source. Indoor Air 25 (5), 536–546.
Wallace, L., Wang, F., Howard-Reed, C., Persily, A., 2008. Contribution of gas and electricstoves to residential ultrafine particle concentrations between 2 and 64 nm: sizedistributions and emission and coagulation rates. Environ. Sci. Technol. 42,8641–8647.
Wilcoxon, Frank, 1945. Individual comparisons by ranking methods. Biom. Bull. 1 (6),80–83.
Yeung, L., To, W., 2008. Size distributions of the aerosols emitted from commercialcooking processes. Indoor Built Environ. 17, 220–229.
Zhang, Q., Gangupomu, R., Ramirez, D., Zhu, Y., 2010. Measurement of ultrafine particlesand other air pollutants emitted by cooking activities. Int. J. Environ. Res. PublicHealth 7, 1744–1759.
M. Naseri, et al. Neurotoxicology 74 (2019) 149–161
161