the impact of facebook on social comparison and happiness: evidence ...aradayal/facebook.pdf · 2...
TRANSCRIPT

1
The Impact of Facebook on Social Comparison and Happiness:
Evidence from a Natural Experiment
September 2018
Ayala Arad, Ohad Barzilay and Maayan Perchik
Coller School of Management, Tel Aviv University
Abstract
The ubiquity of Facebook in modern life compels us to study its effects on well-being. We identified a
unique sample of Facebook users and non-users who are employed at a security-related organization, where
Facebook usage was differentially restricted (even at home) due to an organizational policy change, creating
a pseudo-natural experiment. Non-users in our sample are employees who faced an externally imposed
circumstantial friction that made them refrain from using Facebook, and hence it is less likely that they
chose not to use Facebook because of a-priori personal preferences. This creates unusual conditions that
mitigate the inherent selection-bias problem that could occur in estimations of Facebook's impact on social
comparison and happiness based simply on who is or is not a user in common circumstances.
Performing between-subject analysis, we found significant differences between Facebook users and non-
users at this organization. Given the exogenous assignment to users and non-users, we attribute these
differences to the accumulated effect of Facebook usage. Specifically, we infer that Facebook usage
increases engagement in social comparison which decreases users’ happiness. Social comparison fully
mediates the effect of Facebook on happiness, but only for the younger half of our sample and only for
those who believe that others have many more positive experiences than they do. Surprisingly, we find that
Facebook does not cause users to overestimate the frequency of their friends' positive experiences.
Nevertheless, the increased engagement in social comparison adversely affected those who believe that
their friends’ lives are better than their own. Our findings allude to a new, somewhat more subtle mechanism
than suggested by previous studies.
Keywords: Economics of information systems, Happiness, Facebook, Information and communication
technologies, Natural experiment, Social comparison

2
1. Introduction
Facebook is currently the largest online social network with over two billion users worldwide. Over the
past decade, social media has become an integral part of everyday life for many. Currently 90% of people
between the ages of 18 and 29 use social network sites with older adults rapidly catching up1. It is estimated
that users spend on average 50 minutes each day interacting on Facebook and Instagram combined2.
Drawing on the literature on the effect of information and communication technologies (ICT) on social
welfare and subjective well-being (Ganju et al., 2016; Greenstein and McDevitt, 2011) and given the
prominence of Facebook, we study the effect of Facebook on its users' subjective well-being and the
underlying mechanisms involved.
The Internet and online social networks now mediate the communication and social interactions of many
(Preece and Shneiderman, 2009; Kim and Lee, 2011; Walther, 2011). Users report using online social
networks for relaxation, entertainment and socializing (Ku et al., 2013; Park et al., 2009). Online social
networks, like their offline counterparts, have been found to fortify one’s self esteem (Gentile et al., 2012;
Gonzales and Hancock, 2011; Toma and Hancock, 2013), enforce group identity (Fox and Warber, 2015;
Zhao et al., 2008) and increase trust and cooperation (Bapna et al., 2016). Additional benefits of online
social networks include increased social capital, social support and relationship maintenance (Ellison et al.,
2007; McEwan, 2013; Nabi et al., 2013). Since the above benefits and subjective well-being are strongly
associated (e.g. Bjørnskov, 2003; Helliwell, 2001; Leung et al., 2013), it is reasonable to assume that
participating in online social networks has a positive effect on well-being.
However, there is a growing body of evidence to the contrary, referred to as the “Internet paradox”,
suggesting that Internet technology reduces psychological well-being, as manifested in increased
depression and loneliness (Kraut et al., 1998). The design of Internet-based platforms affects behavior on
1 About 77% between the ages of 30 and 49 and 51% between the ages of 50 and 64 use some social media. See: http://www.pewinternet.org/2015/10/08/social-networking-usage-2005-2015/ 2 https://www.nytimes.com/2016/05/06/business/facebook-bends-the-rules-of-audience-engagement-to-its-advantage.html

3
the platform, as has been demonstrated in a broad variety of contexts (e.g. Overby et al., 2010; Tiwana et
al., 2010; Dellarocas, 2005). It is possible that with regard to well-being, Internet technology and in
particular online social networks, which are tailored to streamline the flow of information among users, are
a two-edged sword. In the case of Facebook, the design of the news feed creates an overwhelming emphasis
on the positive experiences of others (Chou and Edge, 2012) which may give rise to envy, rumination and
jealousy (Tandoc et al., 2015; Feinstein et al., 2013; Fox and Moreland, 2015) as well as depression, anxiety
and stress (Labrague, 2014; Farahani et al., 2011). Social media may also lead to diminished enjoyment of
one’s own experiences (Rifkin et al., 2015) due to the fear of missing out (FOMO effect) (Przybylski et
al., 2013).
The broad spectrum of observed positive and negative effects of Facebook and other online social networks
on well-being, calls for further research (Verduyn et al., 2017; Appel et al., 2016). This study exploits a
pseudo-natural experimental situation where we can compare Facebook users and non-users to study
Facebook’s effect on happiness, social comparison, and perceptions of the positive/negative experiences of
friends and investigate the interplay between these three factors.
We explore two possible mechanisms by which Facebook could affect one's subjective well-being: (i)
Facebook users over-emphasize their positive experiences and underreport negative ones (Zhao et al., 2008;
Mehdizadeh, 2010), which biases users’ perceptions of the lives of others relative to their own. Believing
that others have better lives may undermine a user’s happiness (Chou and Edge, 2012). Thus, our focus is
not on perceptions of the absolute frequency of friends’ positive and negative experiences, but rather
Facebook’s impact on a user’s perception of the relative frequencies (friends vs. own). (ii) Facebook’s
architecture increases social comparison among its users, which may be a key factor influencing subjective
well-being since it has been shown that (offline) upward social comparison reduces happiness (Argyle,
2013). Non-users of Facebook do not encounter constant reminders of how much better the lives of others
are compared to their own and can live in comfortable denial, while for Facebook users, the positive
experiences of others are more vividly and more frequently observed triggering upward social comparisons

4
(see Bamberger and Belogolovsky (2017) for a similar argument in a different context). These two
mechanisms are separable and can act independent of each other: a biased perception may affect happiness
even if one’s social comparison level has not increased, while a higher level of upward social comparison
may affect happiness even if one's perceptions haven’t been influenced by Facebook use.
Identifying a causal link between Facebook usage and happiness is a challenge in light of the inherent
selection bias. Individuals who choose not to use Facebook are likely to have personalities that differ from
those of the Facebook users (Nadkarni and Hofmann, 2011; Ljepava et al., 2013) which makes it difficult
to devise a proper control group of non-users of Facebook.
A similar selection problem exists in studies that compare the subjective well-being of users with different
types or intensities of usage (Chou and Edge, 2012; Tandoc et al., 2015). It is possible that people’s general
dispositions lead them use Facebook differently (e.g., passive use vs. active use or different usage
frequency). For example, it might be that happy people use Facebook differently with the causal chain
reversed. Hence one cannot identify the impact of the type or intensity of Facebook usage on happiness by
performing the above comparison. Even longitudinal within-subject studies that compare subjective well-
being across time and across types of usage (e.g. Kross et al., 2013; Verduyn et al., 2015) are subject to the
possibility that in periods when the participants are happier they also choose to use Facebook more or less
intensively.
Some studies use path analysis (Baron and Kenny, 1986) to explore the mediating effect of envy, rumination
and social comparison on depression (Tandoc et al., 2015; Feinstein et al., 2013) or on life satisfaction
(Krasnova et al., 2013; Locatelli et al., 2012). However, this approach does not eliminate the possibility of
underlying endogeneity (for a discussion of this issue, see Appel et al., 2016).
This study investigates the impact of Facebook on the perception of others’ lives, on social comparison and
on happiness, using a unique sample of users and non-users for whom not using Facebook is due to
circumstances rather than a result of personal preferences. This setting reduces the inherent self-selection

5
associated with not using Facebook. All the participants are employees of a large, well-known, security-
related organization in which the use of Facebook was at first entirely forbidden for reasons of security
(during the period 2008-2012), and then was allowed for some employees. We use the policy changes as a
pseudo-natural experiment, dividing the employees into two groups: users and non-users (further discussed
in Section 3.1). In January 2015, 144 randomly selected employees filled out a pencil-and-paper
questionnaires regarding their demographics, friends’ experiences, personal experiences, social comparison
orientation (using Gibbons and Buunk, 1999), happiness (using The Oxford Happiness Questionnaire, Hills
and Argyle, 2002), and their Facebook use (based on Ellison et al., 2007). The questionnaires are further
discussed on Section 3.2. The results were analyzed using a moderated mediation model (Preacher and
Hayes, 2004; Hayes, 2013), reflecting our proposed theoretical model (See Section 2).
In an ideal field experiment, the organization would have assigned its employees randomly into users and
non-users and had perfect compliance (i.e. all employees who were assigned to use Facebook would indeed
do so, and vice versa). In such circumstances, we could have surveyed the employees after some time
regarding their social comparison orientation, happiness level and their estimations of their friends' positive
and negative experiences, and been able to interpret any difference between users and non-users as causal.
However, in our setting, Facebook usage was manipulated via organizational restrictions, exogenously
posed, based on security considerations and contingent on the projects in which the employee is involved.
We note that Facebook restrictions were not based on the function of the employee; for example, an
administrator and a scientist could have identical restrictions placed on them while two engineers might
each have different restrictions. Nevertheless, because the exogenous assignment was not necessarily
random, we need to address the concern that it is associated with individual characteristics that are
correlated with our dependent variables - social comparison and happiness. Furthermore, we wish to address
the possibility that there are non-compliers who freely decided not to use Facebook although they were not
severely restricted.

6
In order to reduce concerns regarding potential selection-bias and its effect on our estimations, we have
conducted the following additional analyses: (1) Matching analyses. We repeated our analyses on matched
samples of employees using propensity score matching on their observable covariates (using both ‘nearest
neighbor’ and ‘Mahalanobis’ distance metrics). (2) Personal interviews. In order to estimate the magnitude
of self-selection in our sample, we conducted post-study interviews with the organization’s non-user
employees, to understand their reasons for not using Facebook and how those reasons relate to the
restrictions placed on them. (3) Instrumental Variable analysis. In the spirit of the partial identification
literature, following Manski (1990), we performed instrumental variable analysis in which non-users with
low social comparison orientation were fictitiously “encouraged” to use Facebook. Avoiding the use of
Facebook despite the “encouragement” is a manifestation of potential selection bias and is eliminated in
the second stage of the estimation when using the synthetic instrumental variable. (4) Comparison to a
sample of students. In order to determine whether or not the level of social comparison and happiness, or
the manner in which the employees use Facebook is unique, we compared the results to those of a
“standard” subject pool – a sample of 175 students at a university located near the organization’s facility,
and of comparable socio-economic background as the employees of the organization. These additional
analyses are described in Section 3.5 and Section 5.
Surprisingly, we found that Facebook usage had no impact on the perception of the frequency of either
positive or negative experiences of friends (suggested mechanism (i) above). Hence, we focused on the
second mechanism, which concerns the effect of Facebook on engagement in social comparison. We found
social comparison to be positively affected by Facebook usage for the younger half of the subjects (23 and
younger) but had no significant effect for the older subjects. In turn, Facebook use had a significant negative
effect on happiness; our moderated mediation model showed that social comparison fully mediated the
impact of Facebook on happiness, but the effect is significant only for those who believe that their friends
have many more positive experiences than they do. Our findings provide empirical support for the second

7
mechanism, i.e. increased levels of upward social comparison may affect happiness even if one's
perceptions haven’t changed due to Facebook use.
This study makes several contributions to the literature on the effect of social networks on well-being. First,
it proposes a revised mediation model for the mechanism by which Facebook affects users’ well-being.
Previous studies suggested that Facebook's negative effect results directly from users being envious of their
peers. We propose a somewhat subtler model; besides using the state-of-the-art surveys, we developed two
new questionnaires asking participants to estimate the frequency of a set of positive and negative
experiences of their friends and of their own. These new questionnaires allow us to show that, in contrast
to the previous conception in the literature, users’ perception of the relative frequency of their peers positive
and negative experiences is not affected by Facebook. However, by affecting one’s social comparison
orientation, Facebook affects happiness by intensifying the (independent) perception of others’ lives as
better than one’s own. If you believe that your life is worse than the lives of your friends, using Facebook
might make you less happy.
Another set of contributions of this study is related to its experimental settings, namely the pseudo-natural
field experiment performed in a workplace:
• Exogenous assignment. The almost exogenous assignment to users and non-users reduces some of the
selection bias, inherent to this research question and evident in previous studies. Although not perfect,
our results suggest some causal interpretation.
• Age. To the best of our knowledge, this study is the first to consider the effect of age when studying
the influence of Facebook on well-being. Contrary to previous studies, which used more homogenous
subject groups, mainly students (Wenninger et al., 2014), we were fortunate to survey employees in a
broad age range (between 18 and 58, with an average of 26). We find that the older portion of our
sample were somewhat resistant to Facebook's influence on social comparison, and consequently, to its
effect on happiness.

8
• Passive usage. A unique feature of our study’s context is the relatively passive usage of the Facebook
users in our sample. Due to the need for security in their work, even employees who were allowed to
use Facebook were asked to be cautious about the information they share online. For example, many
of them were asked not to upload photos, and to not share information about their work. Although such
passive usage seems at first as extremely non-typical, it is actually a non-negligible style of usage in
the general population – as manifested by a recent official Facebook blogpost3 and popular media
articles4, as well as in our parallel sample of students. This study contributes to the growing literature
considering the negative implications of passive social media usage.
• Cumulative effect. These settings allow us to account for the cumulative effect of Facebook usage 'in
the wild', in contrast to lab experiments and short-lived field studies (Kross et al., 2013; Verduyn et al.,
2015; Vogel et al., 2015; Lin and Sonja, 2015).
2. Theory building
We investigate Facebook’s effect on happiness, social comparison and users’ perceptions of the
positive/negative experiences of friends, and study the interplay between these factors.
As a baseline for our theory, we hypothesize regarding the effect of using Facebook on one’s perceptions
of the relative frequency of positive and negative experiences of friends. Our focus is not on the perceptions
of the absolute frequency of friends’ positive and negative experiences, but rather the relative frequencies
(friends vs. own). This is because we are interested in the implications of this potential perceptual bias;
people compare their own life experiences to others' and hence the relative frequency matters (Argyle,
2013; Wood et al., 1985; Buunk et al., 2013; Wills, 1981). Believing that others have better lives may
undermine the user’s well-being (Chou and Edge, 2012).
3 https://newsroom.fb.com/news/2017/12/hard-‐questions-‐is-‐spending-‐time-‐on-‐social-‐media-‐bad-‐for-‐us/ 4 https://www.theguardian.com/technology/2017/dec/15/facebook-‐mental-‐health-‐psychology-‐social-‐media

9
People use online social networks as an impression management tool (Krämer and Winter, 2008) and to
fortify their self-esteem (Gentile et al., 2012; Gonzales and Hancock, 2011; Toma and Hancock, 2013).
Hence, they tend to portray an improved version of themselves, and to over-emphasize their positive
experiences and underreport negative ones (Zhao et al., 2008; Mehdizadeh, 2010). This makes it reasonable
to believe that the design of Facebook's news feed, which creates an overwhelming emphasis on the positive
experiences of others (Chou and Edge, 2012), would bias users’ perceptions of the relative frequency of
their friends’ positive experiences compared to their own.
Formally, we test the following hypothesis:
• H1a (positive experiences bias): Using Facebook increases one’s perception of the relative frequency
of positive experiences of friends compared to one’s own.
• H1b (negative experiences bias): Using Facebook decreases one’s perception regarding the relative
frequency of negative experiences of friends compared to one’s own.
Further, we explore a competing mechanism, by which Facebook usage may affect users’ happiness through
the mediating effect of an increase in users’ social comparison orientation. Specifically, our proposed theory
distinguishes between two constructs: (a) the degree to which one considers one’s own actions in light of
what others do - social comparison orientation, and (b) the perceived difference in the positive experinces
of friends compared to one’s own - ∆(pos). Our proposed theory is outlined in Figure 1.
People have an innate drive to evaluate their opinions and abilities (Festinger, 1954), which allows them to
reduce uncertainty (Gibbons and Buunk, 1999) and establish their standing (Brown et al., 2007). As humans
are social creatures, self-evaluation often depends upon comparing oneself with other people, a process
called “social comparison” (Festinger, 1954). Formally, social comparisons are defined as “comparative
judgments of social stimuli on particular content dimensions” (Kruglanski and Mayseless, 1990). People
vary considerably from one another in the extent to which they engage in social comparison and these

10
differences are captured by a broadly accepted index called social comparison orientation (Gibbons and
Buunk, 1999).
Figure 1. Outline of the theory on the effect of Facebook on one's happiness via the mediating effect of social comparison. Age serves as a moderator for the effect of Facebook on social comparison. The effect of social comparison on happiness is moderated by ∆(pos).
The Facebook platform, similar to other social media, is… well, social. Many online user interactions on
Facebook correspond to offline social interactions and have social implications such as enforcing group
identity (Fox and Warber, 2015; Zhao et al., 2008), increasing social capital, social support and relationship
maintenance (Ellison et al., 2007; McEwan, 2013; Nabi et al., 2013). Facebook’s design, and in particular
the news feed, intensifies the social experience. The news feed stacks the experiences of multiple people,
laying them out one on top of the other, and making the comparison to oneself unavoidable. Furthermore,
the ubiquity of Facebook in modern life might make this increased comparison a habit that manifests outside
of Facebook. Facebook friends are often also real world friends, so it is reasonable to expect a social
comparison spillover.
We hypothesize that the effect of using Facebook on social comparison is moderated by age. Social
comparison is part of human development, supporting self-evaluation and changes with age (Ruble et al.,
1980). In addition to the association between age and social comparison, age may also moderate Facebook's
Social Comparison ∆(pos)∗
Age
Happiness
* ∆(pos) - the perceptions of others' positive experiences compared to one’s own

11
effect, in line with previous findings that younger Facebook users are more susceptible to social influence
than older ones (Aral and Walker, 2012).
Formally, we hypothesize:
• H2 (social comparison): Using Facebook increases one's social comparison orientation; this effect is
moderated by age, where younger users are more affected than older users.
Social comparison may go both ways - upward and downward comparisons (Gibbons and Buunk, 1999;
Wills, 1981). In upward comparisons one perceives the other as better on a particular dimension whereas
the opposite holds for downward comparisons. Numerous previous studies focused on the mediation role
of envy in reducing subjective well-being (Cohen-Charash, 2009; Smith et al., 1999; Vecchio, 2000). These
studies did not make the distinction between upward social comparison and envy. Our proposed theory is
somewhat subtler; we distinguish between Facebook’s effect on the intensity of social comparison and the
direction of the comparison (upward or downward). Considering H1 is independent of H2, it is possible
that Facebook increases one's social comparison level (H2) but does not affect one's positive experiences
bias (H1), which may cause either upward or downward social comparison, depending to the user’s
unbiased perception of others vs. self.
In the case of upward social comparison, in line with existing literature (off-platform), we expect that
Facebook would decrease its users’ happiness (Argyle, 2013; Wood et al., 1985). Non-users do not have
others’ good lives slammed in their face and they can live in denial whereas for Facebook users, the positive
experiences of others are more vivid and more frequently observed (i.e., hard to avoid) which triggers
upward social comparison (see Bamberger and Belogolovsky, 2017, for a similar argument).

12
Hence, we hypothesize:
• H3 (social comparison as mediator): The effect of using Facebook on happiness is mediated by social
comparison orientation and moderated by one’s perception of the relative frequency of the positive
experiences of friends.
3. Methods
Our experimental sample consists of employees from a large, well-known, security organization.
Employees in this organization must go through a rigorous security clearance process to be hired and are
of a high socio-economic status. The organization hires for a large variety of roles including knowledge
workers, IT, administrative positions, scientists and managers. The employees’ ages in our sample vary
from 18 to 58 (mean=26), 40% are females, 26% are married and 56% have at least a college degree and
the rest have at least a high school education. The average income in the sample is about the average salary
in the country. The socio economic background of the employees in this organization is comparable at large
to that of university students in the country.
In January 2015, 144 randomly selected employees filled out a pencil-and-paper questionnaire. The
questionnaires were administered across 3 weeks on the campus of the organization. The participants, both
users and non-users, were spread across different buildings and offices (physically), within 9 departments
and 18 teams (organizational structure). These departments also reside under different divisions. This
diversity mitigates some of the risk of potential in-group bias. All employees who were asked to take part
in the study agreed, hence mitigating the risk of happiness-associated volunteer bias (Heffetz and Rabin,
2013). We consider employees who did not hold an active Facebook account at the time of the study (2015)

13
as non-users, whereas those who had an active account are considered as users. The sample consisted of 95
users and 49 non-users (34%) of Facebook5.
The assignment to the groups of users and non-users is described below, followed by a description of the
questionnaire, descriptive statistics and the data analysis method.
3.1. Pseudo-exogenous assignment to Facebook users or non-users
For security reasons, the organization's employees were not allowed to use social networks from 2008 to
2012 (neither at work nor at home). Employees with an existing Facebook account, including employees
joining the organization during this period, were asked to delete their account. In 2012, the restrictions were
relaxed and the policy became contingent on the projects in which an employee is involved (rather than
their function). For example, an administrator and a scientist could have identical restrictions placed on
them while two engineers might each have different restrictions.
The above policy changes, together, serve as a pseudo-natural experiment, assigning employees to one of
two groups: users and non-users. Our pivotal argument is that the restrictions posed on the employees serve
as an external friction against using Facebook, encouraging these employees to entirely avoid using it
("assigning" them to the non-users group). This "encouragement" operates mainly along the following two
paths:
1. Present prohibition. Applicable to employees who were not allowed to use Facebook at all at the time
of the study (2015). Considering the nature of the organization, the importance of employees’
credibility to the organization, the possibility that Facebook usage is monitored, and the employees’
periodic polygraph testing, it is safe to assume that employees who were forbidden to use Facebook
complied with this restriction.
5 Note, that the proportion of non-users in the organization is much larger than in a corresponding sample of university students with similar demographic characteristics (4%), suggesting that the high proportion was exogenously manipulated, as discussed below.

14
2. Previous blanket ban. Applicable to employees who worked in the organization before 2012. These
employees were forbidden to use Facebook in 2008-2012. Furthermore, even after relaxing the blanket
ban of using Facebook, many of the employees who were allowed to have a Facebook account were
still forbidden to use their full name or upload photos, which compromised the Facebook experience.
Post-interviews indicate that these employees got used to not having Facebook (see discussion below).
However, this setting, as with field experiments in general, bears a challenge of non-compliance; in our
context, this non-compliance corresponds to employees, for which there was no friction for using Facebook,
but refrained from using it nevertheless. Hence, our 2015 snapshot distinguishes between treated (users)
and non-treated (non-users) subjects, but it is not necessarily perfectly aligned with the restrictions posed
on these subjects.
This potential non-compliance is a manifestation of self-selection and may bias the estimated effect. We
estimated the magnitude of this selection bias through post-interview and found it to be small. We also
reduced the effect of the potential selection bias on the estimation by using an instrumental variable and
matching analyses. We discuss these issues in Section 3.5.
3.2 The questionnaire The questionnaire (which appears in the Appendix), included 6 sections, which were presented in the
following order:
A. Demographics: age, gender, family status, three levels of education and five levels of income.
B. Friends' experiences: We were interested in ascertaining how participants perceive others’ lives
as compared to their own, but didn’t want to reveal our intention directly in the questionnaire.
Therefore, we separated the estimation of participant’s own life experiences from the estimation of
the experiences of others. The respective questions were asked on different sections as follows: In
section B, the participants were asked to evaluate the frequency of various positive experiences in

15
their friends’ lives and to estimate the frequency of negative experiences in their friends’ lives. In
section E, which appeared few pages later, the same questions were asked with respect to the
participant’s own experiences.
Thus, in section B participants were asked ten questions which evaluated the frequency of various
positive experiences in their friends’ lives (e.g. how often during the course of a week do they go
out, read a book, watch a movie, etc.) and five questions in which they estimated the frequency of
negative experiences in their friends’ lives (e.g. how often during the course of a week are they in
a bad mood, upset, sick, etc.).
C. Social comparison: Based on Scale for Social Comparison Orientation (Gibbons and Buunk,
1999). Participants were presented with eight statements and asked to indicate the degree to which
they agree with each of them on a 6-point scale, from “strongly disagree” to “strongly agree”. A
high score indicates a high degree of social comparison. The reliability of the scale was evaluated
using Cronbach’s alpha measure (alpha=0.803).
At the end of this section we added four questions on envy and the need to share.
D. Happiness: Based on The Oxford Happiness Questionnaire (Hills and Argyle, 2002). Respondents
were presented with eight statements and were asked to what extent they agree with each of them
on a 6-point scale as described above. A high score reflects a higher degree of satisfaction with
one’s own life. The reliability of the scale was evaluated using Cronbach’s alpha measure
(alpha=0.715).
E. Personal experiences: Participants were asked about the frequency of ten positive experiences in
their own lives (e.g. how often during the course of a week do they go out, read a book, watch a
movie, etc.) and about five negative experiences in their own lives (e.g. how often during the course
of a week are they in a bad mood, upset, sick, etc.).

16
Using the answers to sections B and E, we measured the difference between the estimated frequency
of others’ positive and negative experiences and one’s own. Because the differences in frequencies
for the various experiences (questions) are on different scales, each experience’s original difference
was transformed into a relative score, i.e. a percentile for that experience. Then, we averaged across
the 10 positive experiences to obtain the variable ∆(pos) and averaged across the 5 negative
experiences to obtain the variable ∆(neg). Thus, a high value of ∆(pos) (∆(neg)) indicates that,
relative to the sample in our survey, individuals tend to believe that others have more positive
(negative) experiences than they do.
F. Facebook use: Based on Ellison et al. (2007). This questionnaire asked about the frequency of
Facebook use and the type of activities that users engage in. For example, participants were asked
how often they check their Facebook account and how often they upload photos, tag, etc.
3.3 Descriptive statistics
The demographics and the main measures of users and non-users in our sample are shown in Table 1. The
correlations between the variables appear in Table A1 in the Appendix.
The distribution of the demographic characteristics of users and non-users in our sample is not identical.
The average age of non-users is greater than that of users in our sample. This is consistent with the second
path of encouragement discussed above; pre-2012 employees got used to not having Facebook, whereas
employees who joined the organization after 2012, who tend to be younger, kept their accounts out of habit.
This difference in age is also related to the higher income, education level and marital status of non-users.
We deal with these differences using two methods: (1) we control for the demographic variables in our
regression analysis, and (2) we employ two matching techniques in which we first balance the two groups
based on their demographic features and then perform the analysis on the balanced groups.

17
Table 1. Descriptive statistics. The following describes the values of the variables on the left columns. Gender: 1 is male, 2 is female. Education: 3 is high-school education, 5 is more than 15 years of education and 4 is in between. All subjects had at least high-school education. Income: 3 is the average income in the country, 1 is much lower and 5 is much higher than the average income. Family status: 1 is married, 2 is single (3 and 4 are “was married” and are very rare in the sample). ∆(pos) is the extent (potentially between 0 and 1) to which one finds others’ lives richer in positive experiences compared to one’s own; ∆(neg) is the analogous extent for negative experiences.
Facebook Users (N= 95) Non-users (N=49)
Min Max Mean Std. dev. Min Max Mean Std. dev.
Age 18 44 23.84 5.27 18 58 29.65 8.97
Gender 1 2 1.46 0.50 1 2 1.31 0.47
Education 3 5 4.02 0.96 3 5 4.57 0.79
Income 1 5 2.27 1.61 1 5 3.08 1.66
Family status 1 4 1.87 0.43 1 2 1.53 0.50
% Friends_Facebook 50 100 91.49 7.97 5 100 83.43 23.06
Social Comparison 1.75 5.5 3.61 0.86 1 5.38 3.32 0.81
Happiness 2.88 5.75 4.43 0.60 2.88 6 4.55 0.67
∆(pos) 0.15 0.79 0.42 0.14 0.2 0.69 0.42 0.11
∆(neg) 0.08 0.96 0.43 0.19 0.06 0.73 0.40 0.17
Interestingly, we find that the frequencies of the various everyday experiences of users and non-users in
our sample are not significantly different, controlling for the demographic variables (Table A2). The
experiences we ask about are generally not expected to be influenced by using Facebook but could have
been associated with the exogenous assignment to these two group. Such an association would have
increased the concern that different types of people (beyond age differences) were assigned to the groups
of users and non-users. Seeing no such association is reassuring.

18
3.4 Empirical model
We use linear regression analysis. In the main analysis, we measure the differences between users and non-
users but do not consider the manner in which Facebook is used, which is endogenously determined by the
users. We will comment on the employees’ type of usage and how it compares to a “standard” student
subject pool in Section 5.
We start with the analysis of simple models to capture the total main effect of Facebook on the perception
of lives of others compared to one’s own (H1) and the users’ social comparison (H2). Then, we present a
moderated mediation model (Preacher and Hayes, 2004; Hayes, 2013), which serves as the capstone of this
study (H3). According to the model (Figure 1), the effect of Facebook on happiness is mediated by social
comparison; age serves as a moderator for the effect of Facebook on social comparison and consequently
for the overall indirect effect on happiness. Furthermore, the effect of social comparison on happiness is
moderated by the perceptions of others' positive experiences as compared to one’s own (∆(pos)). Both age
and ∆(pos) moderators allow us to investigate the variable effect Facebook has on different age groups and
on users with different levels of ∆(pos).
Following the vast literature on the measurement of happiness, we use the following demographic control
variables: age, gender, education, income and family status (Ferrer-i-Carbonell and Frijters, 2004; Dolan et
al., 2008). In addition to age's main effect on happiness, we also included its interaction with Facebook use.
In line with previous findings, which showed that younger Facebook users are more susceptible to social
influence than older ones (Aral and Walker, 2012), we account for potential variability in the effect of
Facebook across different ages. We also devise an additional covariate: the estimated proportion of a
subject's friends who use Facebook. This was motivated by the idea that if Facebook affects happiness and
happiness is contagious (Fowler -and Christakis, 2008), then one might want to control for potential peer
influence (Bapna and Umyarov, 2015) while estimating Facebook's causal effect on happiness. All
estimations of the Facebook effect are robust to its inclusion.

19
Our main moderated mediation model is formally put by equations (1) and (2) below:
𝑆𝑜𝑐𝑖𝑎𝑙𝐶𝑜𝑚𝑝𝑎𝑟𝑖𝑠𝑜𝑛 = 𝛼:𝐹𝑎𝑐𝑒𝑏𝑜𝑜𝑘 + 𝛼@𝐴𝑔𝑒 + 𝛼C𝐹𝑎𝑐𝑒𝑏𝑜𝑜𝑘 ∗ 𝐴𝑔𝑒 + 𝛼D𝐺𝑒𝑛𝑑𝑒𝑟 +
𝛼G𝐸𝑑𝑢𝑐𝑎𝑡𝑖𝑜𝑛 + 𝛼K𝐼𝑛𝑐𝑜𝑚𝑒 + 𝛼M𝐹𝑎𝑚𝑖𝑙𝑦𝑆𝑡𝑎𝑡𝑢𝑠 + 𝛼O𝐷𝑖𝑓𝑓𝑁𝑒𝑔 + 𝜀: (1)
𝐻𝑎𝑝𝑝𝑖𝑛𝑒𝑠𝑠 = 𝛽:𝐹𝑎𝑐𝑒𝑏𝑜𝑜𝑘 + 𝛽@𝑆𝑜𝑐𝑖𝑎𝑙 𝐶𝑜𝑚𝑝𝑎𝑟𝑖𝑠𝑜𝑛 + 𝛽C𝐷𝑖𝑓𝑓𝑃𝑜𝑠 +
𝛽D𝑆𝑜𝑐𝑖𝑎𝑙𝐶𝑜𝑚𝑝𝑎𝑟𝑖𝑠𝑜𝑛 ∗ 𝐷𝑖𝑓𝑓𝑃𝑜𝑠 + 𝛽G𝐺𝑒𝑛𝑑𝑒𝑟 + 𝛽K𝐸𝑑𝑢𝑐𝑎𝑡𝑖𝑜𝑛 + 𝛽M𝐼𝑛𝑐𝑜𝑚𝑒 +
𝛽O𝐹𝑎𝑚𝑖𝑙𝑦𝑆𝑡𝑎𝑡𝑢𝑠 + 𝛽W𝐷𝑖𝑓𝑓𝑁𝑒𝑔 + 𝜀@ (2)
For robustness, we ran a number of variations of the model and found that using only some of the covariates
does not alter the qualitative results. We also control for ∆(neg) – the frequency of negative experiences of
friends as compared to one’s own, for the sake of symmetry (the main effect of ∆(pos) is included in the
model). Eliminating it does not alter the qualitative results. As can be seen in Table A1, ∆(pos) and ∆(neg)
are only slightly correlated with one another, and both are not correlated with other variables. In particular,
∆(pos) and ∆(neg) are not correlated with social comparison, which allows us to include all of them in the
same model without creating a threat of multicollinearity.
3.5 Addressing selection bias
As mentioned earlier, the exogenous assignment was not necessarily random; hence, we need to address
the risk that it is associated with personality characteristics that are correlated with social comparison and
happiness. Furthermore, as with other field experiments, we wish to address the possibility that there are
non-compliers among the participants in the study, who decided not to use Facebook although they were
not severely restricted, hence introducing self-selection bias.
Post-study interviews
In order to estimate the magnitude of self-selection in our sample, we conducted post-study interviews with
the organization’s non-user employees, trying to understand their reasons for not using Facebook and how

20
those reasons relate to the restrictions placed on them. We interviewed 38 employees who do not use
Facebook.
When asked to explain why they do not use Facebook, 32 out of the 38 employees cited the restrictions
placed on them by the organization. Of the other six, two were forbidden to use Facebook in the past, and
three had restrictions placed on them at the time of the study. Although those five employees did not state
the restrictions as the reason for not using Facebook, their choice of not using Facebook might have been
affected by these unique circumstances. Thus, only one of the 38 employees chose not to use Facebook
despite of not being restricted in the past or at the time of the study.
The interviews suggest that our non-user group includes a small number of employees who do not use
Facebook out of choice. For these employees, the choice not to use Facebook may be correlated with some
personality trait, which in turn may be correlated with their social comparison and happiness. However,
self-selection into the group of non-users based on individual differences is small in magnitude: a
conservative conclusion would be that 16% (6 out of 38) of our non-users might have voluntarily selected
not to use Facebook. We further mitigate the potential bias of our estimations due to self-selection using
instrumental variable analysis, described in the next section.
Instrument Variable (IV) Analysis
In contrast to most lab experiments, in field experiments, assignment and treatment are often not identical
because of non-compliance issue (Angrist et al., 1996). A common method for reducing the bias caused by
non-compliance is using an instrumental variable (IV) (Angrist 2006; Angrist et al., 2012). We devised an
IV called friction that reflects whether or not the circumstances “encouraged” the subject to avoid using
Facebook. This is somewhat inversely analogue to the encouragement consideration proposed by Card
(1993) as IV.

21
Matching
We repeated our analyses on matched samples of the employees using propensity score matching (Imbens,
2004; Rosenbaum and Rubin, 1983) on the employees’ observable covariates. We used both ‘nearest
neighbor’ and ‘Mahalanobis’ distance measures, with replacement (Ho et al., 2007).
4. Results and Analysis
As reported below, we found no evidence that Facebook biases a user’s perceptions of others’ lives relative
to her own (not confirming H1). However, we show that Facebook usage increases social comparison
among its users (supporting H2), which in turn reduces happiness conditional on the perception of friends'
positive experiences as compared to their own (supporting H3).
4.1 Perception of others’ lives
We found that Facebook usage has no impact on the ∆(pos) and ∆(neg) scores (∆(pos): B=-0.021 (0.026),
p=0.433, n=132, ∆(neg): B=0.019 (0.036), p=0.612, n=130), using an ordinary least squares (OLS)
regression model. We tested a number of models for both ∆(pos) and ∆(neg) and obtained Facebook
coefficients that are very small in magnitude and non-significant (three models are presented in Tables A3
and A4 each). We estimated the effect for various age groups and found that in all of them Facebook does
not impact ∆(pos) and ∆(neg).
To further examine the robustness of the null result, we conducted multivariate analysis. We calculated, for
each question in Section B and its parallel in Section E, the difference between the estimated frequency
with which friends experience something and the frequency with which the participant experiences it. Thus,
15 differences were obtained: diffposi, where i=1,…,10 (for the 10 questions on positive experiences) and
diffnegi, where i=1,...,5 (for the 5 questions on negative experiences). Multivariate analysis using the
demographic variables as covariates affirmed that Facebook usage does not affect the set diffposi, i=1,…,10
(Pillai’s Trace = 0.08, Wilks’ Lambda = 0.92, Hotelling’s Trace = 0.087, Roy’s Largest Root = 0.087,

22
F=0.807, p=0.622) nor does it affect the set diffnegi, i=1,...,5 (Pillai's Trace = 0.059, Wilks’ Lambda =
0.941, Hotelling’s Trace = 0.063, Roy’s Largest Root = 0.063, F=1.41, p=0.226). Similar qualitative results
were obtained when allowing for an interaction of Facebook and age.
The above results do not support H1. The finding that there is no bias in the perception is somewhat
surprising in view of the fact that Facebook is considered to be a tool for impression management and that
users tend to portray improved versions of themselves there (Zhao et al., 2008). Moreover, earlier findings
suggest that users tend to believe that others have better lives than they do and that others are happier than
they are (Chou and Edge, 2012). Our results suggest that users self-correct for this bias when thinking about
particular experiences, perhaps due to the increasing attention given to this issue in popular media6, and the
understanding that Facebook photos and reports do not represent reality.
4.2 Social comparison
Table 2 describes our OLS estimations for five different models in which social comparison level is the
dependent variable and Facebook is an explanatory variable. Considering Model 2, for example, social
comparison was found to be positively affected by Facebook usage (B=2.167 (0.685), p=0.002, n=133).
We did not find a main effect of age on social comparison (B=-0.022 (0.017), p=0.197, n=133). However,
age’s interaction with Facebook was negative and significant (B=-0.074 (0.026), p=0.005, n=133)
suggesting that the effect of Facebook usage decreases with age, supporting H2. The results are robust to
various specifications, as long as the interaction of age with Facebook is included in the model.
6 E.g. https://www.newyorker.com/tech/elements/how-facebook-makes-us-unhappy

23
Table 2. The effect of Facebook on social comparison. The effect of using Facebook on the social comparison orientation score is examined in five specifications, using an ordinary least square regression. The explanatory variables appear in the leftmost column of the table.
Social Comparison
(1)
Social Comparison
(2)
Social Comparison
(3)
Social Comparison
(4)
Social Comparison
(5)
Age -0.032* (0.017)
-0.022 (0.017)
-0.029* (0.017)
-0.039** (0.017)
-0.046** (0.023)
Gender -0.250 (0.173)
-0.267 (0.169)
-0.250 (0.172)
-0.238 (0.176)
-0.153 (0.180)
Education 0.031 (0.104)
0.117 (0.106)
0.117 (0.106)
0.031 (0.104)
0.165 (0.113)
Income 0.016 (0.064)
0.060 (0.064)
0.083 (0.064)
0.039 (0.064)
0.096 (0.068)
Family status
-0.333 (0.213)
-0.331 (0.207)
-0.323 (0.207)
-0.316 (0.213)
-0.545** (0.257)
Facebook 0.276 (0.168)
2.167*** (0.685)
2.129 *** (0.675)
0.290* (0.17)
2.064*** (0.717)
Facebook x Age -0.074***
(0.026) -0.072***
(0.026) -0.072**
(0.027)
% Friends Facebook -0.003
(0.005) -0.003 (0.005)
Δ(pos) -0.116 (0.580)
Δ(neg) -0.394 (0.437)
R2 0.072 0.126 0.141 0.086 0.143
N 136 136 133 133 128
*p<0.1, **p<.05, *** p<0.01
Having in mind the moderating role of age, we calculated the effect of Facebook for five age values: 19,
20, 23, 28 and 35, which correspond to the 10th, 25th, 50th, 75th, and 90th percentiles in our sample. It was
found that Facebook usage increases social comparison among the mid and lower age groups, i.e. for the
50th percentile and for the lower percentiles. For the 19, 20 and 23 year-old groups the effects are: 0.761
(p=0.002, n=137), 0.687 (p=0.002, n=137) and 0.465 (p=0.009, n=137), respectively and there is no
significant effect for 29 and 35 year-olds (p=0.91 and p=0.154, respectively; see Table A5). Figure 2
illustrates the magnitude of these effects.

24
Figure 2: The Effect of Facebook on Social Comparison by Age. In order to illustrate the effect of Facebook, the estimated level of social comparison for Facebook users is compared to that of non-users, for each age group. The vertical lines represent the standard errors of the effects. The estimates of social comparison are based on Model 2 and on setting covariates to their sample means.
4.3. Moderated mediation model: The mediating effect of social comparison
We estimated the mediated moderation model outlined in Figure 1 and found a significant effect of
Facebook on social comparison and significant interactions – Facebook X age and Social comparison X
Δ(pos) – which confirms H3 and provides empirical evidence for the moderating effect of age and Δ(pos),
respectively. The full regression results appear in Table 3.
As in the estimations of the simple models in Section 4.2, we found that Facebook usage increases social
comparison only among the mid and lower age groups (19, 20 and 23). Social comparison, in turn, has a
significant negative effect on happiness for high levels of ∆(pos), and no effect for low levels: For the 50th,
75th and 90th percentiles of ∆(pos), the average effects across age are -0.169 (p=0.007, n=129), -0.3
(p<0.001, n=129) and -0.395 (p<0.001, n=129), respectively. For the lower percentiles of ∆(pos) 25th and
10th, social comparison does not significantly affect happiness (p=0.422 and p=0.925, respectively). This
finding suggests that increased social comparison per se does not necessarily undermine one's happiness;
It only occurs if one perceives oneself to have fewer positive experiences than friends.
2
2.4
2.8
3.2
3.6
4
4.4
19 20 23 29 35
Social Com
parison
Age
Facebook No Facebook

25
Table 3. The results of the mediated moderation model outlined in Figure 1. We find a significant effect of Facebook on social comparison and significant interactions – Facebook X age and Social comparison X Δ(pos) – which provide empirical evidence for the moderating effect of age and Δ(pos), respectively.
Social comparison Happiness
Facebook 2.05*** (0.710)
-0.081 (0.114)
Age -0.043** (0.022)
Facebook X Age -0.072*** (0.027)
Gender -0.158 (0.178)
-0.154 (0.124)
Education 0.165 (0.113)
-0.048 (0.072)
Income 0.095 (0.067)
0.067* (0.04)
Family status -0.547** (0.255)
0.17 (0.152)
Δ(neg) -0.408 (0.43)
1.064*** (0.298)
Social comparison 0.324* (0.191)
Δ(pos) 2.871** (1.144)
Social comparison X Δ(pos) -1.155*** (0.416)
R2 0.143 0.255
N 129 129
*p<0.1, **p<.05, *** p<0.01
We present the total indirect effect of Facebook usage on happiness for different age groups in Table A6.
Age plays an important role in our setting. We found a significant negative indirect effect on happiness for
the 50th percentile age group and below, conditional on a high percentile of ∆(pos), and no effect for the
older groups (Figure 3). Furthermore, for 19 year olds in the 90th percentile of ∆(pos), the estimated effect

26
is -0.255 (0.122), whereas for 23 year olds with similar levels of ∆(pos) the effect is -0.15 (0.085), which
is somewhat smaller. Similar patterns are observed for the 75th and 50th percentiles of ∆(pos).
Significant effect for younger employees Non-Significant effect for older employees
(A) (B)
Figure 3: Indirect Effect of Facebook on Happiness moderated by Δ(pos) for different age groups. The solid lines represent the indirect effect of Facebook on happiness (mediated by social comparison) and the dashed lines show the 95% confidence intervals by the level of Δ(pos). Figure 3(A) shows the significant effect corresponding to the 10th, 25th and 50th age percentiles (age 19, 20 and 23, respectively). Figure 3(B) shows no significant effect for the 75th and 90th age percentiles (age 28 and 35, respectively).
One possible explanation for the age-related differences is that younger participants are more susceptible
to Facebook’s influence because they rely on Facebook as a source of social information more than older
adults, who are “trained” in gleaning social information from other, off-line sources. Another explanation
considers the differences between younger and older adults in using Facebook's features. Indeed, we find
that younger users are more engaged in activities connected to others, such as comments and tags, rather
than activities which focus on the self, such as posting statuses and uploading photos (B=0.017 (0.007),
-‐0.4
-‐0.2
0
0.2
0.4
0.26 0.32 0.41 0.52 0.6
Happ
iness E
ffect
Δ(pos)
-‐0.2
0
0.2
0.4
0.6
0.26 0.32 0.41 0.52 0.6Ha
ppiness E
ffect
Δ(pos)

27
p=0.025, n=87; Table A7), which may trigger social comparison. Note that we found no other age-related
differences in the usage of Facebook in terms of frequency, intensity and engagement (Table A8).
We note that Facebook usage has no direct effect on happiness (B=-0.081 (0.114), p=0.475, n=129; Table
3). Namely, social comparison fully mediates the effect of Facebook on happiness.
5. Complementary Analysis
We performed additional analyses in order to mitigate selection bias, to examine the robustness of our
results, and to study issues that deviate from our primary focus.
5.1. Propensity score matching The organization’s exogenous assignment of users and non-users was not necessarily random; hence we
need to address the possibility that assignment is associated with personality characteristics that are
correlated with social comparison and happiness. We augmented the main analysis by using propensity
score matching (Rosenbaum and Rubin, 1983; Dehejia and Wahba, 1999).
The first stage involved matching pairs of participants – a Facebook user and a non-user – according to
similarity in age, gender, education, income and family status. The matching process resulted in two
balanced groups (with replacement: 30 non-users, 95 users), where the standard mean difference of the
distance between the groups is below 0.007 and the standard mean difference of individual covariates is
below 0.19 (and in particular below the 0.25 threshold suggested by Stuart (2010). See Table 4 for the
detailed analysis. The treatment and control groups also obey the “common support” requirement with
substantial overlap of their propensity score distributions (Stuart, 2010), as illustrated in Figure 4.

28
Table 4. Balancing of Treatment and Control groups with Logit distance function. We conducted propensity score matching analysis, using the nearest neighbor method with Distance = “logit” (with replacement). The table shows that after the matching the standard deviation of the mean standard between the users and non-users is small.
Means FB Users
Before Matching After Matching
Means FB Non-Users
SD FB Non-Users
SD Mean Diff.
Means FB Non-Users
SD FB Non-Users
SD Mean Diff.
Distance 0.719 0.544 0.229 1.14 0.718 0.154 0.007 Age 23.842 29.653 8.969 -1.109 23.632 5.392 0.04
Gender 1.453 1.306 0.466 0.293 1.358 0.488 0.189 Income 2.263 3.082 1.656 -0.51 2.158 1.639 0.066
Education 4.021 4.571 0.791 -0.576 3.958 0.978 0.066 Family 1.874 1.531 0.504 0.819 1.832 0.381 0.101
Figure 4: Distribution of propensity scores. The figure provides graphical evidence that the treatment and control groups obey the “common support” requirement, with substantial overlap of their propensity score distributions.
After performing the matching procedure, we estimated our mediated moderation model outlined in Figure
1 again. The results are presented in Table 5. We found a significant effect of Facebook on social
comparison and significant interactions – Facebook X age and Social comparison X Δ(pos) consistent with
the original estimation. (see Tables A9 and A10). Furthermore, using a weighted OLS regression, we found
no significant effect of Facebook usage on the perceptions of others’ lives compared to one’s own for
positive or negative experiences (Table A11). For robustness, we also performed matching using the
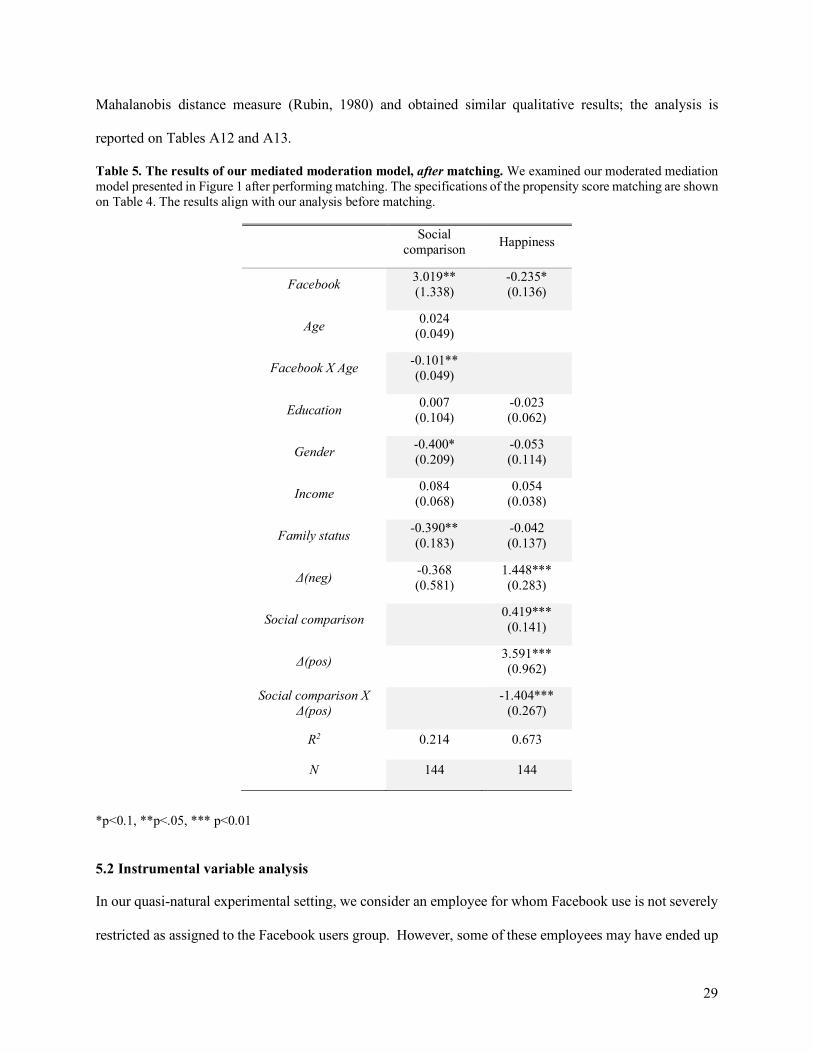
29
Mahalanobis distance measure (Rubin, 1980) and obtained similar qualitative results; the analysis is
reported on Tables A12 and A13.
Table 5. The results of our mediated moderation model, after matching. We examined our moderated mediation model presented in Figure 1 after performing matching. The specifications of the propensity score matching are shown on Table 4. The results align with our analysis before matching.
Social comparison Happiness
Facebook 3.019** (1.338)
-0.235* (0.136)
Age 0.024 (0.049)
Facebook X Age -0.101** (0.049)
Education 0.007 (0.104)
-0.023 (0.062)
Gender -0.400* (0.209)
-0.053 (0.114)
Income 0.084 (0.068)
0.054 (0.038)
Family status -0.390** (0.183)
-0.042 (0.137)
Δ(neg) -0.368 (0.581)
1.448*** (0.283)
Social comparison 0.419*** (0.141)
Δ(pos) 3.591*** (0.962)
Social comparison X Δ(pos) -1.404***
(0.267)
R2 0.214 0.673
N 144 144
*p<0.1, **p<.05, *** p<0.01
5.2 Instrumental variable analysis
In our quasi-natural experimental setting, we consider an employee for whom Facebook use is not severely
restricted as assigned to the Facebook users group. However, some of these employees may have ended up

30
in our non-users group due to personal preferences (a compliance problem). Furthermore, it is reasonable
to assume, that employees who self-selected to refrain from using Facebook despite having no severe
restrictions have unique characteristics. Thus, it is possible that the effects found in Section 4 are not driven
by Facebook, but instead are caused by unobserved personality traits in these self-selected non-users.
To mitigate the effect of this self-selection, we wish to devise an instrumental variable (henceforth IV) to
study the effect of Facebook on social comparison. This IV should be associated with using Facebook but
not directly related to social comparison. We draw on the user experience concept of friction - interactions
that inhibit people from intuitively and painlessly achieving their goals. Ideally, we would have used as IV
the actual friction posed on the employees: Friction=1 for employees that were faced friction due to their
employment circumstances (forbidden, or severely restricted, and/or got accustomed to managing without
Facebook due to previous ban). This is somewhat inversely analogue to the encouragement consideration
proposed by Card (1993) as IV. For employees whose employment circumstances did not induce heavy
friction, friction=0. However, unfortunately, the data of the actual friction is not available to us. Therefore,
we use the post-interview to estimate the magnitude of self-selection in our sample and then construct a
synthetic friction IV.
We assume that all Facebook users do not have friction, i.e. friction=0.7 For non-users, we expect most of
them to have friction=1. However, some may not use Facebook due to self-section, meaning those
employees have friction=0 but are not using Facebook nevertheless.
In particular, based on our post-interview (Section 3.5), we deduce that there should be at most 16% non-
compliers in our non-users group (i.e., 8 employees). For these non-compliers, we wish to assign friction=0.
Recall that our results suggest that using Facebook increases social comparison, which means that not using
Facebook is associated with low social comparison. Since we do not know which subjects are the non-
7 Note that using Facebook despite being forbidden would be a major violation of the organizational policy. One sided non-compliers are common in field experiments (Angrist et al., 1996)

31
compliers, we take a conservative approach and assign friction=0 to up to 8 non-users with the lowest social
comparison score, in the spirit of the partial identification literature following Manski (1990).
Table 6 presents nine estimations using a number of different IVs. Our first IV estimation (denoted “1 non-
complier”) of the effect of Facebook on social comparison assumes that only one non-user, specifically the
one with the lowest social comparison, did not have friction and nevertheless chose to avoid using
Facebook. The second estimation (“2 non-compliers”) assumes that the two non-users with the lowest social
comparison score chose not to use despite having no friction, and so on. Although we present only eight IV
estimations, the results are robust to a slightly larger number of non-compliers.
Table 6. Estimation of Facebook’s effect on Social comparison using instrumental variable analysis. We devised a synthetic IV dubbed friction that reflects whether or not the circumstances “encouraged” the subject to avoid using Facebook. We assume all Facebook users had no friction, i.e. friction=0, and most non-users had friction, i.e., friction=1. A non-user who had no friction is interpreted as a non-complier with friction=0. The first column on the left-hand-side presents the estimation of Facebook’s effect on social comparison without using an IV (“perfect compliance”), where each of the other columns assumes a different number of non-compliers between 1 and 8 in the non-users group. Thus, a different synthetic IV is used for the estimation in each column. Non-users with the lowest score of social comparison were chosen to be the non-compliers.
Dependent variable: Social comparison Perfect
compliance 1 non-
complier 2 non-
compliers 3 non-
compliers 4 non-
compliers 5 non-
compliers 6 non-
compliers 7 non-
compliers 8 non-
compliers
Facebook 2.167*** 1.685** 1.444* 2.000** 1.753** 1.537* 2.099** 2.336** 2.730*** (-0.685) (-0.715) (-0.736) (-0.812) -0.843 (-0.862) (-0.947) (-0.976) (-1.026)
Age -0.022 -0.026 -0.028 -0.026 -0.028 -0.031* -0.029 -0.028 -0.027 (-0.017) (-0.017) (-0.017) (-0.017) (-0.017) (-0.017) (-0.018) (-0.018) (-0.018)
Facebook X Age
-0.074*** -0.058** -0.051* -0.075** -0.067** -0.060* -0.084** -0.095** -0.112*** (-0.026) (-0.027) (-0.027) (-0.031) (-0.032) (-0.032) (-0.036) (-0.038) (-0.04)
Gender -0.267 -0.263 -0.26 -0.266 -0.263 -0.261 -0.266 -0.269 -0.272 (-0.169) (-0.169) (-0.169) (-0.169) (-0.17) (-0.171) (-0.171) (-0.172) (-0.174)
Education 0.117 0.094 0.083 0.107 0.096 0.085 0.11 0.121 0.138 (-0.106) (-0.106) (-0.107) (-0.108) (-0.109) (-0.109) (-0.111) (-0.112) (-0.114)
Income 0.06 0.053 0.05 0.065 0.061 0.059 0.074 0.082 0.093 (-0.064) (-0.064) (-0.065) (-0.065) (-0.066) (-0.066) (-0.067) (-0.068) (-0.069)
Family status
-0.331 -0.325 -0.321 -0.316 -0.313 -0.308 -0.304 -0.3 -0.296 (-0.207) (-0.208) (-0.208) (-0.208) (-0.209) (-0.21) (-0.211) (-0.212) (-0.214)
R2 0.126 0.122 0.117 0.118 0.113 0.104 0.098 0.088 0.068 N 137 137 137 137 137 137 137 137 137
*p<0.1, **p<.05, *** p<0.01

32
In line with our main results, we found that the vast majority of estimations for both Facebook effect and
Facebook X age effect remain significant at the p<0.05 level. All results are significant at the p<0.1 level.
These results reinforce the causal link between using Facebook and social comparison.
5.3 Comparison to another group of Facebook users outside the organization
The generalization of our findings depends on the degree to which our sample is representative. In order to
determine whether or not the level of social comparison and happiness or the manner in which the
participants use Facebook is unique, we compared our results to those for another group of Facebook users
- a sample of undergraduate students at a university located near the organization’s facility. A group of 175
undergraduate students (49% females) aged 18-35 (average age: 22.4) completed an identical questionnaire
online. We focused on the 96% of those students who are Facebook users. Although our original sample is
unique in some ways (i.e. employees of a security-related organization), we found that the social
comparison and happiness score of the Facebook users in the organization do not differ from those of the
parallel sample of students, after controlling for demographic variables (Social comparison: B=0.203
(0.123), p=0.102, n=252; Happiness: B=0.014 (0.093), p=0.878, n=253, see Table A14). This suggests that
our sample is not unique in these constructs.
The pattern of Facebook use, however, differs between the two samples. Comparing the Facebook users in
the organization to those at the university, we found that the latter use Facebook more intensely: they feel
more connected to Facebook, they spend more time on Facebook and they check their account more
frequently (Table A15).8 Accordingly, their usage intensity score, which is based on these criteria, is higher
than that of the organization’s employees (B=0.645 (0.154), p<0.001, n=237, Table A16). Nonetheless, the
employees’ usage of Facebook is not negligible: they spend an average of 45 minutes on Facebook each
day (where the median is about 20 minutes) and 80% of the users check their account at least once a day
8 In all the analysis in this subsection, we focus on users younger than 29, to make the average age of employees and students about the same.

33
(42% check more than once). The students are also more active, as reflected in their answers to q6 in Section
F (B=0.048 (0.02), p=0.019, n=237, Table A16). However, the balance between self-focused and others-
focused activity, as reflected in q7, is the same for the organization’s employees and the students (B=0.007
(0.025), p=0.777, n=237, Table A16). The students post more status updates but also like, tag others and
comment more.
Thus, it appears that the employees are somewhat more passive than the students (passive vs. active index:
3.12 and 2.55, respectively). Nevertheless, passive usage is quite common also among students; by
eliminating 40% of the most active students, the distribution of this measure among the rest of the students
and the employees is very similar (the averages are 3.02 and 3.09 and medians are 2.66 and 2.57). This
demonstrates that the passive use of our sample is not uncommon among a large group of individuals for
whom the usage is not restricted in any way. In fact, passive social media usage is prevalent in the general
population and is becoming an increasing concern, as manifested in recent studies (e.g., Verduyn et al.,
2015).
5.4 The role of the perception of others’ negative experiences
We examined a variation on our moderated mediation model in which the moderator ∆(pos) was replaced
by ∆(neg). We found a weaker moderation role for the belief that others have more negative experiences
than we do (Table A17 and A18). In particular, there is an indirect negative effect of Facebook use on
happiness only for high ∆(neg) scores. Although the ∆(neg) variable was found to be unaffected by
Facebook use, the masking of negative experiences on Facebook in contrast to the vividness of others’
positive experiences may lead one to downplay the possibility that others also have negative experiences.
Hence, non-users with a given ∆(neg) score are more likely to benefit from downward comparison (off-
platform) and to be happier than Facebook users with the same ∆(neg) score. Furthermore, the higher the
score, the larger is the difference between users and non-users. The results of an additional model in which
both ∆(pos) and ∆(neg) serve as moderators are presented in Table A19 and A20.

34
6. Discussion and Summary
Our findings indicate that using Facebook increases engagement in social comparison. Our questionnaire
was not specific to on-platform comparison, but rather measured the overall comparison orientation. We
suggest that the Facebook user experience promotes social comparison (particularly via the news feed), and
may establish a tendency to compare oneself to others on- and off-platform. Surprisingly, we found that
the use of Facebook does not impact the users’ estimation of the frequency of others’ positive and negative
experiences, as compared to one’s own. Nevertheless, we found indications that an increased engagement
in social comparison combined with a belief that others’ lives are richer in positive experiences than one’s
own, causes users to be less happy than non-users.
This finding is a refinement of previous findings on increased envy due to Facebook usage and on
Facebook’s influence on subjective well-being (Verduyn et al., 2017); our proposed model suggests that
the decline in happiness is due to an increase in social comparison, even if ∆(pos) or ∆(neg) are not affected
by the usage.
An additional contribution of the study is related to our findings on the moderating effect of age. Most of
the studies on the effect of Facebook use were conducted among relatively young participants most of
whom are students (Wenninger et al., 2014). Our setting allowed us to examine a wide range of ages (age
18-58, median: 24) and to isolate the effect of its interaction with Facebook use on social comparison and
happiness. We found that only the young participants (age 18-23) in our sample were susceptible to the
Facebook effect on social comparison and consequently on happiness.
This study is the first to our knowledge to use a natural experiment in order to measure the cumulative
effect of prolonged Facebook use in a real-world setting. Although the assignment to each group (users and
non-users) due to the organization’s Facebook policy is not random as in a lab experiment, we argue that it
significantly reduces selection bias. Moreover, our natural setting has some advantages over lab
experiments in which there may be a need to simulate Facebook use, participants may be influenced by an

35
awareness of the research questions and the effects measured in a lab might be momentary. More broadly,
this paper demonstrates a potential negative effect of the usage of information and communication
technologies, and in particular social network platforms such as Facebook, on its users’ subjective well-
being.
References
1. Angrist, J. D., Imbens, G. W., and Rubin, D. B. (1996). Identification of causal effects using instrumental variables. Journal of the American statistical Association, 91(434), 444-455.
2. Angrist, J. D. (2006). Instrumental variables methods in experimental criminological research: what, why and how. Journal of Experimental Criminology, 2(1), 23-44.
3. Angrist, J. D., Dynarski, S. M., Kane, T. J., Pathak, P. A., and Walters, C. R. (2012). Who benefits from KIPP?. Journal of policy Analysis and Management, 31(4), 837-860.
4. Appel, Helmut, Alexander L. Gerlach, and Jan Crusius. (2016). The interplay between Facebook use, social comparison, envy, and depression. Current Opinion in Psychology 9, 44-49.
5. Aral, Sinan, and Dylan Walker. (2012). Identifying influential and susceptible members of social networks. Science 337, 337-341.
6. Argyle, Michael. (2013) The psychology of happiness. Routledge. 7. Bamberger, P., & Belogolovsky, E. (2017). The dark side of transparency: How and when pay
administration practices affect employee helping. Journal of Applied Psychology, 102(4), 658. 8. Bapna, R. and Umyarov, A. (2015). Do your online friends make you pay? A randomized field
experiment on peer influence in online social networks. Management Science, 61 (8), 1902-1920. 9. Bapna, R., Qiu, L., & Rice, S. C. (2016). Repeated Interactions vs. Social Ties: Quantifying the
Economic Value of Trust, Forgiveness, and Reputation Using a Field Experiment. Forthcoming: Management of Information Systems Quarterly.
10. Baron, R. M. and Kenny, D. A. (1986). The Moderator-Mediator Variable Distinction in Social Psychological Research – Conceptual, Strategic, and Statistical Considerations, Journal of Personality and Social Psychology, Vol. 51(6), pp. 1173–1182.
11. Bjørnskov, C. (2003). The happy few: Cross–country evidence on social capital and life satisfaction. Kyklos, 56(1), 3-16.
12. Brown, D. J., Ferris, D. L., Heller, D., and Keeping, L. M. (2007). Antecedents and consequences of the frequency of upward and downward social comparisons at work. Organizational Behavior and Human Decision Processes, 102(1), 59-75.
13. Buunk, B. P., Gibbons, F. X., & Buunk, A. (2013). Health, coping, and well-being: Perspectives from social comparison theory. Psychology Press.
14. Card, D. (1993). Using geographic variation in college proximity to estimate the return to schooling (No. w4483). National Bureau of Economic Research.
15. Chou H. T. and Edge, N. (2012). “They are happier and having better lives than I am”: the impact of using Facebook on perceptions of others' lives. Cyberpsychology, Behavior, and Social Networking, 15(2), 117-21.
16. Cohen-‐‑Charash, Y. (2009). Episodic envy. Journal of Applied Social Psychology, 39(9), 2128-2173.

36
17. Dehejia RH and Wahba S. (1999). Causal effects in nonexperimental studies: Re-evaluating the evaluation of training programs. Journal of the American Statistical Association; 94:1053–62.
18. Dellarocas, C. (2005). Reputation mechanism design in online trading environments with pure moral hazard. Information Systems Research, 16(2), 209-230.
19. Dolan, Paul, Tessa Peasgood, and Mathew White. (2008). Do we really know what makes us happy? A review of the economic literature on the factors associated with subjective well-being. Journal of economic psychology 29 (1), 94-122.
20. Ellison, N. B., Steinfield, C., and Lampe, C. (2007). The benefits of Facebook “friends:” Social capital and college students’ use of online social network sites. Journal of Computer-‐‑Mediated Communication, 12 (4), 1143-1168.
21. Farahani, H. A., Kazemi, Z., Aghamohamadi, S., Bakhtiarvand, F., & Ansari, M. (2011). Examining mental health indices in students using Facebook in Iran. Procedia—Social and Behavioral Sciences, 28, 811–814.
22. Ferrer-‐‑i-‐‑Carbonell, Ada, and Paul Frijters. (2004). How Important is Methodology for the estimates of the determinants of Happiness?. The Economic Journal 114 (497), 641-659.
23. Festinger, L. (1954). A theory of social comparison processes. Human relations, 7(2), 117-140. 24. Feinstein, Brian A., Rachel Hershenberg, Vickie Bhatia, Jessica A. Latack, Nathalie Meuwly, and
Joanne Davila. (2013). Negative social comparison on Facebook and depressive symptoms: Rumination as a mechanism. Psychology of Popular Media Culture, 2 (3), 161.
25. Fowler, J. H., and Christakis, N. A. (2008). Dynamic spread of happiness in a large social network: Longitudinal analysis over 20 years in the framingham heart study. British Medical Journal, 337.
26. Fox, J., and Moreland, J. J. (2015). The dark side of social networking sites: An exploration of the relational and psychological stressors associated with Facebook use and affordances. Computers in Human Behavior, 45, 168-176.
27. Fox, J., and Warber, K. M. (2015). Queer Identity Management and Political Self-‐‑Expression on Social Networking Sites: A Co-‐‑Cultural Approach to the Spiral of Silence. Journal of Communication, 65(1), 79-100.
28. Ganju, Kartik K., Paul A. Pavlou, and Rajiv D. Banker. (2016). Does Information and Communication Technology Lead to the Well-Being of Nations? A Country-Level Empirical Investigation. MIS Quarterly, 40(2), 417-430.
29. Gentile, B., Twenge, J. M., Freeman, E. C., and Campbell, W. K. (2012). The effect of social networking websites on positive self-views: An experimental investigation. Computers in Human Behavior, 28(5), 1929-1933.
30. Gibbons, F.X. and Buunk, B.P. (1999). Individual differences in social comparison: The development of a scale of social comparison orientation. Journal of Personality and Social Psychology, 76, 129-142.
31. Godes, D., Mayzlin, D., Chen, Y., Das, S., Dellarocas, C., Pfeiffer, B., and Verlegh, P. (2005). The firm's management of social interactions. Marketing Letters, 16(3), 415-428.
32. Gonzales, A. L., and Hancock, J. T. (2011). Mirror, mirror on my Facebook wall: Effects of exposure to Facebook on self-esteem. Cyberpsychology, Behavior, and Social Networking, 14(1-2), 79-83.
33. Greenstein, S., and McDevitt, R. C. (2011). The broadband bonus: Estimating broadband Internet's economic value. Telecommunications Policy, 35(7), 617-632.
34. Hayes, F. Andrew (2013). Introduction to Mediation, Moderation, and Conditional Process Analysis: A Regression-Based Approach. The Guilford Press.
35. Heffetz, O. and Rabin, M. (2013). Conclusions Regarding Cross-Group Differences in Happiness

37
Depend on Difficulty of Reaching Respondents. American Economic Review, 103 (7), 3001-3021. 36. Helliwell, J. (2001). Social capital, the economy and well-being. The review of economic performance
and social progress, 1. 37. Hills, P., and Argyle, M. (2002). The Oxford Happiness Questionnaire: a compact scale for the
measurement of psychological well-being. Personality and Individual Differences, 33, 1073–1082. 38. Ho Daniel, Kosuke Imai, Gary King and Elizabeth Stuart. (2007). Matchit: Nonparametric
Preprocessing for Parametric Causal Inference, Journal of Statistical Software, 42 (8), http://gking.harvard.edu/matchit/.
39. Hobbs, W. R., Burke, M., Christakis, N. A., & Fowler, J. H. (2016). Online social integration is associated with reduced mortality risk. Proceedings of the National Academy of Sciences, 113 (46), 12980–12984.
40. Imbens G. W. (2004). Nonparametric estimation of average treatment effects under exogeneity: a review. Review of Economics and Statistics, 86 (1), 4–29
41. Kim, J., and Lee, J. E. R. (2011). The Facebook paths to happiness: Effects of the number of Facebook friends and self-presentation on subjective well-being. CyberPsychology, behavior, and social networking, 14(6), 359-364.
42. Krasnova, Hanna, Helena Wenninger, Thomas Widjaja, and Peter Buxmann. (2013) Envy on Facebook: a hidden threat to users' life satisfaction?. Wirtschaftsinformatik 92, 1-16.
43. Kraut, R., Patterson, M., Lundmark, V., Kiesler, S., Mukophadhyay, T., and Scherlis, W. (1998). Internet paradox: A social technology that reduces social involvement and psychological well-being?. American psychologist, 53(9), 1017.
44. Krämer, N. C., & Winter, S. (2008). Impression management 2.0: The relationship of self-esteem, extraversion, self-efficacy, and self-presentation within social networking sites. Journal of media psychology, 20(3), 106-116.
45. Kross, E., Verduyn, P., Demiralp, E., Park J., Lee, D. S., Lin, N., (2013). Facebook Use Predicts Declines in Subjective Well-Being in Young Adults. PLoS ONE, 8 (8), e69841.
46. Kruglanski, A. W., and Mayseless, O. (1990). Classic and current social comparison research: Expanding the perspective. Psychological bulletin, 108(2), 195.
47. Ku, Y. C., Chu, T. H., and Tseng, C. H. (2013). Gratifications for using CMC technologies: A comparison among SNS, IM, and e-mail. Computers in Human Behavior, 29(1), 226-234.
48. Labrague, L. J. (2014). Facebook use and adolescents’ emotional states of depression, anxiety, and stress. Health Science Journal, 8(1), 80–89.
49. Leung, A., Kier, C., Fung, T., Fung, L., and Sproule, R. (2013). Searching for happiness: The importance of social capital. In The exploration of happiness (pp. 247-267). Springer Netherlands.
50. Lin, Ruoyun, and Sonja Utz. (2015). The emotional responses of browsing Facebook: Happiness, envy, and the role of tie strength. Computers in Human Behavior 52, 29-38.
51. Ljepava, Nikolina, R. Robert Orr, Sean Locke, and Craig Ross. (2013). Personality and social characteristics of Facebook non-users and frequent users. Computers in Human Behavior 29(4), 1602-1607.
52. Locatelli, Sara M., Katharina Kluwe, and Fred B. Bryant. (2012). Facebook use and the tendency to ruminate among college students: Testing mediational hypotheses. Journal of Educational Computing Research 46 (4), 377-394.
53. Manski, C. (1990). Nonparametric Bounds on Treatment Effects. The American Economic Review: Papers and Proceedings, 80(2), 319-323.

38
54. McEwan, B. (2013). Sharing, caring, and surveilling: An actor–partner interdependence model examination of Facebook relational maintenance strategies. Cyberpsychology, Behavior, and Social Networking, 16(12), 863-869.
55. Mehdizadeh, S. (2010). Self-presentation 2.0: Narcissism and self-esteem on Facebook. Cyberpsychology, Behavior, and Social Networking, 13, 357–364.
56. Nabi, R. L., Prestin, A., and So, J. (2013). Facebook friends with (health) benefits? Exploring social network site use and perceptions of social support, stress, and well-being. Cyberpsychology, Behavior, and Social Networking, 16(10), 721-727.
57. Nadkarni, A. and Hofmann, S. G. (2011). Why do people use Facebook? Personality and Individual Differences, 52, 243–249.
58. Overby, E., Slaughter, S. A., and Konsynski, B. (2010). Research commentary—the design, use, and consequences of virtual processes. Information Systems Research, 21(4), 700-710.
59. Park, N., Kee, K. F., and Valenzuela, S. (2009). Being immersed in social networking environment: Facebook groups, uses and gratifications, and social outcomes. CyberPsychology & Behavior, 12(6), 729-733.
60. Preacher, K. J., and Hayes, A. F. (2004). Behavior Research Methods, Instruments and Computers, 36(4), 717-731.
61. Preece, J., and Shneiderman, B. (2009). The reader-to-leader framework: Motivating technology-mediated social participation. AIS Transactions on Human-Computer Interaction, 1(1), 13-32.
62. Przybylski, A. K., Murayama, K., DeHaan, C. R., and Gladwell, V. (2013). Motivational, emotional, and behavioral correlates of fear of missing out. Computers in Human Behavior, 29(4), 1841-1848.
63. Radovic, A., Gmelin, T., Stein, B. D., and Miller, E. (2017). Depressed adolescents' positive and negative use of social media. Journal of Adolescence, 55, 5-15.
64. Rifkin, J., Cindy C., and Kahn B. (2015) Fomo: How the Fear of Missing Out Leads to Missing Out. NA-Advances in Consumer Research, 43.
65. Rosenbaum P. R, and Rubin D. B. (1983). The central role of the propensity score in observational studies for causal effects. Biometrika, 70, 41–55.
66. Rubin, D. B. (1980). Bias reduction using Mahalanobis-metric matching. Biometrics, 293-298. 67. Ruble, D. N., Boggiano, A. K., Feldman, N. S., & Loebl, J. H. (1980). Developmental analysis of the
role of social comparison in self-evaluation. Developmental Psychology, 16(2), 105. 68. Smith, R. H., Parrott, W. G., Diener, E. F., Hoyle, R. H., & Kim, S. H. (1999). Dispositional
envy. Personality and Social Psychology Bulletin, 25(8), 1007-1020. 69. Stuart, Elizabeth A. (2010). Matching Methods for Causal Inference: A Review and a Look Forward.
Statistical Science 25 (1), 1–21. 70. Tandoc, Edson C., Patrick Ferrucci, and Margaret Duffy. (2015). Facebook use, envy, and depression
among college students: Is facebooking depressing? Computers in Human Behavior 43, 139-146. 71. Tiwana, A., Konsynski, B., and Bush, A. A. 2010. Research Commentary—Platform Evolution:
Coevolution of Platform Architecture, Governance, and Environmental Dynamics. Information Systems Research 21(4), 675-687.
72. Toma, C. L., and Hancock, J. T. (2013). Self-affirmation underlies Facebook use. Personality and Social Psychology Bulletin, 39(3), 321-331.
73. Valkenburg, P. M., Peter, J., and Schouten, A. P. (2006). Friend networking sites and their relationship to adolescents' well-being and social self-esteem. CyberPsychology & Behavior, 9(5), 584-590.
74. Vecchio, R. P. (2000). Negative emotion in the workplace: Employee jealousy and envy. International

39
Journal of Stress Management, 7(3), 161-179. 75. Verduyn, Philippe, David Seungjae Lee, Jiyoung Park, Holly Shablack, Ariana Orvell, Joseph Bayer,
Oscar Ybarra, John Jonides, and Ethan Kross. (2015). Passive Facebook usage undermines affective well-being: Experimental and longitudinal evidence. Journal of Experimental Psychology: General 144 (2), 480.
76. Verduyn, P., Ybarra, O., Résibois, M., Jonides, J., & Kross, E. (2017). Do Social Network Sites Enhance or Undermine Subjective Well-‐‑Being? A Critical Review. Social Issues and Policy Review, 11(1), 274-302.
77. Vogel, Erin A., Jason P. Rose, Bradley M. Okdie, Katheryn Eckles, and Brittany Franz. (2015). Who compares and despairs? The effect of social comparison orientation on social media use and its outcomes. Personality and Individual Differences 86, 249-256.
78. Walther, J. B. (2011). Theories of computer-mediated communication and interpersonal relations. The handbook of interpersonal communication, 4, 443-479.
79. Wenninger, Helena, Hanna Krasnova, and Peter Buxmann. (2014). Activity matters: Investigating the influence of Facebook on life satisfaction of teenage users. In proc of the 22nd European Conference on Information Systems.
80. Wills, T. A. (1981). Downward comparison principles in social psychology. Psychological bulletin, 90(2), 245.
81. Wood, J. V., Taylor, S. E., and Lichtman, R. R. (1985). Social comparison in adjustment to breast cancer. Journal of Personality and Social Psychology, 49, 1169-1183.
82. Zhao S., Grasmuck S., and Martin J. (2008). Identity construction on Facebook: digital empowerment in anchored relationships. Computers in Human Behavior, 24, 1816–1836.