the impact of ex vivo clinical grade activation protocols on human t-cell phenotype and
TRANSCRIPT
The Impact of Ex Vivo Clinical Grade Activation Protocolson Human T-cell Phenotype and Function for the
Generation of Genetically Modified Cells for AdoptiveCell Transfer Therapy
Paul C. Tumeh,*w Richard C. Koya,z Thinle Chodon,* Nicholas A. Graham,yJThomas G. Graeber,yJz Begona Comin-Anduix,z and Antoni Ribas*zz
Summary: Optimized conditions for the ex vivo activation, geneticmanipulation, and expansion of human lymphocytes for adoptivecell therapy may lead to protocols that maximize their in vivofunction. We analyzed the effects of 4 clinical grade activationand expansion protocols over 3 weeks on cell proliferative rate,immunophenotype, cell metabolism, and transduction efficiencyof human peripheral blood mononuclear cells (PBMCs). Peaklentiviral transduction efficiency was early (days 2 to 4), at a timewhen cells showed a larger size, maximal uptake of metabolicsubstrates, and the highest level of proximal T-cell receptorsignaling engagement. Anti-CD2/3/28 activation beads inducedgreater proliferation rate and skewed PBMCs early on to a CD4phenotype when compared with the cells cultured in OKT3.Multicolor surface phenotyping demonstrated that changes inT-cell surface markers that define T-cell functional phenotypes weredependent on the time spent in culture as opposed to the particularactivation protocol. In conclusion, ex vivo activation of humanPBMCs for adoptive cell therapy demonstrate defined immuno-phenotypic and functional signatures over time, with cells early onshowing larger sizes, higher transduction efficiency, maximalmetabolic activity, and zeta-chain-associated protein-70 activation.
Key Words: adoptive cell therapy, melanoma, ex vivo activation,
lentiviral transduction, immunophenotyping
(J Immunother 2010;33:759–768)
Adoptive cell transfer (ACT) therapy involves thereinfusion of autologous ex vivo activated and ex-
panded antigen-specific lymphocytes to patients after ahost lymphodepleting regimen. Clinical experiences to datewith ACT demonstrate significant antitumor activity inpatients with metastatic melanoma.1–3 Three main sourcesof tumor antigen-specific lymphocytes have been investi-gated in the clinic: (1) autologous tumor-infiltratinglymphocytes expanded from tumor biopsies,4 (2) cellularcloning of antigen-specific lymphocytes expanded fromperipheral blood mononuclear cells (PBMCs),5,6 and (3)PMBCs genetically redirected to become tumor specificusing viral vector-mediated transduction of T-cell receptor(TCR) chains.7 Among these approaches, TCR engineeringprovides a promising strategy for the rapid generation oflarge numbers of tumor-specific lymphocytes in a step-wiseand predictable manner.7,8 To generate TCR engineeredlymphocytes, PBMCs collected from peripheral blood mustbe stimulated ex vivo to proliferate and enable retroviral orlentiviral vector transduction with the genes coding for2 cancer-specific TCR chains. However, the timing of viralvector transduction and the subsequent cellular manipula-tion for the selection of “optimally fit” TCR transgenicT-cell preparations remains to be elucidated as a relativepaucity of data currently exists on the immunophenotypicand functional signatures of PBMCs during exvivo activation.
It is likely that the ex vivo expansion and the viralvector transduction to express transgenic TCR genes willalter the phenotype and function of lymphocytes, resultingin changes in their in vivo distribution, persistence, andantitumor activity. Potential scenarios include the inabilityof T cells to maintain a naive phenotype with the ex vivomanipulations, the loss of specific memory T-cell pheno-types, and the acquisition of late effector or exhaustedT-cell phenotypes over time. Different T-cell subsets havedistinct surface phenotypes and functional profiles, andemerging data suggests that they may have markedlydifferent abilities to persist in vivo upon ACT.9
Several cell surface markers have been used to defineT-cell functional phenotypes. Naive T cells are defined byCD45RA expression and the lymph node homing markersCD62L and CCR7. Evidence supports that the expressionof these markers enables naive T cells to extravasate fromhigh endothelial venules and migrate to T-cell zones ofCopyright r 2010 by Lippincott Williams & Wilkins
Received for publication April 13, 2010; accepted July 9, 2010.From the *Division of Hematology-Oncology, Department of Medi-
cine, University of California Los Angeles (UCLA), Los Angeles;wDivision of Dermatology, Department of Medicine, Los AngelesBiomedical Research Institute at Harbor-UCLA Medical Center,Torrance; zDivision of Surgical Oncology, Department of Surgery,UCLA; Departments of yMolecular and Medical Pharmacology;zJonsson Comprehensive Cancer Center; and JDepartment ofMolecular and Medical Pharmacology, Crump Institute forMolecular Imaging, UCLA, Los Angeles, California.
Supported by the grants from the National Institutes of Health awardsP50 CA086306 and U54 CA119347, and the California Institute forRegenerative Medicine (CIRM) New Faculty Award RN2-00902-1and The Fred L. Hartley Family Foundation (A.R.). Paul C.Tumeh was supported by the UCLA Scholars in OncologicMolecular Imaging (SOMI) program. Richard C. Koya wassupported by the V Foundation-Gil Nickel Family EndowedFellowship in Melanoma Research. Nicholas A. Graham is apostdoctoral trainee supported by the UCLA Tumor BiologyProgram T32 CA009056. Thomas G. Graeber is an Alfred P. SloanResearch Fellow. The UCLA Flow Cytometry Core Facility issupported by the NIH awards CA-16042 and AI-28697.
All authors have declared there are no financial conflicts of interest inregard to this work.
Paul C. Tumeh and Richard C. Koya authors have contributed equallyto this study.
Reprints: Antoni Ribas, Division of Hematology-Oncology, Depart-ment of Medicine, 11-934 Factor Building, UCLA Medical Center,10833 Le Conte Avenue, Los Angeles, CA 90095-1782 (e-mail:[email protected]).
Supplemental Digital Content is available for this article. Direct URLcitations appear in the printed text and are provided in theHTML and PDF versions of this article on the journal’s website,www.immunotherapy-journal.com.
BASIC STUDY
J Immunother � Volume 33, Number 8, October 2010 www.immunotherapy-journal.com | 759

peripheral lymph nodes to be exposed to antigen presentedby dendritic cells. In addition, they express CD27 andCD28, 2 costimulatory receptors that aid in their activationupon TCR recognition of antigen. Antigen exposed T cellsdownregulate CD45RA and express CD45RO on their cellsurface. T central memory (TCM) cells are antigenexperienced cells (expressing CD45RO), and constitutivelyexpress CD62L and CCR7, enabling surveillance forantigen presentation in lymph nodes and preparation forsecondary expansion. T effector memory (TEM) cells havedownregulated lymph node homing markers, which isthought to enable these cells to populate peripheral tissuesand inflammatory sites for immediate response to patho-gens. TEM maintain CD27 expression but downregulatesurface CD28, subsequently limiting their proliferativecapacity upon secondary antigen exposure, but enhancingeffector function. This phenotype is even more pronouncedin T effector (TEFF) cells, which readily release cytotoxicgranules and immune effector cytokines upon antigenrecognition by their TCR, but have decreased ability topersist long term. TEFF cells are negative for CD27 andCD28, as well as for lymph node homing markers, andexpress markers of terminal T-cell activation such asKLGR-1 and the natural killer call marker CD57.9,10
The ability to recognize these T-cell subsets upon exvivo expansion for genetic modification should provideimportant information for the planning of ACT ap-proaches. It is notable that preclinical testing in animalmodels suggests that ACT of T cells with naive or TCMimmunophenotypes have shown superior in vivo function.For example, CCR7+CD27+CD28+CD62L+ T cells, aphenotype that is characteristic of TCM cells, showedsuperior ability to eradicate established tumors in micewhen compared with TEFF cells, which produced higherlevels of cytokines and cytotoxic activity in vitro beforeACT.9,11 Similar results were generated in a nonhumanprimate model, where transferred cells with a TCMphenotype were superior to cells with a TEM phenotypein their ability to persist in vivo.12 Furthermore, T cells witha naive phenotype obtained from TCR transgenic micedemonstrated enhanced antitumor activity after ACT whencompared with their mature T-cell counterpart.13 Incontrast to obtaining lymphocytes from TCR transgenicmice, significant challenges exist in the procurement of largepopulations of antigen-specific T cells from humans withminimal ex vivo manipulation. Hence, the majority of ACTclinical experiences have used extensively expanded cellsex vivo, generating TEM or TEFF phenotypes for celltransfer.8,14,15 The selection of these T cells has beenfrequently based on demonstration of full effector functionsex vivo, including high levels of interferon-g secretion andcytolytic activity, which are features of TEFF cells.However, this effector phenotype has been a suboptimalpredictor of their in vivo performance and is thought to bedue the ex vivo expansion process driving cells to anovermanipulated, exhausted phenotype.5,9,16 The ability togenetically redirect the specificity of large populations oflymphocytes by TCR gene transfer, with a one-time viraltransduction procedure, and the full exploitation ofhomeostatic proliferation after conditioning regimens toexpand cells in the host, provides the option of usingminimally manipulated lymphocyte subsets for humanACT protocols.
To better characterize ex vivo expanded lymphocyticpopulations for ACT, we performed studies on human
PBMCs to define the phenotype and function of cellsactivated under 4 clinical grade activation protocols.We systematically characterized and evaluated lymphocytegrowth and proliferative rate, metabolic and signaltransduction signatures, and immunophenotypic markersunder these protocols. A protocol using the clinical gradeanti-CD3 antibody OKT3 and the g-chain cytokineinterleukin (IL)-2 has been extensively tested in ACTprotocols.17 It is well established that the repeated use ofOKT3 in lymphocyte activation and expansion protocolsresults in vast activation-induced cell death in part owing tothe lack of including costimulatory signals. To address thislimitation, we also tested anti-CD2/3/28 magnetic beads,which provide CD28 costimulatory molecule engagement.These beads are generated at clinical grade and have beenshown to adequately expand T cells for ACT when usedwith IL-2.18 We also tested the potential value of addingIL-15 to these activation protocols as ACT in mouse modelsof CD8+ T cells cultured in IL-15 demonstrated greatertumor cytotoxicity than those cultured in IL-2 alone.19 Ourstudies demonstrate that ex vivo-activated lymphocytesexperience an initial phase of metabolic activation followedby marked proliferation. During the metabolic activationphase, these cells can be optimally genetically modifiedwith lentiviral vectors and subsequently expanded ex vivo.The comparison of the 4 clinical grade protocols tested byus yielded information about slight effects of each one ofthem on the cell surface phenotype and downstream TCRsignaling. However, lymphocyte phenotype was mainlyguided by the duration of ex vivo expansion as opposed toa particular activation protocol, and it did not follow theclassical definitions of naive, TCM, TEM, and TEFF cells.
MATERIALS AND METHODS
Cell Procurement and ActivationPBMCs were collected from a healthy donor under
University of California Los Angeles institutional reviewboard approval number 04-07-063 and cryopreserved aspreviously described.20 PBMCs were thawed and dilutedwith Roswell Park Memorial Institution complete mediacontaining 5% human AB serum, and 1% penicillin,streptomycin, and amphotericin (Omega Scientific, Tarzana,CA). Cells were washed and subjected to enzymatic treatmentwith DNase (Sigma, St Louis, MO) for 1 hour at 371C, andrested overnight in a 5% CO2 incubator. The next day cellswere diluted with fresh media to a concentration of 1.5million cells per milliliter and activated with 50ng/mL ofanti-CD3 antibody OKT3 (Centocor Ortho Biotech Inc,Horsham, PA) or anti-CD2/3/28 activation beads using abead-to-cell ratio of 1:2 (Anti-Biotin MACSiBead particles,Miltenyi, Auburn, CA). About 300 IU/mL of IL 2 (gift fromNovartis, Emeryville, CA), with or without the addition of10ng/mL of IL-15 (gift from Amgen, Thousand Oaks, CA)was added to the groups.
Lentiviral Vector ProductionThe 293 T-cell line was obtained from American Type
Culture Collection (Rockville, MD) and cultured in Dulbeccomodified Eagle medium with l-glutamine (BioWittaker, Walk-erville, MD), 10% fetal bovine serum (HyClone, Logan, UT),and 1% penicillin and streptomycin. The constructs requiredfor the packaging of third-generation self-inactivating lentiviralvectors have been previously described.21 The MART-1TCR chains were a kind gift of Dr Steven A. Rosenberg
Tumeh et al J Immunother � Volume 33, Number 8, October 2010
760 | www.immunotherapy-journal.com r 2010 Lippincott Williams & Wilkins

(NCI Surgery Branch, Bethesda, MD) and were extractedfrom a retroviral vector that has been previously described.8
Viral titer was determined by assessing viral p24 antigenconcentration by enzyme-linked immunosorbent assay(Coulter Immunetech, Miami, FL) and hereafter expressedas milligram of p24 equivalent units per milliliter. Onemicrogram per milliliter of p24 measured in the preparationcorresponds to approximately 107 green fluorescent protein(GFP) transduction units per milliliter, as assessed bytitration in 293 T cells. For each production round, weobtained 10mL of concentrated virus, at 20 to 40mg/mLp24 equivalent, which was cryopreserved at �801C untilready to use.
Lentiviral Vector-mediated Gene TransferStimulated PBMCs were washed twice with adoptive
immunotherapy media-V (Invitrogen Corporation, Carls-bad, CA) and for each transduction point 1�106 cells weremixed with the lentiviral vector supernatant at 1mg p24equivalents per milliliter. Protamine sulfate (Sigma), wasadded at the final concentration of 6mg/mL, and thetransduction plates were incubated overnight at 371C, 5%CO2. PBMCs were washed twice with adoptive immuno-therapy media-V medium and seeded at a density of 106
cells/mL in adoptive immunotherapy media-V, 5% humanAB serum, and 300 IU/mL of IL-2, with or without theaddition of 10 ng/mL of IL-15. Forty-eight hours latercells were harvested for fluorescence-activated cell sortinganalysis of GFP expression, or MART-1 TCR expressionusing commercially available MART-126–35 MHC tetra-mers as previously described.22 Transduced PBMCs wereresuspended in 50mL of adult bovine serum for blocking,followed by staining for the surface membrane antigensCD3, CD8, and CD4 (BD Biosciences, San Jose, CA) for30 minutes on ice. Flow cytometric analysis was performedin a FACScalibur cytometer equipped with a 488-nm argonlaser (Becton Dickinson, Franklin Lakes, NJ).
Flow Cytometry Staining for SurfaceImmunophenotyping and IntracellularPhosphoprotein Staining
Activated PBMCs were resuspended in 100mL ofadult bovine serum (Omega Scientific, Tarzana, CA) andstained for 15 minutes at room temperature. A 9-colorcell surface staining was used with 3 cocktail combinationsof antibodies in replicate aliquots of the cultures (Supple-mental Table 1 http://links.lww.com/JIT/A70). For intra-cellular phosphoprotein staining, activated PBMCs werefixed with 2% paraformaldehyde (Electron MicroscopyServices, Fort Washington, PA), and permeabilized using90% ice-cold methanol. Fixed and permeabilized PBMCswere washed twice in Dulbecco phosphate-buffer saline(Mediatech Inc, Manassas, VA), 0.5% bovine serum albumin(Sigma), and 0.01% sodium azide (Sigma). Replicatealiquots of cultures at different time points were labeledwith 3 cocktails of antibodies in a 5-color cell surface andintracellular staining flow cytometry approach (Supple-mental Table 2 http://links.lww.com/JIT/A71) for 30minutes at room temperature in the dark. Antibodies weredirectly conjugated and used at saturated conditions. Forall experiments, a combination of antimouse Ig k/negativecontrol fetal bovine serum compensation particles (BDBiosciences) and PBMCs were used for compensationpurposes, and 5�105 to 1�106 lymphocytes were acquiredfor each condition. To correctly gate the flow cytometry
data, the fluorescent minus one approach was used.20,23
All samples were acquired on a LSR II (BD Biosciences)and data were analyzed using FlowJo software (TreeStar,Ashland, OR). For extracellular 9-color flow cytometry,Boolean gating was used to calculate the frequencyof immunomarkers (Supplemental Figure 1 http://links.lww.com/CJP/A17).24 We used Uniform Priority 0, aspreviously described,25 to depict 5 independent dimensionsof data in a single display for polychromatic plots. Thebiexponential approach was used in all the plots. Forclustering analysis, the flow cytometry data was meancentered, unit normalized, and subjected to unsupervisedhierarchical clustering using the average-linkage methodbased on the Pearson correlation.26 Results were visualizedusing Java Treeview.27
Metabolic Tracer Uptake AssayTritium (3H)-labeled 20-deoxy-D-glucose (20DDG),
30-deoxy-30-fluorothymidine (30FLT), and 20-deoxy-20-fluoroarabinofuranosylcytosine (FAC) were purchasedfrom Moravek Biochemicals (Brea, CA). For radioactivetracer uptake assays, we added 0.5mCi of (3H)20DDG,(3H)30FLT, or (3H)FAC to wells containing equal aliquotsof 2�104 cells from each condition and at each time pointin a 96-well tissue culture plate and incubated the plate for1 hour at 371C and 5% CO2. Glucose-free medium was usedfor experiments with (3H)20DDG. Extracellular metabolictracer was washed off using a multiscreen high throughputscreening vacuum manifold system (Millipore, Billerica,MA). About 100 mL scintillation fluid (Perkin Elmer,Waltham, MA) was added to each well and tritium countswere measured on a 1450 microbeta trilux microplate(Perkin Elmer). To normalize the amount of radioliganduptake on a per cell basis, 0.05mCi of probe was placedinto 4�104 cells/well for 1 hour. After 3 washes withphosphate-buffered saline, the total amount of radioactivitywas measured in scintillation counts per minute. Back-ground counts (0.05 mCi of radioligand placed into anempty well) were subtracted from counts measured inexperimental wells. This generated an accurate count of theprobe uptake per well. As each radioligand is characterizedby a specific radioactivity in Curies per millimole, a simpleunit conversion from Curies per millimole to counts perminute/femtomole enabled us to determine the totalamount of radioactivity per 4�104 cells.
Statistical AnalysisData were analyzed with GraphPad Prism (version 5)
software (GraphPad Software, La Jolla, CA). A Mann-Whitney U test or analysis of variance with Bonferroniposttest was used.
RESULTS
Clinical Grade Lymphocyte Activation ProtocolsHuman PBMCs were thawed and activated in
triplicate under the following conditions: (1) OKT3 anti-body plus IL-2, (2) OKT3 antibody plus IL-2 and 15,(3) anti-CD2/3/28 activation beads plus IL-2, and (4) anti-CD2/3/28 activation beads plus IL-2 and IL-15 (Fig. 1A).These 4 activation protocols provided the platform toanalyze cell growth and proliferative rate, metabolicsubstrate utilization by radioactive tracer uptake, lentiviraltransduction efficiency, immunophenotype by polychromatic
J Immunother � Volume 33, Number 8, October 2010 Ex Vivo Clinical Grade Activation Protocols for Act
r 2010 Lippincott Williams & Wilkins www.immunotherapy-journal.com | 761

flow cytometry, and signal transduction with intracellularphosphoprotein flow cytometry staining.
Distinct Ratios of CD4/CD8 T-cell Subsets OverTime With OKT3 and Anti-CD2/3/28 Beads andCD8 Skewing With IL-15
Dynamic changes in the percentage of CD4, CD8, CD4/CD8 double negative, and CD4/CD8 double positive T-cellsubsets during activation were analyzed. At baseline, thawedPBMCs demonstrated the expected 2:1 ratio of CD4:CD8T-cell subsets, with approximately 65% of CD4+ cells and25% of CD8+ cells after gating for CD3+ lymphocytes. Byday 7, OKT3 and anti-CD2/3/28 beads expanded markedlydifferent T-cell subset populations. Under OKT3 influence,50% to 60% of total lymphocytes demonstrated a CD8+
T-cell phenotype whereas 75% to 85% of lymphocytes inanti-CD2/3/28 cultures were CD4+ T cells (Fig. 1B). How-ever, the enhanced proliferative rate experienced by lympho-cytes stimulated with anti-CD2/3/28 beads yielded a greater
absolute number of CD8+ T cells compared with OKT3cultures at all time points (Fig. 2A). It is interesting to notethat, we observed reciprocal patterns of differentiation overthe 21 days with OKT3 anti-CD3 antibody with IL-2 (CD8+
- CD4+) and anti-CD2/3/28 activation beads with IL-2(CD4+ - CD8+). The addition of IL-15 directed T cellstoward a predominant CD8+ subset in both OKT3 and anti-CD2/3/28 groups. The baseline presence of a small populationof CD4/CD8 double negative (but CD3 positive) cellsdisappeared shortly after placing the cells in culture, with thispopulation reappearing by the end of the culture period. Asmall population of double positive T cells was also noted bythe end of the culture period under all conditions (Fig. 1B).
T-cell Activation With Anti-CD2/3/28 BeadsResults in Larger Cell Size and GreaterProliferative Rate Compared With OKT3
We analyzed the cell viability and size at differentstages of ex vivo activation and expansion using an
OKT3 + IL-2
OKT3 + IL-2 + IL-15
Anti-CD2/3/28 beads + IL-2
Anti-CD2/3/28 beads + IL-2 + IL-15
A
IL-2
B
Per
cent
age
(%)
OKT3 Anti-CD2/3/28 beads
IL-2
+ IL
-15
FIGURE 1. Clinical-grade lymphocyte activation protocols and their effects on CD4/CD8 T-cell subsets as a function of time. A,Schematic of the 4 clinical grade compatible activation protocols. B, CD4 positive, CD8 positive, CD4/CD8 double negative, and CD4/CD8double positive T-cell subsets (all gated on CD3+ cells) analyzed over time with the 4 activation protocols. Respective percentages of varyingT-cell subsets are represented over 21 days of activation as analyzed by flow cytometry. IL indicates interleukin.
Tumeh et al J Immunother � Volume 33, Number 8, October 2010
762 | www.immunotherapy-journal.com r 2010 Lippincott Williams & Wilkins

automated cell counter with trypan blue exclusion. Cellviability was greater than 95% in all groups and at all timepoints through 21 days (data not shown). Activated cellsdemonstrated a larger size on days 2 to 4, at a time whencells started proliferation (Fig. 2A; P<0.0001; 5 replicatesamples for each time point had very close values, and theerror bars are hidden behind the symbols at most timepoints). Anti-CD2/3/28 beads generated PBMCs that were 1to 2mm in diameter larger than those activated with OKT3(P<0.001). Under all conditions, PBMCs proliferatedexponentially from day 2 onwards (note the semilogarithmicplot for cell number in Fig. 2A), with anti-CD2/3/28activation beads showing a greater proliferative rate. Thisproliferative rate was upheld through day 21. The addition ofIL-15 did not generate differences in cell size, but it had anadverse effect in the proliferation of OKT3 cultures(P<0.001 comparing IL-2 alone with IL-2 plus IL-15).
Accumulation of metabolic substrates is positivelyassociated with cell size and negatively associated withproliferative rate. Lymphocyte metabolism is a reflection ofcell fitness and function, which we reasoned could bestudied by the uptake of metabolic imaging probes.28 Wemeasured the intracellular retention of (3H)-20DDG as ameasure of glucose metabolism, and (3H)-30FLT as reflec-tion of cell proliferation as it is an analog of thymidinethat can be used for positron emission tomography (PET)
scanning in humans.29 In addition, we also tested (3H)-FAC, a recently described PET probe able to detectimmune cell activation in mouse models as an additionalmeasure of lymphocyte activation and proliferation.30 In allcases, equal cellular aliquots taken from the cultures wereused with results normalized to metabolic tracer uptakeon a per cell basis. It is interesting to note that, peakaccumulation of all the 3 metabolic probes was on day 2,with decreased accumulation in cells that were rapidlyproliferating thereafter (Fig. 2B). Cells activated by OKT3and anti-CD2/3/28 beads shared similar (3H)-20DDGprofiles, whereas activation with the OKT3-containingprotocols led to an increased retention of (3H)-30FLT and(3H)-FAC. Addition of IL-15 did not reproducibly affectmetabolic substrate accumulation.
Peak Lentiviral Transduction EfficiencyCorrelates With Greater Cellular Size andIncorporation of Metabolic Tracers
In an effort to define optimal scheduling of ex vivoviral vector-mediated genetic engineering of lymphocytesfor ACT, we determined the efficiency of lentiviral transduc-tion of CD4+ and CD8+ isolated lymphocytes under thevarying activation protocols. For these studies we used aGFP-expressing lentiviral vector with transduction efficiencyanalyzed by flow cytometry. Highest transduction efficiencywas noted on day 2 (Fig. 3A). It is interesting to note that,peak transduction efficiency did not correlate with exponen-tial proliferation, as by days 7 and 14 transduction efficiencylevels decreased. The addition of IL-15 did not influencetransduction efficiency. Having defined the best timing forlentiviral transduction using a marker gene, we next testedthe effects of these different protocols on the transductionefficiency and surface expression of a MART-1 melanomaantigen HLA-A*0201-restricted TCR induced by a lentiviralvector constructed to express the a and b chains of thisTCR. T lymphocytes activated with anti-CD2/CD3/CD28beads had higher surface expression of the TCR incomparison to cells activated with OKT3 (Fig. 3B). It isinteresting to note that, transduction efficiency was higher inCD4+ T cells in comparison to CD8+ T cells, which isa reproducible observation in PBMC from other donors(data not shown).
Analysis of Signaling Networks Downstream ofSurface Receptors During Ex Vivo Expansion
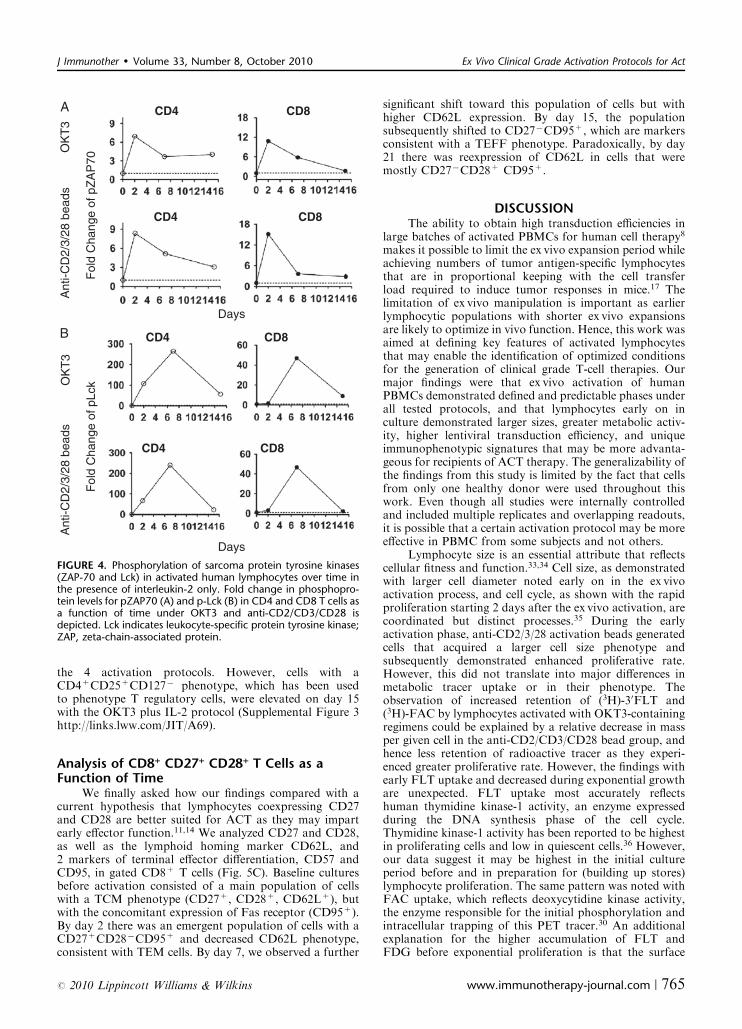
Phosphorylation of the protein tyrosine kinases zeta-chain-associated protein (ZAP-70) of 70 kda and leukocyte-specific protein tyrosine kinase are reflective of signaltransduction upon surface TCR activation.31,32 Maximalphosphorylation of ZAP-70 in lymphocytes was observedon day 2 postactivation in all groups (Fig. 4A). There was a6 to 8-fold peak increase in phosphorylation in ZAP-70 inCD4+ T cells and a 10 to 15-fold peak increase inphosphorylation in ZAP-70 in CD8+ T cells, irrespectiveof the culture system. The pattern of leukocyte-specificprotein tyrosine kinase phosphorylation was markedlydifferent, with day 7 demonstrating peak phosphorylationlevels and a decrease almost back to baseline by day 15.TCR signaling downstream of these 2 sarcoma kinases isfollowed by the activation of the mitogen-activated proteinkinase and the PI3k/Akt signaling pathways (SupplementalFigure 2 http://links.lww.com/JIT/A68). We found evi-dence of higher levels of phosphorylation of p38 andextracellular signal-regulated kinases upon T-cell expansion
OK
T3
Ant
i-CD
2/3/
28 b
eads
B 2-DDG FLT FAC
Days
Trac
er u
ptak
e (f
mol
s)
IL2IL2 IL15
A
OKT3 IL2OKT3 IL2 IL15antiCD2/3/28 IL2antiCD2/3/28 IL2 IL15
Cel
l dia
met
er (
µm)
Proliferation ( x 10
6)
Days
FIGURE 2. The effects of ex vivo activation protocols onlymphocyte size, proliferative rate, and metabolism. A, Celldiameter and proliferation under the 4 varying protocols. Cellsize and counts were obtained using an automated cell counterwith trypan blue exclusion. B, Metabolic probe accumulationby ex vivo-activated lymphocytes. Equal aliquots of 2�104 cellsfrom the different cultures at different time points wereincubated with (3H)-labeled metabolic probes for 1 hour, afterwhich the trapped intracellular radioactivity was measured. Errorbars represent means ± SEM of 3 independent experiments.DDG, 20-deoxy-D-glucose; FAC, 20-deoxy-20-fluoroarabinofurano-sylcytosine; FLT, fluorothymidine; IL, interleukin.
J Immunother � Volume 33, Number 8, October 2010 Ex Vivo Clinical Grade Activation Protocols for Act
r 2010 Lippincott Williams & Wilkins www.immunotherapy-journal.com | 763

when compared with Akt. We also analyzed the phosphory-lation status of signal transducers and activators oftranscription (STAT), which are important signalingmolecules downstream of cytokine receptors and also ofthe mitogen-activated protein kinase pathway. There was alate (day 7) increase in pSTAT6 in proliferating lympho-cytes regardless of the activation protocol, whereas the restof pSTATs were relatively constant throughout the ex vivoexpansion cultures. Similar results were observed at allculture conditions.
Multicolor Surface Phenotyping of Ex VivoExpanded Lymphocytes
We next asked whether lymphocyte surface markersfor activation, lymph node homing, and memory pheno-types that segregate T-cell functional subsets were differen-tially expressed with the 4 activation protocols. PBMCsobtained at baseline and at 4 time points during ex vivoactivation were evaluated by multicolor surface phenotyping
using 3 different combination groups of 8 surface mar-kers. This strategy enabled the simultaneous analysis of5 surface markers at each time point on CD3+ lymphocytesgated based on CD4 or CD8 positivity. To interrogatewhether lymphocyte phenotype subsets segregated byactivation protocol or by culture day, we subjected theflow cytometry data to unsupervised hierarchical clustering.As depicted by heat maps, the major driver for clusteringsurface phenotypes for both CD4+ and CD8+ cells wastime spent in culture, rather than the activation protocol(Figs. 5A, B). For CD4+ T cells, a phenotype ofCD25+CD27+CD28+CD44+ and CCR7�CCR5� pre-dominated on culture day 2, whereas cells with a phenotypeof CD45RO+HLA�DR+ and CD127 to CD137� werepredominantly observed on culture day 21. The surfacephenotype was different for CD8 cells, with a phenotypeof CD27+CD28+CD137+ and CCR7� predominatingon day 2, and CCR7+HLA–DR+ and CD137� byday 21. These phenotypic changes were common with
CD3 CD4 CD8
A
IL2
IL2 IL15
CD4 T cells CD8 T cells
Days
OK
T3
Ant
i-CD
2/3/
28 b
eads
Tran
sduc
tion
leve
l (G
FP
%)
B
MA
RT
-1
tetr
amer
FIGURE 3. Lentiviral transduction efficiencies in human lymphocytes as a function of time and culture system. A, The percentage of GFPexpressing CD4 and CD8 lymphocytes over time is depicted. Transduction efficiency was determined using flow cytometry aftertransducing cells with a lentiviral vector expressing GFP. B, MART-126�35 tetramer assay to assess surface TCR expression of CD3+ T cellsactivated with OKT3 or anti-CD2/3/28 and transduced with a lentiviral-MART-1 TCR vector. GFP indicates green fluorescent protein; IL,interleukin; TCR, T-cell receptor.
Tumeh et al J Immunother � Volume 33, Number 8, October 2010
764 | www.immunotherapy-journal.com r 2010 Lippincott Williams & Wilkins
the 4 activation protocols. However, cells with aCD4+CD25+CD127� phenotype, which has been usedto phenotype T regulatory cells, were elevated on day 15with the OKT3 plus IL-2 protocol (Supplemental Figure 3http://links.lww.com/JIT/A69).
Analysis of CD8+ CD27+ CD28+ T Cells as aFunction of Time
We finally asked how our findings compared with acurrent hypothesis that lymphocytes coexpressing CD27and CD28 are better suited for ACT as they may impartearly effector function.11,14 We analyzed CD27 and CD28,as well as the lymphoid homing marker CD62L, and2 markers of terminal effector differentiation, CD57 andCD95, in gated CD8+ T cells (Fig. 5C). Baseline culturesbefore activation consisted of a main population of cellswith a TCM phenotype (CD27+, CD28+, CD62L+), butwith the concomitant expression of Fas receptor (CD95+).By day 2 there was an emergent population of cells with aCD27+CD28�CD95+ and decreased CD62L phenotype,consistent with TEM cells. By day 7, we observed a further
significant shift toward this population of cells but withhigher CD62L expression. By day 15, the populationsubsequently shifted to CD27�CD95+, which are markersconsistent with a TEFF phenotype. Paradoxically, by day21 there was reexpression of CD62L in cells that weremostly CD27�CD28+ CD95+.
DISCUSSIONThe ability to obtain high transduction efficiencies in
large batches of activated PBMCs for human cell therapy8
makes it possible to limit the ex vivo expansion period whileachieving numbers of tumor antigen-specific lymphocytesthat are in proportional keeping with the cell transferload required to induce tumor responses in mice.17 Thelimitation of ex vivo manipulation is important as earlierlymphocytic populations with shorter ex vivo expansionsare likely to optimize in vivo function. Hence, this work wasaimed at defining key features of activated lymphocytesthat may enable the identification of optimized conditionsfor the generation of clinical grade T-cell therapies. Ourmajor findings were that ex vivo activation of humanPBMCs demonstrated defined and predictable phases underall tested protocols, and that lymphocytes early on inculture demonstrated larger sizes, greater metabolic activ-ity, higher lentiviral transduction efficiency, and uniqueimmunophenotypic signatures that may be more advanta-geous for recipients of ACT therapy. The generalizability ofthe findings from this study is limited by the fact that cellsfrom only one healthy donor were used throughout thiswork. Even though all studies were internally controlledand included multiple replicates and overlapping readouts,it is possible that a certain activation protocol may be moreeffective in PBMC from some subjects and not others.
Lymphocyte size is an essential attribute that reflectscellular fitness and function.33,34 Cell size, as demonstratedwith larger cell diameter noted early on in the ex vivoactivation process, and cell cycle, as shown with the rapidproliferation starting 2 days after the ex vivo activation, arecoordinated but distinct processes.35 During the earlyactivation phase, anti-CD2/3/28 activation beads generatedcells that acquired a larger cell size phenotype andsubsequently demonstrated enhanced proliferative rate.However, this did not translate into major differences inmetabolic tracer uptake or in their phenotype. Theobservation of increased retention of (3H)-30FLT and(3H)-FAC by lymphocytes activated with OKT3-containingregimens could be explained by a relative decrease in massper given cell in the anti-CD2/CD3/CD28 bead group, andhence less retention of radioactive tracer as they experi-enced greater proliferative rate. However, the findings withearly FLT uptake and decreased during exponential growthare unexpected. FLT uptake most accurately reflectshuman thymidine kinase-1 activity, an enzyme expressedduring the DNA synthesis phase of the cell cycle.Thymidine kinase-1 activity has been reported to be highestin proliferating cells and low in quiescent cells.36 However,our data suggest it may be highest in the initial cultureperiod before and in preparation for (building up stores)lymphocyte proliferation. The same pattern was noted withFAC uptake, which reflects deoxycytidine kinase activity,the enzyme responsible for the initial phosphorylation andintracellular trapping of this PET tracer.30 An additionalexplanation for the higher accumulation of FLT andFDG before exponential proliferation is that the surface
A
B
OK
T3
Ant
i-CD
2/3/
28 b
eads
Fol
d C
hang
e of
pZ
AP
70
OK
T3
Ant
i-CD
2/3/
28 b
eads
Fol
d C
hang
e of
pLc
k
Days
Days
CD4 CD8
CD4 CD8
CD4 CD8
CD4 CD8
FIGURE 4. Phosphorylation of sarcoma protein tyrosine kinases(ZAP-70 and Lck) in activated human lymphocytes over time inthe presence of interleukin-2 only. Fold change in phosphopro-tein levels for pZAP70 (A) and p-Lck (B) in CD4 and CD8 T cells asa function of time under OKT3 and anti-CD2/CD3/CD28 isdepicted. Lck indicates leukocyte-specific protein tyrosine kinase;ZAP, zeta-chain-associated protein.
J Immunother � Volume 33, Number 8, October 2010 Ex Vivo Clinical Grade Activation Protocols for Act
r 2010 Lippincott Williams & Wilkins www.immunotherapy-journal.com | 765

expression of transporters for these nucleoside analogs maybe higher during the initial culture period; this possibilitywas not explored in this work. It is of particular interestthat peak lentiviral vector-mediated transduction efficiency
was noted during the early stage of cell proliferationconcordant with the higher metabolic tracer uptake.
CD4/CD8 skewing seen with varying activationprotocols and on different days may result in lymphocytes
CD8+CD4+
C
Day 2Day 0 Day 15Day 7
CD28
CD
27
1050
0.23 8.41
83.28.18
Day 21
CD95
CD62L CD57
A B
105
103
103
104
104
Tumeh et al J Immunother � Volume 33, Number 8, October 2010
766 | www.immunotherapy-journal.com r 2010 Lippincott Williams & Wilkins

with distinct phenotype and function for ACT. Prepara-tions with a higher percentage of CD4+ T cells may bebetter equipped for supporting CD8+ T cells in vivo.37 Inthis regard, the anti-CD2/3/28 bead protocol without theaddition of IL-15 generated higher absolute numbers andproportions of CD4+ T cells during the first 2 weeks ofculture. Therefore, it would be interesting to test thisactivation protocol in ACT experiments. We expected anti-CD2/3/28 activation beads to costimulate as well as provideTCR signaling by nonspecific CD3 engagement, resulting inmarkedly different lymphocyte phenotypes when comparedwith activation with OKT3 (lacking the CD28 costimula-tion). However, our findings suggested that the days spentin culture had a greater influence on immunophenotypethan the specific T-cell activation and expansion conditions.Of note, the high concentrations of IL-2 used in all thetested conditions may have an overriding effect to potentialbenefits that may be derived from adding IL-15. It iscertainly possible that lower concentrations of IL-2 wouldhave allowed noticing beneficial effects of adding IL-15,which was not evident in our studies.
The day 2 immunophenotype was markedly differentcompared with day 0, suggesting a rapid change in cellsurface marker expression upon ex vivo expansion. It isinteresting to note that programmed death 1, a markerassociated with T cells that have progressed beyond theireffector phenotype and display evidence of exhaustion38
did not consistently increase with the progression of thecultures until day 21. Both CD4+ and CD8+ T cells almostuniformly lacked the lymph node homing marker CCR7 byculture day 2, but this marker increased on the surface ofthe CD8 subset gradually and peaked at 3 weeks. Althoughthere are several models to explain the progression betweeneffector and memory cell phenotypes,39 this observation withex vivo activated and expanded cultures would suggest thatperipherally circulating TEFF cells can acquire a phenotypemore consistent with centrally circulating lymphocytes withlong-term cultures.
There is limited published data to date on thephenotype of TCR transgenic lymphocytes administeredto patients. The most complete is from Johnson et al,8
where cells used for ACT had low CD27, intermediateCD28, low CD45RA, and high CD45RO. Our analysis didnot readily detect a significant population of cells with thisphenotype (Fig. 5C). However, their approach included theaddition of a rapid expansion protocol involving expandedcultures in IL-2 and allogeneic feeder cells after the initialculture in OKT3 and IL-2. The rapid expansion protocol38
results in further expansion of cells by 1 to 2 logs, which maygenerate functional phenotypes different from those describedherein. It is interesting to note that, in the Johnson et al work,the ratio of CD45 isoforms changed in TCR transgenic cellsrecovered from the peripheral blood of patients, with themajority reverting to a CD45RA+ phenotype. This suggests
that the functional phenotype of cells before ACT changeswith cell expansion in a lymphodepleted host, as previouslydescribed in experiences analyzing the process of homeostaticproliferation in murine models.39
Finally, the advent of multicolor flow cytometry poseschallenges in conceptualizing and depicting the concomi-tant analysis of multiple markers simultaneously expressedby single cells analyzed by flow cytometry. If depictedand followed individually or in pairs, the added value ofdetecting multicolor staining in single cells is lost. With ourdata, we found that heat map representations of unsuper-vised hierarchical clustering revealed how cell surfacephenotypes segregated based on culture conditions andtime. Using this approach, we concluded that the time spentin culture has a greater impact on cell phenotype than the4 activation and expansion protocols tested here. Thissurface phenotype data may aid in the future in interpretingthe functional phenotype of adoptively transferred cells topatients.
This work was undertaken in preparation for a clinicalprogram using TCR transgenic lymphocytes for ACTtherapy in patients with melanoma (clinical trial registra-tion number NCT00910650). Based on the data presentedherein we made decisions for the ex vivo expansion andviral vector transduction of PBMC, with the caveat thatdata from a single healthy donor may not fully recapitulatewhat can be encountered when activating and genemodifying PBMC from a series of patients with advancedmelanoma. Viral vector transduction to insert TCR genesinto lymphocytes is performed on days 2 and 3 afterinitiating ex vivo PBMC expansion to optimize transduc-tion efficiency. The observation that the time in culture wasthe major determinant of T-cell functional phenotype, asopposed to a particular ex vivo expansion protocol, led usto decide to use OKT3 and IL-2 as the activation protocolgiven its prior successful use in clinical trials of TCRengineering ACT. As the production of clinical grade OKT3has been recently discontinued, we are using OKT3 from acommercial vendor with additional lot release testing forpurity and potency as defined in the investigator new drugapplication filed with the Food and Drug Administration.The marked changes with expanded culture in vitro and theemergence of cellular populations with nonphysiologicalphenotypes led us to select a limited (7d) expansion exvivowith the hopes to optimize in vivo proliferation after ACT tolymphopenic hosts.
REFERENCES
1. June CH. Principles of adoptive T cell cancer therapy. J ClinInvest. 2007;117:1204–1212.
2. Yokosuka T, Sakata-Sogawa K, Kobayashi W, et al. Newlygenerated T cell receptor microclusters initiate and sustainT cell activation by recruitment of Zap70 and SLP-76. NatImmunol. 2005;6:1253–1262.
FIGURE 5. Multicolor surface immunophenotyping of ex vivo-activated human lymphocytes. Unsupervised clustering of heat mapsconstructed with data from multicolor surface phenotyping of CD4 (A) and CD8 (B) cells using 3 different combination groups ofsurface markers (Supplemental Tables 1 and 2). Each column represents cells activated with the indicated stimuli for the indicated timeand rows represent the measured surface phenotypes. Red and green indicate high and low percentages, respectively, of cells describedby the indicated surface phenotype. Each column sums to 3�100%, for the 3 combinations of surface markers. The predominant CD4phenotypes of CD25+CD27+CD28+CD44–CCR7�CCR5� on day 2 and CD45RO+CD127�CD137�HLA�DR+ on day 21, and CD8phenotypes of CD27+CD28+CD137+CCR7� on day 2 and CD137�CCR7+HLA�DR+ on day 21 are indicated by red boxes. C, Time-course analysis of gated CD8 cells in the presence of interleukin-2 only. Expression of CD27 (y-axis), CD28 (x-axis), CD57 (green),CD62L (red), and CD95 (blue) in a 5 dimensional polychromatic plot is depicted.
J Immunother � Volume 33, Number 8, October 2010 Ex Vivo Clinical Grade Activation Protocols for Act
r 2010 Lippincott Williams & Wilkins www.immunotherapy-journal.com | 767
3. Dudley ME, Wunderlich JR, Yang JC, et al. Adoptive celltransfer therapy following non-myeloablative but lympho-depleting chemotherapy for the treatment of patientswith refractory metastatic melanoma. J Clin Oncol. 2005;23:2346–2357.
4. Rosenberg SA, Packard BS, Aebersold PM, et al. Use oftumor-infiltrating lymphocytes and interleukin-2 in the im-munotherapy of patients with metastatic melanoma. Apreliminary report. N Engl J Med. 1988;319:1676–1680.
5. Yee C, Thompson JA, Byrd D, et al. Adoptive T cell therapyusing antigen-specific CD8+ T cell clones for the treatmentof patients with metastatic melanoma: in vivo persistence,migration, and antitumor effect of transferred T cells. ProcNatl Acad Sci U S A. 2002;99:16168–16173.
6. Hunder NN, Wallen H, Cao J, et al. Treatment of metastaticmelanoma with autologous CD4+ T cells against NY-ESO-1.N Engl J Med. 2008;358:2698–2703.
7. Morgan RA, Dudley ME, Wunderlich JR, et al. Cancerregression in patients after transfer of genetically engineeredlymphocytes. Science. 2006;314:126–129.
8. Johnson LA, Morgan RA, Dudley ME, et al. Gene therapywith human and mouse T-cell receptors mediates cancerregression and targets normal tissues expressing cognateantigen. Blood. 2009;114:535–546.
9. Klebanoff CA, Gattinoni L, Restifo NP. CD8+ T-cell memoryin tumor immunology and immunotherapy. Immunol Rev.2006;211:214–224.
10. Sallusto F, Lenig D, Forster R, et al. Two subsets of memoryT lymphocytes with distinct homing potentials and effectorfunctions. Nature. 1999;401:708–712.
11. Gattinoni L, Klebanoff CA, Palmer DC, et al. Acquisition offull effector function in vitro paradoxically impairs the in vivoantitumor efficacy of adoptively transferred CD8+ T cells.J Clin Invest. 2005;115:1616–1626.
12. Berger C, Jensen MC, Lansdorp PM, et al. Adoptive transferof effector CD8+ T cells derived from central memory cellsestablishes persistent T cell memory in primates. J Clin Invest.2008;118:294–305.
13. Hinrichs CS, Borman ZA, Cassard L, et al. Adoptivelytransferred effector cells derived from naive rather than centralmemory CD8+ T cells mediate superior antitumor immunity.Proc Natl Acad Sci U S A. 2009;106:17469–17474.
14. Powell DJ Jr, Dudley ME, Robbins PF, et al. Transition oflate-stage effector T cells to CD27+ CD28+ tumor-reactiveeffector memory T cells in humans after adoptive cell transfertherapy. Blood. 2005;105:241–250.
15. Pule MA, Savoldo B, Myers GD, et al. Virus-specific T cellsengineered to coexpress tumor-specific receptors: persistenceand antitumor activity in individuals with neuroblastoma. NatMed. 2008;14:1264–1270.
16. Dudley ME, Wunderlich JR, Yang JC, et al. A phase I study ofnonmyeloablative chemotherapy and adoptive transfer ofautologous tumor antigen-specific T lymphocytes in patientswith metastatic melanoma. J Immunother. 2002;25:243–251.
17. Rosenberg SA, Restifo NP, Yang JC, et al. Adoptive celltransfer: a clinical path to effective cancer immunotherapy. NatRev Cancer. 2008;8:299–308.
18. Hollatz G, Grez M, Mastaglio S, et al. T cells for suicide genetherapy: activation, functionality and clinical relevance.J Immunol Methods. 2008;331:69–81.
19. Klebanoff CA, Gattinoni L, Torabi-Parizi P, et al. Centralmemory self/tumor-reactive CD8+ T cells confer superior
antitumor immunity compared with effector memory T cells.Proc Natl Acad Sci U S A. 2005;102:9571–9576.
20. Comin-Anduix B, Lee Y, Jalil J, et al. Detailed analysis ofimmunologic effects of the cytotoxic T lymphocyte-associatedantigen 4-blocking monoclonal antibody tremelimumab inperipheral blood of patients with melanoma. J Transl Med.2008;6:22.
21. Koya RC, Kasahara N, Favaro PM, et al. Potent maturationof monocyte-derived dendritic cells after CD40L lentiviral genedelivery. J Immunother. 2003;26:451–460.
22. Comin-Anduix B, Gualberto A, Glaspy JA, et al. Definition ofan immunologic response using the major histocompatibilitycomplex tetramer and enzyme-linked immunospot assays. ClinCancer Res. 2006;12:107–116.
23. Perfetto SP, Chattopadhyay PK, Roederer M. Seventeen-colour flow cytometry: unravelling the immune system. NatRev Immunol. 2004;4:648–655.
24. Seder RA, Darrah PA, Roederer M. T-cell quality in memoryand protection: implications for vaccine design. Nat RevImmunol. 2008;8:247–258.
25. Roederer M, Moody MA. Polychromatic plots: graphicaldisplay of multidimensional data. Cytometry A. 2008;73:868–874.
26. Eisen MB, Spellman PT, Brown PO, et al. Cluster analysis anddisplay of genome-wide expression patterns. Proc Natl AcadSci U S A. 1998;95:14863–14868.
27. Saldanha AJ. Java treeview–extensible visualization of micro-array data. Bioinformatics. 2004;20:3246–3248.
28. Fox CJ, Hammerman PS, Thompson CB. Fuel feeds function:energy metabolism and the T-cell response. Nat Rev Immunol.2005;5:844–852.
29. Shields AF, Grierson JR, Dohmen BM, et al. Imagingproliferation in vivo with (F-18)FLT and positron emissiontomography. Nat Med. 1998;4:1334–1336.
30. Radu CG, Shu CJ, Nair-Gill E, et al. Molecular imaging oflymphoid organs and immune activation by positron emissiontomography with a new (18F)-labeled 20-deoxycytidine analog.Nat Med. 2008;14:783–788.
31. Chan AC, Iwashima M, Turck CW, et al. ZAP-70: a 70 kdprotein-tyrosine kinase that associates with the TCR zetachain. Cell. 1992;71:649–662.
32. Deindl S, Kadlecek TA, Brdicka T, et al. Structural basis forthe inhibition of tyrosine kinase activity of ZAP-70. Cell.2007;129:735–746.
33. Savage-Dunn C. Cell size: a matter of life or death? Curr Biol.2008;18:R738–R740.
34. Jorgensen P, Tyers M. How cells coordinate growth anddivision. Curr Biol. 2004;14:R1014–1027.
35. Conlon IJ, Dunn GA, Mudge AW, et al. Extracellular controlof cell size. Nat Cell Biol. 2001;3:918–921.
36. Schwartz JL, Grierson JR, Rasey JS. Rates of accumulationand retention of 30-deoxy-30-fluorothymidine (FLT) in differentcell lines. J Nucl Med. 2001;42:283–290.
37. Nakanishi Y, Lu B, Gerard C, et al. CD8(+) T lymphocytemobilization to virus-infected tissue requires CD4(+) T-cellhelp. Nature. 2009;462:510–513.
38. Riddell SR, Greenberg PD. The use of anti-CD3 and anti-CD28 monoclonal antibodies to clone and expand humanantigen-specific T cells. J Immunol Methods. 1990;128:189–201.
39. Khaled AR, Durum SK. Lymphocide: cytokines and thecontrol of lymphoid homeostasis. Nat Rev Immunol. 2002;2:817–830.
Tumeh et al J Immunother � Volume 33, Number 8, October 2010
768 | www.immunotherapy-journal.com r 2010 Lippincott Williams & Wilkins