the impact of eu consumption on deforestation .... report analysis of impact.pdf · deforestation...
TRANSCRIPT

Technical Report - 2013 - 063
Environment
The impact of EU consumption on deforestation: Comprehensive analysis of the impact of EU
consumption on deforestation
Final report

Europe Direct is a service to help you find answers to your questions about the European Union
New freephone number:00 800 6 7 8 9 10 11
A great deal of additional information on the European Union is available on the Internet.It can be accessed through the Europa server (http://ec.europa.eu).
ISBN 978-92-79-28926-2 doi: 10.2779/822269
© European Union, 2013Reproduction is authorised provided the source is acknowledged.

x
Analysis and report performed by:
Dieter Cuypers Glen Peters Sylvia Prieler Theo Geerken Jonas Karstensen Günther Fisher Leen Gorissen Eva Hizsnyik
Arnoud Lust Harrij Van Velthuizen
The impact of EU consumption on deforestation:Comprehensive analysis of the impact of EUconsumption on deforestation Bultynck Katrien Study funded by the European Commission, DG ENV Contract N° 070307/2010/577031/ETU/E2

The views expressed in this study are those of the authors and do not necessarily reflect the views of the European Commission or of its services. The study should be referred as: European Commission, 2013. The impact of EU consumption on deforestation: Comprehensive analysis of the impact of EU consumption on deforestation. Study funded by the European Commission, DG ENV, and undertaken by VITO, IIASA, HIVA and IUCN NL. Views or opinions expressed inthis report do not necessarily represent those of IIASA or its National Member Organizations

Acknowledgement
ACKNOWLEDGEMENT
We are grateful for the review and comments received during the expert workshop of October 20, 2011 where the methods and preliminary results of this study were tabled. We wish to thank the following experts who attended the workshop and provided us with valuable comments and suggestions for improvements in the understanding of the final report: Frédéric Achard (JRC, EU), John Barrett (Leeds University, UK), Doug Boucher (Union of Concerned Scientists, USA), Bette Harms (Wageningen University, NL), James Hewitt (independent consultant, UK), Kate Horner (FoE, USA), Richard A. Houghton (Woodshole Research Center, USA), Thomas Kastner (Klagenfurt University, AU), Pekka Kauppi (University of Helsinki, FIN), Lian Pin Koh (Swiss Federal University, SWI), Patrick Meyfroidt (University of Louvain, BEL), Declan Mulligan (JRC, EU), Jean-Pierre Ometto (INPE, BRA), Marie-Gabrielle Piketty (CIRAD, FR), Mark W. Roberts (EIA, USA), Van Helden Flip (Dutch Ministry of Economic Affairs, Agriculture and Innnovation, NL), Caspar Verwer (Wageningen University, NL) and Harry Wilting (PBL, NL).

IV
SUMMARY
Comprehensive analysis of the impact of EU consumption of imported food and non-food commodities and manufactured goods on deforestation This is the report of Task 2 of a study that was carried out by VITO, IIASA and CICERO for the European Commission DG Environment under Contract N° 070307/2010/577031/ETU/E2. CHAPTER 2 of this report outlines the general conclusions Between 1990 and 2008, 239 million hectares of forests were cleared worldwide (FAO data). The concept of “embodied deforestation” is used for linking deforestation to consumption. It refers to the deforestation embodied (as an externality) in a produced, traded, or consumed product, good, commodity or service. It is the deforestation associated with the production of a good, commodity or service. When looking at deforestation embodied in total final consumption, the EU27 is consuming 732 kha (2004) or 10% of the global embodied deforestation consumption (7,290 kha per year). Deforestation embodied in EU27 consumption is almost entirely due to imports, as deforestation within the EU is negligible. Over the period 1990-2008, the EU27 imported almost 36% of all deforestation embodied in crop and livestock products traded between regions. It should be noted that worldwide only 33% of deforestation embodied in crops and only 8% of deforestation embodied in lifestock products is traded internationally. Africa and South and Central Amerika are the largest consumers of deforestation (30% of the global share each). Unlike the EU27, this deforestation is associated with commodities and products that are produced locally. The highest share of embodied deforestation was traded through international crop product trade. Consequently, the import of embodied deforestation through the import of crop products was the main cause of the strong link between the EU27 and embodied deforestation. Of the overall deforestation embodied in traded crop products over the period 1990-2008, one third was consumed by the EU economy. The analysis for the trade of embodied deforestation in livestock products consists of two different trade streams: ruminant livestock products raised on pastures in the country of origin and livestock products fed on feed crops with embodied deforestation. The EU27 imported more than one quarter of the global embodied deforestation in ruminant livestock products during the period 1990-2008. This study required the development of an innovative transition model to link land use changes to deforestation data. CHAPTER 3 describes the method and results of this model which is based on FAO data. The output of this model, i.e. the embodied deforestation is then used as an input for two other models. LANDFLOW, a physical units-based trade model is descripbed in CHAPTER 4. TSRTRADE/GTAP-MRIO is a monetary-based model (CHAPTER 6) to simulate how all products derived from the agricultural and forestry commodities are traded throughout the world.

Summary
CHAPTER 4 analyses the global trade flows of agricultural and forestry commodities with embodied deforestation for the period 1990-2008. It equally identifies and quantifies the imports and trade flows of embodied deforestation for the EU27, but also exports to other trading blocks. CHAPTER 5 analyses the global trade flows of embodied deforestation in final consumption with a specific focus on the EU27. The chapter also provides an evolution of embodied deforestation in EU27 final consumption over the period 1990-2008. CHAPTER 6 presents consumption foresights and scenarios up to 2020 or 2030. CHAPTER 7 describes the most relevant developed indicators and compares them with another land-use based indicator, the Ecological Footprint.

VI
RESUME
Analyse complète de l'impact de la consommation européenne de produits alimentaires et non alimentaires importés et de biens de consommation sur la déforestation Ceci est le rapport de la Tâche 2 d'une étude ayant été menée par VITO, IIASA et CICERO pour la DG de l'Environnement de la Commission Européenne dans le cadre du contrat N° 070307/2010/577031/ETU/E2. Le CHAPITRE 2 de ce rapport souligne les conclusions générales. Entre 1990 et 2008, 239 millions d'hectares de forêt ont été décimés dans le monde entier (données du FAO). Le concept de la “déforestation incarnée” est utilisé pour relier la déforestation à la consommation. Il fait référence à la déforestation résultant (comme une externalité) d'un produit, bien ou service fabriqué, commercialisé ou consommé. Il s'agit de la déforestation associée à la production d'un bien, d'un produit ou d'un service. Lorsqu'on examine la déforestation totale finale résultant de la consommation, l'UE des 27 consomme 732 kha (2004), soit 10% de la consommation totale de la déforestation en résultant (7,290 kha par an). La déforestation résultant de la consommation de l'UE des 27 est quasiment entièrement due aux importations, étant donné que la déforestation au sein de l'U.E. est insignifiante. Sur la période 1990-2008, l'UE27 a importé presque 36% du total de la déforestation résultant des produits provenant des récoltes et de l'élevage échangés entre les régions. Il est important de souligner que, dans le monde entier, seuls 33% de la déforestation résultant des produits issus des récoltes et seulement 8% de la déforestation résultant des produits issus de l'élevage sont commercialisés au niveau international. L'Afrique, l'Amérique du Sud et l'Amérique Centrale sont les plus gros consommateurs de déforestation (30% du total mondial chacune). Contrairement à l'U.E. des 27, cette déforestation est associée aux produits ayant été produits au niveau local. La partie la plus importante de la déforestation résultant de la consommation a alimenté le commerce international de produits issus de récoltes. Par conséquent, l'importation de déforestation résultant de l'importation de produits issus des récoltes était la principale cause du lien étroit entre l'U.E. des 27 et la déforestation résultant de la consommation. Du total de la déforestation résultant des produits issus des récoltes commercialisés sur la période 1990-2008, un tiers était consommé par l'économie de l'U.E.. L'analyse du commerce de la déforestation résultant des produits issus de l'élevage comprend deux flux commerciaux différents: produits issus de l'élevage de ruminants élevés dans des pâtures dans le pays d'origine et les produits issus de l'élevage nourris sur des cultures fourragères avec la déforestation en résultant. L'U.E. des 27 a importé plus d'un quart de la déforestation totale résultant des produits issus de l'élevage de ruminants durant la période 1990-2008. Cette étude nécessite de développer un modèle de transition innovant pour relier les changements d'utilisation de la terre aux données relatives à la déforestation. Le CHAPITRE 3 décrit la méthode et les résultats de ce modèle qui est basé sur les informations FAO.

Résumé
L'efficacité de ce modèle, c.-à-d. la déforestation résultant de la consommation, est ensuite utilisée comme une donnée pour deux autres modèles. LANDFLOW, un modèle commercial basé sur des unités physiques est décrit dans le CHAPITRE 4. TSRTRADE/GTAP-MRIO est un modèle basé sur la système monétaire (CHAPITRE 6) pour simuler comment tous les produits dérivés des produits agricoles et forestiers sont commercialisés à travers le monde entier. Le CHAPITRE 4 analyse les flux commerciaux internationaux des produits agricoles et forestiers avec la déforestation en résultant pour la période 1990-2008. De la même façon, cela identifie et quantifie les importations et les flux commerciaux de la déforestation en résultant pour l'U.E. des 27, mais également les exportations vers d'autres blocs commerciaux. Le CHAPITRE 5 analyse les flux commerciaux internationaux de la déforestation résultant de la consommation finale en se concentrant tout particulièrement sur l'U.E. des 27. Ce chapitre montre également l'évolution de la déforestation résultant de la consommation finale de l'U.E. des 27 sur la période 1990-2008. Le CHAPITRE 6 présente les prévisions de consommation et les scénarios possibles jusqu'en 2020 ou 2030. Le CHAPITRE décrit les indicateurs développés les plus pertinents et les compare à un autre indicateur basé sur l'utilisation de la terre, l'Empreinte Écologique.

VIII
RESUMEN
Análisis exhaustivo del impacto en la deforestación del consumo de mercancías alimentarias y no alimentarias y de productos manufacturados importados en la UE Este es el informe de la Tarea 2 de un estudio realizado por VITO, IIASA y CICERO para la DG de Medio Ambiente de la Comisión Europea según contrato nº 070307/2010/577031/ETU/E2. El CAPÍTULO 2 de este informe esboza las conclusiones generales. Entre 1990 y 2008, se talaron 239 millones de hectáreas de bosques en todo el mundo (datos de la FAO). El concepto de “deforestación incorporada” se usa para vincular deforestación y consumo. Se refiere a la deforestación incorporada (como efecto externo) en un producto, mercancía, bien o servicio producido, comercializado o consumido. Es la deforestación asociada con la producción de un bien, mercancía o servicio. Cuando se analiza la deforestación incorporada en el consumo final total, la UE27 está consumiendo 732 kha (2004) o un 10% del consumo de deforestación incorporada global (7.290 kha anuales). La deforestación incorporada en el consumo de la UE27 se debe casi en su totalidad a las importaciones, ya que la deforestación dentro de la UE es insignificante. En el periodo 1990-2008, la UE27 importó casi el 36% de toda la deforestación incorporada en productos de cultivo y ganadería intercambiados entre regiones. Hay que tener en cuenta que, en todo el mundo, sólo se intercambia internacionalmente un 33% de la deforestación incorporada en los cultivos y un 8% en productos de ganadería. África y América del Sur y Central son los máximos consumidores de deforestación (30% de la cuota global cada una). A diferencia de la UE27, esta deforestación se asocia a productos y mercancías de producción local. La cuota más alta de deforestación incorporada se intercambió mediante el comercio internacional de productos cultivados. Por lo tanto, la importación de deforestación incorporada a través de la importación de productos cultivados fue la causa fundamental de la importante vinculación entre la UE27 y la deforestación incorporada. De toda la deforestación incorporada en productos cultivados comercializados en el periodo 1990-2008, un terció se consumió en la economía de la UE. El análisis del intercambio de deforestación incorporada en productos de ganadería consta de dos ramas comerciales diferentes: productos de rumiantes criados en pastos en el país de origen y productos de ganado criado con forraje con deforestación incorporada. La UE27 importó más de una cuarta parte de la deforestación incorporada mundial en productos de rumiantes durante el periodo 1990-2008. Este estudio requería el desarrollo de un modelo de transición innovador para vincular los cambios en el uso de la tierra a los datos de deforestación. El CAPITULO 3 describe el método y los resultados de este modelo que se basa en los datos de la FAO. El resultado de este modelo, es decir, la deforestación incorporada, se usa después como información para otros dos modelos. LANDFLOW, un modelo de intercambio basado en unidades físicas se describe en el CAPÍTULO 4.

Resumen
TSRTRADE/GTAP-MRIO es un modelo basado en unidades monetarias (CAPÍTULO 6) para simular de qué forma se intercambian en el mundo todos los productos derivados de materias primas agrícolas y forestales. El CAPÍTULO 4 analiza el flujo comercial mundial de materias primas agrícolas y forestales con deforestación incorporada durante el periodo 1990-2008. Asimismo identifica y cuantifica los flujos de importaciones y comercialización de deforestación incorporada en la UE27, además de las exportaciones a otros bloques comerciales. El CAPÍTULO 5 analiza los flujos mundiales de comercio de deforestación incorporada en el consumo final, centrándose específicamente en la UE27. Este capítulo recoge además la evolución de la deforestación incorporada en el consumo final de la UE27 durante el periodo 1990-2008. El CAPÍTULO 6 presenta las previsiones y posible evolución del consumo hasta 2020 o 2030. El CAPÍTULO 7 describe los indicadores desarrollados más relevantes y los compara con otro indicador basado en el uso de la tierra: la huella ecológica.

X
RESUMO
Análise exaustiva do impacto do consumo da UE de matérias-primas alimentares e não alimentares e de produtos manufaturados importados na desflorestação Este é o relatório da Missão 2 de um estudo desenvolvido pelo VITO, o IIASA e o CICERO para a DG Ambiente da Comissão Europeia ao abrigo do Contrato N° 070307/2010/577031/ETU/E2. O CAPÍTULO 2 do presente relatório esquematiza as conclusões gerais. Entre 1990 e 2008, 239 milhões de hectares de florestas foram desbravados em todo o mundo (dados da FAO). O conceito de “desflorestação incorporada” é utilizado para relacionar a desflorestação com o consumo. Refere-se à desflorestação incorporada (como externalidade) num produto, bem, matéria-prima ou serviço, produzido, comercializado ou consumido. É a desflorestação associada à produção de um bem, matéria-prima ou serviço. Analisando a desflorestação incorporada no consumo final total, a UE-27 consome 732 mil hectares (2004) ou 10% do consumo global da desflorestação incorporada (7290 mil hectares por ano). A desflorestação incorporada no consumo da UE-27 deve-se quase inteiramente às importações, uma vez que a desflorestação no âmbito da UE é insignificante. No período de 1990-2008, a UE-27 importou quase 36% de toda a desflorestação incorporada em produtos agrícolas e pecuários comercializados entre regiões. De salientar que a nível mundial só 33% da desflorestação incorporada na agricultura e apenas 8% da desflorestação incorporada em produtos pecuários são comercializados internacionalmente. A África e a América Central e do Sul são os maiores consumidores de desflorestação (cada região com 30% da quota global). Ao contrário da UE-27, esta desflorestação está associada a matérias-primas e produtos produzidos localmente. A maior quota de desflorestação incorporada foi comercializada através do mercado internacional de produtos vegetais. Consequentemente, a importação de desflorestação incorporada através da importação de produtos vegetais constituiu a principal razão da forte ligação entre a UE-27 e a desflorestação incorporada. Da desflorestação total incorporada em produtos vegetais comercializados durante o período de 1990-2008, um terço foi consumido pela economia da UE. A análise da comercialização de desflorestação incorporada em produtos pecuários consiste em dois fluxos comerciais diferentes: produtos de gado ruminante criados em pastagens no país de origem e produtos de gado alimentado com culturas forraginosas de desflorestação incorporada. A UE-27 importou mais de um quarto da desflorestação incorporada em produtos de gado ruminante durante o período de 1990-2008. Este estudo exigiu o desenvolvimento de um modelo de transição inovador para relacionar as alterações de uso do solo com os dados da desflorestação. O CAPÍTULO 3 descreve o método e os resultados deste modelo que se baseia em dados da FAO. O resultado deste modelo, ou seja, a desflorestação incorporada, é depois utilizado como dado para outros dois modelos. O LANDFLOW, um modelo comercial baseado em unidades físicas é descrito no CAPÍTULO 4.

Resumo
O TSRTRADE/GTAP-MRIO é um modelo baseado em indicadores monetários (CAPÍTULO 6) para simular a comercialização a nível mundial de todos os produtos derivados de matérias-primas agrícolas e florestais. O CAPÍTULO 4 analisa os fluxos comerciais globais das matérias-primas agrícolas e florestais com a desflorestação incorporada no período de 1990-2008. De igual forma, identifica e quantifica as importações e os fluxos comerciais de desflorestação incorporada para a UE-27, mas também as exportações para outros blocos comerciais. O CAPÍTULO 5 analisa os fluxos comerciais globais de desflorestação incorporada no consumo final com uma incidência específica na UE-27. O capítulo também expõe uma evolução da desflorestação incorporada no consumo final da UE-27 durante o período de 1990-2008. O CAPÍTULO 6 apresenta previsões e cenários de consumo até 2020 ou 2030. O CAPÍTULO 7 descreve os indicadores desenvolvidos mais relevantes e compara-os com outro indicador baseado no uso do solo, a Pegada Ecológica.

Table of Contents
XII
TABLE OF CONTENTS
Acknowledgement _______________________________________________________________ III
Summary _______________________________________________________________________ IV
Résumé ________________________________________________________________________ VI
Resumen ______________________________________________________________________VIII
Resumo ________________________________________________________________________ X
Table of Contents _______________________________________________________________ XII
List of Figures __________________________________________________________________ XVII
List of Tables _________________________________________________________________ XXIII
List of Acronyms _______________________________________________________________ XXV
CHAPTER 1 Introduction _________________________________________________________ 1
1.1. General introduction – Deforestation, deforestation drivers and complexity 1
1.2. The Complexity of the task of linking consumption to deforestation 6
1.3. Terms of Reference and structure of the report 7 1.3.1. Terms of Reference ___________________________________________________ 7 1.3.2. Structure of the report ________________________________________________ 8
CHAPTER 2 General results & conclusions _________________________________________ 17
2.1. Introduction 17
2.2. Summary of the methodology: apparent and final consumption 17
2.3. Worldwide deforestation and deforestation embodied in international trade 18 2.3.1. Worldwide gross deforestation from 1990-2008 ___________________________ 18 2.3.2. Deforestation embodied in agricultural and forestry commodities _____________ 20 2.3.3. Deforestation embodied in international trade ____________________________ 22
2.4. EU27 deforestation impact 23 2.4.1. Relative weight off deforestation impacts associated with EU27 trading compared to impacts associated with other trading countries/blocks _____________________________ 23 2.4.2. Deforestation impacts associated with EU27 consumption of commodities, products, goods and services by sector and by commodity ___________________________________ 27 2.4.3. The origins of the goods and services consumed in the EU27 that are associated with deforestation _______________________________________________________________ 31 2.4.4. EU27 consumption of goods and services associated with deforestation versus processing and export ________________________________________________________ 33 2.4.5. Past trends and possible future foresight scenarios of EU27 consumption associated with deforestation ___________________________________________________________ 34 2.4.6. The overall EU27 impact vs. the theoretical sustainable level of use/consumption 35
CHAPTER 3 Allocation of deforestation to land-use sectors and primary commodities _____ 37

Table of Contents
x XIII
3.1. Introduction 37
3.2. Data sources and methodology 37 3.2.1. Deforestation database _______________________________________________ 38 3.2.2. Forests and deforestation defined_______________________________________ 38 3.2.3. Forest degradation ___________________________________________________ 40 3.2.4. Attribution of deforestation to sectors and commodities ____________________ 41 3.2.5. This study attributes deforestation to sectors and sub-sectors in proportion to the additional land demand of each sector during the reporting period. For a global study, this approach is best suited to address both direct and indirect effects on deforestation caused by the expansion of individual sub-sectors (see Annex A).Uncertainty and system boundaries _ 43
3.3. Results 44 3.3.1. Forest Area Changes _________________________________________________ 44 3.3.2. Attribution of deforestation to main sectors ______________________________ 46 3.3.3. Attribution of deforestation to primary crops ______________________________ 49 Sugarcane expansion and deforestation is strongly concentrated in Brazil where 81% of the global 3.3 Mha deforestation attributed to the expansion of sugarcane production are located. __________________________________________________________________________ 52
CHAPTER 4 Trade analysis of embodied deforestation in agricultural and forestry commodities and the role of the EU27 __________________________________________________________ 62
4.1. Introduction 62
4.2. Overview of data sources and methods for the attribution of embodied land and deforestation to agricultural and forestry commodities 62
4.2.1. General LANDFLOW methodology _______________________________________ 63 4.2.2. Deforestation associated with the consumption of crop, livestock and forestry products 64
4.3. Results 66 4.3.1. Consumption of embodied deforestation in crop and livestock products ________ 66 4.3.2. Consumption of embodied deforestation in crop products trade ______________ 75 4.3.3. Consumption of embodied deforestation in livestock products trade ___________ 94 4.3.4. Landflow scope and system boundaries __________________________________ 97 4.3.5. Consumption of embodied deforestation in wood products __________________ 99 4.3.6. Mining and deforestation ____________________________________________ 103
4.4. Conclusions/Summary 106
CHAPTER 5 Embodied deforestation in final consumption of goods and services in the EU27 – detailed analysis of current consumption and recent trends ____________________________ 109
5.1. Introduction 109
5.2. Definitions, Methodology and Data Required to Interpret the Results 110 5.2.1. Definitions ________________________________________________________ 110 5.2.2. Brief overview of Methodology and Data ________________________________ 111 5.2.3. Specific limitations of the data sources __________________________________ 114 5.2.4. Specific Limitations of the Applied Methodology __________________________ 115
5.3. Trade and consumption in 2004 117 5.3.1. Land use embodied in EU27 consumption and import in 2004 _______________ 117 5.3.2. Deforestation embodied in EU27 final consumption and import in 2004 _______ 123

Table of Contents
XIV
5.4. Historic Trends from 1992 to 2008 146 5.4.1. Comparison of land use over time _____________________________________ 146 5.4.2. Comparison of deforestation over time _________________________________ 150
5.5. Summary of key results 156
5.6. Conclusion and discussion 159
CHAPTER 6 Foresight scenarios of consumption trends within the EU27 in relation to land use and deforestation towards 2030 __________________________________________________ 161
6.1. Introduction 161
6.2. Data and methodology 162 6.2.1. Food consumption data and methodology _______________________________ 162 6.2.2. Biofuel consumption and iluc _________________________________________ 172 6.2.3. Additional demand of wood resources through the consumption of biomass for energy 172
6.3. Results 174 6.3.1. Food consumption foresights and scenarios______________________________ 174 6.3.2. Biofuel consumption predictions in relation to land use and deforestation _____ 178 6.3.3. Solid biomass ______________________________________________________ 179
6.4. Overall conclusion 180
CHAPTER 7 Assessment of the overall impact of EU27 consumption on deforestation ____ 182
7.1. Introduction 182
7.2. Indicator trends for land use and deforestation derived from previous chapters relevant for addressing a sustainable level of use/consumption 183
7.2.1. Evolution of per capita and total land use embodied in EU27 apparent consumption 184 7.2.2. Evolution of per capita deforestation embodied in EU27 apparent consumption 189
7.3. Messages derived from the Ecological Footprint concept on deforestation and afforestation 194
7.3.1. Introduction _______________________________________________________ 194 7.3.2. Properties of the EF : ________________________________________________ 194 7.3.3. Messages of the EF concept regarding deforestation and afforestation ________ 195 7.3.4. EF scores at EU27 level ______________________________________________ 196
7.4. Added value of embodied deforestation indicators developed in this project 197
7.5. Conclusions 199
List of Literature _______________________________________________________________ 200
Annex A: Method for attribution of deforestation to sectors and commodities (for CHAPTER 3) 1
Annex B: Regions used in CHAPTER 3and CHAPTER 4 __________________________________ 10
Annex C1: Overview of data sources and methods for the attribution of embodied land and deforestation to agricultural commodities ___________________________________________ 11
Land in production ___________________________________________________________ 14 Allocation of feed sources to livestock types ______________________________________ 17

Table of Contents
x XV
Fodder crops ________________________________________________________________ 18 Feed energy supply __________________________________________________________ 18 Land associated with the trade and consumption of crop and livestock products _________ 20 Embodied deforestation associated with the consumption of crop and livestock products __ 22 Aggregation of physical production volumes ______________________________________ 23
Annex C2: Overview of data sources and methods for the attribution of embodied land and deforestation to forest products ___________________________________________________ 24
FAOSTAT ___________________________________________________________________ 24 Forest productivity ___________________________________________________________ 27 Land and deforestation associated with roundwood production and derived products _____ 28
Annex D: Crop Commodities included in Supply Utilization Accounts (SUAs) ________________ 30
Annex E: Livestock products included in FAOSTAT trade data base ________________________ 31
Annex F: Additional background information for CHAPTER 4 _____________________________ 32
Land associated with production and utilization of agricultural products ________________ 32
Additional background information for trade of wood products and forest land embodied in supply and utilization of wood products 38
wood volumes and extents of land associated with production and utilization of forest products ___________________________________________________________________ 38
Annex G: Breakdown of ‘other’ category in Figure 4-11 _________________________________ 42
Annex H: Breakdown of ‘other’ category on Figure 4-26 ________________________________ 44
Annex I: methodological concepts of final consumption analysis (CHAPTER 5) ______________ 45
Concepts of final consumption analysis 45
Specifics on MRIOA 50
Annex J: GTAP sector listing and description (MRIOA) for CHAPTER 5______________________ 52
Annex K: GTAP region listing and description (MRIOA – for CHAPTER 5) ___________________ 55
Annex L: extract from the expert workshop with regards to the ambiguity on rubber plantation reporting in FAO statistics _________________________________________________________ 58
Annex M: List of databases/datasets used (provided on CD) _____________________________ 60
Annex N: Task 2 Expert Workshop Report (October 20, 2011) ____________________________ 62
1. Introduction and tour de table 62
2. Presentation on the study by Giuliana Torta (DG ENV) on the political context, objectives, expectations and next steps of the study. 62
3. Presentation on the programme for the day, the combined modelling and general conclusions on the preliminary results by Dieter Cuypers (VITO). 62
4. Presentation on the methodology and preliminary results of the land-use change estimation (deforestation) by Günther Fischer (IIASA). 63

Table of Contents
XVI
5. Presentation on the methodology and preliminary results from LANDFLOW modelling of land-use change (deforestation) by Günther Fischer. 64
6. Presentation on methodology and preliminary results from GTAP I-O modelling of land-use change (deforestation) by Glen peters (CICERO). 65
7. Presentation on running subtask 2.4, EUs impact versus the theoretical sustainable level of use/consumption by Theo Geerken (VITO). 66
8. Policy discussion 67
Workshop discussions and issues ___________________________________________________ 67
1. The reliability of, and concepts and definitions behind FAO statistics 67
2. The attribution of deforestation to the forestry sector and the issue of forest degradation 72 i. The attribution of the remaining residual fraction to the forestry sector ____________ 72 ii. The attribution of deforestation to the forestry sector due to preceding logging _____ 74 iii. Further specificities on degradation, reforestation and afforestation _______________ 74
b. Integration of the results of both modelling results 78
c. Policy-related questions and comments from the workshop 78 Additional comments received by email: _________________________________________ 79
About the preliminary results 80
About input data: 80
About methodology: 81
Annex O: Task 1 Conclusions: Inception Report Summary _______________________________ 83
Methodology for estimating transition pathways for deforestation 84 Deforestation definitions and choice of deforestation data___________________________ 84 Attribution of use/transition probabilities to deforestation __________________________ 88
Methodologies for Estimating Factor Embodiments in International Trade 90 Literature Review ____________________________________________________________ 90 Method and data description of the proposed approaches ___________________________ 98

List of Figures
x XVII
LIST OF FIGURES
Figure 1-1 Overview of the different models and how they are linked to each other ____________ 9 Figure 2-1 Regional forest area changes between 1990 and 2008. _________________________ 19 Figure 2-2 Global Gross deforestation by deforestation driver / sector, including the “unexplained”
category over the period 1990-2008. The smaller pie of the pie-in-pie chart represents the embodied deforestation in agricultural and forestry commodities. _____________________ 20
Figure 2-3 Deforestation embodied in agricultural commodities (crops for food, feed, fuel and fibres, and livestock products from ruminants, pigs and poultry) for the period 1990-2008 _ 21
Figure 2-4 Deforestation embodied in traded crop commodities, by crop groups, for the period 1990-2008, totaling 22.4 Mha __________________________________________________ 22
Figure 2-5 Cumulative deforestation embodied in EU27 crop consumption by crop group, 1990-2008 (note that 0.2 Mha is re-exported in livestock products) _________________________ 24
Figure 2-6 : Import of embodied deforestation in key regions _____________________________ 25 Figure 2-7 Trade balances for deforestation embodied in final consumption for different world
regions. The figure shows deforestation embodied in the different sectors. _____________ 26 Figure 2-8 Consumption of goods and services associated with deforestation allocated by sector for
the EU27 (2004). The pie chart only explicitly shows sectors covering 75% of the total are shown explicitly. The sectors shown represent the goods and services that were consumed in the EU27. __________________________________________________________________ 27
Figure 2-9 Cumulative deforestation embodied in EU27 consumption of crop and livestock products, 1990-2008 _________________________________________________________ 30
Figure 2-10 : Deforestation embodied in EU27 net imports of crop products, by crop, 1990-2008 31 Figure 2-11 Most important crop commodities and countries of origin for deforestation embodied
in crop imports into the EU27 (1990-2008) _______________________________________ 32 Figure 2-12 EU27 imported deforestation by country of origin (2004) ______________________ 33 Figure 2-13 Increased or decreased land use for different EU27 diets in 2020 and 2030 compared to
current land use for EU27 consumption __________________________________________ 34 Figure 3-1 Forest land and non-forest land, deforestation, afforestation and reforestation in the
FAO Land-Use approach (adapted from FAO 2010a to include reforestation). ____________ 40 Figure 3-2 Regional forest area changes between 1990 and 2008. Note: ‘Net deforestation’ data are
derived from FRA 2010. ‘Afforestation’ denotes the change of former non-forest land to forest land use and has been estimated from regional published data of afforestation from the FRA 2010 main report and where available from national data on afforestation and/or natural expansion reported in the FRA 2010 country reports. Gross deforestation is estimated by adding net deforestation and afforestation. Other Europe includes Russia. ______________ 45
Figure 3-3 Global deforestation by main sectors, 1990-2008 ______________________________ 47 Figure 3-4 Regional deforestation by main sectors, cumulative 1990-2008___________________ 48 Figure 3-5 Contribution of specific crops to deforestation associated with the expansion of cropland
between 1990 and 2008, per region _____________________________________________ 49 Figure 3-6 Contribution of specific crops to deforestation associated with expansion of crop
production, per crop 1990-2008 ________________________________________________ 51 Figure 3-7 Brazilian and Indonesian deforestation by main sectors 1990-2008 ________________ 54 Figure 3-8 Crops contribution to deforestation in Brazil, 1990-2008Indonesia ________________ 55 Figure 3-9 Crops contribution to deforestation in Indonesia, 1990-2008 ____________________ 57 Figure 3-10 Deforestation by main sectors in Argentina and Paraguay, 1990-2008 ____________ 58 Figure 3-11 Crops contribution to deforestation in Argentina, 1990-2008 ___________________ 59 Figure 3-12 Crops contribution to deforestation in Paraguay, 1990-2008 ____________________ 59 Figure 3-13 Deforestation by main sectors in Nigeria and Ghana, 1990-2008 _________________ 60 Figure 3-14 Crops contribution to deforestation in Nigeria, 1990-2008 ______________________ 60

List of Figures
XVIII
Figure 3-15 Crops contribution to deforestation in Ghana, 1990-2008 ______________________ 61 Figure 4-1 LANDFLOW methodological scheme for agricultural and forestry commodities ______ 65 Figure 4-2 Cumulative deforestation embodied in supply and utilization of crop and livestock
products, 1990-2008 _________________________________________________________ 67 Figure 4-3 Cumulative embodied deforestation by use category of agricultural products, 1990-2008,
left, a) global for 127.6 Mha; and right, b) for EU27 or 8.7 Mha) _______________________ 68 Figure 4-4 Cumulative deforestation embodied in supply and utilization of crop and livestock
products (a, top: 1990-2000; b, bottom: 2000-2008) ________________________________ 70 Figure 4-5 Net flows of cumulative deforestation embodied in crop and livestock products traded
with the EU27 (kha), 1990-2008 ________________________________________________ 72 Figure 4-6 Cumulative deforestation embodied in EU27 consumption of crop and livestock
products, 1990-2008 _________________________________________________________ 73 Figure 4-7 Distribution of the cumulative deforestation embodied in traded crop commodities, by
crop groups, 1990-2008 _______________________________________________________ 77 Figure 4-8 Shares of embodied deforestation in crops for the period 1990-2008 for the top
countries with deforestation embodied in crop products in decreasing order (relative values). __________________________________________________________________________ 78
Figure 4-9 Shares of embodied deforestation in crops for the period 1990-2008 for the top countries with deforestation embodied in crop products in decreasing order (absolute values). __________________________________________________________________________ 78
Figure 4-10 Cumulative deforestation embodied in EU27 crop consumption by crop group, 1990-2008 ______________________________________________________________________ 79
Figure 4-11 Most important crop commodities and countries of origin for deforestation embodied in crop imports into the EU27 (1990-2008) _______________________________________ 82
Figure 4-12 Global production of major vegetable oils (totalling 134 million tons), by oil crop (a: left) and by country (b: right) for 2008 (source: USDA FAS) ___________________________ 84
Figure 4-13 Global trade of major vegetable oils, exports totalling 53 million tons (a: left), imports totalling 51 million tons (b: right), 2008 (source: USDA FAS) __________________________ 85
Figure 4-14 Vegetable oil industrial and food use in the EU27 in 2004-2005 and 2008-2009 _____ 86 Figure 4-15 Origin of EU27 oilseeds (left) and vegetable oil (right, * Palm kernel oil, peanut oil,
cotton oil, coconut oil) supply in 2007–08 in 1000 metric tons ________________________ 87 Figure 4-16 EU27 vegetable oil use in 2007–08 ________________________________________ 88 Figure 4-17 Worldwide use of most important vegetable oils _____________________________ 88 Figure 4-18 Palm oil imports into the EU27, 1990-2008. _________________________________ 89 Figure 4-19 Soybean imports into the EU27, 1990-2008 _________________________________ 90 Figure 4-20 Soybean cake imports into the EU27, 1990-2008 _____________________________ 91 Figure 4-21 Total imports of soybean related commodities between 1990-2008 per importing
region, specifically for the EU27, China and the Rest of the World. _____________________ 92 Figure 4-22 Evolution of the consumption of vegetable oils in the EU27 between 2004 and 2011 93 Figure 4-23 Evolution of the consumption of specific vegetable oils by the non-food sector (left)
and the food sector(right) in the EU27 ___________________________________________ 93 Figure 4-24 Cumulative deforestation embodied in the regional supply and utilization of wood and
paper products (1990-2008) __________________________________________________ 100 Figure 4-25 Cumulative deforestation embodied in EU27 imports of wood-based products, by main
sub-sectors, (1990-2008) _____________________________________________________ 101 Figure 4-26 Most important countries of origin for embodied deforestation associated with the
imports of EU27 (1990-2008) _________________________________________________ 102 Figure 4-27 Share of mining exports from ‘deforestation countries’ into the EU27 in 2007 _____ 105 Figure 5-1 A schematic of how the global supply chain can lead from consumption of a hamburger
to deforestation in different countries. The supply chain is truncated and only three pathways leading to deforestation are highlighted, though more may exist. In this example, there are

List of Figures
x XIX
various inputs required to produce and consume a hamburger in a restaurant. After various degrees of processing, potentially in different countries, deforestation may occur at several different parts of the supply chain: expanded wheat production may cause deforestation in Ethiopia, expanded fodder production for cattle may cause deforestation in Mexico, or expanded pastures may lead to deforestation in Brazil. _____________________________ 111
Figure 5-2: This chapter uses the land use and deforestation data generated by IIASA as input into a global model of the supply chain (CHAPTER 3). Thus, the final results in this chapter depend on the quality of the input data from CHAPTER 3. ____________________________________ 112
Figure 5-3 Land use allocated to final consumption categories in the EU27 and the top 10 sectors for each land use type (2004) _________________________________________________ 119
Figure 5-4 The trade balance for each land category (colours) with the black dot representing the net trade balance (2004). _____________________________________________________ 121
Figure 5-5 The origin of the imports of embodied land use into key regions showing how import origin varies (2004). The pie charts cover total embodied land use, but only countries covering 75% of the total are shown explicitly with the rest allocated to “Rest of World”. The EU27 imports of 328Mha and an export of 36Mha, giving a net import of 291Mha. ___________ 122
Figure 5-6 The origin of imports into the EU27 for different land use categories (2004). The pie charts cover all of each land use category, but only countries covering 75% of the total are shown explicitly ____________________________________________________________ 123
Figure 5-7 The net balance of trade for the net export of goods and services associated with deforestation. ______________________________________________________________ 129
Figure 5-8 For total embodied deforestation allocated to EU27 final consumption (732 kha for 2004), the figure shows the top 5 sectors consumed in the EU27 (bars) and the top 5 sector and regions producing agricultural and forestry products involving deforestation, required to produce the consumed goods and services. ______________________________________ 132
Figure 5-9 For cropland deforestation allocated to EU27 final consumption (507 kha for 2004), the figure shows the top 5 sectors consumed in the EU27 (bars) and the top 5 sector and regions producing agricultural products on deforested land required to produce the consumed goods and services. _______________________________________________________________ 133
Figure 5-10 For pasture deforestation allocated to EU27 final consumption (199 kha in 2004), the figure shows the top 5 sectors consumed in the EU27 (bars) and the top 5 sector and regions producing agricultural products on deforested land required to produce the consumed goods and services. _______________________________________________________________ 134
Figure 5-11 For logging preceding deforestation allocated to EU27 final consumption (26 kha in 2004), the figure shows the top 5 sectors consumed in the EU27 (bars) and the top 5 sector and regions producing forestry products from deforestation, required to produce the consumed goods and services. ________________________________________________ 135
Figure 5-12 The origin of embodied deforestation imported into the EU27, China, Japan, and the USA and used to meet final consumption in each region (2004). The pie charts cover deforestation for cropland, pastures and due to logging, but only countries covering 75% of the total are shown explicitly. _________________________________________________ 139
Figure 5-13 The origin of embodied deforestation by land use type imported into the EU27 for final consumption in the EU27 (2004). The pie charts show deforestation per deforestation category, but only countries covering 75% of the total are shown explicitly. ____________ 140
Figure 5-14 Consumption of goods and services associated with deforestation allocated by sector for the EU27 (2004). The pie charts cover the different categories of deforestation and the total , but only sectors covering 75% of the total are shown explicitly. The sectors shown represent the goods and services that were consumed in the EU27, through deforestation. For a full list of sector names, see Annex J. __________________________________________ 142

List of Figures
XX
Figure 5-15 Embodied deforestation allocated to EU27 final consumption requires the production of agricultural commodities. In the GTAP-MRIO there is only one commodity for pastures (livestock) and logging (forestry). ______________________________________________ 144
Figure 5-16 The land use from 1992-2008 due to final consumption in the EU27, Rest of the World, and globally. The black line represents domestic land use and the colours consumption of different types of land. Each figure has the same scale. ____________________________ 147
Figure 5-17 The land use in other countries (imports) required to meet final consumption in the EU27, Rest of the World and Globally. __________________________________________ 148
Figure 5-18 Land use as a function of time for 10 regions of the world. The black line is the total land use in each region for cropland, pasture, and forest land. The coloured bars represent consumption of the different land types over time. The rapid changes in 1992 and 1993 in the EU27 and the former Soviet Union is due to the collapse of the former Soviet Union. ____ 149
Figure 5-19 The deforestation from 1992-2008 due to final consumption in the EU27, Rest of the World, and globally. The black line represents domestic deforestation and the drop at 2000 represents the merging of the two time periods 1990-2000 and 2000-2008 (CHAPTER 3). Each figure has the same scale. ____________________________________________________ 150
Figure 5-20 The embodied deforestation in other countries (imports) required to meet final consumption in the EU27, Rest of the World and Globally. __________________________ 151
Figure 5-21 Deforestation as a function of time for 10 regions of the world. The black line is the total embodied deforestation in each region for cropland, pastures, and Logging. The coloured bars represent consumption of the different land types over time. ___________________ 153
Figure 5-22: The imported deforestation into EU27 final consumption allocated to sector from 1992-2008. Only the sectors cumulatively covering more than 2% the total are shown explicitly, with the remaining sectors in “Others”. _________________________________ 155
Figure 5-23: The imported deforestation into EU27 final consumption allocated to region from 1992-2008. ________________________________________________________________ 155
Figure 6-1 EU27 population growth as measured and predicted by the UN. _________________ 163 Figure 6-2 Global per capita food consumption (Source WHO and FAO, 2003) ______________ 164 Figure 6-3 Global per capita food consumption split-up between food from vegetable and animal
sources (Source WHO and FAO, 2003) __________________________________________ 165 Figure 6-4 Meat consumption in the EU25, Source: EEA,2007 (SEE = South East Europe comprising
a.o. Romania and Bulgaria; EECCA = Eastern Europe, Caucasus and Central Asia). ________ 165 Figure 6-5 FAPRI (2010) and OECD-FAO (2011) foresight scenarios for meat consumption of
different meat types (cwe: carcass weight equivalent, rtc: ready-to-cook weight). Apart from the differences in absolute volumes per capita for the different meat types, both data sources show similar trends. _________________________________________________________ 166
Figure 6-6 Evolution of food supply in the EU27 countries from 1961 to 2007 (FAO, 2011) _____ 167 Figure 6-7 Change in diet composition for the average EU27 diet(kcal/day) from 1990-2007 ___ 169 Figure 6-8 Increased or decreased land use for different EU27 diets in 2020 and 2030 compared
with current land use for EU27 consumption. ____________________________________ 175 Figure 6-9 Scheme of EU27 food supply, losses, waste, and intake (estimates of food waste are very
much dependent upon the system boundaries of how they are calculated as well as per sector) ___________________________________________________________________ 177
Figure 6-10 Projected solid biomass demand for electricity and heating for the EU27 in RWE(m³), based on NREAP data and own calculations, including projected demand by the EFSOS (Mantau et al., 2007) and EFI-GTM (UNECE-FAO, 2011) models ______________________ 180
Figure 7-1 Evolution of per capita cropland embodied in EU27 consumption _______________ 185 Figure 7-2 Evolution of per capita cropland use embodied in EU27 consumption ____________ 186 Figure 7-3 Evolution of pasture land use embodied in EU27 consumption per capita _________ 187 Figure 7-4 Evolution of pasture land use embodied in total EU27 consumption _____________ 188 Figure 7-5 The EU Ecological Footprint disaggregated (1961-2006) (source: EEA) ____________ 189

List of Figures
x XXI
Figure 7-6 Evolution of deforestation embodied in EU27 cropland product apparent consumption (left) and pasture land product apparent consumption (right) ________________________ 190
Figure 7-7 Evolution of deforestation embodied in EU27 agricultural products consumption (left) and wood products consumption (right) _________________________________________ 191
Figure 7-8 Deforestation embodied in agricultural products produced in different world regions (1990-2008), see annex A for region names) ______________________________________ 192
Figure 7-9 Deforestation embodied in agricultural products consumed in different world regions (1990-2008), see annex A for region names ______________________________________ 193
Figure 7-10 Evolution of deforestation embodied in EU27 consumption ___________________ 194 Figure 7-11 Characteristic graph for the Ecological Footprint (source: GFN) _________________ 195 Figure 7-12 Ecological Footprint and biocapacity from 1961-2006 (source: EEA) _____________ 196 Figure (Annexes) 1 Land conversion flows included in the attribution of deforestation to broad
sectors .......................................................................................................................................... 7 Figure (Annexes) 2 Elements of Supply Utilization Accounts (in tons) .............................................. 12 Figure (Annexes) 3 Commodity structure of FAOSTAT forest products database ............................. 24 Figure (Annexes) 4 Global use of cropland for major crop groups (2006–08) ................................... 32 Figure (Annexes) 5 Use of cropland in EU27 by major crop groups (2006–08 average) ................... 33 Figure (Annexes) 6 Global use of cropland for animal feed, non-feed use and seed/waste (2006–08
average) ...................................................................................................................................... 34 Figure (Annexes) 7 Regional utilization of cropland (2006–08); a) North America, EU27 and
Oceania; b) South, Southeast and East Asia; c) Sub-Saharan Africa; d) Central and South America ...................................................................................................................................... 35
Figure (Annexes) 8 Regional per capita cropland use associated with the consumption of crop and livestock products (average for 2006–08) ................................................................................. 36
Figure (Annexes) 9 Cropland in regional net supply and utilization of crop and livestock products (1992) ......................................................................................................................................... 37
Figure (Annexes) 10 Cropland in regional net supply and utilization of crop and livestock products (2008) ......................................................................................................................................... 38
Figure (Annexes) 11 Total roundwood (CUM equiv.) in the regional supply and utilization of wood and paper products (1994-1996 annual average) ...................................................................... 39
Figure (Annexes) 12 Total roundwood (CUM equiv.) in the regional supply and utilization of wood and paper products (2006-2008 annual average) ...................................................................... 40
Figure (Annexes) 13 Utilization of wood and paper products (CUM equiv.) in the EU27 (1992-2008) .................................................................................................................................................... 40
Figure (Annexes) 14 Forest land in regional supply and utilization of wood and paper products (2006-2008 annual average) ...................................................................................................... 41
Figure (Annexes) 15 National accounting identities for consumption and production of land use, deforestation, emissions to air, and so on. Production equals Domestic plus Exports and Consumption equals Domestic + Imports. It is also possible to define Consumption as Production minus Exports plus Imports, which is the same as Production minus Net Trade. Thus, international trade is an integral part of consumption-based accounting. ..................... 46
Figure (Annexes) 16: The two figures show different principles to allocate embodied land use and deforestation to sectors. It is possible to start on the production side (left) to determine what agricultural commodities (like soy beans or palm oil) get allocated to final consumption. This reveals the origin, after processing, of final consumption. It is also possible to start on the consumption side (right) to determine what goods and services are consumed (like clothing or processed meat). This reveals the destination, after processing, of agricultural commodities. Both approaches are equally valid, they just provide a different allocation perspective. ........ 47
Figure (Annexes) 17: Different methods have different levels of processing along the supply chain. The analysis in CHAPTER 4 works at the level of “Apparent Consumption” which only partially

List of Figures
XXII
considers processing. The analysis in this Chapter, works at the level of final consumption, which considers processing until goods and services are consumed by households, government, or capital investments as defined in the system of national accounts. ............... 48
Figure (Annexes) 18: The same goods and services can be consumed at multiple points along the supply chain. In this example, oil is used to make a hamburger which is served to a patient in a hospital. From a final consumption perspective, the soy beans would be allocated to government hospital services. However, it is also possible that the oil and the hamburger are consumed by households. .......................................................................................................... 49
Figure (Annexes) 19: With multiple levels of processing, goods and services can be allocated differently in international trade. In the case of soy bean harvested in Brazil that is processed in China for later consumption in the EU27, the allocation can be made from China to the EU27 (Option A) or directly from Brazil to the EU27 (Option B). Option B is used in this chapter to directly link the agricultural commodity with final consumption, however, the underlying database provides all the information to use Option B. ............................................................ 49
Figure (Annexes) 20 Gross and Net deforestation from a Land-Use approach (from FAO, 2010)..... 86 Figure (Annexes) 21 Land-cover dynamics following forest clearing or logging. Land-cover
transitions between agriculture, secondary forest, degraded land, and other land uses. It is critical to know how much land is put to the different uses, and how long it remains in those uses (from Ramankutty et al. 2007) ........................................................................................... 87
Figure (Annexes) 22 Estimation of ‘transition pathways’ of deforested areas for primary agricultural and forestry commodities .......................................................................................................... 89
Figure (Annexes) 23 Stylized example for uni-layer trade methods. Only direct trade of country A with countries B and C can be considered. ................................................................................ 91
Figure (Annexes) 24 Stylized example for multi-layer trade methods. Direct (black arrows) and indirect trade via multiple countries (yellow [A to C via B] and red arrows [A to B via C]) can be considered. ................................................................................................................................. 92
Figure (Annexes) 25 LANDFLOW (shaded inside the box) methodology overview, and how it is linked to the ‘transition pathways’ model ............................................................................... 100
Figure (Annexes) 26 Elements of Supply Utilization Accounts (in tons) .......................................... 103

List of Tables
x XXIII
LIST OF TABLES
Table 1-1 Definitions used for international trade and consumption ________________________ 12 Table 2-1 The allocation of global embodied land use and deforestation to final consumption in
different world regions in 2004 showing the relative magnitude of embodied deforestation to land use, and that the share of consumption is skewed towards the deforestation hotspots. The deforestation included here only includes deforestation for croplands, pastures, and due to preceding logging, i.e. embodied deforestation. _________________________________ 26
Table 2-2 Consumption of goods and services associated with deforestation allocated by aggregated sector for the EU27 (2004). The sectors shown represent the goods and services that were consumed (cons) in the EU27, but were produced by deforestation. ___________ 29
Table 3-1 Global deforestation by main sectors, 1990-2008 ______________________________ 46 Table 3-2 Regional deforestation by main sectors, cumulative 1990-2008 ___________________ 48 Table 3-3 Attribution of deforestation in Brazil 1990-2008 _______________________________ 54 Table 3-4 Attribution of deforestation in Indonesia 1990-2008 ____________________________ 56 Table 4-1 Deforestation embodied in regionally traded agricultural products (in kha), 1990-2008 71 Table 4-2 Embodied deforestation in global production and EU27 trade of main crop groups (Mha)
__________________________________________________________________________ 74 Table 4-3 Cumulative deforestation for cropland embodied in traded crop products (kha), 1990-
2008 ______________________________________________________________________ 76 Table 4-4 Deforestation embodied in the global production and the EU27 imports of oil crops (Mha)
__________________________________________________________________________ 80 Table 4-5 Total exports of soybeans and soybean products (million tons), 1990-2008 __________ 91 Table 4-6 Cumulative deforestation for pastures embodied in traded livestock products (1000 ha),
1990-2008 __________________________________________________________________ 95 Table 4-7 Cumulative deforestation due to feed crop production embodied in traded livestock
products (1000 ha), 1990-2008 _________________________________________________ 96 Table 4-8 Embodied deforestation in global production, trade and ‘Other utilization’ of main crop
groups _____________________________________________________________________ 98 Table 4-9 Share of mining exports from forested countries to the EU27 (2007). ______________ 104 Table 5-1 Various macro-variables in absolute and relative terms for the aggregated regions used to
present the results for 2004. __________________________________________________ 113 Table 5-2 Land use associated with production and consumption in world regions for 2004 showing
which countries are net exporters or importers of land and the balance relative to production. The EU27 imports as much land use (291Mha) as it uses domestically (290Mha). ________ 120
Table 5-3 A separation of deforestation by the land use after deforestation, and the part attributed to preceding logging. Only deforestation that can be clearly linked to cropland, pastures, or logging is allocated to trade flows in this chapter (embodied deforestation is 60% of total deforestation). All numbers are 1000ha per year averaged over the 2000-2008 period. ___ 126
Table 5-4 Comparisons of land use, gross deforestation, and embodied deforestation for agricultural production for 2004. The deforestation for agricultural production is highly concentrated in three regions, while land use is distributed broadly amongst the other regions (Mha = 106 ha, kha = 10³ ha). __________________________________________________ 126
Table 5-5 The allocation of global embodied land use and deforestation to final consumption in different world regions in 2004 showing the relative magnitude of embodied deforestation to land use, and that the share of consumption is skewed towards the deforestation hotspots. The deforestation included here only includes deforestation for croplands, pastures, and due to preceding logging, i.e. embodied deforestation. ________________________________ 127
Table 5-6 The share of global land use and deforestation allocated to EU27 consumption by type of land use. __________________________________________________________________ 128

List of Tables
XXIV
Table 5-7 The share of embodied land use and deforestation allocated globally and to the EU27 by land use type. ______________________________________________________________ 128
Table 5-8 The production and consumption of embodied deforestation in world regions with the balance (difference) showing the degree to which regions import goods and services associated with deforestation. Note, the deforestation numbers reported here include deforestation associated with cropland, pastures and due to preceding logging, i.e. embodied deforestation. _____________________________________________________________ 129
Table 5-9 The top 10 sector and region combinations for final consumption in the EU27 with embodied deforestation allocated to the sector and region where the good and services were produced before being purchased by a final consumer in the EU27 (2004). _____________ 136
Table 5-10 The top 10 sector and region combinations for final consumption in the EU27 showing the sector and region where agricultural and forestry products involving deforestation were produced (2004) ___________________________________________________________ 137
Table 5-11 The embodied deforestation allocated to the final consumption of goods and services for aggregated sectors in the EU27 (2004). The sectors shown represent the goods and services of final consumption in the EU27 and later figures show the region of deforestation. The disaggregated results are in Figure 5-14. _____________________________________ 141
Table 5-12 The import of goods and services into the EU27 associated with deforestation showing the purpose of the import (2004). ______________________________________________ 145
Table 5-13 The destination of total re-exports from the EU27of import of goods and services associated with deforestation (2004). ___________________________________________ 145
Table 6-1 Average EU27 consumption (3,465.61 kcal/day) per day and per year in 2007 (supply data) _____________________________________________________________________ 170
Table 6-2 Daily recommended intake levels for macronutrients __________________________ 171 Table 6-3 Primary energy input calculated from the NREAPs for solid biomass for energy
applications _______________________________________________________________ 173 Table 7-1 Comparison of the Ecological Footprint indicator with the embodied deforestation
indicator developed in this project. The column for EF is based on “Integrating Ecological, Carbon and Water Footprint : Defining the “Footprint Family” and its Application in Tracking Human Pressure on the Planet (OPEN:EU Project)” and has been extended. ___________ 197
Table (Annexes) 1 Definition of items reported in the FAOSTAT forest products database and used
for the calculation of national wood balances and land appropriation of the forest sector. (Commodity numbers in brackets are those used in the FAOSTAT database) .......................... 25
Table (Annexes) 2 Relevant characteristics of approaches for allocating factor embodiments of imported products to consumption activities ............................................................................ 97
Table (Annexes) 3 Model implementations used in this project for the estimation of ‘deforested land embedded in trade’ and ‘land embedded in trade’ in international trade ........................ 98
Table (Annexes) 4 FAOSTAT country time series database .............................................................. 101 Table (Annexes) 5 Aggregate commodity groups in LANDFLOW ..................................................... 105 Table (Annexes) 6 Data Sources used for constructing the TSTRADE model ................................... 106 Table (Annexes) 7 Overview of data used in the construction of the GTAP-MRIO model .............. 108

CHAPTER 1
XXV
LIST OF ACRONYMS
CAP CIFOR CIS COMTRADE CUM DDGS DMC EC EEBT EF Embrapa EMC EU
Common Agricultural Policy of the European Union Center for International Forestry Research Commonwealth of Independent States United Nations Commodity Trade Statistics Database Cubic metres = cum = m³ Distillers Dried Grains with Solubles Domestic Material Consumption European Commission Emissions Embodied in Bilateral Trade Ecological Footprint Brazilian Agricultural Research Corporation Environmentally Weighted Material Consumption European Union
E-GDPA Extended GDP Approach E-PBTA EXIOPOL FAPRI FAO FAOSTAT FAWS FLEGT FRA GAI GFCL GFSM GHG GMRIO GPP GTAP ha HANPP IBAMA INPE iLUC IUFRO JRC kha LC LEAC LU LUC LULUCF MCI MEA Mha
Extended Product level Bilateral Trade Approach A New Environmental Accounting Framework Using Externality Data and Input-Output Tools for Policy Analysis Food and Agriculture Policy Research Institute Food and Agriculture Organisation of the United Nations Statistical database of the FAO Forest Available for Wood Supply Forest Law Enforcement, Governance and Trade Forest Resources Assessment Gross Annual Increment Gross Forest Cover Loss Global Fibre Supply Model Greenhouse Gas Generalized Multi-Region Input-Output Analysis Green Public Procurement Global Trade Analysis Project (www.gtap.agecon.purdue.edu) Hectares (10.000 m²) Human Appropriation of Net Primary Productivity Instituto Brasileiro do Meio Ambiente E Dos Recursos Naturais Renováveis (Brazilian Institute for the Environment and Renewable Natural Resources) Instituto Nacional de Pesquisas Espaciais (Brazilian National Institute for Space Research) Indirect Land-Use Change International Union of Forest Research Organizations Joint Research Center Kilo hectares or1,000 hectares Land Cover Land and Ecosystem Accounts Land Use Land-Use Change Land Use, Land-Use Change and Forestry Multi-Cropping Index Millenium Ecosystem Assessment Mega hectares (1.000.000 ha)

XXVI
MOSUS MPOB MRIO
Modeling Opportunities and Limits for Restructuring Europe towards Sustainability Malaysian Palm Oil Board Multi-Region Input-Output
OECD nec NREAP NPP PBTA REDD+ RSPO RSS
Organisation for Economic Co-operation and Development not elsewhere classified National Renewable Energy Action Plan Net Primary Productivity Product level Bilateral Trade Approach Reduced Emissions from Deforestation and forest Degradation in developing countries plus Roundtable on Sustainable Palm Oil Remote Sensing Survey
SBTA SUA TEEB TBFRA TMC ToR UNCED UNECE
Sector level Bilateral Trade Approach Supply Utilization Accounts The Economics of Ecosystems and Biodiversity Temperate and Boreal Forest Resource Assessment Total Material Consumption Terms of Reference United Nations Conference on Environment and Development United Nations Economic Commission for Europe
UNSD United Nations Statistic Division

CHAPTER 1 Introduction
1
CHAPTER 1 INTRODUCTION
1.1. GENERAL INTRODUCTION – DEFORESTATION, DEFORESTATION DRIVERS AND COMPLEXITY
What is the current state of forest loss on a global level? The key findings of the latest Global Forest Resources Assessment (FRA) of the Food and Agriculture Organisation of the United Nations (FAO) on deforestation are clear:
• The rate of deforestation shows signs of decreasing – but is still alarmingly high. Deforestation – mainly the conversion of tropical forests to agricultural land – shows signs of decreasing in several countries but continues at a high rate in others. Around 13 million hectares of forest were converted to other uses or lost through natural causes each year in the last decade compared to 16 million hectares per year in the 1990s. Both Brazil and Indonesia, which had the highest net loss of forest in the 1990s, have significantly reduced their rate of loss, while in Australia, severe drought and forest fires have exacerbated the loss of forest since 2000.
• Large-scale planting of trees is significantly reducing the net loss of forest area globally.
Afforestation and natural expansion of forests in some countries and regions have reduced the net loss of forest area significantly at the global level. The net change in forest area over the period 2000–2010 is estimated at –5.2 million hectares per year (an area about the size of Costa Rica), down from –8.3 million hectares per year over the period 1990–2000.
• South America and Africa continue to have the largest net loss of forest. Oceania also
reported a net loss of forest, while the area of forest in North and Central America was estimated as almost the same in 2010 as in 2000. The forest area in Europe continued to expand, although at a slower rate than in the 1990s. Asia, which had a net loss in the 1990s, reported a net gain of forest over the period 2000–2010, primarily due to the large-scale afforestation reported by China and despite continued high rates of net loss in many countries in South and Southeast Asia.
• Previous figures underestimated global deforestation rate for the 1990s. FRA 2010, like
FRA 2005, did not directly compile data on deforestation rates, because few countries have this information. In FRA 2005 the global deforestation rate was estimated from net changes in forest area. Additional information on afforestation and on natural expansion of forest for the past 20 years has now made it possible to also take into account deforestation within those countries that have had an overall net gain in forest area. As a result, the revised estimate of the global rate of deforestation and loss from natural causes for 1990–2000 (close to 16 million hectares per year) is higher, but more accurate, than was estimated in FRA 2005 (13 million hectares).(FAO, 2010a)
The FRA 2010 was complemented by a Remote Sensing Survey (RSS) for which the results were published end of 2011. The RSS is based on a systematic sampling design with 13,000 sample sites from the Landsat Global Land Survey with 30 m spatial resolution. The estimates from this RSS are slightly different from the FRA 2010. For the global forest area in 2005 there is a difference of 9%
CHAPTER 1 Introduction
2
between the two methods; the FRA 2010 estimated the area at 4.06 billion ha while the RSS estimated it at 3.96 billion ha. On the other hand, the net forest loss between 1990 and 2005 in the FRA 2010 is substantially higher (32%) than the one estimated through the RSS; 107.4 Mha versus 72.9 Mha. Secondly, the FRA 2010 suggests a decrease in forest area loss over the period 2000-2005, while the RSS detected an increase. The differences are mainly attributable to the differences in both assessments in Africa (FAO and JRC, 2011). From the above it is clear that, despite all international efforts, deforestation is still ongoing at an enormous pace. The International Union of Forest Research Organisations (IUFRO) recently published their report “Embracing Complexity: Meeting the Challenges of International Forest Governance. A Global Assessment Report” in which they advocate again for a global and effective renewed response:
“Given the global nature of the problems associated with forests, an international response is required, but one that is more effective than in the past.”
“The complexity of the issues around forests gives rise to what are known as ‘wicked’ problems – problems that defy efforts to break them down into simpler, easier-to-solve components. A succession of approaches to deal with the wicked problems of forests has captured the attention of policymakers and a range of international institutions have been created. None has been able to deal effectively with the complexity of the issues involved. Competing interests and divergence over key ideas have stalled international negotiations on global forest governance for years. Efforts to bypass the stalemate by moving forest concerns into biodiversity or climate change fora and to create parallel civil society-led processes have created a correspondingly complex set of institutions. These complex arrangements are difficult to navigate and prone to produce further conflict and suboptimal outcomes.” (Rayner et al., 2010)
What is being lost, besides trees? With forests being cleared, their associated ecosystem services disappear too. Many ecosystem services, as outlined in the Millennium Ecosystem Assessment (MEA, 2005) are attributed to forests: the supporting, provisioning, regulating, and cultural services of ecosystems contribute to the constituents of human well-being on a local, regional and global level. Some extracts from the MEA chapter 21 on Forests and Woodlands clearly illustrate this:
• Forest ecosystems are extremely important refuges for terrestrial biodiversity, a central component of Earth’s biogeochemical systems, and a source of ecosystem services essential for human well-being.
• Forests, particularly those in the tropics, provide habitat for half or more of the world’s known terrestrial plant and animal species. This biodiversity is essential for the continued health and functioning of forest ecosystems, and it underlies the many ecosystem services that forests provide.
• Forests and woodlands play a significant role in the global carbon cycle and, consequently, in accelerating or decelerating global climate change.
• More than three quarters of the world’s accessible freshwater comes from forested catchments.
• The provisioning services obtained from forests have substantial economic value. Forests annually provide over 3.3 billion cubic meters of wood (including 1.8 billion cubic meters of

CHAPTER 1 Introduction
3
fuelwood and charcoal), as well as numerous non-wood forest products that play a significant role in the economic life of hundreds of millions of people. The combined economic value of ‘‘nonmarket’’ (social and ecological) forest services may exceed the recorded market value of timber, but these values are rarely taken into account in forest management decisions.
• The rural poor are particularly dependent on forest resources. As many as 300 million people, most of them very poor, depend substantially on forest ecosystems for their subsistence and survival. The 60 million indigenous people who live in forest areas are especially dependent on forest resources and the health of forest ecosystems.
• Forests play important cultural, spiritual, and recreational roles in many societies.”(MEA, 2005)
What are the main current responses of the international Community? As outlined above, in the cited paragraphs from the IUFRO report, International Community has up to now not been very effective in addressing this global problem. In 1992 at the United Nations Conference on Environment and Development (UNCED) in Rio de Janeiro, the International Community failed to come to a convention on forests. Instead, a few years later the Intergovernmental Panel on Forests came to light, followed by the Intergovernmental Forum on Forests, which again was watered down to the United Nations Forum on Forests (UNFF) which, according to Dimitrov et al. (2007: 243), “[is] explicitly deprived of a policymaking mandate”. In addition, other initiatives have emerged: “Efforts to bypass the stalemate by moving forest concerns into biodiversity or climate change fora and to create parallel civil society-led processes have created a correspondingly complex set of institutions.” (Rayner et al., 2011). The IUFRO report distinguishes:
a) Non-legally binding declarations, principles, statements, decisions, resolutions and other instruments reflecting political commitments focused on forests, including the NLBI, other decisions of the UNFF, IPF/IFF proposals for action, the Forest Principles and Chapter 11 of Agenda 21; b) Legally binding conventions, agreements and other instruments with significant forest-related provisions, including the CBD, UNFCCC, UNCCD, CITES, Ramsar, as well as legally binding agreements and other instruments with the potential to influence forests indirectly, such as LRTAP; c) Treaty-based organisations and institutions with significant forest-related mandates and programs or with the potential to affect forests, including CIFOR, FAO, ICRAF, ITTO, World Bank, GEF, NFP Facility and WTO; d) Other relevant organisations, institutions, networks and processes, including GBIF, IUCN, IUFRO, UNEP and UNDP; e) Performance-based international initiatives of NGOs and other Major Groups, including international certification schemes, such as FSC, Smartwood, and PEFC and industry codes of conduct, such as the work of WBCSD; f) Regional organisations, institutions, instruments, processes, initiatives and networks, including ACTO, African Forest Forum, AFP, ASEAN, ATO, SADC, CBFP, Forest Europe, EFI, regional C&I initiatives, regional FLEG processes, FLEGT and regional certification programmes such as SFI; g) New ‘entanglements’ – clubs of states, learning platforms and collaborations, including REDD+ partnerships, round tables, IBPES.

CHAPTER 1 Introduction
4
A particular interesting development in this regard is the process on what is now called REDD+ in the framework of the United Nations Framework Convention on Climate Change (UNFCCC): Deforestation and degradation of forests in developing countries contribute to approximately 12 to 17% of the global annual greenhouse gas emissions (IPCC, 2007; van der Werf et al., 2009). Since 2005 avoiding deforestation is back on the UNFCCC agenda. The mechanism now known as “Reduced Emissions from Deforestation and forest Degradation in developing countries Plus (REDD+)”, which would reward developing countries for not deforesting and/or degrading their forests, but instead reward them for managing them sustainably, conserving and/or enhancing their carbon stocks, could well be the global response in which all issues regarding these forests will meet. The latest progress on REDD+ was made during CoP 16 and 17 of the UNFCCC. The Cancun Agreements (CoP 16), under ‘Policy approaches and positive incentives on issues relating to reducing emissions from deforestation and forest degradation in developing countries; and the role of conservation, sustainable management of forests and enhancement of forest carbon stocks in developing countries’, in article 68 (UNFCCC, 2011) read: “The Conference of the Parties [...] Encourages all Parties to find effective ways to reduce the human pressure on forests that results in greenhouse gas emissions, including actions to address drivers of deforestation” Which can conclude this ‘setting-the scene’ and brings us back to the main basic question: what drives deforestation and what’s the impact of our consumption? What drives deforestation? Or as Helmut Geist and Eric Lambin (2001) put it in their trail-blazing and ubiquitously cited Land-Use and Land-Cover Change Report: “What drives tropical deforestation?” The authors conducted a meta-analysis of proximate and underlying causes of deforestation based on subnational case study evidence. From 152 subnational deforestation case studies in the tropics between 1880 and 1996 (average 1960 to 1984) they did a frequency analysis of the occurrence of these driving forces. They identified three main aggregate proximate causes1 (agricultural expansion, wood extraction, expansion of infrastructure) and five broad categories of underlying driving forces2 (demographic, economic, technological, policy/institutional, and cultural or socio-political factors). While the first proximate cause, agricultural expansion or the expansion of cropped land and pasture clearly involves forest removal, the latter two proximate causes have been qualified, to a certain extent, in the report. On the inclusion of expansion of transport infrastructure as a proximate cause, the authors state the following: “It might be argued that the expansion of transport infrastructure, especially road 1 Proximate causes are human activities (land uses) that directly affect the environment and thus constitute proximate sources of change. They connect the changes in land cover and land use. Proximate causes change land cover, with further environmental consequences that may ultimately feedback to affect land use (Geist & Lambin, 2001: 5) 2 Underlying driving forces (or social processes) are seen to be fundamental forces that underpin the more obvious or proximate causes of tropical deforestation.

CHAPTER 1 Introduction
5
construction, is not a land use and, thus, a proximate cause of deforestation (due to its limited direct impact upon forest cover). However, given the many direct and indirect impacts reported in the cases, we felt that infrastructure expansion, mainly road extension, deserves to be coded as a proximate cause” (Geist & Lambin, 2001:8). Equally they raise the issue of the variety of meanings of deforestation in global change studies which has its influence on the third proximate cause, wood extraction. Geist and Lambin adopt “a broad and inclusive definition “in the sense that it highlights not only forest conversion (…) but also different types of degradation (…). [They] are aware that this choice of deforestation criteria has repercussions on the subsequent analysis of its causes. For example, selective harvesting of wood thus became coded as a proximate cause of deforestation” (Geist & Lambin, 2001:17). Results and Conclusions of the Land-Use and Land-Cover Change Report One of the main conclusions of this report is that causes and drivers of tropical deforestation cannot be reduced to a single variable or even to a few variables. Mainly 3- and 4-factor terms of underlying causation are related to 2- and 3-factor terms of proximate causation. For the proximate causes the most frequently found combinations are the agriculture-wood-road connexus, the agriculture-wood connexus, and population-driven agricultural expansion. Underlying driver tandems were identified to be most important. These are mainly economy-, policy and institution- and culture-driven tandems. It can be clear that deforestation is a complex problem, and it becomes even more so in a globalised world. What drives deforestation in a globalised world? The case-studies on which the analysis above is based mainly date from the 1960s to halfway the 1980s. In the meanwhile a globalised world is a fact. Globalization started after World War II but has accelerated considerably since the mid-1980s (Soubbotina and Sheram, 2000). Eric Lambin and colleagues (2001) identified globalisation as a cross-cutting theme: “Global forces become the main determinants of land-use change, as they amplify or attenuate local factors. [...]Opportunities and constraints for new land uses are created by markets and policies, increasingly influenced by global factors.” So, although the analysis still stands, the agents of the drivers are changing with growing international trade and policies. Rudels analysis of deforestation from 1970 to 2000 (Rudel, 2007) suggests that neo-liberal regimes reshaped the drivers behind tropical deforestation. Deforestation became more enterprise-driven in the 1990s. Recently many more research was done on this topic (Gibbs et al., 2010; DeFries et al., 2010; Lambin & Meyfroidt, 2011), all pointing in the same direction. The Union of Concerned Scientists released recently the report ‘The root of the Problem. What drives tropical deforestation today?’ (Boucher et al., 2011). This report summarizes the most recent research and could be considered as a follow-up of the 2001 study, and points towards the growing distance between production and consumption locations because of growing urban populations. To paraphrase Butler and Laurance (2008): “[...] tropical deforestation now is substantially driven by major industries and economic globalization, with timber operations, oil and gas development, large-scale farming and exotic-tree plantations being the most frequent causes of forest loss.” These industries provide us with biomass for food, feed, fibre, fertiliser, and since the last decade feedstock for biofuels (fuel), and even finance (speculation on food markets and even land speculation, more recently), but also a lot of other ecosystem services (forest).

CHAPTER 1 Introduction
6
The outsourcing of land or land use beyond local, regional, national or territorial borders has always existed and is intrinsically linked to the existence of exchange of products, barter and trade, or -even in a unilateral way- colonization, territorial expansion (either violently or peacefully), resulting in the present global world order and prosperity (im)balances (Diamond, 1997). In economic theory the outsourcing of land has even been crystallised in the so-called comparative advantage theory3 when applied to land as a production factor. Following the most recent food crisis (but also the growing demand for biofuels) this outsourcing has even adopted quite questionable practices called ‘land grabbing’ (Von Braun and Meinzen-Dick, 2009; Cotula et al., 2009). Land grabbing is the contentious issue of large-scale land acquisitions; the buying or leasing of large pieces of land in developing countries, by domestic and transnational companies, governments, and individuals. The exact definition, however, is a bit unclear as illustrated by the different estimated figures on the phenomenon. The most recent estimates of this phenomenon were calculated by the International Land Coalition (ILC) and the Centre for Development and Environment (CDE).
1.2. THE COMPLEXITY OF THE TASK OF LINKING CONSUMPTION TO DEFORESTATION
As a first response to this global problem, the European Commission, in its October 2008 Communication "Addressing the challenges of deforestation and forest degradation to tackle climate change and biodiversity loss"4, committed itself to further explore the links between deforestation and EU consumption patterns. The COM indicates, among other actions, the following: "More generally on policy coherence, the Commission is committed to […]: studying the impact of EU consumption of imported food and non-food commodities (e.g. meat, soy beans, palm oil, metal ores) that are likely to contribute to deforestation. This could lead to considering policy options to reduce this impact". Responding to the Communication, the Environment Council, the European Parliament and the Economic and Social Committee all expressed strong support for such a study. This report is the ‘Comprehensive analysis of the impact of EU consumption of imported food and non-food commodities and manufactured goods on deforestation’. This report and its results will serve as a basis for further work in Task 3 & 4, which respectively will deal with ‘The identification of critical areas where Community policies and legislation could be reviewed’ and ‘The Proposition of specific Community policy and legislative measures and other measures’ in order to reduce the impact of EU consumption on deforestation and “help the prospects for sustainable development at a global level”5. As set out above, this is a complex task, no one-to-one relationships exist between drivers of deforestation and deforestation, and neither do these kind of relationships exist between deforestation and the consumption of food and non-food commodities and manufactured goods, the demand side of the so-called economic underlying driving forces of deforestation. It becomes
3 the law of comparative advantage (1815) says that two countries (or other kinds of parties, such as individuals or firms) can both gain from trade if, in the absence of trade, they have different relative costs for producing the same goods. Even if one country is more efficient in the production of all goods (absolute advantage), it can still gain by trading with a less-efficient country, as long as they have different relative efficiencies. 4 COM (2008) 645 5 Ibid. 4

CHAPTER 1 Introduction
7
even more complex when we take into account land-cover or land-use transition dynamics on the same parcel of land.
1.3. TERMS OF REFERENCE AND STRUCTURE OF THE REPORT
1.3.1. TERMS OF REFERENCE
The report responds to the following Terms of Reference (ToR):
→ TASK 1: Identification of relevant information and work methodology development
To identify relevant existing documents, studies and data sources and develop a work methodology Building on an analysis of relevant existing documents, and studies , and suitable data sources (e.g. Comtrade, UNEP, FAO, EEA), the Contractor will compile existing information and elaborate a methodology for the implementation of tasks 2, 3 and 4.
→ TASK 2: Comprehensive analysis of the impact of EU Consumption of imported food and non-food commodities and manufactured goods on deforestation
To carry out a comprehensive analysis of the impact of EU consumption of imported food and non-food commodities and manufactured goods on deforestation. 2.1) Identify and quantify the imports and trade flows of food and non-food commodities and manufactured products into the Community market that are closely associated with deforestation in the country of origin, for example through direct land use change or displacement of other land uses. Imports should be specified per exporting countries/region and in an aggregated fashion (i.e. the total imports entering the Community market per commodity or type of product). The study will also analyse trade flows of raw material, intermediate products or manufactured goods re-exported from the EU to third countries. The Contractor will specify the most appropriate reference period for the analysis of past trends (e.g. the last 5 or 10 years or else) as part of its work methodology and develop future scenarios until 2020 and 2030. The study will build on - and integrate - the information already available in existing documents and studies, including, for instance, the report published by the European Commission in 2008: "Environmental impacts of significant natural resources trade flows into the EU" (http://ec.europa.eu/environment/natres/studies.htm). Imports to the Community market should be compared to imports into other major trading countries/blocks, whenever data are available; 2.2) Estimate, for each identified commodity, intermediate product or category of manufactured goods imported into the Community, the direct (e.g. conversion of forest into agricultural land) and/or indirect impacts (e.g. pollution from mining activities leading to forest degradation and later forest conversion) on deforestation in the countries/region(s) of origin. Cumulative impacts should also be considered. In addition, an estimation should be provided per commodity/category of manufactured goods of the relative weight of impacts caused by Community trading compared to impacts caused by other trading countries/blocks, whenever data are available. The most recent data and statistics on deforestation rate, trends and national/regional forest cover will be used for the purpose of the study. Data sources should be specified by the Contractor in the proposed methodology (task 1);

CHAPTER 1 Introduction
8
2.3) Analyse the current consumption of the selected commodities, intermediate products and/or manufactured goods (i.e. how the imports are used, the level of resource efficiency, the analysis of life cycle and re-use, etc.), in line with the EU Thematic Strategy for the Sustainable Use of Natural Resources and the recent SCP/SIP Action Plan. A foresight scenario of consumption trends within the EU should also be elaborated; 2.4) Quantifying the overall EU impact vs. the theoretical sustainable level of use/consumption. This should be done using assessment tools such as material flows (DMC/TMC equivalents), land use, water, GHG, ecological footprint, HANPP {Human Appropriation of Net Primary Production} or other suitable assessment methods to be proposed in the tender. The draft final report will be presented and discussed in a workshop with experts of the relevant disciplines. The Workshop should be organised in Brussels, outside EC premises, and should target the participation of some 20 technical experts from EU and/or non EU countries, as mostly appropriate on the basis of the results of Task 1 and 2. The final report describing the outcomes of task 2 should integrate the discussions and the recommendations expressed during the workshop.
1.3.2. STRUCTURE OF THE REPORT
In the following we outline the structure of the report and link it to the ToR. CHAPTER 2 of this report outlines the general conclusions and answers the ToR questions in a summarized way. It builds upon the results of all other chapters. Those chapters explain in more detail how the results were obtained and explain the limitations and assumptions which underlie the used models. An extensive explanation on the developed methodology and data sources used can be found in the inception report (Cuypers et al., 2011) which is the deliverable for task 1, and the annexes to this report. The way the different models linked to each other is shown in the next page. The methods and preliminary results of chapters 3 to 5 were discussed during an expert meeting and the received comments were integrated into the respective chapters. First of all, to be able to identify the commodities that are closely associated with deforestation in the country of origin, a transition model was constructed. This identification is essential for all the analyses that follow because it determines which commodities and all of the intermediary and final products and product categories will require focus. The model attributes ‘embodied deforestation’ to the commodities associated with deforestation in the country of origin. This embodied deforestation can be compared with other externalities like greenhouse gases and virtual water. It tells how much deforestation is associated with a commodity and derived products, but also products composed of different commodities, product categories, sectors or even trade streams.

CHAPTER 1 Introduction
9
Figure 1-1 Overview of the different models and how they are linked to each other
TRANSITION PATHWAYS
FAO FRA 2010 Deforestation data
(1990-2010)
Deforestation-transition Literature
Deforestation and subsequent land-use classes: Forest, Grass (pasture), Crop (cultivated), Other
FAOSTAT land resources in time series
(1990-2008)
DEFORESTED LAND IN COMMODITIES from these land-use classes (agricultural and forest commodities)
LANDFLOW
LAND IN COMMODITIES from these land-use classes (agricultural and forest commodities)
FAOSTAT land-use data (1990-2008)
Commodities linked to land-use classes
FAOSTAT primary production data
(1990-2008)
GTAP data(1992-2008)
TSTRADE and GTAP MRIO
INTERNATIONAL TRADE MATRICES
including ‘deforestation-prone’ fossil fuels and
ores(monetary) AGRICULTURE AND
FORESTRY TRADE MATRICES(physical)
FAOSTAT Supply Utilisation Accounts
(SUA)(1990-2008)
FAOSTAT Wood Balances (WB)
(1992-2008)
FAOSTAT Trade Data
(1990-2008)
National WBs
National SUAs
OVERALL IMPACT
ASSESSMENT
Literature on land-use related
sustainability indicators
Assessment of generated indicators vs existing
Add-on indicator
Land-use and deforested land-use indicators
Apparent consumption of agriculture and forest commodities
Final Sector Consumption of products
Consumption scenarios

CHAPTER 1 Introduction
10
CHAPTER 3 describes the method and results of this model which is based on FAO data, mainly the FRA 2010 (FAO, 2010a) and FAOSTAT land use data. First the model attributes embodied deforestation to the agricultural and forestry sector and their different primary commodities (e.g. meat, wood, soy, oil palm). The results for different world regions are given and a special section is dedicated to countries for which the trade analysis has shown that they require particular focus (Brazil, Indonesia, Argentina, Paraguay, Ghana and Nigeria). The output of this model, i.e. the embodied deforestation is then used as an input for two other models which together can answer the ToR subtasks 2.1 to 2.3 and generate the necessary indicators used in subtask 2.4. The models use, however, a different approach and complement each other to give an answer to the ToR questions. LANDFLOW, a physical units-based trade model based on the concept of apparent consumption, which means it can track the trade of agricultural (CHAPTER 4) and forestry commodities and their embodied deforestation between countries. Once these commodities become highly processed products and are not considered agricultural or forestry commodities anymore, they cannot be tracked anymore either. Embodied deforestation of these products is attributed to the country where the tracking stops. TSRTRADE/GTAP-MRIO is a monetary-based model (CHAPTER 6) to simulate how all products derived from the agricultural and forestry commodities are traded throughout the world. This model can use the concept of final consumption as monetary trade streams do not have the above-mentioned system boundaries. It traces the embodied deforestation up to the final consumer in a country or region, but it loses track of of the physical commodity or product. There are no existing models which can do both. Therefore this two-track modelling is needed to answer the questions in the Terms of Reference to this study. CHAPTER 4 analyses the global trade flows of agricultural and forestry commodities with embodied deforestation for the period 1990-2008. It equally identifies and quantifies the imports and trade flows of embodied deforestation for the EU27, but also exports to other trading blocks. The chapter concludes with a section on the link between mining products and deforestation. CHAPTER 5 analyses the global trade flows of embodied deforestation in final consumption with a specific focus on the EU27. The analysis treats the current final consumption of embodied deforestation of all commodities, intermediate products and/or manufactured goods within the different consumption sectors of the EU27. The most recent analysis possible with this detail is an analysis for the year 2004, though developments which could affect the results of the relative importance of sectors within the EU27 are discussed. The chapter also provides an evolution of embodied deforestation in EU27 final consumption over the period 1990-2008. CHAPTER 6 treats consumption foresights and scenarios up to 2020 or 2030. The preceding analysis points out that food consumption, and in particular meat consumption which is related to the import of oilcakes embodies most of deforestation in final consumption. Scenarios based on low, average and high consumption of these food items within the EU27 are treated and foresights for different diets are compared. Although not treated in the scenarios, the issue of food waste is briefly discussed. Additionally, the chapter treats biofuel and solid biomass (wood) foresights based on the National Renewable Energy Action Plans (NREAPs) as they could increase the need for productive land. Both scenarios and/or foresights are finally expressed in foresights for land use needed either directly or through indirect land-use change (iLUC) which ultimately could lead to deforestation. CHAPTER 7 treats the most relevant developed indicators and compares them with another land-use based indicator, the Ecological Footprint. It evaluates the sustainability in the light of the upcoming policy tasks.

CHAPTER 1 Introduction
11
→ Time period under analysis
Throughout this report different time periods will be used to answer the ToR questions. The time periods and specific years are mainly determined by the data sources used. In general FAO data are available for the period 1990-2010, but there are some limitations. For the analysis in CHAPTER 3, 4 and 5 the time period 1990-2008 is used as complete FAOSTAT data on land use and commodities are only available up to 2008, as for now. When the land use data are used in I-O (CHAPTER 5) another limitation is the low data quality of international trade streams due to the collapse of the Former Soviet Union, which reduces the analysis to the time-period 1992-2008 for some specific analyses. In the same chapter a so-called deep dive analysis is possible for the year 2004 as this year is the most complete year available for such an analysis. Area Type Year Source Chapter National account data
Input-output tables
1997 GTAP5 Database (Mastoris et al. 2002) 5
2001 GTAP6 Database (Dimaranan 2006) 5 2004 GTAP7 Database (Narayanan and
Walmsley 2008) 5
GDP statistics 1990-2009
UNSD National Accounts Main Aggregates Database http://unstats.un.org/unsd/snaama/Introduction.asp
5
Environmental data
Land-Use, agricultural and forestry production
1990-2007
FAOSTAT land use domain 3 and 4
Deforestation 1990-2010
FAO FRA 2010 (but up to 2008) 3
Trade statistics Bilateral trade
data for final consumption
1992-2006
GTAP7 (Narayanan and Walmsley 2008) (derived from COMTRADE)
5
Bilateral agricultural trade data for apparent consumption
1990-2008
FAOSTAT 4
Food supply data 1961-2007
FAOSTAT SUA, FBs 6
Food consumption foresights
2010-2015
OECD-FAO (2011) and FAPRI (2010) 6
EU27 biofuel consumption foresight
NREAP data from Beurskens and Hekkenberg (2011)
6

CHAPTER 1 Introduction
12
→ Definitions and methodological concepts
Finally we conclude this introductory chapter with some definitions to avoid confusion. As different approaches and models, with their own terminology and concepts, are used, the terms below need to be well understood Table 1-1.
Table 1-1 Definitions used for international trade and consumption
Term Meaning Example Comment Products Products are goods and services that
result from a process of production. See goods or services
Goods Goods are physical, produced objects for which a demand exists, over which ownership rights can be established and whose ownership can be transferred from one institutional unit to another by engaging in transactions on markets.
Cars, toys, paper, office supplies, furniture
Services Services are the result of a production activity that changes the conditions of the consuming units, or facilitates the exchange of products or financial assets.
Banking services, food delivery
In general the categories physical goods and intangible services are not such discrete categories. In reality, for example, catering services provide both physical food items and intangible services. The term service is used in CHAPTER 6 as it is typical for the analysis done by GTAP. It refers to the sectors treated in that analysis. The trade sector, for example is a typical service sector. Processing of food can be considered a service, but it is part of the food sector. The food sector, as such, is not treated as a service sector, but is clearly distinguished in GTAP.
Commodity (agricultural/forestry)
Resources or basic agricultural and forestry products. These traded goods usually have not yet undergone much of processing
Soybeans, roundwood
Intermediate consumption
Intermediate consumption consists of goods and services used up in the course of production.
Aluminium used in the production of a car or electricity used in the production of a home computer.
Distinction from final consumption and equivalent to intermediate demand.
Final consumption Final consumption consists of goods Food products purchased by Distinct from intermediate consumption and equivalent to final demand.

CHAPTER 1 Introduction
13
Term Meaning Example Comment and services used by individual households or the community to satisfy their Individual or collective needs or wants. It also includes capital investments.
households in a super market or gas purchased for heating the home.
Final consumption analysis is used in GTAP modelling (see CHAPTER 5)
Apparent consumption =Utilization =Use
Domestic disappearance/utilization defined as production plus imports minus exports, adjusted for changes in inventories.
Soybeans utilized for different purposes in Germany, i.e., utilization as seed, feed, food, waste, processing (e.g., crushing for oil and soybean cake), to stocks, and industrial/ other use.
The concept distinguishes between intermediate consumption (seed, feed, processing) and final utilization (waste, food, industrial use) subject to data system boundaries. As highly processed products (e.g., cotton shirts, ethanol, furniture) are not tracked by the underlying FAO data system and recorded as industrial or other use, final consumption will differ from apparent consumption by the amount of traded highly processed products not recorded by this data system. Apparent consumption analysis is used in LANDFLOW modelling (see CHAPTER 4) Apparent consumption is subject to system boundaries and cannot track highly processed products which might be exported again.
Externality A cost or benefit not transmitted through prices.
Greenhouse gas emissions, pollution, deforestation, biodiversity loss, etc. which are usually not reflected or ‘internalised’ in the price that is paid for a product.
For deforestation this is clearly a cost and not a benefit.
Forest Land spanning more than 0.5 hectares with trees higher than 5 m and a canopy cover of more than 10% (land-cover criteria), or trees able to reach these thresholds in situ. It does not include land that is predominantly under agricultural or urban land use (land-use criteria).
This study applies the land use concept and definition of forest as used by the FAO Forest Resource Assessments and FAO land use statistics. The first three criteria are land-cover criteria, the last two are land-use criteria. The last land-use criterion excludes areas with tree cover, which meets the minimal land cover criteria, but where land use is classified as agricultural or urban use (e.g. urban parks, agro-forestry). The second last criterion includes temporarily unstocked forest areas (e.g. after a clear cut as part of a forest management cycle) as well as forest areas, which do not currently meet the minimal land-cover criteria but are able to reach the thresholds in situ.
Deforestation The clearing of forests by people and the land converted to another use, such as agriculture or infrastructure.
Also natural disasters may destroy forests, and when the area is incapable of regenerating naturally and no efforts are made to replant, it too converts to other land uses. (see section 3.2.2).
Afforestation Afforestation is the act of establishing forests through planting and/or deliberate seeding on land
Afforestation of agricultural land or the establishment of plantation forests on
Afforestation implies an increase in forest area through the conversion of land, which was not classified as forest land before. In contrast reforestation (cf. below) does not have an impact on the extent of the total area of forest. (See section 3.2.1)

CHAPTER 1 Introduction
14
Term Meaning Example Comment that until then was not classified as forest.
degraded areas, which were classified as ‘other land’ use.
Reforestation Reforestation refers to the re-establishment of forest through planting and/or deliberate seeding on land classified as forest,
Reforestation on forest land after a fire, storm or following clearfelling.
Reforestation is the re-establishment of forest formations after a temporary condition with less than 10% canopy cover due to human-induced or natural perturbations. Reforestation thus happens on forest land remaining forest land. (See section 3.2.1)
Net deforestation Net changes in forest area between two time points in a particular geographic region (usually a country).
In the FAO Forest Resource Assessment 2010 (FRA 2010), countries were asked to provide information on their forest area for four points in time. This permits the calculation of net change in forest area over time. This net change is the sum of all negative changes due to deforestation and natural disasters and all positive changes due to afforestation and natural expansion of forests. (see section 3.2.4)
Gross deforestation Gross deforestation includes all land use conversions from forest land to non-forest land over a given time period.
In this study estimated gross deforestation was calculated as reported net deforestation plus reported afforestation and where available natural forest expansion. When countries did not report afforestation and natural forest expansion, average regional afforestation rates derived from published estimates in the FRA 2010 reports were applied (see Annex A for details). Note that some studies use the term ‘gross deforestation’ for all forest area losses including temporary clearcuts for roundwood extraction on forest land. Such land-cover approaches are often used in remote sensing studies. In contrast the analysis in this study uses the land-use approach.
Embodied deforestation
The deforestation embodied (as an externality) in a produced, traded, or consumed product, good, commodity or service. It is the deforestation associated with the production of a good, commodity or service. It excludes, per definition, deforestation that cannot be associated with consumable or tradable commodities, products, goods and services. Deforestation for which no clear cause can be identified or deforestation caused by natural hazards are thus excluded.
Embodied deforestation in soy meaning the deforestation that was necessary to convert a forest in cropland to cultivate soy. For more processed or composed products this refers to all the deforestation in the complete process to produce this product or all the commodities it is composed of.
Embodied deforestation in EU27 imports is calculated based on country specific production (including country and commodity specific embodied deforestation) and exports to EU27 countries based on bilateral trade flows. It is NOT calculated according to the share of EU imports of a specific commodity (e.g. soybean) and an average global embodied deforestation content of this commodity. For other externalities the wording ‘embedded’ is sometimes used, though ‘embodied’ has preference. Sometimes it is referred to as ‘virtual deforestation’ in analogy with ‘virtual water’ as an externality in products. ‘Virtual water’ is then all the water needed to produce a product.

CHAPTER 1 Introduction
15
Term Meaning Example Comment Embodied land use The land use embodied (as an
externality) in a produced, traded or consumed product, good, commodity or service.
Embodied land use in soy meaning the amount of land needed to produce a certain amount of soy. For more processed or composed products this refers to all the land used in the complete process to produce this product or all the commodities it is composed of.
Traded deforestation or traded embodied deforestation
This is the part of deforestation that is traded along with products that enter the international market. It is only a part of total deforestation due to the production of commodities as the major part of these commodities is consumed domestically (i.e. the country where deforestation for that commodity took place. It is the opposite of domestically consumed (embodied) deforestation.
Traded deforestation, imported by the EU27.
Imported deforestation or Imported embodied deforestation
Part of traded deforestation which is embodied in the products imported.
Imported deforestation into the EU27 which is embodied in soy products imported into the EU27.
Similarly: exported deforestation
Cropland deforestation Pasture deforestation Logging deforestation
The deforestation associated to these sectors.
Cropland deforestation in Brazil takes into account all deforestation directly or indirectly caused by conversion of forests into cropland.
This subdivision is a caused by the methodology applied and facilitates the identification and further split-up to commodities with embodied deforestation.
Solid biomass Solid biomass originates from agricultural crops and residues, from forestry, woodprocessing
Wood pellets Agricultural pellets Wood chips and particles Bagasse
Currently most solid biomass used in heat and electricity applications is applied as wood pellets from forestry and woodprocessing industries

CHAPTER 1 Introduction
16
Term Meaning Example Comment industries and from organic waste
Bioliquids Liquid fuel for energy purposes other than for transport, including electricity and heating and cooling, produced from biomass
Palm oil
Biofuels Liquid or gaseous fuel for transport produced from biomass
Biodiesel bioethanol

CHAPTER 2 General results & conclusions
17
CHAPTER 2 GENERAL RESULTS & CONCLUSIONS
2.1. INTRODUCTION
This study required the development of innovative models to link land use changes to observed deforestation data on the one hand and to link embodied deforestation to trade flows and final consumption in the EU on the other hand. The models used are shortly summarized in the below section 2.2. 2.2. SUMMARY OF THE METHODOLOGY: APPARENT AND FINAL CONSUMPTION
Previous modeling has linked embodied land use as an exernality to trade flows and final consumption, but never to embodied deforestation. For a good understanding of the models used it is important to explain the difference between “apparent” and “final consumption”. “Final consumption” consists of goods and services used by individual households or the community to satisfy their individual or collective needs. “Apparent consumption” is calculated as “production plus imports minus exports, sometimes also adjusted for changes in inventories”. The concept does not distinguish between intermediate and final consumption. “Apparent consumption” is subject to system boundaries and cannot track highly processed products (e.g. leather handbags, shirts, furniture) which might be exported again. Apparent consumption analysis is used in LANDFLOW modelling, a physical units-based trade model. It can track the trade of agricultural and forestry commodities and their embodied deforestation between countries. Once these commodities become highly processed products, they cannot be tracked any longer. Embodied deforestation of these products is attributed to the country where the tracking stops. Final consumption analysis is used in GTAP-MRIO modelling, a monetary-based model to simulate how all products derived from agricultural and forestry commodities are traded throughout the world. It traces the embodied deforestation up to the final consumer sector in a country or region, but it loses track of the physical commodity or product. An example can make this distinction, which is crucial to interpret the results of this study, more clear. Most primary ingredients of a pizza (e.g. cheese, maize, meat, soy beans, sausages) that contain embodied deforestation and that are imported in the EU are seen as European apparent consumption. These ingredients are tracked by the LANDFLOW/apparent consumption approach, including re-exports as ingredients, if applicable. However, if the pizza as a whole is produced in the country of deforestation and exported to the EU27, this is not visible as EU apparent consumption for the LANDFLOW model, because it is a highly processed product. For the same reason the export of a pizza produced in the EU27 out of imported ingredients with embodied deforestation is not visible as re-export either. To overcome this problem, the GTAP/final consumption approach can track embodied deforestation further down the value chain. However, this approach needs to aggregate the detailed product categories from the LANDFLOW/apparent consumption approach into sectors.

CHAPTER 2 General results & conclusions
18
The food producing sector, including pizzas produced and consumed worldwide, uses a number of ingredients with embodied deforestation that are connected by the model to EU27 consumption (e.g. households, services, restaurants). In this GTAP/final consumption approach, trade flows are considered in monetary units and the included sectors are assumed to be homogeneous (i.e. embodied deforestation is proportional to the price). Thus it can be concluded that the GTAP final consumption approach is restricted to information on product sectors and can not look into specific commodities. In this report, the results of both methods are used and analysed besides one another. They are not always exactly comparable, because their purpose, sectors, regions and level of detail are different. To interpret the results, it is important to keep in mind that the figures from the GTAP model are on the impact of the final consumption of sectors on deforestation, while the LANDFLOW model is used to generate more detailed information on the apparent consumption of a number of key commodities. As an example, the GTAP approach ranks embedded deforestation impact on a sector basis, with the food sector heading the list, and tracks the country of origin, with Brazil on top, while the LANDFLOW approach shows that soybeans and soybean cake are the commodities with the highest impact. For all below results and conclusions, we have indicated whether they are based on final or apparent consumption.
2.3. WORLDWIDE DEFORESTATION AND DEFORESTATION EMBODIED IN INTERNATIONAL TRADE
In this report, the impact of EU consumption on worldwide deforestation is analysed. As a starting point the status of worldwide deforestation is presented and it is shown which share of deforestation is embodied in international trade of food and non-food commodities and manufactured goods that are ultimately consumeded. The study includes data both on gross and on net deforestation. However the main focus is on “gross” deforestation, which can be more directly linked to consumption than “net” deforestation, where the impact is more “neutralised” by afforestation. 2.3.1. WORLDWIDE GROSS DEFORESTATION FROM 1990-2008
For the period 1990-2008 worldwide gross deforestation is estimated at 239 million ha (Mha), or about 13 Mha on average per year (approximately the size of Greece), with substantial regional variations. The main regions with gross deforestation are South America (33% of global gross deforestation), Sub-Saharan Africa (31%), and Southeast Asia (19%). During the same period, gross deforestation was partially compensated by afforestation and natural expansion of forests, counting together for 115 Mha. As reported in the Forest Resources Assessment 2010 of the Food and Agriculture Organisation (FAO), this results in a net deforestation of 124 Mha. It must be noted, however, that the recent Remote Sensing Survey (RSS) recommends to revise these deforestation rates downwards, especially for the African continent6.
6 As the international trade exposure of Africa is relatively low compared to other regions, such revisions would have only a small implication for EU27 results..

CHAPTER 2 General results & conclusions
19
Figure 2-1 Regional forest area changes between 1990 and 2008.
This study identifies drivers of deforestation by main sectors. Gross deforestation (as estimated from FRA-2010, i.e. a land use concept) is attributed to five main sectors: “agricultural expansion”, “logging” (prior to agricultural expansion), “urban areas expansion” , “natural hazards (espescially wildfire)” and “unexplained”. FRA 2010 and FAOSTAT land use domain databases are used. Using a “transition model” developed under the project, land use changes reported in FAOSTAT for the above sectors were linked to the deforestation areas from FRA 2010. Moreover, a fraction of the agricultural land expansion allocated to deforestation is re-allocated to “logging for industrial roundwood extraction” to account for wood extraction preceding the conversion of forest land for agriculture. Unexplained deforestation in reporting When gross deforestation cannot be explained by either of the factors (i.e. agriculture, logging, built-up area increases or natural hazards), the remainder is termed “unexplained”. Of the 239 Mha of worldwide gross deforestation, about 58 Mha (24%) of reported deforestation cannot be clearly linked to the conversion of forests for clear consumption purposes or other reported deforestation causes. When deforestation numbers are not supported by reported area extensions for agricultural land, this forest loss remains unexplained7. This is inherent to limitations of the basic data sets. First of all, this unexplained deforestation can be partially attributed to erroneous deforestation figures (over-reporting) and agricultural area data on national level (under-reporting), as demonstrated by the recent results of the RSS. Secondly, this unexplained category 7 The largest source of uncertainty relates to the deforestation data. However, even the 9% difference in forest area between the FRA 2010 assessment and the Remote Sensing Survey of FRA 2010 is assessed by FAO as a good result considering the differences in methods. Furthermore, an accurate assessment of tree cover at lower canopy densities (10-30%) is very difficult with both the country-level FRA 2010 assessment and the RS survey. Therefore, uncertainties are particularly large in dry regions and for degraded forests. Agricultural production statistics and trade data are considered to be relatively reliable. Since more than half of imported deforestation to the EU27 is from Latin America, any uncertainties in deforestation in this region are of relevance for the EU27. Unlike for Africa, no large discrepancies in deforestation rates between the RS survey and FRA 2010 were found for South America.
-80
-60
-40
-20
0
20
40
60No
rther
n Ame
rica
EU27
Othe
r Eur
ope
Ocea
nia
North
Afri
ca, W
est A
sia
Sub-
Saha
ran A
frica
Cent
ral A
meric
a, Ca
rib.
Sout
h Ame
rica
Sout
h Asia
East
Asia
Sout
heas
t Asia
milli
on he
ctare
s
Gross deforestation Net deforestation Afforestation
Source: FAO, 2010a, FAO, 2011 and own estimates based thereon

CHAPTER 2 General results & conclusions
20
can be partially interpreted as the result of long-term degradation effects due to many informal practices in forests, e.g. illegal logging and unsustainable fuelwood gathering. As consistent global data and clear cause-consequence relationships on the latter are nonexistent, their impact is assumed to be found in this category. Thirdly, conversion of forests into agricultural land might encompass more conversion than actually will result in productive (and reported) agricultural land. This effect has been taken into account, though it might be underestimated. Drivers of deforestation For the remaining 182 Mha of worldwide gross deforestation, about 41 Mha (17%) were caused by natural hazards (mainly natural of man made fires) that did not result in reported agricultural land expansion. Indonesia alone lost 9 Mha of forest caused by the El Niño Southern Oscillation (ENSO) event in 1997–1998. Furthermore, about 9 Mha (4%) were turned into built-up land and infrastructure. The 132 remaining Mha, or 55% of worldwide gross deforestation, can be clearly attributed to the conversion of forest land to land for crop production, ruminant livestock production and industrial roundwood production (logging). These products were either used in the country of origin or exported for transformation and consumption elsewhere. Figure 2-2 shows the attribution of worldwide gross deforestation by deforestation driver / sector, including the “unexplained” category. Over the whole period, 24% of gross deforestation could not be attributed to clearly defined causes. In general, deforestation causes remained rather constant, with conversion of forest into cropland becoming relatively more substantial in the second subperiod.
Figure 2-2 Global Gross deforestation by deforestation driver / sector, including the “unexplained” category over the period 1990-2008. The smaller pie of the pie-in-pie chart represents the embodied deforestation in agricultural and forestry commodities.
2.3.2. DEFORESTATION EMBODIED IN AGRICULTURAL AND FORESTRY COMMODITIES
27%
17%
4%
2%
24%26%
52%
1990-2000
19%
17%
4%
2%
24%34%
60%
2000-2008
24%
17%
4%
2%
24%29%55%
1990-2008Unexplained
Natural hazards (esp. wildfire)
Expansion of urban areas & infrastructure Industrial roundwood production (logging) Ruminant livestock production
Crop production

CHAPTER 2 General results & conclusions
21
Of the 132 Mha (55%) of deforestation linked to global production of agricultural and forestry products, only 4.5 Mha (2%) of deforestation was attributed to logging. In this analysis, however, only the impact of logging which precedes conversion into agricultural land has been taken into account. The methodology does not attribute deforestation to logging directly, because only sustainable forest management practices are recorded in the FAOSTAT figures and illegal practices are not. This main look as an important limitation to the reader. In this context it should be mentioned that the scope of the study is limited to deforestation and does not include forest degradation. The impact of wood consumption goes beyond deforestation and has an impact on forestdegradation. Additionally, within the overall impact of the agricultural sector (128 Mha or 53%), 69 Mha (29%) of forests were directly or indirectly cleared for cropland to meet the global human demand for food, feed for livestock, fuel and fibres from crops. About 58 Mha (24%) of forests were cleared for pastures to raise livestock. Deforestation embodied in agricultural commodities (crop and livestock products) On the one hand, expansion of pastures is related to the consumption of livestock products from ruminants, mainly the consumption of ruminant meat. On the other hand, the top five agricultural commodities alone caused half of the 69 Mha deforestation associated with cropland expansion. Globally, the main crops that contributed directly or indirectly to deforestation include soybeans (19%), maize (11%), oil palm (8%), rice (6%), and sugar cane (5%). From the perspective of the final use of products with embodied deforestation, crops serve different purposes. Figure 2-3 reveals the importance of forest clearing for beef production in the overall impact of the agricultural sector. Of the 128 Mha, 49% of deforestation is embodied in livestock and feed crop products for beef production, 8% in feed crop products for pig and poultry livestock products, and 43% of embodied deforestation is used for food of vegetable origin, fuel and fibres.
Figure 2-3 Deforestation embodied in agricultural commodities (crops for food, feed, fuel and fibres, and livestock products from ruminants, pigs and poultry) for the period 1990-2008
46%
3%
8%
43%
Pastures for grazing (ruminants) -livestock products, mainly beef
Crops for feed (ruminants) -livestock products, mainly beef
Crops for feed (pigs and poultry) -livestock products, pork and chicken
Crops for non-feed use -crop products for food, fibre and fuel
Embodied deforestation (linking deforestation to consumption) = The deforestation embodied (as an externality) in a produced, traded, or consumed product, good, commodity or service. It is the deforestation associated with the production of a good, commodity or service.

CHAPTER 2 General results & conclusions
22
Ranking the sectors that are associated with deforestation worldwide, pastures for ruminant livestock production represents the largest share with 58 Mha (24%). The agricultural crop sector represents 69 Mha (29%), divided over individual commodities soybeans (13 Mha), maize (8 Mha), oil palm (6 Mha), wood products (5 Mha), rice (4 Mha), and sugar cane (3 Mha). In conclusion, the consumption of livestock products from ruminant animals which are fed on grazing land (mainly beef), is the most important driver of deforestation on a global scale.
2.3.3. DEFORESTATION EMBODIED IN INTERNATIONAL TRADE
The below results are based on LANDFLOW analysis and apparent consumption. Approximately two-thirds of deforestation embodied in crop products stays in the producing country, while one third or 22.4 Mha of deforestation is embodied in crop products that are traded internationally. Oil crops (soybean and oil palm) and their derived products represent the largest share (63%) of deforestation embodied traded crop commodities, followed by stimulants (11%) like coffee and tea, and fibre crops (8%) like cotton and tobacco (Figure 2-4). The regions that exported most deforestation embodied in crop products were South America (64%), Southeast Asia (23%) and Sub-Saharan Africa (12%). These are the same regions where most deforestation takes place but it should be noted that Sub-Saharan Africa suffers from high deforestation, while its exposure to international trade is relatively low. The key deforestation importing regions are the EU27 (39%), East Asia (including China, 21%), North Africa and West and Central Asia (16%), North America (9%) and South Asia (8%).
Figure 2-4 Deforestation embodied in traded crop commodities, by crop groups, for the period 1990-2008, totaling 22.4 Mha
For livestock products, the portion that remains in the country or region of origin is even higher. Only 4.7 (8%) of 58 Mha of deforestation embodied in ruminant livestock products (mainly beef) is traded internationally. Regarding the conversion of forests into pastures for grazing for ruminant livestock, the highest share of the deforestation occurs in South America (28 Mha), but only 10% is exported from the region. The second ranked Sub-Saharan Africa (21 Mha) exports only 4% of ruminant livestock products from pastures. However, deforestation associated with livestock product consumption that is trade internationally does not only stem from conversion of forests into pastures for ruminant livestock grazing. Feed crops are also fed to ruminants and more importantly to pigs and poultry (see Figure 2-3). Some of
63%11%
8%
6%
5%4% 3% 0%
Oil crops
Stimulants
Fibre crops
Sugar crops
Cereals
Fruits, Vegetables
Roots, Pulses
Fodder crops

CHAPTER 2 General results & conclusions
23
these livestock products enter international trade after being fed on crops with embodied deforestation in the country of origin. Almost 1 Mha of deforestation embodied in livestock products fed on crops with embodied deforestation were traded internationally between regions from 1990 to 2008. About half of this embodied deforestation was exported from South America. Noticeably, the EU27 is the second most important exporter (more than one third) of this trade. For wood products, approximately 75% of embodied deforestation stays within the country of origin. In total, almost 1.1 Mha of embodied deforestation is exported from Southeast Asia, South America and to a lesser extent Sub-Saharan Africa. The bulk of these products are imported in East Asia (including China, 55%), the EU27 (18%), North America (12%), and other regions.
2.4. EU27 DEFORESTATION IMPACT
In the following, results from both LANDFLOW and GTAP approach analyses are presented. The apparent consumption analysis always encompasses the embodied deforestation in EU27 consumption for the whole period analysed: 1990-2008. These results allow for an identification of the commodities with the highest impact. The final consumption analysis treats in detail the results for the most recent period for which such an analysis is available, namely the year 2004. A less detailed analysis over 1992-2008 is also provided. It gives a better insight into where the products with embodied deforestation are finally consumed within the EU27 economy.
2.4.1. RELATIVE WEIGHT OFF DEFORESTATION IMPACTS ASSOCIATED WITH EU27 TRADING COMPARED TO IMPACTS ASSOCIATED WITH OTHER TRADING COUNTRIES/BLOCKS
The analysis of apparent consumption for the period 1990-2008 (LANDFLOW approach) focuses on a detailed set of commodities. It shows that the EU27 was relatively more associated with deforestation embodied in traded agricultural and forestry products than other trading regions. The deforestation embodied in products imported in the EU27 and its relative weight depend on the product type. The EU27 was the largest importer of deforestation embodied in crop and livestock products, though the role of East Asia became increasingly important during the 2000’s. Over the period 1990-2008, the EU27 imported from other regions 9 Mha of deforestation embodied in crop and livestock products. This is almost 36% of all embodied deforestation in crop and livestock products traded between regions during that period, or almost 7% of global embodied deforestation in crop and livestock products, including non-traded embodied deforestation. Subtracting EU27 embodied deforestation in crop and livestock products exported to other regions leaves a net import balance of 8.4 Mha of embodied deforestation. The second ranked region in terms of net import of deforestation embodied in crop and livestock products was Eastern Asia (including China and Japan) with 4.5 Mha, mainly over the period 2000-2008. In addition, the following regions the following regions listed by magnitude of imported embodied deforestation were North Africa and Western and Central Asia with 3.4 Mha, North America (1.9Mha), South Asia (1.7 Mha), non-EU Europe and Russia (1.6 Mha) and Oceania (less than 0.1 Mha). The highest share of embodied deforestation was traded through international crop product trade. Consequently, the import of embodied deforestation through the import of crop products was the main cause of the strong link between the EU27 and embodied deforestation. Of the 22.4 Mha of

CHAPTER 2 General results & conclusions
24
embodied deforestation in traded crop products, 33% or 7.4 Mha was consumed by the EU27 economy (Figure 2-5). A small part was re-exported as deforestation embodied in livestock products (see further).
Figure 2-5 Cumulative deforestation embodied in EU27 crop consumption by crop group, 1990-2008 (note that 0.2 Mha is re-exported in livestock products)
The most decisive factor was the import of oil crops, as they are heavily associated with deforestation in the country of origin. 70% of deforestation embodied in crop products was due to the import of these crops or derived products (Figure 2-5). This embodied deforestation was mainly associated with two crops and their derived secondary crop products, namely soybean cake and soybeans (together 82%) and oil palm (17%). Other important crop product groups are stimulants like coffee and cocoa (12%) and industrial crops like rubber (6%). The EU27 had an important share in this consumption compared to other trading blocks. The EU27 imported about 21% of global deforestation embodied in oil crops, whereas the remainder was either consumed within the country of origin or traded to other regions. Quite notably, the EU27 has been the most important destination of soybeans from Brazil and Argentina over the period 1990-2008: respectively 61% and 48% of these countries’ soybean export went to the EU27. For deforestation embodied in stimulants, globally 27% was imported by the EU27. For fibre crops and rubber (mainly rubber), 16% of deforestation embodied in those crops was imported by the EU27. The absolute values for these two crop groups are, compared to oil crops, only minor. When taking into account all deforestation embodied in crop products from 1990 to 2008, the EU27 imported almost 11% of all deforestation embodied in crop products. Embodied deforestation in the trade of ruminant livestock products was considerably lower. The analysis for the trade of embodied deforestation in livestock products consists of two different trade streams: ruminant livestock products raised on pastures in the country of origin and livestock products fed on feed crops with embodied deforestation. The EU27 import of embodied deforestation in ruminant livestock products during the period 1990-2008, amounts to 1.3 Mha out of a global total of 4 Mha, meaning that more than one-quarter of this amount was imported by the EU27. A fraction (0.14 Mha) of the imported embodied deforestation was re-exported in livestock products to other regions. Thus, from 1990 to 2008, about 1.2 Mha of deforestation was embodied in the EU27 net imports of ruminant livestock products due to expansion of pasture areas in the respective countries of origin. To conclude, the EU27 is the main net importer of embodied deforestation in traded ruminant livestock products,
3% 2% 1%
70%
5%
12%
6%
1%EU27 7.4 Mha
Cereals
Roots, Pulses
Sugar crops
Oil crops
Fruits, Vegetables
Stimulants
Industrial crops
Fodder crops

CHAPTER 2 General results & conclusions
25
followed by the regions North Africa-Western and Central Africa, non-EU Europe and Russia, East Asia and North America. As the EU27 has been importing large amounts of crop commodities for feeding livestock and as a net exporter of livestock products, it has also been a small net exporter of deforestation (0.2 Mha) embodied in livestock exports fed on crops with embodied deforestation. Many other regions, headed by East Asia, North Africa-Central and West Asia and non-EU Europe and Russia are net importers of livestock fed on feed crops with embodied deforestation. Deforestation associated with wood and wood-based product imports into the EU27 amounts to only 0.2 Mha, an area which is rather small compared to the deforestation embodied in EU27 net imports of agricultural products (9 Mha). One-sixth (17%) of this amount is re-exported from the EU27 to other regions. The main region importing deforestation embodied in wood products was East Asia, with more than half of the overall trade. The EU27 and North America follow.
Figure 2-6 : Import of embodied deforestation in key regions
The detailed analysis on final consumption for 2004 (GTAP approach) also provides a comparison of embodied deforestation traded between different trading blocks. The EU27 is the largest net importer (Figure 2-6 and Figure 2-7), by a factor of two, followed by East Asia, and then North America. South and Central America dominate the net exports, by a factor of three over South East Asia and then Africa, a factor of two less than South East Asia. The final consumption of deforestation embodied in crop products is the most decisive factor.

CHAPTER 2 General results & conclusions
26
Figure 2-7 Trade balances for deforestation embodied in final consumption for different world regions. The figure shows deforestation embodied in the different sectors.
This broadly confirms the results of the LANDFLOW analysis. When looking at deforestation embodied in total final consumption per region, the EU27 is consuming 732 kha (2004) or 10% of the global embodied deforestation consumption (7,290 kha)(Table 2-1) This percentage is slightly different from the 7% calculated with the LANDFLOW apparent consumption approach, ,due to methodological differences. Africa and South and Central America are heading the list with more than 2 Mha each (30% of the global share each). As opposed to the situation in the EU27, this embodied deforestation is associated with commodities and products that are produced locally.
Table 2-1 The allocation of global embodied land use and deforestation to final consumption in different world regions in 2004 showing the relative magnitude of embodied deforestation to land use, and that the share of consumption is skewed towards the deforestation hotspots. The deforestation included here only includes deforestation for croplands, pastures, and due to preceding logging, i.e. embodied deforestation.
Region Land use
consumption (Mha)
Global share of land use
consumption (%)
Embodied deforestation consumption
(kha)
Global share of embodied
deforestation consumption
(%) Africa 1,086 19 2,204 30 South and Central America 512 9 2,189 30 South East Asia 137 2 826 11 EU27 582 10 732 10 East Asia 726 13 381 5 North America 954 17 347 5 West Asia 460 8 217 3 South Asia 276 5 212 3 Rest of the Former Soviet and Europe 642 11 152 2
-1000 -500 0 500 1000 1500
EU27
East Asia
North America
West Asia
South Asia
Rest of the Former Soviet and Europe
Oceania
Africa
South East Asia
South and Central America
Land Area (kha)
CroplandPasturesLoggingNet

CHAPTER 2 General results & conclusions
27
Oceania 284 5 29 0 Global 5,659 7,290
2.4.2. DEFORESTATION IMPACTS ASSOCIATED WITH EU27 CONSUMPTION OF COMMODITIES, PRODUCTS, GOODS AND SERVICES BY SECTOR AND BY COMMODITY
The detailed final consumption analysis for the year 2004 (GTAP approach) provides a deeper insight into how goods and services were consumed within 57 consumption sectors in the EU27. The origin of the deforestation associated with final consumption in the EU27 is centralized in key regions and commodities (e.g. Brazil with oil seeds and meat, Argentina with oil seeds, Indonesia with oil seeds and wood, Nigeria with a variety of agricultural commodities). However, when these commodities are reallocated to the goods and services sectors of final consumption in the EU27, we find a diffuse range of important goods and services sectors of final consumption. The EU27 produces a large share of the goods and services consumed in the EU27, while using raw and semi-processed agricultural and forestry commodities imported from other regions. The sectors of final consumption with the largest allocation of embodied deforestation are dominated by agricultural and food products, but processed products are often important, such as furniture and clothing. We found that service sectors (trade, public administration, health, education) had a surprisingly large impact, due to a high share of expenditure on services and the use of processed products like food and paper in the service sectors. Figure 2-8 shows the relative importance of deforestation embodied in different goods and services sectors of final consumption in the EU27. The main goods and services are those that require food (both food from animal as non-animal origin), but general service sectors like trade, public administration, health and education do not only consume food, but also a wide variety of other products.
Figure 2-8 Consumption of goods and services associated with deforestation allocated by sector for the EU27 (2004). The pie chart only explicitly shows sectors covering 75% of the total are shown explicitly. The sectors shown represent the goods and services that were consumed in the EU27.
When aggregated per sector, food dominates the impact (60%, with 18% meat and 42% other food). The service sectors are the second most important (22%), although this is mainly due to high expenditure and consumption of food products in addition to paper, furniture, etc. Wood and associated products represent 5%, and also textiles including leather (6%) and manufactured products (3%) are significant (Table 2-2)

CHAPTER 2 General results & conclusions
28
The subdivision in other columns of the different sectors of deforestation for crops or pasture expansion or due to logging in the country of origin reveals the underlying dynamics. It appears that even the non-meat based food sector embodies deforestation from rather unexpected sectors of deforestation in the country of origin. For example, the non-meat based food sector embodies considerable shares of embodied deforestation in wood products (e.g. packaging), but also deforestation embodied in ruminant livestock products raised on pastures. The aggregated wood products sector logically embodies most of the deforestation embodied in imported wood products, but also an important amount of deforestation embodied in crop products due to the use of fibre crops (e.g. for textiles in furniture) and chemicals derived from crops. The textile sector includes an equal amount of deforestation embodied in fibre crops and leather (livestock pasture deforestation).

CHAPTER 2 General results & conclusions
29
Table 2-2 Consumption of goods and services associated with deforestation allocated by aggregated sector for the EU27 (2004). The sectors shown represent the goods and services that were consumed (cons) in the EU27, but were produced by deforestation.
Total Deforestation
Cropland Deforestation
Pasture Deforestation
Logging Deforestation
Sector of consumption in the EU27
Total (10³ ha)
Share of
EU27 cons (%)
Total (10³ ha)
Share of
EU27cons (%)
Total (10³ ha)
Share of
EU27cons (%)
Total (10³ ha)
Share of
EU27cons (%)
Food - Non Meat based 305 42 274 54 28 14 3 10
Services 164 22 127 25 32 16 5 21
Food – Meat-based 134 18 30 6 103 52 1 3 Textiles, including leather 46 6 22 4 22 11 2 9
Wood products including pulp, paper, furniture, construction
36 5 20 4 5 2 12 45
Manufacturing 25 3 18 4 4 2 2 9 Energy, chemicals, mining, transport 21 3 16 3 4 2 1 4
EU27 Total 732 100 507 100 199 100 26 100 The best sector analysis available up to date is for the year 2004. The time and effort needed for a compilation of statistics and verification does not allow for a more recent analysis. Embodied deforestation consumed by the EU27, however, remained quite stable between 2004 and 2008. Nevertheless, this could mask underlying changes between different EU27 sectors. The most important change could be a rising importance of the energy sector in relation to the other sectors due to higher applications of oil crops for biofuel production. As shown inTable 2-2, the energy sector embodied in total 3% of deforestation in the EU27 in 2004, mainly due to the deforestation embodied in crop products used in this sector. Ancillary data to our analysis show that the increased use of vegetable oils by the biofuel sector is mainly on the account of increased rapeseed oil use, a crop which does not embody deforestation. The application of soybean oil and palm oil in the non-food sector rose too, but their share is much smaller than the share of rapeseed oil. The application of these vegetable oils by the food industry, however, remained stable. Therefore, we conclude that the share of the energy sector at this time is likely to be higher than the 3% calculated for 2004. However, the change is likely to be small and will thus not alter the relative importance of different sectors in consumption of embodied deforestation between 2004 and 2008. The analysis of apparent consumption for the period 1990-2008 (LANDFLOW approach) focuses on a more detailed set of commodities. It shows that EU consumption of livestock products (mainly meat) was the most important driver of deforestation in that period. A breakdown of cumulative deforestation embodied in EU27 domestic crop and livestock product use is presented in Figure 2-9. Some crop products (such as soybean cake) that are associated with deforestation are used as feed for animals. Figure 2-9 reveals that 44% of deforestation is

CHAPTER 2 General results & conclusions
30
associated with feed crop products. Another important deforestation driver is the expansion of pastures for ruminant livestock production, counting for 14%. Hence, the principal contribution to deforestation embodied in EU27 utilization of agricultural products over the period 1990-2008 is the consumption of livestock products (59%), either through the import of feed products or directly through the import of livestock products (mainly meat). Livestock products consumption of the EU27 population involved 3.8 Mha cultivated land expansion for feed crop production plus 1.2 Mha pasture expansion for ruminant livestock, equalling a total of 5 Mha. Both the 3.8 Mha and the 1.2 Mha are embodied deforestation in imported commodities.
Figure 2-9 Cumulative deforestation embodied in EU27 consumption of crop and livestock products, 1990-2008
Figure 2-10 depicts deforestation embodied in EU27 net imports of crop products, by crop over the period 1990-2008.
25%
44%
14%
14%
1%
1%1%
EU27 8.7 Mha
Crops for food
Crops for feed
Crops for other uses (fibre and fuel)
Livestock products for direct EU27 consumptionLivestock products for feeding of livestock productsLivestock products for other uses
Seed and Waste
Source: LANDFLOW calculations based on FAOSTAT 2011

CHAPTER 2 General results & conclusions
31
Figure 2-10 : Deforestation embodied in EU27 net imports of crop products, by crop, 1990-2008
It shows that soybeans and derived products are responsible for 4.4 Mha of net imported deforestation in the EU27. Palm oil and derived products is the second ranked crop with 0.9 Mha. Stimulants such as cocoa and coffee take the third position with 0.9 Mha, while nuts account for 0.3 Mha and rubber for 0.2 Mha. Deforestation associated with EU27 imports of wood products over the period 1990-2008 amounted to 0.2 Mha.
2.4.3. THE ORIGINS OF THE GOODS AND SERVICES CONSUMED IN THE EU27 THAT ARE ASSOCIATED WITH DEFORESTATION
Both the apparent consumption analysis for the period 1990-2008 (LANDFLOW approach on commodities) and the final consumption analysis for the year 2004 (GTAP approach on sectors) point towards South America and in particular Brazil and Argentina as the main sources for embodied deforestation associated with the consumption of agricultural and forestry products or goods and services within the EU27. This is mainly due to the import of soybeans and soybean cake used in many EU sectors. As previously mentioned, the expansion of soybean crops is the largest driver of deforestation in the analyzed period. The analysis of apparent consumption for the period 1990-2008 (LANDFLOW model) points out that amongst all commodities, oil crops are the most important, mainly due to soybeans and soybean products from Brazil, Argentina and Paraguay, and palm oil from Indonesia and Malaysia. Another important group are stimulants. Cocoa bean production has expanded in African countries like Ghana, Nigeria, Cameroon and Togo, but also Indonesia is an important country of origin. Coffee associated with deforestation was mainly imported from Latin American countries like Peru, Honduras, Nicaragua and Colombia, but also from Southeast Asian countries like Indonesia, Vietnam and Laos and some African countries (Kenya, Uganda and Tanzania).
34%
26%
12%
8%
4%4%
3% 9%
EU27 7.4 Mha
Soybean Cake
Soybeans
PalmOil & PalmKernelOil
Cocoa Beans
Coffee Green
Nuts
Natural Rubber
Other

CHAPTER 2 General results & conclusions
32
Figure 2-11 gives the order of importance of different combinations of crop products and their country of origin. Only the most important combinations (share > 1%) are shown in detail.
Figure 2-11 Most important crop commodities and countries of origin for deforestation embodied in crop imports into the EU27 (1990-2008) Livestock products with embodied deforestation are mainly imported from South America and Sub-Saharan Africa. Wood products with embodied deforestation, which constitute a very small proportion of total imported embodied deforestation, originate from Brazil (almost 50%) and Indonesia, followed by a few Sub-Saharan countries such as Cameroon and Madagascar, but also from other Asian countries. The final consumption analysis for the year 2004 (GTAP approach) confirms the general results from the above analysis. Brazil accounts for almost 50% of deforestation embodied in EU27 consumption, followed by Argentina (9%), Nigeria (6%), Indonesia and Paraguay (both 5%) (cf. Figure 2-12).
23%
18%
9%9%
4%
3%
3%
2%2%
2%2%
1%1%
1%
20%
EU27 Net Imported Deforestation in crops: 7.4 MhaBrazil - Soybean Cake
Brazil - Soybeans
Argentina - Soybean Cake
Indonesia - PalmOil
Paraguay - Soybeans
Ghana - CocoaBeans
Brazil - Nuts
Malaysia - PalmOil
Nigeria - CocoaBeans
Indonesia - Natural Rubber
Argentina - Soybeans
Indonesia - Coffee Green
Cameroon - CocoaBeans
Indonesia - CocoaBeans
Other

CHAPTER 2 General results & conclusions
33
Figure 2-12 EU27 imported deforestation by country of origin (2004)
The final consumption analysis confirms the position of Brazil and Indonesia as important exporters of embodied deforestation in wood products to the EU27, followed by other Asian countries, with an important role for Vietnam. Although no deforestation could be directly attributed to the import of mining products, it is important to notice that the import of minerals and concentrates from Brazil and Indonesia to the EU27 can indirectly contribute to deforestation. Brazil is an important trade partner for the EU27 for iron and aluminium ores and concentrates for the EU27. Indonesia is also important for copper ores and concentrates as well as gold ores and concentrates of other precious metals.
2.4.4. EU27 CONSUMPTION OF GOODS AND SERVICES ASSOCIATED WITH DEFORESTATION VERSUS PROCESSING AND EXPORT
For the final consumption analysis for the year 2004 (GTAP approach), it must be noted that all the above results refer to what is consumed in the EU27. Re-exports are not part of final consumption. The final consumption analysis points out that 93% of the deforestation embodied in EU27 import is used for EU27 final consumption. The total deforestation embodied in import of raw or semi-processed agricultural and forestry commodities that undergo further processing in the EU27 before export represent 7%. Wood products are relatively more likely to be further processed in the EU27 for export, followed by crop products and then ruminant livestock products. In absolute terms, the processing of imported crop products is the most important cause for re-export of embodied deforestation. The products that are imported by the EU27 and then subject to further processing are, in order of importance, oil seeds (53%), various crops (16%) and beef (14%), followed by a drop to the next sectors. Most important re-exports in sector terms are processed food products (18%), processed vegetable oils and fats (17%) and chemicals (9%). The main destination of these re-exports is the USA (22%), followed by a number of countries or regions with 6-7%: rest of Western Asia, Switzerland, Japan and the Russian Federation. These re-exports represent a range of processed goods and services.
48%
9%
5%
5%
4%
3%
2%
2%2%
2%
2%2%
1%
1% 12%
EU27 Imported Deforestation: 0.2 Mha
BrazilIndonesiaCameroonArgentinaMalaysiaCote d'IvoireGabonUruguayRest of SEAPhilippinesChileGhanaChinaCongo, Rep.Other
LANDFLOW results based on FAOSTAT

CHAPTER 2 General results & conclusions
34
2.4.5. PAST TRENDS AND POSSIBLE FUTURE FORESIGHT SCENARIOS OF EU27 CONSUMPTION ASSOCIATED WITH DEFORESTATION
The apparent consumption analysis for both periods 1990-2000 and 2000-2008 (LANDFLOW approach) shows a higher apparent consumption of embodied deforestation in the EU27 in the first period than in the second period. This is logically related to lower deforestation rates in the countries of origin in the second period. The final consumption analysis (GTAP analysis over 1992-2008) shows a rather stable picture of deforestation embodied in the EU27 final consumption, compared to other world regions. An indicative foresight scenario for food consumption in the EU27 until 2030 has been developed to quantify what changes may arise in the future. Average food consumption per capita in industrial countries is expected to level off. Also, meat consumption levels in the EU27 are expected to stabilize. Consequently, the most important drivers for deforestation over the analysed period until 2030 are will remain at approximately the same level. With a slightly growing EU27 population by 2020/2030, the foresight results suggest that this will require 3-4 Mha8 of agricultural land, if average food consumption levels per capita (meat and dairy diets) remain unchanged9. If all EU27 citizens were to consume food (meat and dairy diets) according to a high per capita food consumption scenario, the additional land use needed could amount to 16 Mha. Slight behavioral changes in EU27 food consumption (e.g. less meat or less beef consumption) could reduce the need for additional land by up to 10 Mha by 2020 and 203010 compared to the current average EU27 diet.
Figure 2-13 Increased or decreased land use for different EU27 diets in 2020 and 2030 compared to current land use for EU27 consumption
8 It was not possible to estimate additional deforestation 9 2020 and 2030 population forecasts for the EU27 do only slightly differ and estimates are quite similar for those years 10 No important change between 2020 and 2030 is expected.
-60-50-40-30-20-10 -
10 20 30
hect
ares
Mill
ions
2020
2030

CHAPTER 2 General results & conclusions
35
The scenarios and comparisons should be considered as indicative: the absolute values are less important than the relative differences between them. A reduction of food waste levels was identified as another important factor to reduce the impact of EU consumption on deforestation. The impact on land use or deforestation is, however, too much dependent on the food waste type to allow for the calculation of possible land use change effects. Oil crops were identified as a decisive factor for deforestation embodied in the EU27 consumption over the period 1990-2008. As the IFPRI (2011) study points out, the additional land claim from the biofuel sector is also expected to increase the need for land and can cause additional land use change or deforestation, albeit indirectly. For solid biomass, own calculations, based on simple assumptions to convert primary energy production into wood volumes from NREAP data, predict an additional demand of 318million m³ RWE from forests, between 2010 and 2020. Due to incomplete data from the national NREAPs, it is not possible to calculate what amount will be sourced from outside the EU borders and what amount will be sourced from within the borders. The European Commission (2010) states that the bulk of this bioenergy will be in the form of wood pellets from forest-based industries, increasingly coming from outside the EU (see also Sikkema et al., 2011). IEA Bioenergy Task 40 (2011) estimates a tripling of the EU demand for wood pellets by 2020 compared to the demand in 2010. Together these foresight scenario’s lead to the following conclusions. Stabilization of the current average meat consumption per capita by the EU27 would require an additional 2.8 Mha of land by 2020, if not met with efficiency increases in the livestock sector. An additional 1.73 – 1.87 Mha would be required for biofuels for transport based on NREAP data (IFPRI 2011). Altogether, this would require between 4.53 and 4,67 Mha of additional land, possibly resulting in additional deforestation. Looking at the future, growing food trends in other consumer countries, including developing regions and emerging economies, can also have an impact on land demand and thus possibly on deforestation. 2.4.6. THE OVERALL EU27 IMPACT VS. THE THEORETICAL SUSTAINABLE LEVEL OF USE/CONSUMPTION
According to the results of this study, the EU27 consumption is responsible for 10% of total deforestation embodied in consumption or 36% of embodied deforestation traded internationally.
Over the period from 1990 to 2008, average land use embodied in EU27 consumption (per capita as well as for total population, based on apparent consumption) decreased. The final consumption approach found a smaller reduction in embodied land use. If lack of available land is a driving force for deforestation, this positive development may reduce deforestation. Deforestation embodied in EU27 apparent consumption also was lower over the period 2000-2008 compared to 1990-2000. By contrast, the final consumption approach showed a small increase of embodied deforestation for the period of 2000-2008 compared to 1992-2000. The differences can be explained by the fact that the GTAP final consumption approach traces back more highly processed products that are not detected by the apparent consumption approach modelled in LANDFLOW. Since 2002 (the peak year in deforestation) deforestation embodied in EU27 final consumption is decreasing again, mainly due to less oil seeds with embodied deforestation imported in the EU27.

CHAPTER 2 General results & conclusions
36
Despite these slow positive developments, sustainable consumption levels (zero deforestation embodied in EU27 consumption of products and services) have not been reached yet. In fact both embodied land use and embodied deforestation remained stable over the period 1990-2008. The specific deforestation indicators developed (“embodied deforestation”), provide added value in comparison with land use based indicators like the Ecological Footprint, due to the specific focus on the relation between deforestation and consumption.

CHAPTER 3 Allocation of deforestation to land-use sectors and primary commodities
37
CHAPTER 3 ALLOCATION OF DEFORESTATION TO LAND-USE SECTORS AND PRIMARY COMMODITIES
3.1. INTRODUCTION
This chapter is a basic building block for the study as it determines the amount of deforestation that can be linked to the agricultural and forestry commodities sourced within a country where the deforestation takes place. It also determines how much of deforestation is ‘embodied’ in products made out of those resources or containing them. These products are either consumed within the same country, but many are also traded internationally and consumed, either after some transformations or not, in far away countries. This chapter thus generates the externality ‘embodied deforestation’ by establishing a link between reported deforestation in a certain country and the commodities that are at the very basis of this deforestation (e.g. deforestation for soy cropping, deforestation for grazing land to raise livestock, deforestation for timber, etc).
Hence, this chapter is not about EU27 consumption, but about land use changes in general, worldwide, and more in particular about the conversion of forest land into agricultural land, built-up land and so-called ‘other land’. It attributes deforestation to the primary commodities (different crops, livestock and timber) based on national deforestation data from the FRA 2010 (FAO, 2010a) and production data on agriculture and forestry from FAOSTAT (FAO, 2011) for the period 1990-2008. The following explains in brief the used definitions, data, methodology and limitations and uncertainties for this attribution (section 3.2). For a more in-depth explanation on the methodology we refer to Annex A. In section 3.3, the results of this attribution are treated. The results section dedicates a special subsection to the results for Brazil and Indonesia, as one third of global deforestation during this time period was found to have happened in these two countries alone. Of lesser importance on a global level, but important to EU27 consumption and deforestation, are Argentina, Paraguay, Nigeria and Ghana. Additional results on these focus countries have also been added.
3.2. DATA SOURCES AND METHODOLOGY
Many different agricultural and forestry commodities (and the products stemming from them) are grown or raised on the same land area consecutively, while, this area has only been deforested once. To estimate the share or relative weight of impact caused by food and non-food commodities, an analysis of the drivers of deforestation and cause-consequence relationships is needed. As the causes of deforestation are multiple, complex, and vary from location to location and over time with cascades of drivers, a clear cause-consequence relationship is difficult to establish (e.g. Geist and Lambin, 2001; Ramankutty, 2007, 2010).

CHAPTER 3 Allocation of deforestation to land-use sectors and primary commodities
38
Forest change dynamics are complex and vary from region to region. They include cycles of forest land reduction and growth induced by both human activities and natural causes. Moreover, countries or studies may apply different definitions of “forests” according to specific classification systems, assessment methods and monitoring frequencies. It is therefore difficult to compile consistent data sets for major forest types and forest land development globally. At the same time the attribution of consumption patterns to deforestation requires a complete and consistent global picture of national forest areas and agricultural development since markets are closely interlinked by global trade. Moreover, the time dimension is of critical importance for the estimation of deforestation rates and associated consumption patterns. Given these difficulties and uncertainties in describing accurate transition pathways from forest land to primary sectors and commodities, assumptions will be kept simple and transparent.
3.2.1. DEFORESTATION DATABASE
The latest consistent data on global deforestation were used. FRA 2010 provides forest area changes for three periods 1990 to 2000, 2000 to 2005 and 2005 to 2010 and net change in forest area has been calculated for each country (FAO, 2010a11). In view of the growing significance of planted forests the parameters ‘afforestation’ and ‘reforestation’ were included in FRA 2010. Afforestation is the act of establishing forests through planting and/or deliberate seeding on land that is not classified as forest, while reforestation refers to the re-establishment of forest through planting and/or deliberate seeding on land classified as forest, for instance after a fire, storm or following clearfelling (FAO, 2010a). Reforestation is the re-establishment of forest formations after a temporary condition with less than 10% canopy cover due to human-induced or natural perturbations (FAO, 2000). Reforestation thus happens on forest land remaining forest land. Afforestation implies an increase in forest area through the conversion of land not bearing forest to forested land, while reforestation does not have an impact on the size of the total area of forest. Although deforestation data are available up to 2010, globally consistent land use, supply utilization accounts and trade data, which are required for the second part of the analysis in the following chapters are only available up to 2008. Therefore our analysis covers the period 1990 to 2008.
3.2.2. FORESTS AND DEFORESTATION DEFINED
An important distinction in defining a forest results from the distinction of the land cover versus the land use approach. Land cover refers to the observed biophysical properties of the land surface, whereas land use is determined by the human activities on and inputs to a given piece of land area.
Linking consumption and deforestation suggests treating forest as land use. This study applies the land use concept and definition of forest as used by the Food and Agricultural Organization (FAO) Global Forest Resources Assessment (FRA 2010), the FAO land use statistics, and the recently published Remote Sensing Survey (RSS)12 on forest area changes between 1990 and 2005
11 For details and data see Table 3 in Annex 3 and Box 2.2 of FAO 2010a 12 The implications of the use and estimates of the recent Remote Sensing Survey (RSS) on the results of the study are very small. The RSS for FRA 2010 has up to now only resulted in a very brief summary stating general results which, to some extent, can be used to qualify some of the deforestation data in the FRA 2010

CHAPTER 3 Allocation of deforestation to land-use sectors and primary commodities
39
conducted by FAO and JRC. Forest land use may include periods during which the land is devoid of tree cover, for example during cycles of forest harvesting and regeneration. In such cases, a land use is considered to be forest land use when management or natural processes will, within a reasonable time, restore tree cover to the point where it constitutes a forest (FAO and JRC, 2011). This study uses the land use concept, which is consistent with the FAO definition of forests and deforestation (Figure 3-1).
Forest is defined as “Land
• spanning more than 0.5 ha
• with trees higher than 5 m
• and a canopy cover of more than 10%,
• or trees able to reach these thresholds in situ.
• It does not include land that is predominantly under agricultural or urban land use.”
The first three criteria are land-cover criteria, the last two are land-use criteria. The last land-use criterion excludes areas with tree cover, which meet the minimal land cover criteria, but where land use is classified as agricultural or urban use (e.g. urban parks, agro-forestry). The second last criterion includes temporarily unstocked forest areas (e.g. after a clear cut as part of a forest management cycle) as well as forest areas, which do not currently meet the minimal land-cover criteria but are able to reach the thresholds in situ.
report (deforestation data in Africa and deforestation data related to countries with many 10-30% crown cover forests). Most of the differences in estimates between the RSS and national data in FRA 2010 would end up in the category ‘unexplained deforestation’, even more because this reports transition model assesses (to the extent possible) inconsistencies between deforestation and expansion of agricultural land and attributes the deforestation to the category ‘unexplained’. “The FRA 2010 reported a substantially higher net loss in forest area from 1990-2005 (107.4 million ha) than found in the remote sensing survey (72.9 million ha) or a difference of 32 percent.” This difference could potentially explain some of the ‘unexplained’ category resulting from this analysis. FRA 2010 suggested that the rate of net forest loss decreased in the period 2000–2005, while the remote sensing survey detected an increase in rate. This is in line with this analysis where the unexplained fraction decreases after 2000. “The largest difference between the two assessments was in Africa where most countries still have very old data and were most often from forecasts, which reduces the accuracy of change estimates.” Indeed, uncertainties related to results of African countries are highlighted in the study. FAO clearly states that the RSS analysis complements the country-based FRA process. In the future the RS survey will be used to improve the reporting of forest area and forest area change as part of the continuous improvement of the FRA process. When the FRA RS analysis publishes country data, especially on gross deforestation, those could be readily applied in the methodology for attribution of deforestation to main sectors. However, it is not clear whether and when country results will be published.

CHAPTER 3 Allocation of deforestation to land-use sectors and primary commodities
40
Figure 3-1 Forest land and non-forest land, deforestation, afforestation and reforestation in the FAO Land-Use approach (adapted from FAO 2010a to include reforestation).
The predominant use of the land is the first determining factor and the use of the land can thus not be assessed by looking at the cover alone. The definition of forests explicitly excludes areas under predominant agricultural and urban use regardless of the presence of trees. This has the following consequences:
o Palm oil plantations, while they can meet all the necessary thresholds to classify as a forest from a land cover point-of-view, are not considered forests due to their agricultural use;
o The same applies to other kind of cropping systems with perennials like agroforestry systems with cocoa, coffee, or tea, banana and plantain. FRA2010 talks about trees outside forests when agroforestry is concerned, not forests.
o Large-scale eucalyptus and pine plantations are included in FRA 2010 as forests, despite of their intensive management., as the main purpose of these plantations is to produce wood products.,
• Rubber plantations are reported as forests by FRA 2010. Rubber plantations have both an agricultural use (throughout their lifetime) and a forestry use (at the end of the plantations lifetime) as the wood is used for wood products. Rubber harvested area and production are also reported in the FAO agricultural domain (see Annex L)
o FRA 2010 includes the quality of Forest characteristics in FRA 2010 include three categories: i) primary forests; ii) other naturally regenerated forests; iii) planted forests. Conversion between these categories is not considered deforestation.
3.2.3. FOREST DEGRADATION
The impact of the forestry sector on forests is thus much larger than its impact on the ‘binary problem of deforestation’ (forest- non forest) alone. The above definitions and their consequences allow for the forestry sector to source wood while its impact on the forest area is not recorded by this definition. Forest degradation is a complex issue. Many different concepts or definitions exist. For a broader view on the existing definitions, we refer to the FAO Forests and Climate Change Working Paper 5 (Schoene et al., 2007). Schoene and colleagues listed up existing international definitions of forest degradation in order to find a definition for the purpose of the UNFCCC, and they rightly point to the fact that degradation “can realistically only be assessed ex post, after a given observation period. [...] degradation in this sense is not measurable during a short assessment period.”
Forest land (use)
Any otherland (use)
DeforestationNatural disasters
AfforestationNatural expansionReforestation
Tresholds

CHAPTER 3 Allocation of deforestation to land-use sectors and primary commodities
41
A more recent initiative for assessing degradation by the FAO and the Collaborative Partnership on Forests13 defines forest degradation as : “ a change process within the forest, which negatively affects the characteristics of the forest. The combination of various forest characteristics (forest quality) can be expressed as the structure or function, which determines the capacity to supply forest products and services. Forests may be degraded in terms of loss of any of the goods and services that they provide (wood, food, habitat, water, carbon storage and other protective socio-economic and cultural values). Degradation is typically caused by disturbances, which vary in terms of the extent, severity, quality, origin and frequency. The change process can be natural (caused by fire, storm, drought, pest, disease) or it can be human induced (unsustainable logging, excessive fuelwood collection, shifting cultivation, unsustainable hunting, overgrazing). The latter can be intentional (direct) through for example excessive logging, overgrazing, too short a fallow period or it can be unintentional (indirect) for example through spreading of an invasive alien species or pestilence or road construction that might open a previously inaccessible area for encroachment. (Simula, 2009). Give the complexity of the forest degradation issue and the unavailability of global data it was concluded and agreed for this study, as described in the inception report, that forest degradation is not included in this study. 3.2.4. ATTRIBUTION OF DEFORESTATION TO SECTORS AND COMMODITIES
For the attribution of deforestation to main sectors, the FRA 2010 net forest area changes need to be adjusted for any conversions of non-forest land to forest land. For countries reporting afforestation and/or natural forest re-growth this has been taken into account, otherwise average regional rates derived from the published estimates in the FRA 2010 main report (FAO, 2010a14). Such estimated gross deforestation15, calculated as reported net deforestation plus afforestation (and where available also natural forest expansion), includes all land use conversions from forest land to non-forest land over a given time period. Gross deforestation was then attributed to human activities and main sectors as described below.
Official data on land use, agricultural and forest production as published by the FAO are used as the basis for the allocation of deforestation to crops, livestock production, logging, natural hazards and the remainder to ‘unexplained’ causes. The applied methodology follows a three-stage approach.
(1) Firstly, the land-use transition model attributes deforestation to combinations of the following land use category changes:
(i) forest land converted to agriculture, including for crop cultivation of annual crops and perennials (e.g. oil palm, olive trees, orchards, coffee, cocoa, etc.), and livestock production;
(ii) forest land converted to built-up land, i.e. expansion of rural settlement, urban areas, and infrastructure;
13 Assessment and monitoring of forest degradation. available at http://www.fao.org/forestry/cpf/forestdegradation/en/ 14 Table 5.7 on p.96 of FAO 2010a 15 Note that some studies use the term ‘gross deforestation’ for all forest area losses including temporary clearcuts for roundwood extraction on forest land. Such land-cover approaches are often used in remote sensing studies. In contrast the analysis in this study uses the land-use approach.

CHAPTER 3 Allocation of deforestation to land-use sectors and primary commodities
42
(iii) forest land converted to ‘other land16’ in the process of logging for round wood, side effects of agricultural expansion and other ‘unexplained’ reasons; and
(iv) forest land destroyed due to natural hazards (e.g., fire, pest and diseases, extreme events) and converted to ‘other land’.
Agricultural expansion is assumed to be the main driver of deforestation. Besides deforestation allocated to built-up area increases (own estimates) and natural hazards (based on data on fire reported in FRA 2010), deforestation is attributed to the agricultural sector within the limits of agricultural expansion, i.e. up to the extents that agricultural land expansion can explain deforestation (for details see Equation 9 in Annex A).
(2) Secondly, the deforestation attributed to agriculture is treated separately for deforestation used for the expansion of crop cultivation (including annual crops and plantations of perennials), and deforestation for pastures for expanding ruminant livestock production. A fraction of agricultural land is allocated to the forestry sector (logging for industrial roundwood) to account for wood extraction on forest land that has been converted for agriculture.
(3) Thirdly, deforestation associated with expansion of crop cultivation and plantations of perennials is attributed to specific individual crops/perennial plants in proportion to each crops magnitude of harvested area expansion.
FRA 2010 and the FAOSTAT land use domain are consistent in reporting the same forest area. The FRA 2010 main report and FRA 2010 country reports also provide estimates on afforestation and natural regrowth, which were used to estimate gross deforestation (see Annex A for details). Following conclusions of the project’s expert workshop (20 October 2011) the methodology i) re-allocates a fraction of the agricultural land expansion to ‘logging for industrial roundwood extraction prior to agricultural expansion’ to account for wood extraction on forest land that has been converted for agriculture; and ii) when gross deforestation cannot be explained by either of the drivers – agricultural expansion logging, built-up area increases, or natural hazards -, the remainder is termed ‘unexplained’. Thus, results allocate deforestation to the following sectors or causes:
i) cultivated land expansion and related crop production increases with crop production being disaggregated to specific crops (cropland) ;
ii) pasture expansion and ruminant livestock production increases (pastures); iii) expansion of rural settlement, urban areas and infrastructure (built-up land); iv) industrial round-wood extraction (logging prior to agricultural expansion); v) natural hazards (fire mainly); and vi) ‘unexplained’ deforestation.
Based on available data, estimations were achieved on a country-by-country basis for two periods, 1990-2000, and 2000-2008. Results are available for individual countries and regional aggregations. Details of the methodology are presented in Annex A.
16 The land use category ‘other land’ comprises of all land use not classified as agricultural land (i.e. cultivated land, permanent pastures and meadows), forest land (according to FRA2010 defined as minimum 10% canopy cover) and built-up areas. This includes sparsely vegetated shrub land and herbaceous vegetation with less than 10% canopy cover.

CHAPTER 3 Allocation of deforestation to land-use sectors and primary commodities
43
→ Indirect Land-Use Change (iLUC)
The discussion on land-use changes makes a distinction between direct and indirect land use changes (see e.g. IEA, 2011). This distinction has especially been discussed in the debate on the sustainability of biofuels production. For example, it has been reported that cropland expansion for soybean production in southern Brazil is a major reason why cattle operations are expanding into the Amazon forest biome (Lapola et al., 2010), as cattle farms are being ‘pushed’ into the Amazon by soybean cultivation on their former production sites. In this case cropland expansion in Southern Brazil indirectly causes land use changes (deforestation) in the Amazon. In general direct and indirect effects apply to all land use conversions and deforestation may therefore as well result from direct or indirect land-use changes. Forests may be converted into agricultural land (direct land-use change). Built-up land expansion into agricultural land may gradually ‘push’ agricultural land into forests (indirect land use change). In the latter case built-up land expansion indirectly causes deforestation.
3.2.5. THIS STUDY ATTRIBUTES DEFORESTATION TO SECTORS AND SUB-SECTORS IN PROPORTION TO THE ADDITIONAL LAND DEMAND OF EACH SECTOR DURING THE REPORTING PERIOD. FOR A GLOBAL STUDY, THIS APPROACH IS BEST SUITED TO ADDRESS BOTH DIRECT AND INDIRECT EFFECTS ON DEFORESTATION CAUSED BY THE EXPANSION OF INDIVIDUAL SUB-SECTORS (SEE ANNEX A).UNCERTAINTY AND SYSTEM BOUNDARIES
Deforestation results from a complex set of interacting driving forces. Agriculture is a primary source of deforestation (Houghton, 2010, Boucher, 2011). The applied methodology tracks the direct and indirect contribution of agricultural expansion on deforestation using a land-use transition model and the extensive FAOSTAT database on land use, harvested areas for crop production, and livestock numbers. In addition land degradation and abandonment as well as ‘edge effects’ (i.e. a fraction of land wasted in the process of land conversion to agriculture) are taken into account. The land-use transition model includes also the expansion of built-up land, and deforestation due to natural conditions (especially fire). Conversion of forests to agricultural land is in some regions preceded by timber extraction. A certain fraction of deforestation attributed to agricultural expansion is thus reallocated to roundwood extraction.
The FRA 2010 assessment provides the only source of globally consistent country data on deforestation. It has been selected as data source for the attribution of the above sectors to an estimated gross deforestation using reported net deforestation and estimates on afforestation and natural expansion based on published regional and country data. The FRA 2010 is a compilation of country reports and thus based on self reporting by the countries, based on their national statistics and capacities to monitor their forests.
The attribution of deforestation to the above sectors may not ‘explain’ all estimated deforestation in a country. Following advice from the expert workshop any remaining areas were assigned to ‘unexplained’.
Reasons for ‘unexplained’ deforestation may include gaps, deficiencies or uncertainties in the underlying data base. Deforestation may also result from unsustainable management practices of wood production both for industrial roundwood and fuelwood gathering. Due to scarce scientific literature on over-exploitation and unsustainable utilization of forest resources causing deforestation, the expert panel, recommended to assign no specific forest sector activities to deforestation except for the above described roundwood extraction prior to agricultural expansion. The FRA 2010 report has been complemented by a global remote sensing survey17 (RSS) covering the period 1990 to 2005. The remote sensing involved over 13,000 sample sites approximately
17 See also http://www.fao.org/forestry/fra/remotesensingsurvey/en/
CHAPTER 3 Allocation of deforestation to land-use sectors and primary commodities
44
100 km apart. At most sites the area survey was 10 km by 10 km, providing a sampling intensity of about one percent of the global land surface. Initial results were released on 30 November 2011.
→ FRA 2010 and the complementary Remote Sensing Survey (RSS) results
The FRA 2010 report has been complemented by a global remote sensing survey covering the period 1990 to 2005. Findings of the remote sensing survey suggest a 32% lower net loss in forest area compared to those reported in FRA 2010, which is based on forest areas reported by countries. The largest difference between the two assessments was in Africa where many countries reported estimates based on old data.
Therefore the net deforestation in Africa between 1990 and 2008 from the FRA 2010 may be an overestimation. However there are yet no details from the remote sensing survey on gross and net deforestation in Africa. Moreover, Africa includes large dry regions with a tree cover at lower canopy cover densities (e.g. between 10% and 30% canopy cover). As pointed out by FAO neither of the two approaches can accurately assesstree cover at lower canopy densities (FAO, 2010). The FAO Global Forest Resources Assessment (FRA 2010) estimated the total global forest area in 2005 at 4.06 billion hectares, compared with the remote sensing survey estimate of 3.69 billion hectares, a difference of about 9 percent, which is a good result considering the differences in methods. The FRA 2010 reported a substantially higher net loss in forest area from 1990-2005 (107.4 million ha) than found in the remote sensing survey (72.9 million ha) or a difference of 32 percent.” This difference could potentially explain some of the ‘unexplained’ category resulting from our analysis. FRA 2010 suggested that the rate of net forest loss decreased over the period 2000–2005, while the remote sensing survey detected an increase in rate. This is in line with our analysis where the unexplained fraction decreases after 2000
3.3. RESULTS
3.3.1. FOREST AREA CHANGES
Between 1990 and 2008 the FRA 2010 reports a global net deforestation – in which losses of forest cover are partially offset by afforestation or natural expansion- of 123 Mha. North America, Europe, Russia and South and East Asia reported net gains in forest areas. In South America, Sub- Saharan Africa, Southeast Asia and Central America forest area decreased by 75 Mha, 68 Mha, 33 Mha and 10 Mha respectively.
Based on regional published data of afforestation from the FRA 2010 main report and where available from data reported in the country reports (country reports sometimes include natural expansion), we estimated that about 115 Mha of ‘non-forest land’ was converted to forests in this 18-year period. More than one third of global afforestation is reported to have occurred in China alone. Figure 3-2 shows regional forest area changes between 1990 and 2008.

CHAPTER 3 Allocation of deforestation to land-use sectors and primary commodities
45
Figure 3-2 Regional forest area changes between 1990 and 2008. Note: ‘Net deforestation’ data are derived from FRA 2010. ‘Afforestation’ denotes the change of former non-forest land to forest land use and has been estimated from regional published data of afforestation from the FRA 2010 main report and where available from national data on afforestation and/or natural expansion reported in the FRA 2010 country reports. Gross deforestation is estimated by adding net deforestation and afforestation. Other Europe includes Russia.
Adding these afforested areas to reported net deforestation provides estimates of gross deforestation, based on FAO statistics. Between 1990 and 2008, global gross deforestation comprised 239 Mha with substantial regional variations. The main regions with gross deforestation are South America (33% of global gross deforestation), Sub-Saharan Africa (31%), and Southeast Asia (19%).
The deforestation in EU27 is taking place in Portugal and Estonia. For Portugal two trends come together. First, while there is a small net increase in forest area of Portugal during 1990 to 2008, the estimated afforestation, based on reported data, is about twice as much as the net forest increrase. This implies (despite of a net increase) an estimated gross deforestation (of 187 thousand ha; about 2/3 of this in 1990-2000 and 1/3 in 2000-2008). Second, while cropland has decreased, the reported pasture area increased by almost 1 million ha (roughly 600 thousand ha in 1990-2000 and 400 thousand in 2000-2008). Hence, the model sees some gross deforestation and it sees land demand for pasture (in both sub-periods). Consequently, it allocates some amount of the estimated gross deforestation to the agricultural sector (livestock only as is consistent with the data).
For Estonia, gross deforestation occured according to the available data mainly in period 2000-2008 (i.e. afforestation plus natural expansion of forests exceeds net change of forest; in fact, there is even a small net decrease of forest area reported in Estonia). At the same time there was some increase in reported pasture area, nearly 200 thousand ha in 2000-2008) and the model, driven by
-80
-60
-40
-20
0
20
40
60
Nort
hern
Am
eric
a
EU27
Oth
er Eu
rope
Oce
ania
Nort
h Af
rica,
Wes
t Asia
Sub-
Saha
ran
Afric
a
Cent
ral A
mer
ica,
Car
ib.
Sout
h Am
eric
a
Sout
h As
ia
East
Asia
Sout
heas
t Asia
mill
ion
hect
ares
Gross deforestation Net deforestation Afforestation
Source: FAO, 2010a, FAO, 2011 and own estimates based thereon

CHAPTER 3 Allocation of deforestation to land-use sectors and primary commodities
46
these data, allocates some deforestation in the second period to Estonia's ruminant livestock sector.
3.3.2. ATTRIBUTION OF DEFORESTATION TO MAIN SECTORS
→ Global deforestation attributed to main sectors
Table 3-1 and Figure 3-3 present details of global deforestation attributed to main sectors during the periods 1990-2000 and 2000-2008.
Table 3-1 Global deforestation by main sectors, 1990-2008
1990-2000 2000-2008 1990-2008 Mha1 % Mha % Mha % Agricultural expansion, of which 71.5 51 56.1 58 127.6 53 Cultivated land expansion & crop production 36.8 26 32.6 34 69.4 29 Pasture expansion & ruminant livestock prod. 34.7 24 23.5 24 58.2 24 Industrial roundwood production (logging) 2 2.3 2 2.2 2 4.5 2 Expansion of urban areas & infrastructure 5.0 4 3.9 4 8.9 4 Natural hazards (esp. wildfire) 24.2 17 16.7 17 40.8 17 Unexplained3 39.0 27 18.6 19 57.5 24 World gross deforestation 4 141.8 100 97.5 100 239.3 100 Source: FAO, 2010a, FAO, 2011 and own estimates based thereon1 million hectares 2 Logging prior to agricultural expansion 3 Remaining gross deforestation that cannot be explained by either of the other main sectors 4 Gross deforestation is estimated from FRA 2010 (FAO, 2010) reported national figures of net forest change and estimated afforestation/natural expansion based on FRA 2010 regional averages and where available national country reports.
Between 1990 and 2008 more than half of deforestation, or 127.6 Mha, was the result of increasing land demand for agriculture. Agricultural expansion that directly or indirectly caused deforestation comprises two main sub-sectors: i) cultivated land expansion for crop production including plantations of perennials and ii) pasture expansion to accommodate increasing ruminant livestock numbers and production. Attribution of deforestation within the agricultural sector is done in proportion to additional land demand of each sub-sector within individual countries. At the global level during 1990-2008, 69.4 Mha, i.e., more than half (54%) of agricultural expansion was attributed to crop cultivation and plantations of perennials and the remaining 58.2 Mha (46%) to expansion of ruminant livestock production.
Logging may provide an incentive for further conversion of agricultural land use (Asner et al., 2006; Sheil et al., 2009). Deforestation for agricultural expansion is thus in some countries preceded by roundwood extraction. To account for this effect, a region or country specific fraction (up to a maximum of 10%) of the agricultural allocation has been assigned to logging for industrial roundwood production. In this way globally 2% of deforestation or 4.5 Mha were assigned to the logging sector.

CHAPTER 3 Allocation of deforestation to land-use sectors and primary commodities
47
Figure 3-3 Global deforestation by main sectors, 1990-2008
About 9 Mha of deforestation is estimated to be associated with the direct or indirect effect of the expansion of built-up land, including urbanization and other settlement and infrastructure development, and 41 Mha is associated with natural hazards, mainly wildfire.
The attribution of the above sectors to deforestation leaves a remainder of 57.5 Mha or almost one fourth of the cumulative gross deforestation between 1990 and 2008 which could not be explained by a conversion into well-defined land-use categories and has been assigned to the category ‘unexplained’. Unexplained deforestation may be caused by numerous factors including subsistence agriculture not reported in the FAO statistics, underreporting of agricultural expansion, illegal logging, or extensive fuelwood gathering especially in dry conditions or close to urban centers leading to irreversible loss of the canopy cover below minimum thresholds that define the forest land-use category. Another reason may be that the here applied methodology and database, relying upon nationally reported deforestation and land-use data from the FAO, overestimates gross deforestation. As explained above the most recent remote sensing analysis for the period 1990-2005 suggests that net deforestation reported in the FRA 2010 assessment (which forms the basis for our analysis) overestimates net deforestation by about 30%.
→ Regional deforestation by sectors
Deforestation by sectors varies markedly across regions (Table 3-2 and Figure 3-4). Agricultural land expansion is the dominant driving force of deforestation in South America, Sub-Saharan Africa and Southeast Asia (the latter only after 2000). In Sub-Saharan Africa and South America, both livestock and cropping, contribute to deforestation. In Southeast Asia agricultural expansion is due to oil palm mainly.
Between 1990 and 2008, half of the global 58 Mha deforestation related to ruminant livestock production expansion occurred in South America and about a third in Sub-Saharan Africa. A relative smaller contribution to deforestation from expanding ruminant livestock production occurred in Central America, South Asia and Southeast Asia.
0102030405060708090
100110120130140150
1990-2000 2000-2008
mill
ion
hect
ares
Unexplained
Natural hazards (esp. wildfire)
Expansion of urban areas & infrastructure (built-up)
Industrial roundwood production (logging)
Expansion of pastures & ruminant livestock production
Expansion of cultivated land & crop production
Source: FAO, 2010a, FAO, 2011 and own estimates based thereon

CHAPTER 3 Allocation of deforestation to land-use sectors and primary commodities
48
Table 3-2 Regional deforestation by main sectors, cumulative 1990-2008
1,000 hectares Crop
production Livestock
production Built -up
Industr. Rwd
Natural hazards
Unexplained
Total forest loss
North America 0 0 425 0 4,941 0 5,365 EU27 121 219 84 0 488 283 1,195 Other Europe1 44 23 24 0 2,286 0 2,376 Oceania 133 0 47 0 4,302 11 4,492 North Africa2 379 732 179 0 197 15 1,503 S-S Africa3 24,414 21,567 2,661 442 9,505 14,650 73,239 Central America3 2,663 2,715 446 0 518 5,788 12,129 South America 22,912 28,914 1,395 2,248 5,725 18,010 79,204 South Asia 794 512 1,582 0 1,061 1,052 5,000 East Asia 2,784 2,251 682 0 818 3,418 9,953 Southeast Asia 15,169 1,237 1,337 1,823 10,994 14,310 44,869 WORLD 69,412 58,172 8,862 4,513 40,833 57,536 239,326 Source: FAO, 2010a, FAO, 2011 and own estimates based thereon 1 includes Russia 2 Northern Africa, Western and Central Asia 3 Sub-Saharan Africa 4 Central America & Caribbean
Figure 3-4 Regional deforestation by main sectors, cumulative 1990-2008
0 5 10 15 20 25 30 35 40 45
Northern AmericaEuropean Union
Other EuropeOceania
N. Africa and W. AsiaSub-Saharan Africa
C. America and Carib.South America
South AsiaEast Asia
Southeast Asia
Northern AmericaEuropean Union
Other EuropeOceania
N. Africa and W. AsiaSub-Saharan Africa
C. America and Carib.South America
South AsiaEast Asia
Southeast Asia
2000
-200
819
90-2
000
MhaCrops Livestock Industrial Rwd Built-up Natural hazards Unexplained
Source: FAO, 2010a, FAO, 2011 and own estimates based thereon

CHAPTER 3 Allocation of deforestation to land-use sectors and primary commodities
49
Natural hazards, especially wild fires, appear to be important causes for deforestation in many regions. This includes the occurrence of widespread fires in Southeast Asia in the late 1990s during an abnormally long El Niño dry season when many ‘managed’ fires spread out of control (Page et al., 2002; ADB, 1999; Bouwen, 2000). In North America, Europe, Russia, and Oceania natural hazards are a dominant driver of deforestation.
3.3.3. ATTRIBUTION OF DEFORESTATION TO PRIMARY CROPS
Attribution of deforestation to a particular crop commodity is estimated in proportion to land related to crop-specific area expansion over the period 1990-2008. The allocation takes account of specific requirements of selected perennials18 vis-a-vis the use of “virgin” forests to grow these perennials (see Annex A).
In South America and Southeast Asia cash crops dominate, i.e. soybean, sugarcane and maize in South America, and oil palm paddy rice and rubber in Southeast Asia (Figure 3-5). Sub-Saharan Africa shows the largest deforestation for crops, but counts far less cash crops among this share. In Sub-Saharan Africa and Central America a range of subsistence crops, with maize dominating, caused deforestation. In South Asia the expansion of mainly the paddy rice area and in East Asia the recent increase of potato cultivation and the increases in vegetable growing areas and maize directly or indirectly caused deforestation. Wheat expansion appears a major driver of deforestation in Oceania, North Africa and West and Central Asia, and to some extent in Europe, where fodder crop production is the main driver. However total deforested areas are very small compared to other regions.
Figure 3-5 Contribution of specific crops to deforestation associated with the expansion of cropland between 1990 and 2008, per region
Rudel (2009) finds that human agents driving tropical deforestation have shifted over time. From the 1960s to the 1980s, small-scale farmers, with state assistance, deforested large areas of
18 The selected perennials include: oil palm fruit, natural rubber, coffee, cocoa, tea, banana and plantain.
0 5000 10000 15000 20000 25000
Sub-Saharan Africa
Central America
South America
South & East Asia
Southeast Asia
Rest of World
kha
Soybean Maize Oil Palm Rice, Paddy Sugar cane
Sorghum Groundnut Bean, Dry Cocoa Bean Cassava
Millet Wheat Natural rubber Seed Cotton Other cropsSource: FAO, 2010a, FAO, 2011 and own estimates based thereon

CHAPTER 3 Allocation of deforestation to land-use sectors and primary commodities
50
tropical forest in Southeast Asia and Latin America. As globalization and urbanization increased during the 1980s, the agents of deforestation changed in two important parts of the tropical biome, the lowland rainforests in Brazil and Indonesia. Well-capitalized ranchers, farmers, and loggers producing for consumers in distant markets became more prominent in these places and this globalization weakened the historically strong relationship between local population growth and forest cover. Even in Africa where small-scale farmers predominate, subsistence production, is decreasing while rapid urbanization has increased incentives for farmers to convert forests into fields for crops to sell in urban markets.
Significant production increases during 1990-2008 of the top five agricultural commodities alone caused half of the 69.9 Mha deforestation associated with cropland expansion. Globally, the main crops that contributed directly or indirectly to deforestation include soybeans (19%), maize (11%), oil palm (8%), rice (6%), and sugar cane (5%). Other important subsistence crops that expanded their cultivated areas and have directly or indirectly contributed to deforestation include sorghum (3 Mha deforestation between 1990 and 2008), groundnut (2.4 Mha), dry beans (2.3 Mha), Cassava (1.7 Mha) and Millet (1.7 Mha). Almost 75% of deforestation for crops could be attributed to just 14 crops (Figure 3-6).
The ‘other crops’ group includes a multitude of different crops. The following lists commodities of the ‘other category’, which cover more than 1% of the total area attributed to crop expansion and amount to at least 100 thousand hectares in the particular region (all data cumulative for 1990-2008):
• Sub-Saharan Africa (Total: 24.4 Mha): cow peas (3%), sweet potatoes (3%), sesame seed (3%), bananas (2%), plantains (2%), potatoes (1%), cashew nuts (1%), melonseed (1%)
• South America (Total: 22.9 Mha): cashew nuts (2%), sunflower seed (2%) • Southeast Asia (Total: 15.1 Mha): coffee (4%), coconuts (3%), sesame seed (2%), sunflower
seed (2%), pigeon peas (1%), cashew nuts (1%), bananas (1%) • South & East Asia (Total: 3.4 Mha) : potatoes (11%), vegetables fresh (10%), rapeseed (4%) • Central America: (Total: 2.6 Mha): coffee (8%), sugar cane (7%), fodder crops (5%), oranges
(4%)

CHAPTER 3 Allocation of deforestation to land-use sectors and primary commodities
51
Figure 3-6 Contribution of specific crops to deforestation associated with expansion of crop production, per crop 1990-2008
Natural rubber has been estimated to contribute 1.3 Mha to deforestation, of which 62% and 11% occurred in Indonesia and Thailand respectively. Other important countries include Vietnam (5%), Brazil (5%) and Nigeria (4%).
It should be noted that there is some ambiguity regarding the way natural rubber is treated in the FAO statistics. FAOSTAT reports harvested areas of natural rubber as an agricultural crop. FRA 2010 reports rubber plantations as part of the forest land use. In the FAO land use domain it is unclear whether rubber is included in permanent crops (part of agricultural land) or in forest land. In this study natural rubber is treated as an agricultural crop and it is assumed that the land use statistics include natural rubber in the agricultural land domain. Consistency across different data sources is important from a methodological point of view. For a global study potential errors introduced due to inconsistencies are relatively small for aggregate results. However, individual country results with important rubber plantation areas should be treated with caution. Rubber plantations are concentrated in a few countries in Southeast Asia and Africa. According to FAOSTAT global harvested area increased from 6.5 Mha in 1990 to 9.2 Mha in 2010. Indonesia, Malaysia and Thailand contributed 33%, 21% and 14% respectively of these 2.7 Mha growth. Refer to Annex L for more information on rubber data from FAOSTAT.
→ Focus crops and countries
Soybean
Between 1990 and 2008 some 13 Mha of deforestation can be attributed directly or indirectly to the expansion of soybean production (Figure 3-6). By far the largest deforestation due to soybean
0 5000 10000 15000 20000
SoybeanMaize
Oil PalmRice, PaddySugar cane
SorghumGroundnut
Bean, DryCocoa Bean
CassavaMillet
WheatNatural rubber
Seed CottonOther crops
kha
Sub-Saharan Africa Central America South America
South & East Asia Southeast Asia Rest of WorldSource: FAO, 2010a, FAO, 2011 and own estimates based thereon

CHAPTER 3 Allocation of deforestation to land-use sectors and primary commodities
52
expansion occurred in South America (Figure 3-5): Brazil (65%), followed by Argentina (19%), Paraguay (7%), and Bolivia (6%). The remaining 3% is spread over almost 40 countries throughout the World. Maize
The expansion of cultivated land for maize production is estimated to have caused a deforestation of 7.5 Mha globally spread across more than 70 countries throughout the world. The largest contributions are from Brazil (16%), Tanzania (10%), Zimbabwe (6%), Indonesia (5%), Mexico (5%), Paraguay (5%), and China (5%).
Oil palm
According to FAO data global palm oil harvested area increased between 1990 and 2008 by 8.7 Mha. Of this expansion, 5.5 Mha were associated with deforestation concentrated in Indonesia (57%) and Malaysia (25%). Other important countries include Nigeria (7%), Thailand (2%), and Ghana (2%).. There is uncertainty and debates related to the reported area of palm oil. Any underreporting of palm oil areas would likely also result in underestimation of deforested areas being attributed to palm oil expansion.
Paddy rice
Paddy rice expansion occurred mainly throughout Southeast Asia and Sub-Saharan Africa where it contributed directly or indirectly to an estimated 4.3 Mha of deforestation in more than 20 countries. About one third of deforestation attributed to paddy rice expansion was found in Myanmar and another 19% in Indonesia.
Sugarcane
Sugarcane expansion and deforestation is strongly concentrated in Brazil where 81% of the global 3.3 Mha deforestation attributed to the expansion of sugarcane production are located.
Selected country results
→ Brazil and Indonesia
Between 1990 and 2008 one third of total gross deforestation or 77 Mha was found to occur in just two countries, Brazil and Indonesia. Almost all deforestation (73.4 Mha) in these countries is reported in FRA 2010 as net deforestation. The remaining 3.7 Mha of gross deforestation were masked by afforestation, i.e. conversion of non-forest land to forest land. Neither Brazil nor Indonesia reported natural forest regrowth. Only Indonesia reported afforestation for 1990, 2000 and 2005.
Agricultural expansion is by far the leading proximate cause of tropical deforestation. In next to all cases, agricultural expansion does not operate alone, but in combination with other proximate causes, namely wood extraction and infrastructure extension. Underlying driving forces (or social processes) underpin the more obvious causes of deforestation. They may act directly at the local level, or indirectly from the national or even global level. Main factors include i) economic factors (market growth & commercialization, urbanization and industrialization, poverty); ii) policy and institutional factors (e.g. favourable credits or subsidies for agricultural expansion, liberally granted licenses and logging concessions, land development policies, property rights issues, colonization & transmigration); iii) technological factors (agricultural intensification, use of heavy equipment in

CHAPTER 3 Allocation of deforestation to land-use sectors and primary commodities
53
timber logging); iv) biophysical factors (natural forest fire, easy access to lowland rainforests) and interlinkages of those (Geist & Lambin, 2002). Brazil and Indonesia have both a long history of tropical deforestation. Before 1985, small-scale farmers, with state assistance, deforested large areas of tropical forest in Southeast Asia and Latin America. During the 1980s, the agents of deforestation changed in the lowland rainforests of Brazil and Indonesia. Well-capitalized ranchers, farmers, and loggers producing for consumers in distant markets became more prominent (Rudel, 2009). The following interlinked processes have been reported to contribute to deforestation in Brazil and Indonesia (adapted from Lambert & Geist, 2002). Infrastructure-agriculture: Road network extension causes the expansion of permanently cropped land (for food and cash crops) and pasture for cattle. In Brazil, the Trans-Amazonian highway, an ambitious resettlement-economic development program, is under construction since the 1970s. The current emphasis is on paving at least parts of the highway. In the Amazon, new transportation projects frequently lead to a dramatic rise in illegal deforestation, logging, mining, and hunting activities (Laurence, 2004). Logging-agriculture: Timber sales from commercial logging reduce investments required for conversion of forests to farmland. Culture-Institutions: The concept of forest frontiers – i.e., frontiers that work as escape velvet for the remedy of social conflicts and for the sake of national integration, defense, unity and security – bears manyfold policy and institutional implications reported to be associated with agriculturerelated deforestation in Indonesian Sumatra as well as in the Brazilian Amazon. Economy-Policy/Institutions-Demography: Modern, mechanized cash crop agriculture and timber for export and the related decline of traditional smallholder farming, joblessness and rural poverty operate as push factors of migration to the frontier, sometimes supported by colonization and transmigration programs. In Indonesia the transmigration program, which destroyed large areas of forests, peaked in the early 1980s. However, the Indonesian government still maintains the transmigration program, although on a far smaller scale. Land availability-Migration: Outside the areas affected by deforestation, landlessness or growing land scarcity pushes small, deprived farmers or landless workers to the forest frontier, where land and soils availability for agricultural production is the main pull factor for in-migration.
The following pays special attention to the concentration of deforestation in these countries (Figure 3-7). The EU27 imports significant amounts of soybeans and soy cakes for livestock feed from Brazil and palm oil for food and industry from Indonesia.

CHAPTER 3 Allocation of deforestation to land-use sectors and primary commodities
54
Figure 3-7 Brazilian and Indonesian deforestation by main sectors 1990-2008
Brazil
In Brazil, agricultural expansion is the primary driver of deforestation, namely for 70% over the period 1990-2000 and 83% over the period 2000-2008. Cattle ranching in the Legal Brazilian Amazon19 correlates significantly with deforestation (Cederberg et al., 2010; Morton, 2006; Zaks et al., 2009; Cohn, 2011). Recent Remote sensing-based analysis by Brazil’s National Institute for Space Research (INPE) and the Agricultural Research Corporation (Embrapa) report that 62% of deforestation in the Legal Brazilian Amazon until 2008 is used for cattle grazing and only 5% for large-scale crop production (EMBRAPA/INPE, 2011). One of the reasons why cattle operations are expanding into the Amazon biome is the large-scale conversion of pastures in southern Brazil to cropland (Lapola et al., 2010; Sparovek et al., 2009). Soybean production has been identified as an important driver of deforestation as it induces land settlers (e.g. cattle ranchers and small holders) to advance further into the Amazon forest to open up new land (Fearnside, 2001).
The methodology applied here anticipates each agricultural sub-sector, cropping and ruminant livestock production, to contribute directly and indirectly to deforestation within the agricultural assignment of deforestation in Brazil. Cropland expansion is responsible for about a third of total deforestation in Brazil (Table 3-3).
Analysis of the individual crops contributing directly or indirectly to deforestation highlight the significance of soybean expansion, followed by sugar cane, maize, sorghum, and cashew nuts. More than 50 different crops grown and expanding in production are responsible for the remaining 11% of deforestation attributed to the crop sector (Figure 3-8).
Nearly half of the deforestation has been attributed to the livestock sector. Between 1990 and 2000 reported pasture land expansion was the main factor causing deforestation in Brazil. Although the total amount of reported pasture areas remained fairly constant after 2000, yet, ruminant livestock numbers increased until 2008 by some 20%.
Table 3-3 Attribution of deforestation in Brazil 1990-2008 19 The legal Brazilian Amazon constitutes only a portion of Brazil’s forest area. Brazil counts other important forest areas within the Cerrado, Pantanal, Atlantic Forest, Caatinga and Pampa biomes
0
5
10
15
20
25
30
1990-2000 2000-2008 1990-2000 2000-2008
Brazil Indonesia
mill
ion
hect
ares Unexplained
Natural hazards
Built-up
Industrial Rwd
Livestock
Crops
Source: FAO, 2010a, FAO, 2011 and own estimates based thereon

CHAPTER 3 Allocation of deforestation to land-use sectors and primary commodities
55
1990-2000 2000-20081000 ha % 1000 ha %
Agricultural expansion, of which 20,115 68 18,143 81 Cultivated land expansion & crop production 8,051 27 7,118 32 Pasture expansion & ruminant livestock prod. 12,063 41 11,025 49Industrial roundwood production (logging) 1,059 4 955 4Expansion of urban areas, rural settlements, infrastructure 401 1 306 1Natural hazards (e.g., fire) 1,961 7 1,498 7Unexplained 5,987 20 1,482 7TOTAL deforestation 29,523 100 22,384 100
Source: FAO, 2010a, FAO, 2011 and own estimates based thereon
The unexplained fraction of deforestation in the second period is significantly smaller than in the first period (7% versus 20%) which might point towards a general improvement of deforestation monitoring in Brazil.
Figure 3-8 Crops contribution to deforestation in Brazil, 1990-2008Indonesia
Indonesia reported a very significant drop in the rate of net deforestation in the 2000–2005 period as compared with the 1990s. Although the rate increased again recently, it is still below the high rates during and shortly after the peak of the large-scale transmigration program in the 1980s and early 1990s (FAO, 2010a). This drop is consistent with other recent findings based on the use of remote sensing analysis (Hansen et al., 2009).
Reasons for the significant decline in deforestation rates after 2000 include: i)The El Niño Southern Oscillation (ENSO) event of 1997–1998 led to a prolonged drought and widespread forest fires in Indonesia (Stibig and Malingreau, 2003). This resulted in the loss of an estimated 4 to over 10 Mha according to different sources (FRA 2010b; UNCHS, 2000; Page et al., 2002; ADB & INDPA, 1999); and ii) policies reducing deforestation including a moratorium of forest conversion in 2000, a quota reduction on roundwood production from natural forest in 2002 (FRA 2010b). Annual afforestation rates significantly increased after 2000 (FAO, 2010b). As a result the estimated gross deforestation of 6.1 Mha between 2000 and 2008 exceeds reported net deforestation area by 2 Mha.
Table 3-4 summarizes the attribution of deforestation to main sectors in Indonesia. Over the period before 2000 as much as 43% of deforestation can be attributed to the forest fires following the 1997-1998 drought.
57%17%
8%
4%
3% 2%9%
Total : 15.2 million hectares
Soybeans
Sugar Cane
Maize
Sorghum
Cashew Nuts
Wheat
Other
Source: FAO, 2010a, FAO, 2011 and own estimates based thereon

CHAPTER 3 Allocation of deforestation to land-use sectors and primary commodities
56
The most important contributing factors to fires in Indonesia are weather patterns, previous deforestation, increased human access to forest areas, and an unsettled land tenure system. Land clearing, where fires frequently get out of control, is one the major causes and mainly related to large-scale forest conversion like oil palm plantations. Small-scale agricultural conversion mainly in settlement/transmigration areas, land tenure disputes can be other causes of fires; accidental fires also happen. However, there are no estimations on the actual contribution of the different factors to the loss of forest area. (Harrison et.al, 2009; Suyanto et.al, 2004; Tacconi, 2003; Sargeant, 2001).
In the second period 2000-2008, with significantly lower deforestation rates, the relative importance of the agricultural sector increased due to less natural hazards and a decrease of the category ‘unexplained’.
Table 3-4 Attribution of deforestation in Indonesia 1990-2008
1990-2000 2000-2008 1000 ha % 1000 ha %
Agricultural expansion, of which 3,719 19 3,738 61 Cultivated land expansion & crop production 3,706 19 3,698 60 Pasture expansion & ruminant livestock prod. 13 0 40 1 Industrial roundwood production (logging) 413 1 415 7 Expansion of urban areas, rural settlements, infrastructure 281 2 202 3 Natural hazards (e.g.,. fire) 8,319 43 587 10 Unexplained 6,599 34 1,202 20 TOTAL deforestation 19,332 100 6,145 100
Source: FAO, 2010a, FAO, 2011 and own estimates based thereon
Agricultural expansion is a major source of deforestation. In both periods 1990-2000 and 2000-2008, as much as 3.7 Mha of deforestation was attributed to the expansion of cultivated land and plantations with perennials in Indonesia.
It was estimated that 40% of the deforestation attributed to the crop sector is associated directly or indirectly with oil palm production, followed by rubber and paddy rice (both 11%), and cocoa beans (9%). Other important crops include maize, coconuts, coffee, cashew nuts, and bananas (Figure 3-9).

CHAPTER 3 Allocation of deforestation to land-use sectors and primary commodities
57
Figure 3-9 Crops contribution to deforestation in Indonesia, 1990-2008
Our analysis attributes respectively between 1990 and 2000, and 2000 and 2008, 1,4 and 1,8 Mha deforestation to oil palm expansion.
Remote sensing analysis suggests that our estimates of 3.7 Mha cropland expansion (of which 1.8 Mha attributed to oil palm) causing directly or indirectly deforestation during 2000-2008 may be a rather conservative estimate. Total gross deforestation in Sumatra and Kalimantan alone between 2000 and 2008 was 5.4 Mha (Broich, 2011). Over 95% of oil palm plantations are situated in the easily accessible lowlands of Sumatra and Kalimantan (Bangun, 2006). By 2010 2.3 Mha of peat swamp forests in Indonesia alone were deforested and are currently severely degraded (Koh, 2011).
These different estimates and especially the difference between the remotely sensed data and the reported data have been brought to the attention before by Kamphuis et al. (2011) for Malaysia: “According to the MPOB statistics, Sabah had planted 1.28 Mha of oil palm plantations in 2007, and Sarawak 0.66 Mha. Recent sources indicate however, that the total area of oil palm in Sarawak was some 1.39 Mha in 2007 (Forest Department Sarawak, pers. comm.), which is surprisingly more than twice the figure shown by MPOB.”
For Indonesia data on actual area planted to oil palm is not easily obtained (USDA, 2007). Figures of harvested area range between 4,6 Mha in 2007 (FAOSTAT) and 6,1 Mha for 2005 (Fitzherbert et al., 2008).
This calls for coordination and clear reporting between different administrations. We may assume that the impact from conversion of forests to oil palm plantations is likely higher than the results indicated in this study, not only for Malaysia, but also for Indonesia.
In Indonesia a relatively large share of deforestation, namely 30% and 20% respectively in the first and second period, cannot be explained by the estimated contribution of agricultural expansion, logging prior to agricultural expansion, natural hazards and expansion of built-up areas for urbanisation and infrastructure. Further local analysis is required to understand this ‘unexplained’ fraction.
43%
11%11%
9%
5%
5%
5%
2%2%
7%
Total: 8 million hectaresOil Palm Fruit
Natural Rubber
Rice, Paddy
Cocoa Beans
Maize
Coconuts
Coffee, Green
Cashew Nuts
Bananas
OtherSource: FAO, 2010a, FAO, 2011 and own estimates based thereon

CHAPTER 3 Allocation of deforestation to land-use sectors and primary commodities
58
→ Other focus countries with deforestation and exports to the EU27
Besides Brazil and Indonesia the EU27 imports agricultural commodities from many other countries. The following countries recorded substantial deforestation between 1990 and 2008. A closer look at the deforestation dynamics of these countries can give a better insight into the link between EU27 consumption and deforestation in these countries. They include Argentina, Paraguay, Nigeria and Ghana.
South America: Argentina and Paraguay
In South America Argentina and Paraguay have exported significant amounts of soybeans to the EU27. Figure 3-10 to Figure 3-12 show the deforestation by main sectors in these countries and the crop contribution to deforestation.
Cropland deforestation has been important for both countries throughout the analysed period, though deforestation for livestock raising had a bigger share in Paraguay in the 1990s. For Argentina, this share slightly grew over the period 2000-2008 while cropland deforestation remained constant (Figure 3-10).
Argentina has been subject to major land use changes in the past two decades including net forest area loss of 5.4 Mha from 34.8 Mha in 1990 to 29.4 Mha in 2010.
In the 1990s Argentina shows a lot of unexplained deforestation. This reported deforestation cannot be explained by a conversion into cropland or pastures. It can be noted that ‘other wood land’ (not included in FRA 2010 forest area estimates) amounts to 61 Mha in 2010, an extent twice as big as forests. As stated in the FRA 2010 Remote Sensing Survey, neither the FRA 2010 statistical approach, nor the remote sensing survey “is suited to accurate assessment of tree cover at lower canopy cover densities (e.g. between 10 and 30% canopy cover). This introduces some uncertainty in the accuracy of numbers – particularly in dry regions and for degraded forests.”
Figure 3-10 Deforestation by main sectors in Argentina and Paraguay, 1990-2008
Analysis of the individual crops contributing directly or indirectly to deforestation in Argentina attributes 75% of cropland deforestation to soybean expansion.
0
500
1000
1500
2000
2500
3000
3500
1990-2000 2000-2008 1990-2000 2000-2008
Argentina Paraguay
thou
sand
hec
tare
s
Unexplained
Natural hazards
Built-up
Industrial Rwd
Livestock
Crops
Source: FAO, 2010a, FAO, 2011 and own estimates based thereon

CHAPTER 3 Allocation of deforestation to land-use sectors and primary commodities
59
Figure 3-11 Crops contribution to deforestation in Argentina, 1990-2008
The analysis of the individual crops contributing directly or indirectly to deforestation in Paraguay gives a slightly different picture compared to Argentine cropland deforestation; 60% of cropland deforestation is attributed to soybean expansion (Figure 3-12).
Figure 3-12 Crops contribution to deforestation in Paraguay, 1990-2008
Africa: Nigeria and Ghana
The vast majority of EU27 cocoa is imported from Sub-Saharan Africa including Ghana and Nigeria as countries with significant deforestation since 1990.
In Ghana and Nigeria cropland expansion has been identified as the main driver for deforestation (Figure 3-13).
75%
8%
6%
4%2%
5%
Total: 3.4 million hectares
Soybeans
Wheat
Maize
Sunflower Seed
Barley
Other
60%21%
6%
3%2%
8%
Total: 1.6 million hectares
Soybeans
Maize
Wheat
Sunflower Seed
Sesame Seed
Other
Source: FAO, 2010a, FAO, 2011 and own estimates based thereon
Source: FAO, 2010a, FAO, 2011 and own estimates based thereon

CHAPTER 3 Allocation of deforestation to land-use sectors and primary commodities
60
Figure 3-13 Deforestation by main sectors in Nigeria and Ghana, 1990-2008
In Nigeria deforestation is mainly associated with crops from subsistence agriculture. However some cash crops grown primarily for exports, namely cocoa beans and oil palm fruits, also contributed to deforestation (Figure 3-14).
In Ghana the same cash crops, cocoa and oil palm fruit, contribute more than one third of the 2 Mha deforestation attributed to cropland expansion (Figure 3-15).
Figure 3-14 Crops contribution to deforestation in Nigeria, 1990-2008
0
500
1000
1500
2000
2500
3000
3500
4000
4500
1990-2000 2000-2008 1990-2000 2000-2008
Nigeria Ghana
thou
sand
hec
tare
s
Unexplained
Natural hazards
Built-up
Industrial Rwd
Livestock
Crops
9%
9%
9%
8%
7%
7%7%7%
4%
33%
Total: 5.6 million hectaresGroundnuts in Shell
Yams
Cassava
Cocoa Beans
Sweet Potatoes
Oil Palm Fruit
Cow Peas, Dry
Sorghum
Melonseed
Other
Source: FAO, 2010a, FAO, 2011 and own estimates based thereon
Source: FAO, 2010a, FAO, 2011 and own estimates based thereon

CHAPTER 3 Allocation of deforestation to land-use sectors and primary commodities
61
Figure 3-15 Crops contribution to deforestation in Ghana, 1990-2008
31%
13%
10%7%
7%
5%
5%
3%
2%
17%
Total: 2 million hectaresCocoa Beans
Cassava
Maize
Groundnuts in Shell
Oil Palm Fruit
Yams
Plantains
Pulses nes
Taro (Coco Yam)
OtherSource: FAO, 2010a, FAO, 2011 and own estimates based thereon

CHAPTER 4 Trade analysis of embodied deforestation in agricultural and forestry commodities and the role of the EU27
62
CHAPTER 4 TRADE ANALYSIS OF EMBODIED DEFORESTATION IN AGRICULTURAL AND FORESTRY COMMODITIES AND THE ROLE OF THE EU27
4.1. INTRODUCTION
This chapter analyzes the deforestation embodied in traded agricultural and forestry products and gives an insight into the likely impact of traded mining products. The role of the EU27 in the trade of these products is emphasized. In the preceding chapter, concerning the time period 1990-2008, agricultural and forestry products are found to be most associated with deforestation. These products are tracked between the country of origin, where deforestation occurred, up to the country where they are consumed, including embodied deforestation. This chapter analyses the apparent consumption of embodied deforestation in traded crop, livestock and forestry products for the period 1990-2008. This allows for an identification and quantification of trade flows of agricultural and forestry commodities into the EU27 that are closely associated with deforestation in the country of origin. The trade analysis is based on the concept of apparent consumption because of the limitations of the trade data used. This means that once the products become highly processed and are not recorded anymore as an agricultural or forestry commodity, they are no longer tracked. An analysis up to final consumption based on GTAP sectoral input-output data is provided in the next chapter. Most agricultural and forestry products, however, are imported in their raw primary form, or only moderately processed, to be processed and consumed in the country of import. An overview of the data sources and methodology applied in the LANDFLOW modelling for tracking embodied deforestation in traded agricultural and forestry commodities is described in section 4.2(for details see Annex C). Section 4.3 summarizes results of embodied deforestation in crop and livestock products, with a focus on the EU27. The section on crops includes, a subsection specifically on oil crops. As shown in the preceding chapter, the expansion of soybean and oil palm have been an important driver of deforestation. This is also crucial for international trade of embodied deforestation.
4.2. OVERVIEW OF DATA SOURCES AND METHODS FOR THE ATTRIBUTION OF EMBODIED LAND AND DEFORESTATION TO AGRICULTURAL AND FORESTRY COMMODITIES
In a globalized world with complex supply chains and trade relations, consumption patterns in one country can cause land use changes far away. The LANDFLOW model can track ‘total land’ and ‘deforestation’ embodied in agricultural and forestry products from primary production in the country of origin to final utilization. It accounts for intermediate and joint products along the agricultural and forestry processing chains and records cross-country flows of primary and secondary commodities. The result are database records for supply (production + imports) and utilization (consumption + exports) of each country/region from 1990 to 2008. Variables include i) physical quantities; ii) land areas; and iii) embodied deforestation areas.

CHAPTER 4 Trade analysis of embodied deforestation in agricultural and forestry commodities and the role of the EU27
63
4.2.1. GENERAL LANDFLOW METHODOLOGY
LANDFLOW is an accounting model solving for all commodities a system of linear equations across regions for land content of traded products. It operates worldwide in annual calculation steps between 1990 and 2008 at country level and uses a detailed commodity list for calculations. Results are generated for aggregate commodity groups covering all agricultural activities and allowing a complete land balance of agricultural and forestry production. Commodity group aggregates include i) Crops: total and sub-categories (Cereals; Roots & tubers; Sugar crops; Oil crops; Fruits/Vegetables/Spices; Stimulants; Industrial crops; Fodder crops); ii) Livestock: Ruminants are treated separately from other animals (mainly pigs & poultry); and iii) Forestry: Total and sub-categories industrial roundwood (comprising of ‘Wood products’ and ‘Pulp and Paper’) and wood fuel. In addition, flows of selected important commodities of interest can be traced separately.
LANDFLOW input data are time series country data from different domains of the FAOSTAT online agriculture and forestry databases including primary crop and livestock production, land use data, animal stock numbers, commodity supply and utilization balances of primary and derived products, national commodity trade data, and bilateral commodity trade data by country in physical units and dollar values, production of raw timber materials and wood-based products.
First of all, LANDFLOW allocates physical land areas to primary production of crops and timber by applying country-specific yields for cropland and forest land productivity to the recorded domestic production of individual commodities. Land estimates of the crop sector account for multi-cropping and joint production when allocating individual crop commodities to physical cropland. Pasture land is allocated to ruminant livestock. ‘Deforested’ land is attributed to primary commodities by the sub-module ‘Attribution of deforestation to main sectors and primary commodities’.
Secondly, FAO’s supply utilization accounts for agricultural products and wood balances for forestry are connected to trade matrixes to track physical quantities and embodied land areas from primary production via intermediate products and trade to final utilization (Figure 4-1).
Tracking land in commodities starts with the countries of origin where production takes place. Land areas associated with utilization of crops are estimated by applying country specific yields to domestic production, adding imports (using relevant yields in country of origin) and subtracting exports of individual commodities (using land content of exports based on both domestic production and imports).
In the livestock sector, ruminants (e.g. cattle, sheep, goats, horses) are treated separately from monogastric animals (pigs and poultry). Ruminants rely on pastures, cultivated green fodder and feed from primary crops produced on arable land. Monogastric animals are fed with primary crops or crop by-products. By comparing energy supply from reported feed use with livestock herd energy requirements, it was possible to attribute total feed use of primary crops and crop by-products (e.g. brans or soybean cake) to different livestock categories. Pasture requirements were then estimated to fill any feed energy supply gap of ruminants.
For forestry, an estimation of forest products and associated land areas including trade was made for three sub-sectors: primary sector ‘industrial roundwood and wood fuel’ and two sectors for manufactured forest products: ‘wood and products of wood’ and ‘pulp, paper and paper products’. Land use in the paper sector takes into account recycled paper use and only land area requirements of each year’s roundwood use in paper production is counted.
Annual trade matrices of individual commodities were compiled based on large amounts of time series data of more than ten million recorded bilateral trade flows of agricultural and forestry commodities published in FAOSTAT. For this purpose, countries were grouped into fourteen regional markets. Starting from a trade matrix compiled from the physical commodity flows per

CHAPTER 4 Trade analysis of embodied deforestation in agricultural and forestry commodities and the role of the EU27
64
country reported by the FAO, an iterative procedure was applied for each commodity and year for the period 1990 to 2008 to calculate balanced trade shares and to ensure the full mutual consistency of export and import flows. This means that whatever a country in region i reports as export to region k must also show up as import from region i by a country of region k.
LANDFLOW is able to deal with intermediate uses (livestock feeds being the most important), land content in trade and utilization of joint products (e.g. soybean oil and soybean meal used in different sectors or countries) as well as re-exports of imported raw materials in the form of derived products.
4.2.2. DEFORESTATION ASSOCIATED WITH THE CONSUMPTION OF CROP, LIVESTOCK AND FORESTRY PRODUCTS
The main objective of the LANDFLOW analysis in this study is to track the extents of past deforestation, associated with the apparent consumption of primary and processed agricultural and forestry commodities during the reporting periods 1990-2000 and 2000-2008. The calculations for tracking deforestation from production to final use are based on country data at detailed Supply Utilization Accounts (SUA) commodity level. They follow the logic outlined above for physical land resources associated with agricultural production and utilization, using instead of total cultivated land, pasture land or forest land the extents of embodied deforestation attributed to the crop, livestock and forestry sectors, and consequently to individual cropping sectors in the countries where deforestation occurred. Instead of land use data, information on deforestation previously attributed to sectors and commodities is used as an input for these calculations.
The methodology for estimating the deforestation embodied in the utilization or apparent consumption of agricultural and forestry commodities involves the following assumptions:
• The sum of deforestation areas involved in the national production of various primary crops and livestock products equates to the total extents of reported deforestation attributed to expansion and conversion of cropland and pastures;
• Deforestation intensity (hectares deforestation per volume of production) associated with a primary crop commodity during a given reporting period is calculated as total cumulative production during that period divided by the total extent of deforestation attributed to the crop for that period;
• The sum of deforestation embodied in the national supply (i.e., production plus imports) of a commodity equals the sum of deforestation embodied in the utilization (exports, seed, waste, feed, processing, food, other utilization) of the product;
• Deforestation embodied in different utilization items of a commodity is proportional to the respective consumed volumes; and
• Globally, for the consistency of the accounts, the sum of deforestation embodied in total imports of a particular commodity equals the sum of deforestation embodied in total commodity exports.
For ruminant livestock products, deforestation intensities are also calculated in relation to deforestation attributed to conversion of forests into pastures. Thus, total deforestation embodied in the consumption and trade of these livestock products combines the embodied deforestation due to feed and fodder crops used in raising livestock as well as the deforestation associated with expansion of permanent pastures used for grazing or feeding ruminant livestock.

CHAPTER 4 Trade analysis of embodied deforestation in agricultural and forestry commodities and the role of the EU27
65
Figure 4-1 LANDFLOW methodological scheme for agricultural and forestry commodities
System boundaries
The LANDFLOW model computes extents of deforestation embodied in traded primary and processed agricultural commodities reported by the FAO. FAOSTAT is a wealthy database with accounts of all these commodities. However, once these commodities reach a very advanced processing stage, they may fall outside the domain boundaries of the FAOSTAT system and are thus not traced by FAOSTAT beyond being recorded as ‘other utilization’ (i.e. mainly non-food industrial use). For instance, once animal fats enter the industrial sector to produce cosmetics, or tanned leather from skins and hides are turned into leatherwear or shoes, the trade of respectively cosmetics or shoes is not recorded in the FAOSTAT data and one has to resort to other statistics to model international trade of these products. To overcome this specific problem, the approach of multi-region Input-Output modelling based on monetary trade streams, is used as a complement to the detailed LANDFLOW analysis (see next chapter).A more subtle difference in the two methods used in this study may occur with regard to items recorded in FAOSTAT as (apparent final) food utilization. In multi-region Input-Output modeling a small fraction of a country’s food use may be counted as intermediate consumption, e.g. as input to car manufacturing because enterprises of this economic sector may be running on canteens to feed their labor force. In this case, with each car exported some food and its embodied resources would be recorded as exports as well in the multi-region Input-Output analysis.
See also section 4.3.4 for more details on systems boundaries and its releveance for LANDFLOW modeling results.

CHAPTER 4 Trade analysis of embodied deforestation in agricultural and forestry commodities and the role of the EU27
66
4.3. RESULTS
In the preceding chapter, deforestation was found to occur mainly in three deforestation hotspots: South America, Sub-Saharan Africa and Southeast Asia. Only little deforestation rates were recorded in other world regions. International trade of deforestation embodied in agricultural and wood products is analysed and tracked to apparent consumption and put into perspective to the embodied deforestation of products used in the country or region of deforestation. This allows for an analysis of the importance of consumption in the EU27 and attributed embodied deforestation as compared to other regions. In addition to the results for embodied deforestation, analyses were also performed to calculate total land embodied in traded agricultural and forestry commodities. These results are additional to the main analysis and are presented in Annex F. A separate section discusses the indirect role of international trade of mining products in deforestation.
4.3.1. CONSUMPTION OF EMBODIED DEFORESTATION IN CROP AND LIVESTOCK PRODUCTS
In the following, deforestation embodied in crop and livestock products will be treated. This section allows for a comparison of this trade of embodied deforestation between trading blocks and an assessment of the role of the EU27 in this international trade.
→ Trading blocks and consumption of embodied deforestation
In the preceding chapter, agricultural commodities, i.e. crop and livestock products, were found to embody 127.6 Mha of deforestation during the period 1990-2008. Deforestation caused by agricultural expansion is associated with both domestic consumption and consumption beyond the borders of the country or region where deforestation took place. Part of it is embodied in international trade. Figure 4-2 gives a summary of results for the attribution of cumulated embodied deforestation to crop and livestock products for the period 1990-2008. In the left bar, shown for each region, the diagram indicates the estimated amount of embodied deforestation associated with production and net imported extents associated with the trade of crop and livestock products. This represents the amount of embodied deforestation in a country’s supply of crop and livestock products. The second bar provides a distribution of deforestation embodied in the supply in terms of utilization of crop products (i.e. all domestic crop uses excluding feed, seed and waste), utilization for livestock products, a seed/waste category, to stock changes, and net exported embodied deforestation associated with a region’s agricultural commodity trade. All regions, except for North America, show deforestation embodied in their production of agricultural commodities. The EU27, non-EU Europe and Russia as well as Oceania had relatively little deforestation embodied in the production of agricultural commodities. South America, Sub-Saharan Africa and Southeast Asia show the highest amounts. Note that all dark green bars (deforestation embodied in production) add up to 127.6 Mha, the total global accumulated deforestation for the period 1990-2008.

CHAPTER 4 Trade analysis of embodied deforestation in agricultural and forestry commodities and the role of the EU27
67
Figure 4-2 Cumulative deforestation embodied in supply and utilization of crop and livestock products, 1990-2008
Only the three mentioned deforestation hotspots, and to a small extent Central America, show a net export of deforestation embodied in agricultural commodities. The bars also show that these regions utilized most of the deforestation themselves. Sub-Saharan Africa, due to its smaller trade exposure, exported only 6% of deforestation embodied in agricultural commodities. Southeast Asia and South America have higher trade exposure. Their exported embodied deforestation was 31% and 27 %, respectively. In South America and Sub-Saharan Africa, embodied deforestation was mainly due to consumption of livestock products, especially for cattle grazing. In Southeast Asia most of deforestation is attributed to crop consumption not related to feeding livestock. On the importing side, the EU27 was the main importer of embodied deforestation through the import of agricultural commodities. The net import of deforestation embodied in agricultural commodities into the EU27 was 8.4 Mha. During the same period, the EU27 had a consumption of – in the graph hardly discernable – 0.3 Mha of domestic deforestation embodied in agricultural commodities. The second in line in terms of import of deforestation embodied in agricultural commodities was Eastern Asia (including China and Japan) with 4.5 Mha, mainly over the period 2000-2008 (see further for a disaggregation between the two periods). The sequence is completed by the region North Africa and Western and Central Asia with 3.4 Mha, North America (1.9Mha), South Asia (1.7 Mha), non-EU Europe and Russia (1.6 Mha), and Oceania (less than 0.1 Mha). North America imports less embodied deforestation than the EU27 due to limited imports especially of animal feed. Eastern Asia (including China and Japan) and EU27 have similar levels of embodied deforestation in consumption, but while all of this is imported in the case of EU27, in Eastern Asia about half of the embodied deforestation consumed is produced in the region.
0
10
20
30
40
50
60
NAM EU27 EURR CAM SAM NAWA SAFR SASIA SEASIA EASIA OCE
Defo
rest
atio
n in
cro
p an
d liv
esto
ck p
rodu
cts
(mill
ion
hect
ares
)
1990-2008
Production from StockNet Import Consumption CropsConsumption Livestock Seed+Wasteto Stock Net Export
Source: LANDFLOW calculations based on FAOSTAT 2011

CHAPTER 4 Trade analysis of embodied deforestation in agricultural and forestry commodities and the role of the EU27
68
When focussing on the EU27 and taking into account deforestation in imports and domestic deforestation in production within the EU27 (8.7 Mha), 5.2 Mha were used for the consumption of livestock products (imported or domestically raised livestock products as well as livestock products raised in the EU27 but fed with feed crops with embodied deforestation). 3.4 Mha were used for direct human consumption (food, fibre and fuel together)20. A further, more specific split-up of this use is provided in Figure 4-3b. The 5.2 Mha of deforestation embodied in livestock products consumed in the EU27 is further divided. Most of the deforestation embodied in products utilized in the EU27 was consumed through the consumption of ruminant livestock items, either raised on grazing land (17%) or fed on crops associated with deforestation, like soybean cake (20%). Another 24% was consumed through the consumption of pork and chicken livestock products. When compared with the global consumption of deforestation embodied in crop and livestock products, the typical feeding strategy of developed regions like the EU27 is clearly demonstrated. For the EU27, 44% of deforestation is embodied in feed crops, while for the global total this is only 11%. Deforestation due to the expansion of grazing land is mainly driven by livestock consumption in the country of origin. This kind of deforestation embodied in ruminant livestock products is considerably less traded than deforestation embodied in feed crops.
Figure 4-3 Cumulative embodied deforestation by use category of agricultural products, 1990-2008, left, a) global for 127.6 Mha; and right, b) for EU27 or 8.7 Mha) For comparison, Figure 4-3a highlights cumulative embodied deforestation by use category of agricultural products for the global total of 127.6 Mha. Cumulative over the period 1990 to 2008 we estimate that deforestation embodied in crop and livestock products consumed within the EU27 was about 7% (or 8.7 Mha) of the global total deforestation embodied in consumed crop and livestock products. There are marked differences in the two periods for which embodied deforestation was analyzed. These require some special attention as they give an insight into how the trade of embodied deforestation has evolved over time and how it might possibly evolve further. Figure 4-4 shows both periods separately. Total deforestation embodied in crop and livestock products for the second period is less than in the 1990s, notably for Sub-Saharan Africa and Central America, and somewhat less for South America. 20 Numbers do not add due to rounding.
43%
8%3%
46%
Global total 127.6 Mha
39%
24%20%
17%
EU27 8.7 Mha
Crops for non-feed use -crop products for food, fibre and fuel
Crops for feed (pigs and poultry) - livestock products, pork and chicken
Crops for feed (ruminants) - livestock products, mainly beef
Pastures for grazing (ruminants) - livestock products, mainly beefSource: LANDFLOW calculations based on FAOSTAT 2011

CHAPTER 4 Trade analysis of embodied deforestation in agricultural and forestry commodities and the role of the EU27
69
The deforestation embodied in the EU27 consumption slightly decreased in 2000-2008 compared to 1990-2000, with an average rate of embodied deforestation of 0.507 Mha per year in the 1990s and 0.410 Mha per year during the period 2000-2008. The EU27 share in embodied deforestation in crops and livestock products was 6.8% for the period 1990-2008; it was respectively 7.4% and 6.2% for the sub-periods 1990-2000 and 2000-2008. This is mainly due to lower deforestation rates in the second period, but also due to the growing importance of Eastern Asia as shown in Figure 4-4b. While the region in the 1990s still consumed a considerable amount of deforestation from within the region, this changed over the period 2000-2008. Almost 73% of deforestation embodied in crop and livestock products in the 1990s was from deforestation within the region, while in 2000-2008 this was only 8%. The amount of imported embodied deforestation into the region has also grown in the second period. While the EU27 remained the biggest importer of embodied deforestation, Eastern Asia is about to take over that place.
Important findings: • For the period 1990-2008, we estimate that regional trade of agricultural products
involved about 23% or 29 Mha of a total deforestation of some 127 Mha attributed to agriculture.
• The deforestation caused by the global crop and livestock production in the period 1990-2008 remained for the bigger part within the region of origin. For the three deforestation hotspot regions: South America, Southeast Asia and Sub-Saharan Africa, the traded portion of embodied deforestation in these products was respectively 27%, 31% and 6%; the remainder is associated with consumption within the region.
• The EU27 countries have been the largest ‘net importer’ of deforestation in agricultural products during 1990-2008. Results indicate that after correction for re-exports a net traded amount of 8.4 Mha is connected with the consumption of agricultural products in the EU27 countries. After 2000 the role of East Asia (mainly China) became increasingly important.
• More than half or 61% of the total 8.7 Mha embodied deforestation in imported agricultural products is associated with the livestock sector (mainly imported feed crops); the remaining 39% for non-animal based food, fibre or fuel.

CHAPTER 4 Trade analysis of embodied deforestation in agricultural and forestry commodities and the role of the EU27
70
Figure 4-4 Cumulative deforestation embodied in supply and utilization of crop and livestock products (a, top: 1990-2000; b, bottom: 2000-2008)
0
5
10
15
20
25
30
NAM EU27 EURR CAM SAM NAWA SAFR SASIA SEASIA EASIA OCE
Defo
rest
atio
n in
cro
p an
d liv
esto
ck p
rodu
cts
(mill
ion
hect
ares
)
1990-2000
Production from Stock Net Import
Consumption Crops Consumption Livestock Seed+Waste
to Stock Net Export
0
5
10
15
20
25
30
NAM EU27 EURR CAM SAM NAWA SAFR SASIA SEASIA EASIA OCEDefo
rest
atio
n in
cro
p an
d liv
esto
ck p
rodu
cts
(mill
ion
hect
ares
)
2000-2008Source: LANDFLOW calculations based on FAOSTAT 2011

CHAPTER 4 Trade analysis of embodied deforestation in agricultural and forestry commodities and the role of the EU27
71
→ Traded embodied deforestation between regions
The preceding section examined the total embodied deforestation in crop and livestock products and compared major trading regions with regard to how embodied deforestation was consumed within those regions. It also analyzed whether embodied deforestation was consumed within the region where deforestation took place, imported or exported. It provided information on the major consumers and producers of deforestation, but it did not reveal the exact trade streams between the different regions. Of the total 127.6 Mha deforestation attributed to crops and livestock production, the major part (80%) was consumed within the region where deforestation took place. The remaining part was traded. Table 4-1 shows bilateral trade of embodied deforestation in crop and livestock products. Off-diagonal cells represent the bilateral trade between the regions. Diagonal cells represent trade within the region. Columns per region represent imports of embodied deforestation from other regions and rows represent exports to other regions.
Table 4-1 Deforestation embodied in regionally traded agricultural products (in kha), 1990-2008
Source: LANDFLOW calculations based on FAOSTAT 2011. As summarized in Table 4-1, countries in South America and Southeast Asia have been the most important sources of embodied deforestation. South America, with Brazil and Argentina accounting for about 90% of net exported embodied deforestation from South America, exported almost 14 Mha of embodied deforestation. The main importers here were the EU27, Eastern Asia and the
Nor
th A
mer
ica
EU
27
Oth
er E
urop
e
Cen
tral
Am
eric
a
Sou
th A
mer
ica
Nor
th A
fric
a, W
este
rn a
nd C
entr
al A
sia
Sub
Sah
aran
Afr
ica
Sou
th A
sia
Sou
thea
st A
sia
Eas
t Asia
Oce
ania
TO
TAL
EXPO
RT
EXP
ORT
(e
xcl.
intr
a-re
gion
)
North America 4 0 2 13 0 2 0 0 0 7 0 28 24
EU27 28 768 129 28 13 198 88 12 31 97 4 1,396 628
Other Europe 3 17 15 0 0 11 1 0 0 4 0 51 36
Central America 290 125 27 177 24 29 4 2 1 56 2 737 560
South America 637 5,700 1,077 378 1,852 2,163 505 464 645 2,352 45 15,818 13,966 North Africa, Western and Central Asia 4 20 10 0 0 46 4 11 2 7 1 105 59
Sub Saharan Africa 331 1,638 150 19 43 467 482 150 181 561 12 4,034 3,552
South Asia 3 11 9 0 1 21 11 9 8 4 1 78 69
Southeast Asia 651 1,446 192 76 86 506 302 1,144 349 1,434 94 6,280 5,931
East Asia 4 13 10 1 2 7 3 1 8 38 1 88 50
Oceania 5 4 0 2 0 20 5 4 24 43 2 109 107
TOTAL IMPORT 1,960 9,742 1,621 694 2,021 3,470 1,405 1,797 1,249 4,603 162 28,724 IMPORT (excl. intra-region) 1,956 8,974 1,606 517 169 3,424 923 1,788 900 4,565 160 24,982

CHAPTER 4 Trade analysis of embodied deforestation in agricultural and forestry commodities and the role of the EU27
72
region North Africa, Western and Central Asia. Southeast Asia exported 5.9 Mha of embodied deforestation. Main importers of Southeast Asian embodied deforestation were the EU27, East Asia and South Asia. On the receiving side, the countries of the EU27 have been by far the most important trade destination among the regions listed in the table. The results indicate that crop and livestock products, which were attributed as much as 9 Mha of deforestation, were imported by EU27 countries from outside the region, whereas exports to countries outside the region involved only 0.6 Mha. This means that a net amount of 8.4 Mha was consumed in the EU27 countries. Note that, as mentioned above, this estimate is subject to the boundaries and limitations of the FAOSTAT data system and may not include a small fraction of embodied deforestation associated with re-exports from EU27 (e.g. cosmetics) or with imports into EU27 countries of highly processed agricultural raw materials (e.g. leather handbags imported from China).
→ Traded embodied deforestation and the EU27
Figure 4-5 sketches net flows of deforestation embodied in traded agricultural products of the EU27 countries with countries in different regional markets worldwide. Red arrows show net imported deforestation (embodied in the EU27 trade with a region), blue arrows indicate net exported deforestation (from the EU27 embodied in regionally traded commodities).
Figure 4-5 Net flows of cumulative deforestation embodied in crop and livestock products traded with the EU27 (kha), 1990-2008

CHAPTER 4 Trade analysis of embodied deforestation in agricultural and forestry commodities and the role of the EU27
73
As shown in the figure, the main sources of net imports of embodied deforestation into the EU27 are South America (5.8 Mha), Southeast Asia (1.5 Mha) and Sub-Saharan Africa (1.4 Mha). The EU27 is an important trade partner for both Subsharan Africa and South America for embodied deforestation. This is less the case for the Southeast Asian deforestation hotspot (see the respective lines in Table 4-1). A breakdown of cumulative deforestation embodied in EU27 domestic crop and livestock product use is presented in Figure 4-6. This further breakdown gives a more detailed insight into the supply and processing chains of the different products used in the EU27. For example, it shows that crops used directly as food as well as in food products processed in the EU27 account for one-quarter of cumulative deforestation embodied in EU27 domestic crop and livestock product consumption. The bigger part, some 44% of the total net imported embodied deforestation over the period 1990-2008 is associated with feed uses of crop products (such as soybean cake) to feed EU27 livestock herds for consumption of meat, milk products and eggs. Another 15% of the cumulative embodied deforestation in EU27 domestic use of agricultural products derives from deforestation for pasture expansion in the countries of origin embodied in livestock product imports, 14% in products used for food and 1% used as feed (i.e. deforestation embodied in livestock products used as feed). Other non-food and non-feed industrial crop and livestock product uses account for another 15%. Waste contributes 1%. Hence, the principal contribution to deforestation embodied in EU27 utilization of agricultural products over the period 1990-2008 is the consumption of livestock products (59%), either through the import of feed products or directly through the import of livestock products (mainly meat).
Figure 4-6 Cumulative deforestation embodied in EU27 consumption of crop and livestock products, 1990-2008
→ Embodied deforestation and the relative importance of trade with the EU27
In the preceding sections, crops and livestock products have been looked at as one group of agricultural commodities. Especially for crops, it is also important to have more information on
25%
44%
14%
14%
1%
1%1%
EU27 8.7 Mha
Crops for food
Crops for feed
Crops for other uses (fibre and fuel)
Livestock products for direct EU27 consumptionLivestock products for feeding of livestock productsLivestock products for other uses
Seed and Waste
Source: LANDFLOW calculations based on FAOSTAT 2011
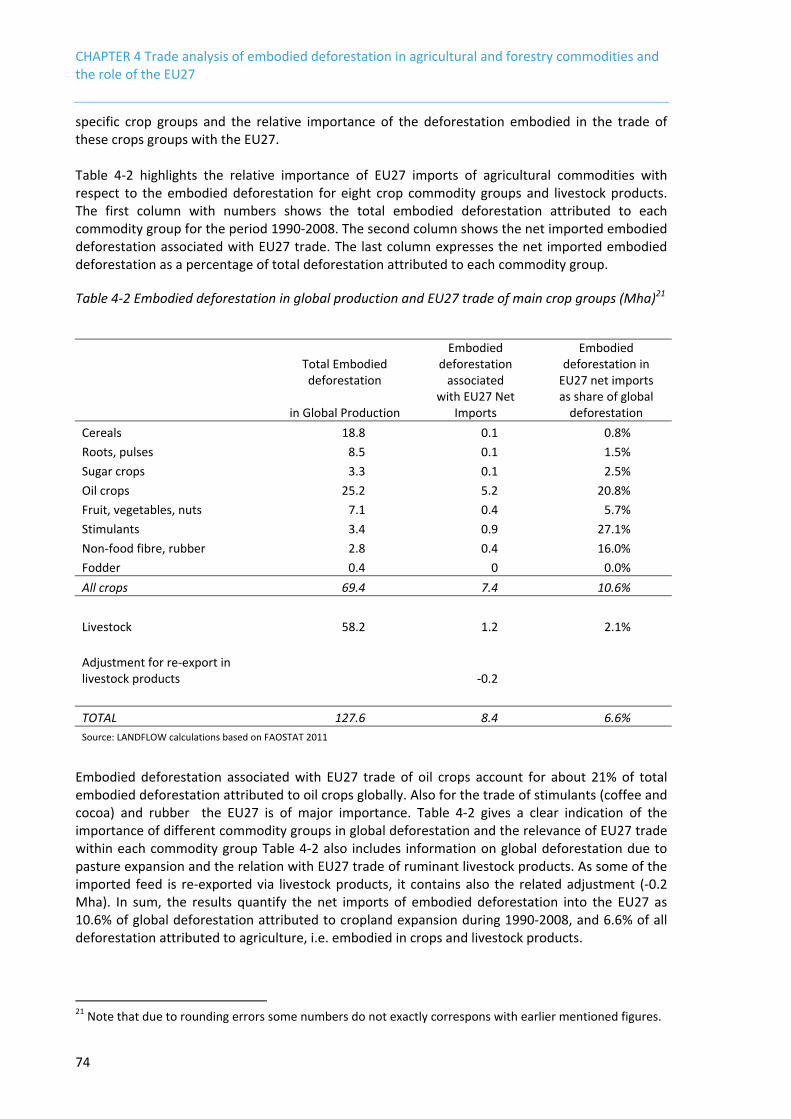
CHAPTER 4 Trade analysis of embodied deforestation in agricultural and forestry commodities and the role of the EU27
74
specific crop groups and the relative importance of the deforestation embodied in the trade of these crops groups with the EU27. Table 4-2 highlights the relative importance of EU27 imports of agricultural commodities with respect to the embodied deforestation for eight crop commodity groups and livestock products. The first column with numbers shows the total embodied deforestation attributed to each commodity group for the period 1990-2008. The second column shows the net imported embodied deforestation associated with EU27 trade. The last column expresses the net imported embodied deforestation as a percentage of total deforestation attributed to each commodity group.
Table 4-2 Embodied deforestation in global production and EU27 trade of main crop groups (Mha)21
Total Embodied deforestation
Embodied deforestation
associated
Embodied deforestation in
EU27 net imports
in Global Production with EU27 Net
Imports as share of global
deforestation Cereals 18.8 0.1 0.8% Roots, pulses 8.5 0.1 1.5% Sugar crops 3.3 0.1 2.5% Oil crops 25.2 5.2 20.8% Fruit, vegetables, nuts 7.1 0.4 5.7% Stimulants 3.4 0.9 27.1% Non-food fibre, rubber 2.8 0.4 16.0% Fodder 0.4 0 0.0% All crops 69.4 7.4 10.6%
Livestock 58.2 1.2 2.1%
Adjustment for re-export in livestock products -0.2 TOTAL 127.6 8.4 6.6% Source: LANDFLOW calculations based on FAOSTAT 2011
Embodied deforestation associated with EU27 trade of oil crops account for about 21% of total embodied deforestation attributed to oil crops globally. Also for the trade of stimulants (coffee and cocoa) and rubber the EU27 is of major importance. Table 4-2 gives a clear indication of the importance of different commodity groups in global deforestation and the relevance of EU27 trade within each commodity group Table 4-2 also includes information on global deforestation due to pasture expansion and the relation with EU27 trade of ruminant livestock products. As some of the imported feed is re-exported via livestock products, it contains also the related adjustment (-0.2 Mha). In sum, the results quantify the net imports of embodied deforestation into the EU27 as 10.6% of global deforestation attributed to cropland expansion during 1990-2008, and 6.6% of all deforestation attributed to agriculture, i.e. embodied in crops and livestock products.
21 Note that due to rounding errors some numbers do not exactly correspons with earlier mentioned figures.

CHAPTER 4 Trade analysis of embodied deforestation in agricultural and forestry commodities and the role of the EU27
75
The following sections will give more detail on traded crops and livestock products separately.
4.3.2. CONSUMPTION OF EMBODIED DEFORESTATION IN CROP PRODUCTS TRADE
The preceding sections treated crop and livestock products in general, without discussing in detail individual. In this section, trade matrices provide information on bilateral trade flows of deforestation embodied in crops between regions, the kind of crops and the importance of certain crops for the EU27. Oil crops are of major importance for the impact of EU27 consumption on deforestation, and will therefore be treated in more detail at the end of the section.
→ Embodied deforestation in international crop trade
Table 4-3 shows a summary of results of the cumulative deforestation for cropland embodied in traded crop products (including food, fuel and feed crops) for the period 1990-2008, aggregated to 11 world regions.
Important findings: • During the period 1990-2008, the EU27 had a net import of about 8.4 Mha of
deforestation embodied in crop and livestock products. • The bigger part of the deforestation embodied in crop and livestock products was
associated with EU27 meat consumption, mainly through feed imports, but also through the direct import of meat products. Almost 25% ofembodied deforestation was due to non-livestock food use, another 15% for non food uses like fibre or fuel.
• The major part originated from South America (5.8 Mha) and Southeast Asia (1.5 Mha). The EU27 was also an important trade partner for African embodied deforestation. Imports from Sub-Saharan Africa involved 1.4 Mha of embodied deforestation.
• The EU27 was an important trade partner for deforestation embodied in stimulants like coffee and cocoa, oil crops and non-food fibre crops and rubber. While oil crops constituted the main crops for traded embodied deforestation, these other crop groups are also fairly important since the major share of deforestation embodied in these crops was imported by the EU27.

CHAPTER 4 Trade analysis of embodied deforestation in agricultural and forestry commodities and the role of the EU27
76
Table 4-3 Cumulative deforestation for cropland embodied in traded crop products (kha), 1990-2008
Source: LANDFLOW calculations based on FAOSTAT 2011.
Table 4-3 gives a clear picture of the volume and significance of regional trade flows in terms of cumulative deforestation embodied in traded crop commodities. For instance, South America has been by far the largest exporter of deforestation embodied in crops, amounting to 12.2 Mha of which 1.4 Mha involve products traded within South America (see the diagonal element). Concerning import, countries of the EU27 have been the main recipients of embodied deforestation attributed to the conversion of cropland in the country of origin, namely an estimated import of 7.5 Mha from outside the EU27 of which 4.8 Mha were imported from South America, 1.4 Mha from Southeast Asia and 1.0 Mha from Sub-Saharan Africa. A relatively small amount of less than 0.2 Mha was re-exported in the form of crop products to other world regions. Other significant importers of embodied deforestation were East Asia, North Africa, West and Central Asia and South Asia. Concerning export, the most important exporters of deforestation embodied in crop products are, apart from South America, the countries of Southeast Asia and Sub-Saharan Africa. Crops are by far the most traded products with embodied deforestation. When comparing Table 4-1 to Table 4-3, it is clear that crop trade embodied 78% of all internationally traded deforestation in agricultural products. When put into perspective to the total deforestation embodied in crop products (including non-traded deforestation embodied in crop products), about 30% or 22.4 Mha
Nor
th A
mer
ica
EU
27
Oth
er E
urop
e
Cen
tral
Am
eric
a
Sou
th A
mer
ica
Nor
th A
fric
a, W
este
rn a
nd C
entr
al A
sia
Sub
Sah
aran
Afr
ica
Sou
th A
sia
Sou
thea
st A
sia
Eas
t Asia
Oce
ania
TO
TAL
EXPO
RT
EXP
ORT
(e
xcl.
intr
a-re
gion
)
North America 0 0 0 0 0 0 0 0 0 0 0 0 0
EU27 1 178 31 3 2 76 28 7 1 11 3 341 163
Other Europe 0 14 1 0 0 3 0 0 0 0 0 18 17
Central America 198 123 26 100 21 25 2 2 1 39 2 539 439
South America 244 4,872 536 233 1,424 1,450 372 455 575 1,985 39 12,185 10,761 North Africa, Western and Central Asia 4 16 6 0 0 32 4 5 2 2 1 72 40
Sub Saharan Africa 322 1,035 129 17 36 349 206 122 177 410 12 2,815 2,609
South Asia 3 11 9 0 1 18 10 9 4 4 1 70 61
Southeast Asia 650 1,435 192 76 86 503 300 1,144 343 1,393 94 6,216 5,873
East Asia 4 10 3 1 2 7 3 1 8 26 1 66 40
Oceania 0 1 0 0 0 17 4 3 18 21 2 66 64
TOTAL IMPORT 1,426 7,695 933 430 1,572 2,480 929 1,748 1,129 3,891 155 22,388 IMPORT (excl. intra-region) 1,426 7,517 932 330 148 2,448 723 1,739 786 3,865 153 20,067

CHAPTER 4 Trade analysis of embodied deforestation in agricultural and forestry commodities and the role of the EU27
77
of embodied deforestation during 1990-2008 entered cross-regional international trade (total deforestation for cropland conversion was 69.4 Mha, see previous chapter). For oil crops, this percentage exceeds 50%, much higher than for other crop groups. As a result, oil crops have played a major role among crops as agents of causing and transmitting embodied deforestation from the country of origin to other regions. As shown in Figure 4-7, almost two-thirds of all global deforestation embodied in traded crops and crop products involved booming oil crops markets. These oil crops are used in the country of destination either directly for food, or as feed for the livestock herd, as well as increasingly for the chemical sector or as feedstock in biofuel production (see further). Other important crop groups are stimulants (11% of total deforestation embodied in trade, mainly cocoa and coffee) and industrial crops (8% of total deforestation embodied in trade, including rubber, fibre crops and tobacco).
Figure 4-7 Distribution of the cumulative deforestation embodied in traded crop commodities, by crop groups, 1990-2008
Figure 4-8 shows the major countries in decreasing order of deforestation embodied in crop products for the period 1990-2008. The graph distinguishes domestically used embodied deforestation in crop products on the one hand and exported embodied deforestation on the other hand. The last category is split-up in export to EU27 and non-EU27 countries. Worldwide, approximately two-third of deforestation embodied in crop production is used domestically in the producing country, one-third is exported. For Brazil, for example, about half of the deforestation embodied in exported crop products was exported to the EU27. Figure 4-9 allows for the same comparisons, but in absolute values. For example, it is clear that the deforestation embodied in domestically consumed crop products in Brazil was almost as high as all the deforestation embodied in crop products in Indonesia for the period 1990-2008. The deforestation embodied in domestically consumed crop products in Indonesia is of the same magnitude as the deforestation embodied in Brazilian crop products exported to the EU27.
5%3%
6%
63%
4%
11%
8%
Traded deforestation, total 22.4 Mha
Cereals
Roots, Pulses
Sugar crops
Oil crops
Fruits, Vegetables
Stimulants
Fibre crops
Source: LANDFLOW calculations based on FAOSTAT 2011

CHAPTER 4 Trade analysis of embodied deforestation in agricultural and forestry commodities and the role of the EU27
78
Figure 4-8 Shares of embodied deforestation in crops for the period 1990-2008 for the top countries with deforestation embodied in crop products in decreasing order (relative values).
Figure 4-9 Shares of embodied deforestation in crops for the period 1990-2008 for the top countries with deforestation embodied in crop products in decreasing order (absolute values).
0%10%20%30%40%50%60%70%80%90%
100%Br
azil
Indo
nesia
Nig
eria
Mya
nmar
Arge
ntin
a
Tanz
ania
Suda
n
Chin
a
Ghan
a
Para
guay
Mal
aysia
Boliv
ia
Ethi
opia
Zim
babw
e
Uga
nda
Mal
awi
Beni
n
Mex
ico
Burk
ina
Faso
Cam
bodi
a
Cam
eroo
n
Viet
Nam
Used domestically Export to EU27 Export to non-EU27
0 5 10 15
BrazilIndonesia
NigeriaMyanmarArgentinaTanzania
SudanChina
GhanaParaguayMalaysia
BoliviaEthiopia
ZimbabweUgandaMalawi
BeninMexico
Burkina FasoCambodiaCameroon
Viet NamPeru
Guatemala
Million hectares
Used domesticallyExport to EU27Export to non-EU27

CHAPTER 4 Trade analysis of embodied deforestation in agricultural and forestry commodities and the role of the EU27
79
→ The EU27 and deforestation embodied in crop products
About 7.4 Mha of embodied deforestation can be associated with EU27 consumption of agricultural products from net imported crops and crop products (seeTable 4-3, imports minus exports). Figure 4-10 summarizes the relative importance of different crop groups contributing to this total. Oil crops and by-products used for feeding, food production and feedstocks for industrial use (e.g. cosmetics, biofuels) contribute about 70% of the embodied deforestation associated with EU27 consumption of crop products. Imported stimulants (coffee, cocoa, tea) were attributed 12%. All other crop groups have minor contributions, together accounting for 18%. The dominant role of oil crops in EU27 imported embodied deforestation can be explained in two ways. First, by the large imports of soybean products mainly from South America (especially Brazil and Argentina, see further), accounting for roughly 82% of deforestation attributed to the import of oil crops into the EU27. Secondly, by palm oil imports from Southeast Asia, which contributed about 17% of deforestation associated with EU27 oil crops imports, imported primarily from Indonesia and Malaysia.
Figure 4-10 Cumulative deforestation embodied in EU27 crop consumption by crop group, 1990-2008
3% 2% 1%
70%
5%
12%
6%
1%EU27 7.4 Mha
Cereals
Roots, Pulses
Sugar crops
Oil crops
Fruits, Vegetables
Stimulants
Industrial crops
Fodder crops
Important findings: • For the period 1990-2008, global net trade of crop products between regions
encompassed 22.4 Mha of embodied deforestation. Almost two thirds (63%) was embodied in traded oil crop products.
• The EU27 imported about 7.4 Mha of deforestation embodied in traded crop products or 33% of total embodied deforestation in international cross-regional trade.
• For trade streams of embodied deforestation in crop products into the EU27, oil crops were most important (70%), followed by stimulants like coffee and cocoa (12%) and by industrial crops including rubber (6%).
Source: LANDFLOW calculations based on FAOSTAT 2011
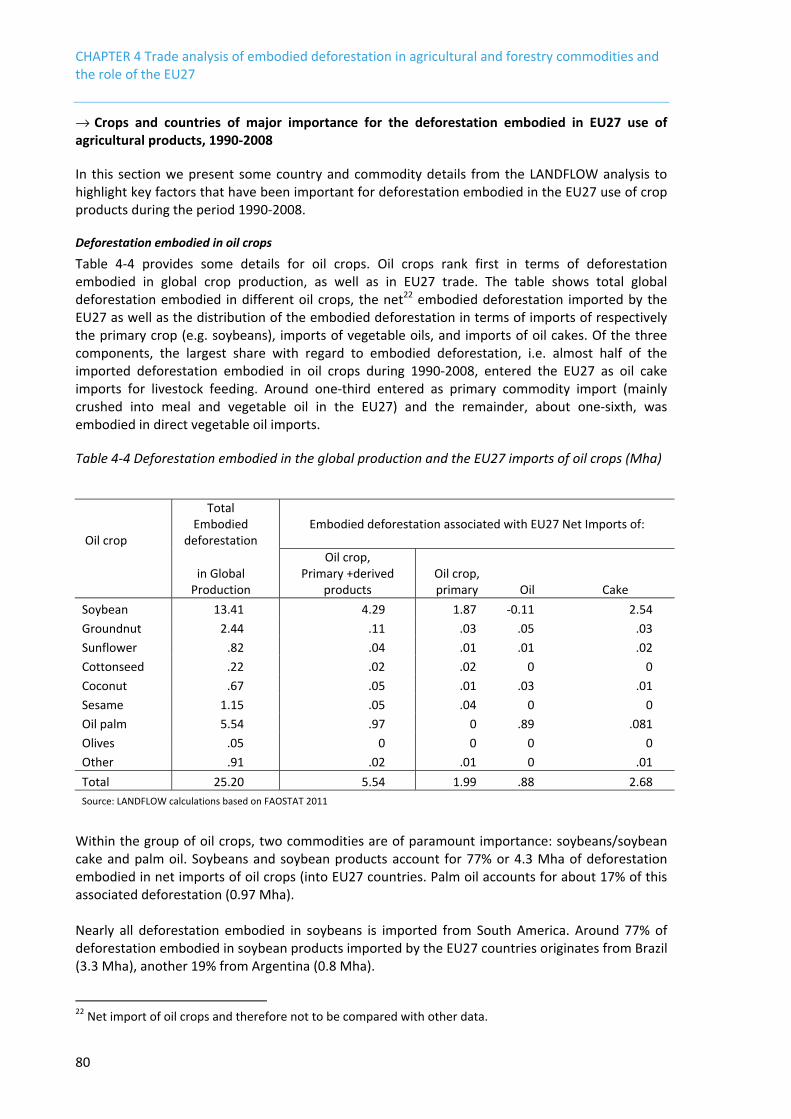
CHAPTER 4 Trade analysis of embodied deforestation in agricultural and forestry commodities and the role of the EU27
80
→ Crops and countries of major importance for the deforestation embodied in EU27 use of agricultural products, 1990-2008
In this section we present some country and commodity details from the LANDFLOW analysis to highlight key factors that have been important for deforestation embodied in the EU27 use of crop products during the period 1990-2008.
Deforestation embodied in oil crops
Table 4-4 provides some details for oil crops. Oil crops rank first in terms of deforestation embodied in global crop production, as well as in EU27 trade. The table shows total global deforestation embodied in different oil crops, the net22 embodied deforestation imported by the EU27 as well as the distribution of the embodied deforestation in terms of imports of respectively the primary crop (e.g. soybeans), imports of vegetable oils, and imports of oil cakes. Of the three components, the largest share with regard to embodied deforestation, i.e. almost half of the imported deforestation embodied in oil crops during 1990-2008, entered the EU27 as oil cake imports for livestock feeding. Around one-third entered as primary commodity import (mainly crushed into meal and vegetable oil in the EU27) and the remainder, about one-sixth, was embodied in direct vegetable oil imports.
Table 4-4 Deforestation embodied in the global production and the EU27 imports of oil crops (Mha)
Oil crop
Total Embodied
deforestation Embodied deforestation associated with EU27 Net Imports of:
in Global Production
Oil crop,Primary +derived
products Oil crop, primary Oil Cake
Soybean 13.41 4.29 1.87 -0.11 2.54 Groundnut 2.44 .11 .03 .05 .03 Sunflower .82 .04 .01 .01 .02 Cottonseed .22 .02 .02 0 0 Coconut .67 .05 .01 .03 .01 Sesame 1.15 .05 .04 0 0 Oil palm 5.54 .97 0 .89 .081 Olives .05 0 0 0 0 Other .91 .02 .01 0 .01 Total 25.20 5.54 1.99 .88 2.68 Source: LANDFLOW calculations based on FAOSTAT 2011
Within the group of oil crops, two commodities are of paramount importance: soybeans/soybean cake and palm oil. Soybeans and soybean products account for 77% or 4.3 Mha of deforestation embodied in net imports of oil crops (into EU27 countries. Palm oil accounts for about 17% of this associated deforestation (0.97 Mha). Nearly all deforestation embodied in soybeans is imported from South America. Around 77% of deforestation embodied in soybean products imported by the EU27 countries originates from Brazil (3.3 Mha), another 19% from Argentina (0.8 Mha).
22 Net import of oil crops and therefore not to be compared with other data.

CHAPTER 4 Trade analysis of embodied deforestation in agricultural and forestry commodities and the role of the EU27
81
The main sources of deforestation embodied in imported palm oil are countries in Southeast Asia. Indonesian exports contribute three-quarters of deforestation embodied in palm oil imported into the EU27 (about 0.7 Mha), nearly all of the remainder originates from Malaysia (about 0.2 Mha). At the end of this section we go deeper into the trends in production and use of oil crops as their use for food, feed and fuel deserves some extra attention, especially regarding the fact that consumption drivers have been changing due to biofuel policies.
Deforestation embodied in stimulants (coffee and cocoa)
Tropical perennial crop commodities (in the group called stimulants) are another source of deforestation associated with EU27 consumption. Also, the EU27 is, compared to other regions, an important importer of deforestation embodied in stimulants. Of the estimated 0.9 Mha deforestation embodied in stimulants imported into the EU27, around 0.6 Mha is attributed to cocoa and 0.3 Mha to coffee. The analysis estimates that around 88% of deforestation embodied in EU27 imports of cocoa comes from Sub-Saharan Africa and about 12% from Southeast Asian countries. The main countries of origin are Ghana, Nigeria, Cameroon and Togo; the main (but relatively less important) source of deforestation embodied in cocoa imports from Southeast Asia was Indonesia. Regarding deforestation embodied in coffee imports to the EU27, about 41% (or 0.14 Mha) originate from Central and South America (mainly Peru, Honduras, Nicaragua and Colombia), some 44% (or 0.15 Mha) from Southeast Asia (e.g., from Indonesia, Vietnam and Laos) and the remaining 15% (or 0.05 Mha) from Sub-Saharan Africa (some deforestation was attributed to stimulants in Kenya, Uganda and Tanzania).
Deforestation embodied in industrial crops (rubber)
Finally, of less importance though, we include also rubber in the discussion of deforestation associated with EU27 imports, an estimated 0.2 Mha. Of this amount, about 80% originate from Southeast Asia (primarily Indonesia) and roughly 20% from Sub-Saharan Africa (mainly Nigeria and Liberia). As pointed out in the previous chapter, reporting of rubber plantations is somewhat ambiguous in FAO statistics where it is listed both under forests (in FRA 2010) as well as among agricultural crops (in FAOSTAT). In this study, the calculation of embodied deforestation in rubber is based on harvested area expansion and production of rubber reported in FAOSTAT. Figure 4-11 shows a ranking of the most important pairs of crop-country of origin combinations that were associated with deforestation embodied in the crop imports of the EU27 during 1990-2008. This ranking is headed by soybean cake and soybeans from Brazil and Argentina, followed by palm oil imported from Indonesia, followed by soybeans from Paraguay. Cocoa, rubber and nuts from different exporting countries are also significantly contributing. About 20% of deforestation embodied in imported crop commodities was associated with other less important crops, each less than 1% of imported embodied deforestation. These crop commodities, in total amounting to 1.5 Mha, are listed in Annex G.

CHAPTER 4 Trade analysis of embodied deforestation in agricultural and forestry commodities and the role of the EU27
82
Figure 4-11 Most important crop commodities and countries of origin for deforestation embodied in crop imports into the EU27 (1990-2008)
23%
18%
9%9%
4%
3%
3%
2%2%
2%2%
1%1%
1%
20%
EU27 Net Imported Deforestation in crops: 7.4 MhaBrazil - Soybean Cake
Brazil - Soybeans
Argentina - Soybean Cake
Indonesia - PalmOil
Paraguay - Soybeans
Ghana - CocoaBeans
Brazil - Nuts
Malaysia - PalmOil
Nigeria - CocoaBeans
Indonesia - Natural Rubber
Argentina - Soybeans
Indonesia - Coffee Green
Cameroon - CocoaBeans
Indonesia - CocoaBeans
OtherSource: LANDFLOW calculations based on FAOSTAT 2011

CHAPTER 4 Trade analysis of embodied deforestation in agricultural and forestry commodities and the role of the EU27
83
→ Trends in production and use of oil crops
The previous section highlighted the outstanding role of oil crops as a key factor of deforestation associated with EU27 consumption. This is mainly due to the fact that these crops can serve many purposes. Their oils are used in the oleochemical and food industry, their protein-rich cakes and meals, and the oils are used in the feed industry, and in recent years the use of vegetable oils as a feedstock in the biofuel industry is expanding. As a consequence, the supply and processing chain of oil crops has become an international jumble of supply and use of co- and by-products between the food, feed, energy and other industrial sectors in the last decade. The trade databases on which the analysis of the use and trade of these oil crops is based, however, do not allow for such clear distinction between all these uses, co- and by-products from a multitude of oil crops. This is especially because of the relatively recent global phenomenon of the increasing use of vegetable oils as a source for biodiesel. Other datasources are thus needed to give an idea on this effect. Note that following figures are on trade and utilization of oil crops and oil crop derivates; they do not necessarily have implications for embodied deforestation as some crops are not directly associated with deforestation (e.g. rapeseed or sunflower), and production of other oil crops (e.g. soybeans and oil palm) do not necessarily imply that they were grown on recently (1990-2008) deforested land.
Important findings: • During 1990-2008 about 7.4 Mha of deforestation associated with EU consumption
stems from imported crops and crop products. Imported oil crops and by-products contributed about 70% of this embodied deforestation associated with EU consumption, imported stimulants (cocoa, coffee, tea) were attributed 12%, industrial crops (rubber, fibre crops, etc.) 6% of total embodied deforestation in imported crop commodities; all other crop groups have minor contributions, together accounting for about 12%.
• Within the group of oil crops, two commodities are of paramount importance, soybeans/soybean cake and palm oil. Soybeans and soybean products account for 80% (4.45 Mha) of deforestation embodied in oil crops (and derived products) imported into EU27 countries. Nearly all soybean deforestation is imported from South America (73% from Brazil, 19% from Argentina). Palm oil accounts for about 16% of the EU27 associated deforestation (0.9 Mha). The main source of deforestation embodied in imported palm oil are countries in Southeast Asia, notably Indonesia.
• Tropical perennial crops were another source of deforestation associated with EU27 consumption. Around 0.6 Mha of embodied deforestation in EU27 imports during 1990-2008 was connected with cocoa (mostly from countries in Sub-Saharan Africa), 0.3 Mha with coffee (various countries in Southeast Asia, Central and South America, and Sub-Saharan highlands), and 0.2 Mha with natural rubber (mainly from Southeast Asia, notably Indonesia).
• For the oil crop group that embodied most of the deforestation imported into the EU27 during the period 1990-2008, almost half of the embodied deforestation entered as oil cakes (soybean cake); one third as the primary oil crop (soybeans); and the remainder as vegetable oil (e.g. palm oil).
• Deforestation imported into the EU27 in 1990-2008 was mainly embodied in the following crop products (in order of importance): soybean cake and soybeans from Brazil and Argentina, palm oil from Indonesia, soybeans from Paraguay, cocoa beans from Ghana, nuts from Brazil (cashew nuts), palm oil from Malaysia, cocoa beans from Nigeria, natural rubber and coffee from Indonesia.

CHAPTER 4 Trade analysis of embodied deforestation in agricultural and forestry commodities and the role of the EU27
84
Vegetable oil production and trade
Vegetable oils are obtained from a variety of oil crops by crushing the seeds or processing the oil fruit into vegetable oil and oilseed cake or meal. Oil crops are either crushed in the country where they are grown and then result in supply chains of the different co- and by-products, or are exported as the raw crop and then crushed in another country for its supply chain. With a worldwide annual production of approximately 134 million tons in 2008, vegetable oils constitute a significant product group with ample applications for different food purposes, as well as oleochemical and energy purposes. Four crops – oil palm, soybeans, rapeseed and sunflower - accounted for nearly 90% of total vegetable oil production in 2008 (Figure 4-12a). Approximately 40% of the annual vegetable oil production is traded, with palm oil contributing nearly two-thirds of all traded vegetable oil. The top five producers of vegetable oil in 2008 were Indonesia (23.0 million tons), Malaysia (19.9 million tons), China (15.5 million tons), EU27 (15.2 million tons), and the USA (10.0 million tons) (Figure 4-12b).
Figure 4-12 Global production of major vegetable oils (totalling 134 million tons), by oil crop (a: left) and by country (b: right) for 2008 (source: USDA FAS)
Indonesia (16.8 million tons) and Malaysia (15.3 million tons) are also the largest exporters of vegetable oils (palm oil), together holding a 60% share of global exports (Figure 4-13a). The largest importer in 2008 was China (9.0 million tons), followed by EU27 (7.9 million tons), and India (5.9 million tons) (Figure 4-13b).
36%
28%
15%
9%
4%
3%3%
2% Oil Palm
Oil Soybean
Oil Rapeseed
Oil Sunflower
Oil Peanut
Oil Cottonseed
Oil Coconut
Oil Olive
17%
15%
12%11%
7%7%
5%
26%
Indonesia
Malaysia
China
EU-27
United States
Argentina
India
Other

CHAPTER 4 Trade analysis of embodied deforestation in agricultural and forestry commodities and the role of the EU27
85
Figure 4-13 Global trade of major vegetable oils, exports totalling 53 million tons (a: left), imports totalling 51 million tons (b: right), 2008 (source: USDA FAS)
Protein meal production and trade
Production and trade of protein meals is dominated by soybeans, contributing, in 2008, two-thirds of a total of 236 million tons produced globally and more than 75% of 72 million tons of traded protein meals. Argentina (28.6 million tons) ranks first among exporters, and EU27 (27.7 million tons) is by far the largest importer. Note that also unprocessed soybeans are imported into the EU27, and are crushed there to produce soymeal (and soybean oil).
Utilization of vegetable oils
The major vegetable oils are mutually substitutable in most of the main uses (Schmidt & Weidema, 2007). As a result, the prices of different vegetable oils are closely interlinked. An increase in the demand for any particular vegetable oil is likely to increase prices for all of them. While utilization of vegetable oils is still primarily for food and feed use, the soaring biodiesel industry is demanding significant amounts of oil; an estimated 10% of global vegetable oil production was used to produce 14.7 billion litres of biodiesel in 2008. Approximately 60% of this production took place in Europe, mostly within the EU27, and from rapeseed oil. In 2008, Germany was the largest biodiesel producer globally. The growing biodiesel industry had a significant impact on the structure of the EU27 oilseed markets in terms of production and trade patterns of oilseeds, vegetable oils and its by-products. The rapidly expanding biodiesel production implied increased use of vegetable oils for industrial purposes23. In recent years, more than 90% of the growth in demand for vegetable oils within the EU27 was due to biofuels. While domestic vegetable oil consumption for food use in the EU27 remained constant over the past few years, amounting to approximately 13 million tons, vegetable oil consumption for industrial use nearly doubled between 2004–05 and 2008–09 (Figure 4-14). The main driver was increased biodiesel production from rapeseed oil, the major biodiesel feedstock, followed by soybean oil (see also Figure 4-15a). Rapeseed oil is domestically produced within the EU27. Soybeans are primarily imported from Brazil and the USA. The soybean oil is either produced within the EU27 from imported soybeans or imported as soybean oil.
23 See http://www.fas.usda.gov/oilseeds/circular/2005/05-10/octcov.pdf
32%
29%13%
4%
3%3%
2%
14%
Indonesia
Malaysia
Argentina
Brazil
Ukraine
Canada
Philippines
Other
17%
15%
11%7%5%3%
3%
39%
China
EU-27
India
United States
Pakistan
Bangladesh
Egypt
Other

CHAPTER 4 Trade analysis of embodied deforestation in agricultural and forestry commodities and the role of the EU27
86
Figure 4-14 Vegetable oil industrial and food use in the EU27 in 2004-2005 and 2008-2009
According to DG AGRI24, oilseed use for fuel was estimated at 9.2 million tons in 2007–2008, one million ton more than in the previous year, and double the amount used in 2004–2005. Thus, about 20% of total oilseed supply25 was used for transport fuels. Apart from converting vegetable oils (almost exclusively rapeseed oil) into biodiesel, a considerable amount of vegetable oils (at least 0.6 Mtoe in 2006) was used directly as fuel in transport (mainly rapeseed oil) and in stationary plants (mainly palm oil).
EU27 oilseed supply
Total EU27 oilseed supply in 2007-2008 was 43 million tons (USDA FAS, 2008). The main contributors were domestic rapeseed and sunflower production (43% and 11% of total supply) and imported soybeans (33%) (Figure 4-15a). About half of the total EU27 oilseed supply was from domestic production with planted areas of 6 Mha of rapeseed and 4 Mha of sunflower. Of this, cropland with energy crops was 4 Mha in 2007. The majority of energy crops was rapeseed. The vast majority of total oilseed supply was crushed (37.2 million tons) into vegetable oils and meals26. Oilseed crushing capacity expanded considerably over recent years in response to the growing vegetable oil demand from the biofuels industry. Besides increased vegetable oil production, the increasing absorption of domestically produced rapeseed oil for biodiesel, and the subsequent gap in EU27 vegetable oil supplies for food products, has also led to increased imports of vegetable oils. Hence, since 2005 the EU27 has moved even for rapeseed oil from being a small net-exporter to a major net-importer27.
EU27 vegetable oil supply
Total EU27 vegetable oil supply in 2007–08 was 23.4 million tons. Of this, nearly two-thirds were derived from domestic mills and one-third from imports (Figure 4-15b). More than half of the EU27
24 DG AGRI 2008 http://ec.europa.eu/agriculture/bioenergy/index_en.htm 25 DG AGRI reports a total oilseed supply of 49.7 million tons for 2007 26 The remaining use of oilseeds was: Exports (0.738 mio. tons), direct food use (0.997 mio.tons) and feed, seed, waste (2.783 mio. tons). 27 Traditional suppliers, Canada and Australia have not been able to keep pace with surging EU demand, particularly in 2007 with the drought in Australia.
0
2
4
6
8
10
12
14
Industrial Use 2004/05
Food Use 2004/05 Industrial Use 2008/09
Food Use 2008/09
mill
ion
tons
Palm oil Rapeseed Soybean Sunflower Other oilsSource: USDA FAS, 2008
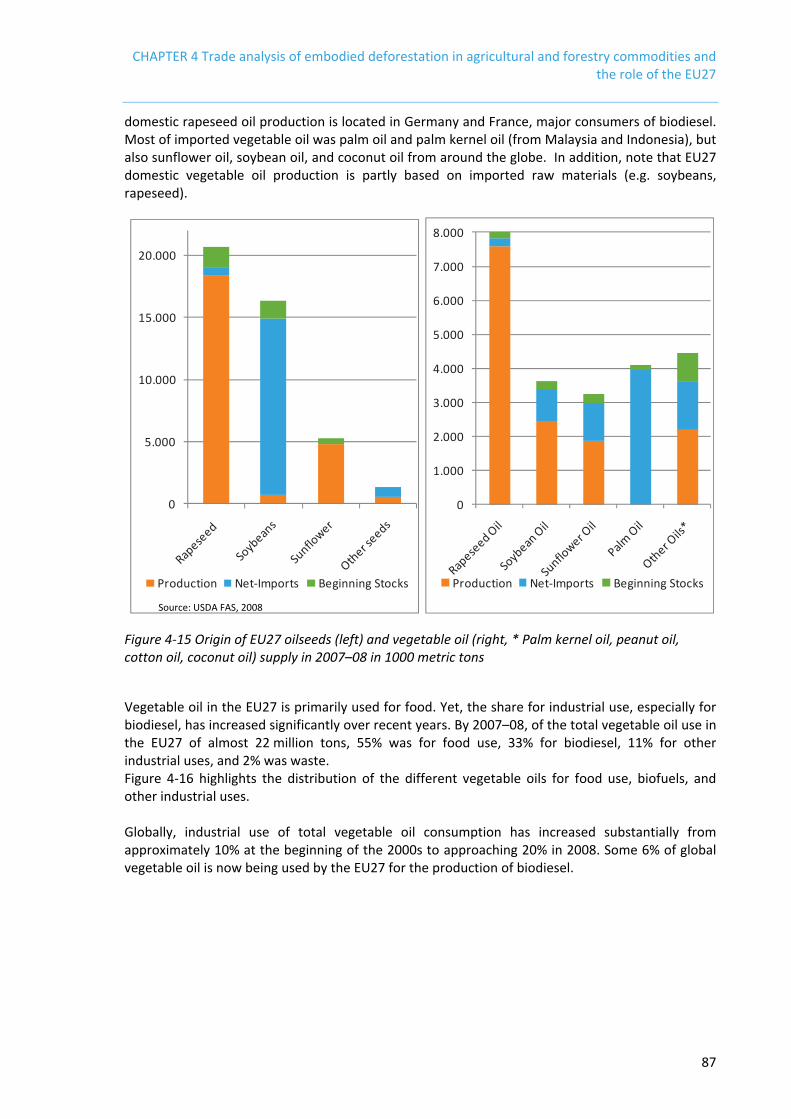
CHAPTER 4 Trade analysis of embodied deforestation in agricultural and forestry commodities and the role of the EU27
87
domestic rapeseed oil production is located in Germany and France, major consumers of biodiesel. Most of imported vegetable oil was palm oil and palm kernel oil (from Malaysia and Indonesia), but also sunflower oil, soybean oil, and coconut oil from around the globe. In addition, note that EU27 domestic vegetable oil production is partly based on imported raw materials (e.g. soybeans, rapeseed).
Figure 4-15 Origin of EU27 oilseeds (left) and vegetable oil (right, * Palm kernel oil, peanut oil, cotton oil, coconut oil) supply in 2007–08 in 1000 metric tons
Vegetable oil in the EU27 is primarily used for food. Yet, the share for industrial use, especially for biodiesel, has increased significantly over recent years. By 2007–08, of the total vegetable oil use in the EU27 of almost 22 million tons, 55% was for food use, 33% for biodiesel, 11% for other industrial uses, and 2% was waste. Figure 4-16 highlights the distribution of the different vegetable oils for food use, biofuels, and other industrial uses. Globally, industrial use of total vegetable oil consumption has increased substantially from approximately 10% at the beginning of the 2000s to approaching 20% in 2008. Some 6% of global vegetable oil is now being used by the EU27 for the production of biodiesel.
0
5.000
10.000
15.000
20.000
Production Net-Imports Beginning Stocks
0
1.000
2.000
3.000
4.000
5.000
6.000
7.000
8.000
Production Net-Imports Beginning Stocks
Source: USDA FAS, 2008

CHAPTER 4 Trade analysis of embodied deforestation in agricultural and forestry commodities and the role of the EU27
88
Figure 4-16 EU27 vegetable oil use in 2007–08
Figure 4-17 compares the trends in food use versus industrial uses for the three major global vegetable oils. In all three cases, the strong impact of biodiesel production on the increase of industrial uses of vegetable oil after 2003 is clearly visible.
Figure 4-17 Worldwide use of most important vegetable oils
Oil palm
Oil palm is the most productive oil crop, with the highest yield of oil per unit area. The area of oil palm plantations more than tripled from 4 Mha in the beginning of the 1980s to 14 Mha in 2008. The vast majority of this increase was concentrated in Malaysia (4.3 Mha28) and Indonesia (6.1 Mha29), together representing more than 80% of the total worldwide production. 28 Malaysian Palm Oil Board. www.mpob.gov.my 29 For Indonesia data on actual area planted to oil palm is not easily obtained (USDA, 2007). Figures of
0
2.000
4.000
6.000
8.000
10.000
12.000
Food Use Biofuels Industrial
1000
MT
Rapeseed Oil Soybean Oil Sunflower Oil Palm Oil Olive oil Coconut oil Other Veg.Oils
Worldwide use of rapeseed oil
0
5000
10000
15000
20000
25000
30000
35000
1995 1997 1999 2001 2003 2005 2007
100
0 t
on
nes
/yea
r
Industrial use
Food Use
Worldwide use of palm oil
0
5000
10000
15000
20000
25000
30000
35000
1995 1997 1999 2001 2003 2005 2007
100
0 t
on
nes
/yea
r
Industrial use
Food Use
Worldwide use of soybean oil
0
5000
10000
15000
20000
25000
30000
35000
1995 1997 1999 2001 2003 2005 2007
100
0 t
on
nes
/yea
r
Industrial use
Food Use
Source: USDA FAS, 2008
Source: USDA FAS, 2008

CHAPTER 4 Trade analysis of embodied deforestation in agricultural and forestry commodities and the role of the EU27
89
Over 70% of global palm oil production, or 31 million tons, was exported around the world, with over 90% originating from Malaysia and Indonesia. Malaysia exports 80–90% of its palm oil, whileIndonesia exports 70% (a figure that sharply increased from around 50% in the 1990s). Current main importing regions are China, India, the EU27, and Pakistan. The strongest import growth occurred in China, where palm oil imports have increased five-fold during 2000-2008. There was also a rapid growth of oil palm imports to EU27 countries, as is shown in Figure 4-18. Being the dominant players in the international market for palm oil, Indonesia and Malaysia accounted for most of the EU27 imports during the entire period 1990-2008.
Figure 4-18 Palm oil imports into the EU27, 1990-2008.
Palm oil's semi-solid properties make it a favourite ingredient among food processors. The oil can be incorporated into a wide variety of food products including cooking oils and margarines. Due to its stability, palm oil is good frying oil. Industrial uses of palm oil include liquid detergents, soaps, waxes, cosmetics, and fuel oil, e.g. for biodiesel production. The global use of palm oil for food has doubled over the past 8 years to 2008. Since 2003, industrial applications have also grown, which may be partly related to increased biodiesel production, and other oleochemical applications. Currently, approximately 20% of palm oil is used for industrial purposes. The use of palm oil for biodiesel production has been rather small compared to other vegetable oils.
Soybean
World soybean production has increased by over 500% during the last 40 years, due to both increased demand for vegetable oil and growing global livestock feed requirements. Similarly, the harvested area has quadrupled to more than 90 Mha. The world’s main producers of soybean are the USA, Brazil, Argentina, China, and India.
harvested area range between 4,6 Mha in 2007 (FAOSTAT) and 6,1 Mha for 2005 (Fitzherbert et al., 2008).
0
1
2
3
4
5
1990 1992 1994 1996 1998 2000 2002 2004 2006 2008
Palm
oil
impo
rts (
mill
ion
tonn
es)
Other
Côte d'Ivoire
Colombia
Papua New Guinea
Malaysia
Indonesia
Source: FAOSTAT, 2011

CHAPTER 4 Trade analysis of embodied deforestation in agricultural and forestry commodities and the role of the EU27
90
Approximately 6% of soybeans are used directly as human food (tofu, soybean milk), mostly in Asia. The bulk (85%) of the world’s soybean crop is processed (via ‘crushing’ or ‘oil mill’ operations) into vegetable oil and meal for livestock feed. The oil component is primarily used for human consumption, although the proportion for industrial use is growing rapidly ( Figure 4-17). Industrial uses include production of fatty acids, soaps, varnish, or lacquer, but the recent increase in growth of industrial uses is due to biodiesel production based on soybean oil, especially in the USA and Argentina. In 2008–09, biodiesel production accounted for as much as 25%, or around 4.4 million tons, of total soybean oil usage in the USA, Argentina, Brazil, and the EU27 (ISTA Mielke GmbH, Nov. 2008). Although much of the soybean area expansion to date has been for the production of concentrated feeds for livestock, increasing demand for biodiesel adds further momentum. In the United States of America biodiesel production soared after 2005 and reached 1.7 billion litres in 2007. While soybeans are not an efficient crop for the production of biodiesel, due to their comparatively low oil content, their common use in the USA for food and feed products has led to soybean oil becoming the primary source for USA biodiesel. Soybean producers have lobbied to increase awareness of soybean biodiesel, expanding the market for their product. Argentina promotes soybean biodiesel aimed exclusively at the export market. Soybean imports into the EU27 were initially dominated by the USA. During the last decade, Brazil has substantially been gaining market shares, which has reduced EU27 soybean imports from the USA. The dynamics of soybean imports into EU27 is shown in Figure 4-19.
Figure 4-19 Soybean imports into the EU27, 1990-2008
A large volume of soybean cake is imported by EU27 countries as protein source for livestock production. As shown in Figure 4-20, soybean cake is almost exclusively brought to the EU27 from only two countries, Brazil and increasingly Argentina. Due to substantial deforestation being associated with the expansion of soybean production in South America, this has contributed greatly to deforestation embodied in EU27 consumption.
0
2
4
6
8
10
12
14
16
18
1990 1992 1994 1996 1998 2000 2002 2004 2006 2008
Soyb
ean
impo
rts
(mill
ion
tonn
es)
Other
Canada
Paraguay
Argentina
Brazil
USA
Source: FAOSTAT, 2011

CHAPTER 4 Trade analysis of embodied deforestation in agricultural and forestry commodities and the role of the EU27
91
Table 4-5 highlights the important role EU27 plays in international trade of soybeans and soybean products, in particular soybean cake. For the period 1990-2008, EU27 imports accounted for about 60% of soybean exports (both soybeans and soybean products) from Brazil, for about half of the soybean exports from Argentina and more than 20% of US soybean exports. According to the bilateral trade data compiled from FAOSTAT, the EU27 imported over the period 1990-2008 almost 40% of all traded soybean products. Around three quarters of EU27 soybean imports (both beans and soybean products) originated from South America.
Figure 4-20 Soybean cake imports into the EU27, 1990-2008
Table 4-5 Total exports of soybeans and soybean products (million tons), 1990-2008
To EU27 To Non-EU27 EU27-share
Brazil 273 171 61%
Argentina 168 185 48%
USA 126 418 23%
Paraguay 14 32 30%
Canada 7 12 39%
Other 11 114 9%
World Total 599 932 39%
Source: FAOSTAT, 2011 The EU27 has been a large importer of soybeans and soybean cake with embodied deforestation from South America. The EU27 has imported more deforestation embodied in soybeans than any
0
5
10
15
20
25
1990 1992 1994 1996 1998 2000 2002 2004 2006 2008
Cake
of s
oybe
an im
port
s (m
illio
n to
nnes
)
Other
USA
Argentina
Brazil
Source: FAOSTAT, 2011

CHAPTER 4 Trade analysis of embodied deforestation in agricultural and forestry commodities and the role of the EU27
92
other region. Figure 4-21 explains why. Soybeans were found to be associated with around 20% (or 13 Mha) of total deforestation embodied in crop production over the period 1990-2008. Four countries account for 97% of this 13 Mha, namely Brazil (66%), Argentina (18%), Paraguay (7%) and Bolivia (6%). All four countries export a big share of their soybean production (70% and more). On the receiving side, the figure shows the imports of three groups, EU27, China, and all other countries (termed Rest of World). For the period 1990-2008, there are marked differences among these three groups of countries. While EU27 imported about the same amount of soybean products as Rest of World, the source of EU27 imports has been predominantly Brazil and Argentina, notably for soybean cake. Imports of Rest of World originated predominantly from USA. In the case of China, imports of soybeans during 1990-2008 were comparable to the imports of EU27, but China imported very little in terms of soybean cake. In addition, about half of China’s soybean related imports originated from the USA. These factors taken together – large imports of soybeans and soybean cake, dominantly from Brazil and Argentina – explain why EU27 consumption has been associated with a large fraction of deforestation embodied in soybean products.
Figure 4-21 Total imports of soybean related commodities between 1990-2008 per importing region, specifically for the EU27, China and the Rest of the World.
The evolution of vegetable oil use in the EU27 during the last years
This short section highlights very recent changes in the use of vegetable oils within the EU27 during last decade due to biofuel policies. As the analysis of final consumption (see next chapter) is based upon detailed data of sectoral input-output relationships in 2004 (the most recent year that allows for such a detailed analysis of the global economy), these changes need to be considered to qualify the results.
0
50
100
150
200
250
300
350
Soybeans Cake Other prod.
Soybeans Cake Other prod.
Soybeans Cake Other prod.
Imported by EU27 by China by Rest of World
Mill
ion
tons
Total imports of soybean related commodities , 1990-2008
Other
USA
Bolivia
Paraguay
Argentina
Brazil
Country of origin:

CHAPTER 4 Trade analysis of embodied deforestation in agricultural and forestry commodities and the role of the EU27
93
Figure 4-22 shows how the EU27 consumption of vegetable oils by both the non-food industry and the food industry evolvedin recent years. The use of vegetable oils by the food industry has remained constant, while the use by the non-food industry nearly doubled from 2004-2005 to 2008-2009 and nearly tripled by 2010-2011 to a level almost as high as vegetable oil use by the food industry.
Figure 4-22 Evolution of the consumption of vegetable oils in the EU27 between 2004 and 2011
Figure 4-23 indicates the specific vegetable oils used in the two subsectors shown in Figure 4-22.
Figure 4-23 Evolution of the consumption of specific vegetable oils by the non-food sector (left) and the food sector(right) in the EU27
0
5000
10000
15000
20000
25000
30000
1000
met
ric to
ns
industrial consumption
food consumption
source: USDA, FAS
0
2000
4000
6000
8000
10000
12000
1000
met
ric to
ns
02000400060008000
100001200014000
1000
met
ric to
ns
palm oil rapeseed oil
soybean oil sunflower oil
other vegetable oil source: USDA, FAS

CHAPTER 4 Trade analysis of embodied deforestation in agricultural and forestry commodities and the role of the EU27
94
The booming use of vegetable oils by the non-food industry has been mainly due to rising rapeseed oil consumption, but also palm oil and soybean oil use have been increasing. Palm oil used in 2008-2009 was already double the amount used by the sector in 2004-2005. Soybean oil use more than doubled by 2008-2009 and more than tripled by 2010-2011. In the food sector the consumption and distribution of different vegetable oils stayed quite stable.
4.3.3. CONSUMPTION OF EMBODIED DEFORESTATION IN LIVESTOCK PRODUCTS TRADE
The analysis of embodied deforestation in the international trade of livestock products must account for embodied deforestation in feed crops as well as pastures. A portion of the deforestation embodied in crop commodities is used as feed, either in the country of origin, or in the country of destination of traded feed crops. This feeding of crops results in deforestation being embodied in the respective livestock products, which are then either domestically consumed in these countries, or re-exported, together with the embodied deforestation, to other countries. These trade streams contain all kinds of livestock products from poultry and pork to ruminant livestock products, such as beef, dairy products and hides. Another important deforestation driver has been expansion of pasture for ruminant livestock grazing. In the following, international trade streams of embodied deforestation in livestock products are shown in regional trade matrices (similar toTable 4-3 for crop production) separately for deforestation attributed to pasture expansion (Table 4-6) and embodied in feed crops (Table 4-7).
→ deforestation embodied in traded livestock products due to deforestation for ruminant livestock grazing
Table 4-6 shows deforestation embodied in international trade of livestock products due to raising ruminant livestock (in the countries where deforestation occurs) on land converted to pastures.
Important findings: • The non-food (mainly biofuel) sector consumption of vegetable oil in the EU27 has
grown considerably in recent years. Though based primarily on rapeseed oil (without embodied deforestation), the issue of indirect land use changes (iluc), such as soybean and palm oil triggering production elsewhere, in relation to biofuel production is heavily debated.
• The diverse crop group of oil crops is widely utilized for food, feed, fuel and other industrial products and extensively traded as primary and processed commodities.
• While utilization of vegetable oils still primarily occurs in the food sector, utilization for biodiesel production has been increasing in the recent decade.
• The imports of soybeans and soybean cake from South America has been a decisive factor for the amount of embodied deforestation in EU27 consumption between 1990 and 2008.
• The high substitutability of vegetable oils from different feedstocks and growing regions can result in rapid shifts of embodied deforestation among economic sectors.

CHAPTER 4 Trade analysis of embodied deforestation in agricultural and forestry commodities and the role of the EU27
95
Table 4-6 Cumulative deforestation for pastures embodied in traded livestock products (1000 ha), 1990-2008
Source: LANDFLOW calculations based on FAOSTAT 2011.
As may be expected, countries in South America are the most significant source of deforestation embodied in traded ruminant livestock products. Livestock product net exports from South American countries embodied 2.7 Mha of a total cumulated deforestation between 1990-2008 due to pasture expansion for ruminant livestock grazing of 28.9 Mha (see CHAPTER 3). Hence, while there is a quite significant component of deforestation embodied in ruminant livestock production, according to the available data a large fraction, about 90% of deforestation embodied in livestock products is consumed within the region of origin and only 10% entered cross-regional trade. Most important consuming regions of the traded part of this embodied deforestation were the EU27 followed by the region North Africa, Western and Central Asia, Other Europe and Russia, and North America.
EU27 import of embodied deforestation due to pasture expansion
The EU27 import from outside the region during 1990-2008 amounts to 1.3 Mha of embodied deforestation in ruminant livestock products out of a global total of 4 Mha, i.e. more than one-
Nor
th A
mer
ica
EU
27
Oth
er E
urop
e
Cen
tral
Am
eric
a
Sou
th A
mer
ica
Nor
th A
fric
a, W
este
rn a
nd C
entr
al A
sia
Sub
Sah
aran
Afr
ica
Sou
th A
sia
Sou
thea
st A
sia
Eas
t Asia
Oce
ania
TO
TAL
EXPO
RT
EXP
ORT
(e
xcl.
intr
a-re
gion
)
North America 4 0 2 12 0 2 0 0 0 6 0 26 22
EU27 11 154 23 9 5 46 19 2 11 13 0 293 139
Other Europe 2 2 11 0 0 7 1 0 0 3 0 26 15
Central America 87 2 1 72 3 4 2 0 0 16 0 187 115
South America 387 754 450 127 382 589 89 8 62 253 4 3,105 2,723 North Africa, Western and Central Asia 0 2 3 0 0 8 0 5 0 3 0 21 13
Sub Saharan Africa 9 579 20 2 7 112 263 26 4 136 0 1,158 895
South Asia 0 0 0 0 0 3 1 0 4 0 0 8 8
Southeast Asia 1 2 0 0 0 1 0 0 2 15 0 21 19
East Asia 0 2 6 0 0 0 0 0 0 7 0 15 8
Oceania 0 0 0 0 0 0 0 0 0 1 0 1 1
TOTAL IMPORT 501 1,497 516 222 397 772 375 41 83 453 4 4,861 IMPORT (excl. intra-region) 497 1,343 505 150 15 764 112 41 81 446 4 3,958

CHAPTER 4 Trade analysis of embodied deforestation in agricultural and forestry commodities and the role of the EU27
96
quarter of this amount was imported by the EU27. A fraction (0.14 Mha) of the imported embodied deforestation was re-exported in livestock products to other regions. About 1.2 Mha of deforestation during 1990-2008 was thus embodied in the EU27 net imports of ruminant livestock products due to expansion of pasture areas in the respective countries of origin. Some two-thirds of this imported deforestation originate from South America (in order of importance: Brazil, Argentina and Uruguay), and one-third originated in relatively small extents from various countries in Sub-Saharan Africa (including South Africa, Namibia, Botswana and Zimbabwe).
→ deforestation embodied in traded livestock products due to deforestation embodied in feed crops
Overall, global cross-regional trade of livestock products for the period 1990-2008 involved only 0.96 Mha of embodied deforestation for cropland in the countries from where these products originate, much less than is involved in the trade of crop commodities (Table 4-7).
Table 4-7 Cumulative deforestation due to feed crop production embodied in traded livestock products (1000 ha), 1990-2008
Source: LANDFLOW calculations based on FAOSTAT 2011.
Most of the deforestation embodied in feed crops is thus consumed in the region where livestock is raised and livestock products fed on these crops were consumed. Compared to other regions, South America and the EU27, as important livestock producing regions, had the highest export of
Nor
th A
mer
ica
EU
27
Oth
er E
urop
e
Cen
tral
Am
eric
a
Sou
th A
mer
ica
Nor
th A
fric
a, W
este
rn a
nd C
entr
al A
sia
Sub
Sah
aran
Afr
ica
Sou
th A
sia
Sou
thea
st A
sia
Eas
t Asia
Oce
ania
TO
TAL
EXPO
RT
EXP
ORT
(e
xcl.
intr
a-re
gion
)
North America 0 0 0 1 0 0 0 0 0 1 0 2 2
EU27 16 436 75 16 6 76 41 3 19 73 1 762 326
Other Europe 1 1 3 0 0 1 0 0 0 1 0 7 4
Central America 5 0 0 5 0 0 0 0 0 1 0 11 6
South America 6 74 91 18 46 124 44 1 8 114 2 528 482 North Africa, Western and Central Asia 0 2 1 0 0 6 0 1 0 2 0 12 6
Sub Saharan Africa 0 24 1 0 0 6 13 2 0 15 0 61 48
South Asia 0 0 0 0 0 0 0 0 0 0 0 0 0
Southeast Asia 0 9 0 0 0 2 2 0 4 26 0 43 39
East Asia 0 1 1 0 0 0 0 0 0 5 0 7 2
Oceania 5 3 0 2 0 3 1 1 6 21 0 42 42
TOTAL IMPORT 33 550 172 42 52 218 101 8 37 259 3 1,475 IMPORT (excl. intra-region) 33 114 169 37 6 212 88 8 33 254 3 957

CHAPTER 4 Trade analysis of embodied deforestation in agricultural and forestry commodities and the role of the EU27
97
embodied deforestation in livestock products. For South America this is due to domestic deforestation embodied in feed crops, and for the EU27 mainly due to embodied deforestation in imported feed crops. The latter mainly due to the import of oil crops as pointed out earlier.
EU27
As the EU27 has been importing large amounts of crop commodities for feeding livestock and is a net exporter of livestock products it has also been a small net exporter of deforestation of some 0.2 Mha via its livestock exports (0.326 – 0.114 Mha inTable 4-7). In this case the net export of deforestation embodied in livestock products from the EU27 represents a re-export of deforestation associated with imported crop feeds.
4.3.4. LANDFLOW SCOPE AND SYSTEM BOUNDARIES
The system boundaries of LANDFLOW analysis are set by the primary products and their reported processing and supply chain as provided by the FAO agricultural and forestry statistical data (see also Annex C and D). FAO’s agricultural Supply Utilization Accounts (SUA) or Commodity Balances constitute the most comprehensive and internationally harmonized accounts, tracking agricultural commodities from production to processing until (apparent) final utilization. The SUAs report various utilization categories, namely the use as
i) Food (in raw form and derived products, e.g. all wheat utilized in a country as food for human consumption in its diverse processing stages, such as flour, bread, noodles, etc. expressed in wheat equivalent);
ii) Feed (SUA feed commodities are listed in Annex C); iii) Processing (i.e. input to derived processed products, for which utilization is recorded as
a separate commodity; e.g. soybean cake), iv) Seed and Waste (waste refers to losses between recorded production and households;
i.e. storage and transportation, household wastes are not included); v) ‘Other utilization’ (discussed in detail below).
The latter comprises non-food/non-feed industrial products manufactured from agricultural raw materials. The FAO trade and SUA statistics do not report trade and final utilization of these highly processed ‘Other utilization’ items. Examples include garments from cotton fabrics, soap from vegetable oil, ethanol from sugar cane, leather from hides and skins, or pet food from offals. Due to these domain boundaries of the FAOSTAT database, trade of highly processed goods and hence ultimate final uses of agricultural raw materials reported under the utilization category ‘Other utilization’ are tracked up to the stage of industrial utilization but cannot be tracked with the SUA system to their final use. These products are therefore beyond the LANDFLOW system boundaries. Although such higher value products may be traded, LANDFLOW attributes the embodied land use
Important findings: • About 5 Mha of deforestation was embodied in the global trade of livestock products
over the period 1990-2008. This represents about 1/5 of deforestation embodied in the trade of agricultural products for the same period. Major exporters of embodied deforestation in ruminant livestock products were South America and Subsaharan Africa. The EU27 imported around one-third of these products.
• Due to its net export position in livestock products, the EU27 has re-exported some of deforestation embodied in feed crops to other regions (mainly North Africa, Western and Central Asia and Other Europe).

CHAPTER 4 Trade analysis of embodied deforestation in agricultural and forestry commodities and the role of the EU27
98
or the deforestation associated with the utilization of those commodities to the country where industrial processing is recorded, e.g. where cotton was utilized for shirt production. LANDFLOW analysis cannot account for cases when shirts are traded (i.e. in this example, LANDFLOW analysis cannot attribute deforestation embodied in cotton to the country where the shirts are purchased by the consumers; instead any embodied deforestation is attributed to the country where shirt production takes place. Table 4-8 indicates that the attribution of deforestation based on LANDFLOW analysis is fairly robust for six out of eight crop groups, namely cereals, roots and pulses, sugar crops, fruits/vegetables/nuts, stimulants and fodder crops. For these commodities the share of embodied deforestation associated with ‘other utilization’ is relatively low (below 13%). Also only 8% or 4.8 Mha of the embodied deforestation in ruminant livestock products is associated with ‘Other utilization’ (e.g. leather). For non-food fibre and rubber products all primary production is processed by industry. In this case LANDFLOW analysis tracks the trade of raw materials (65% of total production) to the destination of industrial use but cannot track the trade and final use of these industrial products (e.g. when Germany imports rubber for tire production the deforestation consequently embodied in the rubber tires is not accounted for when these tires are traded). Note, however, that only 4% or 2.8 Mha of deforestation embodied in crops are attributed to this category. For oil crops, 5 Mha or one fifth of the attributed deforestation is associated with the use in non-food/non-feed industrial products (e.g. soaps, cosmetics, biofuel, etc.). Although a large share of these products is consumed in the region/country of industrial processing, the data system boundaries of the LANDFLOW analysis result in some uncertainty of the attributed deforestation to final uses for these two product groups.
Table 4-8 Embodied deforestation in global production, trade and ‘Other utilization’ of main crop groups
Embodied deforestation in
global production (Mha)
Embodied deforestation
associated with international trade
(%)
Embodied deforestation
associated with ‘Other utilization’
(%) Cereals 18.8 6 3.4 Roots, pulses 8.5 9 5.8 Sugar crops 3.3 40 13.1 Oil crops 25.2 56 20.0 Fruit, vegetables, nuts 7.1 14 0.2 Stimulants 3.4 71 7.8 Non-food fibre, rubber 2.8 65 100.0 Fodder 0.4 0 0 All crops 69.4 32 13.9 Pasture (ruminant livestock) 57.7 8 8.3 TOTAL 127.1 22 11.4 Source: LANDFLOW calculations based on FAOSTAT 2011

CHAPTER 4 Trade analysis of embodied deforestation in agricultural and forestry commodities and the role of the EU27
99
4.3.5. CONSUMPTION OF EMBODIED DEFORESTATION IN WOOD PRODUCTS
In the preceding chapter deforestation embodied in wood products from logging preceding deforestation was estimated at 4.5 Mha for the period 1990-2008. This embodied deforestation in wood products is low compared to the impact of the agricultural sector. Figure 4-24 shows a summary of results for the attribution of cumulated deforestation to industrial roundwood for the period 1990-2008. In the left bar shown for each region, the diagram indicates the estimated amount of deforestation associated with domestic roundwood production and the net deforestation associated with imports of wood and wood-based products. This bar represents the amount of deforestation embodied in a region’s supply of forest products. The second bar provides a distribution of the deforestation embodied in a region’s supply in terms of roundwood and related wood products, and the net deforestation embodied in a region’s wood and wood product exports.
Important findings: • The uncertainty (due to data system limitations for tracking highly processed
industrial commodities) of attributing embodied deforestation in crop and livestock products using the LANDFLOW apparent consumption analysis is estimated to be less than 11%. The estimate would materialize only if all industrial products with embodied deforestation were traded and consumed outside the country/region of industrial production.
• This limitation is most relevant for the group of non-food fibre and rubber products, where all raw materials are processed into industrial goods. Note, however, that non-food fibre and rubber products are associated only with 2% of total deforestation embodied in agricultural products.
• Oil crops, an important crop group regarding embodied deforestation and with a high share of traded commodities, are somewhat affected by this limitation (with 20% of oil crops in ‘Other utilization’). Information in preceding sections suggests, however, that for the EU27 this limitation is less relevant since deforestation embodied in palm oil and soybean oil imported to the EU27 and further processed into industrial products in the EU27 is also mostly consumed in the EU27. For the major part of imported embodied deforestation with oil crop products, apparent consumption is therefore a close approximation of final consumption as re-exports are very limited.

CHAPTER 4 Trade analysis of embodied deforestation in agricultural and forestry commodities and the role of the EU27
100
Figure 4-24 Cumulative deforestation embodied in the regional supply and utilization of wood and paper products (1990-2008)
About 25% or 1.10 Mha of the embodied deforestation in wood products entered international trade, mainly from Southeast Asia (0.70 Mha) and South America (0.40 Mha). For Sub-Saharan Africa most embodied deforestation was consumed within the country where deforestation took place. Globally, wood products like sawn wood, panels and residues embodied the major part of deforestation, compared to pulp and paper. The most important region importing deforestation embodied in wood products was East Asia with more than half of the overall trade. The EU27 and North America follow.
EU27
The EU27 imports of deforestation associated with wood and wood-based products (from countries outside the region) amounts to only 0.2 Mha, which is rather small compared to deforestation embodied in EU27 net imports of agricultural products. One-sixth (17%) of this amount is then re-exported to other regions, mainly after processing, as paper products and sawn wood. Regarding EU27 imports, about two-thirds of the imported deforestation comes from South America, the remainder in about equal amounts from countries in Southeast Asia and in Sub-Saharan Africa. Figure 4-25 shows that traded volumes and associated embodied deforestation entered the EU27 in raw and various processed forms. 12% of total imports were imported as primary (‘in the rough’) roundwood (of which one-third is from Brazil, about half from Sub-Saharan Africa, with Cameroon and Madagascar accounting for 80% of it, and 15% from Southeast Asia of which a large share was from Myanmar). 16% of deforestation embodied in exports to the EU27 was associated with sawn wood (of which almost half is from South America, dominated by Brazil and some imports from Bolivia; 30% is from countries in Southeast Asia, mainly Malaysia, Myanmar and Indonesia; and 23% were exported to EU27 from Sub-Saharan African countries such as Cameroon and Madagascar). Deforestation embodied in wood panels and fibreboards contributed 19% of the total (of which about half came from South America, mainly Brazil, the other half from Southeast
0,0
0,5
1,0
1,5
2,0
2,5
NAM EU27 EURR CAM SAM NAWA SAFR SASIA SEASIA EASIA OCE
Defo
rest
atio
n an
d U
tiliza
tion
of W
ood
prod
ucts
(mill
ion
hect
ares
)
1990 - 2008
Production Net Import Wood products Pulp + Paper Net ExportSource: LANDFLOW calculations based on FAOSTAT 2011

CHAPTER 4 Trade analysis of embodied deforestation in agricultural and forestry commodities and the role of the EU27
101
Asia, largely from Indonesia). The largest share of embodied deforestation entered the EU27 as imported wood pulp (45%; of which about 80% is from Brazil, and about 14% from Indonesia). Only a small fraction (8%) relates to other wood-based products such as chips and particles, or wood residues. Whereas the assessed extents of deforestation embodied in EU27 imports were about the same in 1990-2000 and for 2000-2008, the structure, as shown in Figure 4-25 for the entire period, has changed notably. It is interesting to note that the share of embodied deforestation entering the EU27 as primary wood (‘in the rough’) decreased about fourfold (from 19% for 1990-2000 to some 5% for 2000-2008 due to roundwood export limitations and higher processing in the countries of origin in the second period), the share traded as sawn wood decreased slightly and the share traded as wood panels remained about the same as for the average. The share attributed to trade of wood pulp increased during 2000-2008 to more than 50%.30
Figure 4-25 Cumulative deforestation embodied in EU27 imports of wood-based products, by main sub-sectors, (1990-2008)
Figure 4-26 shows a ranking of the most important countries that were associated with (albeit small) deforestation extents embodied in the imports of wood-based products to EU27 during 1990-2008. This ranking is clearly headed by products imported from Brazil and Indonesia, followed by a few Sub-Saharan countries such as Cameroon and Madagascar. A further breakdown of the ‘other’ category is given in Annex H.
30 Note that in this study the quantified deforestation associated with trade of wood products is based on the reported traded volumes (converted to CUM equivalent) and an average national deforestation intensity in industrial roundwood calculated with the amount of deforestation attributed to total industrial roundwood production of a country. Currently available international data do not permit to attribute deforestation to specific tree species in order to differentiate deforestation according to wood sources of different sub-sectors.
12%
16%
19%45%
8%
Roundwood (WIR)Sawn woodPanels and FibreboardsWood pulpOther
Source: LANDFLOW calculations based on FAOSTAT 2011

CHAPTER 4 Trade analysis of embodied deforestation in agricultural and forestry commodities and the role of the EU27
102
Figure 4-26 Most important countries of origin for embodied deforestation associated with the imports of EU27 (1990-2008)
As mentioned in the previous chapter, we follow the advice of the project’s Expert Workshop (held in Brussels on 20 October, 2011), which recommended to label any residual extents of deforestation remaining after the attribution to either agriculture, built-up conversion, or natural hazards such as fires, as ‘unexplained deforestation’ rather than attributing it to the forest sector on the basis of highly uncertain factors, which are sometimes noted but in general not quantifiable with available data, such as unsustainable wood extraction or illegal logging. This is one of the reasons why the deforestation attributed to wood products is quite small and may underestimate the impacts of the sector.
48%
9%
5%
5%
4%
3%
2%
2%2%
2%
2%2%
1%
1% 12%
EU27 Imported Deforestation: 0.2 Mha
BrazilIndonesiaCameroonArgentinaMalaysiaCote d'IvoireGabonUruguayRest of SEAPhilippinesChileGhanaChinaCongo, Rep.Other
LANDFLOW results based on FAOSTAT
Important findings: • Deforestation embodied in traded wood products is estimated to be considerably
smaller than deforestation in traded agricultural commodities. Of some 1.1 Mha deforestation embodied in traded wood products, only 0.24 Mha were imported by the EU27. About 17% of this was re-exported to other regions as paper products and sawn wood. East Asia was the biggest importer of deforestation embodied in wood products.
• Although total amounts of embodied deforestation are small, it should be noted that highly manufactured wood products (e.g. furniture) are subject to similar data system domain boundaries as discussed for agricultural commodities. Asian countries have become major wood manufacturing countries. This may have resulted in re-export of deforestation embodied in highly manufactured wood products to other regions.

CHAPTER 4 Trade analysis of embodied deforestation in agricultural and forestry commodities and the role of the EU27
103
4.3.6. MINING AND DEFORESTATION
Mining operations may cause deforestation, though this has not been included in our main analysis. It is likely that the relative direct contribution to deforestation from mining activities will be small and local. For example, it has been estimated that 4500 km2 (0,45Mha) of forests would need to be deforested to explore all known exploitable mineral deposits in Amazonia (Smith et al., 1995). This is approximately 1/4 of the average annual deforestation rate in the Brazilian Amazon in 1992-2007 (INPE, 2010). Another recent study assessed the accumulated deforestation in the Legal Amazon up to 2007 at 707.752.350 ha of which 730.680 ha or 0,1% of deforestation was for mineral extraction (EMBRAPA & INPE, 2011). When only the very narrow definition of deforestation is used (crown cover removal) the main effect of mining is the clearing of forests for infrastructure such as roads, construction camps and the mining site itself. The crown cover removal for such infrastructure is, compared to deforestation for the agricultural and forestry sectors, relatively small, but especially roads may open areas for deforestation (Geist and Lambin, 2001). Its main contribution is, therefore, indirectly by opening untouched forests, sparking forest intrusion and conversion of forests to agricultural and built-up land. In addition, after mining is completed the ground may be left bare making it difficult for forests to recover (Peterson and Heemskerk, 2001). Therefore, goods and services requiring production inputs from countries known to have substantial deforestation rates and a growing mining sector may indirectly contribute to deforestation. To give an indication of the potential role of EU27 consumption in countries where there may be deforestation associated with mining, we give a brief overview of the trade flows from these countries to the EU27. Geist and Lambin (2001) analysed the three key drivers of deforestation; agricultural expansion, wood extraction and infrastructure expansion. Within these broad categories, they have analysed several sub categories; e.g. forest to pasture conversion and mining activities. They concluded that multiple contributing factors lead to deforestation, but particularly agricultural expansion in combination with other factors. In 146 of 152 cases studied (96%) the expansion of crop land and pasture was the leading proximate cause of tropical deforestation. In contrast, just 16% of the cases were associated with mining, hydropower development and/or oil exploration, with large regional variations. Thus, while mining is important, the data suggests that it is a relatively small driver. Based on previous analyses (Geist and Lambin, 2001) we considered trade of oil (extraction of crude petroleum and natural gas), coal (mining and agglomeration of hard coal, lignite and peat) and minerals (mining of metal ores, uranium, gems, and other mining and quarrying activities) from specific countries to the EU27 in 2007 (Figure 4-27 based on TSTRADE and GTAP data). The selection of countries was made based upon trade streams with the EU27, forest cover and deforestation. Hydropower related operations are not included in this analysis, although they might cause deforestation on a local scale. This is more often found in Asian cases than elsewhere (e.g. Malaysian Borneo, Indonesia, Vietnam and Thailand) (Geist and Lambin, 2001). In the figure and Table 4-9 the share of exports from the selected countries to a 10 region aggregation of the world is shown. Oil traded from countries in South America (Colombia, Peru and Ecuador) are mostly exported to North America, South and Central America, or East Asia. Less than 1% is exported from the individual countries to the EU27. China extracts and consumes significant amounts of coal from mining (to produce a variety of products and services), but less than 2% of the export is traded to the EU27. However, a more significant share of coal associated to deforestation may be embodied in other products exported to the EU27. The relative share of

CHAPTER 4 Trade analysis of embodied deforestation in agricultural and forestry commodities and the role of the EU27
104
mineral exports to the EU27 is larger, with Brazil (26%) and Indonesia (20%) being the largest contributors (Figure 4-27). We cannot easily attribute deforestation to these sectors because their main contribution is the fact that they unlock untouched forests, while it results in agricultural land use. Though the effect cannot be neglected. Brazil is an important source of iron and aluminium ores and concentrates for the EU27. Indonesia for copper ores and concentrates, gold ores and concentrates of other precious metals. It should be considered that most of EU27 imports of fossil fuels and mining ores are being sourced either in countries with very low forest cover or in countries that don’t report deforestation trends. Most of the coal is imported from South Africa, Australia and the Russian Federation; most of the oil comes from Norway, the Russian Federation and North Africa; mining ores are mainly sourced from South Africa, Botswana and Brazil (the only country among the ones mentioned which reports substantive deforestation).
Table 4-9 Share of mining exports from forested countries to the EU27 (2007).
Activity Region Country Share of exports to E27 Fossil oil South and Central America Colombia
Ecuador Peru
0,86% 0,21% 0,02%
Fossil coal East Asia China 1,93% Minerals South East Asia Indonesia
Philippines Thailand
19,50% 0,19% 5,36%
South and Central America Brazil 26,19% This study focuses on deforestation, so the other effects of mining in forested environments on the state of the forest, rivers and groundwater which can eventually degrade the forest and result in deforestation have not been assessed. Literature on these effects of mining is far more extensive than literature and empirical research on deforestation by mining. Rare earth elements are gaining importance as many modern technologies like smart phones and electric cars depend heavily on these resources. In the future, sourcing of these elements might constitute an additional indirect driver to deforestation. To date, rare earth elements are mainly exported from China, but they are also available in other forested countries like Brazil.

CHAPTER 4 Trade analysis of embodied deforestation in agricultural and forestry commodities and the role of the EU27
105
Figure 4-27 Share of mining exports from ‘deforestation countries’ into the EU27 in 2007

CHAPTER 4 Trade analysis of embodied deforestation in agricultural and forestry commodities and the role of the EU27
106
4.4. CONCLUSIONS/SUMMARY
The past two decades have been marked by an increasing globalization of trade in agricultural commodities, wood products and mining products. The three sectors have been important drivers for deforestation, though the latter two more indirectly as commercial wood extraction and mining also often unlock untapped forest resources for agricultural expansion. Agriculture has been a major driving force of deforestation during the analyzed period of 1990 to 2008. More than half of total gross deforestation, or 127 Mha, can be attributed to the increasing land demand for agriculture and has thus been treated/interpreted as deforestation embodied in agricultural products. Agricultural expansion comprises two main sub-sectors, namely cropland expansion accounting for 69 Mha of attributed deforestation (55% of total embodied deforestation attributed to agricultural production) and pasture expansion (58 Mha, a share of 45%). Agricultural land expansion has been the dominant driving force of deforestation in South America, Sub-Saharan Africa and Southeast Asia. Together, these three regions account for 90% of all deforestation associated with agriculture. In Sub-Saharan Africa and South America, both livestock and cropping have contributed to deforestation; in agricultural expansion in Southeast Asia the impact of ruminant livestock has been very small and most impacts were related to cropland expansion and agriculture plantation crops. At the global level, the model-based calculations suggest that 57% of deforestation embodied in agricultural products during 1990-2008 concerns feed uses (feed crops and pastures) and 43% non-feed uses of crops. Some 8% can be attributed to feeding pigs and poultry. The remainder, nearly half (49%) of the total, is attributed to ruminant livestock production due to forest conversion for expansion of pastures and cropland (feed crops and crop by-products used as feeds). Over the past two decades, trade volumes of agricultural commodities have increased substantially with annual increase rates between two and four percent depending on commodity. The agricultural sector today is characterized by substantial cross-country flows of primary and processed agricultural products. The findings in this chapter on international trade of agricultural commodities and their link with deforestation, and the role of the EU27 can be summarized as follows:
• For the period 1990-2008, we estimate that about 29 Mha of deforestation was embodied
in regionally traded agricultural products of a total deforestation of some 127 Mha
Important findings: • In this study, no deforestation was attributed to the mining sector, as deforestation
caused by the mining sector is mainly limited to clearing for infrastructure, which is a small extent compared to land needed for agricultural expansion.
• However, the infrastructure development for mining has unlocked remote forest areas and incentivized further clearing of these forests for agricultural and forestry purposes.
• The EU27 sources considerable amounts of minerals from densely forested countries with high historic deforestation rates like Brazil and Indonesia. The unlocking of forest areas through road building for mining operations cannot be neglected as a driver of deforestation (Geist and Lambin, 2001).
CHAPTER 4 Trade analysis of embodied deforestation in agricultural and forestry commodities and the role of the EU27
107
attributed to agriculture. Countries in South America (notably Brazil and Argentina accounting for more than 90 percent of ‘exported’ embodied deforestation from South America) and in Southeast Asia (e.g. Indonesia) have been the most important agents of deforestation embodied in international trade of agricultural products.
• Deforestation caused by agricultural expansion remained for the bigger part within the region of origin. For the three deforestation hotspot regions South America, Southeast Asia and Sub-Saharan Africa, the traded portion of embodied deforestation in these products was respectively 27%, 31% and 6%. More than three-quarters of global deforestation embodied in agricultural products remained within the region of origin, i.e., the agricultural products were consumed or utilized in the region where production (and deforestation) occurred.
• The EU27 had the largest imports of crop and livestock products associated with deforestation, though the role of East Asia (mainly China) became increasingly important during the 2000’s.
• During 1990-2008 the EU27 imported about 9 Mha of deforestation embodied in crop and livestock products.
• The bigger part of the deforestation embodied in crop and livestock products was associated with the EU27 meat consumption, mainly through feed imports, but also through the direct import of meat products. Almost 25% of the embodied deforestation was due to non-livestock food use, another 15% to non food uses like fibre or fuel. The major part originated from South America (5.8 Mha) and Souteast Asia supplied 1.5 Mha. The EU27 was an important trade partner for African embodied deforestation. Sub-Saharan Africa supplied 1.4 Mha of embodied deforestation. Imports from Sub-Saharan Africa supplied involved 1.4 Mha of embodied deforestation.
• Some 30% of deforestation due to expansion of cropland during 1990-2008 or 22.4 Mha entered cross-regional international trade. For oil crops this percentage exceeds 50%, much higher than for other crop groups. As a result, oil crop products (mostly soybeans and palm oil) have played an outstanding role among crops as agents of causing and transmitting deforestation to other regions. Almost two-thirds of all deforestation embodied in traded crop products has involved the booming oil crops markets.
• About 7.4 Mha of deforestation embodied in EU27 consumption stems from imported crops and crop products. Oil crops and by-products contributed to about 70% of this deforestation (for cropland) associated with EU27 consumption, imported stimulants (cocoa, coffee, tea) were attributed 12%, industrial crops (rubber, fibre crops, etc.) 6%, and all other crop groups have minor contributions, together accounting for about 12%.
• The EU27 was an important trade partner for deforestation embodied in stimulants like coffee and cocoa, oil crops and rubber.
• Within the group of oil crops, two commodities are of paramount importance, soybeans/soybean cake and palm oil. Soybeans and soybean products account for 80% (4.45 Mha) of deforestation embodied in oil crops (and derived products) imported into EU27 countries, palm oil accounts for about 16% of this associated deforestation (0.9 Mha).
• For the oil crop group which embodied most of deforestation imported into the EU27 during 1990-2008, almost half of the embodied deforestation entered as oil cakes, one third as primary crop (e.g. soybeans), and the remainder as vegetable oil. The import of soybean cake from South America has been of paramount importance for the imports of embodied deforestation into the EU27. Around 73% of deforestation embodied in soybean products imported by EU27 countries originates from Brazil, another 19% from Argentina.
• The main sources of deforestation embodied in traded palm oil are countries in Southeast Asia. Indonesia contributes three-quarters of deforestation embodied in palm oil imported into EU27 (about 0.7 Mha).

CHAPTER 4 Trade analysis of embodied deforestation in agricultural and forestry commodities and the role of the EU27
108
• An estimated 0.6 Mha of imported embodied deforestation during 1990-2008 was associated with cocoa (mostly from countries in Sub-Saharan Africa), 0.3 Mha with coffee (various countries in Southeast Asia, Central and South America, and Sub-Saharan highlands), and with 0.2 Mha with natural rubber (mainly from Southeast Asia, notably Indonesia).
• Deforestation imported into the EU27 in 1990-2008 was mainly embodied in the following crop products (in order of importance): soybean cake and soybeans from Brazil and Argentina, palm oil from Indonesia, soybeans from Paraguay, cocoa beans from Ghana, nuts from Brazil (cashew nuts), palm oil from Malaysia, cocoa beans from Nigeria, natural rubber and coffee from Indonesia.
• About 5 Mha of deforestation was embodied in the trade of livestock products over the period 1990-2008. This represents 1/5 of deforestation embodied in the trade of agricultural products for the same period. Major exporters of embodied deforestation in ruminant livestock products were South America and Sub-Saharan Africa. The EU27 imported around one-third of these products.
• Due to its net export position in livestock products, the EU27 has re-exported some of the deforestation embodied in feed crops to other regions (mainly North Africa, Western and Central Asia and Other Europe). About 1.2 Mha of deforestation imported into the EU27 during 1990-2008 was embodied in the imports of ruminant livestock products due to expansion of pasture areas in the respective countries of origin. Some two-thirds of this ‘imported’ deforestation originate from South America (in order of importance: Brazil, Argentina, Uruguay), and one-third originated in relatively small extents from various countries in Sub-Saharan Africa.
• Deforestation embodied in traded wood products is estimated to be considerably smaller than deforestation in traded agricultural commodities. Of some 1.1 Mha deforestation embodied in l traded wood products, only 0.2 Mha were imported by the EU27. About 17% of that was re-exported to other regions as paper products and sawn wood.
• In this study, no embodied deforestation was attributed to the mining sector as deforestation caused by the mining sector is mainly limited to clearing for infrastructure, which is a small extent compared to land needed for agricultural expansion. However, the infrastructure development for mining has unlocked remote forest areas and incentivized further clearing of these forests for agricultural and forestry purposes.The EU27 sources considerable amounts of minerals from densely forested countries with high historic deforestation rates like Brazil and Indonesia. The unlocking of forest areas through road building for mining operations cannot be neglected.

CHAPTER 5 Embodied deforestation in final consumption of goods and services in the EU27 – detailed analysis of current consumption and recent trends
109
CHAPTER 5 EMBODIED DEFORESTATION IN FINAL CONSUMPTION OF GOODS AND SERVICES IN THE EU27 – DETAILED ANALYSIS OF CURRENT CONSUMPTION
AND RECENT TRENDS
5.1. INTRODUCTION
In this chapter the final consumption of goods and services associated with embodied deforestation is analysed. The chapter is a complement to the physical tracking of embodied deforestation in traded agricultural commodities (crop and livestock products) and traded wood products in CHAPTER 4. The strength of this chapter is that it allocates the embodied deforestation to EU27 final consumption, the point at which no further processing occurs (see definitions in Table 5-1Table 1-1The embodied deforestation is allocated to different final consumers (households, government, and investments) and to the consumption of different goods and services; ranging from food and manufactured products through to highly processed service sectors. The approach taken in this chapter allows multiple levels of processing in different countries and industries to be included in the analysis. While CHAPTER 4 considered processing of physical agricultural and forest commodities, the method applied in this chapter considers higher levels of processing through the use of monetary data. Final consumers rarely consume agricultural and forest commodities directly and instead generally purchase, for example, processed foods in a supermarket, clothing containing leather, manufactured products made of wood, and significantly, services such as retailing, public administration (education, health), insurance, and so on. The extra level of processing gives a different perspective on embodied deforestation, as the “distance” between deforestation and final consumption can be substantially increased. Services, for example, seem quite unrelated to deforestation, but the service sectors are the dominate component of modern economies and thus require substantial inputs to be sustained. CHAPTER 4 highlighted the importance of food for embodied deforestation, though this perspective needs to be changed for final consumption. While households consume substantial amounts of food, other sectors also require food, such as restaurants, hotels, hospitals, and similar. Because of processing, the relative impacts of food consumed directly by households would be expected to decrease while the relative impacts other sectors will increase when higher levels of processing are included. Thus, the analysis in this chapter should be consider as complementary to the previous chapters as they take quite different perspectives on consumption. The focus on final consumption adds a new perspective, but compared to the previous chapters, leads to a different set of limitations. The processing is calculated using monetary transactions, and thus the link to physical flows is weakened (though not lost). Due to the size of the database used the sector results are aggregated (57 individual sectors in 112 countries and regions), and it is only possible to consider aggregated goods and services (e.g., textiles) and not individual products (e.g., cotton or t-shirts). Due to sector aggregation, the dynamics in individual products cannot be followed (e.g., both soy bean and palm oil are in a sector “oil seeds”). The economic datasets used in this type of analysis take years to develop, and hence the most detailed results suffer a time lag of several years. The database used for the analysis in this chapter, for example, releases data with a time-lag of about five years and only updates the database every 3-4 years; hence, the analysis will generally be 5-8 years before the present year (2004 in this chapter). To accommodate for this

CHAPTER 5 Embodied deforestation in final consumption of goods and services in the EU27 – detailed analysis of current consumption and recent trends
110
weakness, we have also performed a time-series analysis from 1992-2008 using a less detailed data set. These weaknesses need to be considered when interpreting the results presented in this chapter. This chapter is structured as follows. Section 5.2 explains the concept of final consumption to guide the reader in the interpretation of the results. The section also provides a brief overview of the methodology and data and outlines the specific limitations of the methodology and data. Section 5.3 presents the results of the analysis for the year 2004; first, section 5.3.1 shows the results of the analysis for embodied land use land for the final consumption of goods and services in the EU27 and compares this to other comparable regions, and second, section 5.3.2 repeats this analysis for embodied deforestation and provides insight into the importance of the sectors where most embodied deforestation is consumed and where this embodied deforestation originates. Section 5.4 analyses the trends of embodied land use and deforestation over the time period 1992-2008. This section quantifies the temporal evolution of embodied land use and deforestation of final consumption in the EU27 and compares this to other key regions. This allows the temporal trends to be superimposed on the detailed analysis for the year 2004. Finally, the last section Error! Reference source not found. provides a listing of the most important findings and a brief discussion of the results.
5.2. DEFINITIONS, METHODOLOGY AND DATA REQUIRED TO INTERPRET THE RESULTS
This section gives a general overview of the definitions, methods, and data used in this chapter. A clear understanding of the definitions, in particular, is useful for interpreting the results in this chapter. Further specifications on the methods and data are found in the Inception Report.
5.2.1. DEFINITIONS
This chapter focuses on the final consumption of goods and services in the EU27 that lead to deforestation (see Table 1-1 for more detailed definitions). Final consumption is a concept taken from the System of National Accounts which refers to the consumption by households, government, and capital investments as final consumers in the economic accounting system. Final consumption is the end result of intermediate consumption (processing) by industry required to produce goods and services. In CHAPTER 4 the analysis allocated embodied land use and deforestation to apparent consumption (a mix of intermediate and final consumption). An understanding of the various terms and definitions used in this chapter is important to interpret the results and put them into the context of the analysis in CHAPTER 4. The analysis in this chapter considers highly processed goods and services (Figure 5-1). The goods and services consumed by final consumers rarely resemble the commodities used in their production. For example, paper does not resemble the logged forest, palm oil used as sandwich spread does not resemble a palm oil plantation, and soy-beans are seemingly not connected to the beef we eat. Processing also occurs in more abstract parts of the supply chain as well. For example, a car may contain leather seats with the leather originating from cattle grazing on pastures associated with deforestation. The final consumption of government services (such as health, education, maintenance services, tax collection, etc) may consume paper associated with deforestation. Enumerating these complex relationships between economic sectors and between countries gives a different perspective on embodied deforestation, and thus the results in this chapter complement those in CHAPTER 4.

CHAPTER 5 Embodied deforestation in final consumption of goods and services in the EU27 – detailed analysis of current consumption and recent trends
111
Annex I provides key definitions using illustrative examples on the difference between final and apparent consumption.
Figure 5-1 A schematic of how the global supply chain can lead from consumption of a hamburger to deforestation in different countries. The supply chain is truncated and only three pathways leading to deforestation are highlighted, though more may exist. In this example, there are various inputs required to produce and consume a hamburger in a restaurant. After various degrees of processing, potentially in different countries, deforestation may occur at several different parts of the supply chain: expanded wheat production may cause deforestation in Ethiopia, expanded fodder production for cattle may cause deforestation in Mexico, or expanded pastures may lead to deforestation in Brazil.
5.2.2. BRIEF OVERVIEW OF METHODOLOGY AND DATA
This chapter uses the land use and deforestation data generated by IIASA as input into a global model of the supply chain (GTAP-MRIO, Figure 5-2). The GTAP-MRIO is based on a well-known economic and trade database (Global Trade Analysis Project, GTAP), which is converted into a multi-regional input-output (MRIO) model (Peters et al., 2011a). The GTAP-MRIO is a method to enumerate the global supply chain from land use and deforestation to final consumption for 112 countries and regions, and for 57 aggregated sectors. The main difference with the results in this chapter and those in CHAPTER 4, are that this chapter has a higher level of processing, allocates embodied deforestation to final consumption, uses monetary units for the allocation, and has less sector detail for agricultural commodities (but more sector detail for final consumption).

CHAPTER 5 Embodied deforestation in final consumption of goods and services in the EU27 – detailed analysis of current consumption and recent trends
112
Figure 5-2: This chapter uses the land use and deforestation data generated by IIASA as input into a global model of the supply chain (CHAPTER 3). Thus, the final results in this chapter depend on the quality of the input data from CHAPTER 3.
→ Multi-regional input-output analysis (MRIOA)
In this chapter we reallocate the commodities produced on existing or recently deforested land, along the supply chain to become allocated, hence ‘embodied’, in the final consumption of goods and services. To enumerate the global supply chain we use multi-regional input output analysis31 (MRIOA). MRIOA is a top-down method grounded in economic statistics containing the relationship between all regions and sectors in the database (our data divides the world into 112 countries and regions, each with 57 economic sectors). The regions with land use and deforestation are separated into land use types and sectors; cropland for crop products, pastures for livestock products, and the forestry sector for wood products. More details on the GTAP-MRIO used in this chapter can be found in Annex I and the Inception Report.
→ Land use and deforestation data
A sub-set of LANDFLOW output (see CHAPTER 4) provided the amount of land used for the production of primary commodities in each country and year including
i) cultivated land used for the production of individual crops accounting for multi-cropping (see Annex C1);
ii) pasture land for grazing animals with results provided in total extents and normalized to pasture equivalent (see Section ‘permanent pastures’ in Annex C1);
iii) forest land areas associated with roundwood production based on forest yield estimates (see Annex C2)
31 For those familiar with Life-Cycle Assessment (LCA), one can think of MRIOA as like a generalization of LCA to the global level.

CHAPTER 5 Embodied deforestation in final consumption of goods and services in the EU27 – detailed analysis of current consumption and recent trends
113
Deforestation embodied in primary commodities (e.g. individual crops, livestock herds and logging prior to agricultural expansion) was derived from the estimations described in CHAPTER 3. Results were generated cumulatively for the periods: 1990-2000 and 2000-2008.
→ Aggregated results
The most detailed results cover 57 sectors in 112 countries and regions in 2004. This is too detailed to give a concise summary of the EU27’s relative role in global land use and deforestation patterns. We therefore aggregate our results to ten regions to enable easier comparisons between trading blocks. Table 5-1 shows each aggregated region, its population, Gross Domestic Product, and trade exposure. The countries in each region are based on a hierarchical aggregation of the regions listed in Annex I. The EU27 is the fifth largest region in terms of population (after East Asia, South Asia, Africa, and South East Asia), but second largest in terms of economic output (after North America). Compared to other regions, the EU27 as a whole has less trade exposure for both exports and imports (not including trade within the EU27 and the other regions).
Table 5-1 Various macro-variables in absolute and relative terms for the aggregated regions used to present the results for 2004.
Region Population
Gross Domestic Product (GDP) Trade Exposure
Million person
% Trillion USD (2004)
% Exports in GDP
(%)
Imports in GDP
(%)
Africa 886 13.8 0.8 1.9 32.4 29.0 Oceania 33 0.5 0.8 1.8 16.8 18.4 East Asia 1,539 24.0 7.5 18.3 17.3 13.1 South East Asia 549 8.6 0.8 1.9 62.8 51.9 South Asia 1,458 22.8 0.8 2.0 15.8 20.2 EU27 488 7.6 12.9 31.5 11.3 11.9 North America 433 6.8 13.3 32.6 6.4 10.2 Rest of the Former Soviet and Europe 296 4.6 1.4 3.5 32.6 27.2 South and Central America 448 7.0 1.5 3.6 19.9 15.5 West Asia 275 4.3 1.2 2.8 37.7 32.1 Global 6,405 100 41.0 100 14.2 14.2
→ Time-series 1992-2008
The most detailed analysis with the GTAP-MRIO covers the years 1997 (78 regions), 2001 (87 regions), and 2004 (112 regions) with each year having 57 sectors in each region. To analyse the trends over a longer period we used a method to generate time-series results (Peters et al., 2011b). The TSTRD method (time-series with trade) is based on widely available economic and bilateral trade statistics from established global data sets and is calibrated to the match the results in 1997, 2001, and 2004. See Annex I and the Inception Report for more details.

CHAPTER 5 Embodied deforestation in final consumption of goods and services in the EU27 – detailed analysis of current consumption and recent trends
114
5.2.3. SPECIFIC LIMITATIONS OF THE DATA SOURCES
→ Land use and deforestation data
The land use and deforestation data are explained in CHAPTER 3, and hence the limitations of that data also apply to this chapter. The land use data are available annually; however, the deforestation data is only available for two time periods: 1990-2000 and 2000-2008. This limitation is discussed in CHAPTER 3
→ The GTAP database
The construction of an MRIOT inevitably requires harmonization and balancing due to the combination of a vast array of potentially conflicting data. Our analysis is based on an MRIOT constructed from the GTAP database (Narayanan and Walmsley, 2008). Datasets of this type generally take years to develop; first, statistical offices have to construct relevant statistics (often with a time lag), and second, the database developer needs to then synthesise and harmonise the data sources and test the results. Often there is a time lag of around 5 years between the current year and each new data release. Due to the nature of the database construction, new databases are often constructed only every 3-4 years. Thus, the most recently available database is often 5-8 years before the present. In the case of this project, the 2004 data set (GTAP version 7.1) was the most recent database available at the time of analysis and writing. However, to account for this weakness we additionally analysed trends over the period 1992-2008 using an alternative method. Since the GTAP database is constructed from a variety of data sources, and then balanced to remove conflicts, there may be high levels of uncertainty on individual data points. Though it is often found that these errors tend to cancel in typical MRIOA calculations (Jensen, 1980; Peters, 2007a; Yamakawa and Peters, 2009). Despite the uncertainties, it is worth emphasizing that the GTAP database is used widely and at a high-level for economic analysis and, particularly, for the analysis of agricultural and trade policies. Thus, the GTAP database is, arguably, the best available and most respected for this type of analysis (despite its various shortcomings). The method of constructing the GTAP database is described elsewhere (Narayanan and Walmsley, 2008), as are the methods for converting it to an MRIOT (Peters et al., 2011a). The GTAP database has a high level of regional detail not found in other MRIOTs. The GTAP database has a high level of sector detail compared to many economic models, but for detailed supply chain analysis aggregation errors will result when analysing specific and detailed supply chains. The GTAP database has 57 economic sectors, eight of which are primary cropland, four are primary livestock, one forestry sector, eight processed food sectors, in addition to textiles and a variety of manufacturing and service sectors (see Annex J). The results need to be interpreted within this sector classification and it is not possible to infer anything beyond the sector detail. As an example, “oil seeds” is one sector and does not differentiate between soy beans, palm oil, and other oil seeds, and consequently, without additional analysis, it is not possible to say whether the oil seeds refer to soy beans, palm oil, or another oil seed. To make specific detail, but less processing, the results in CHAPTER 4 can be used or complementary analysis with ancillary data can be performed; for example oil seeds from South America will mainly encompass soy beans, while for South East Asia this is palm oil.

CHAPTER 5 Embodied deforestation in final consumption of goods and services in the EU27 – detailed analysis of current consumption and recent trends
115
An important consequence of the sector classification used in GTAP is that biofuels are aggregated within the chemical processing sector. Even for countries with a large historic biofuel signal, like Brazil, it is not possible to analyse biofuels due to “aggregation error” in the chemicals sector, and biofuels in the Brazilian economy is a good example to demonstrate this. Brazil produces sugar cane, about 60% which is for sugar and 40% which is for biofuels and is processed in the “chemical processing” sector. The chemical processing sector is, however, used by many different sectors for purposes other than biofuels. For example, chemical processing sends 23% of its output to other chemical processing industries, 7% to retail and wholesale trade (which includes fuel sales), 6% to oil seeds (mainly fertilizer), 6% to construction (mainly chemicals used in construction), and so on. Thus, the chemical processing structure does not reflect in any way the supply chain of ethanol. A consequence of this is that any purchase of chemical processing will incorrectly use sugar cane. For example, the purchase of clothing requires textiles which require plant fibres which require fertilizer. The fertilizer is produced in the chemical processing sector and hence some sugar cane is used to make fertilizer to produce clothing, instead of all being allocated to biofuel use. In reality, the sugar cane is for ethanol, but the data does not differentiate this in enough detail. As a consequence of aggregation error, it is not possible to analyse the detailed supply chains of biofuels. Aggregation error is a common and well-known limitation of MRIO, but its existence needs to be acknowledged when interpreting results. It is only possible to follow groups of products such as processed food, manufacturing, and so on, and not individual products within those groups. Aggregation error also leads to misallocations, as in the example of biofuels. This type of “aggregation error” is not specific to the GTAP-MRIO, but occurs in all MRIOTs to varying degrees depending on their sector classification.
→ Time-series 1992-2008
In addition to GTAP data in 1997, 2001, and 2004, the time-series analysis uses data on gross domestic product by expenditure and trade data from GTAP. We base the timeseries analysis from 1992-2008 since this is the time period over which we have consistent and harmonized time-series data. Global data before 1993 is bad due to the collapse of the former Soviet Union and several other countries. However, the time period is still long enough to allow a detailed analysis of trends in food consumption without being affected by the collapse of the former Soviet Union or the recent global financial crisis.
5.2.4. SPECIFIC LIMITATIONS OF THE APPLIED METHODOLOGY
→ Multi-regional input-output analysis (MRIO)
There are many assumptions in IOA which will affect results (Lenzen, 2001), however, in the context of the study we are performing, these are unlikely to affect the conclusions. Our analysis is top-down and allocates global embodied land use and deforestation to regions and sectors, and then through the linearity assumption in multiple (infinite) supply chains, it further allocates to final consumption. The linearity assumption states that production inputs scale proportionally with output and hence there are no economies of scale. Since we are analysing historic and global flows on which the database is constructed, this is not really seen as a significant issue. One issue with the linearity assumption, and of aggregation of many industries in one sector, is that all industries and marginal production is averaged. If in reality the last unit of production is more polluting than

CHAPTER 5 Embodied deforestation in final consumption of goods and services in the EU27 – detailed analysis of current consumption and recent trends
116
the first unit (such as oil from oil sands and oil from a low cost oil well) then our data will average all production so this distinction cannot be made. It is not known what effect this would have on the results. The MRIOA is ideal for estimating the impacts of final consumption and this requires a separation between intermediate and final consumption. It may be of interest to follow intermediate and final consumption together by ignoring who the final consumer of a product is (apparent consumption). While this may be seen as a weakness of MRIOA, CHAPTER 4 focuses on apparent consumption using a different and independent methodology. In general final consumption results for embodied land use and deforestation are higher than apparent consumption due to a broader system boundary and higher level of processing (ref, http://www.biogeosciences-discuss.net/9/3949/2012/bgd-9-3949-2012.html). MRIOA is based on historic attribution and not modelling potential changes in the future. Since we are analysing historic flows we are not able to determine what would be the outcome if different, for example, policies were introduced by government. However, in the context of the questions addressed in this chapters, this weakness is not relevant as it is a historic focussed. Most other problems with MRIOA primarily relate to the data used as input and not the method itself, for example, aggregation error as discussed earlier.
→ Time-series 1992-2008
MRIOA allows a detailed analysis of the results in a particular year. We chose the most recent year available at the time, 2004, for this chapter, but it is also possible to perform an analysis for GTAP in 1997, 2001, and 2004. It is often of interest to have more recent results; however, because of the time lags in database construction (see earlier), this is often not feasible. To account for this weakness, Peters et al (2011) developed a time-series method to extend the GTAP-MRIO results in 1997, 2001, and 2004 over a longer time series (1992-2008 based on data requirements). This same methodology is used in this chapter for the deforestation analysis. The time-series analysis presents results over the period 1992-2008 for 57 sectors and 112 countries and regions. The method is based on trends in Gross Domestic Product by expenditure (household, governments, capital formation, exports, and imports) and bilateral trade data, but calibrated to match the detail GTAP-MRIO results in 1997, 2001, and 2004. The results of this have been shown to be robust compared to recent independent studies using independent methods (ref, http://www.biogeosciences-discuss.net/9/3949/2012/bgd-9-3949-2012.html). As this method only approximates the embodied deforestation using a simplified model (compared to a full GTAP-MRIO analysis), the results need to be considered as conservative. Peters et al (2011), for example, focus on aggregated results (aggregated sectors and regions) as is done in this study. Thus, despite the potential limitations, comparisons with independent studies, suggest that the results from the time-series analysis are robust to these limitations. Since the time-series analysis is based on MRIOA, the limitations for the GTAP-MRIO method and data apply to the time-series analysis as well.

CHAPTER 5 Embodied deforestation in final consumption of goods and services in the EU27 – detailed analysis of current consumption and recent trends
117
5.3. TRADE AND CONSUMPTION IN 2004
In this section we focus on consumption and trade for the year 2004, but the deforestation rates represent the 2000-2008 average (see methods and limitations). We focus on 2004 as it was the most detailed and recent global data set available to allocate embodied deforestation to final consumption at the time of analysis and writing. We consider the EU27’s aggregate and relative share of global embodied land use and deforestation by comparing similar regions and performing sector comparisons. A following section focuses on trends over time to quantify embodied land use and deforestation over the period 1992-2008. Our analysis covers both embodied land use and deforestation, but we focus on deforestation. We find that an analysis of embodied land use is, nevertheless, important to put in perspective where goods and services consumed in the EU27 are produced. First, the patterns of embodied land use may be different to embodied deforestation, and there is value in understanding both the land use and deforestation implications of EU27 final consumption. Second, if land use is intensive in one region then it may indicate increased pressures for deforestation and hence indicate potential problem regions for deforestation in the future. Areas of intensive land use but low deforestation may become areas of deforestation in the future. The results are often separated by land use type: cropland, pastures, and logging (CHAPTER 3). Specific land uses are linked to the specific causes of deforestation. Cropland use or deforestation for cropland expansion are linked to consumption of products which require inputs of raw crop commodities like crops for food, feed, fibre or fuel. Land use or deforestation for pastures will become mainly embodied in consumption products linked to ruminant livestock products such as meat or leather. Land use for forestry or deforestation due to logging is related to consumption of wood and paper products.
5.3.1. LAND USE EMBODIED IN EU27 CONSUMPTION AND IMPORT IN 2004
For the analysis of embodied land use in this section, we focus only on the aspects that provide a deeper understanding of the embodied deforestation results.
→ The importance of different final consumption categories
According to the System of National Accounts,, goods and services are ultimately consumed by three categories: household consumption, government consumption, and capital investments32. Within each of these final consumption categories, it is possible to consume 57 different types of goods and services (see Annex J for a description of the different sectors). The land use associated with the different final consumers by sector includes all land use in the global supply chain required to meet the given final consumption. Final consumption globally sums to equal global production, but at the regional level the differences between consumption and production are due to international trade in raw and processed goods and services. Figure 5-3 shows the embodied land use allocated to final consumption by sector for the EU27. Household consumption dominates consumption of all land use categories. In the case of cropland, household consumption is dominated by food products, and particularly processed food products. Government consumption has a small impact, but is dominated by the service sectors. The 32 Capital investments primarily cover construction activities, such as, roads, bridges, buildings, and similar, but also large machinery.

CHAPTER 5 Embodied deforestation in final consumption of goods and services in the EU27 – detailed analysis of current consumption and recent trends
118
government services are large in monetary terms and the land use represents food consumption in the provision of government services; for example, in school and hospital cafeterias, meetings, and so on. Household consumption also dominates pasture land use, with meat and processed food consumption particularly important. Several of the top sectors include processed products that can be associated with pasture land use. For example, leather products arise from pasture land and are used in a variety of products, such as wearing apparel and various manufactured products. In the case of forests, household consumption still dominates, but capital investments are significant and dominated by construction activities. Household consumption of forest land is dominated by a variety of processed wood products such as furniture, paper and books, and so on. When covering all land use together, households dominate and the most important sectors which are various types of food (meat and other general food categories), construction, and various services sectors. All together meat consumption has the highest land use due to the consumption of meat ultimately derived from pastures. Figure 5-3 can be used as a guide to understand the different types of final consumers in the embodied deforestation analysis. In the embodied deforestation results that follow, the different final consumers are not differentiated in the figures. However, Figure 5-3 provides information on the role of the different final consumers. As examples, if public administration is important then this is likely due to government services, likewise, if construction is important, then it is likely due to capital investments, and so on. The different sector patterns between cropland, pastures, and forest activities are also shown in Figure 5-3. In all cases, household consumption is the main final consumer, and processed food production often dominates the sector impacts. These issues are explored further below.
→ EU27’s share of global land use
Countries use their own land to produce goods and services for domestic use and export, but they also import embodied land use from other countries to help meet their consumption33 (Table 5-2). In the case of the EU27, half of the goods and services requiring land use are sourced outside of the EU27. The EU27 accounts for only 5% of global land use for production of goods and services, but this doubles when imported embodied land use is accounted for. As a consequence, the EU27 net import of land use is of similar magnitude as the total land use in the EU27. Of this net import, the EU27 has a gross import of 328Mha and a gross export of 36Mha, giving a net import of 291Mha. Compared to other regions, the EU27 has the largest net import of land use (291Mha), followed by West Asia (113Mha), North America (82Mha), and East Asia (31Mha). Oceania (193Mha), South and Central America (150Mha), and the Former Soviet and Eastern Europe (106Mha) are the three largest net exporters of land use. We repeat that the consumption figures will not correspond with any analyses that are not based upon a final consumption analysis (e.g. apparent or intermediate consumption analyses).
33 We consider land use for crops, pastures, and logging (forests). The results in this section are broadly consistent with other studies on land use, for example Lugschitz et al. (2011), after allowing for different treatments of land use and different methods for modelling final consumption.

CHAPTER 5 Embodied deforestation in final consumption of goods and services in the EU27 – detailed analysis of current consumption and recent trends
119
Figure 5-3 Land use allocated to final consumption categories in the EU27 and the top 10 sectors for each land use type (2004)

CHAPTER 5 Embodied deforestation in final consumption of goods and services in the EU27 – detailed analysis of current consumption and recent trends
120
Table 5-2 Land use associated with production and consumption in world regions for 2004 showing which countries are net exporters or importers of land and the balance relative to production. The EU27 imports as much land use (291Mha) as it uses domestically (290Mha).
Region Production (Mha)
Consumption (Mha)
Balance (Mha)
Balance (%)
EU27 290 582 -291 -100 West Asia 347 460 -113 -33 North America 872 954 -82 -9 East Asia 695 726 -31 -4 South Asia 273 276 -3 -1 South East Asia 137 137 0 0 Africa 1,158 1,086 72 6 Rest of the Former Soviet and Europe 748 642 106 14 South and Central America 662 512 150 23 Oceania 476 284 193 40 Global 5,659 5,659 0
The difference between production and consumption can be interpreted as representing a trade balance between the land use embodied in exports and imports (Peters, 2008a). Depending on each regions comparative advantage in different types of land, different regions may be net importers or net exporters of different types of land. In total, 27% of land use for economic purposes is embodied in the production of internationally traded goods and services. This share varies, however, by land use type. In total, 31% of cropland is embodied in the production of internationally traded goods and services, 21% of pasture land, and 46% of forest land used for logging. The other parts are domestically consumed. The EU27 is a net importer of all types of land. The EU27 is the largest net importer for embodied cropland and pastures, but second largest for embodied forest land, next to East Asia. The EU27 has the largest trade imbalance amongst the ten regions (Figure 5-4). Some regions show a net import in one type of land use, but an export in another. For example, North America is a net importer of embodied pastures and forest land used for logging, but a net exporter of embodied cropland. Oceania is the largest net exporter (due to pastures or livestock trade) followed by South and Central America. The Former Soviet and Eastern Europe is the largest net exporter of embodied forest land used for logging while East Asia is the largest importer. Despite these regional differences, the EU27 stands out as the largest net importer of embodied land use, signifying both a small export and large import. This is important for embodied deforestation as the more land use a country imports, the lesser control it has over deforestation linked to its consumption.

CHAPTER 5 Embodied deforestation in final consumption of goods and services in the EU27 – detailed analysis of current consumption and recent trends
121
Figure 5-4 The trade balance for each land category (colours) with the black dot representing the net trade balance (2004).
→ Origin of imports into the EU27 by region and land category
The analysis of production, consumption, and their difference does not reveal the key trading partners for each land category and each region; an export may balance with an import giving a much smaller net export or import. When comparing the imports into a given region, the key import partners vary significantly depending on the region; most likely due to geographic location, trade agreements, economic relations, etc (Figure 5-5). At the detailed level, the EU27 imports land mainly from China, the Russian Federation, and Brazil34. China is much more dependent on the Russian Federation, Australia, and the USA. Japan is more dependent on Australia, China, and the USA. The USA is dependent on imports from Canada, China, and Australia. These results indicate the importance of certain producers to the different regions.
34 This is broadly consistent with a study by Lugschitz et al. (2011), though the latter study does not show the detailed results.
-300 -250 -200 -150 -100 -50 0 50 100 150 200
EU27
West Asia
North America
East Asia
South Asia
South East Asia
Africa
Rest of the Former Soviet and Europe
South and Central America
Oceania
Land Area (Mha)
CroplandPasturesForest landNet
Important findings: • Only 5% of global land use for the production of goods and services from cropland,
pastures and forests occurs within the EU27, yet EU27 final consumption of goods and services based on agricultural and forestry commodities globally sourced requires twice this amount of land (10% of global land use).
• The EU27 is the largest net importer of embodied cropland. The import of embodied cropland is 78% of its domestic cropland use. The import of embodied pastures, due to the use of ruminant livestock products, is 235% of the domestic land use for pastures. For forest land the EU27 is more self-sufficient than the other two land uses, but the EU27 is still the second largest net importer of embodied forest land representing 40% of domestic forest land use.
• Due to the net import of embodied land use into the EU27, the EU27 is equally likely to have its goods and services sourced abroad as domestically.

CHAPTER 5 Embodied deforestation in final consumption of goods and services in the EU27 – detailed analysis of current consumption and recent trends
122
Figure 5-5 The origin of the imports of embodied land use into key regions showing how import origin varies (2004). The pie charts cover total embodied land use, but only countries covering 75% of the total are shown explicitly with the rest allocated to “Rest of World”. The EU27 imports of 328Mha and an export of 36Mha, giving a net import of 291Mha.
The import partners also vary depending on the type of land use, and this is particularly relevant for the EU27 (Figure 5-6). For cropland imported into the EU27, the top-three importing countries are Brazil, the USA, and the Russian Federation. For pastures, the top-three are China, Rest of East Asia (Mongolia), and Brazil. For forest land use, the top-three are the Russian Federation, Canada, and the USA. For comparison, for total land use, the top three import regions are China, the Russian Federation, and Brazil. For the different regions, different sectors dominate the trade flows. The large imports from China and East Asia are due to textiles and leather products. Various processed food products are most important for cropland, with most of the final processing occurring in the EU27. For forest land use, construction, furniture, paper products (particularly in the service sectors) are most important. China ranks high for most land use types imported into the EU27, and its importance partially reflects the high degree of processing captured within our modelling. The level of processing is important because the EU27 imports goods and services that are not directly associated with land use; for example, leather wearing apparel may be imported into the EU27 instead of unprocessed leather. Significantly, much of the final processing occurs in the EU27 which means that raw and semi-processed goods and services are imported into the EU27 before final processing and sale. These results on embodied land use also have relevance to the embodied deforestation analysis later on. In the case of cropland, the import of products into the EU27 is dominated by Brazil, a country that has the largest levels of deforestation. Likewise, in the case of pastures, Brazil is the third most important import partner. For the import of forest land for logging the Russian Federation is particularly important for the EU27.
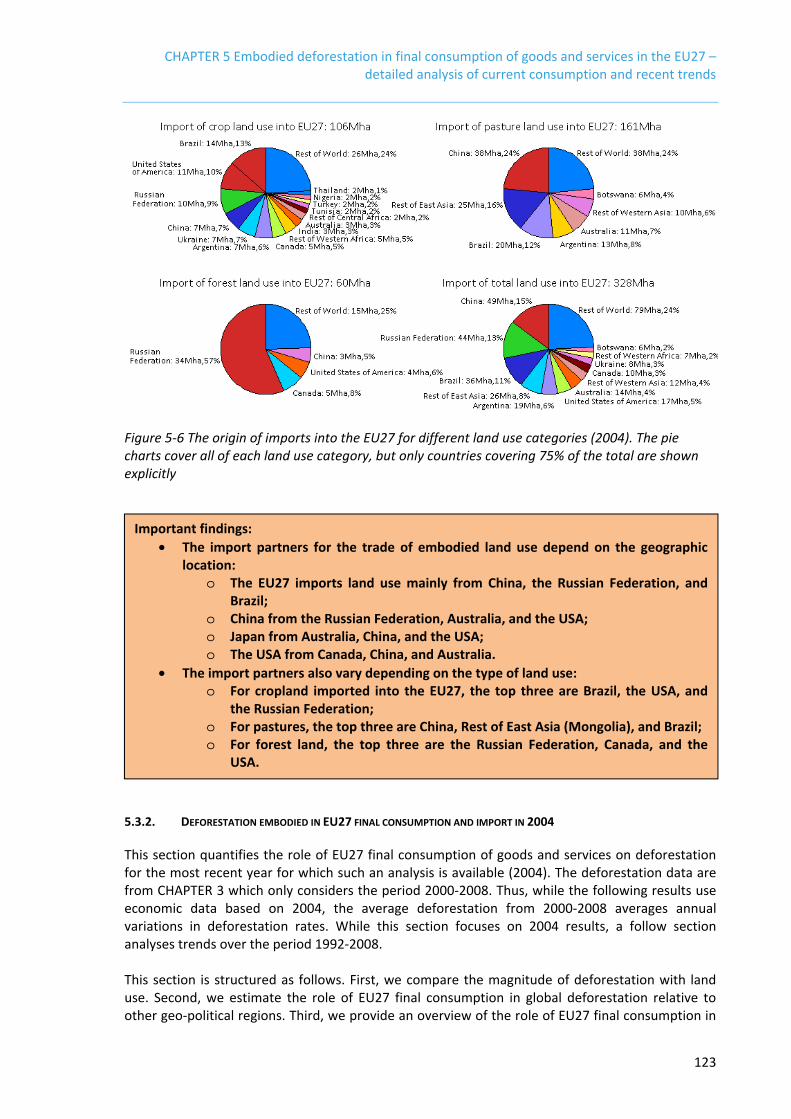
CHAPTER 5 Embodied deforestation in final consumption of goods and services in the EU27 – detailed analysis of current consumption and recent trends
123
Figure 5-6 The origin of imports into the EU27 for different land use categories (2004). The pie charts cover all of each land use category, but only countries covering 75% of the total are shown explicitly
5.3.2. DEFORESTATION EMBODIED IN EU27 FINAL CONSUMPTION AND IMPORT IN 2004
This section quantifies the role of EU27 final consumption of goods and services on deforestation for the most recent year for which such an analysis is available (2004). The deforestation data are from CHAPTER 3 which only considers the period 2000-2008. Thus, while the following results use economic data based on 2004, the average deforestation from 2000-2008 averages annual variations in deforestation rates. While this section focuses on 2004 results, a follow section analyses trends over the period 1992-2008. This section is structured as follows. First, we compare the magnitude of deforestation with land use. Second, we estimate the role of EU27 final consumption in global deforestation relative to other geo-political regions. Third, we provide an overview of the role of EU27 final consumption in
Important findings: • The import partners for the trade of embodied land use depend on the geographic
location: o The EU27 imports land use mainly from China, the Russian Federation, and
Brazil; o China from the Russian Federation, Australia, and the USA; o Japan from Australia, China, and the USA; o The USA from Canada, China, and Australia.
• The import partners also vary depending on the type of land use: o For cropland imported into the EU27, the top three are Brazil, the USA, and
the Russian Federation; o For pastures, the top three are China, Rest of East Asia (Mongolia), and Brazil; o For forest land, the top three are the Russian Federation, Canada, and the
USA.

CHAPTER 5 Embodied deforestation in final consumption of goods and services in the EU27 – detailed analysis of current consumption and recent trends
124
deforestation at the sector and region level and from a consumption and production perspective. Fourth, we consider the regions of deforestation that are important for EU27 final consumption. Fifth, we consider the goods and services consumed in the EU27 that lead to deforestation. Sixth, we consider the agricultural and forestry commodities with embodied deforestation that are used as input into EU27 final consumption. Finally, we estimate the embodied deforestation in raw and semi-processed agricultural and forestry commodities that are further processed and then re-exported from the EU27. Overall, these sub-sections give a detailed and complete description of the role of EU27 final consumption in global deforestation.
→ Gross deforestation, land use, and international trade
We focus the analysis in this chapter on deforestation for cropland, pastures, and logging which precedes the conversion of forests into other land uses. It is assumed that only these three land uses enter international trade flows. We assume that fuelwood does not enter international trade and is therefore only used domestically. Global gross trade in fuelwood and charcoal was around 0.2% of total production for much of the past decades and recently increased to about 0.5% in 2007 (Kastner et al., 2011). It is believed that the increase can be linked to the rising interest in biomass for electricity and heating to replace fossil fuels. If the international trade of this commodity increases further, it should be included in future studies. It must be noted, however, that the major share of traded biomass from wood products is still represented by wood pellets which are classified under industrial roundwood. The deforestation for other causes is not allocated to consumption or production in any country. Likewise, the deforestation that cannot be explained by agricultural expansion, built up areas, or natural causes is not allocated to countries because it is not possible to attribute that to either domestic or foreign consumption.

CHAPTER 5 Embodied deforestation in final consumption of goods and services in the EU27 – detailed analysis of current consumption and recent trends
125
Table 5-3 shows the relative magnitudes of gross deforestation allocated to the different categories or cropland use, pastures (for ruminant livestock products) and logging. Further information is found in CHAPTER 3. The current magnitude of embodied deforestation is significantly smaller than current embodied land use, with gross deforestation representing around 0.2% of global land use (average of 2000-2008 deforestation). Deforestation for cropland, pastures, or due to logging represents around 0.1% of global land use. Table 5-4 shows that deforestation for agricultural production is highly concentrated in three regions: South and Central America, Africa, and South-East Asia, the hotspots for deforestation for the period 2000-2008. Thus, the results in the following sections will logically focus on these three regions. However, to put things into perspective, the embodied deforestation analysis focuses on only 0.1% of agricultural land use and thus, focussing on embodied deforestation alone, may miss many important environmental issues arising from land use more broadly.
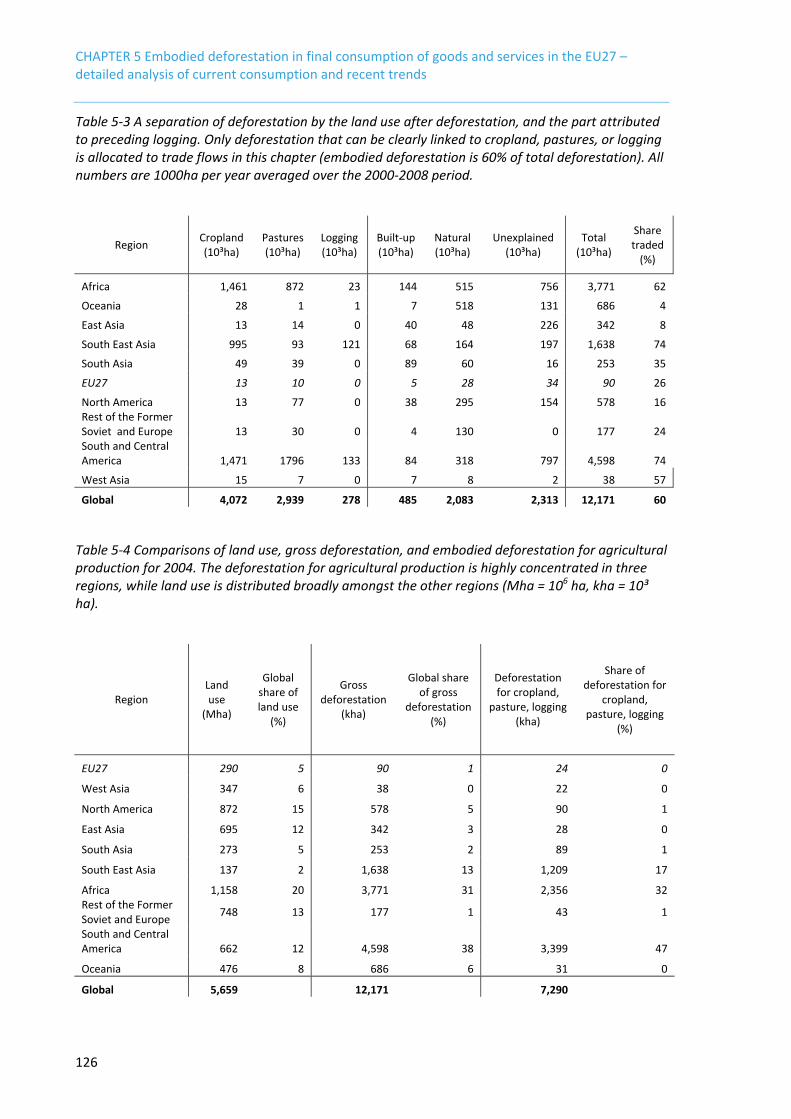
CHAPTER 5 Embodied deforestation in final consumption of goods and services in the EU27 – detailed analysis of current consumption and recent trends
126
Table 5-3 A separation of deforestation by the land use after deforestation, and the part attributed to preceding logging. Only deforestation that can be clearly linked to cropland, pastures, or logging is allocated to trade flows in this chapter (embodied deforestation is 60% of total deforestation). All numbers are 1000ha per year averaged over the 2000-2008 period.
Region Cropland (10³ha)
Pastures (10³ha)
Logging (10³ha)
Built-up (10³ha)
Natural (10³ha)
Unexplained (10³ha)
Total (10³ha)
Share traded
(%)
Africa 1,461 872 23 144 515 756 3,771 62
Oceania 28 1 1 7 518 131 686 4
East Asia 13 14 0 40 48 226 342 8
South East Asia 995 93 121 68 164 197 1,638 74
South Asia 49 39 0 89 60 16 253 35
EU27 13 10 0 5 28 34 90 26
North America 13 77 0 38 295 154 578 16 Rest of the Former Soviet and Europe 13 30 0 4 130 0 177 24 South and Central America 1,471 1796 133 84 318 797 4,598 74
West Asia 15 7 0 7 8 2 38 57
Global 4,072 2,939 278 485 2,083 2,313 12,171 60
Table 5-4 Comparisons of land use, gross deforestation, and embodied deforestation for agricultural production for 2004. The deforestation for agricultural production is highly concentrated in three regions, while land use is distributed broadly amongst the other regions (Mha = 106 ha, kha = 10³ ha).
Region Land use
(Mha)
Global share of land use
(%)
Gross deforestation
(kha)
Global share of gross
deforestation (%)
Deforestation for cropland,
pasture, logging (kha)
Share of deforestation for
cropland, pasture, logging
(%)
EU27 290 5 90 1 24 0
West Asia 347 6 38 0 22 0
North America 872 15 578 5 90 1
East Asia 695 12 342 3 28 0
South Asia 273 5 253 2 89 1
South East Asia 137 2 1,638 13 1,209 17
Africa 1,158 20 3,771 31 2,356 32 Rest of the Former Soviet and Europe 748 13 177 1 43 1
South and Central America 662 12 4,598 38 3,399 47
Oceania 476 8 686 6 31 0
Global 5,659 12,171 7,290

CHAPTER 5 Embodied deforestation in final consumption of goods and services in the EU27 – detailed analysis of current consumption and recent trends
127
→ EU’s share of global embodied deforestation
Total (Cropland, Pastures, Logging) Unlike agricultural land use, deforestation is highly skewed in three world regions (South and Central America, Africa, and South-East Asia). Since the most significant share of embodied deforestation (as for land use) is used domestically, the three key deforestation regions are also responsible for the largest shares of final consumption allocated to embodied deforestation (Table 5-5). Some of the largest regions in terms of embodied land use consumption have a considerably smaller share of global consumption of embodied deforestation; for example, North America (17% compared to 5%), the former Soviet Union and East Europe (11% compared to 2%), and East Asia (13% compared to 5%). The EU27 is the fourth biggest region in terms of the consumption of embodied deforestation (fifth for land use). The EU27 has a 10% share of this global embodied deforestation, similar to the share of global land use (10%). Other important high consumption regions are have to rely less on imported land use to sustain their consumption and will consequently import less embodied deforestation from other regions, and more specifically the deforestation hotspots. East Asia and North America import only half of embodied deforestation the EU27 imports.
Table 5-5 The allocation of global embodied land use and deforestation to final consumption in different world regions in 2004 showing the relative magnitude of embodied deforestation to land use, and that the share of consumption is skewed towards the deforestation hotspots. The deforestation included here only includes deforestation for croplands, pastures, and due to preceding logging, i.e. embodied deforestation.
Region Land use
consumption (Mha)
Global share of land use
associated with consumption
(%)
Deforestation embodied in consumption
(kha)
Global share of deforestation embodied in consumption
(%) Africa 1,086 19 2,204 30 South and Central America 512 9 2,189 30 South East Asia 137 2 826 11 EU27 582 10 732 10 East Asia 726 13 381 5 North America 954 17 347 5 West Asia 460 8 217 3 South Asia 276 5 212 3 Rest of the Former Soviet and Europe 642 11 152 2
Oceania 284 5 29 0 Global 5,659 7,290
When disaggregated by type of land use, the EU27’s share of the global totals is similar for each land use type (Table 5-6). The EU27 consumption of embodied cropland is 14% of the global total, but slightly lower at 13% for embodied deforestation. For pastures the EU27 is allocated 7% of the global total for both embodied pasture use and deforestation leading to pastures. The largest relative difference is for logging, where EU27 consumption is responsible for 19% of the global land use associated with logging, while this drops to 9% for the deforestation preceded by logging. Table

CHAPTER 5 Embodied deforestation in final consumption of goods and services in the EU27 – detailed analysis of current consumption and recent trends
128
5-7 shows that EU27 consumption of embodied land use and deforestation has a different distribution by land use type than the global distribution. While the global land use is dominated by pastures (60% of the total), EU27 consumption is allocated a smaller share (38%). Likewise, for deforestation leading to pastures, the global allocation is 40%, but this is lower for the EU27 (27%). These results show that the EU27 uses a smaller share of global pastures but a larger share of global cropland use.
Table 5-6 The share of global land use and deforestation allocated to EU27 consumption by type of land use.
Global Total
EU27 Total
EU27 Share
(%)
Land Use (Mha) 5659 582 10.3
Cropland 1529 217 14.2 Pastures 3387 223 6.6 Logging 743 142 19.1 Deforestation (kha) 7290 732 10.0
Cropland 4072 507 12.5 Pastures 2939 199 6.8 Logging 278 26 9.4
Table 5-7 The share of embodied land use and deforestation allocated globally and to the EU27 by land use type.
Global Total
EU27 Total
Land Use (%) 100 100
Cropland 27 37 Pastures 60 38 Logging 13 24 Deforestation (%) 100 100
Cropland 56 69 Pastures 40 27 Logging 4 4
The EU27 is the largest net importer of embodied deforestation (Table 5-8); this is partially since the EU27 has a very low level of domestic gross deforestation (24kha/y for 2000-2008), and thus imports of embodied deforestation are relatively high. East Asia also has a low level of domestic deforestation and a high import, and hence the share of net imports is very high relative to domestic deforestation. The EU27 is the largest net importer, followed by East Asia, and then North America. South and Central America dominate the net exports over South East Asia and then Africa, less than South East Asia. The trade balances are dominated by embodied deforestation for cropland in all regions. In South and Central America, the export of embodied deforestation in livestock products due to pasture expansion is relatively more important than in other regions.

CHAPTER 5 Embodied deforestation in final consumption of goods and services in the EU27 – detailed analysis of current consumption and recent trends
129
Table 5-8 The production and consumption of embodied deforestation in world regions with the balance (difference) showing the degree to which regions import goods and services associated with deforestation. Note, the deforestation numbers reported here include deforestation associated with cropland, pastures and due to preceding logging, i.e. embodied deforestation.
Region Production (1000ha)
Consumption (1000ha)
Balance (1000ha)
Balance (% of production)
EU27 24 732 -708 -2,993 East Asia 28 381 -353 -1,275 North America 90 347 -257 -285 West Asia 22 217 -195 -887 South Asia 89 212 -123 -140 Rest of the Former Soviet and Europe 43 152 -109 -253
Oceania 31 29 1 5 Africa 2,356 2,204 152 6 South East Asia 1,209 826 383 32 South and Central America 3,399 2,189 1,210 36 Global 7,290 7,290
Figure 5-7 The net balance of trade for the net export of goods and services associated with deforestation.
-1000 -500 0 500 1000 1500
EU27
East Asia
North America
West Asia
South Asia
Rest of the Former Soviet and Europe
Oceania
Africa
South East Asia
South and Central America
Land Area (kha)
CroplandPasturesLoggingNet

CHAPTER 5 Embodied deforestation in final consumption of goods and services in the EU27 – detailed analysis of current consumption and recent trends
130
→ Overview of embodied deforestation allocated to EU27 final consumption by region and sector
The following sub-sections analyse the impacts of EU27 final consumption on deforestation by sector and region. In this sub-section we provide an overview and the following sub-sections consider the results in more sector and region detail and from different perspectives. It is possible to analyse EU27 final consumption from two perspectives: 1) in terms of the goods and services consumed (consumption- or destination-perspective); and 2) in terms of the agricultural and forestry commodities used as inputs (production- or origin-perspective, see Annex I). In both cases, the entire supply chain is included and it is either traced from the final good or service consumed in the EU27 to the region and sector of deforestation, or in the other way, from the region and sector of deforestation to final consumption in the EU27. Both approaches are complementary as they highlight either 1) the final consumption of goods and services, or 2) the region and sector (commodity) of deforestation. The following figures combine both the production and consumption perspectives to show the sector and region combinations of each consumed good and service in the EU27 together with the associated origin of the commodities involving deforestation that were used as input to produce the goods and services. Final consumers in the EU27 can consume from 57 different sectors and the deforestation may occur in 112 countries for 57 different commodities. From these 6,384 combinations (57 times 112), we only show the top 5 combinations for both consumption and production in the following figures. Thus, the figures only highlight the most significant flows, but since the figures cover all deforestation (including deforestation within the EU2735) associated with 35 The analysis in Chapter 3 found a small amount of deforestation in the EU27, primarily in Portugal and Estonia. So as not to ignore this small amount of deforestation, we include it in the analysis, In following figures, for example deforestation directly or indirectly linked to pasture expansion show up for Portugal and Estonia. These portions are, however, very small and are a consequence of the underlying data used in Chapter 3. The deforestation in EU27 is taking place in Portugal and Estonia. For Portugal two trends come together. First, while there is a small net increase in forest area of Portugal during 1990 to 2008, the estimated afforestation, based on reported data, is about twice as much as the net forest increrase. This implies (despite of a net increase) an estimated gross deforestation (of 187 thousand ha; about 2/3 of this in 1990-2000 and 1/3 in 2000-2008). Second, while cropland has decreased, the reported pasture area increased by almost 1 million ha (roughly 600 thousand ha in 1990-2000 and 400 thousand in 2000-2008). Hence, the model sees some gross deforestation and it sees land demand for pasture (in both sub-periods). Consequently, it allocates some amount of the estimated gross deforestation to the agricultural sector (livestock only as is consistent with the data).
Important findings: • The consumption of goods and services in the EU27 was associated with 10% of global
deforestation in 2004, similar to the value for global land use. • There is little deforestation in the EU27 so the majority of the deforestation was
embodied in the imports of goods and services, either directly or indirectly via processing in other countries.
• The EU27 is the largest importer of embodied deforestation. The three deforestation hotspots consume most of embodied deforestation themselves, but the EU27 is next, followed by East Asia and North America. The latter two regions can rely more upon their own land resources for consumption than the EU27 and are therefore less prone to imports of embodied deforestation from other regions.

CHAPTER 5 Embodied deforestation in final consumption of goods and services in the EU27 – detailed analysis of current consumption and recent trends
131
EU27 final consumption, they provide a broad overview of the key findings for the sector and region results from both a consumption and production perspective. The following sub-sections provide more details from the different perspectives of these results to provide a complete and detailed picture of the role of EU27 final consumption on global deforestation. Figure 5-8 to Figure 5-11 show the top 5 sectors for EU27 final consumption (bars) and the top 5 sector and regions producing commodities (colours) with embodied deforestation required for EU27 final consumption. Figure 5-8 shows the results for total embodied deforestation, Figure 5-9 for deforestation embodied in crops, Figure 5-10 for deforestation embodied in pastures, and Figure 5-11 for deforestation embodied in wood products. These figures encapsulate all the detailed results described in the following sections, and put the magnitude of the contributions of different sectors and regions in the perspective of the total. More specific details are found in the following sections which are, in effect, aggregations of different combinations of sectors and regions in the following figures. Figure 5-8 covers total embodied deforestation (cropland, pastures, and logging). In terms of the consumed products, other processed food products (which includes products with meat mixed with non-meat products) is the consuming sector which is allocated the largest share of embodied deforestation. This sector mainly contains deforestation embodied in oil seeds from Brazil, Argentina (soybean meal and oil in feed and food), and Indonesia (vegetable oils used in food and feed), pastures in Brazil (beef), and crops in Nigeria. The second most important consuming sector is processed meat with the largest deforestation occurring in Brazil, mainly due to pasture deforestation for ruminant livestock grazing (see also Figure 5-9).
For Estonia, gross deforestation occured according to the available data mainly in period 2000-2008 (i.e. afforestation plus natural expansion of forests exceeds net change of forest; in fact, there is even a small net decrease of forest area reported in Estonia). At the same time there was some increase in reported pasture area, nearly 200 thousand ha in 2000-2008) and the model, driven by these data, allocates some deforestation in the second period to Estonia's ruminant livestock sector.

CHAPTER 5 Embodied deforestation in final consumption of goods and services in the EU27 – detailed analysis of current consumption and recent trends
132
Figure 5-8 For total embodied deforestation allocated to EU27 final consumption (732 kha for 2004), the figure shows the top 5 sectors consumed in the EU27 (bars) and the top 5 sector and regions producing agricultural and forestry products involving deforestation, required to produce the consumed goods and services.
Since we consider total embodied deforestation, Portugal is found in the results as there was a small amount of deforestation in Portugal over the period (2000-2008) embodied in livestock products from pastures, and most of this is consumed within the EU27 (see CHAPTER 3). The next most important consuming sector is “trade” which covers retailing, hotels, and restaurants and then the large aggregation of service sectors. These sectors consume a variety of processed food products, in addition to having high expenditure, and hence the sector and region combinations with the highest allocations are similar as for the combination of meat-based and non-meat based food. Figure 5-8 showed the top 5 sectors for EU27 final consumption (bars) and the top 5 sector and regions producing commodities (colours) on deforested land required for EU27 final consumption. The following figures show this figure separately for deforestation for cropland, pastures, and logging and provide a more detailed insight. Note that among these split-ups deforestation embodied in crop products is still the most important import category. The other categories are relatively less important but their split-up reveals more about the specific products and origins.

CHAPTER 5 Embodied deforestation in final consumption of goods and services in the EU27 – detailed analysis of current consumption and recent trends
133
Figure 5-9 shows the same results as Figure 5-8, but only considering deforestation associated with cropland. Thus, pastures are not seen in these results, and instead the results are dominated by oil seeds and other crops. The most important sectors in terms of consumption are processed food, trade (including hotels and restaurants), oils and beverages. In terms of deforestation, the results are dominated by oil seeds from Brazil, Argentina, Paraguay, Malaysia, and Indonesia, crops in Nigeria, and grains in Brazil. Beverages also appear in the top five. Due to the aggregation in the GTAP-MRIO, it is not possible to detail beverages into types of beverages, but the important inputs for beverages include oil seeds and crops (such as coffee beans, cocoa, etc) which are key ingredients in common beverages.
Figure 5-9 For cropland deforestation allocated to EU27 final consumption (507 kha for 2004), the figure shows the top 5 sectors consumed in the EU27 (bars) and the top 5 sector and regions producing agricultural products on deforested land required to produce the consumed goods and services.
Figure 5-10 shows the results for deforestation associated with pastures. Not surprisingly, the consuming sectors are dominated by meat, processed meat products, processed food (which contains meat), and trade (including hotels and restaurants). Leather products appear as the fifth most important consuming sector. The deforestation is due solely to deforestation for pastures, mainly in Brazil. The leather consumption associated with deforestation is, however, very small compared to the overall imported amount of embodied deforestation. Other important regions include Cambodia, Portugal, Argentina and Zimbabwe. As discussed previously, Portugal is found in

CHAPTER 5 Embodied deforestation in final consumption of goods and services in the EU27 – detailed analysis of current consumption and recent trends
134
the results since there is land deforested in Portugal that is allocated to pastures, and most of this is used domestically.
Figure 5-10 For pasture deforestation allocated to EU27 final consumption (199 kha in 2004), the figure shows the top 5 sectors consumed in the EU27 (bars) and the top 5 sector and regions producing agricultural products on deforested land required to produce the consumed goods and services.
Figure 5-11 shows the results for logging preceding deforestation. Note that compared to crops and livestock, the deforestation attributed to logging is much lower. The consuming sectors are dominated by construction (due to the use of wood in capital investments), manufactured products which covers furniture, wood products, and the service and trade sectors both of which have large purchases of paper, furniture, and so on. The regions with the largest allocation of embodied deforestation to logging are Indonesia, Brazil, and a variety of South-East Asian countries.

CHAPTER 5 Embodied deforestation in final consumption of goods and services in the EU27 – detailed analysis of current consumption and recent trends
135
Figure 5-11 For logging preceding deforestation allocated to EU27 final consumption (26 kha in 2004), the figure shows the top 5 sectors consumed in the EU27 (bars) and the top 5 sector and regions producing forestry products from deforestation, required to produce the consumed goods and services.
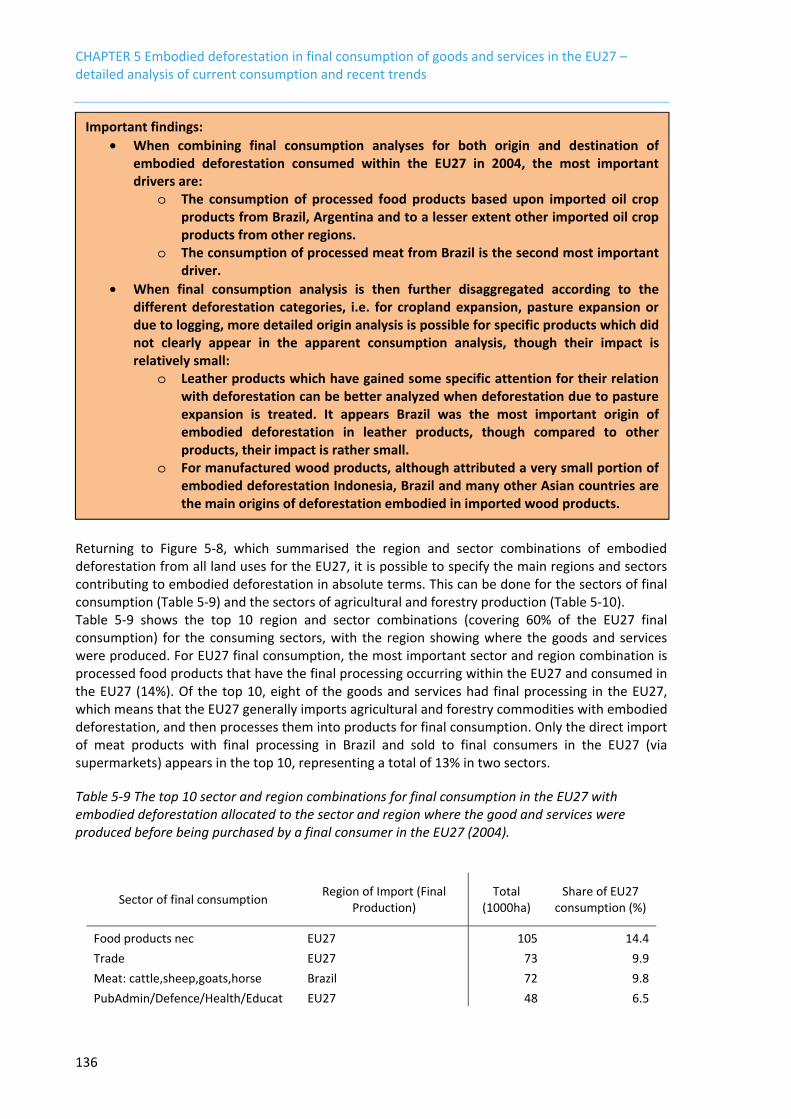
CHAPTER 5 Embodied deforestation in final consumption of goods and services in the EU27 – detailed analysis of current consumption and recent trends
136
Returning to Figure 5-8, which summarised the region and sector combinations of embodied deforestation from all land uses for the EU27, it is possible to specify the main regions and sectors contributing to embodied deforestation in absolute terms. This can be done for the sectors of final consumption (Table 5-9) and the sectors of agricultural and forestry production (Table 5-10). Table 5-9 shows the top 10 region and sector combinations (covering 60% of the EU27 final consumption) for the consuming sectors, with the region showing where the goods and services were produced. For EU27 final consumption, the most important sector and region combination is processed food products that have the final processing occurring within the EU27 and consumed in the EU27 (14%). Of the top 10, eight of the goods and services had final processing in the EU27, which means that the EU27 generally imports agricultural and forestry commodities with embodied deforestation, and then processes them into products for final consumption. Only the direct import of meat products with final processing in Brazil and sold to final consumers in the EU27 (via supermarkets) appears in the top 10, representing a total of 13% in two sectors.
Table 5-9 The top 10 sector and region combinations for final consumption in the EU27 with embodied deforestation allocated to the sector and region where the good and services were produced before being purchased by a final consumer in the EU27 (2004).
Sector of final consumption Region of Import (Final Production)
Total (1000ha)
Share of EU27 consumption (%)
Food products nec EU27 105 14.4 Trade EU27 73 9.9 Meat: cattle,sheep,goats,horse Brazil 72 9.8 PubAdmin/Defence/Health/Educat EU27 48 6.5
Important findings: • When combining final consumption analyses for both origin and destination of
embodied deforestation consumed within the EU27 in 2004, the most important drivers are:
o The consumption of processed food products based upon imported oil crop products from Brazil, Argentina and to a lesser extent other imported oil crop products from other regions.
o The consumption of processed meat from Brazil is the second most important driver.
• When final consumption analysis is then further disaggregated according to the different deforestation categories, i.e. for cropland expansion, pasture expansion or due to logging, more detailed origin analysis is possible for specific products which did not clearly appear in the apparent consumption analysis, though their impact is relatively small:
o Leather products which have gained some specific attention for their relation with deforestation can be better analyzed when deforestation due to pasture expansion is treated. It appears Brazil was the most important origin of embodied deforestation in leather products, though compared to other products, their impact is rather small.
o For manufactured wood products, although attributed a very small portion of embodied deforestation Indonesia, Brazil and many other Asian countries are the main origins of deforestation embodied in imported wood products.

CHAPTER 5 Embodied deforestation in final consumption of goods and services in the EU27 – detailed analysis of current consumption and recent trends
137
Beverages and tobacco products EU27 42 5.7 Construction EU27 23 3.1 Vegetable oils and fats EU27 20 2.8 Meat products nec EU27 19 2.6 Business services nec EU27 18 2.5 Meat products nec Brazil 16 2.2 Rest of World 297 40.5 Share of EU27 435 59.5
Table 5-10 shows the top-10 sector and region combinations that produced the agricultural and forestry commodities associated with deforestation that were ultimately embodied in final consumption in the EU27, covering 67% of the total. The table therefore lists hotspots of deforestation by region, sector and hence land use type. Brazil is ranked in the top two places (39% in total), and again in the sixth and tenth ranking. This confirms that Brazil’s deforestation is distributed across a variety of agricultural and forestry commodities, and hence, an even wider range of goods and services consumed in the EU27 due to high levels of processing. A variety of other regions are ranked high: Argentina, Nigeria, Paraguay, Indonesia, and Malaysia. The most important land use is cropland, as pastures only appear once (ranking 2). The sectors are dominated by oil seeds, but a wide variety of crops are also important representing indirect land use change (see CHAPTER 3). Cattle from pasture deforestation only appears once in the top ten (at number two), with cropland deforestation in all other rankings, though a share of the cropland deforestation relates to animal feed (see CHAPTER 4?). In contrast to the consumption perspective which showed that most of the final processing is performed in the EU27, the production perspective shows that the EU27 sources its raw materials from a variety of different countries and in a variety of different agricultural and forestry commodities.
Table 5-10 The top 10 sector and region combinations for final consumption in the EU27 showing the sector and region where agricultural and forestry products involving deforestation were produced (2004)
Sector of deforestation Region of Deforestation Total (1000ha) Share of EU27 consumption (%)
Oil seeds (soy) Brazil 143 19.5 Cattle,sheep,goats,horses Brazil 140 19.1 Oil seeds (soy) Argentina 52 7.0 Crops nec Nigeria 36 4.9 Oil seeds (soy) Paraguay 27 3.8 Cereal grains nec Brazil 25 3.3 Crops nec Rest of Western Africa 24 3.3 Oil seeds (palm) Indonesia 18 2.5 Oil seeds (palm) Malaysia 17 2.3 Sugar cane Brazil 12 1.6
Rest of World 238 32.6 Share of EU27 494 67.4

CHAPTER 5 Embodied deforestation in final consumption of goods and services in the EU27 – detailed analysis of current consumption and recent trends
138
The preceding figures gave a first insight into how the EU27 consumed embodied deforestation from different countries, from different causes of deforestation and the products or sectors where they are consumed within the EU27. They provide a general overview as they combine different analyses in one figure. The following sub-sections consider these results in more detail and from different aspects to give a detailed and complete understanding of the role of the EU27 final consumption on global deforestation.
→ Origin of imports into the EU27 by region and land category
For land use it was shown that for the imports into a given region, the key import partners vary significantly depending on the region; most likely due to geographic location, trade agreements, economic relations, etc (Figure 5-5). In the case of deforestation, the origin of the imported deforestation is dominated by countries with high rates of deforestation (Figure 5-4). Figure 5-12 shows the origin of embodied deforestation imported into the EU27, China, Japan, and the USA. The most important source of embodied deforestation imported into the EU27, China, Japan, and the USA is Brazil). Argentina is also a large source of embodied deforestation imported into the EU27 and China, but not for Japan and the USA. Indonesia is relatively more important for Japan and the USA compared to the EU27 and China. Mexico is the third most important source of embodied deforestation imported into the USA. Other important sources of embodied deforestation imported into other regions include Nigeria, Paraguay, Malaysia, and Cambodia.
Important findings: • When allocating deforestation to the sector and region where the goods and services
were finally produced we found that most of the goods and services were finally produced in the EU27 using imported agricultural or forestry products.
• In the top 10 sector and region combinations, the only non-EU27 final production was meat production in Brazil, all other final production of consumed goods and services underwent their final transformation in the EU27.
• When allocating deforestation to the sector and region where the agricultural and forestry commodities were sourced, we found that the EU27 sources agricultural products from a variety of different countries and sectors with an important country being Brazil, representing about 40% of deforestation.

CHAPTER 5 Embodied deforestation in final consumption of goods and services in the EU27 – detailed analysis of current consumption and recent trends
139
Figure 5-12 The origin of embodied deforestation imported into the EU27, China, Japan, and the USA and used to meet final consumption in each region (2004). The pie charts cover deforestation for cropland, pastures and due to logging, but only countries covering 75% of the total are shown explicitly.
Focussing on the EU27, the source of embodied deforestation imported into the EU27 varies depending on the type of land use which leads to the deforestation (Figure 5-13). Brazil is particularly important for deforestation leading to all land uses, but particularly for deforestation for pastures and cropland. About 74% of deforestation embodied in imports of ruminant livestock products (from pasture deforestation) into the EU27 originates in Brazil and 40% of deforestation embodied in imports of crop products originates in Brazil. The next most important countries for deforestation leading to different types of land use vary considerably. For deforestation leading to cropland, the top three are Brazil (40% with the top three representing soy beans, and some sugar cane and maize), Argentina (11%, soy beans), and Nigeria (8%, top three are cocoa beans, groundnuts and a variety of vegetables). For deforestation leading to pastures Brazil dominates with 74%, but Cambodia is also significant with 6%. For the EU27, deforestation due to logging is dominated by imports from Indonesia (29%) and Brazil (28%). Thus, the ranking of countries varies depending on the type of land use following the deforestation.

CHAPTER 5 Embodied deforestation in final consumption of goods and services in the EU27 – detailed analysis of current consumption and recent trends
140
Figure 5-13 The origin of embodied deforestation by land use type imported into the EU27 for final consumption in the EU27 (2004). The pie charts show deforestation per deforestation category, but only countries covering 75% of the total are shown explicitly.
→ The importance of different consuming sectors for EU27 final consumption
Figure 5-8 to Figure 5-11 showed the top-5 sectors of final consumption in the EU27 that are associated with deforestation. This sub-section considers the sectors of final consumption in the EU27 in more detail.Within the model used in this chapter, there are a total of 57 sectors that can be used by final consumption (Annex J). Table 5-11 shows the embodied deforestation for the sectors of final consumption in the EU27, but aggregated from 57 sectors to 7 sectors for ease of comparison. Figure 5-14 extends Table 5-9 to additionally show the results disaggregated by sector covering 75% of the total. The sectors containing the greatest share of embodied deforestation vary by type of land use following deforestation. For total deforestation at the aggregated sector detail, non-meat based food is allocated the largest share of embodied deforestation (42%), followed by services (22%), meat-based food (18%), then clothing and textiles with 6%, and a variety of wood-based sectors (5%). It is important to note that “non-meat based food” can still
Important findings: • For the consumption of goods and services in the EU27 leading to deforestation, 48%
of the deforestation occurred in Brazil, 9% in Argentina, 6% in Nigeria, 5% in Indonesia, 5% in the “Rest of Western Africa”, and 5% in Paraguay.
o The origin of the embodied deforestation imported into the EU27 varies by the type of land use following the deforestation:Deforestation followed by cropland expansion: Brazil (40% with the top three representing soy beans, and less important: sugar cane and maize), Argentina (11%, soy beans), and Nigeria (8%, top three are cocoa beans, groundnuts and vegetables)
o Deforestation followed by pasture expansion: Brazil (74%) and Cambodia (6%) o Deforestation due to logging: Indonesia (29%) and Brazil (28%).

CHAPTER 5 Embodied deforestation in final consumption of goods and services in the EU27 – detailed analysis of current consumption and recent trends
141
include meat due to processing; common examples include a chicken salad, pizza, sandwiches containing meat, and so on Services are particularly important in a final consumption perspective for two reasons: first, the services are large (government services, business services, retailing, etc) and cover about 60% of expenditure in the EU27 (33% households, 23% government, and 4% capital) and second, the service sectors include hotels and restaurants, hospitals, education, et, and thus purchase large quantities of food, textiles, paper, wood products, etc. A weakness of this approach is that it is not possible to determine the products consumed in the services sectors, but this information is available in CHAPTER 4.
Table 5-11 The embodied deforestation allocated to the final consumption of goods and services for aggregated sectors in the EU27 (2004). The sectors shown represent the goods and services of final consumption in the EU27 and later figures show the region of deforestation. The disaggregated results are in Figure 5-14.
Total Deforestation
Cropland Deforestation
Pasture Deforestation
Logging Deforestation
Sector of consumption in the EU27
Total (10³ ha)
Share of
EU27 (%)
Total (10³ ha)
Share of
EU27%)
Total (10³ ha)
Share of
EU27 (%)
Total (10³ ha)
Share of
EU27 (%)
Food - Non Meat based 305 42 274 54 28 14 3 10
Services 164 22 127 25 32 16 5 21
Food – Meat-based 134 18 30 6 103 52 1 3 Textiles, including leather 46 6 22 4 22 11 2 9
Wood products including pulp, paper, furniture, construction
36 5 20 4 5 2 12 45
Manufacturing 25 3 18 4 4 2 2 9 Energy, chemicals, mining, transport 21 3 16 3 4 2 1 4
EU27 Total 732 100 507 100 199 100 26 100 Figure 5-14 repeats the results of Table 5-9 at a higher level of sector detail. For total embodied deforestation (bottom right pie in Figure 5-14), the top ranked sectors are processed food products (18%), meat: cattle, sheep, goats, horses (13%), wholesale and retail trade including hotels and restaurants (10%), public administration (7%), then smaller contributions from vegetable oils and fats, construction, and so on. Various manufacturing sectors are important at the aggregate, such as, leather products (3%), manufacturing including furniture (2%), wearing apparel (2%), and textiles (2%). The chemical sector, which includes biofuels, appears with only 1%, however, due to aggregation errors in the GTAP-MRIO this percentage is unreliable (but CHAPTER 4 has more detailed results on this aspect).

CHAPTER 5 Embodied deforestation in final consumption of goods and services in the EU27 – detailed analysis of current consumption and recent trends
142
Figure 5-14 Consumption of goods and services associated with deforestation allocated by sector for the EU27 (2004). The pie charts cover the different categories of deforestation and the total , but only sectors covering 75% of the total are shown explicitly. The sectors shown represent the goods and services that were consumed in the EU27, through deforestation. For a full list of sector names, see Annex J.
The ranking of sectors changes when considering the different types of land use resulting from deforestation. In the case of deforestation for cropland and at the aggregated sector level (Table 5-9), processed food is most important, followed by services (which includes food consumption via restaurants, government provisions like hospitals and schools, etc). At the more detailed level (Figure 5-14), , for embodied deforestation leading to croplands allocated to EU27 final consumption, the top ranked sectors are processed food products (22%), wholesale and retail trade (which includes hotels and restaurants) 12%, processed vegetable oils and fats purchased by consumers (9%), and then beverages and tobacco (8%). Non-agricultural sectors appear in the top rankings, though this is mainly due to services: the second most important sector is wholesale and retail trade (hotels and restaurants), the fifth most important is government services, and the ninth most important representing business services. The chemicals sector appears as the fourteenth most important, which may represent a share of biofuels, but due to potential aggregation errors it is not possible to confirm this. Meat products appear as seventh most important (processed meat) and thirteenth (unprocessed meat) and this represents both deforestation leading to pastures and deforestation leading to cropland Used in the livestock sector. Diverse manufactured and processed products accumulate to 7% of the total (Table 5-9). In the case of deforestation leading to pastures at the aggregated level(Table 5-9), meat-based food products are most important with 52%, followed by services (16%), and non-meat based food (14%, which thus may contain processed meat and other animal products). At the more detailed level (Figure 5-14), processed meat (cattle, sheep, goats, horses) are most important (42%), followed by other processed meat products (9%) and processed food products (8%). Wholesale and retail trade (which includes hotels and restaurants) represents 7%, closely followed by leather products with 7% and textiles with 2%. We find textiles (containing leather) and leather products are both important by products in the livestock sector (representing 11% at the aggregated level). Service based sectors appear as the fourth most important representing wholesale and retail trade
CHAPTER 5 Embodied deforestation in final consumption of goods and services in the EU27 – detailed analysis of current consumption and recent trends
143
(hotels and restaurants), sixth with government services, and ninth with business services. Diverse manufactured products represent about 4% (Table 5-9). In the case of deforestation due to logging at the aggregated level (Table 5-9), processed wood products, furniture, construction, etc is most important with 48% of the total, and services (25%, which includes paper, furniture, etc used in the service sectors). At the disaggregated sector level (Figure 5-14), the sector distribution is dominated by construction (22%), other manufacturing which includes furniture (9%), and then the service sectors of government administration (9%) and wholesale and retail trade (7%). The service sectors include the use of, for example, paper, furniture, etc, and due to size of the service sectors in modern economies these high shares could be expected Diverse manufactured products represent about 13% (Table 5-9).
→ The importance of different agricultural and forestry commodities for EU27 final consumption
The previous sub-section allocated embodied deforestation to the goods and services consumed in the EU27. Those goods and services, however, were produced using a variety of commodities grown on deforested land or by preceding logging. In this section, we allocate the deforestation to the commodities that are required to produce the goods and services consumed in the EU27. The results here detail Figure 5-8 to Figure 5-11. For all types of land use following deforestation (Figure 5-15 , the embodied deforestation allocated to EU27 final consumption required the production of oil seeds (54%), other crops (20%), and vegetables, fruits, and nuts (9%). These three sectors account for 83% of the imports. These results are in line with the apparent consumption analysis in CHAPTER 4, confirming the importance of oil crops A weakness of the GTAP-MRIO is the limited sector detail, and thus CHAPTER 4 contains more detail on the specific commodities within each of the aggregated sectors
Important findings: • For embodied deforestation allocated to EU27 final consumption of goods and
services we found that: o Processed food is allocated the largest share of embodied deforestation (60%,
with 18% meat and 42% other food) o The service sectors (22%) due to the high expenditure of the service sector
which purchases large quantities of food, paper, furniture, etc; due to activities in hotels and restaurants, hospitals, education, business activities, etc
o Textiles including leather (6%) o Wood and associated products (5%) o Diverse manufactured products (6%).
• The rankings change for different types of land use following the deforestation. Notable increases include:
o The allocation to processed food increases to 54% for cropland o The allocation to processed meat increases to 52% and textiles (including
leather ) to 11% for pastures o The allocation to wood products increases to 45% for logging

CHAPTER 5 Embodied deforestation in final consumption of goods and services in the EU27 – detailed analysis of current consumption and recent trends
144
such as “oil seeds” and “other crops”
Figure 5-15 Embodied deforestation allocated to EU27 final consumption requires the production of agricultural commodities. In the GTAP-MRIO there is only one commodity for pastures (livestock) and logging (forestry).
→ Re-export of imported deforestation from the EU27
The EU27 imports agricultural and forestry products which involved deforestation to produce the required final consumption in the EU27, but also, the EU27 exports some of the goods and services it produces. These exported goods and services may go to intermediate or final consumption in other countries. The results presented so far have only shown the imports required for final consumption in the EU27, and not the imports for the re-export (Table 5-12). More than 90% of the deforestation embodied in EU27 import is for EU27 final consumption. The total deforestation embodied in the import of raw or semi-processed agricultural and forestry commodities that undergo further processing in the EU27 before export represent 4.1% if the exports are for intermediate consumption elsewhere, and 3.4% if the exports are for final consumption in another country. These percentages vary slightly depending on the type of deforestation the products come from. Wood products are relatively more likely to be further processed in the EU27 before export, than crop products and ruminant livestock products. In
Important findings: • Embodied deforestation for EU27 final consumption requires the production of goods
and services based on commodities grown on deforested land. Within the aggregation of the GTAP-MRIO used in this chapter, oil seeds are most important (38%), then livestock products (27%), and other crops (14%). These results are in line with results from Chapter 4.
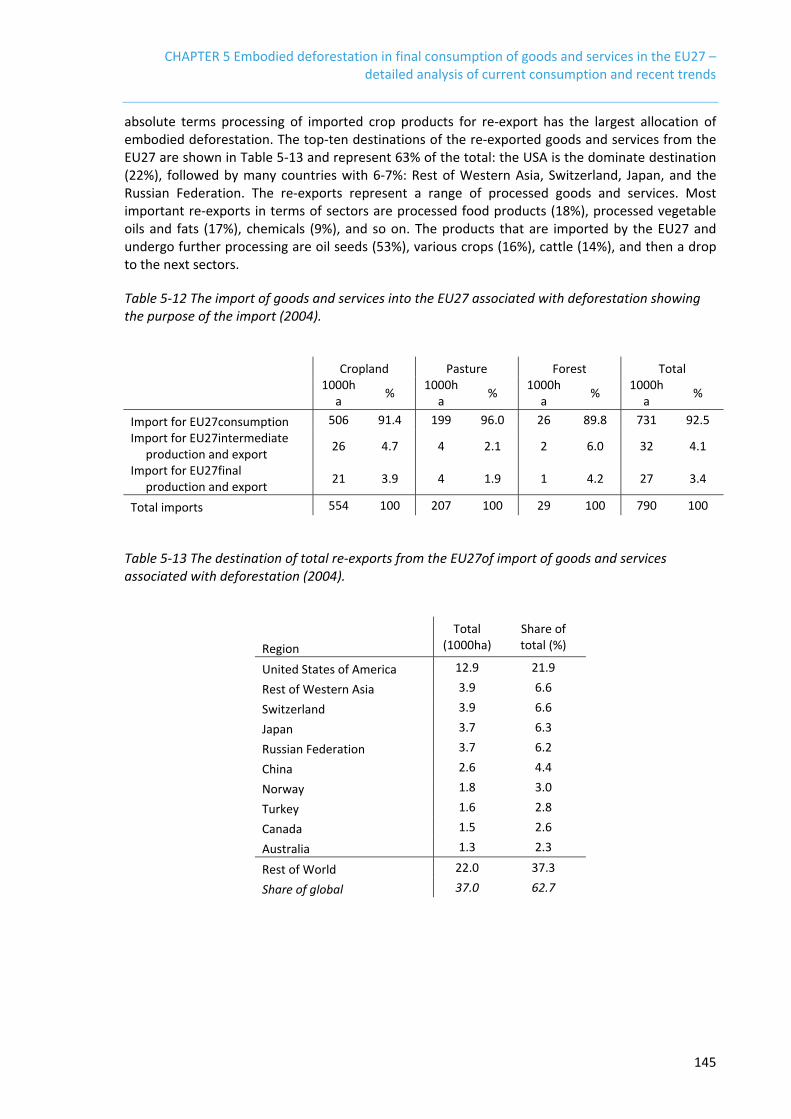
CHAPTER 5 Embodied deforestation in final consumption of goods and services in the EU27 – detailed analysis of current consumption and recent trends
145
absolute terms processing of imported crop products for re-export has the largest allocation of embodied deforestation. The top-ten destinations of the re-exported goods and services from the EU27 are shown in Table 5-13 and represent 63% of the total: the USA is the dominate destination (22%), followed by many countries with 6-7%: Rest of Western Asia, Switzerland, Japan, and the Russian Federation. The re-exports represent a range of processed goods and services. Most important re-exports in terms of sectors are processed food products (18%), processed vegetable oils and fats (17%), chemicals (9%), and so on. The products that are imported by the EU27 and undergo further processing are oil seeds (53%), various crops (16%), cattle (14%), and then a drop to the next sectors.
Table 5-12 The import of goods and services into the EU27 associated with deforestation showing the purpose of the import (2004).
Cropland Pasture Forest Total
1000h
a % 1000ha % 1000h
a % 1000ha %
Import for EU27consumption 506 91.4 199 96.0 26 89.8 731 92.5 Import for EU27intermediate production and export 26 4.7 4 2.1 2 6.0 32 4.1
Import for EU27final production and export 21 3.9 4 1.9 1 4.2 27 3.4
Total imports 554 100 207 100 29 100 790 100
Table 5-13 The destination of total re-exports from the EU27of import of goods and services associated with deforestation (2004).
Region Total
(1000ha) Share of total (%)
United States of America 12.9 21.9
Rest of Western Asia 3.9 6.6
Switzerland 3.9 6.6
Japan 3.7 6.3
Russian Federation 3.7 6.2
China 2.6 4.4
Norway 1.8 3.0
Turkey 1.6 2.8
Canada 1.5 2.6
Australia 1.3 2.3
Rest of World 22.0 37.3
Share of global 37.0 62.7

CHAPTER 5 Embodied deforestation in final consumption of goods and services in the EU27 – detailed analysis of current consumption and recent trends
146
5.4. HISTORIC TRENDS FROM 1992 TO 2008
The previous sections have estimated the role of EU27 final consumption in land use and deforestation for a single year, 2004 (using average deforestation data for 2000-2008, but economic and trade data from 2004). The objective of this section is to determine whether the EU27 has changed its share of imports relative to its domestic production. This could suggest that the EU27 is protecting its own environment at the expense of others (Mayer et al., 2005; Meyfroidt et al., 2010); intentionally or unintentionally. We first address this question for land use and then for deforestation. The method used here is based on Gross Domestic Product by expenditure and bilateral data, linked to detailed analyses in the years 1997, 2001, and 2004. In earlier sections, the specific limitations of the method are explained more broadly.
5.4.1. COMPARISON OF LAND USE OVER TIME
Of particular interest for land management is whether EU27 final consumption has led to an increase in its share of global land use. Figure 5-16 shows the temporal development of domestic land use (black line) and consumption of land use (colours) over time for the EU27, rest of the world, and globally. Land use has remained relatively stable over time (the drop after 1992 is an effect of the collapse of the former Soviet Union). The distribution of land use by land type has also remained relatively static over time, despite some subtle variations. In the rest of the world, and globally, there has been a slight increase in land use from 1995 to 2005 whereby it then drops again. However, in relative terms, the land use required to meet global consumption has remained relatively stable.
Important findings: • The EU27 imports raw or semi-processed agricultural and forestry products which
involved deforestation and further processes them for either final consumption in the EU27 or to export to other countries for final consumption or further processing.
• Of the total imports into the EU27, 93 % of the embodied deforestation remains in the EU27 with the remainder re-exported.
• The destination of the re-exports is dominated by the USA (22%) and a range of countries around 6-7%: Rest of Western Asia, Switzerland, Japan, and the Russian Federation.
• The goods and services which are re-exported are processed food products (18%), processed vegetable oils and fats (17%), chemicals (9%), etc. The products that are imported and undergo further processing within the EU27 and are re-exported afterwards are oil seeds (53%), various crops (16%) and cattle (14%)

CHAPTER 5 Embodied deforestation in final consumption of goods and services in the EU27 – detailed analysis of current consumption and recent trends
147
Figure 5-16 The land use from 1992-2008 due to final consumption in the EU27, Rest of the World, and globally. The black line represents domestic land use and the colours consumption of different types of land. Each figure has the same scale.
Other studies have reported very large changes in international trade relative to consumption over the 1990-2008 period (Peters et al., 2011b). Figure 5-17 shows the imported land use over time for the EU27, rest of the world, and globally. In contrast to the production and consumption of land use, there are underlying dynamics reflecting the growth in international trade. Whilst the EU27 has had a relatively static share of land use embodied in imports, The Rest of the World has increased its imports, particularly for cropland, and this has led to a global increase in traded land use. Since global land use has remained relatively constant, these dynamics reflect an increase in international trade in agricultural products. Since production and consumption of embodied land use is relatively constant at the global level and traded land use has increased, it implies that countries are producing less of their goods and services requiring land use domestically and instead importing them.

CHAPTER 5 Embodied deforestation in final consumption of goods and services in the EU27 – detailed analysis of current consumption and recent trends
148
Figure 5-17 The land use in other countries (imports) required to meet final consumption in the EU27, Rest of the World and Globally.
Despite the relatively static nature of the consumption and production of land use at the global level, there are some underlying dynamics at the regional level due to growth in international trade. Figure 5-18 shows the temporal development of domestic land use (black line) and consumption (colours) over time for ten regions. Regions that are net importers have remained net importers, and likewise for net exporters. The EU27 remained a similar net importer of land use throughout the period. The slight temporal changes at the global level shown in Figure 5-16 are due to reductions in output from the former Soviet Union in the early 1990’s and decreases in output in Oceania and North America in the late 2000’s. There has been growth in cropland production and consumption, most notably in Africa, South-East Asia, South and Central America (production only), and West Asia (consumption only). In the case of pasture land, the trade imbalances have remained similar over the period 1992-2008. South East Asia had a rapid increase in consumption from 2000 to 2008, while South and Central America had a drop in consumption. In all types of land, Europe has retained a similar trade balance throughout the time-period, and this was a large net import. Due to the lack of temporal changes in land use embodied in production and consumption, the static results presented previously for 2004 are likely to remain valid in other years. In other words, the relative share of the EU27’s role in global land use is likely to have remained stable over time.

CHAPTER 5 Embodied deforestation in final consumption of goods and services in the EU27 – detailed analysis of current consumption and recent trends
149
Figure 5-18 Land use as a function of time for 10 regions of the world. The black line is the total land use in each region for cropland, pasture, and forest land. The coloured bars represent consumption of the different land types over time. The rapid changes in 1992 and 1993 in the EU27 and the former Soviet Union is due to the collapse of the former Soviet Union.

CHAPTER 5 Embodied deforestation in final consumption of goods and services in the EU27 – detailed analysis of current consumption and recent trends
150
5.4.2. COMPARISON OF DEFORESTATION OVER TIME
Figure 5-19 shows deforestation allocated to final consumption in the EU27, Rest of the World and globally. Deforestation allocated to cropland, pastures, and logging has decreased slightly between the two periods considered here (1990-2000 and 2000-2008, see CHAPTER 3). Since we consider an average of two periods, the deforestation rate is constant from 1990-2000 and from 2000-2008, with the step change in 2000 representing the merging of the two time periods (see CHAPTER 3). The EU27 has kept a relatively constant share of deforestation allocated to consumption over time, though the allocation is slightly higher in the 1990-2000 period compared to the 2000-2008 period. The allocation to the EU27 was a minimum around 1997, reached a maximum around 2004 and has decreased towards 2008.
Figure 5-19 The deforestation from 1992-2008 due to final consumption in the EU27, Rest of the World, and globally. The black line represents domestic deforestation and the drop at 2000 represents the merging of the two time periods 1990-2000 and 2000-2008 (CHAPTER 3). Each figure has the same scale.
Important findings: • Global land use required for the production and consumption of goods in services has
remained relatively static from 1992 to 2008. The EU27’s share of embodied land use in final consumption has also remained static from 1992 to 2008, despite dynamics in some other regions.
• While global land use has remained static, there has been an increase in international trade in agricultural products, particularly products produced on cropland. This implies countries import relatively more compared to domestic land use over time. The EU27, however, has had little temporal development in imported land use over time.

CHAPTER 5 Embodied deforestation in final consumption of goods and services in the EU27 – detailed analysis of current consumption and recent trends
151
Figure 5-20 shows the import of agricultural and forestry products with embodied deforestation for the consumption of goods and services by the EU27, Rest of the World, and globally. The general form of the figure is quite similar to that of land use (Figure 5-17), except that the EU27 has a much greater share of imports associated with deforestation compared to land use. This reflects that the EU27 has very low domestic deforestation and hence relatively higher imports of agricultural and forestry products involving deforestation. Global deforestation rates have dropped slightly, but the traded share has grown due to rapid growth in international trade; a similar feature noted for land use. Since the share allocated to the EU27 has remained relatively constant, the growth in international trade in goods and services associated with deforestation is due to changes in the Rest of the World.
Figure 5-20 The embodied deforestation in other countries (imports) required to meet final consumption in the EU27, Rest of the World and Globally.
Figure 5-21 shows the regional changes in deforestation allocated to production and consumption. The deforestation rates are more dynamic at the regional level compared to the global level since there are noticeable changes between the two time periods 1990-2000 and 2000-2008 (black lines in the figure). Deforestation rates linked to the global consumption of deforestation embodied in agricultural and forestry products have increased in South and Central America and South East Asia, however, the other regions reporting increases have low deforestation rates. However, these changes should be put in the context of the methodology described in CHAPTER 3. Likewise, in terms of deforestation associated with final consumption (colour areas in the figure), the final consumption of goods and services associated with deforestation is more dynamic at the regional level. There has been an increase in the allocation of deforestation to final consumption in South East Asia, which tracks the slight increase in deforestation recorded there. South East Asia did not only increase its deforestation for the production of agricultural and forestry products, it also consumed more of that embodied deforestation over the period 1990-2008. There has been a

CHAPTER 5 Embodied deforestation in final consumption of goods and services in the EU27 – detailed analysis of current consumption and recent trends
152
rapid increase in the consumption of embodied deforestation in West Asia, South Asia, and the countries of the former Soviet Union and Eastern Europe, though the absolute allocation is small in these regions. Decreases were recorded in East Asia and Africa, reflecting a drop in deforestation rates. The remaining countries, including the EU27, have kept a relatively constant allocation of final consumption of goods and services embodied in deforestation.

CHAPTER 5 Embodied deforestation in final consumption of goods and services in the EU27 – detailed analysis of current consumption and recent trends
153
Figure 5-21 Deforestation as a function of time for 10 regions of the world. The black line is the total embodied deforestation in each region for cropland, pastures, and Logging. The coloured bars represent consumption of the different land types over time.

CHAPTER 5 Embodied deforestation in final consumption of goods and services in the EU27 – detailed analysis of current consumption and recent trends
154
→ Temporal developments at the detailed level
The time-series analysis is most robust at the aggregated level (see limitations), but it is possible to detail the results further. While these results are relatively robust, the time-series is based on an approximation method, and thus the results here should be verified as more recent data comes available. The sector and region changes are separated from the previous results to indicate more care is needed with interpretation. As shown in Figure 5-21, the deforestation embodied in EU27 final consumption has remained relatively static. However, there may be underlying dynamics at the sector level. Figure 5—22 shows the imported deforestation into the EU27 by sector. The figure indicates some dynamics at the sector level. Meat consumption declined from 1992-1995 and then remained relatively static, and this explains the decline from 1992 to 1995 in embodied deforestation. Embodied deforestation associated with oil seed consumption peaked in 2002 before declining towards 2008, while the consumption of vegetable oils and fats has shown rapid growth from 2000 onwards. The decrease in oil seeds since 2002 is partially compensated by an increase in vegetable oils and fats, suggesting a changing level of processing. The allocation to cereals has grown rapidly from 2006, but this signal is very short and needs verification. Most other sectors have remained relatively static over time. Figure 5—23 shows that the changes over time are driven primarily by deforestation originating in South and Central America, and Figure 5-21 shows that this is mainly due to cropland. These results primarily reflect the underlying economic trade data in the GTAP database, and are the most detailed results available in the time-series results (see limitations for details). Thus, the results should be interpreted as indicating likely developments and require further verification and analysis as more detailed data becomes available.
Important findings: • Analogous to global land use, embodied deforestation required to produce goods in
services for final consumption, has remained relatively static from 1992 to 2008. The EU27’s share of deforestation consumption has also remained static from 1992 to 2008, despite dynamics in some other regions.
• While deforestation rates have remained relatively constant in the two time periods, there has been an increase in international trade in embodied deforestation. The EU27, however, has had little temporal development in imported embodied deforestation over time.

CHAPTER 5 Embodied deforestation in final consumption of goods and services in the EU27 – detailed analysis of current consumption and recent trends
155
Figure 5-22: The imported deforestation into EU27 final consumption allocated to sector from 1992-2008. Only the sectors cumulatively covering more than 2% the total are shown explicitly, with the remaining sectors in “Others”.
Figure 5-23: The imported deforestation into EU27 final consumption allocated to region from 1992-2008.
0
0.1
0.2
0.3
0.4
0.5
0.6
0.7
1992
1994
1996
1998
2000
2002
2004
2006
2008
Mill
ion
hect
ares
Oi l seedsMeat: cattle,sheep,goats ,horseCrops necVegetable oi l s and fatsFood products necVegetables , frui t, nutsLeather productsMeat products necCereal gra ins necOthers
0
0.1
0.2
0.3
0.4
0.5
0.6
0.7
1992
1994
1996
1998
2000
2002
2004
2006
2008
Mill
ion
hect
ares
South and Centra l AmericaAfricaSouth East As iaOthers

CHAPTER 5 Embodied deforestation in final consumption of goods and services in the EU27 – detailed analysis of current consumption and recent trends
156
Together with the apparent consumption analysis in CHAPTER 4, oil seeds and derived products are important for embodied deforestation. The changes reported in this chapter suggest an increase in embodied deforestation for oil seeds from around 1998 before a shift to higher processing around 2002. Thus, at the aggregated level, there is no significant change in deforestation related to oil seeds and derived products embodied into the EU27. For 2004 it was found that the chemical sector was allocated about 3% of embodied deforestation (seeTable 5-11), but as discussed in the limitations the method applied here cannot detect a signal from biofuels. For about a decade now, the use of vegetable oils by the biofuel industry has increased. Figure 5-22 shows that compared to 2004, the use of vegetable oils by the EU27 non-food industry nearly doubled (+98%) by 2008 and increased 145% by 2011. Figure 5-23shows that this was mainly related to the use of rapeseed oil in the EU27, though the use of soybean oil for non-food uses increased 165% by 2008 and 235% by 2011 compared to 2004. For oil palm the increase was 114% in 2008 and similarly for 2011. Due to the growth in biofuel consumption, the attribution to sectors reported in this chapter may have changed from 2004 to 2008; that is, in 2008 there may be a relatively larger impact of the chemical (hence biofuel) sector (greater than 3%). Figure 5-19 and Figure 4-20 have shown that soybean imports from Brazil and Argentina have remained quite stable over the period 2004-2008, so the changes are likely to be small at the aggregated level. However, confirmation of this requires a more detailed analysis as new data becomes available. Simple temporal developments of consumption do not account for the different co-products of imported oil products between the food, feed, and fuel sectors.
5.5. SUMMARY OF KEY RESULTS
The results in this chapter cover both embodied land use and deforestation, providing complementary understanding of current and past land management. Combined, these results give a comprehensive picture of the role of EU27 final consumption in global land use and deforestation. Here we list the most important findings of the final consumption analysis:
• Only 5% of global land use for the production of goods and services from cropland, pastures and forests occurs within the EU27, yet EU27 final consumption of goods and services based on agricultural and forestry commodities globally sourced requires twice this amount of land (10% of global land use).
• The EU27 is the largest net importer of embodied cropland. The import of embodied cropland is 78% higher than its domestic cropland use. The import of embodied pastures, due to the use of ruminant livestock products, is 235% higher than domestic land use for
Important findings: • While consumption of embodied deforestation has remained relatively static at the
aggregated level, there are some dynamics at the sector level. A slight decrease in embodied deforestation is found from 1992-1995 due to a decrease associated with meat consumption. An increase due to oil seeds occurs from 1998 and a decrease from 2002 which is partially compensated by increased processing to vegetable oils and fats. The method is not sufficient to detect the role of biofuels.
• Embodied deforestation in South and Central America describes most of the temporal changes in the EU27. Given the only modest temporal changes over the period 1992-2008, the detailed analysis presented for 2004 is likely to remain robust for later years.

CHAPTER 5 Embodied deforestation in final consumption of goods and services in the EU27 – detailed analysis of current consumption and recent trends
157
pastures. For forest land the EU27 is more self-sufficient than the other two land uses, but the EU27 is still the second largest net importer of embodied forest land representing 40% of domestic forest land use.
• Due to the net import of embodied land use into the EU27, the EU27 is equally likely to have its goods and services sourced abroad as domestically.
• The import partners for the trade of embodied land use depend on the geographic location:
o The EU27 imports land use mainly from China, the Russian Federation, and Brazil; o China from the Russian Federation, Australia, and the USA; o Japan from Australia, China, and the USA; o The USA from Canada, China, and Australia.
• The import partners also vary depending on the type of land use: o For cropland imported into the EU27, the top three are Brazil, the USA, and the
Russian Federation; o For pastures, the top three are China, Rest of East Asia (Mongolia), and Brazil; o For forest land, the top three are the Russian Federation, Canada, and the USA.
• The consumption of goods and services in the EU27 was associated with 10% of global deforestation in 2004, similar to the value for global land use.
• There is little deforestation in the EU27 so the majority of the deforestation was embodied in the imports of goods and services, either directly or indirectly via processing in other countries.
• The EU27 is the largest importer of embodied deforestation. The three deforestation hotspots consume most of embodied deforestation themselves, but the EU27 is next, followed by East Asia and North America. The latter two regions can rely more upon their own land resources for consumption than the EU27 and are therefore less prone to imports of embodied deforestation from other regions.
• When combining final consumption analyses for both origin and destination of embodied deforestation consumed within the EU27 in 2004, the most important drivers are:
o The consumption of processed food products based upon imported oil crop products from Brazil, Argentina and to a lesser extent other imported oil crop products from other regions.
o The consumption of processed meat from Brazil is the second most important driver.
• When final consumption is further disaggregated according to different types of land use following deforestation- cropland, pasture, logging- more detailed analysis is possible for specific products which did not clearly appear in the apparent consumption analysis:
o Leather products: Brazil was the most important origin of embodied deforestation associated with leather products, though compared to other products, the allocation is relatively small.
o For manufactured wood products: Indonesia, Brazil and many other Asian countries are the main origins of deforestation embodied in imported wood products, although the shares are relatively small.
• When allocating deforestation to the sector and region where the goods and services were produced before final consumption we found that most of the goods and services were finally produced in the EU27 using imported agricultural or forestry products. In the top 10 sector and region combinations, the only non-EU27 final production was meat production in Brazil, all other final production of goods and services underwent their final transformation in the EU27.
• When allocating deforestation to the sector and region where the agricultural and forestry commodities were sourced, we found that the EU27 sources agricultural products from a

CHAPTER 5 Embodied deforestation in final consumption of goods and services in the EU27 – detailed analysis of current consumption and recent trends
158
variety of different countries and sectors with an important country being Brazil, representing about 40% of deforestation.
• When allocating deforestation to the final consumption of processed goods and services in the EU27 we found that food dominates the impact (60%, with 18% meat and 42% other food). The service sectors are next important (22%) though this is due to high expenditure and consumption of food products in addition to paper, furniture, etc. Wood and associated products represent 5%, and interestingly textiles including leather (6%) and manufactured products (3%) are significant.
• When allocating deforestation to the commodities grown on deforested land required to produce goods and services for EU27 final consumption we found that imports of oil seeds were most important (38%), then livestock products (27%), and crops (14%). These results are in line with results from the preceding chapter.
• The EU27 imports raw or semi-processed agricultural and forestry products which involved deforestation and further processes them for either final consumption in the EU27 or to export to other countries for final consumption or further processing.
• Of the total imports into the EU27, 93 % of the embodied deforestation remains in the EU27 with the remainder re-exported.
• The destination of the re-exports is dominated by the USA (22%) and a range of countries around 6-7%: Rest of Western Asia, Switzerland, Japan, and the Russian Federation.
• The goods and services which are re-exported are processed food products (18%), processed vegetable oils and fats (17%), chemicals (9%), etc. The products that are imported and undergo further processing within the EU27 and are re-exported afterwards are oil seeds (53%), various crops (16%) and cattle (14%)
• Global land use required for the production and consumption of goods in services has remained relatively static from 1992 to 2008. The EU27’s share of embodied land use in final consumption has also remained static from 1992 to 2008, despite dynamics in some other regions.
• While global land use has remained static, there has been an increase in international trade in agricultural products, particularly products produced on cropland. This implies countries import relatively more compared to domestic land use over time. The EU27, however, has had little temporal development in imported land use over time.
• Analogous to global land use, embodied deforestation required to produce goods in services for final consumption, has remained relatively static from 1992 to 2008. The EU27’s share of deforestation consumption has also remained static from 1992 to 2008, despite dynamics in some other regions.
• While deforestation rates have remained relatively constant in the two time periods, there has been an increase in international trade in embodied deforestation. The EU27, however, has had little temporal development in imported embodied deforestation over time.
• At the sector level, there are some underlying dynamics. The most significant are changes in oil seeds and derived products, leading to a small net effect because this is partially compensating each other. The method is not robust to detect the role of biofuels.

CHAPTER 5 Embodied deforestation in final consumption of goods and services in the EU27 – detailed analysis of current consumption and recent trends
159
5.6. CONCLUSION AND DISCUSSION
This chapter has considered the land use and deforestation embodied in the final consumption of goods and services in the EU27 and nine other key world regions. The modelling uses the detailed agricultural and forestry commodities from CHAPTER 3 (embodied deforestation) and Chapter 4 embodied land use from LANDFLOW) as input and transforms them into more aggregated and broad sectors of production and consumption (57 sectors in each of the 112 regions as shown in Annex B). A global and sector level data set (GTAP-MRIO) has been used to enumerate the global supply chain and allocated deforestation to final consumption. The dataset and modelling traces unprocessed agricultural commodities produced on deforested land through various levels of processing in different countries to link deforestation with the final consumption of households, government, and capital investments at the sector level. CHAPTER 4 of this report provides more detail at the commodity level, but with less processing. The results in this chapter are, therefore, complementary to those in CHAPTER 4. In summary, the origin of the deforestation associated with final consumption in the EU27 is centralized in key regions and sectors (e.g., Brazil with oil seeds and meat, Argentina with oil seeds, Indonesia with oil seeds and wood, Nigeria with a variety of agricultural commodities, etc). However, when these commodities are reallocated to the goods and services that are consumed in the EU27, we find that a diffuse range of goods and services are important. The EU27 produces a large share of the goods and services consumed in the EU27, but using raw and semi-processed agricultural and forestry commodities imported from other regions. The sectors of final consumption with the largest allocation of deforestation are dominated by agricultural and food products, but processed products are often important, such as furniture and clothing. We found that service sectors had a surprisingly high impact, and this is due to a high share of expenditure on services and the use of processed products like food and paper in the service sectors. Thus, while the location and commodities of deforestation are quite specific, the goods and services consumed that contain deforestation are quite diffuse. Studies generally find that consumption is strongly correlated to income, but we found that even the poorest countries consume a large share of embodied deforestation. This is primarily since a large share of the current deforestation occurs in poor countries, and the largest share of deforestation is used for goods and services consumed within the country of deforestation. The centralized nature of deforestation, and the diffuse nature when allocated to final consumption, may give support for a larger focus on production-side policies as opposed to consumption-side policies. On the one hand, estimating the deforestation embodied in the thousands of highly processed goods in a supermarket, or more broadly used in service sectors or construction, may be an unachievable task. However, consumers could be given broad recommendations on goods and services generally containing high levels of embodied land use and deforestation, such as meat products. On the other hand, specific policies addressing current, and possibly future, deforestation hot-spots may alleviate the need for consumption-side policies and additionally have a greater coverage as both the domestic consumption and exports of commodities grown on deforested land may be captured. Though, to address the consumption and production of deforestation requires a deeper analysis of specific policies and their efficiencies, as following reports in this project will elaborate. The EU27 has virtually no current deforestation, with its current land use patterns based on a legacy of deforestation in the past. Of the world regions considered, the EU27 is the largest importer of goods and services associated with land use and deforestation. Though, despite increases in the global trade of agricultural commodities, the EU27 has kept its import of embodied land use and deforestation relatively stable over time. Our results indicate a complex and long

CHAPTER 5 Embodied deforestation in final consumption of goods and services in the EU27 – detailed analysis of current consumption and recent trends
160
global supply chain, with high levels of processing, presenting challenges for regulation. The agricultural commodities grown on deforested land are relatively concentrated amongst a few key product lines: livestock and oil seeds. These agricultural commodities are rarely purchased by final consumers, and instead, undergo several layers of transformation before entering final consumption as highly processed goods and services. The EU27 is also responsible for the largest share of final processing and packaging before sale to final consumers in the EU27, and this may have the effect of masking inputs which were ultimately sourced from deforested land. While the global supply chain and high levels of processing makes regulation challenging, the results do indicate that there are several possible points of intervention. These issues will be taken up in later reports in the project.

CHAPTER 6 Foresight scenarios of consumption trends within the EU27 in relation to land use and deforestation towards 2030
161
CHAPTER 6 FORESIGHT SCENARIOS OF CONSUMPTION TRENDS WITHIN THE EU27 IN RELATION TO LAND USE AND DEFORESTATION TOWARDS 2030
6.1. INTRODUCTION
The analysis made in the preceding chapters shows that in the EU27, the food sector is most associated with deforestation. This is mainly due to the consumption of oil crop products, like oilseed meals and vegetable oils, used in both the food and feed sector, and to a lesser extent to imported livestock products. Soybean cake imported as such or as soybeans from South America proved to be the decisive factor for deforestation associated with EU27 consumption. Soybean cake is used as feed for EU27 livestock to produce meat. Recent developments in biofuel policies and additional claims on the resources from the forestry sector will potentially also in the future have an effect on land use and deforestation. Additional data to the analysis has shown that in 2011, the amount of vegetable oil used by the industry was almost as high as the amount used for food(Figure 5-22). This increase was mainly due to the increased use of rapeseed oil, though also the use of palm oil and soy oil by the industry has doubled or more than doubled. The amounts of imported palm oil and soybean oil (through the import of soybeans, crushed in EU27 oil mills) in 2011 were small compared to the use of rapeseed oil for biodiesel production. Moreover, in 2011, the amounts of palm oil and soybean oil used by the non-food industry were as high as the amounts used in the food industry. The use of vegetable oils and meat by the EU27 food industry, however, remained stable in recent years. To assess the potential role of these drivers in the future, we developed indicative foresight scenarios for the EU27 to describe what changes may arise in the future. We consider foresights in three main areas:
• Current food consumption in the EU27, the composition of the diets and scenarios up to 2030 based on the United Nations population scenarios, historic trends in food consumption and projections by the Organisation for Economic Co-operation and Development (OECD), FAO and the Food and Agriculture Policy Research Institute (FAPRI). This allows for the assessment of the relative impact of changes on the composition of EU27 citizens diets with regard to meat consumption effects in relation to land use and deforestation;
• Biofuel (broadly defined) consumption as this new application of biomass from land resources may increase our demand for land and might cause additional deforestation. However, to comply with the Renewable Energy Directive and the Fuel Quality Directive to reach emission targets, biofuels need to meet certain sustainability criteria. These sustainabillity criteria describe for instance that raw material for biofuels will not be obtained from land with high biodiversity or carbon stock such as primary forest and other wooded land. For this reason, it is not possible to attribute direct impacts on deforestation to biofuels in a forecast. Indirect impacts can be attributed through iLUC and are heavily debated. These are outside the scope of the present study. For completeness, reference to predicitions from two recent studies on biofuels are given. Wood consumption or solid biomass consumption for stationary energy applications (electricity and heat) may increase pressure on forest resources and cause additional deforestation. Foresight on amounts of wood have been calculated from the NREAPs submitted by the EU27 Member States.

CHAPTER 6 Foresight scenarios of consumption trends within the EU27 in relation to land use and deforestation towards 2030
162
The scenarios for food have been developed for 2030, while the biofuel and solid biomass foresights are up to 2020, as the latter are policy-driven by the EU Directives on renewable energy and fuel quality36. The scenarios are designed as a basis for discussion as they provide potential futures that can be shaped by policy interventions. We do not develop scenarios on where resources are sourced in the future since these are very much dependent upon future developments in international policy, trade agreements and international commodity price differences. This can be shaped by policy interventions as well.
6.2. DATA AND METHODOLOGY
6.2.1. FOOD CONSUMPTION DATA AND METHODOLOGY
Estimating the demand for food can be done by multiplying population figures by per capita consumption (Lambin and Meyfroidt, 2011; Boucher et al., 2011). In the following, we treat both data sources and the limitations to these data in relation to the foresights for land use or deforestation in 2020 and 2030.
→ Population – EU27 demography towards 2030
The 2010 revision of the UN World Population prospects includes population observations and projections for 1950-2100 (United Nations, 2011). Figure 6-1 shows the historical EU27 population growth as well as the predicted population growth based on three different fertility levels. The high population projection shows a steady increase, following the trend of observations and without an upper limit. The medium projection flattens out at the current population level and stabilizes at around 500 million citizens. The low population projection shows a peak at the current level, and then declines. The range of the spread of population projections for 2100 is quite large, from 300 million citizens in the low scenario to more than 750 million in the high scenario. Thus, there is a high level of uncertainty in the future population size of the EU27, even in the 2020-2030 time horizon. For 2030, the UN prospects a range between 491 and 539 million EU citizens, with the middle fertility level at 516 million. All three show an increasing population size over time, though the low fertility prospects levels of about 500 million and then declines.
36 The Renewable Energy Directive (2009/28/EC) requires the EU to have 20% renewable energy by 2020, and a part of that goal is a 10% target for the transport sector. The Fuel Quality Directive (98/70/EC) requires fuel suppliers to lower the GHG intensity of their fuels with at least 6% by 2020. The majority of the 10% and the 6% targets is expected to be achieved by using biofuels.

CHAPTER 6 Foresight scenarios of consumption trends within the EU27 in relation to land use and deforestation towards 2030
163
Figure 6-1 EU27 population growth as measured and predicted by the UN.
In the following analysis on EU27 consumption over time, we have used the medium population projection as a reference to 2030 as it is more likely that the EU27 population will evolve according to a conservative estimate, rather than to one of the extremes.
→ Per capita food consumption foresights
Total per capita food consumption levels
Total per capita food consumption levels as well as future trend projections are available in aggregated and to some extent in disaggregated form from the FAO, the World Health Organisation (WHO) and the Food and Agriculture Policy research Institute (FAPRI). Depending on the way they are expressed, data are available up to 2015, 2020 or 2030. Projection which go further in time (2030) have much less detail and are generally only expressed in kcal. Projections for consumption expressed in kg for different meat products are only available for 2015 or 2020. Projections reaching up to 2030 are mainly expressed in dietary energy (kcal) and are focused on macro-nutrients or food groups, as these projections are used for nutritional health purposes. Figure 6-2 shows the evolution of average food availability for developing, industrialized and transition countries (former plan economy led countries) and projections up to 2030. Food availability in transition countries used to be higher than in industrialized countries but after the fall of the former Soviet Union, food availability dropped under industrialized country levels. This decline in transition countries is likely to revert and food availability is expected to increase for all three country groupings. For industrialized countries, this trend is clearly levelling off. Projections for 2030 average food availability show an increase to on average 3,000, 3,200 and 3,500 kcal respectively for developing, transition and industrialized countries (FAO, 2003).
0
100
200
300
400
500
600
700
800
1950 1970 1990 2010 2030 2050 2070 2090
Mill
ions

CHAPTER 6 Foresight scenarios of consumption trends within the EU27 in relation to land use and deforestation towards 2030
164
Figure 6-2 Global per capita food consumption (Source WHO and FAO, 2003)
While dietary energy and other figures on macro- and micro-nutrients are very valuable from a nutritional health point of view, a food consumption analysis from an environmental point of view requires another focus, even more so when information about land use and deforestation is concerned. A valuable division is a split-up between food from vegetable origin on the one hand and from animal origin on the other hand, as the former requires considerably less land (see also Gerbens-Leenes and Nonhebel, 2002; Pimentel and Pimentel, 2003). Figure 6-3 shows the evolution of the food consumption split-up between food from vegetable and animal sources. The figure shows a similar decline in the transition countries in the 1990s as in Figure 6-2, but it also indicates that food from animal sources is levelled off at a certain development level. While food consumption is rising with increasing development, meat consumption has some particularities. With an increasing income, meat consumption is steeply rising to increase its share in the overall diet, but is then levelled off. In general, the meat consumption increases with development and levels off at about 90kg/cap/y (FAO, 2006), based on FAO consumption data. There are, however, exceptions to this general rule: in the USA, the average meat consumption is higher than 120kg/cap/y.
0
500
1000
1500
2000
2500
3000
3500
4000
1964-19661974-19761984-19861997-1999 2015 2030
kcal
per
capi
ta p
er y
ear
Developing Countries Industrialized countries Transition countries

CHAPTER 6 Foresight scenarios of consumption trends within the EU27 in relation to land use and deforestation towards 2030
165
Figure 6-3 Global per capita food consumption split-up between food from vegetable and animal sources (Source WHO and FAO, 2003)
FAO-OECD (2011) and FAPRI (2010) projections show that EU27 meat consumption is levelling off in 2015 and 2020 respectively. For illustrative reasons, we reproduce an EEA graph (2007) based on FAPRI projections (Figure 6-4).
Figure 6-4 Meat consumption in the EU25, Source: EEA,2007 (SEE = South East Europe comprising a.o. Romania and Bulgaria; EECCA = Eastern Europe, Caucasus and Central Asia).
On top of this disaggregation between food from vegetable and animal sources, a split-up between the different types of meat is important for foresight scenarios in relation to land use and deforestation. Gerbens-Leenes and Nonhebel (2002) point out the specific land use efficiency of different meat types (see also FAO, 2006 and Galloway et al., 2007). Westhoek et al. (2011) made a compilation of LCA studies for dairy and meat production in the EU27 on land use efficiency for different meat and dairy products. Beef and veal production systems have the lowest land use efficiency. The absolute difference in land use efficiency, however, is very much dependent on the exact production system type.
0500
1000150020002500300035004000
Tota
l
Vege
tabl
e
Anim
al
Tota
l
Vege
tabl
e
Anim
al
Tota
l
Vege
tabl
e
Anim
al
Tota
l
Vege
tabl
e
Anim
al
1967-1969 1977-1979 1987-1989 1997-1999
kcal
per
cpita
per
year
Developing Countries Industrialized countries Transition countries

CHAPTER 6 Foresight scenarios of consumption trends within the EU27 in relation to land use and deforestation towards 2030
166
Figure 6-5 shows the consumption trends of different meat types for FAPRI (2010) and OECD-FAO (2011) data. Apart from the differences between the two datasets in absolute terms, both show a decreasing trend for beef and veal consumption and an increasing trend for pork and poultry consumption in the EU27. Lamb meat consumption remains quite stable but is low in absolute levels.
Figure 6-5 FAPRI (2010) and OECD-FAO (2011) foresight scenarios for meat consumption of different meat types (cwe: carcass weight equivalent, rtc: ready-to-cook weight). Apart from the differences in absolute volumes per capita for the different meat types, both data sources show similar trends.
Limitations to the per capita food consumption level statistics and the issue of food waste
All available past, present and foresight food consumption statistics are based on food supply data. The FAO has estimated EU27 food supply for nearly five decades now. FAOSTAT estimates both Food Balance Sheets (FBSs) and food supplies. FBSs give a complete picture of supply (including production, imports, stock changes and exports) and utilization (including final demand in the form of food use and industrial non-food use, intermediate demand such as animal feed and seed use, and waste) by commodity. From these data, the average per capita supply of macronutrients (i.e. energy, protein, fats) can be derived for all food commodities. Although such average per capita supplies are derived from national data, they may not correspond to the actual per capita availability, determined by many other factors such as inequality in food access. Likewise, these data refer to an “average amount of food available for consumption”, which for a number of reasons (e.g. waste at household level) is not equal to the average food intake or average food consumption. In the remainder of this chapter, therefore, the terms “food consumption” or “food intake” should be read as “food available for consumption”. The assessments of food consumption based on national statistics do not fully take into account this factor and are based on what is supplied to national consumers rather than on the actual intake (FAO, 2006; Kearny, 2010). Due to food waste, a share of food supply is not necessarily consumed. While estimates of waste in the food sector show large ranges due to different
0
5
10
15
20
25
30
35
40
45
50
1999 2001 2003 2005 2007 2009 2011 2013 2015 2017 2019
kg p
er ca
pita
FAPRI Beef and Veal (cwe)
FAPRI Pork (cwe)
FAPRI Poultry (rtc)
FAPRI Lamb (cwe)
OECD-FAO Beef and Veal (cwe)
OECD-FAO Pork (cwe)
OECD-FAO Poultry (rtc)
OECD-FAO Lamb (cwe)
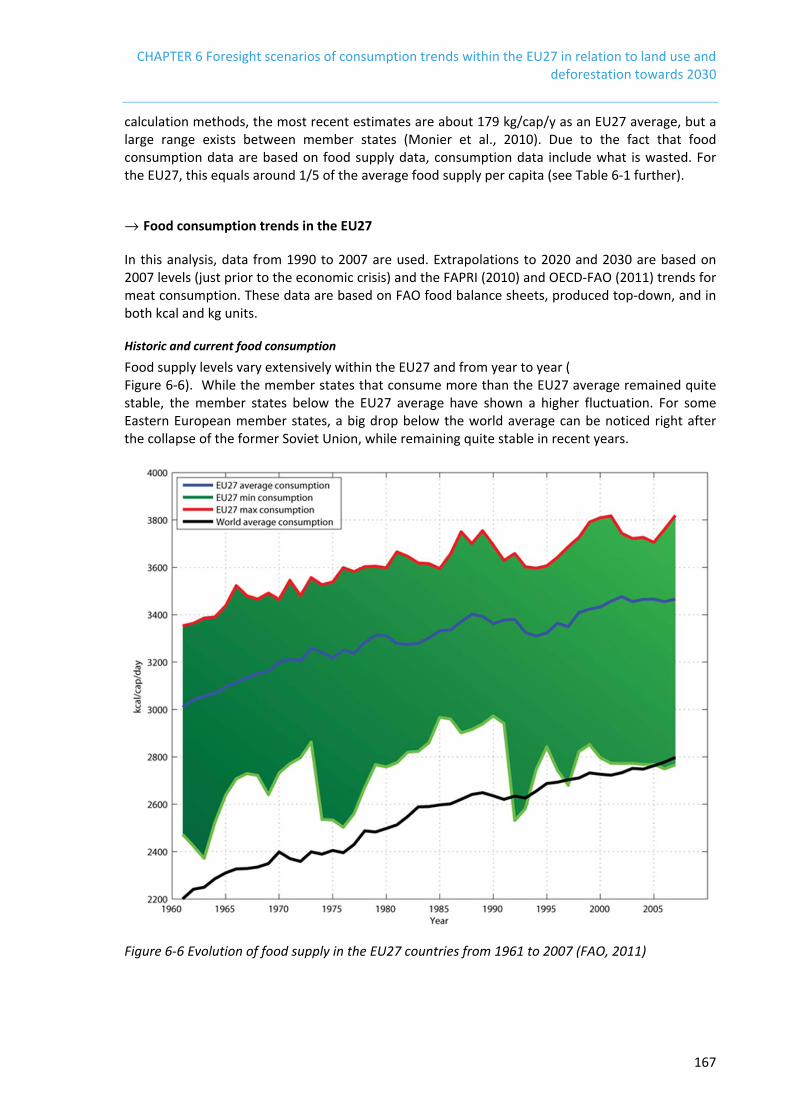
CHAPTER 6 Foresight scenarios of consumption trends within the EU27 in relation to land use and deforestation towards 2030
167
calculation methods, the most recent estimates are about 179 kg/cap/y as an EU27 average, but a large range exists between member states (Monier et al., 2010). Due to the fact that food consumption data are based on food supply data, consumption data include what is wasted. For the EU27, this equals around 1/5 of the average food supply per capita (see Table 6-1 further).
→ Food consumption trends in the EU27
In this analysis, data from 1990 to 2007 are used. Extrapolations to 2020 and 2030 are based on 2007 levels (just prior to the economic crisis) and the FAPRI (2010) and OECD-FAO (2011) trends for meat consumption. These data are based on FAO food balance sheets, produced top-down, and in both kcal and kg units.
Historic and current food consumption
Food supply levels vary extensively within the EU27 and from year to year ( Figure 6-6). While the member states that consume more than the EU27 average remained quite stable, the member states below the EU27 average have shown a higher fluctuation. For some Eastern European member states, a big drop below the world average can be noticed right after the collapse of the former Soviet Union, while remaining quite stable in recent years.
Figure 6-6 Evolution of food supply in the EU27 countries from 1961 to 2007 (FAO, 2011)

CHAPTER 6 Foresight scenarios of consumption trends within the EU27 in relation to land use and deforestation towards 2030
168
The EU27 weighted average consumption has increased by 15% from 1961 to 2007. The average EU27 consumption level is high compared to the world average consumption. While the world average consumption from 1990 to 2007 was around 2,700 kcal/cap/day, EU consumption was more than 3,400 kcal/cap/day, but remained quite constant during the last years. Meanwhile, the world average is still on the rise. For comparison, the USA has one of the highest averages with 3,650 kcal/cap/day, while Eritrea has the world’s lowest average consumption with less than 1,550 kcal/cap/day.
Adaptability of EU27 food consumption habits
As explained above, the evolution of total food consumption does not reveal the underlying changes in diets that are far more informative, especially with regard to environmental impacts, and in particular from the point of view of the land use impact of different food categories. Figure 6-7 shows the changes in the average EU27 diet over the period 1990-2007. The average EU27 citizen changed its diet over these years by eating less animal products (except for aquatic products), more non-animal products, mainly due to the increase in cereal consumption. Over this 18 year long period, the average EU27 citizen has clearly started to substitute animal fats (butter) for vegetable oils (margarine), potatoes for cereals (pasta), and decreased consumption in alcoholic beverages. However, the amount of calories, fats and proteins consumed is still well above recommended values, even when the difference between supply and actual intake is taken into account.

CHAPTER 6 Foresight scenarios of consumption trends within the EU27 in relation to land use and deforestation towards 2030
169
Figure 6-7 Change in diet composition for the average EU27 diet(kcal/day) from 1990-2007
Total volume of EU27 average food consumption
As production, consumption and trade data are usually expressed in volumes or weights, kcals have to be transposed into these units to calculate land use effects. The average 2007 EU27 diet of 3.465,61 kcal/day is presented in Table 6-1. In energy terms, this average diet contains 70% of non animal-based food and 28% of meat and dairy. In total weight, the ratio is 62% non-animal based food and 36% meat and dairy. The average EU27 meat consumption (86.16 kg/cap/y) is around the level where meat consumption levels off (FAO, 2006).
-60 -40 -20 0 20 40 60 80 100 120 140
Aquatic Products, Other + (Total)
Fish, Seafood + (Total)
Animal Fats + (Total)
Eggs + (Total)
Meat + (Total)
Milk - Excluding Butter + (Total)
Offals + (Total)
Alcoholic Beverages + (Total)
Cereals - Excluding Beer + (Total)
Fruits - Excluding Wine + (Total)
Miscellaneous + (Total)
Oilcrops + (Total)
Pulses + (Total)
Spices + (Total)
Starchy Roots + (Total)
Stimulants + (Total)
Sugar & Sweeteners + (Total)
Sugarcrops + (Total)
Treenuts + (Total)
Vegetable Oils + (Total)
Vegetables + (Total)
TOTAL Aquatic food
TOTAL Animal food: meat+dairy (land)
TOTAL 'Vegetarian' food(land)
GRAND TOTAL
change kcal/day

CHAPTER 6 Foresight scenarios of consumption trends within the EU27 in relation to land use and deforestation towards 2030
170
Table 6-1 Average EU27 consumption (3,465.61 kcal/day) per day and per year in 2007 (supply data)
food category daily energy content daily weight kg/year kcal/day % g/day % Aquatic Products, Other (Total) 0.10 0% 0.25 0% 0.09
Fish, Seafood (Total) 47.81 1% 60.36 2% 22.03
Animal Fats (Total) 204.57 6% 36.44 1% 13.30
Eggs (Total) 4810 1% 34.08 1% 12.44
Meat (Total) 390.96 11% 236.05 9% 86.16
Milk - Excluding Butter (Total) 322.70 9% 661.32 24% 241.38
Offals (Total) 9.89 0% 8.63 0% 3.15
Alcoholic Beverages (Total) 187.64 5% 298.85 11% 109.08
Cereals - Excluding Beer (Total) 946.39 27% 342.63 13% 125.06
Fruits - Excluding Wine (Total) 120.73 3% 286.11 11% 104.43
Miscellaneous (Total) 5.37 0% * * *
Oil crops (Total) 25.54 1% 9.32 0% 3.40
Pulses (Total) 24.79 1% 7.32 0% 2.67
Spices (Total) 5.23 0% 1.67 0% 0.61
Starchy Roots (Total) 138.45 4% 209.81 8% 76.58
Stimulants (Total) 30.13 1% 22.88 1% 8.35
Sugar & Sweeteners (Total) 373.38 11% 107.34 4% 39.18
Sugar crops (Total)** - 0% - 0% -
Treenuts (Total) 30.81 1% 13.51 0% 4.93
Vegetable Oils (Total) 470.80 14% 53.10 2% 19.38
Vegetables (Total) 82.22 2% 321.45 12% 117.33
TOTAL Aquatic food 47.91 1% 60.60 2% 22.12 TOTAL Animal food: meat+dairy (land) 976.22 28% 976.52 36% 356.43 TOTAL Non-animal food (land) 2,441.48 70% 1,673.97 62% 611.00 GRAND TOTAL 3,465.61 100% 2,711.10 100% 989.55 * miscellaneous was not further used as it is negligible
** sugar crops end up in sugar and other composed products
→ EU27 food consumption scenarios for different diet compositions
Based on the above knowledge of historic trends and current consumption (in 2007, before the economic crisis), we can construct different basic consumption scenarios. These scenarios are based on the two extreme EU27 consumption patterns as well as on the average EU27 food consumption:
• Business as Usual scenario: all EU27 citizens consume as much as the average EU27 consumer (3,465.61 kcal/day) in 2007 by 2030, i.e. the food consumption of the average EU27 citizen remains equal;
• High scenario: all EU27 citizens consume as much as the biggest EU27 consumers (Austria, 3,818.80 kcal/day) in 2007 by 2030;
CHAPTER 6 Foresight scenarios of consumption trends within the EU27 in relation to land use and deforestation towards 2030
171
• Extremely low scenario: all EU27 citizens consume as much as the smallest EU27 consumers (Bulgaria, 2,766.11 kcal /day) in 2007.
In each scenario, medium population growth is assumed, i.e. EU27 population develops up to 516 million by 2030. As mentioned above, the caloric value of consumption is more valuable to nutritional health studies than to studies on likely environmental impact. The animal origin part of a diet has the highest impact on land use, considering food/feed conversion data for food from animal origin. Livestock’s land use includes grazing land and cropland dedicated to the production of feed crops and fodder (FAO, 2006; Galloway et al., 2007; Gerbens-Leenes and Nonhebel, 2002). Livestock represents the largest of all anthropogenic land uses (FAO, 2006). Therefore, we constructed three indicative scenarios on land use and some additional indicative scenarios for the EU27 average diet. For these latter scenarios, we made meat/dairy-substitution scenarios based on the fact that the EU27 citizen can adapt its food consumption and on the actual changes taking place in meat consumption. For each scenario, we tracked whether the intake of the maximum amount of recommended total fats, unsaturated fats and proteins are still attained upon substitution, even when taking into account average food waste levels. Daily Recommended Intakes are listed inTable 6-2.
Table 6-2 Daily recommended intake levels for macronutrients
Macronutrient Daily Recommended Intake Calorie intake 2,500 (males) – 2,000 (females) – 1,800 (children) kcal Fats 79g/day or 28kg/year of which unsaturated (23g/day of 8kg/year Proteins 63g/day or 23 kg/year (for 75 kg average person) As EU27 average food consumption is well above these recommended intakes, a substitution is not needed to attain for example the recommended protein levels. This means that animal protein intakes do not need to be replaced by additional plant proteins as these levels are already high enough. In case one would want to replace them, this would only have a minor effect on land use. We based our kg-to-land use figures for EU27 livestock production on the average amount determined by the LCA-studies compiled by Westhoek et al. (2011) and for beef and veal on figures from Gerbens-Leenes and Nonhebel (2002) as LCA data for beef and veal production are very dependent on the production system. The land use averages from Westhoek et al. reflect the EU27 situation for the composition of feed for livestock. Imported cropland (for example soy cropland from Argentina) has been taken into account. These figures are not representative for every specific situation of every EU27 member state. For an even better comparison, Gerbens-Leenes and Nonhebel (2002) suggest using country-specific data. Additional scenarios for EU27 average consumption are:
• All EU27 citizens consume as much as the average EU27 consumer but abstain from meat once a week in 2020 and 2030.
• All EU27 citizens consume as much as the average EU27 consumer but abstain from all food of animal origin once a week in 2020 and 2030. This is to evaluate the additional impact of not consuming dairy and eggs for one day in comparison to the former scenario only to abstain from meat.

CHAPTER 6 Foresight scenarios of consumption trends within the EU27 in relation to land use and deforestation towards 2030
172
• All EU27 citizens consume as much as the average EU27 consumer but instead of abstaining from meat or from food from animal origin, they choose to replace beef by chicken once a week in 2020 and 2030.
• All EU27 citizens consume as much as the average EU27 consumer but decrease their consumption of beef and replace beef 4 times a week by 1 day of chicken, 1 day of goat/lamb, 1 day of pork, and 1 day of vegetarian food in 2020 and 2030.
• All EU27 citizens become vegetarian in 2020 or 2030. This is a very extreme and unlikely scenario but informative in the context of land-use efficiency.
6.2.2. BIOFUEL CONSUMPTION AND ILUC
For the consumption of biofuels for transport, biodiesel (fatty acid methyl ester) and bioethanol are currently distinguished as the main biofuel applications. Biodiesel is the most important biofuel in the EU27 due to the high level of diesel vehicles in the EU27 car fleet. In 2010 77% of EU biofuel demand was biodiesel, 21% was bio-ethanol (EurObserv’ER, 2011). Advanced biofuels are specified within the Renewable Energy Directive under Article 21.2 as those derived from wastes, residues, non-food cellulosic material, and lignocellulosic material.These do not directly compete with food applications for their feedstock. They could, however, compete for land used for the production of wood in case wood plantations are used to produce these biofuels. In this research, we do not consider these advanced biofuels as the conversion of waste is not the focus of this study and production of advanced biofuels from wood and lignocellulosic crops will remain limited in the 2020 frame. For consumption projections up to 2020, we rely on the predictions from the IFPRI study (2011) which developed an updated version of the global computable general equilibrium model (CGE), MIRAGE-Biof, as well as a revised scenario describing the EU mandate based on the National Renewable Energy Action Plans of the 27 member states. In the IFPRI 2011 study, a stronger focus has been placed on specific feedstock Land Use Change (LUC) computation and the uncertainties surrounding these values. In the mandate scenario of the IFPRI study, it was assumed that the EU will consume 27.2 Mtoe of first generation land-using ethanol and biodiesel by 2020, involving an additional consumption of 15.5 Mtoe. Thus resulting in a total biofuel consumption that reaches 8.6 percent of the mandated target of 10 percent renewable energy in road transport fuels. According to the main findings of IFPRI (2011), the EU biofuel production will increase from 10.1 Mtoe in the baseline to 20.9 Mtoe without trade liberalization and 17.8 Mtoe with trade liberalization by 2020.
6.2.3. ADDITIONAL DEMAND OF WOOD RESOURCES THROUGH THE CONSUMPTION OF BIOMASS FOR ENERGY
While the impact of the consumption of wood products on deforestation is rather limited, it is valuable to assess the additional demand of wood products, and thus pressure on forest land, caused by the Renewable Energy Directive’s projected demand for energy from solid biomass. Traditional use of wood fuel for heating (locally) is not treated here. Estimates on future wood demand for bioenergy (solid biomass for heating and electricity) can be derived from the NREAPs using straightforward assumptions to convert the reported energetic output into wood volumes (see further). Current and past use as well as trade of bioenergy from wood is, however, a difficult task to estimate as EUROSTAT only reports on this use since January 2009. Before that date, bioenergy from wood in EUROSTAT and FAOSTAT figures are included in

CHAPTER 6 Foresight scenarios of consumption trends within the EU27 in relation to land use and deforestation towards 2030
173
broad categories like ‘wood residues’ and ‘chips and particles’. Even reporting agencies admit that the categorisation was never consistently applied (Bradley et al., 2009). The NREAPs report on biomass from forestry37, but only a few member states have been able to provide complete data and estimates, especially regarding imported versus domestically produced solid biomass from forestry. What is reported consistently and completely is the primary energy production in ktoe. Calculation from ktoe to wood volumes is done in two steps:
1. Calculation from primary energy production to energy input; 2. Calculation from energy input to wood volumes.
For step 1, some robust assumptions have to be made on the way biomass will be applied for both heating and electricity, especially regarding the fact that both these applications can be combined (e.g. in combined heat and power (CHP) plants):
• It is assumed that biogas and bioliquids, the alternative inputs for both electricity and heating, are only used for CHP as they are too valuable to be used for either heating or electricity alone;
• Efficiencies of the stationary park in the EU27 are estimated by the following averages: o Thermal efficiency of heating boilers = 90% o Thermal efficiency of CHP = 55%; o Electric efficiency of CHP = 28%; o Electric efficiency (dedicated) = 33%.
Based on these assumptions, we calculated the primary energy input for biomass for electricity and heating in Table 6-3 in million tons of oil equivalent (Mtoe).
Table 6-3 Primary energy input calculated from the NREAPs for solid biomass for energy applications
(Mtoe) Heat Electricity Total2005 49,4 17,7 67,12010 58,7 27,2 85,92015 69,4 36,7 106,12020 85,0 47,7 132,7
For step 2, we use the following parameters (Wood Fuels Handbook, 2008)38:
• 1toe = 41.868 GJ • Fresh wood water content = 43% • Fresh wood lower heating value = 9.5 GJ/ton of fresh wood • Average wood density (30% water content) = 735kg/m³ • 1 m³ RWE (round wood equivalent volume) = 0.5m³ solid wood
This results in 0. 206 toe/m³ and allows us to calculate the demand for wood in units commonly used in wood supply and trade.
37 See template : http://ec.europa.eu/energy/renewables/doc/nreap__adoptedversion__30_june_en.pdf 38 http://nuke.biomasstradecentres.eu/Portals/0/D2.1.1%20-%20WOOD%20FUELS%20HANDBOOK_BTC_EN.pdf

CHAPTER 6 Foresight scenarios of consumption trends within the EU27 in relation to land use and deforestation towards 2030
174
6.3. RESULTS
6.3.1. FOOD CONSUMPTION FORESIGHTS AND SCENARIOS
In this section, we first sketch the backdrop of global food consumption in 2030 as foresighted by OECD-FAO (2011). After that, we treat the results of the foresights and scenarios.
→ Global picture for 2030
EU27 demography and food consumption cannot be assessed without figures on the global demography and changing consumption patterns in developing countries, especially emerging economies in mind. As shown in the preceding chapters, the EU27 plays an important role as an importer and consumer of food worldwide. While the EU27 will probably remain a major importer of food and embodied land use (and deforestation) in the future, its relative role will become smaller. The OECD forecasts that global agricultural production will need to increase by more than 50% by 2030 in order to feed a population more than 27% larger and roughly 83% wealthier than today. Although it is assumed that the productivity of land will increase substantially, the global agricultural area will have to increase by roughly 10% to sustain this production, mostly at the expense of the remaining forest areas (both tropical and temperate), savannah and scrubland (Bakkes et al., 2008). Oilseeds will remain an important crop group and will outstrip grain trade. The production of oilseeds is predicted to grow to 2030 about 50% faster than the overall average agricultural production. This growth is not only boosted by an increasing demand for vegetable oil, but also by a growing demand for oilseed meals due to changing food consumption patterns in developing countries as well as the demand for biofuels. The greatest importer of oilseed is expected to remain China, doubling its imports from 2001 to 2030. To conclude, even if food consumption in the EU27 remains relatively stable at current levels, consumption growth in developing countries will add to land use changes.
→ Results of the foresights and scenarios for meat and dairy consumption in the EU27
Against this global backdrop for 2030, with land for food production becoming a scarce resource and an increasing threat to forests, changes in food consumption are even more relevant. Especially when these changes can result in more efficient land use and less deforestation. Based on the LCA land use data for different food items from animal origin and assuming a similar productivity in 2020 and 2030, calculations predict that if all EU citizens would consume meat and dairy products according to 2007 EU27 average levels (BAU), by 2020 and 2030, an additional amount of respectively 2.8 Mha and 3.6 Mha of land will be needed (Figure 6-8). If the additional consumption cannot be met through more efficient land use or the use of degraded or fallow land, this could result in deforestation, either directly or indirectly. If, under the same conditions, all EU citizens would consume according to the high scenario (Austrian diet), an additional amount of 15.6 Mha and 16.6 Mha of land will be needed.

CHAPTER 6 Foresight scenarios of consumption trends within the EU27 in relation to land use and deforestation towards 2030
175
Consumption according to the lowest EU27 food consumption standards (Bulgarian diet) can free a lot of land, but this is rather illustrative. The effect of a reduction of meat consumption, e.g. by abstaining from meat one day a week, could free land for other purposes. Eating no meat or nothing from animal origin one day a week can liberate respectively 5 and 10 Mha of land by 2020 or 2030. Diversification of meat consumption (substitution of beef for other meat products) also has beneficial effects on land use compared to the 2007 average diet. The scenarios and comparisons are indicative: the absolute values are less relevant than the comparisons between them. For the future, more detailed studies on kg-to-land use data for every single member state are recommended to allow for more valuable absolute comparisons.
Figure 6-8 Increased or decreased land use for different EU27 diets in 2020 and 2030 compared with current land use for EU27 consumption.
In general, a shift towards a healthier diet can have land use benefits by 2020 and 2030. It should be noted, however, that while cattle in general has a higer demand on land use than other livestock, poultry and pork are more dependent on protein cakes from oil crops for feed. The latter are, as shown earlier, heavily associated with deforestation. This issue highlights the importance of relating land use efficiency to deforestation. A focus on deforestation without taking into account land use efficiency is too simplistic. A reduction of food waste, which has a high potential impact, was not taken into account in these indicative foresights. Of slightly less than 1.000 kg of food supplied yearly to an average EU27 citizen, almost 200kg is wasted (Monier et al., 2011). The land use impact is difficult to assess as
-60
-50
-40
-30
-20
-10
-
10
20
30
hect
ares
Mill
ions
2020
2030

CHAPTER 6 Foresight scenarios of consumption trends within the EU27 in relation to land use and deforestation towards 2030
176
different food items have different land use efficiencies, e.g. one kg of food waste from animal origin has a much higher impact than one kg of other food waste. Figure 6-9 compiles food waste study data for different supply chains and for the food chain in general. The absolute values cited are the higher values, not EU27 average values.

CHAPTER 6 Foresight scenarios of consumption trends within the EU27 in relation to land use and deforestation towards 2030
177
Figure 6-9 Scheme of EU27 food supply, losses, waste, and intake (estimates of food waste are very much dependent upon the system boundaries of how they are calculated as well as per sector)
For further reading on the issue of food losses and food waste, we refer to Gustavsson et al. (2011) and Monier et al. (2010).
Meat supply
Slaughterhouse and transport
Retail sector
(saleable)Retail shelves Households
Household waste
containers
Consumer intake
Losses, waste Losses, waste,outdated,unsold, unconsumed
Ruminant meat: 30%Pigmeat: 25%Poultry meat : 20%(Fish: 60% is considered to be not part of fillet)
Together 20-23% or more
Dairy supply
Processing and transport
Retail sector
(saleable)Retail shelves Households
Household waste
containers
Consumer intake
Losses, waste Waste, unconsumed
Meat sector (including fish)
Dairy sector (milk and derivates, cheese, eggs)
9%
Meat and dairy chemes based on data from Westhoek et al. (2011) who cite data from UK and Dutch studiesData on the general food sector from Gustavsson et al. (2011) and Monier et al. (2010).
Losses, waste, outdated, unsold
General food sector
Food supply
Processing and transport
Retail sector
(saleable)Retail shelves Households
Household shelves and
fridge
Consumer intake
Preconsumer waste
Consumer waste: 76-115 kg/cap/y, 40% of all losses
Food waste: 280-300 kg/cap/y
Restaurants and catering
Rest/cat shelves and fridge

CHAPTER 6 Foresight scenarios of consumption trends within the EU27 in relation to land use and deforestation towards 2030
178
→ Discussion and conclusion
The relative impact of different diet compositions by 2020 and 2030 was assessed to evaluate the amount of land these behavioural changes could liberate. As shown in previous chapters, the deforestation associated with EU27 consumption is highly determined by the need to use land from beyond EU27 borders to sustain consumption. Increased land use efficiency would reduce the need for foreign land as well as the deforestation associated with this consumption. The scenarios based on different diet compositions of meat and dairy suggest that even small behavioural changes might liberate land up to 3-10 Mha by 2020, reducing the need for land abroad and thus causing less deforestation. Average land use efficiencies are used from a compilation of LCA studies,reflecting the different EU27 production systems. Possible productivity increases by 2020 or 2030 are not taken into account. The ‘Improvement of Products’ study on meat and dairy products (Weidema et al., 2008) explored options to reduce the broader environmental impact along the food supply chain and identified main improvement options in the agricultural production, food waste management and power savings. Food waste management to reduce food losses has a positive effect on all environmental impacts, including land use, as less land is needed when less food is required. Improvements in agricultural production, mainly through improved growing practise and intensification of cereal production, was identified as a way to reduce the impact of meat and dairy products on land use. The study assumed constant dietary habits. In 2009, the research was complemented by the study ‘Environmental impacts of diet changes in the EU’ (Tukker et al., 2009), exploring the effects of diet changes in the EU25 on environmental impacts in a broad sense (though not specifically on land use). Tukker et al. developed alternative diets, with healthier nutrition recommendations as a guideline: the recommendations from the World Health Organisation (WHO), the European Food Safety Authority (EFSA) and other relevant sources indicate the need to reduce consumption of red meat and dairy products to lower negative health impacts. Consequently, alternative diets were developed according to what is presumed to be feasible. However, the proposed alternative diets only marginally reduce the impact on the environment. Still, Tukker et al. recommend the shift towards alternative diets for two reasons, also relevant to our study. First, the research considered the impact on the EU25 environment. As meat production has a prominent role in environmental impacts generated along the food chain, the resulting, decreasing, imports might imply a reduced environmental pressure beyond EU25 borders. Second, the marginal effect of these dietary changes (on EU25 environment) does not outweigh the positive impact of healthier diets. In summary, current average EU27 consumption patterns combined with current livestock production systems land use efficiency will require additional agricultural land by 2020 and 2030. However, behavioural changes in food consumption towards less meat and dairy, or a more diverse meat and dairy consumption, can reduce this need and thus also the associated potential deforestation. Additionally, these changes can have positive health effects.
6.3.2. BIOFUEL CONSUMPTION PREDICTIONS IN RELATION TO LAND USE AND DEFORESTATION
On the basis of the implementation scenarios in the National Renewable Energy Action Plans (NREAPs) of the 27 Member States, we can assume that the EU will consume 27.2 Mtoe of conventional land-using ethanol and biodiesel by 2020, involving an additional consumption of 15.5 Mtoe compared to 2010. The action plans forecast that 72 percent of this will be biodiesel and 28 percent ethanol (expressed in energy content).

CHAPTER 6 Foresight scenarios of consumption trends within the EU27 in relation to land use and deforestation towards 2030
179
The IFPRI 2011 study analyzed the effects of the implementation of the EU biofuels additional mandate under two different trade policy scenarios. The study considers total land use change (LUC), comprising both direct and indirect changes. According this study, the additional biofuels mandate leads to an increase in cropland area by 1.73 up to 1.87 million hectares in 2020, according to the trade scenario. Pasture and managed forest represent the two major sources of cropland extension, followed by savannah and grasslands and finally primary forest (IFPRI, 2011). The most affected regions in terms of cropland extension are Brazil, Latin America, CIS, and Sub Saharan Africa. Note that various factors may influence these numbers – many of them are outside EU control.
→ Conclusion
Apart from an additional food consumption due to a growing world population, additional claims on crops or land due to new biomass applications will require more output from the global agricultural system. This is not different for biofuels. Additional output can be achieved in many ways. The way it will be done will heavily determine the amount of additional land needed. Eventually this might cause deforestation. Yield increases and the use of degraded land, fallow land, cropland and grazing land – if not causing iLUC – could divert this claim away from forests. Other mitigating measures are already being undertaken both on a voluntary basis through roundtable initiatives for sustainable biofuels and on a compulsory basis through the introduction of sustainability criteria for biofuels for transport in the EU27. A pending issue within these criteria, however, is iLUC.
6.3.3. SOLID BIOMASS
The results of our modelling on solid biomass needed by 2020, based on NREAP data, are shown in
Figure 6-10. For illustrative reasons, we included the projected demand calculated by the EFSOS and EFI-GTM models (Mantau et al., 2007; UNECE-FAO, 2011). These differ from our estimates due to specific differences in assumptions and parameters. Our calculations are bottom-up from the
-
200
400
600
800
1.000
2005 2010 2015 2020 2025 2030
RWE
(m³)
Mill
ions
electricity and heat EFSOS (2007)
EFI-GTM (2011) reference EFI-GTM (2011) promoting wood energy

CHAPTER 6 Foresight scenarios of consumption trends within the EU27 in relation to land use and deforestation towards 2030
180
NREAPs, while the models work top-down, based on economic parameters. Our calculations predict an increasing demand for wood in the biomass sector between 2005 and 2020.
Figure 6-10 Projected solid biomass demand for electricity and heating for the EU27 in RWE(m³), based on NREAP data and own calculations, including projected demand by the EFSOS (Mantau et al., 2007) and EFI-GTM (UNECE-FAO, 2011) models
→ Conclusion
Our calculations, based on simple assumptions to convert primary energy production into wood volumes, predict an additional demand of 318 million m³ RWE from forests between 2010 and 2020. Due to incomplete information from the NREAPs, it is unclear up to what extent this additional demand will be sourced from European forests and what part would be sourced from forests beyond EU27 borders. The European Commission (2010) states that the bulk of this bioenergy will be in the form of wood pellets from forest-based industries, increasingly coming from outside the EU (see also Sikkema et al., 2011). While in theory, the EU could supply these wood pellets domestically, it is likely that imports will increase. IEA Bioenergy Task 40 (2011) estimates a tripling of the EU demand for wood pellets by 2020 compared to the demand in 2010, against a background of an increasing global demand. The international trade of wood pellets is expected to increase by 2020 to levels between 5 and 14 times the 2010 level. The higher estimations in the IEA Bioenergy Task 40 study (2011) are a.o. based on the additional supply that countries in the Global South could deliver on the basis of biomass plantation growth.
6.4. OVERALL CONCLUSION
Above, we provided consumption foresights for the EU27 with indicative impacts on land use and potential deforestation. With current EU27 food consumption patterns, additional productive land will be needed by 2020 and 2030, though the shift towards less ruminant meat and the replacement with other meat types can already temper this additional demand. Other alternatives,
-
200
400
600
800
1.000
2005 2010 2015 2020 2025 2030
RWE
(m³)
Mill
ions
electricity and heat EFSOS (2007)
EFI-GTM (2011) reference EFI-GTM (2011) promoting wood energy
326 417
515 644

CHAPTER 6 Foresight scenarios of consumption trends within the EU27 in relation to land use and deforestation towards 2030
181
such as less meat consumption, can also liberate land and reduce the impact of EU consumption on deforestation in the future. As IFPRI (2011) points out, the additional land claim from the biofuel sector is also expected to increase the need for land and can cause additional land use change or deforestation, albeit indirectly. Stabilization of the current average meat consumption per capita by the EU27 would require an additional 2.8 Mha of land by 2020, if not met with efficiency increases in the livestock sector. An additional 1.73 – 1.87 Mha would be required for biofuels for transport based on NREAP data (IFPRI 2011). Altogether, this would require between 4.53 and 4,67 Mha of additional land, possibly resulting in additional deforestation.

CHAPTER 7 Assessment of the overall impact of EU27 consumption on deforestation
182
CHAPTER 7 ASSESSMENT OF THE OVERALL IMPACT OF EU27 CONSUMPTION ON DEFORESTATION
7.1. INTRODUCTION
In the preceding chapters, the term “embodied deforestation” was created and used to assess the impact of EU consumption on deforestation in many ways:
• To identify the exact commodity or product groups which are associated with deforestation and which commodities and products have the highest impact;
• To identify the geographical origin of these commodities and products; • To identify the final geographical location of consumption of such commodities or
products; • To identify the sectors where these products are consumed; • To compare embodied deforestation consumed in countries or regions with other trading
blocks from different points of view or for different commodity and product groups; • To evaluate the evolution of embodied deforestation over time;
These different analyses allow for a better understanding of the impact of EU27 consumption on deforestation which is relevant for identifying potential policy measures. This chapter relates the findings from the previous chapters to a sustainability perspective, provides time trends for indicators on land use and deforestation based on the LANDFLOW model (as indicated in Tender and Inception report), showing the added value to land-use based indicators like the Ecological Footprint. The ToR calls for quantifying the overall EU impact vs. the theoretical sustainable level of use/consumption, using suitable assessment tools to be proposed in the tender. In the Tender and the Task 2 inception report three assessment tools (Ecological Footprint EF, Land and Ecosystem Accounts LEAC, and Human Appropiation of Net Primary Production HANPP) were preselected as possibly suitable for being land-use based. This selection is based on the basket of 4 complementary indicators (EF, EMC, HANPP, LEAC) proposed in a study (Best et al , 2008) for DG ENV for use in the EU Thematic Strategy on the Sustainable Use of Natural Resources. Most assessment tools and underlying methods do not contain an endogenous definition of benchmark/sustainable level. The Ecological Footprint (EF) is an exception, using the concept of carrying capacity . LEAC focuses on land use only in Europe making comparisons not relevant as previous chapters have shown that deforestation that can be attributed to EU consumption is happening outside Europe. HANPP also refers to a defined land area, assessing the intensity of land use as a measure of human dominance of eco-systems, but HANPP does not take the trade dimension (goods and services from abroad) into account. This makes comparisons less relevant as previous chapters have shown that deforestation that can be attributed to EU consumption is happening outside Europe. EMC (Environmentally Weighted Material Consumption) is a weighted indicator of material consumption based on environmental impacts like global warming and eutrophication, but contains no endogenous definition of benchmark/sustainable level (van der Voet et al, 2009).
CHAPTER 7 Assessment of the overall impact of EU27 consumption on deforestation
183
Being land use based, expressing consumption in relation to a sustainable level, traditionally available in an apparent consumption approach, having a recent complementary approach based on GTAP final consumption makes the EF the most suitable assessment tool for comparison with findings from this study, despite the reported limitations on EF for not being an indicator covering all aspects of sustainability. The theoretical sustainable level of EU consumption in the context of deforestation can be defined as EU consumption containing zero traces of embodied deforestation in all food and non-food commodities, manufactured products and services on the EU market. Previous chapters have shown that this sustainable level of consumption is no reality, but an important question for sustainable development is also : in what direction are we moving ? In this chapter, the trends in indicators for land use and deforestation attributed to EU27 consumption of food and non-food products from agricultural and forestry commodities (1990-2008) are described based on the LANDFLOW model, to assess their (un)sustainable characterThe land use trends are compared to EF trends which also have a land use basis. Deforestation indicator trends show the specific added value of the model for deforestation developed in this project. The messages that the EF concept contains regarding deforestation and afforestation are also described. Section 7.2 shows the trends in indicators for land use and deforestation for the EU27 from 1990 to 2008. It provides information on per capita land use and total land use for the EU27 and compares those indicators with available information for EU27 from the EF. It also treats the indicator embodied deforestation. Indicator trends are discussed regarding their (un-)sustainable character. Insights about the (un-)sustainable character of trends based on the final consumption perspective from CHAPTER 5 are also added. Section 7.3 provides the messages that the EF concept provides on deforestation and afforestation. Section 7.4 describes the added value of the embodied deforestation indicator compared to the EF.. Section 7.5 provides the conclusions regarding sustainability.
7.2. INDICATOR TRENDS FOR LAND USE AND DEFORESTATION DERIVED FROM PREVIOUS CHAPTERS RELEVANT FOR ADDRESSING A SUSTAINABLE LEVEL OF USE/CONSUMPTION
In preceding chapters it was shown that the EU27 not only uses its own land extent to satisfy its consumption of food and non-food products based on agricultural and forestry commodities. A large amount of land is needed abroad to sustain the EU27 final consumption of these products. Even though deforestation is happening within a relatively small fraction of all land use, the levelof deforestation is not sustainable yet. . The impact from deforestation lies mainly beyond EU27 borders, as deforestation activities within the EU27 are relatively small. Conversion of forests is common practice in certain countries to sustain both their domestic as well as foreign (EU27 included) consumption. It is therefore important not only to analyse the evolution of the impact of consumption on deforestation, but also the evolution of overall land use as an indicator showing the growing or decreasing demand for land. First of all, EU27 land use trends (related to apparent consumption, which is domestic production + import - export) are treated and compared with the findings from the EF and the final consumption approach from CHAPTER 5. Consecutively, we look further into deforestation trends.
It must be noted that in the following sections, LANDFLOW output data have been used to illustrate consumption evolutions. The exact numbers cannot be directly compared with the results of the modelling up to final consumption using GTAP due to the methodological

CHAPTER 7 Assessment of the overall impact of EU27 consumption on deforestation
184
differences between both approaches, as explained in the preceding chapters. The conclusions in terms of trends, however, are similar.
7.2.1. EVOLUTION OF PER CAPITA AND TOTAL LAND USE EMBODIED IN EU27 APPARENT CONSUMPTION
In this section, EU27 consumption of cropland and pasture products are treated consecutively. As the forestry sector is characterized by a high level of processing, the apparent consumption approach is highly influenced by the limitations caused by the system boundaries of LANDFLOW. The evolution of land use embodied in EU final consumption of forestry based products has already been shown in Figure 5-16 and Figure 5-17. These figures showed a very stable need for land embodied in forestry products for EU27 consumption over the period 1992-2008 and also that EU27 is importing a stable share for these forestry products from other countries leading to the conclusion that the EU27 is relying on a constant amount of land in other countries for forestry based products.
→ Evolution of per capita cropland use embodied in EU27 consumption
Figure 7-1 shows that total per capita cropland use embodied in EU27 apparent consumption (expressed in m2 per capita) gradually decreased from 1990 (3,412 m2/cap) to 2008 (3,283 m2/cap), a reduction of approximately 4%. Total cropland use embodied in apparent consumption comprises cropland embodied the EU27 crop production plus cropland embodied in EU27 imports minus cropland embodied in EU27 exports, and some (not indicated in the figure) small fluctuating stock effects. Two main categories of cropland utilization have been distinguished: first, cropland embodied in direct human food and industrial utilization and second, cropland embodied in livestock feed production attributed to apparent EU27 consumption of livestock products. In addition, a small amount of cropland is attributed to seed/waste (not shown in the figure).

CHAPTER 7 Assessment of the overall impact of EU27 consumption on deforestation
185
Figure 7-1 Evolution of per capita cropland embodied in EU27 consumption
Imports from cropland products have increased since 2002 but simultaneously, the exports of cropland products also increased in the same proportion. This means that the EU27 has grown as a crop processing economy, also for consumption abroad. The ratio between EU27 consumption of crops for direct human food and crops for livestock feed has remained stable on the long term since they each have consumption levels around 1,500m²/cap/y. However, the amount of cropland embodied in livestock feed is, in general, slightly higher than the amount of cropland embodied in direct human use. This ratio is typical for developed countries, although the ratio is very small compared to North America, Oceania, non-EU Europe and Russia. Developing regions, in general, use a relatively small amount of crops for feed and rely more on pastures. Even though the observed per capita trends show a lower land use reflecting better agricultural efficiencies , for sustainability assessment we need to assess them from the perspective of total consumption of EU27 population.
→ Evolution of cropland use embodied in total consumption in the EU27
Asthe EU27 population over the period 1990-2008 rose with 7,8% (from 462 to 498 million citizens), the overall cropland use embodied in EU27 consumption has slightly grown from 157.000 kha to 163.000 kha (Figure 7-2). The 4% efficiency improvement per capita shown in Figure 7-1 has not been sufficient to compensate for the 7,8% population growth in the same period.
0
500
1000
1500
2000
2500
3000
3500
4000
m² p
er c
apita
Domestic cropland in production Imported cropland
Exported cropland Cropland use for livestock feed
Cropland use for direct human use Total cropland use

CHAPTER 7 Assessment of the overall impact of EU27 consumption on deforestation
186
Figure 7-2 Evolution of per capita cropland use embodied in EU27 consumption
The total embodied cropland use has risen, due to growing EU population.
→ Evolution of pasture land use per capita embodied in consumption in the EU27
Figure 7-3 shows that per capita pasture land use embodied in EU27 consumption (expressed in m2/cap) decreased much more than cropland use from 1990 (2,298 m2/cap) to 2008 (1,692 m2/cap) : a decrease of approximately 26%. This can be explained by strong efficiency increases, changed feeding strategies towards more crop feeding and dietary changes (less meat consumption and/or changes in consumption of meat towards less ruminant meat). As from 2002, both import and export figures show a more or less parallel increase in pasture land use, indicating the growing role of the EU27 as livestock products food processor.
0
20
40
60
80
100
120
140
160
180
kha
Thou
sand
s
Domestic cropland in production Imported cropland
Exported cropland Cropland use for livestock feed
Cropland use for direct human use Total cropland use

CHAPTER 7 Assessment of the overall impact of EU27 consumption on deforestation
187
Figure 7-3 Evolution of pasture land use embodied in EU27 consumption per capita
→ Evolution of pasture land use embodied in total consumption in the EU27
Even with an EU27 population growth of 7,8% over the period 1990-2008, total pasture land use still dropped from 106.000 kha to 85.000 kha, as indicated in Figure 7-4.
0
500
1000
1500
2000
2500
m² p
er ca
pita
Domestic pastures in production Imported pastures
Exported pastures Pastures for livestock, fed to livestock
Pastures for livestock Total pasture use
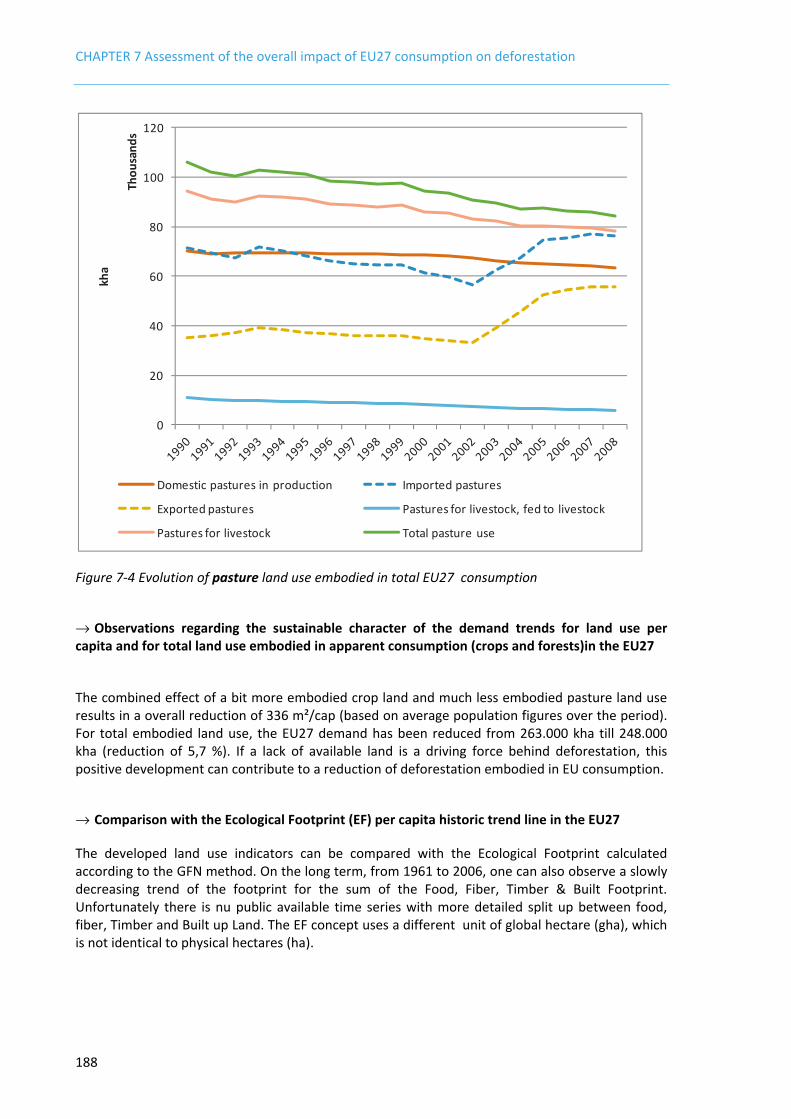
CHAPTER 7 Assessment of the overall impact of EU27 consumption on deforestation
188
Figure 7-4 Evolution of pasture land use embodied in total EU27 consumption
→ Observations regarding the sustainable character of the demand trends for land use per capita and for total land use embodied in apparent consumption (crops and forests)in the EU27
The combined effect of a bit more embodied crop land and much less embodied pasture land use results in a overall reduction of 336 m²/cap (based on average population figures over the period). For total embodied land use, the EU27 demand has been reduced from 263.000 kha till 248.000 kha (reduction of 5,7 %). If a lack of available land is a driving force behind deforestation, this positive development can contribute to a reduction of deforestation embodied in EU consumption.
→ Comparison with the Ecological Footprint (EF) per capita historic trend line in the EU27
The developed land use indicators can be compared with the Ecological Footprint calculated according to the GFN method. On the long term, from 1961 to 2006, one can also observe a slowly decreasing trend of the footprint for the sum of the Food, Fiber, Timber & Built Footprint. Unfortunately there is nu public available time series with more detailed split up between food, fiber, Timber and Built up Land. The EF concept uses a different unit of global hectare (gha), which is not identical to physical hectares (ha).
0
20
40
60
80
100
120
kha
Thou
sand
s
Domestic pastures in production Imported pastures
Exported pastures Pastures for livestock, fed to livestock
Pastures for livestock Total pasture use

CHAPTER 7 Assessment of the overall impact of EU27 consumption on deforestation
189
Figure 7-5 The EU Ecological Footprint disaggregated (1961-2006) (source: EEA)
→ Comparison with the historic evolution of land use embodied in EU27 final consumption (cropland and pasture land) (Figure 5-16)
In Fig 5-16 we can also observe a slight reduction of total land use for the sum of crops and forests. Regarding absolute numbers the apparent consumption approach provides a land use of 248.000 kha for the year 2008 whereas the final consumption approach estimates a land use of 380.000 kha for 2008. This indicates that the GTAP final consumption approach traces back more land use by taking into account more highly processed products that are not visible in the apparent consumption approach modelled in LANDFLOW. As described before : The exact numbers cannot be directly compared with the results of the modelling up to final consumption using GTAP due to the methodological differences between both approaches, as explained in the preceding chapters.
7.2.2. EVOLUTION OF PER CAPITA DEFORESTATION EMBODIED IN EU27 APPARENT CONSUMPTION
Below, we take a closer look at the evolution of deforestation embodied in products finding their way to EU27 consumption. The evolutions are available for two integrated periods: 1990-2000 and 2000-2008.
→ Evolution of deforestation embodied in EU27 apparent consumption associated with the cropland, pasture land and logging products
For an evolution of deforestation in different sectors in the country of origin, the developed indicators with LANDFLOW show an evolution of apparent consumption for the two analyzed periods. In Figure 7-6 (left) it is shown that deforestation embodied in apparent consumption of cropland products in the EU27 decreased from 8.9 m2/cap/y (average for the first decade) to 7.7 m2/cap/y
0.00
1.00
2.00
3.00
4.00
5.00
6.00
Glo
bal H
ecta
res/
Pers
onEcological Footprint, 1961-2006
Food, Fiber, Timber, & Built Footprint Carbon Footprint

CHAPTER 7 Assessment of the overall impact of EU27 consumption on deforestation
190
(average for the second period of 8 years), a reduction of 13 %.The deforestation figures are a small fraction (0,27 %) of total cropland land use (approx. 3300 m2/cap/y). A further disaggregation into crops for direct human use (mainly food) on the one hand and crops used for feed on the other hand is resulting in deforestation rates for the two periods of 4.7 and 4.1m²/cap/y (13 % reduction) and 4.0 and 3.6m²/cap/y (reduction of 10 %) respectively (Figure 7-6). In the first period, deforestation due to conversion into pastures for EU27 consumption of livestock products was 2.3 m²/cap/y. In the second period, it decreased to 1.8 m²/cap/y (22 % reduction, Figure 7-6, right). About 5 to 8% of imported livestock products (e.g. bone meal) are re-fed to livestock in the EU27. Again, the deforestation rate for pasture is a small fraction (approx 0,1 %) of total land use (average pasture land use by the EU27 in that period: approximately 2000 m2/capita, see Figure 7-3). Combining both deforestation for cropland and for pastures gives the global picture for deforestation embodied in the EU27 apparent consumption of agricultural products . In the first period, the total amount was 11.2m²/cap/y, which decreased to 9.6m²/cap/y (reduction of 14 %) over the period 2000-2008 (Figure 7-7, left). In the figure, deforestation for feed crops and for pastures is aggregated to represent the deforestation for feeding livestock. Deforestation for feed decreased from 7.0 to 5.8 m²/cap/miningy, while deforestation for crops used for direct human consumption decreased from 4.1 to 3.6 m²/cap/y.
Figure 7-6 Evolution of deforestation embodied in EU27 cropland product apparent consumption (left) and pasture land product apparent consumption (right)
In the same figure (Figure 7-7, right), deforestation embodied in wood products is presented. As explained in previous chapters, the impact of the forestry sector on deforestation is relatively small compared to the use of agricultural products since only the impact of logging preceding conversion into agricultural land is assessed. The reduction of per capita deforestation embodied in EU27 wood products consumption is significant and even when multiplied by growing population (average population in period 2000-
0
2
4
6
8
10
12
1990-2000 2000-2008
m²/
cap/
y
Used for feed
Used for direct human use
0
2
4
6
8
10
12
1990-2000 2000-2008
m²/
cap/
y
used for feed
used for livestock products (mainly imported meat)
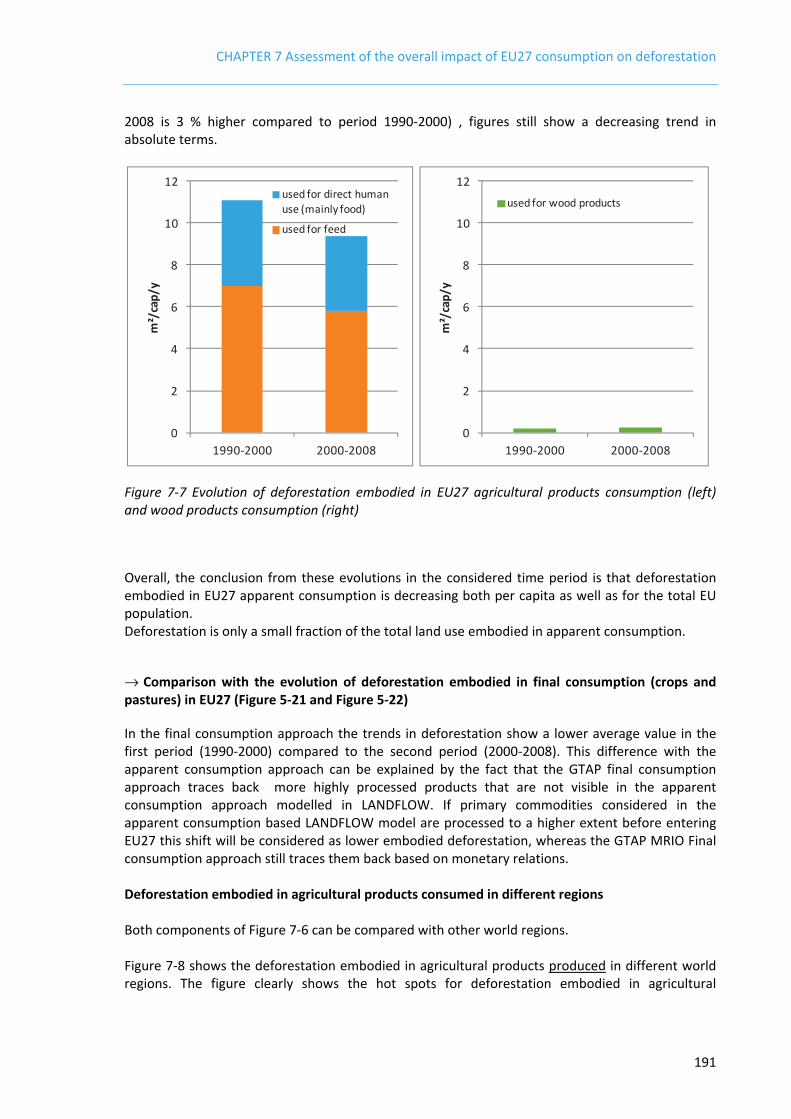
CHAPTER 7 Assessment of the overall impact of EU27 consumption on deforestation
191
2008 is 3 % higher compared to period 1990-2000) , figures still show a decreasing trend in absolute terms.
Figure 7-7 Evolution of deforestation embodied in EU27 agricultural products consumption (left) and wood products consumption (right)
Overall, the conclusion from these evolutions in the considered time period is that deforestation embodied in EU27 apparent consumption is decreasing both per capita as well as for the total EU population. Deforestation is only a small fraction of the total land use embodied in apparent consumption.
→ Comparison with the evolution of deforestation embodied in final consumption (crops and pastures) in EU27 (Figure 5-21 and Figure 5-22)
In the final consumption approach the trends in deforestation show a lower average value in the first period (1990-2000) compared to the second period (2000-2008). This difference with the apparent consumption approach can be explained by the fact that the GTAP final consumption approach traces back more highly processed products that are not visible in the apparent consumption approach modelled in LANDFLOW. If primary commodities considered in the apparent consumption based LANDFLOW model are processed to a higher extent before entering EU27 this shift will be considered as lower embodied deforestation, whereas the GTAP MRIO Final consumption approach still traces them back based on monetary relations. Deforestation embodied in agricultural products consumed in different regions Both components of Figure 7-6 can be compared with other world regions. Figure 7-8 shows the deforestation embodied in agricultural products produced in different world regions. The figure clearly shows the hot spots for deforestation embodied in agricultural
0
2
4
6
8
10
12
1990-2000 2000-2008
m²/
cap/
y
used for direct human use (mainly food)
used for feed
0
2
4
6
8
10
12
1990-2000 2000-2008m
²/ca
p/y
used for wood products

CHAPTER 7 Assessment of the overall impact of EU27 consumption on deforestation
192
production. The EU27 has hardly any domestic deforestation and thus nearly no deforestation embodied in the production of agricultural products.
Figure 7-8 Deforestation embodied in agricultural products produced in different world regions (1990-2008), see annex A for region names)
Figure 7-9 is presenting the deforestation embodied in agricultural products consumed in different world regions.
0 10 20 30 40 50 60 70 80
NAM
EU27EURR
CAM
SAMNAWA
SAFRSASIA
SEASIA
EASIAOCE
average
m²/cap/y
Cropland
Pasture

CHAPTER 7 Assessment of the overall impact of EU27 consumption on deforestation
193
Figure 7-9 Deforestation embodied in agricultural products consumed in different world regions (1990-2008), see annex A for region names
The global average of deforestation through the consumption of agricultural products was almost 12m²/cap/y for the period 1990-2008. Owing to its legacy of deforestation for agricultural land in the past, the EU27 stayed below this average throughout the period, at 10m²/cap/y on average. Still, the EU27 ranks 5th after deforestation hot spot regions (developing regions without such a legacy). Deforestation embodied in EU27 apparent consumption of food and non-food agricultural and forestry products Figure 7-10 summarizes the impact of EU27 consumption of food and non-food agricultural and forestry products on a per capita basis for the two assessed periods. In general, deforestation associated with EU27 consumption decreased from 11.3 m²/cap/y to 9.6 m²/cap/y. As the average population rose with 3%, this also means a reduction of per capita deforestation . On average, 61% of deforestation was due to the use of livestock products (feed crops and grazing), 36% for direct human use of crop products (mainly food), and 2% due to the use of wood products.
0 10 20 30 40 50 60 70 80
NAMEU27EURRCAMSAM
NAWASAFR
SASIASEASIA
EASIAOCE
average
m²/cap/y
Cropland
Pasture

CHAPTER 7 Assessment of the overall impact of EU27 consumption on deforestation
194
Figure 7-10 Evolution of deforestation embodied in EU27 consumption
The figures based on “final consumption” in 2004 are somewhat higher: 14.9m²/cap (0.732 Mha for 498 EU27 citizens in 2004). This can be explained by the system boundaries of the LANDFLOW model. As shown in CHAPTER 5, some of the sectors with the hightest deforestation impact consume a considerable amount of manufactured and processed products, which are thus not included in the above figure.
7.3. MESSAGES DERIVED FROM THE ECOLOGICAL FOOTPRINT CONCEPT ON DEFORESTATION AND AFFORESTATION
7.3.1. INTRODUCTION
The Ecological Footprint (EF) method, conform the Global Footprint Network (GFN), expresses the demand for bioproductive land as a consequence of yearly consumption levels and of the land needed to absorb CO2 emissions from the consumption of energy or the associated need to sequester the emitted greenhouse gases. The method compares this footprint with the biocapacity in order to see whether the consumption levels are sustainable. The unit used by the EF and Biocapacity is the global hectare (gha), which combines the hectare (ha) with productivity factors. By comparing this footprint with the limited biocapacity of a country or worldwide, the concept is pretty unique in providing a clear and understandable limit to the consumption levels the earth can support. The concept is widely recognized for its communicative value to explicitly explain to policy makers and consumers that we are not on a sustainable track. In the scientific and statistical community, however, criticism on the limited transparency and questions about the foundations of the single score methodology still exist.
7.3.2. PROPERTIES OF THE EF :
• The EF expresses consumption levels in land demand for bioproductive land; • Pretty unique concept due to a hard sustainability limit (biocapacity);
0
2
4
6
8
10
12
1990-2000 2000-2008
m²/
cap/
y
used for wood products
used for direct human use (mainly food)
used for feed

CHAPTER 7 Assessment of the overall impact of EU27 consumption on deforestation
195
• Communicative advantages for expressing the need for action to non experts; and • The concept calls for a reduction of the ecologic deficit (difference between footprint and
biocapacity).
A characteristic graph shown below (at world level) relates the Ecological Footprint from global consumption to the available biocapacity on earth (Figure 7-11).
Figure 7-11 Characteristic graph for the Ecological Footprint (source: GFN)
One of the key messages of this graph is that due to consumption, around the year 1984, humanity achieved a higher ecological footprint than the available biocapacity on earth, assuming a full compensation of CO2 emissions in trees on land. Moreover, growing fossil fuel use is considered the main reason for the increasing world consumption footprint. Without this carbon footprint, biocapacity would be sufficient to sustain consumption patterns.
7.3.3. MESSAGES OF THE EF CONCEPT REGARDING DEFORESTATION AND AFFORESTATION
• The EF promotes afforestation to sequester emitted CO2 gases; • If we would not have to compensate for CO2emissions on land at world level, there
would still be bioproductive land available to produce wood, crops, feed etc. ; at world level there seems to be no direct need for deforestation because of land scarcity;
• The EF shows that demand for wood products is still growing; • The EF (as do other indicators based on biocapacity) focuses strongly on the so-called
provisioning services of ecosystems, rather than taking into account all ecosystem services. The biocapacity value of forest land is lower than the value for cropland. Conversion of forest land to cropland or built-up land as such would reduce the ecological deficit, which is a controversial signal towards deforestation. In the Expert

CHAPTER 7 Assessment of the overall impact of EU27 consumption on deforestation
196
Workshop in October 2011, this drawback was also reported as existing in the HANPP concept.
7.3.4. EF SCORES AT EU27 LEVEL
In the EU27 member states, we already consumed more bioproductive land per person in 1961 than available bioproductive land (Figure 7-12). At world level, this point was reached around 1980 (Figure 7-11) . In both cases, the increasing carbon footprint is the main reason for the rising ecological footprint. Even though it is based on statistics (FAO, EIA, COMTRADE etc.), the EF concept is still criticized as an overall sustainability indicator, since it is not covering all environmental impacts like acidification, toxic impacts, deforestation and the concept of ecological deficit should not be applied to densely populated areas.
Figure 7-12 Ecological Footprint and biocapacity from 1961-2006 (source: EEA)
→ Similarities of land use and embodied deforestation calculations in this project compared with two types of EF calculations :bottom-up versus top-down approach
The two models we used to calculate embodied deforestation in EU27 consumption show similarities with EF calculations in the sense that the apparent consumption approach with LANDFLOW can be considered as a bottom-up approach. The GTAP final consumption approach can be considered as a top-down approach. EF calculations, according to the GFN methodology and licence, used for many years a bottom-up calculation approach using FAOSTAT, IEA, COMTRADE statistics etc. The GFN calculations express the footprint of consumption levels in terms of ‘apparent consumption’ which is defined as production plus import minus export. A similar approach was applied in CHAPTER 4. Recently a top-down approach has been added in , a FP7 project called OPEN:EU (http://www.oneplaneteconomynetwork.org/eureapa.html), to calculate the Ecological, Carbon and
0.00
1.00
2.00
3.00
4.00
5.00
6.00
Glob
al H
ecta
res/
Pers
on
Ecological Footprint & Biocapacity, 1961-2006
EFc/person BC/person

CHAPTER 7 Assessment of the overall impact of EU27 consumption on deforestation
197
Water footprintsThe EUREAPA tool uses the same approach as this project, based on GTAP MR-IO (CHAPTER 5). . This top-down approach uses the ‘final consumption perspective’ defined as the consumption of private households, government consumption and capital investments from both governments and households. Once licence conditions are developed and published, the online EUREAPA tool can be used to make more detailed comparisons on priority product groups. This opens the opportunity to look for policy synergies in addressing priority products from different perspectives : carbon, ecological, water and embodied deforestation.
7.4. ADDED VALUE OF EMBODIED DEFORESTATION INDICATORS DEVELOPED IN THIS PROJECT
The results and indicators developed in this project are much more specific for deforestation than the land use indicators from the EF methodology. This has been achieved by focusing on land use changes over time in combination with growing production figures of primary products. Below, a comparative table for the EF methodology and the actual methodologies of this project show the added value achieved.
Table 7-1 Comparison of the Ecological Footprint indicator with the embodied deforestation indicator developed in this project. The column for EF is based on “Integrating Ecological, Carbon and Water Footprint : Defining the “Footprint Family” and its Application in Tracking Human Pressure on the Planet (OPEN:EU Project)” and has been extended.
ECOLOGICAL FOOTPRINT EMBODIED DEFORESTATION INDICATOR MAIN CONCEPT
The amount of the biosphere‘s regenerative capacity that is directly and indirectly (i.e. embodied in trade) used by humans (namely Ecological Footprint) compared with how much is available (namely biocapacity), at both local and global scale.
The amount of deforestation that is directly and indirectly (i.e. embodied in trade) used by humans, at EU27 scale, not covered by other indicators
MAIN MESSAGE
To promote recognition of ecological limits and safeguard the ecosystems‘ life-supporting services enabling the biosphere to support mankind in the long term.
To raise awareness of impacts on deforestation attributed to our consumption (additional indicator for resource use) , showing our dependency on products & services causing deforestation in other parts of the world.
DATA AND SOURCES
• Data on local production, import and export for agricultural, forestry and fisheries products (FAOSTAT, UN Comtrade); • Land use data (FAOSTAT, etc); • Local and trade embodied CO2 emissions (IEA and others); and • Land yield (FAOSTAT) and potential crop productivity (provided by the FAO GAEZ model) – this data is needed to express results in units of global hectares. • Data on population (FAO)
• Forest Resources Assessment (FRA) of the Food and Agricultural Organisation (FAO) for deforestation rates;
• Official data on land use, agricultural and forest production as published by FAO are used as the basis for the allocation of deforestation to crops, livestock production, wood extraction and natural hazards
• GTAP data if final consumption per year is required
UNIT OF MEASUREMENT
• Global hectares (gha) of bioproductive land. Gha is not a measure of area but rather of the ecological production associated with an area; and • Results can also be expressed in actual physical hectares. • Usually expressed per capita
• Deforestation in average m² per capita per year for a FAO FRA period (apparent consumption)
• Hectares of deforestation per year (final consumption) for years which allow to trace up to final consumption (dependent upon GTAP model years), can be expressed per capita
INDICATOR COVERAGE
• Temporally explicit and multi-dimensional indicator that can be applied to single products, cities, regions, nations and the whole biosphere; • Approximately 240 countries for the period 1961-2007 are tracked; of these, approximately 150 countries are published by Global Footprint Network (Ewing et al., 2010a);
• Indicator for the EU27 for reference years : o 2004 (GTAP year); o periods 1990-2000 and 2000 till 2008
(LANDFLOW) • Documents both direct and indirect human demands
for the source (resource production) of the biosphere; • It has a consumption-based point of view and thus
considers trade;

CHAPTER 7 Assessment of the overall impact of EU27 consumption on deforestation
198
• Documents both direct and indirect human demands for both the source (resource production) and the sink (carbon uptake) capacity of the biosphere; • Provides a measure of both human demand and nature supply; • Provides a clear benchmark; and • It has a consumption based point of view and thus considers trade. • GFN approach is based on apparent consumption • Eureapa approach is based on final demand
• LANDFLOW is based on apparent consumption; • GTAP based model is based on final consumption.
POLICY USEFULNESS
• Measures ‗overshoot‘ and identifies the pressures that humanity is placing to various ecosystem services; • Monitors societies‘ progresses towards minimum sustainability criteria (demand ≤ supply); • Monitor the effectiveness of established resource use and resource efficiency policies; • Helps analyzing the consequences of using alternative energies; • Communicates the wide range of environmental impacts of different lifestyles to the overall public; • Track pressure on biodiversity (indirectly); and • Illustrates the unequal distribution of resource use and can be used to design international policies aiming at implementing contraction and convergence principles.
• Identifies the pressures that humanity is placing to existing forest ecosystems (and as a basis for all ecosystem services lost due to deforestation);
• Can monitor societies‘ progresses towards less deforestation when calculated every year. Today certain data sources are only available every 5 years.
• Monitors the effectiveness of established resource use and resource efficiency policies;
• Track pressure on forests (directly and indirectly) and provides a basis for other impacts on biodiversity;
• Illustrates the unequal distribution of resource use and can be used to design international policies
STRENGTHS
• Allows benchmarking human demand for renewable resources and carbon uptake capacity with nature supply and determining clear targets. • Provides an aggregated assessment of multiple anthropogenic pressures; and • Easy to communicate and understand with a strong conservation message.
• provides very specific information on deforestation which is not considered for any other land-use based indicators who only consider land-use and biocapacity with a strong focus on the provisioning services of ecosystems , i.e. the productivity of biomass and/or associated carbon sequestration.
WEAKNESSES • Cannot cover all aspects of sustainability, neither all environmental concerns, especially those for which no regenerative capacity exists (including abiotic resources); • Shows pressures that could lead to degradation of natural capital (e.g. reduced quality of land or reduced biodiversity), but does not predict this degradation; and • Not geographically explicit; • Some underlying assumptions are controversial, though documented.
• Local practices in deforestation can change rapidly over or even between years: not really a weakness but a fact of life in deforestation practice
• Therefore the embodied deforestation is very time-period specific
COMPLEMENTARY PROPERTIES IN THE FOOTPRINT FAMILY
• Uses a consumer-based approach to track human pressures on the planet in terms of the aggregate demand that resource consumption and CO2 emissions places on the ecological assets.
Focuses specifically on deforestation
CONDITIONS FOR USE
EF software and data according to GFN methodology needs a licence EUREAPA Web-based tool for EF needs a licence for commercial use
LANDFLOW model is owned and used by IASA Licence of GTAP model is needed
Even though the deforestation calculations and indicators in this project share FAO land use data as basic input, embodied deforestation indicators cannot simply be integrated as basic add-on indicators to the EF. They require several additional calculations and data, for the following reasons:
• The deforestation calculations consider changes over time

CHAPTER 7 Assessment of the overall impact of EU27 consumption on deforestation
199
• Certain data sources needed for deforestation calculations (like FRA) are reported on a 5 or 10-yearly basis only. Nevertheless annual indicators could be developed by assuming linear regressions within the period. Annual data can be derived directly via GTAP, but only for the years for which GTAP was constructed (unless assumptions are made on the evolution from one year with known GTAP data to another).
• Additional data sources are needed.
7.5. CONCLUSIONS
• Over the period from 1990 to 2008, average land use embodied in EU27 consumption (per capita as well as for total population, based on apparent consumption) decreased. The final consumption approach found a smaller reduction in embodied land use. If lack of available land is a driving force for deforestation, this positive development may reduce deforestation.
• Deforestation embodied in EU27 apparent consumption was also lower over the period 2000-2008 compared to 1990-2000. By contrast, the final consumption approach showed a small increase of embodied deforestation for the period of 2000-2008 compared to 1992-2000. The differences can be explained by the fact that the GTAP final consumption approach traces back more highly processed products that are not detected by the apparent consumption approach modelled in LANDFLOW. Since 2002 (the peak year in deforestation) deforestation embodied in EU27 final consumption is decreasing again, mainly due to less oil seeds with embodied deforestation imported in the EU27.
• Despite these slow positive developments, sustainable consumption levels (zero deforestation embodied in EU27 consumption of products and services) have not been reached yet. In fact both embodied land use and embodied deforestation remained remarkably stableover the period 1990-2008.
• The deforestation embodied in EU27 consumption (400.000 -500.000 hectare/year in both approaches) is comparable to yearly afforestation rates within Europe (European afforestation equalled on average 0.71 Mha per year over the period from 1990 to 2008).
• The specific deforestation indicators developed (“embodied deforestation”), provide added value in comparison with land use based indicators like the Ecological Footprint, due to the specific focus on the relation between deforestation and consumption.

List of Literature
200
LIST OF LITERATURE
ADB/BAPPENAS (1999). Causes, Extent, Impact and Costs of 1997/98 Fires and Drought Final Report, Annex 1 and 2, Planning for Fire Prevention and Drought Management Project. Asian Development Bank TA 2999-INO Fortech, Pusat Pengembangan Agribisnis, Margueles Po¨yry, Jakarta, Indonesia. Andrew, R., Peters, G.P., Lennox, J., 2008. New Zealand's carbon balance: MRIO applied to a small developed country, The 2008 International Input-Output Meeting on Managing the Environment (IIOMME), Seville, Spain. Andrew, R., Peters, G.P., Lennox, J., 2009. Approximation and regional aggregation in multi-regional input-output analysis for national carbon footprint accounting. Economic Systems Research 21, 311-335. Asner, G. P.; Broadbent, E. N.; Oliveira, P. J. C.; Keller, M.; Knapp, D. E; Silva, J. N. M. (2006). Condition and fate of logged forests in the Brazilian Amazon. Proc. Natl. Acad. Sci., 103, 12947–12950. Ayres, R.U., Kneese, A.V., 1969. Pollution, Consumption, and Externalities. American Economic Review LIX, 282--296. Bakkes, J.A. et al.(2008). Background report to the OECD Environmental Outlook to 2030. Overviews, details, and methodology of model-based analysis. Netherlands Environmental Assessment Agency, and Organisation for Economic Co-Operation and Development. Available from URL: http://www.rivm.nl/bibliotheek/rapporten/500113001.pdf Bakkes, J.A. et al. (2009). Getting into the right lane for 2050. Netherlands Environmental Assessment Agency. Available from URL: http://www.pbl.nl/sites/default/files/cms/publicaties/500159001.pdf Bang, J.K., Hoff, E. and Peters, G.P., 2008. EU Consumption, Global Pollution. World Wildlife Fund Trade and Investment Programme and the Industrial Ecology Programme at the Norwegian University of Science and Technology. Bangun D., 2006. Indonesian palm oil industry. Presented at the National Institute of Oilseed Palm convention, March 21-25, Sheraton Wild Horse Pass, Phoenix, Arizona, USA. Banse, M., Kaditi, E, Robinson, S. and Swinnen, J. (2008). Analysis of the European Food Industry. IPTS-JRC, European Commission, Brussels, Belgium. Available from URL: ftp://ftp.jrc.es/pub/EURdoc/JRC41843.pdf Best, A et al. (2008), Potential of the Ecological Footprint for monitoring environmental impacts from natural resource use. Analysis of the potential of the Ecological Footprint and related assessment tools for use in the EU’s Thematic Strategy on the Sustainable Use of Natural Resources http://ec.europa.eu/environment/natres/pdf/footprint.pdf

List of Literature
201
Beurskens, L.W.M., Hekkenberg, M. (2011). Renewable Energy Projections as Published in the National Renewable Energy Action Plans of the European Member States. ECN. Available from URL: http://www.ecn.nl/docs/library/report/2010/e10069.pdf Bischoff-Ferrari, H.A. et al. (2011) Milk intake and risk of hip fracture in men and women: A meta-analysis of prospective cohort studies Journal of Bone and Mineral Research 26: 4, 833–839. Boucher, D., Elias, P., Lininger, K., May-tobin, C., Roquemore, S. And Saxon, E. (2011), The root of the problem. What drives tropical deforestation today? Union of Concerned scientists. Cambridge. Available from URL: http://www.ucsusa.org/global_warming/solutions/forest_solutions/drivers-of-deforestation.html Bowen, M. R., Bompard, J. M., Anderson, I. P., Guizol, P. & Gouyon, A. (2000). Forest Fires and Regional Haze in Southeast Asia (eds Eaton, P. & Radojevic, M.), p52–66, Nova Science, New York. Bradley, D., Cuypers, D. And Pelkmans L. (2009). 2nd generation biofuels and trade. An exploratory study. IEA Task 40 report. Available from URL: http://www.bioenergytrade.org/downloads/2ndgenerationbiofuelsfinaldec142009.pdf Broich, M., M. Hansen, F. Stolle, P. Potapov, B. Arunarwati Margono and B. Adusei (2011), Remotely sensed forest cover loss shows high spatial and temporal variation across Sumatera and Kalimantan, Indonesia 2000–2008, Environ. Res. Lett. 6 014010 (9pp), doi:10.1088/1748-9326/6/1/014010. Bucki, M., Cuypers, D., Mayaux, P., Achard, F., Estreguil, C. and Grassi, G. (2012). The matrix - a pragmatic solution for assessing REDD+ performance in countries with low monitoring capacities. Environmental Research Letters. Butler, R.A. and Laurance, W.F. (2008), New Strategies for Conserving Tropical Forests. Trends in Ecology and Evolution, 23-9, 469-472 Carlsson-Kanyama, A., Assefa, G., Peters, G.P., Wadeskog, A., 2007. Koldioxidutslapp till foljd av Sveriges import och konsumtion: berakningar med olika metoder (Carbon dioxide emissions from Sweden's import and consumption: Calculations with different methods). Industrial Ecology, School of Energy and Environmental Technology, KTH. Casson, A. (2000). The hesitant boom: Indonesia’s oil palm sub-sector in an era of economic crisis and political change. CIFOR, Bogor, Indonesia. http://www.cifor.org/publications/pdf_files/CASSON.pdf Casson, A. (2003). Oil palm, soybeans and critical habitat loss. WWF Forest Conservation Initiative. Casson, A., Tacconi, L. and Deddy, K. (2007). Strategies to reduce carbon emissions from the oil palm sector in Indonesia. Paper prepared for the Indonesian Forest Climate Alliance, Jakarta. Cederberg C, Persson UM, Neovius K, Molander S & Clift R. (2010). Including Carbon Emissions from Deforestation in the Carbon Footprint of Brazilian Beef. Environmental Science & Technology 45(5): 1773–1779.

List of Literature
202
Chapagain A.K. and Hoekstra A.Y. (2004): Water footprints of nations. Volume 1: Main Report. Value of Water Research Report Series No.16, UNESCO-IHE Delft, The Netherlands. Cotula, L., Vermeulen, S., Leonard, R. and Keeley, J. (2009) Land grab or development opportunity? Agricultural investment and international land deals in Africa. FAO, IIED and IFAD ftp://ftp.fao.org/docrep/fao/011/ak241e/ak241e.pdf Croezen, H. And Brouwer, F. (2008). Estimating indirect land use impacts from by-products utilization. CE Delft. Cuypers, D., Peters, G.P., Minx, J., Prieler, S., Fisher, G., Hizsnyik, E., Smet, L.d., Königel, C., 2011. The impact of EU consumption of food and non-food imports on deforestation (Interim Report). VITO to meet requirements of EC Contract N° 070307/2010/577031/ETU/E2. DeFries, R.S., Rudel, T., Uriarte, M. And Hansen, M. (2010). Deforestation driven by urban population growth and agricultural trade in the twenty-first century. Nature Geoscience, 3, 178-181. Diamond, J. (1997) Guns, Germs, and Steel: The Fate of Human Societies. W.W. Norton & Co, New York. Diamond, J. (2004). Collapse: How Societies Choose to Fail or Succeed. Viking Adult, NY, 597 pp. Dimitrov, R. S., Sprinz, D. F., DiGiusto, G. M. and Kelle, A. (2007), International Nonregimes: A Research Agenda. International Studies Review, 9: 230–258. Ecorys (2010). Study on the evolution of some deforestation drivers and their potential impacts on the costs of an avoiding deforestation scheme. A study for DG ENV. Rotterdam, The netherlands. EEA, 2010. The European environment — state and outlook 2010: synthesis. European Environment Agency, Copenhagen Empresa Brasileira de Pesquisa Agropecuaria (EMBRAPA), Instituto Nacional de Pesquisas Espaciais (INPE), 2011. Levantamento de informacoes de uso e cobertura da terra na Amazonia. Sumario Executivo (in Portugese). Available from URL: http://www.senado.gov.br/noticias/agencia/pdfs/TerraClass_sumario.pdf (Accessed on 13 September 2011). European Commission (2008). COMMUNICATION FROM THE COMMISSION TO THE EUROPEAN PARLIAMENT, THE COUNCIL, THE EUROPEAN ECONOMIC AND SOCIAL COMMITTEE AND THE COMMITTEE OF THE REGIONS. Addressing the challenges of deforestation and forest degradation to tackle climate change and biodiversity loss. COM (2008) 645. Available from URL: http://eur-lex.europa.eu/LexUriServ/LexUriServ.do?uri=COM:2008:0645:FIN:EN:PDF European Communities, 2008. Eurostat Manual of Supply, Use and Input-Output Tables, Eurostat Methodologies and Working Papers, Luxembourg. FAO (2003). World agriculture: towards 2015/2030. Rome, Italy. Available from URL: http://www.fao.org/docrep/005/Y4252E/y4252e00.HTM FAO (2006). Livestock’s long shadow: Environmental issues and options. Rome: Food and Agriculture Organization of the United Nations.

List of Literature
203
FAO (2010a). Global Forest Resources Assessment 2010, FAO, Rome, 2010. FAO (2010b). Global Forest Resources Assessment 2010 – Country Report Indonesia, FAO, Rome, 2010. FAO (2011). Global forest land-use change from 1999-2005. Initial results from a global remote sensing survey. Food and agriculture Organisation, Rome, Italy. http://foris.fao.org/static/data/fra2010/RSS_Summary_Report_lowres.pdf FAOSTAT (2011). Time-series and cross sectional data relating to food and agriculture. FAO. Rome. Available at: http://faostat.fao.org/default.aspx FAPRI (2010). World Meat: FAPRI 2010 Agricultural Outlook. Available from URL: http://www.fapri.iastate.edu/outlook/2010/text/16Meat.pdf Fitzherbert, E.B., M.J. Struebig, et al. (2008). How will oil palm expansion affect biodiversity? Trends in Ecology and Evolution 23(10): 538. Fischer, G., Nachtergaele, F., Prieler, S., Teixeira, E., Tóth, G., van Velthuizen, H., Verelst, L., Wiberg, D. (2011): GAEZ v3.0 Global Agro-ecological Zones - Model Documentation. International Institute for Applied systems Analysis (IIASA), Laxenburg, Austria and the Food and Agriculture Organization of the United Nations (FAO) Rome, Italy. Forsström, J. , Keränen, J. and Hytönen, E., Soria, A. and Szabó, L. (2006) Development of a Model of the World Pulp and Paper Industry. VTT and IPTS. Available from URL: http://ftp.jrc.es/EURdoc/eur22544en.pdf Galli, A. et al (2011) Integrating Ecological, Carbon and Water Footprint: Defining the Footprint Family and its Application in Tracking Human Pressure on the Planet http://www.oneplaneteconomynetwork.org/resources/programme-documents/WP8_Integrating_Ecological_Carbon_Water_Footprint.pdf Galloway, J.N., M. Burke, G.E. Bradford, R. Naylor, W. Falcon, A.K. Chapagain. J.C. Gasell, E. McMullough, H.A. Mooney, K.L. Olsen, H. Steinfeld, T. Wassenaar, and V. Smil. (2007). International trade in meat: the tip of the pork chop. Ambio 36: 622-629. Geist, H.J., Lambin, E.F., 2001. What Drives Tropical Deforestation?, LUCC Report Series No. 4. Hertwich, E.G., Peters, G.P., 2009. Carbon Footprint of Nations: A Global, Trade-Linked Analysis. Environmental Science and Technology 43, 6414-6420. Gerbens-Leenes, P.W., and S. Nonhebel. (2002). Consumption patterns and their effects on land required for food. Ecological Economics 42: 185-199. Gibbs, H.K., Ruesch, A.S., Achard, F., Clayton, M.K., Holmgren, P., Ramankutty, N. And Foley, J.A. (2010). Tropical forests were the primary sources of new agricultural land in the 1980s and 1990s. Proceedings of the National Academy of Sciences, 107-38, 16732-16737 Gustavsson, J., Cederberg, C. And Sonesson, U. (2011). Global food losses and food waste. Extent, causes and prevention. FAO. Available from URL: http://www.fao.org/fileadmin/user_upload/ags/publications/GFL_web.pdf

List of Literature
204
Hallström, E., Ahlgren, S. and Börjesson, P. (2011). Challengfes and opportunities for future production of food, feed and biofuel. A land use perspective. Lund, Sweden Hansen, M.C., Stehman, S.V., Potapov, P.V., Arunarwati, B., Stolle, F. & Pittman, K. (2009). Quantifying changes in the rates of forest clearing in Indonesia from 1990 to 2005 using remotely sensed data sets. Environ Res Lett 4:10. 1088/1748-9326/4/3/034001. Available from URL: http://iopscience.iop.org/1748-9326/4/3/034001 Houghton, R.A. (2010). How well do we know the flux of CO2 from land-use change? Tellus, Series B: Chemical and Physical Meteorology, 62 (5), pp. 337-351. Kamphuis, B., Arets, E., Verwer, C., Van den Berg, J., Van Berkum, S. and Harms, B. (2011). Dutch trade and biodiversity: Biodiversity and socio-economic impacts of Dutch trade in soya, palm oil and timber. Wageningen. IEA (International Energy Agency) (2011). Bioenergy, Land Use Change and Climate Change Mitigation. Background Technical Report. 61p.
IEA Bioenergy Task 40 (2011). Global Wood Pellet Industry, Market and Trade Study. Bioenergy Task 40. Sustainable International Bioenergy Trade. Available from URL: http://www.bioenergytrade.org/downloads/t40-global-wood-pellet-market-study_final.pdf
IIED (2011). Biomass energy: Another driver of land acquisitions? Available from URL: http://pubs.iied.org/pdfs/17098IIED.pdf INPE, 2010. Monitoramento da floresta amazonica brasileira por satelite, projeto PRODES. Isard, W., 1951. Interregional and regional input-output analysis, a model of a space economy. Review of Economics and Statistics 33, 318-328. ISTA Mielke GmbH (2008). Oil World statistics. Available at: http://www.oilworld.biz/app.php, accessed November 2008 Jensen, R.C., 1980. The concept of accuracy in regional input-output models. International Regional Science Review 5, 139-154. Kearney, J. (2010). Food consumption trends and drivers. Phil.Trans. R. Soc. B 365, 2793-2807. Kitzes, J., A. Galli, S.M. Rizk, A. Reed and M. Wackernagel, 2008, Guidebook to the national footprints accounts 2008 (summary calculation methodology), Global Footprint Network Koh, L.P., Ghazoul, J. (2010). Spatially explicit scenario analysis for reconciling agricultural expansion, forest protection, and carbon conservation in Indonesia, PNAS 107 (24), pp. 11140-11144, doi: 10.1073/pnas.1000530107. Lambin, E.F., and P. Meyfroidt. 2011. Global land use change, economic globalization, and the looming land scarcity. Proceedings of the National Academy of Sciences 108: 3465-3472. Lamers, P., Hamelinck, C., Juninger, M. and Faaij, A. (2011) International bioenergy trade—A review of past developments in the liquid biofuel market. Renewable and Sustainable Energy Reviews 15, 2655–2676.

List of Literature
205
Lambin, E. F. and Meyfroidt, P. (2011). Global land use change, economic globalization, and the looming land scarcity. Proceedings of the National Academy of Sciences, 108-9, 3456-3472. Lapola DM, et al. (2010). Indirect land-use changes can overcome carbon savings from biofuels in Brazil. Proc Natl Acad Sci USA 107:3388–3393. Le Quéré, C., Raupach, M.R., Canadell, J.G., Marland, G., Bopp, L., Ciais, P., Conway, T.J., Doney, S.C., Feely, R., Foster, P., Friedlingstein, P., Houghton, R.A., House, J.I., Huntingford, C., Levy, P., Lomas, M.R., Majkut, J., Metzl, N., Ometto, J., Peters, G.P., Prentice, I.C., Randerson, J.T., Rödenbeck, C., Running, S.W., Sarmiento, J.L., Schuster, U., Sitch, S., Takahashi, T., Viovy, N., Werf, G.R.v.d., Woodward, F.I., 2009. Trends in the sources and sinks of carbon dioxide. Nature Geoscience 2, 831-836. Lenzen, M., 2001. Errors in Conventional and Input-Output-based Life-Cycle Inventories. Journal of Industrial Ecology 4, 127-148. Leontief, W., 1970. Environmental repercussions and the economic structure: An input-output approach. The Review of Economics and Statistics 52, 262-271. Leontief, W.W., 1936. Quantitative input and output relations in the economic system of the United States. The Review of Economic Statistics 18, 105-125.
Lin,, Y. et al. (2011) Plant and animal protein intake and its association with overweight and obesity among the Belgian population. British Journal of Nutrition , 105, 1106-1116.
Lugschitz, B., Bruckner, M. and Giljum, S. (2011) Europe's global land demand. A study on the actual land embodied in European imports and exports of agricultural and forestry products. SERI for FoE Europe. Available from URL: http://www.foeeurope.org/publications/2011/Europe_Global_Land_Demand_Oct11.pdf Mantau, u, Steierer, S., Hetsch, S., Prins, K.(2007). Wood resources availability and demands - implications of renewable energy policies -A first glance at 2005, 2010 and 2020 in European countries. Marx, A. And Cuypers D. (2010). Forest certification as a global environmental governance tool: What is the macro-effectiveness of the Forest Stewardship Council? Regulation and Governance, 4 (4), 408-432. Mayer, A.L., Kauppi, P.E., Angelstam, P.K., Zhang, Y., Tikka, P.M., 2005. Importing Timber, Exporting Ecological Impact. Science 308, 359--360. MEA (2005). Forests and Woodland Systems, chapter 21 in Ecosystems and Human Well-being: Current State and Trends: findings of the Condition and Trends Working Group, edited by Rashid Hassan, Robert Scoles and Neville Ash, Island Press, Washington, USA, 945 pp. Available from URL: http://www.maweb.org/documents/document.290.aspx.pdf Meyfroidt, P., Rudel, T.K., Lambin, E.F., 2010. Forest transitions, trade, and the global displacement of land use. Proceedings of the National Academy of Sciences 107, 20917-20922.

List of Literature
206
Minx, J., Peters, G.P., Wiedmann, T., Barrett, J., 2008. GHG emissions in the global supply chain of food products, The 2008 International Input-Output Meeting on Managing the Environment (IIOMME), 9-11 July, Seville, Spain. Minx, J., Wiedmann, T., Wood, R., Peters, G.P., Lenzen, M., Owen, A., Scott, K., Barrett, J., Hubacek, K., Baiocchi, G., Paul, A., Dawkins, E., Briggs, J., Guan, D., Suh, S., Ackermann, F., 2009. Input-output analysis and carbon footprinting: An overview of regional and corporate applications. Economic Systems Research 21, 187-216. Monier , V. et al. (2010). PREPARATORY STUDY ON FOODWASTE ACROSS EU27. Available from URL: http://ec.europa.eu/environment/eussd/pdf/bio_foodwaste_report.pdf Morton, D.C., R.S. DeFries, Y.E. Shimabukuro, L.O. Anderson, E. Arai, F. del Bon Espirito-Santo , R. Freitas, and J. Morisette (2006). Cropland expansion changes deforestation dynamics in the southern Brazilian Amazon, PNAS, September 26, 2006, vol. 103, no. 39, 14637–14641, www.pnas.org/cgi/doi/10.1073/pnas.0606377103. Narayanan, B., Walmsley, T.L., 2008. Global Trade, Assistance, and Production: The GTAP 7 Data Base. Center for Global Trade Analysis, Purdue University. OECD-FAO (2011). Agricultural Outlook 2011-2020. Available from URL: http://www.keepeek.com/Digital-Asset-Management/oecd/agriculture-and-food/oecd-fao-agricultural-outlook-2011_agr_outlook-2011-en Oosterhaven, J., 1984. A family of square and rectangular interregional input-output tables and models. Regional Science and Urban Economics 14, 565-582. OPEN:EU project http://www.oneplaneteconomynetwork.org/ [accessed 19-12-2011] Page, S. E. et al. (2002). The amount of carbon released from peat and forest fires in Indonesia during 1997. Nature, 420, 61 - 65. Peters, G.P., 2007a. Efficient Algorithms for Life Cycle Assessment, Input-Output Analysis, and Monte-Carlo Analysis. International Journal of Life Cycle Assessment 12, 373-380. Peters, G.P., 2007b. Opportunities and challenges for environmental MRIO modelling: Illustrations with the GTAP database, 16th International Input-Output Conference, Istanbul, Turkey. Peters, G.P., 2007c. Pollution Flows in International Trade: Accounting for intermediate imports. Peters, G.P., 2008a. From Production-Based to Consumption-Based National Emission Inventories. Ecological Economics 65, 13-23. Peters, G.P., 2008b. Greenhouse gas emissions and international trade. In preperation. Peters, G.P., 2008c. Trade and Climate Policy: With a focus on Brazil, XX International conference on Economic Policy, Brazil. Peters, G.P., 2010. Carbon footprints and embodied carbon at multiple scales. Current Opinion on Environmental Sustainability 2, 245-250.

List of Literature
207
Peters, G.P., Andrew, R., Lennox, J., 2011a. Constructing a multi-regional input-output table using the GTAP database. Economic Systems Research 23, 131-152. Peters, G.P., Hertwich, E.G., 2008. CO2 Embodied in International Trade with Implications for Global Climate Policy. Environmental Science and Technology 42, 1401-1407. Peters, G.P., Marland, G., Hertwich, E.G., Saikku, L., Rautiainen, A., Kauppi, P.E., 2009. Trade, Transport, and Sinks Extend the Carbon Dioxide Responsibility of Countries. Climatic Change 97, 379-388. Peters, G.P., Minx, J.C., Weber, C.L., Edenhofer, O., 2011b. Growth in emission transfers via international trade from 1990 to 2008. Proceedings of the National Academy of Sciences 108, 8903-8908. Peters, G.P., Solli, C., 2010. Global carbon footprints: Methods and import/export corrected results from the Nordic countries in global carbon footprint studies. Nordic Council of Ministers, Copenhagen. Peterson, G.D., Heemskerk, M., 2001. Deforestation and forest regeneration following small-scale gold mining in the Amazon: the case of Suriname. Environmental Conservation 28, 117-126. Pimentel, D. And Pimentel, M. (2003). Sustainability of meat-based and plant-based diets and the environment. Am J Clin Nutr 78 (suppl): 660S-3S Potapov, P., Turubanova, S. and Hansen, M.C. (2011) Regional-scale boreal forest cover and change mapping using Landsat data composites for European Russia. Remote Sensing of the Environment 115, 548-561. Ramankutty, N., Gibbs, H.K., Achard, F., Defries, R., Foley, J.A., Houghton, R.A., 2007. Challenges to estimating carbon emissions from tropical deforestation. Global Change Biology 13, 51-66. Rayner, J. Buck, A. & Katila, P. (eds.) (2010). Embracing complexity: Meeting the challenges of international forest governance. A global assessment report. Prepared by the Global Forest Expert Panel on the International Forest Regime. IUFRO World Series Volume 28. Vienna. 172 pp. Available from URL: http://www.iufro.org/science/gfep/forest-regime-panel/report/ Reinvang, R., Peters, G.P., 2008. Norwegian Consumption, Chinese Pollution. World Wildlife Fund Norway, World Wildlife Fund China and the Industrial Ecology Programme at the Norwegian University of Science and Technology. Schmidt, J.H. and B.P. Weidema (2007). Shift in the marginal supply of vegetable oil. International Journal of Life Cycle Assessment 13(3), pp. 235-239. Schoene, D., Killmann, W., Von Lüpke, H. and LoycheWilkie, M. (2007). FAO Forests and Climate Change Working Paper 5. Definitional issues related to reducing emissions from deforestation in developing countries. FAO, Rome, Italy. ftp://ftp.fao.org/docrep/fao/009/j9345e/j9345e00.pdf Sheil,D., Casson, A., Meijaard, E., Van Noordwijk, M., Gaskell, J., Sunderland-Groves, J, Wertz, K. and Kanninen, M. (2009). The impacts and opportunities of oil palm in Southeast Asia. What do we know and what do we need to know? Occasional Paper 51. CIFOR. Bogor, Indonesia. http://www.cifor.org/publications/pdf_files/OccPapers/OP-51.pdf

List of Literature
208
Sikkema, R., Steiner, M., Junginger, M., Hiegl, W., Hansen, M.T. and Faaij, A. (2011) The European wood pellet markets: current status and prospects for 2020. Biofuels, Bioprod. Bioref. 5:250–278 Simula, M. (2009). Towards defining forest degradation: Comparative analysis of existing definitions. Forest Resources Assessment Working Paper 154. FAO, Rome, Italy. ftp://ftp.fao.org/docrep/fao/012/k6217e/k6217e00.pdf Smith, N.J.H., Serrão, E.A.S., Alvim, P.T., Falesi, I.C., 1995. Amazonia: Resiliency and Dynamism of the Land and Its People. United Nations University Press, Tokyo. Wiedmann, T., 2009. A review of recent multi-region input-output models used for consumption-based emissions and resource accounting. Ecological Economics 69, 211-222. Soubbotina, T.P. and Sheram, K.A. (2000). Beyond Economic Growth. Meeting the challenges of global development. The World Bank, Washington, D.C., 155 pp. Available from URL: http://www.worldbank.org/depweb/beyond/beyond.htm Sparovek, G., A. Barretto, G. Berndes, S. Martins, R. Maule (2009). Environmental, land-use and economic implications of Brazilian sugarcane expansion 1996–2006, Mitig Adapt Strateg Glob Change (2009) 14:285–298, DOI 10.1007/s11027-008-9164-3. Stern, P.C., Young, O.R. and Druckman, D. (1992). Global Environmental Change: Understanding the Human Dimensions Committee on the Human Dimensions of Global Change, National Research Council. Available from URL: http://www.nap.edu/openbook.php?record_id=1792&page=92 Tavani, R., Saket, M., Piazza, M., Branthomme, A. and Altrell, D. (2009). Case studies on measuring and assessing forest degradation: Measuring and monitoring forest degradation trhough national forest monitoring assessment. Forest Resources Assessment Working Paper 172. FAO, Rome, Italy. http://www.fao.org/docrep/012/k8592e/k8592e00.pdf TEEB (2010). The Economics of Ecosystems and Biodiversity: Mainstreaming the Economics of Nature: A synthesis of the approach, conclusions and recommendations of TEEB. UNEP. Tukker, A., Bausch-Goldbohm, S., Verheijden, M., de Koning, A., Kleijn, R., Wolf, O. and Pérez-Dominguez, I. (2009). Environmental Impacts of diet changes in the EU. JRC-IPTS, European Commission, Brussels, Belgium. Available from URL: ftp://ftp.jrc.es/pub/EURdoc/JRC50544.pdf UK Timber Trade Federation (2009). EU Market overview. Available from URL: http://www.ttf.co.uk/Search/Default.aspx?q=EU+market+overview UNECE-FAO (2011). The European Forest Sector Outlook Tsudy II.2010-2030. Available from URL: http://live.unece.org/fileadmin/DAM/timber/publications/sp-28.pdf UNEP (2010). Assessing the Environmental Impacts of Consumption and Production: Priority Products and Materials, A Report of the Working Group on the Environmental Impacts of Products and Materials to the International Panel for Sustainable Resource Management. Hertwich, E., van der Voet, E., Suh, S., Tukker, A., Huijbregts M., Kazmierczyk, P., Lenzen, M., McNeely, J., Moriguchi, Y. Available from URL: http://www.unep.fr/shared/publications/pdf/DTIx1262xPA-PriorityProductsAndMaterials_Report.pdf

List of Literature
209
United Nations, Department of Economic and Social Affairs, Population Division (2011). World Population Prospects: The 2010 Revision. NY. Available from URL: http://esa.un.org/unpd/wpp/Excel-Data/population.htm UNFCCC (2011). The Cancun Agreements Report of the Conference of the Parties on its sixteenth session, held in Cancun from 29 November to 10 December 2010. Available from URL: http://unfccc.int/resource/docs/2010/cop16/eng/07a01.pdf#page=2 USDA (2007). Indonesia: Palm Oil Production Prospects Continue to Grow. Available at: http://www.pecad.fas.usda.gov/highlights/2007/12/Indonesia_palmoil/. USDA FAS (2008). Oilseeds: World Market and Trade: http://www.fas.usda.gov/oilseeds/circular/2005/05-10/octcov.pdf van der Voet, E et al. (2009), Environmental Impact of the use of Natural Resources and Products http://www.leidenuniv.nl/cml/ssp/publications/eurostat_indicators_final_report_version_141009.pdf van Gelder, J.W. and German, L. (2011). Biofuel finance. Global trends in biofuel finance in forest-rich countries of Asia, Africa and Latin America and implications for governance. CIFOR Info Brief No. 36, Bogor, Indonesia, 12 pp. Available from URL: http://www.cifor.cgiar.org/publications/pdf_files/infobrief/3340-infobrief.pdf Von Braun, J. and Meinzen-Dick, R. (2009) “Land Grabbing” by Foreign Investors in Developing Countries: Risks and Opportunities. IFPRI http://www.ifpri.org/sites/default/files/publications/bp013all.pdf Weidema, B.P., Wesnæs, M., Hermansen, J., Kristensen, T. and Halberg N. (2006). Environmental Improvement Potentials of Meat and Dairy Products. IPTS-JRC, European Commission, Brussels, Belgium. Available from URL: ftp://ftp.jrc.es/pub/EURdoc/JRC46650.pdf Wendland, K., Lewis, D.J., Alex-Garcia, J., Ozdogan, M., Bauman, M. and Radeloff, V.C. (2011) Regional- and district-level drivers of timber harvesting in European Russia after the collapse of the Soviet Union. Global Environmental Change (in press) Westhoek, H., Rood, T., van de Berg, M., Janse, J., Nijdam, D., Reudink, M. and Stehfest, E. (2011). The Protein Puzzle, The Hague: PBL Netherlands Environmental Assessment Agency. Available from URL: http://www.pbl.nl/sites/default/files/cms/publicaties/Protein_Puzzle_web.pdf WHO (2003). Global and regional food consumption patterns and trends. Wiedmann, T., Lenzen, M., Turner, K., Barrett, J., 2007. Examining the Global Environmental Impact of Regional Consumption Activities - Part 2: Review of input-output models for the assessment of environmental impacts embodied in trade. Ecological Economics 61, 15-26. Wilting, H., Vringer, K., 2009. Carbon and land use accounting from a producer's and a consumer's perspective: An empirical investigation covering the world. Economic Systems Research 21, 291-310. Wirsenius, S., F. Hedenus, and K. Mohlin. 2010. Greenhouse gas taxes on animal food products: Rationale, tax scheme and climate mitigation effects. Climatic Change: 1-26. In press.

List of Literature
210
Yamakawa, A., Peters, G.P., 2009. Using time-series to measure uncertainty in Environmental Input-Output Analysis. Economic Systems Research 21, 337-362. Zaks, D.P.M., C.C. Barford, N. Ramankutty, J.A. Foley (2009). Producer and consumer responsibility for greenhouse gas emissions from agricultural production -- a perspective from the Brazilian Amazon, Environ. Res. Lett. 4, 044010 (12pp), doi:10.1088/1748-9326/4/4/044010.

Annex A: Method for attribution of deforestation to sectors and commodities (for CHAPTER 3)
1
ANNEX A: METHOD FOR ATTRIBUTION OF DEFORESTATION TO SECTORS AND COMMODITIES (FOR CHAPTER 3)
The aim of the analysis described here is to quantify the impact of consumption in individual countries and country-groups (including the European Union) on deforestation. This requires:
• Firstly, an estimation of the total land content and deforestation content in primary sectors and commodities; and
• Secondly, to track commodity flows from primary production to final use via trade and intermediate products.
The focus of this annex is on this first step, the attribution of forest area loss to primary sectors and commodities. For data availability and practical reasons, this study aims for country-specific averages of transition pathways. Global land use and agricultural data published by the UN form the basis for the allocation of deforestation to primary production of crops, livestock products, timber and natural causes. FRA 2010 provides country-level data of net deforestation for three periods 1990 to 2000, 2000 to 2005 and 2005 to 2010. It provides regional estimates of afforestation rates (and sometimes natural expansion) and of forest land seriously affected by fire. Land use and agricultural statistics are available from FAOSTAT until 2008/2009. Based on these published global data, calculations by country for the attribution of deforestation to primary production sectors was done separately for two time periods: 1990-2000, 2000-2008. Attribution of deforestation to sectors and individual commodities follows a three-stage approach. In a first step, we use the structure of a land-use transition model to attribute deforestation to the following land-use change categories, based on the FAO land use statistics from one year to another:
(i) forest land converted to agriculture, i.e. for cropping and livestock production; (ii) forest land converted to built-up land, i.e. expansion of urban areas, residential land and
transport infrastructure; (iii) forest land converted to ‘other land39’ in the process of extraction of industrial roundwood,
fuelwood, side effects of agricultural expansion and other ‘unexplained’ reasons; and (iv) forest land destroyed and as such converted to ‘other land’ due to natural causes (e.g., fire,
diseases, extreme events).
Secondly, the deforestation attributed to agriculture is separated into land used for cropping and land converted to pastures for ruminant livestock production. A fraction of agricultural land is allocated to the forestry sector (logging) to account for wood extraction on forest land that has been converted for agriculture.
39 The land use category ‘other land’ comprises of all land use not classified as agricultural land (i.e. cultivated land, permanent pastures and meadows), forest land (according to FRA2010 defined as minimum 10% canopy cover) and built-up areas. This includes sparsely vegetated shrub land and herbaceous vegetation with less than 10% canopy cover.
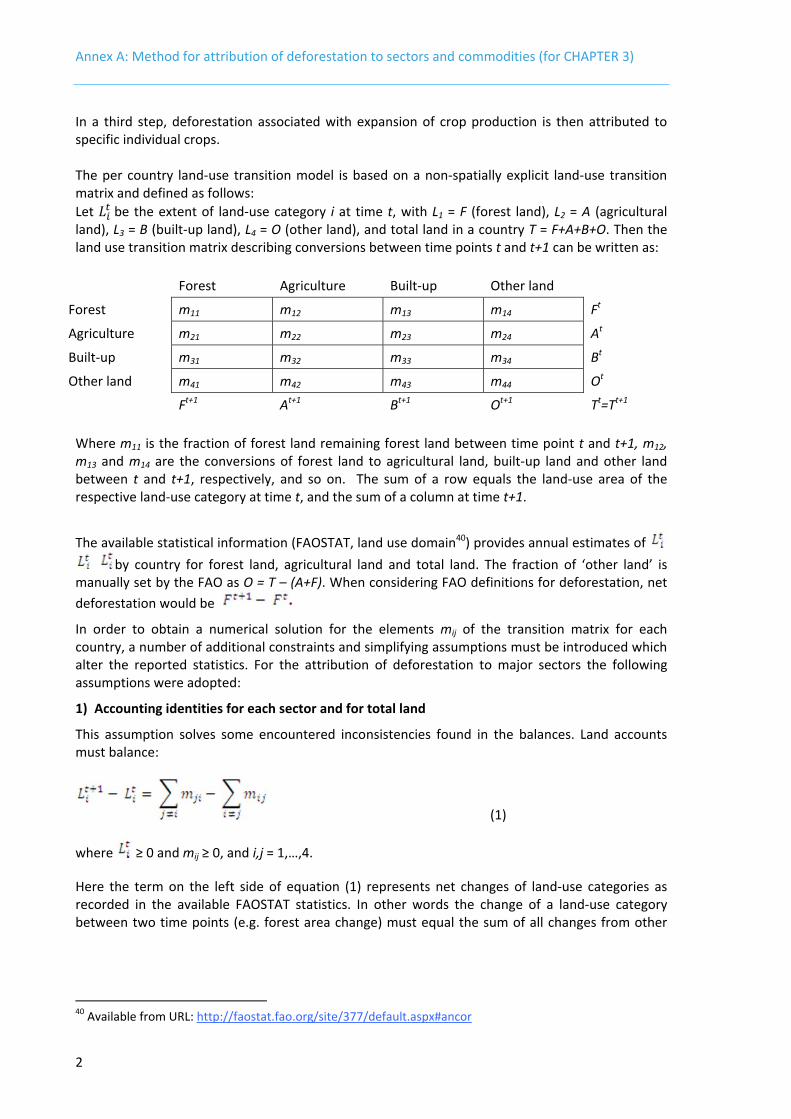
Annex A: Method for attribution of deforestation to sectors and commodities (for CHAPTER 3)
2
In a third step, deforestation associated with expansion of crop production is then attributed to specific individual crops. The per country land-use transition model is based on a non-spatially explicit land-use transition matrix and defined as follows: Let be the extent of land-use category i at time t, with L1 = F (forest land), L2 = A (agricultural land), L3 = B (built-up land), L4 = O (other land), and total land in a country T = F+A+B+O. Then the land use transition matrix describing conversions between time points t and t+1 can be written as:
Forest Agriculture Built-up Other land
Forest m11 m12 m13 m14 Ft
Agriculture m21 m22 m23 m24 At
Built-up m31 m32 m33 m34 Bt
Other land m41 m42 m43 m44 Ot
Ft+1 At+1 Bt+1 Ot+1 Tt=Tt+1 Where m11 is the fraction of forest land remaining forest land between time point t and t+1, m12, m13 and m14 are the conversions of forest land to agricultural land, built-up land and other land between t and t+1, respectively, and so on. The sum of a row equals the land-use area of the respective land-use category at time t, and the sum of a column at time t+1.
The available statistical information (FAOSTAT, land use domain40) provides annual estimates of by country for forest land, agricultural land and total land. The fraction of ‘other land’ is
manually set by the FAO as O = T – (A+F). When considering FAO definitions for deforestation, net deforestation would be
In order to obtain a numerical solution for the elements mij of the transition matrix for each country, a number of additional constraints and simplifying assumptions must be introduced which alter the reported statistics. For the attribution of deforestation to major sectors the following assumptions were adopted:
1) Accounting identities for each sector and for total land
This assumption solves some encountered inconsistencies found in the balances. Land accounts must balance:
(1)
where ≥ 0 and mij ≥ 0, and i,j = 1,…,4.
Here the term on the left side of equation (1) represents net changes of land-use categories as recorded in the available FAOSTAT statistics. In other words the change of a land-use category between two time points (e.g. forest area change) must equal the sum of all changes from other
40 Available from URL: http://faostat.fao.org/site/377/default.aspx#ancor

Annex A: Method for attribution of deforestation to sectors and commodities (for CHAPTER 3)
3
land-use categories (increases, or in the forest example afforestation41) minus the sum of all changes into other land use categories (decreases or in the forest example deforestation).
Furthermore, the four broad land-use categories must add up to total land at all time points:
(2) 2) Specific conditions for certain elements of the transition matrix
a) Conversion of built-up land
None of the built-up land can be converted into another land-use category in a later period.
Conversion to built-up land is assumed irreversible. All off-diagonal elements in the matrix row referring to built-up land are set to zero:
(3)
b) Conversion into forest land or afforestation
All afforestation is modelled via the land category ‘other land’. That means land, especially agricultural land, is assumed to be first converted into this category (through degradation or abandonment) and ‘other land’ is converted into forest land at rates listed in the national reports of FRA 2010 (i.e., Table T5 in those country reports42). Where national data are not reported in FRA 2010, afforestation is estimated using average regional afforestation rates derived from the published estimates in the FRA 2010 main report. In the model, this is represented as
(4)
and afforestation is set according to national data or estimated using regional coefficients (αREG):
(5)
c) Conversion to built-up land
The elements mi3, are assumed to occur from all other land-use categories in proportion to their respective extents:
(6) 41 Afforestation is the act of establishing forests through planting and/or deliberate seeding on land that is not classified as forest, while reforestation refers to the re-establishment of forest through planting and/or deliberate seeding on land classified as forest, for instance after a fire, storm or following clearfelling (FAO, 2010a) 42 FRA 2010 country reports available from URL: http://www.fao.org/forestry/fra/fra2010/en/ , for countries which report on natural expansion of forests into other land, these have been included in the afforestation figures

Annex A: Method for attribution of deforestation to sectors and commodities (for CHAPTER 3)
4
for i = 1, 2, and 4.
The extent of urban expansion, term (Bt+1 – Bt), is derived from a spatially explicit land-use database (Fischer et al, 2011, GAEZ Model Documentation, p.25), which describes the extent of built-up land based on available population distribution data. The spatial population density inventory (30 arc-seconds) for the year 2000 was developed by FAO-SDRN, based on spatial data of LANDSCAN 2003, LandScanTM Global Population Database43, with calibration to UN 2000 population figures. Landscan is a spatial land-demand function, which estimates the extents of required built-up land area for urban and infrastructure purposes based on population density and distribution (based mainly on data from Asia). It is applied together with changes in population numbers to model increases in built-up land area.
d) Conversions due to fire result in ‘other land’
Data presented in FRA 2010 on extents of forest land severely affected by fire were used to provide rough estimates of forest land losses due to natural conditions. In the calculations it is assumed that ten% of the affected forest land is severely damaged and entering the stock of ‘other land’:
(7)
The parameters βREG were calculated from the regional aggregate estimates presented in the main report of FRA 2010. Where specific additional information was available, e.g. the severe forest fires in Indonesia during 1990 – 2000 and the fires and drought conditions in Australia during 2000 – 2008, the national estimates were adjusted accordingly. As noted by FAO, available data on forest land affected by fire and its causes is incomplete and estimates derived are uncertain (FAO, 2010).
e) Specific conversion assumptions for agricultural land
In addition to conversion for built-up land and losses due to natural conditions (fires, etc.), agriculture is a primary source of deforestation (Boucher, 2011; Houghton, 2010):
(8)
And
(9)
where m12 is the conversion of forest land to agricultural land,
dA is total estimated demand for additional agricultural land,
AF is afforestation (equation 5),
m13 is conversion of agricultural land to built-up land.
43 Available from URL: http://www.ornl.gov/landscan/

Annex A: Method for attribution of deforestation to sectors and commodities (for CHAPTER 3)
5
The last term dFO in equation (9) represents natural losses of forest as defined above in equation (7). Afforestation AF and natural losses of forest dFO are parameterized using regional coefficients calculated from results published in FRA 2010 (FAO, 2010) and described above under b) and d).
dFN is the remaining gross forest area change (net forest change plus afforestation) minus forest land converted to built-up minus forest land lost due to natural conditions (fires).
Changes in reported expansion of cultivated land and pastures alone may conceal important deforestation effects of agricultural expansion. Therefore additional available information from FAOSTAT on changes in harvested areas, ruminant livestock numbers, and expansion of selected perennials may increase cultivated land expansion when they are larger than cultivated or pasture land expansion. When a country reports significant increases in harvested cultivated areas while reported cultivated land expands little, the methodology checks for the plausibility of the implied land-use intensification and uses the harvested area expansion to estimate additional physical land demand. Historic analysis of global crop production evolution suggests that on average about a third of the sources of crop production increases were due to harvested land expansion and two thirds due to yield increases with strong regional variation between developed and developing countries (Bruinsma, 2003, p.126).
dA or additional agricultural land demand is estimated as gross demand which is comprised of net increases of cultivated land dC and pastures dP which include losses due to degraded and abandoned agricultural land. dC and dP calculate maximum increases of cultivated land and pastures, respectively, based on reported expansions and other parameters from FAOSTAT, according to:
(10)
and
(11)
(12)
where variables C and P represent respectively reported cultivated land and permanent pastures and meadows.
are changes of reported harvested areas of selected perennial crops (banana and plantain, coffee, cocoa, tea, oil palm fruit, and natural rubber). These selected perennial are likely to be established on newly converted former forest land rather than replacing former cultivated crops because of their biophysical and agronomic management practices.
are changes of harvested area of all other crops during the observation period.
Variable measures the changes in ruminant livestock numbers (mainly cattle, sheep and goats) converted to reference units.
These variables are adapted by regional parameters γREG, δREG, and ϑREG respectively.

Annex A: Method for attribution of deforestation to sectors and commodities (for CHAPTER 3)
6
A fraction of the total agricultural land stock is assumed to be lost due to land degradation and abandonment every year. In addition agricultural land conversion may result in edge effects, e.g. by clearing by fire may destroy forest without entering the stock of cultivated land. The terms DC and DP represent land lost due to degradation, EC and EP were included to account for ‘edge’ effects’, i.e. a fraction of land wasted (and converted to ‘other land’) in the process of land conversion to agriculture. When land is prepared for agricultural use, in most cases the ‘preparation’ has an effect on the surrounding land, while these surroundings will not end up in national agricultural land-use statistics as they are not productive. This kind of deforestation is attributed to the agricultural sector but in the transition matrix this forest land is converted into ‘other land’. So, deforestation because of these effects is attributed to the agricultural sector but does not result into more agricultural land. Note that only very limited country-specific information is available to parameterize these effects and therefore regional coefficients and assumptions were used in the model.
f) Remainder allocated to ‘other land’
All forest area loss that cannot be attributed to the expansion of crops, livestock and built-up land, or natural causes (mainly wildfires), even with the assumptions above, is conversion into ‘other land’. Activities and drivers causing such deforestation differ between regions. This remainder can be attributed as ‘unexplained’.
With the conditions and assumptions described in 1) and 2) above, the land use transition matrix M, which describes changes for the period (t, t+1), respectively for 1990-2000 and 2000-2008 in this study, is fully determined. The resulting flows and estimation method are summarized in the matrix below and sketched in Figure C1.
Forest Agriculture Built-up Other
Forest m11 m12 m13 m14 Ft
Agriculture m21 m22 m23 m24 At
Built-up m31 m32 m33 m34 Bt
Other m41 m42 m43 m44 Ot
Ft+1 At+1 Bt+1 Ot+1 Tt=Tt+1
In Table 2, matrix elements derived using the basic land-use accounting identities, described in 1) above, are shown in blue. Elements resulting from condition 2 a) are shown as grey. Conversion to forest, i.e. afforestation, is defined under 2 b) and shown in yellow. Conversion to built-up land is specified in 2 c) and shown in a red tone, and remaining conversions between agriculture and ‘other land’ result from conditions 2d), 2 e) and 2f) and are shown in green.
The main objective, estimation of deforestation by broad sectors, is given by the off-diagonal elements of row 1, i.e. elements m12, m13, and m14.

Annex A: Method for attribution of deforestation to sectors and commodities (for CHAPTER 3)
7
Figure (Annexes) 1 Land conversion flows included in the attribution of deforestation to broad sectors
The various land conversions (flows) shown in Figure (Annexes) 1 and included in the model calculations refer to the following elements:
A = Clearing of forest land for agricultural use; B = Clearing of forest land in the expansion of built-up and infrastructure land; C = Deforestation unexplained or caused by unsustainable logging; D = Forest land lost due to natural causes (mainly wildfires); E = Afforestation (including natural expansion of forest land); F = Conversion of agricultural land for the expansion of built-up and infrastructure land; G = Loss or abandonment of agricultural land; H = Conversion of other land for agricultural use; I = Conversion of other land for the expansion of built-up and infrastructure land.
3) Proportionality assumption
In order to attribute deforestation to the two subcategories of the agricultural sector, element m12, i.e. cropping and ruminant livestock production, an additional quite natural assumption has been made, namely that deforestation can be attributed in proportion to total additional land demand of each agricultural sub-sector. In other words, we impose the conditions:
(13) And
ForestLand
AgricultureLand
Built-upInfrastruct.
Land
OtherLand
A B
G
H
FC DE
I

Annex A: Method for attribution of deforestation to sectors and commodities (for CHAPTER 3)
8
(14) In this formulation, the terms and respectively represent deforestation attributed to the primary agricultural sub-sectors of cropping and ruminant livestock production, and dC and dP the expansion of cultivated land for crop production and pasture land for ruminant livestock production as defined in equations (11) and (12). Each agricultural sub-sector contributes directly and indirectly to deforestation. For example cropland expansion may be attributed to deforestation indirectly by occurring on land outside the deforested areas while pasture expansion is the direct agent of deforestation.
4) Wood extraction on forest land converted for agriculture
Conversion of forests to agriculture is in some regions preceded by timber extraction. Sometimes natural fires may pave the way for agricultural expansion. We assume a certain fraction of deforestation attributed to agricultural expansion to reallocate to the roundwood extraction. This fraction varies and is set by region, at 0-10% based on expert knowledge.
5) Allocation of deforestation to individual crops
After allocation of deforestation to broad sectors, including to agriculture for the expansion of crop and livestock production, the extents assigned to crop agriculture are attributed to individual crops in the following way. First, crops are divided into two groups:
(i) Group I1 includes perennials, which are frequently being established on forest land rather than replacing former cultivated crops because of their biophysical, agronomic, phyto-pathologic requirements and field/plantation management practices. These perennials include oil palm, rubber, banana & plantain, coffee, cocoa and tea.
(ii) Group I2 includes all other crops.
Secondly, based on the national details of the calculation to determine total demand for additional crop land dC (see condition 2e) in the description above), the extent of deforestation attributed to
crop agriculture is split into amounts allocated to the two crop groups, namely and . Thirdly, within each crop group, extents of deforestation are then attributed in proportion to each crop’s magnitude of harvested area expansion.
with (15) and
with (16) where crop-wise harvested area expansion is calculated as
for both i and j, with (17)
is the harvested area of crop i at time point t.
Annex A: Method for attribution of deforestation to sectors and commodities (for CHAPTER 3)
9
The underlying principle followed here is that deforestation can be caused both by direct conversion as well as indirect factors (e.g. displacement of crops or pastures, distant effects of crop expansion) and that attribution of deforestation is best based on the relative magnitude of land demand reported for each crop sector in terms of expansion of respective harvested areas. Thus all crops in a country reporting expansion of harvested areas are attributed to deforestation in relation to their relative contribution to agricultural expansion.

Annex B: Regions used in CHAPTER 3and CHAPTER 4
10
ANNEX B: REGIONS USED IN CHAPTER 3AND CHAPTER 4 nam North America Canada, United States of America, St Pierre Miq, eu27 European Union All countries of EU15 and EU12 eu15 EU15 Austria, Belgium, Denmark, Finland, France, Germany, Greece,
Ireland, Italy, Luxembourg, Netherlands, Portugal, Spain, Sweden, United Kingdom
eu12 EU12 Bulgaria, Cyprus, Estonia, Hungary, Latvia, Lithuania, Malta, Czech Republic, Poland, Romania, Slovenia, Slovakia
eurr Rest of Europe, Russia
Albania, Belarus, Bosnia and Herzegovina, Croatia, Republic of Moldova, Macedonia, Russian Federation, Serbia and Montenegro, USSR, Ukraine, Yugoslav SFR
cam Central America Antigua, Bahamas, Barbados, Bermuda, Aruba, Belize, Cayman Is, Costa Rica, Cuba, Dominica, Dominican Republic, El Salvador, Grenada, Guadeloupe, Guatemala, Haiti, Honduras, Jamaica, Martinique, Mexico, Montserrat, Netherlands Antilles, Nicaragua, Panama, Puerto Rico, St Kitts Nev, St Lucia, Saint Vincent/Grenadines, Trinidad and Tobago, Turks Caicos, BR Virgin Is, US Virgin Is
sam1 South America 1 Argentina, Brazil sam2 South America 2 Bolivia, Chile, Colombia, Ecuador, Falkland Is, French Guiana, Guyana,
Paraguay, Peru, Suriname, Uruguay, Venezuela sam South America All countries of sam1 and sam2 nawa North Africa &
Western and Central Asia
Armenia, Afghanistan, Algeria, Bahrain, Republic of Azerbaijan, Egypt, Georgia, Iran, Islamic Rep of, Iraq, Israel, Kazakhstan, Jordan, Kyrgyzstan, Kuwait, Lebanon, Libyan Arab Jamahiriya, Morocco, Qatar, Saudi Arabia, Tajikistan, Syrian Arab Republic, Turkmenistan, Oman, Tunisia, Turkey, United Arab Emirates, Uzbekistan, Yemen, Palestine O.T.
ssaf Sub-Saharan Africa
Angola, Botswana, Burundi, Cameroon, Cape Verde, Central African Republic, Chad, Comoros, Republic of Congo, Benin, Equatorial Guinea, Ethiopia PDR, Djibouti, Gabon, Gambia, Ghana, Guinea, Cote d'Ivoire, Kenya, Lesotho, Liberia, Madagascar, Malawi, Mali, Mauritania, Mauritius, Mozambique, Namibia, Niger, Nigeria, Guinea-Bissau, Eritrea, Zimbabwe, Reunion, Rwanda, St Helena, Sao Tome and Principe, Senegal, Seychelles, Sierra Leone, Somalia, South Africa, Sudan, Swaziland, United Rep of Tanzania, Togo, Uganda, Burkina Faso, Ethiopia, Dem Republic of Congo, Zambia, Mayotte
sas South Asia Bangladesh, Bhutan, Sri Lanka, India, Maldives, Nepal, Pakistan sea1 Southeast Asia 1 Indonesia, Malaysia sea2 Southeast Asia 2 Brunei Darussalam, Myanmar, Cambodia, Laos, Papua New Guinea,
Philippines, Timor-Leste, Singapore, Thailand, Viet Nam sea Southeast Asia All countries of sea1 and sea2 eas East Asia Japan, Dem People's Rep Korea, Republic of Korea, China, Macao SAR,
Mongolia, China oce Oceania Amer Samoa, Australia, Solomon Islands, Cook Is, Fiji Islands, French
Polynesia, Kiribati, Guam, Marshall Is, Microneisa, Nauru, New Caledonia, Vanuatu, New Zealand, Niue, Norfolk Is, N Marianas, Pacific Is, Palau, Tonga, Tuvalu, Wallis Fut Is, Samoa
* In LANDFLOW the regions include an additional 40 smaller countries, which have been omitted from this list.

Annex C1: Overview of data sources and methods for the attribution of embodied land and deforestation to agricultural commodities
11
ANNEX C1: OVERVIEW OF DATA SOURCES AND METHODS FOR THE ATTRIBUTION OF EMBODIED LAND AND DEFORESTATION TO AGRICULTURAL COMMODITIES
DATA SOURCES The main data source used for the attribution of land and deforestation to agricultural crops and livestock products are the online databases of the statistical service of the United Nations Food and Agricultural Organization (FAO, 201144). This database contains various domains of national level time-series data, including primary crop and livestock production, land use data, animal stock numbers, commodity supply and utilization balances of primary and derived products, national commodity trade data, and bilateral commodity trade data by country in physical units and dollar values. This section treats the data which is used for the LANDFLOW model: the FAO Supply-Utilization Accounts (SUA), which are essential for linking a country’s agricultural production to consumption, processing and trade; production data; Trade data to link these SUAs with other countries’ SUAs; and Land-use data to link the trade of these commodities to physical land and deforestation in the country of origin.
Commodity balances: Supply Utilization Accounts (SUA) in FAOSTAT
Supply Utilization Accounts (SUA) report primary crops as well as processed crops and crop by-products. For each commodity, the SUA gives information on provision and use: Supply is from Domestic production and Imports. Commodities may be used for Exports (mainly after processing into consumer products) or Domestic use, which together constitute Utilization. Domestic use comprises Feed, Seed, Waste, Processing, Food and Other Utilization Balances also include Stock Changes. Supply and utilization are balanced on an annual basis. Annex C1Error! Reference source not found. indicates the basic accounting logic followed in the FAO commodity balances, which is essential for consistent land accounting across multiple domestic and foreign uses of commodities. Crop commodities included in the SUA commodity balances are listed in Annex D. Most commodities are reported as primary crops. Additionally, the SUA reports secondary products derived from sugar crops and oil crops as well as cereal brans, beverages and some processed foods. In order to quantify the embodied land use and deforestation associated with EU27 consumption, their primary equivalent has to be computed. The primary equivalent is necessary to allow for relating agricultural production to land use as many commodities can be produced from the same crop. For instance, the primary produce of oil crops is oilseeds from which oil is extracted, also jointly producing oilcakes as a residue from the oil extraction process. The conversion of oilcakes and vegetable oil into their primary equivalent can be done with technical coefficients given by FAOSTAT. Technical coefficients for oilseed cakes are defined as production of oilseed cakes divided by the amount of oilseeds used in Processing.
44 FAOSTAT has been consulted in 2011; depending on the data domain used it contains data up to 2007, 2008 or 2009.

Annex C1: Overview of data sources and methods for the attribution of embodied land and deforestation to agricultural commodities
12
Su
pp
ly
Production
Uti
lizat
ion
Exports
To Stocks
equals Domestic Use Seed
From Stocks Waste
Feed
Imports Processing
Food
Other utilizations
Figure (Annexes) 2 Elements of Supply Utilization Accounts (in tons)
Regarding livestock production, the SUAs include among the used items a wide range of primary crops and crop products recorded as animal feeds, as listed in Annex E.
Limitations of the SUA approach – apparent consumption
Due to the domain boundaries of the FAOSTAT databases, trade of highly processed goods and hence ultimate final uses of agricultural commodities reported under the utilization category Other utilizations cannot be tracked within the SUA system. For instance, once animal fats enter the industrial sector to produce cosmetics, or tanned leather from skins and hides are turned into leatherwear or shoes, the trade of cosmetics or respectively shoes is not recorded in the FAOSTAT data. To address this specific limitation of the FAOSTAT data in this study, the approach of multi-region Input-Output modelling up to final consumption, based on monetary trade streams, is used to complement the detailed LANDFLOW analysis. For all other items, in particular the categories Feed and Processing the LANDFLOW system can track a commodity along its processing chain. Volumes recorded as Processing appear in the SUA system as input to a related derived commodity, where uses and trade are recorded and can be tracked. For Feed use, the LANDFLOW model computes the implied commodity flows (and ‘virtual’ land flows) via feed balances for the livestock herds recorded in the FAOSTAT livestock domain data and the SUA accounts of the related livestock products.
Crops primary production and livestock production data
This domain of the FAOSTAT database reports for all primary crops (on a detailed level with a total of 170 different commodities) the following elements:
• Production (tons); • Area harvested (ha); and • Yields, extraction rates (tons/ha)
Production data refer to “the actual harvested production […], excluding harvesting and threshing losses and that part of crop not harvested for any reason”. Area harvested refers to the area from which a crop is gathered. Areas, on which no harvest takes place due to damage or failure, are excluded. In cases of successive cropping, the area is counted as many times as harvested. Yields represent “the harvested production per unit of harvested area for crop products.” (FAO, 2011). For the land estimation it is necessary to distinguish between annual and perennial crops. Whereas annual crops are sown or planted each year, perennial crops occupy the land for long periods.

Annex C1: Overview of data sources and methods for the attribution of embodied land and deforestation to agricultural commodities
13
Where climate permits, annual crops may be harvested more than once a year; perennial crops occupy the land year-round and are usually harvested only once a year. FAOSTAT includes a domain on fodder crops reporting production and harvested area of 16 commodities used exclusively for feed. For livestock, FAOSTAT reports time series of a country’s number of heads of live animals for some 15 different animal categories. According to their feeding characteristics and land requirements we have differentiated two broad groups of animals, namely ‘ruminants’ and ‘other livestock’, including:
• Ruminants: cattle, sheep, goats, horses, asses, mules, camels and other camelids • Other livestock: pigs, chickens, ducks, geese, turkeys, rabbits, other rodents.
Trade data
FAOSTAT provides an extensive trade data base reporting physical quantity (tons) as well as value (1000$) for primary crops and processed commodities:
• Imports (tons) ; • Imports (1000$) ; • Exports (tons) ; and • Exports (1000$)
The commodity list includes nearly 600 different products covering a country’s entire trade of the agricultural sector. For linking with SUA commodity balances, the processed commodities of the trade domain are converted to primary equivalents using technical coefficients. For example, in the case of the primary commodity maize the following items are included in the trade data base: Maize primary; Germ of Maize; Flour of Maize; and Bran of Maize. Primary equivalents are reported in the supply utilization accounts (SUA). FAOSTAT trade data are made consistent with SUA data by ensuring that primary equivalents in the trade data equal reported imports and exports in the supply utilization accounts. For livestock, FAOSTAT trade data include a long list of products. These have been connected with the two broad livestock categories, ‘ruminants’ and ‘other animals’, as listed in Annex E. In addition, FAOSTAT also reports time series of imports and exports of live animals separated for different livestock species.
Land Use data
Land use data in FAOSTAT include the elements arable land, permanent crops and permanent pasture, which are of major importance for attributing land to the crops and livestock sector. These data provide the base information for the area required for a country’s domestic production of primary crops. Arable land refers to “land under temporary crops (double-cropped areas are counted only once), temporary meadows for mowing or pasture, land under market and kitchen gardens and land temporarily fallow (less than five years)” (FAO, 2011).

Annex C1: Overview of data sources and methods for the attribution of embodied land and deforestation to agricultural commodities
14
Land under Permanent crops refers to land cultivated with crops occupying the land for long periods with no need of re-plantation after each harvest, i.e. land area cultivated with perennial crops. Permanent pasture is land “used permanently (five years or more) for herbaceous forage crops, either cultivated or growing wild” (FAO, 2011). In this report we use the term ‘cropland’ to refer to both arable land and land under permanent crops.
LAND IN PRODUCTION
Climatic and biophysical conditions combined with technology and management determine the intensity of cropland use. A piece of cropland may be temporary fallow, produce one crop or may allow two or more crops per year to be harvested. For the physical land balance maintained in the LANDFLOW model the task is to go beyond harvested areas and to estimate the physical land base required for the production of individual crops. Countries report total cropland on the one hand and harvested area for individual crops on the other. Cropland comprises arable land and land under permanent crops. Agricultural land is a production factor with lot of diversity compared to other producing sectors. In order to connect individual crop data (harvested area and production) with aggregate cropland data, some data manipulation and consistency checking is needed for:
• land and crops with more than one yield per year and treating fallow land in the cropland use;
• relating individual crop data to land use; and • accounting for joint production (co-products and by-products).
→ Calculation of Multi-Cropping Index
The intensity of using physical land in time, accounting for both sequential cropping as fallow periods, is indicated by a multi-cropping index (MCI). It reflects the cropping intensity on a given piece of land and is defined as the ratio of harvested area over the actual underlying physical land area. FAOSTAT reports the area harvested for all primary crops. FAO (2011) defines the element area harvested as “the land area from which the crop is gathered”. The area harvested is counted as many times as the crop is sown or planted in the same field during a year (i.e. in case of successive cropping of annual crops). FAOSTAT land use domain reports the land area for arable land and land under permanent crops. The MCI calculation procedure uses these two sources of data and takes into account the differences in land requirements between annual and perennial crops. In order to calculate the harvested production (in tons) per unit of cultivated area, the harvested area of crops has to be converted into actual physical land, i.e. cultivated area. Therefore, the assumption is made that the Multi-Cropping Index can be used for annual crops and a land factor in the range of 0.9 – 1.0 is used for perennial crops. The respective extent of cropland is then derived by dividing the harvested area by the Multi-Cropping Index.

Annex C1: Overview of data sources and methods for the attribution of embodied land and deforestation to agricultural commodities
15
→ Allocation of land used for individual crops
The aim is to allocate the physical land base to the primary agricultural commodities produced in a country. In order to estimate land embodied in consumption and use of commodities, the supply and utilization elements from SUAs have to be connected with the corresponding cropland areas.
While the quantification of the respective land area of primary crops is a relatively easy task using the respective MCI-adjusted yields, a quantification of land for crop by-products requires further calculations.
→ Treatment of Joint Production
In general joint production occurs with oil crops and sugar products. The processing of oil crops leads to oils and oilcakes, both having a technical extraction rate given by FAOSTAT (FAO 2011). As simple conversion of joint commodities by their extraction rates to primary equivalent would lead to double-counting of physical land, a weighting of the technical coefficient is needed.
One possible approach to weighting in case of joint production is to compare the monetary values of the joint products and to use their share in total value of output to weigh extraction rates of the corresponding commodities. The way this is done is comparable to the approach used in Lifecycle Chain Analyses (LCAs) to attribute externalities to co-products and by-products. It is explained in detail below.
Let us assume that we have two joint products A and B, both obtained from the processing of commodity Q. Product A with quantity QA has an extraction rate of εA, product B with quantity QB an extraction rate of εB. The following identities hold:
Q
QAA =ε and
Q
QBB =ε
Knowing the unit price of commodities A and B, say PA and PB, their respective value VA and VB may be calculated:
AAA PQV ⋅= and BBB PQV ⋅= The value share of commodity A is defined as:
BA
AA VV
Vv
+=
With equations above, vA follows as: BBAA
AAA PP
Pv
⋅+⋅⋅
=εε
ε
The value share of commodity B then is given by: AB vv −=1 The quantity Q of any processed crop commodities QA and QB can now be expressed as sum of the primary equivalents of QA and QB:

Annex C1: Overview of data sources and methods for the attribution of embodied land and deforestation to agricultural commodities
16
)1( AB
BA
A
A vQ
vQ
Q −⋅+⋅=εε
These calculations are undertaken for derived products from oilseeds and sugar crops. World export unit values (in $/t) from FAOSTAT (FAO 2011) of the single commodities are taken as their unit price. Table E1 summarizes the calculations for oil crops, presenting the extraction rates (technical coefficients) given by FAOSTAT (FAO 2011) and the calculated value shares. The same logic and calculation procedure is applied for sugar crops and their derived products. From the processing of sugar crops, the SUA commodities Sugar & Sweeteners and Molasses are produced. Sugar & Sweeteners have an extraction rate of about 16%, Molasses of about 4%. Finally, after calculating the primary crop equivalent of processed crops and crop by-products, the respective land areas can be calculated. This land area then has to be allocated proportionally to the relevant utilization items of the processed crop or crop by-product. To give an example, SUAs give the quantity of oilseeds delivered to food processing industries, represented in SUAs through the utilization item Processing. The output of this industry is oil and oilcakes, both being converted to their corresponding land area (as explained before). These two products are mainly used as feed to livestock and food for human beings. The land area thus has to be accounted for under the corresponding utilization items Feed and Food. Extraction rates and value shares of major oil crops
Oilseed Cakes Vegetable Oil
Extraction rate Value share Extraction rate Value share
Soybeans 0.79 64,00% 0.18 36,00%
Groundnuts in Shell 0.38 19,05% 0.3 80,95%
Coconuts 0.08 10,36% 0.13 89,64%
Palm Kernels 0.52 15,83% 0.46 84,17%
Olives 0.22 100%
Sunflower Seed 0.47 17,83% 0.41 82,17%
Rapeseed 0.6 27,45% 0.38 72,55%
Sesame Seed 0.51 8,75% 0.43 91,25%
Cottonseed 0.51 40,51% 0.16 59,49%
Karite Nuts (Sheanuts) 0.25 100%
Castor Beans 0.4 100%
Mustard Seed 0.58 20,84% 0.36 79,16%
Tung Nuts 0.16 100%

Annex C1: Overview of data sources and methods for the attribution of embodied land and deforestation to agricultural commodities
17
Jojoba Seeds 0.35 100%
Safflower Seed 0.63 29,70% 0.35 70,30%
Tallow tree Seeds 0.3 100%
Kapok Fruit 0.37 21,94% 0.3 78,06%
Linseed 0.63 37,30% 0.35 62,70%
ALLOCATION OF FEED SOURCES TO LIVESTOCK TYPES
Feed sources for livestock production include pastures for grazing and various fodder and feed crops grown on cropland as well as by-products from processing of food crops such as cereal brans, oilseed cakes or molasses. One task in LANDFLOW is to estimate the land area used to produce the feed required for a country’s domestic livestock herd. Feed items may either be produced domestically or may be imported. Using the available data, we distinguish three types of feed sources: a) herbaceous forage from permanent pastures; b) dedicated fodder crops, and c) primary crops and crop by-products. These feed sources are obtained from two types of land use, namely permanent pastures and cropland. Ruminants such as cattle, sheep and goats utilize pastures as wells as feed crops grown on cropland. Feed sources for ‘other livestock’, primarily pigs and poultry (monogastrics), originate solely from cropland. The allocation of fodder crops and primary crops and associated land areas to the two groups of animals is estimated according to the energy requirements of the livestock herd as compared to energy supply provided by the different feed sources.
→ Calculations for the allocation of feed sources to livestock
The calculation below explains how feed resources are linked to feed needs for livestock. First it is necessary to calculate energy requirements separately for the two livestock groups of ‘ruminants’ and ‘other livestock’. Reported livestock species (in animal heads) are converted to a common reference unit, the livestock unit45. For instance, a dairy cow in OECD countries counts as one livestock unit, a sheep as 0.15 livestock units and a horse as 0.9 livestock units. Conversion factors were compiled by broad geographical regions. As defined in this way, each livestock unit requires 8700 Mcal of feed energy per year. With these assumptions and conversions, annual livestock energy requirements for the two livestock groups can be calculated. Energy required for the livestock herd is then compared with energy supply from various feed sources recorded in the SUA. Feed in livestock production systems include many categories and vary greatly between countries. In many regions there is a tendency towards decreasing reliance on grazing and increasing importance of feedstuffs produced from cropland. Integrating different FAOSTAT databases allows tracing of five types of feed sources: (i) permanent pastures; (ii) fodder crops grown especially for animal feed; (iii) primary crops grown for both food 45 The reference Livestock Unit (LU) is used to compare or aggregate numbers of animals of different species or categories. Conversion factors are defined in terms of the food energy requirements of the animals relative to the energy requirement of 8700 Mcal per year for the reference LU.

Annex C1: Overview of data sources and methods for the attribution of embodied land and deforestation to agricultural commodities
18
and feed purposes; (iv) crops residues and by-products from food processing; and (v) feeds derived from livestock products, such as milk, milk powder, meat meal, and meat offals.
FODDER CROPS
Production and harvested areas of fodder crops are reported in the FAOSTAT Primary Production domain. Due to dietary requirements, some fodder crops can only be fed to ruminants, while others are fed to both ruminants and the ‘other livestock’ group. It is assumed that all fodder crops reported by FAO are grown on cropland. Published conversion factors of dry matter percentage and energy content of dry matter (Table E-2) are used to estimate feed energy provision from fodder crops.
Table E-2 Fodder crops and their conversion factors
Fodder crops reported in FAOSTAT Primary Production
Dry matter (DM) [%] Energy content in DM
[Mcal/kg]
Fodder crops suitable for ruminants only
Rye Grass, Forage and Silage 32 2.56
Grasses nes, Forage and Silage 26 2.65
Clover for Forage and Silage 23 2.82
Alfalfa for Forage and Silage 26 2.69
Leguminous fodder crops nes, Forage and Silage 23 2.82
Mixed Grasses and Legumes 24 2.80
Fodder crops suitable for ruminants and other livestock
Maize for Forage and Silage 26 2.87
Sorghum for Forage and Silage 30 2.65
Green Oilseeds for Fodder 21 2.70
Cabbage for Fodder 12 3.31
Turnips for Fodder 9 3.75
Beets for Fodder 13 3.54
Carrots for Fodder 12 3.66
Swedes for Fodder 11 3.75
Forage Products nes 25 2.55
Vegetables and Roots for Fodder 11 3.50
FEED ENERGY SUPPLY
The supply utilization accounts (SUA) trace the utilization of various animal feeds. Commodities used for feed include:
• cereals (e.g., wheat, barley, maize, rye) • other primary crops (e.g. sugar crops) • by-products from milling (e.g. cereal brans) • co-products from oil extraction (e.g. soybean cake) • vegetables and fruits • selected livestock products (e.g. eggs, whey) • fish products (e.g. fish meal)

Annex C1: Overview of data sources and methods for the attribution of embodied land and deforestation to agricultural commodities
19
SUA items are generally reported in metric tons. Like with fodder crops, conversion factors are used to calculate dry matter and energy content of the feed sources. SUA commodities used for feed are given in the Table underneath.
SUA feed commodities
Cereals
Wheat
Vegetable Oils
Soybean Oil Barley Coconut Oil Maize Cottonseed Oil
Rye Groundnut Oil Oats Oilcrops Oil, Other
Millet Olive Oil Rye Palm kernel Oil
Sorghum Rape And Mustard Oil Rice (Paddy Equivalent) Sesame seed Oil
Cereals, Other Sunflower seed Oil
Starchy roots
Cassava
Oil cakes
Copra Cake Potatoes Cottonseed Cake
Sweet Potatoes Groundnut Cake Roots, Other Oilseed Cakes, Other
Yams Palm kernel Cake
Sugar crops
Sugar beets Rape And Mustard Cake Sugar cane Sesame seed Cake
Sugar (Raw Equivalent) Soybean Cake Sugar, Non-Centrifugal Sunflower seed Cake
Molasses Brans
Pulses Beans
Vegetables Onions
Peas Tomatoes Pulses, Other Vegetables, Other
Oilcrops
Soybeans
Fruits
Apples Sunflower seed Bananas
Coconuts Oranges, Mandarins Cottonseed Dates
Groundnuts (Shelled Eq) Plantains Rape And Mustard seed Grapes
Sesame seed Fruits, Other Palm kernels
Oilcrops, Other
Permanent pastures
Globally some 3.4 billion hectares are permanent pasture, more than twice as much as the 1.5 billion hectares arable land and land under permanent crops. FAO records for each country and year the area under permanent pastures. This estimate covers a very wide range of land productivity, from marginal pastures in the Sahel or Central Asia to highly productive grasslands such as in Europe, New Zealand or parts of South America. The extent of pasture land required to

Annex C1: Overview of data sources and methods for the attribution of embodied land and deforestation to agricultural commodities
20
feed ruminants depends on pasture productivity. For comparison of pasture resources across countries we use an indicator of ‘reference pasture area’. It is calculated by comparing potential grassland productivity data to a reference yield of five tons dry matter per hectare per year. Pasture yields for individual countries were compiled using estimates from the Agro-Ecological Zones database GAEZ v3.0 (Fischer et al., 2011). Estimated yields were compared to published data and adjusted accordingly if necessary. Average national pasture yields for over 200 countries were assembled ranging from less than one ton to more than 10 tons dry matter per hectare. We use a DM content factor of 90% and a digestible energy content of 2.4 Mcal per kg of dry matter. In summary, on one hand the feed requirements are known in energy terms separately for ruminants and other livestock, and on the other hand feed sources are known in energy terms. This forms the basis for attributing cropland use and pastures to the two animal groups. Feed sources are allocated to livestock categories in proportion to energy requirements of the respective livestock herds and according to suitability of feed sources for use in animal diets, i.e. while respecting dietary characteristics of animal types and the total amounts of recorded feed types, the feed energy balance of each animal type are is satisfied as closely as possible.
LAND ASSOCIATED WITH THE TRADE AND CONSUMPTION OF CROP AND LIVESTOCK PRODUCTS
Over the past two decades trade volumes of agricultural commodities have increased substantially with annual increase rates between 2% and 4% depending on commodity. The agricultural sector today is characterized by substantial cross-country flows of primary and processed agricultural products. LANDFLOW tracks the extents of land associated with exported and imported primary and processed agricultural commodities in order to provide consistent accounts of land use from farm production, to international trade, and to final use. Exported agricultural products may come from domestic production or may derive from imported primary commodities. Processed agricultural commodities rely on primary crops from both, domestic production and imported primary crops. For example, in many EU27 countries domestic utilization of soybean is to a large extent based on imported commodities from North and South America. Or, EU27 countries export processed tropical fruit commodities, which they do not produce themselves. The estimation of trade flows and associated land areas requires information on bilateral trade flows, which was compiled in the form of trade matrices of individual SUA commodities based on a large time series data set of more than ten million recorded bilateral trade flows of agricultural commodities published in FAOSTAT. For this purpose countries were grouped into fourteen regional markets, as follows: North America; EU27 (two sub-regions of EU15 and new Member States); Other Europe; Central America and Caribbean; South America 1 (Argentina and Brazil); South America 2 (all other South American countries); Sub-Saharan Africa; North Africa, Middle East and Central Asia; South Asia; Southeast Asia 1 (Indonesia and Malaysia); Southeast Asia 2 (all other countries in Southeast Asia); East Asia; and Oceania (see Annex B). Starting from a trade matrix compiled from the physical commodity flows per country reported by the FAO, an iterative procedure was applied for each commodity and year for the period 1990 to 2008 to calculate balanced trade shares and to ensure the full mutual consistency of export and import flows, i.e., whatever a country in region i reports as export to region k must also show up as import from region i by a country of region k.

Annex C1: Overview of data sources and methods for the attribution of embodied land and deforestation to agricultural commodities
21
With these preparations, the methodology for estimation of land embodied in the utilization of agricultural commodities relies on the following assumptions:
• Land embodied in the national production of primary crops and livestock products equates to reported cropland and area of permanent pastures;
• Land used for a primary crop commodity is calculated as harvested area divided by the respective applicable multi-cropping index MCI;
• Land used for primary livestock products equals the area of permanent pastures plus the cropland embodied in feed and fodder crops. This involves both domestic and imported feed commodities;
• The sum of land embodied in the national supply (i.e., production plus imports) of a commodity equals the sum of land embodied in the utilization (exports, seed, waste, feed, processing, food, other utilization) of the product;
• Land embodied in different utilization items of a commodity is proportional to the respective consumed volumes. Sum of land embodied in individual consumption items equals total land in the supply (i.e. land in production plus land in import) of this commodity;
• Globally, the sum of land embodied in imports of a particular commodity equals the sum of land embodied in commodity exports.
These conditions can be written as:
Sk
Ik
Qk AAA =+ , k=1,..,M
Or
∈ ∈∈ ∈∈
=+kk mk Mj
Skh
Usesr
rjh
Mj Mm
Smh
hjmjh
Qjh
Mjjh aCaIaQ α , for all commodities h
Where
∈∈
=kk Mj
jhjhQjh
Mjjh MCIHaQ )/( , for all primary crop commodities h
And
Cultj
hjhjh AMCIH = )/( , for all countries j
with
QkA Total land in the production of primary commodities countries of market k IkA Total land in the imports of primary commodities into countries of market k SkA Total land embodied in the supply of commodities in countries of market k
jhQ Production of crop or livestock commodity h in country j
jhI Import of commodity h by country j Qjha Land intensity of production of primary commodity h in country j
Smha Land intensity in supply of commodity h in market m

Annex C1: Overview of data sources and methods for the attribution of embodied land and deforestation to agricultural commodities
22
hjmα Share of country j total imports of commodity h originating from market m rjhC Consumption of commodity h by utilization type r in country j
jhH Harvested area of crop h in country j
jhMCI Multi-cropping index applicable to crop h in country j CultjA Total cropland in country j
The conditions listed above form a system of simultaneous linear equations that is solved each year for all commodities and markets to obtain a vector of land intensities in supply by commodity and market. These intensities are then further applied to calculate the respective land embodied in each use category (e.g. food, feed, waste, etc.).
EMBODIED DEFORESTATION ASSOCIATED WITH THE CONSUMPTION OF CROP AND LIVESTOCK PRODUCTS
The main objective of the analysis with LANDFLOW in this project was to track the extents of past deforestation, which have been associated with the apparent utilization or final consumption of primary and processed agricultural commodities during the reporting periods of 1990-2000 and 2000-2008. The calculations for tracking deforestation from production to final use are based on country data at detailed SUA commodity level and follow the logic outlined above for physical land resources associated with agricultural production and utilization, using instead of total cultivated and pasture land the extents of embodied deforestation attributed to the crop and livestock sectors, and consequently to individual cropping sectors in the countries where deforestation occurred. Instead of land-use data, deforestation attributed to sectors and commodities from CHAPTER 3 are used as an input for these calculations. The methodology for estimating the deforestation embodied in the utilization or final consumption of agricultural commodities involves the following assumptions:
• The sum of deforestation areas involved in the national production of various primary crops and livestock products equates to the total extents of reported deforestation attributed to expansion and conversion of cropland and pastures (Annex D);
• Deforestation intensity (hectares deforestation per volume of production) associated with a primary crop commodity during a given reporting period is calculated as total cumulative production during that period divided by the total extent of deforestation attributed to the crop for that period;
• The sum of deforestation embodied in the national supply (i.e., production plus imports) of a commodity equals the sum of deforestation embodied in the utilization (exports, seed, waste, feed, processing, food, other utilization) of the product;
• Deforestation embodied in different utilization items of a commodity is proportional to the respective consumed volumes; and
• Globally, for the consistency of the accounts, the sum of deforestation embodied in total imports of a particular commodity equals the sum of deforestation embodied in total commodity exports.
In equation form this can be written similar to the relationships for land resources use discussed in the previous section:
∈ ∈∈ ∈∈
=+kk mk Mj
Skh
Usesr
rjh
Mj Mm
Smhjmjh
Qjh
Mjjh dCdIdQ α , for all commodities h

Annex C1: Overview of data sources and methods for the attribution of embodied land and deforestation to agricultural commodities
23
Where
Tjh
Tt
Qjh
tjh dFAdQ =
∈
, for deforestation period T, all countries j and primary crop commodities h
With
tjhQ Production of primary commodity h in country j and year t of period T
jhI Import of commodity h by country j Qjhd Deforestation intensity of production of primary commodity h in country j Smhd Deforestation intensity in supply of commodity h in market m hjmα Share of country j total imports of commodity h originating from market m rjhC Consumption of commodity h by utilization type r in country j
TjhdFA Extent of deforestation in country j and period T attributed to production of crop h
The resulting system of simultaneous linear equations is solved for all commodities and markets to provide a vector of deforestation intensities in supply, which is consistent across markets and commodities. These deforestation intensities are then further applied to calculate deforestation embodied in the reported use category (e.g. food, feed, waste, etc.) of each country. For ruminant livestock products, deforestation intensities are calculated also in relation to deforestation attributed to conversion of forests into pastures. Thus, total deforestation embodied in the consumption and trade of these livestock products combines the embodied deforestation due to feed and fodder crops used in raising livestock as well as the deforestation associated with expansion of permanent pastures used for grazing or feeding ruminant livestock.
AGGREGATION OF PHYSICAL PRODUCTION VOLUMES
Besides land area required for agricultural production and trade we also record physical volumes of produced and traded commodities. In order to aggregate physical volumes (tons) of the rather long and diverse commodity list of FAOSTAT, a set of international price weights of the year 2000 were applied, the so-called Geary-Khamis prices compiled by FAO. Original units of physical production volumes (tons in the case of crops) were multiplied with Geary-Khamis prices and converted into a new unit, representing the physical production volumes in Geary-Khamis dollar equivalent (henceforth referred to as ‘Geary-Khamis production volumes’). In this way, physical production volumes of otherwise very different commodities, such as for example potatoes and cotton lint, become comparable and can be readily aggregated. Moreover a comparison of results between countries, which may produce and consume quite different commodity mixes, becomes more meaningful.

Annex C2: Overview of data sources and methods for the attribution of embodied land and deforestation to forest products
24
ANNEX C2: OVERVIEW OF DATA SOURCES AND METHODS FOR THE ATTRIBUTION OF EMBODIED LAND AND DEFORESTATION TO FOREST PRODUCTS
DATA SOURCES
FAOSTAT
Time series production and trade data were compiled from the FAOSTAT online database of the forestry sector. It covers all countries of the world and includes both the raw timber materials as well as various wood-based products, including paper and paperboard. Generally, for each item time series of the domestic production in physical units (as cubic meters solid volume (CUM) or in metric tons, depending on product) are recorded in the FAOSTAT forest data domain and trade data, namely imports and export quantities in physical units (in CUM or metric tons) and in value (in $) are reported. In addition, a large amount of bilateral trade records for selected commodities, all together more than 450,000 records, are available for the period 1997 to 2008 reporting physical quantities and trade in value terms. Below, a list of commodities, which are relevant for the separation of roundwood production and trade into three sub-sectors, and sketches their interrelations.
Figure (Annexes) 3 Commodity structure of FAOSTAT forest products database
Figure (Annexes) 3 lists the definition of each of the main commodities used in this study for calculating consistent national wood balances (in CUM roundwood equivalent).
ROUNDWOOD
Wood FUEL
SAWNWOOD
Charcoal
IndustrialROUNDWOOD
PANELSWoodPULP
WoodResidues
Chips &Particles
PAPER &Paperboard
RecoveredPaper

Annex C2: Overview of data sources and methods for the attribution of embodied land and deforestation to forest products
25
Roundwood
Roundwood refers to all wood in its natural state obtained from forest removals. At the highest level, it comprises industrial roundwood and wood fuel46, with charcoal being a subcategory of wood fuel. Industrial roundwood is the raw material to produce sawn wood, wood-based panels and wood pulp, with the latter being the base material for paper production47.
Wood fuel
Wood fuel is mainly used by households in traditional stoves. Recently wood is increasingly being used as feedstock (usually in the form of wood pellets) for modern bioenergy facilities of the stationary sector for heat and electricity production. However, compared to traditional wood fuel usage these modern bio-energy technologies are still relatively marginal. Wood pellets are subsumed in the category Industrial Roundwood. Currently the novel forest product ‘wood pellets’ is not separately recorded. According to personal information from Statistics Canada, the Canadian Biomass Association and the Wood Pellet Association Canada48 reporting of the category wood pellets is inconsistent. Wood pellets may be recorded as chips and particles, sawdust or in other categories. Since January 2009 EUROSTAT reports wood pellets.
Chips and particles and wood residues
Production of ‘Chips and Particles’ and ‘Wood residues’ are reported separately (as of 1998) in roundwood equivalent and are recorded as a part of the domestic industrial roundwood production. In contrast, in the trade data these two commodities are reported separately for the entire study period in addition to the import and export of industrial roundwood (the latter denoting wood ‘in the rough’ only). ‘Wood residues’ and ‘Chips and Particles’ are usually produced as waste material from logging, from sawn wood production, or from the production of wood panels. They are used for diverse purposes including pulping as well as particle board and fibreboard production.
Table (Annexes) 1 Definition of items reported in the FAOSTAT forest products database and used for the calculation of national wood balances and land appropriation of the forest sector. (Commodity numbers in brackets are those used in the FAOSTAT database)
Roundwood (1861)
Wood in its natural state as removed from forests and from trees outside forests; wood in the rough. - Wood in its natural state as felled, with or without bark. It may be round, split, roughly squared or in other forms.
Industrial roundwood
(1865)
Roundwood that is used for industrial purposes, either in its round form (e.g. as transmission poles or piling) or as raw material to be processed into industrial products such as sawn wood, panel products or pulp. - The commodities included in this category are saw logs or veneer logs, pulpwood and other industrial roundwood. In the case of trade, chips and particles and wood residues are also included.
Wood fuel (1864)
Wood that will be used "in the rough" as fuel for purposes such as cooking, heating or power generation; and wood that will be used for charcoal production.
46 Wood fuel and fuelwood are different terminologies for the same product. FAOSTAT classification uses wood fuel. 47 In FAOSTAT, the base material of paper production is termed Fibre Furnish, which includes Wood Pulp, Other Fibre Pulp and Recycled Paper. 48 Canada is the largest producer of wood pellets and exports significant quantities to Europe.

Annex C2: Overview of data sources and methods for the attribution of embodied land and deforestation to forest products
26
Charcoal (1630)
Wood carbonized by partial combustion or application of heat from an external source. It is used as a fuel or for other uses.
Sawn wood
(1872) Wood (including sleepers) sawn lengthwise or produced by a profile-chipping process, and planed wood. – Sawn products produced from logs.
Wood-based panels (1873)
An aggregate term including the following commodities: veneer sheets, plywood, particle board and fibreboard. Particle board includes varieties such as oriented strand board (OSB) and flake board. Fibreboard includes hardboard, medium-density fibreboard (MDF) and insulation fibreboard.
Wood pulp (1875)
Wood pulp is the most common material used to make paper. It generally comes from softwood trees such as spruce, pine, fir, larch and hemlock, but also some hardwoods such as eucalyptus and birch. Wood pulp comprises all wood based pulp, including mechanical, semi-chemical, chemical and dissolving wood pulp.
Wood residues49
(1620) Miscellaneous wood residues. Wood residues which have not been reduced to small pieces. They consist principally of industrial residues, e.g. sawmill rejects, slabs, edgings and trimmings, veneer log cores, veneer rejects, sawdust, bark (excluding briquettes), residues from carpentry and joinery production, etc.
Chips and Particles (1619)
Wood chips and particles. Wood that has been deliberately reduced to small pieces from wood in the rough or from industrial residues, suitable for pulping, for particle board and fibreboard production, for fuelwood or for other purposes.
Paper and
paperboard (1876)
The following commodities are included in this aggregate: newsprint, printing and writing paper, other paper and paperboard. (It excludes manufactured paper products such as boxes, cartons, books and magazines.)
Recovered paper (1669)
Used paper and paperboard or residues from paper conversion that are collected for reuse as a raw material for the manufacture of paper, paperboard or other products.
Source: FAOSTAT
Limitations of the wood products database – apparent consumption
It is clear from the above table that highly manufactured products based on wood such as furniture or mouldings are not tracked anymore within this system and as such this system is subject to similar limitations as explained for the SUAs in preceding section.
Temperate and Boreal Forest Resource Assessment
A second major data source used in this study is the TBFRA report on “Forest Resources of Europe, CIS, North America, Australia, Japan and New Zealand (industrialized temperate/boreal countries” (UN-ECE/FAO, 2000) and related databases. It includes estimates of forest productivity and of forest lands available for wood supply. Unlike FAOSTAT statistical data, TBFRA data are not available for all countries of the world, mainly OECD countries and selected transition countries and developing countries. The following TBFRA items are most relevant for the present study:
• Forest land: Forest is defined as “land with tree crown cover of more than 10 percent and area more than 0.5 ha.” Trees on the site are considered to be higher than 5 m.
49 Until 1998, ‘Chips and Particles’ and ‘Wood residues’ are only reported in the trade data. While this provides less detail for earlier years, it does not affect the reported industrial roundwood production, nor the calculation of wood balances in LANDFLOW, which only requires trade information of these products.

Annex C2: Overview of data sources and methods for the attribution of embodied land and deforestation to forest products
27
• Forest available for wood supply (FAWS): This is “forest where any legal, economic, or specific environmental restrictions do not have a significant impact on the supply of wood.” This category also comprises areas where harvesting is not taking place, although there are no such restrictions.
• Forest not available for wood supply: This refers to “forest where legal, economic or specific environmental restrictions prevent any significant supply of wood.”
TBFRA information on the productivity of forests includes:
• Net annual increment, defined as the average annual volume over the given reference period of gross increment less that of natural losses on all trees.
• Annual fellings, referring to the volume of all trees “that are felled during the given reference period, including the volume of trees or parts of trees that are not removed” (ibid, p.33).
• Annual removals, representing the “average annual volume of those fellings that are removed” (ibid, p. 33) from the felling sites. Annual removals thus also comprise the removals of trees felled at an earlier period than the reference period as well as natural losses.
FOREST PRODUCTIVITY
Whereas roundwood production and trade of forest products are being reported in physical units (in CUM) in FAOSTAT, data of the actual forestry area used to produce this output are not provided. How much area is behind the production of roundwood depends on forest productivity and management, i.e. the equivalent of yields in the case of crops. Net annual forest biomass increment per hectare is dependent on climatic and biophysical growing conditions, tree species, but also on management policies and objectives, in particular on the intensity of management. Inventory information on increment is generally measured only for forests under regular management and has in consequence been obtained mainly for the developed countries. TBFRA reports increments as well as total annual felling and total annual removals. FAOSTAT roundwood production data refer to annual removals. The productivity rates are assumed to represent sustainable harvesting, where in the long run annual removal is counter-balanced by increments. Forest productivity data are essential to calculate the land area required for the production of roundwood reported in FAOSTAT statistics. Forest yields applied in this study were derived from TBFRA for the countries included in the report. For all remaining countries a national average forest yield was estimated based on net primary productivity calculated from the spatial GAEZ grid data (Fischer et al., 2011). Harvestable forest yields applied in this study range between around 1 CUM per hectare annual increment in the boreal or drier tropical regions up to more than 6 CUM per hectare in well managed tropical and (central) European countries. Note, although there is some uncertainty about harvestable forest yields, this does not affect the amount of deforestation attributed to the industrial forest sector (see CHAPTER 3 and also discussion of results in this chapter).

Annex C2: Overview of data sources and methods for the attribution of embodied land and deforestation to forest products
28
LAND AND DEFORESTATION ASSOCIATED WITH ROUNDWOOD PRODUCTION AND DERIVED PRODUCTS
Embodied forest land use
In general, forest yields of the individual countries are applied to the reported roundwood production available in FAOSTAT. In this way land area requirements can be estimated for domestic production, imports and exports for all forest commodities. For exported commodities, the forest productivity of the exporting country’s domestic roundwood production is used. In the case of imported roundwood or imported derived commodities, the forest productivity estimates depend on yields of the respective countries of origin. As for crops, trade matrices of bilateral trade flows (in physical terms) and forest productivity estimates were used to determine the land content of each country’s wood (‘in the rough’) and wood product imports. Starting from a trade matrix compiled from the physical bilateral commodity flows per country reported by the FAO, an iterative procedure was applied for each commodity and year for the period 1990 to 2008 to calculate balanced trade shares and to ensure the full mutual consistency of export and import flows, i.e., whatever a country in region i reports as export to region k must also show up as import from region i by a country of region k. As bilateral trade is reported in FAOSTAT only since 1997, the average trade shares calculated for 1997-2000 were used as the initial values of the iterative procedure to calculate mutually balanced trade shares consistent with aggregate national exports and imports for the years 1990 to 1997. Wood and paper commodities reported in FAOSTAT are processed in the LANDFLOW model in terms of three main sub-sectors: (i) a primary roundwood sector; (ii) a sector of derived wood products including sawn wood and wood panels; and (iii) the pulp and paper sector. The LANDFLOW analysis first constructs a consistent wood balance for each country and year, taking into account domestic roundwood production, trade of primary roundwood, production and trade of the derived wood products, as well as of wood pulp and paper (including recycled paper). LANDFLOW then calculates the extent of forest land associated with roundwood production using each country’s respective estimate of forest land productivity. As for crops, the commodity balances and associated land balances form a system of linear equations that is solved each year for all commodities and markets to obtain a vector of land intensities in a country’s domestic supply by commodity and for each market. These intensities are then further applied to calculate the respective land embodied in the production and utilization of each sub-sector (e.g. sawn wood, panels, pulp and paper, etc.).
Embodied deforestation
The calculations for tracking aggregate deforestation extents attributed to the industrial roundwood and/or wood fuel sectors (see CHAPTER 3), from production to the final use of wood products, are based on country data of the main forest, wood and paper commodities listed above. Computations follow the logic outlined above for total land associated with forest production and utilization, using instead of estimated total land extents required for each country’s roundwood production the area of deforestation attributed to each forest sector.
Annex C2: Overview of data sources and methods for the attribution of embodied land and deforestation to forest products
29
Calculations start from the country of origin for each wood commodity, estimate the deforestation content/intensity in a country’s national roundwood supply, separately for the industrial roundwood and wood fuel sectors50, and track the physical land content and flows associated with processing and trade of forest products and their utilization. Solving this system of interlinked flows gives a complete account of land content and extent of deforestation embodied in the intermediate use and final utilization of wood-based products in each region. In the LANDFLOW processing of national deforestation extents, we follow the advice of the project’s Expert Workshop (held in Brussels on 20 October, 2011), which recommended to label any residual extents of deforestation remaining after the attribution to either agriculture, built-up conversion, or natural causes such as fires, as ‘unexplained deforestation’ rather than attributing it to the forest sector on the basis of highly uncertain factors, which are sometimes noted but in general not quantifiable with available data, such as unsustainable wood extraction or illegal logging.
Recycled paper
A special case is recycled paper, included as part of the fibre furnish used for paper production. In order to avoid double counting in wood and land balances, recycled paper in LANDFLOW is treated as not being embodied with land use/deforestation. In other words, the embodied land use/deforestation in roundwood required for paper production is attributed to the first cycle of paper production and use only.
50 According to the expert panel attached to this study the calculations presented here assume no deforestation to be attributed to wood fuel (see CHAPTER 3 for attribution of deforestation to main sectors).

Annex D: Crop Commodities included in Supply Utilization Accounts (SUAs)
30
ANNEX D: CROP COMMODITIES INCLUDED IN SUPPLY UTILIZATION ACCOUNTS (SUAS)
SUA item SUA item 1 Cereals Wheat A 5 Vegetables, Fruit, Nuts P
Barley A Nuts, Spices Tomatoes A Maize A Onions Dry A Rice A Vegetables, Other P Rye A Oranges, Mandarins P Oats A Lemons, Limes P Millet A Grapefruit P Sorghum A Citrus, Other P Cereals, Other A Bananas P Brans D Plantains P Beer D Apples P Maize Germ Oil D Pineapples P Rice Bran Oil D Dates P Infant Food D Grapes P
2 Roots and Potatoes A Fruits, Other PPulses Cassava P Pepper P
Sweet Potatoes A Pimento P Roots, Other A Cloves P Yams A/P Spices, Other A/P Beans, Dry A Wine D Peas, Dry A Beverages Fermented D Pulses, Other A Beverages, Alcoholic D
3 Sugar crops Sugar Cane P 6 Stimulants Coffee Green P Sugar Beets A Cocoa Beans P Sugar, Non-Centrifugal D Tea P Sugar (Raw Equivalent) D 7 Fibres, Tobacco, and Cotton Lint A Sugar Crops, nes A/P Rubber Jute A Sweeteners, Other D Jute-Like Fibres A Molasses D Soft Fibres, Other A/P
4 Oilcrops Soybeans A Sisal P Groundnuts A Abaca, Manila Hemp P Sunflower seed A Hard Fibres, Other A/P Rape and Mustard seed A Tobacco Leaves A Cottonseed A Natural Rubber P Coconuts P 8 Fodder crops Fodder crops A/P Sesame seed A Palm kernels P Olives P Oilcrops, Other A/P Soybean Oil D Groundnut Oil D Sunflower seed Oil D
Rape and Mustard seed Oil D Cottonseed Oil D Palm kernel Oil D Palm Oil D Coconut Oil D Sesame seed Oil D Olive Oil D Oilcrops Oil, Other D Soybean Cake D Groundnut Cake D Sunflower seed Cake D Rape and Mustard Cake D Cottonseed Cake D Palm kernel Cake D Copra Cake D Sesame seed Cake D Oilseed Cakes, Other D
SUA items were grouped in annual (A), perennial (P) crops and derived products (D)

Annex E: Livestock products included in FAOSTAT trade data base
31
ANNEX E: LIVESTOCK PRODUCTS INCLUDED IN FAOSTAT TRADE DATA BASE
Livestock products from RUMINANTS Beef and Veal; Offals of Cattle, Edible; Fat of Cattle; Beef and Veal, Boneless; Cattle Butcher Fat; Beef Dried Salt Smoked; Meat Extracts; Sausages Beef and Veal; Beef Preparations; Homogenized Meat Prep.; Liver Preparations; Cow Milk, Whole, Fresh; Cream, Fresh; Butter of Cow Milk; Ghee (From Cow Milk); Skim Milk of Cows; Whole Milk, Condensed; Whey, Condensed; Yoghurt; Buttermilk, Acid.Milk; Whole Milk, Evaporated; Skim Milk, Evaporated; Skim Milk, Condensed; Dry Whole Cow Milk; Dry Skim Cow Milk; Dry Buttermilk; Dry Whey; Cheese (Whole Cow Milk); Whey, Fresh; Cheese (Skim Cow Milk); Whey Cheese; Processed Cheese; Reconstituted Milk; Ice Cream and Edible Ice; Cattle Hides, Fresh; Hides Wet-Salted Cattle; Hides Dry-Salted Cattle; Hides nes Cattle; Skins Wet-Salt Calves; Skins Dry-Salt Calves; Skins nes Calves; Buffalo Meat; Ghee (From Buffalo Milk); Buffalo Hides, Fresh; Hides Wet-Salted Buffalo; Hides Dry-Salted Buffalo; Mutton and Lamb; Offals of Sheep, Edible; Fat of Sheep; Sheep Milk; Butter and Ghee (Sheep Milk); Cheese of Sheep Milk; Wool, Greasy; Wool, Scoured; Grease incl. Lanolin Wool; Sheepskins, Fresh; Skin Wet-Salted Sheep; Skin Dry-Salted Sheep; Skin nes Sheep; Skin With Wool Sheep; Karakul Skins; Wool Shoddy; Hair Carded or Combed; Wool and Hair Waste; Goat Meat; Offals of Goats, Edible; Cheese of Goat Milk; Goatskins, Fresh; Skins Wet-Salted Goats; Skins Dry-Salted Goats; Skins nes Goats; Fine Goat Hair; Coarse Goat Hair; Horsemeat; Offals of Horse; Hair of Horses; Hides Wet-Salted Horses; Hides Dry-Salted Horses; Hides Unspecified Horses; Meat of Asses; Meat of Camels; Fat of Camels; Hides Wet-Salted Camels; Hides Unspecified Camels; Offals of Other Camelids; Game Meat; Meat, Dried, nes; Meat nes; Offals nes; Meat Meal; Hides and Skins nes, Fresh; Hide Wet-Salted; Hide Dry-Salted; Tallow. Livestock products from OTHER LIVESTOCK Pig meat; Offals of Pigs, Edible; Fat of Pigs; Pork; Bacon-Ham of Pigs; Pig Butcher Fat; Sausages Pig Meat; Meat Preparations Pigs; Lard; Skin Wet-Salted Pigs; Skin Dry-Salted Pigs; Skin nes Pigs; Chicken Meat; Offals Liver of Chickens; Fat Liver Prep(Foie Gras; Meat Canned Chicken; Hen Eggs; Eggs Liquid Hen; Eggs Dry Whole Yolks Hen; Fat of Poultry; Fat of Poultry Rendered; Duck Meat; Goose Meat; Offals Liver Geese; Offals Liver Ducks; Turkey Meat; Pigeons Other Birds; Meat of Pigeon Other Birds; Eggs, excluding Hen; Rabbit Meat; Rabbit Skins; Lard and Stearine Oil

Annex F: Additional background information for CHAPTER 4
32
ANNEX F: ADDITIONAL BACKGROUND INFORMATION FOR CHAPTER 4
ADDITIONAL BACKGROUND INFORMATION FORT RADE OF AGRICULTURAL COMMODITIES AND CROPLAND AND PASTURES EMBODIED IN SUPPLY AND UTILIZATION OF AGRICULTURAL COMMODITIES
LAND ASSOCIATED WITH PRODUCTION AND UTILIZATION OF AGRICULTURAL PRODUCTS
Global cropland51 in 2008 reported by the FAO amounts to approximately 1,526 million hectares (Mha) and is concentrated in the most productive areas i.e., areas with adequate climatic conditions, fertile soils, and large flat terrains. Based on data domains of agricultural production, trade, supply, and utilization, from the FAO Statistical database (FAOSTAT), we have estimated with LANDFLOW the extent of cropland that is associated with crop production for human direct ‘vegetarian’ consumption and the extents needed for the production of livestock feed that eventually is consumed as meat, eggs and dairy. In addition, land that is associated with traded agricultural products was also estimated and included in the accounts. summarizes for 2006-2008 the global use of cropland in the production of different groups of crop commodities.
Figure (Annexes) 4 Global use of cropland for major crop groups (2006–08)
In 2006-08, cereal crops – mainly wheat, rice and maize – being important both for food and feed consumption dominated the use of cropland. Cereals account for nearly half of all cropland use. Second among the aggregate crop groups shown are oil crops, which occupy 16 % of the global cropland. Fodder crops, grown exclusively to support livestock production, account for 12%, and the groups of root crops and pulses and of fruits and vegetables each occupy about 8% of global cropland. Sugar crops, stimulants (coffee, cocoa, tea) and non-food crops (mainly fibres and tobacco) each have a share of less than 3% and together account for less than 10%. 51 Cropland in this study includes permanent crops, accounting for about 10% of the total. Permanent crops include vineyards, orchards and plantations of e.g., oil palm, coconut, cacao, coffee and tea. FAOSTAT reports for 2008 some 1,376 Mha of land under annual crops and 150 Mha under permanent crops.
49%
8%2%
16%
8%
2%3%
12%
Cereals
Roots, Pulses
Sugar crops
Oil crops
Fruit, Vegetables
Stimulants
Non-food crops
Fodder crops
Source: LANDFLOW calculations based on FAOSTAT 2011
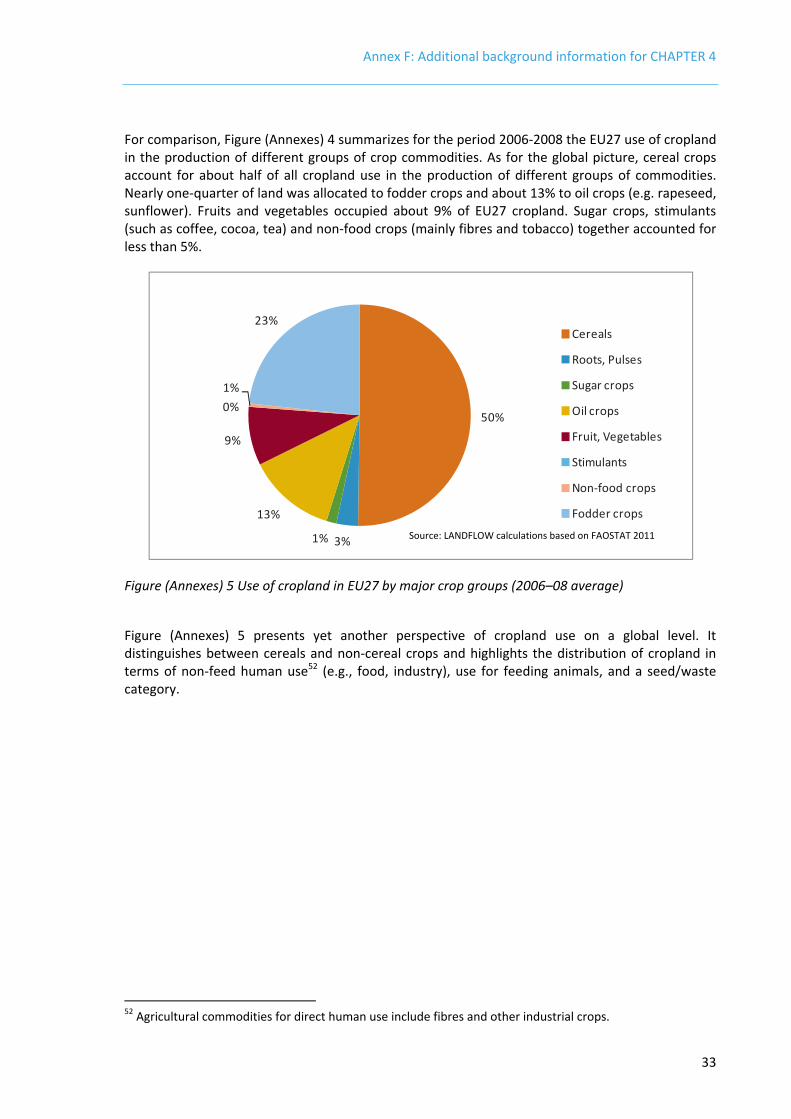
Annex F: Additional background information for CHAPTER 4
33
For comparison, Figure (Annexes) 4 summarizes for the period 2006-2008 the EU27 use of cropland in the production of different groups of crop commodities. As for the global picture, cereal crops account for about half of all cropland use in the production of different groups of commodities. Nearly one-quarter of land was allocated to fodder crops and about 13% to oil crops (e.g. rapeseed, sunflower). Fruits and vegetables occupied about 9% of EU27 cropland. Sugar crops, stimulants (such as coffee, cocoa, tea) and non-food crops (mainly fibres and tobacco) together accounted for less than 5%.
Figure (Annexes) 5 Use of cropland in EU27 by major crop groups (2006–08 average)
Figure (Annexes) 5 presents yet another perspective of cropland use on a global level. It distinguishes between cereals and non-cereal crops and highlights the distribution of cropland in terms of non-feed human use52 (e.g., food, industry), use for feeding animals, and a seed/waste category.
52 Agricultural commodities for direct human use include fibres and other industrial crops.
50%
3%1%
13%
9%
0%1%
23%Cereals
Roots, Pulses
Sugar crops
Oil crops
Fruit, Vegetables
Stimulants
Non-food crops
Fodder crops
Source: LANDFLOW calculations based on FAOSTAT 2011

Annex F: Additional background information for CHAPTER 4
34
Figure (Annexes) 6 Global use of cropland for animal feed, non-feed use and seed/waste (2006–08 average)
In 2006-2008, approximately 60% of global cropland was used to produce crops for direct human (food, food industry and to a lesser extent fuel) use, half of which were cereals and half were other crops. The latter comprise all non-cereals including root crops, sugar crops, oil crops, and fruits and vegetables. About one-third of global cropland was used for the production of animal feeds consisting of cereals (14%, mainly maize, wheat, barley, and sorghum), fodder crops (12%) and various other crops and the by-products of the processing of oil crops (7%). The remainder (about 7%) was associated with ‘seed and waste’53. Consumption patterns differ significantly between developed and developing countries. In developed countries (Figure (Annexes) 7 a) the products of approximately one-third of cropland are used for human consumption (in vegetable or processed form for food and various non-feed uses) and half for the production of livestock feed. The remaining cropland, about one-fifth, is associated with net exports from developed countries and with seed and waste.
53 Seed: Data include the amounts of the commodity set aside for nurseries and seed production. Waste: reflects commodity losses through wastage at all stages between farm gate and consumption (including handling, storage and transport) but does not include the waste incurred at household level.
31%
29%
14%
7%
12%
7%
Non-feed, Cereals
Non-feed, Other crops
Feed - Cereals
Feed - Other crops
Fodder crops
Seed/Waste
Source: LANDFLOW calculations based on FAOSTAT 2011

Annex F: Additional background information for CHAPTER 4
35
Figure (Annexes) 7 Regional utilization of cropland (2006–08); a) North America, EU27 and Oceania; b) South, Southeast and East Asia; c) Sub-Saharan Africa; d) Central and South America
In developing countries (Figure (Annexes) 7b-d), a much larger share of cropland is used for direct human consumption of crop products. For the broad aggregate region of South, Southeast and East Asia (Figure (Annexes) 7b), close to three-quarters of cropland was employed to produce food and less than 20% were used for producing livestock feed, and the region was a net importer of (virtual) land. In the region of Central and South America (Figure (Annexes) 7d), about half the cropland is utilized for direct crop consumption, one-quarter is feed use, and another quarter is associated with net exports of agricultural products and seed/waste. For Sub-Saharan Africa (Figure (Annexes) 7c) the picture is again different. Here more than three-quarters of cropland use go into direct consumption of crops, some 13% of cropland was assessed as going into livestock production, and a relatively high share of 11% is in seed/waste. Land associated with imports of Sub-Saharan countries exceeds land in Sub-Saharan exports, which results in a balance of net imports. There are also significant differences among regions in the extents of per capita cropland associated with crop and livestock product consumption (Figure (Annexes) 8). Note, the values shown refer to cropland only and do not include the large extents of pastures supporting ruminant livestock production especially in South America, Sub-Saharan Africa and Oceania.
32%
49%
6%
9%4%
a) North America, Europe, Oceania
Crops, Consumption
Livestock, Consumption
Seed/Waste
Crops, Net exports
Livestock, Net exports
75%
19%
6%
0% 0%
b) South, Southeast and East Asia
Crops, Consumption
Livestock, Consumption
Seed/Waste
Crops, Net exports
Livestock, Net exports
76%
13%
11%
0% 0%
c) Sub-Saharan Africa
Crops, Consumption
Livestock, Consumption
Seed/Waste
Crops, Net exports
Livestock, Net exports
48%
26%
8%
18%
0%
d) Central and South America
Crops, Consumption
Livestock, Consumption
Seed/Waste
Crops, Net exports
Livestock, Net exports
Source: LANDFLOW calculations based on FAOSTAT 2011Source: LANDFLOW calculations based on FAOSTAT 2011
Source: LANDFLOW calculations based on FAOSTAT 2011Source: LANDFLOW calculations based on FAOSTAT 2011

Annex F: Additional background information for CHAPTER 4
36
Figure (Annexes) 8 Regional per capita cropland use associated with the consumption of crop and livestock products (average for 2006–08)
Global average cropland use associated with livestock production was 770 m2 per capita in 2006-08. For final uses of crop products, excluding feed use, the respective value was 1,390 m2 per capita. An estimated 180 m2 per capita were in seed and waste. Regional values vary widely due to differences in both consumption patterns and land efficiency of production system. In the developed countries cropland use associated with livestock products exceeds land in direct utilization of crop products. Cropland per capita associated with livestock consumption was in the range of approximately 1,700-4,500 m2 per capita whereas crop products for non-feed uses (mainly food) required about 1,400-2,400 m2 per capita. Due to high yields in the EU27, land intensity in consumption is at the lower end of these ranges, respectively 1,600 m2 per capita (livestock products) and 1,450 m2 per capita (crop products). For comparison, in South Asia, Southeast Asia, and East Asia, per capita use of cropland for livestock products was in the range of 100-400 m2 per capita, for crop products in the range of 850-1,300 m2 per capita. The figures for Sub-Saharan Africa reflect the relatively low land productivity achieved in the agricultural system. Hence, despite widespread under-nutrition, the extents of cropland associated with utilization of respectively livestock and crop products for 2006-08 were 340 m2 per capita (livestock products) and 2,180 m2 per capita (crop products). In developing countries the extent of cropland used for livestock feed has recently increased significantly owing to dietary shifts towards livestock products, notably in China. Figure (Annexes) 9 provides a regional overview of cropland associated with net supply and use of agricultural products in 1992, as an example for the beginning of the assessment period. Areas associated with supply (the left bar for each region in Figure (Annexes) 9) comprise cropland used by a region’s agricultural sector for crop and livestock feed production (‘Production’), the ‘foreign’ land associated with imported crops and crop products (‘Net Import’), and areas associated with stock changes (‘from Stock’). Cropland associated with domestic utilization (the right bar of each region in Figure (Annexes) 9) includes five elements: (i) ‘Consumption, Crops’ denoting cropland
0
500
1000
1500
2000
2500
3000
3500
4000
4500
5000
NAM EU27 EURR CAM SAM NAWA SAFR SASIA SEASIA EASIA OCE
m² /
cap
ita
Cropland for livestock (feed) Cropland for non-feed usesSource: LANDFLOW calculations based on FAOSTAT 2011

Annex F: Additional background information for CHAPTER 4
37
associated with a region’s direct human use (food and other utilizations) of crop production (both domestic and imported); (ii) ‘Consumption, Livestock’, which refers to the cropland used for livestock feed (domestic and imported); (iii) ‘Seed + Waste’, which denotes cropland associated with seed use and waste (up to the marketing stage); (iv) cropland associated with net exports of crops and livestock (‘Net Exports’); and (v) cropland associated with stock increases of crop and livestock products (‘to Stocks’).
Figure (Annexes) 9 Cropland in regional net supply and utilization of crop and livestock products (1992)
For example, in 1992 the countries of the EU27 used approximately 166 Mha of cropland through the utilization of crop commodities of which 30 Mha were through imported crop commodities. Of these 166 Mha about 73 Mha were for crop products which were directly used by humans (mainly as food and for processing) and another 84 Mha were used for livestock feed. Contrary to North America, Oceania, South America and Southeast Asia, the EU27 was a net importer of cropland in 1992. For comparison, Figure (Annexes) 10 presents the same type of information for 2008. The figures indicate that there are three key regions with significant amounts of (virtual) land exported in crop commodities, namely North America, South America and Oceania, respectively exporting 68 Mha, 46 Mha and 33 Mha. The main ‘land’ importing regions were East Asia, North Africa and the Middle East, and the EU27 with net land ‘imports’ of respectively 66 Mha, 42 Mha and 33 Mha. The figures clearly show the relative importance of livestock products in each region as compared to other utilizations of crop products.
0
50
100
150
200
250
NAM EU27 EURR CAM SAM NAWA SAFR SASIA SEASIA EASIA OCE
mill
ion
hect
ares
1992
Production from Stock Net Import
Consumption Crops Consumption Livestock Seed+Waste
to Stock Net Export
Source: LANDFLOW calculations based on FAOSTAT 2011

Annex F: Additional background information for CHAPTER 4
38
Comparing the two diagrams for 1992 and 2008 gives a quite stable picture for developed countries in North America, Western Europe and Oceania. It shows a significant change in land embodied in both production and use of agricultural products in the ‘Other Europe’ region (‘EEUR’ mainly comprising the countries of former Yugoslavia, non-EU Eastern European countries and Russian Federation; see Annex K). For the regions of Central America, South America, Sub-Saharan Africa and Southeast Asia the results clearly indicate the increased use/intensity of cropland in supply and utilization.
Figure (Annexes) 10 Cropland in regional net supply and utilization of crop and livestock products (2008)
ADDITIONAL BACKGROUND INFORMATION FOR TRADE OF WOOD PRODUCTS AND FOREST LAND EMBODIED IN SUPPLY AND UTILIZATION OF WOOD PRODUCTS
WOOD VOLUMES AND EXTENTS OF LAND ASSOCIATED WITH PRODUCTION AND UTILIZATION OF FOREST PRODUCTS
Based on data domains of forest production, national level trade, and bilateral forest product trade data from the FAO Statistical database (FAOSTAT), we have estimated with LANDFLOW the roundwood volumes (in CUM equivalent) and extents of forest land that are associated with the production and utilization of wood products.
Figure (Annexes) 11 summarizes for the period 1994-1996 (annual average) the regional production of roundwood and shows the domestic utilization of wood products by broad sector: (i) wood fuel, (ii) sawn wood, wood-based panels and boards, and (iii) pulp and paper. The figure also indicates the net import or net export of primary roundwood and derived products. These wood balances are shown in physical units (as CUM equivalents). For comparison,
0
50
100
150
200
250
NAM EU27 EURR CAM SAM NAWA SAFR SASIA SEASIA EASIA OCE
mill
ion
hect
ares
2008
Production from Stock Net ImportConsuption Crops Consumption Livestock Seed+Wasteto Stock Net Export
Source: LANDFLOW calculations based on FAOSTAT 2011
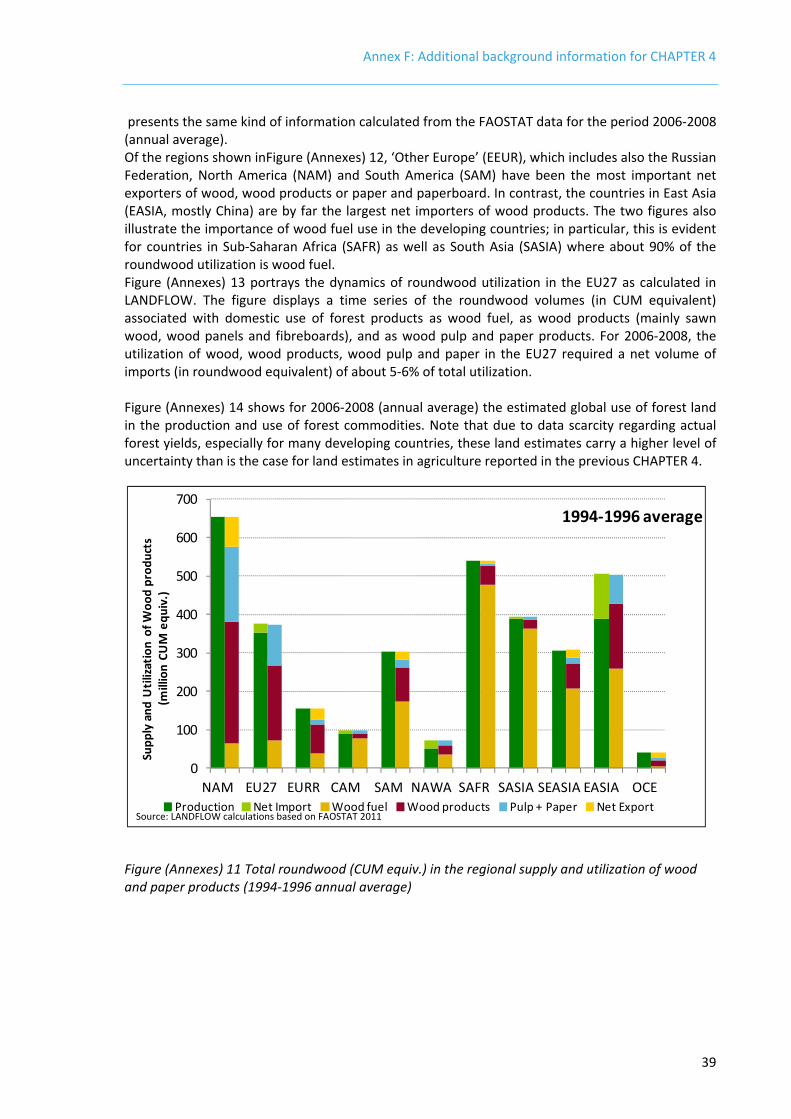
Annex F: Additional background information for CHAPTER 4
39
presents the same kind of information calculated from the FAOSTAT data for the period 2006-2008 (annual average). Of the regions shown inFigure (Annexes) 12, ‘Other Europe’ (EEUR), which includes also the Russian Federation, North America (NAM) and South America (SAM) have been the most important net exporters of wood, wood products or paper and paperboard. In contrast, the countries in East Asia (EASIA, mostly China) are by far the largest net importers of wood products. The two figures also illustrate the importance of wood fuel use in the developing countries; in particular, this is evident for countries in Sub-Saharan Africa (SAFR) as well as South Asia (SASIA) where about 90% of the roundwood utilization is wood fuel. Figure (Annexes) 13 portrays the dynamics of roundwood utilization in the EU27 as calculated in LANDFLOW. The figure displays a time series of the roundwood volumes (in CUM equivalent) associated with domestic use of forest products as wood fuel, as wood products (mainly sawn wood, wood panels and fibreboards), and as wood pulp and paper products. For 2006-2008, the utilization of wood, wood products, wood pulp and paper in the EU27 required a net volume of imports (in roundwood equivalent) of about 5-6% of total utilization. Figure (Annexes) 14 shows for 2006-2008 (annual average) the estimated global use of forest land in the production and use of forest commodities. Note that due to data scarcity regarding actual forest yields, especially for many developing countries, these land estimates carry a higher level of uncertainty than is the case for land estimates in agriculture reported in the previous CHAPTER 4.
Figure (Annexes) 11 Total roundwood (CUM equiv.) in the regional supply and utilization of wood and paper products (1994-1996 annual average)
0
100
200
300
400
500
600
700
NAM EU27 EURR CAM SAM NAWA SAFR SASIA SEASIA EASIA OCE
Supp
ly a
nd U
tiliza
tion
of W
ood
prod
ucts
(mill
ion
CUM
equ
iv.)
1994-1996 average
Production Net Import Wood fuel Wood products Pulp + Paper Net ExportSource: LANDFLOW calculations based on FAOSTAT 2011

Annex F: Additional background information for CHAPTER 4
40
Figure (Annexes) 12 Total roundwood (CUM equiv.) in the regional supply and utilization of wood and paper products (2006-2008 annual average)
Figure (Annexes) 13 Utilization of wood and paper products (CUM equiv.) in the EU27 (1992-2008)
0
100
200
300
400
500
600
700
NAM EURR SAM SAFR SEASIA OCE
Supp
ly a
nd U
tiliza
tion
of W
ood
prod
ucts
(mill
ion
CUM
equ
iv.)
2006-2008 average
Production Net Import Wood fuel Wood products Pulp + Paper Net Export
0
50
100
150
200
250
300
350
400
450
500
1992 1993 1994 1995 1996 1997 1998 1999 2000 2001 2002 2003 2004 2005 2006 2007 2008
Util
izatio
n of
Woo
d an
d W
oodp
rodu
cts
(mill
ion
CUM
equ
iv.)
Wood fuel Wood products Pulp + Paper
Source: LANDFLOW calculations based on FAOSTAT 2011
Source: LANDFLOW calculations based on FAOSTAT 2011

Annex F: Additional background information for CHAPTER 4
41
Figure (Annexes) 14 Forest land in regional supply and utilization of wood and paper products (2006-2008 annual average)
The LANDFLOW estimates suggest that about 1.4 billion hectares of forest land were involved in the global roundwood production of 2006-2008, with the production in the regions of North America and ‘Other Europe’ requiring the largest extents of forest land resources, in both regions estimated to exceed 250 Mha. The most important region with regard to net land imports associated with the trade and use of wood and wood-based products was by far East Asia (implying on average a ‘virtual’ net import of land in forest products of 73 Mha per year during 2006-2008), but also EU27 and North Africa, Central and Western Asia. For the EU27 forest land associated with utilization of wood and wood-based products is estimated at 160 Mha. Forest products are extensively traded. In 2006-2008 associated ‘virtual’ land trade were 178 Mha in imported products and 143 Mha in exported products resulting in a net import of 35 Mha.
0
50
100
150
200
250
300
NAM EURR SAM SAFR SEASIA OCE
Land
in fo
rest
pro
duct
s(m
illio
n he
ctar
es)
2006-2008 average
Production Net Import Utilization Net ExportSource: LANDFLOW calculations based on FAOSTAT 2011

Annex G: Breakdown of ‘other’ category in Figure 4-11
42
ANNEX G: BREAKDOWN OF ‘OTHER’ CATEGORY IN FIGURE 4-11
Deforestation embodied in EU27 imports of crop commodities Total: 7.4 Mha ==> see Figure 4-11 in CHAPTER 4 Other crop-country combinations not shown in Figure 4-11: 1.5 Mha 20,5%
% of total cummulative Paraguay - Maize 0,92% 80,44%Togo - CocoaBeans 0,89% 81,33%Myanmar - BeansDry 0,88% 82,21%Brazil - Maize 0,73% 82,94%Peru - CoffeeGreen 0,71% 83,65%Indonesia - PalmkernelCake 0,66% 84,31%Brazil - Sugar (RawEquivalent) 0,58% 84,89%Honduras - CoffeeGreen 0,48% 85,37%Benin - Nuts 0,47% 85,84%Sudan - GroundnutOil 0,45% 86,29%Indonesia - CoconutOil 0,43% 86,72%Mozambique - CottonLint 0,42% 87,14%Nicaragua - CoffeeGreen 0,40% 87,54%Sudan - Sesameseed 0,40% 87,94%Brazil - TobaccoLeaves 0,36% 88,30%Brazil - SoybeanOil 0,34% 88,64%Malaysia - PalmkernelCake 0,31% 88,95%Sudan - GroundnutCake 0,29% 89,24%Viet Nam - CoffeeGreen 0,29% 89,53%Thailand - NaturalRubber 0,28% 89,81%Indonesia - Nuts 0,28% 90,09%Nigeria - NaturalRubber 0,27% 90,36%Zimbabwe - CottonLint 0,23% 90,59%Viet Nam - Nuts 0,23% 90,82%Argentina - SunflowerseedCake 0,22% 91,04%Paraguay - SoyabeanCake 0,21% 91,25%Malaysia - PalmkernelOil 0,20% 91,45%Benin - CottonLint 0,20% 91,65%Laos - CoffeeGreen 0,19% 91,84%Kenya - CoffeeGreen 0,18% 92,02%Argentina - Groundnuts (ShelledEq) 0,18% 92,20%Ghana - Nuts 0,18% 92,38%Mali - CottonLint 0,17% 92,55%Benin - Cottonseed 0,16% 92,71%Cameroon - Bananas 0,16% 92,87%Liberia - NaturalRubber 0,16% 93,03%Bolivia - Soybeans 0,16% 93,19%Argentina - Maize 0,16% 93,35%

Annex G: Breakdown of ‘other’ category in Figure 4-11
43
Uganda - CoffeeGreen 0,15% 93,50%Kenya - Tea 0,15% 93,65%Brazil - Sorghum 0,15% 93,80%Viet Nam - NaturalRubber 0,14% 93,94%Chad - CottonLint 0,12% 94,06%Argentina - Sunflowerseed 0,11% 94,17%Malawi - TobaccoLeaves 0,11% 94,28%Brazil - Oranges,Mandarines 0,10% 94,38%Tanzania, United Rep of - CoffeeGreen 0,10% 94,48%Argentina - GroundnutOil 0,10% 94,58%Colombia - Bananas 0,09% 94,67%Burkina Faso - CottonLint 0,09% 94,76%Argentina - SoybeanOil 0,09% 94,85%Ecuador - Bananas 0,09% 94,94%Sudan - Groundnuts (ShelledEq) 0,09% 95,03%Zimbabwe - TobaccoLeaves 0,09% 95,12%Mozambique - Sugar (RawEquivalent) 0,08% 95,20%Paraguay - SoybeanOil 0,08% 95,28%Colombia - CoffeeGreen 0,08% 95,36%Togo - CoffeeGreen 0,08% 95,44%Ethiopia - CoffeeGreen 0,07% 95,51%Indonesia - CopraCake 0,07% 95,58%Uganda - CottonLint 0,07% 95,65%Sudan - Sorghum 0,07% 95,72%Argentina - BeansDry 0,06% 95,78%Zimbabwe - PimentoAllspice 0,06% 95,84%Bolivia - Nuts 0,06% 95,90%Guatemala - CoffeeGreen 0,06% 95,96%Ghana - NaturalRubber 0,06% 96,02%Paraguay - SunflowerseedOil 0,06% 96,08%Nigeria - OilseedCakes,Other 0,05% 96,13%Argentina - SunflowerseedOil 0,05% 96,18%Nigeria - PalmkernelCake 0,05% 96,23%Madagascar - Spices,Other 0,05% 96,28%Cameroon - CottonLint 0,05% 96,33%Ethiopia - BeansDry 0,05% 96,38%Costa Rica - Bananas 0,05% 96,43%Guinea-Bissau - Nuts 0,05% 96,48%Indonesia - Coconuts 0,05% 96,53%Tanzania, United Rep of - BeansDry 0,05% 96,58%Colombia - PalmOil 0,05% 96,63%Cameroon - NaturalRubber 0,05% 96,68%Indonesia - Spices,Other 0,05% 96,73%rest 3,29%

Annex H: Breakdown of ‘other’ category on Figure 4-26
44
ANNEX H: BREAKDOWN OF ‘OTHER’ CATEGORY ON FIGURE 4-26
Other countries Norway 1,15% United States of America 1,07% South Africa 0,91% Russian Federation 0,90% Myanmar 0,89% Canada 0,84% Thailand 0,75% Switzerland 0,74% Central African Republic 0,55% Congo, Dem Republic of 0,54% Liberia 0,34% Nigeria 0,27% Paraguay 0,26% Equatorial Guinea 0,23% Madagascar 0,21% Turkey 0,17% Papua New Guinea 0,15% Korea, Republic of 0,14% Morocco 0,12% Japan 0,10% Croatia 0,09% Australia 0,08% Viet Nam 0,08% Ecuador 0,06% Ukraine 0,06% Venezuela,Bolivar Rep of 0,05% Guyana 0,05% India 0,05% Guinea 0,04% Bolivia 0,04% Israel 0,04% Belarus 0,04% Rest 0,46%

Annex I: methodological concepts of final consumption analysis (CHAPTER 5)
45
ANNEX I: METHODOLOGICAL CONCEPTS OF FINAL CONSUMPTION ANALYSIS (CHAPTER 5)
This annex is a mehtodological annex to CHAPTER 5. It explains:
• some concepts of final consumption analysis in more detail with illustrative examples; and • specifics on MRIOA
CONCEPTS OF FINAL CONSUMPTION ANALYSIS
National Accounting Identities: Consumption versus Production
Traditionally, national accounting covers all activities occurring on nationally administered territories. When deforestation, land use, emissions to air, or any other environmental indicators are considered, terms like territorial-based or production-based accounting are often used. Some authors have suggested the use of “production” rather than “territorial” to distinguish technical differences in the system boundary used by different agencies (Peters, 2008a; Peters and Hertwich, 2008b). Due to international trade, a share of the production-based activities may be for consumption by residents from another country (exported goods and services). This has led to a new type of accounting which allocates activities to the final consumption of goods and services (Hertwich and Peters, 2009; Meyfroidt et al., 2010; Munksgaard and Pedersen, 2001; Peters and Hertwich, 2008a; Peters et al., 2009; Peters et al., 2011b). Consumption-based and production-based activities are linked via international trade (exports and imports) and it is often synonymous to study consumption-based accounting and emissions associated with international trade. In production-based, consumption-based, and trade-based accounting, several terms need to be defined (Figure (Annexes) 15) 54:
• Production is the land that is used for either domestic purposes or to produce exports; production = domestic + exports;
• Exports of land from one country are the imports of land from another country and this allows the definition of consumption as; consumption = production – exports + imports = domestic + imports;
• We often consider net transfers between consumption and production to highlight the magnitude of transfers between regions; net trade = production – consumption = exports – imports. Thus, Consumption = Production – Net Trade.
54 These definitions depend more explicitly on how each term is defined (Peters 2008a), however, for the purposes of this discussion methodological complexities can be ignored.

Annex I: methodological concepts of final consumption analysis (CHAPTER 5)
46
Figure (Annexes) 15 National accounting identities for consumption and production of land use, deforestation, emissions to air, and so on. Production equals Domestic plus Exports and Consumption equals Domestic + Imports. It is also possible to define Consumption as Production minus Exports plus Imports, which is the same as Production minus Net Trade. Thus, international trade is an integral part of consumption-based accounting.
Allocation of activities to sectors
At the country and regional level, embodied land use and deforestation can be allocated to production or consumption using the global supply chain. However, at the sector level, there are various allocation options. Figure (Annexes) 16 views Figure 5-1 from two different perspectives, either a production or consumption perspective (origin or destination analysis). It is possible to start analysis on the production side to determine what agricultural commodities (like soy beans or palm oil) get allocated to final consumption. This reveals the origin, after processing, of final consumption. As an example, soy bean might get processed and fed to dairy cattle which are used for cheese production and end up on a sandwich. It is also possible to start on the consumption side to determine what goods and services are consumed (like clothing or processed meat). This reveals the destination, after processing, of agricultural commodities. As an example, a consumer may purchase leather shoes, where the leather ultimately originated from extensive cattle production occurring on deforested land. Both methods of allocation are equally valid, they just answer different questions. In this chapter, both methods of allocation are used to provide more information on the final consumption of goods and services grown on deforested land.

Annex I: methodological concepts of final consumption analysis (CHAPTER 5)
47
Figure (Annexes) 16: The two figures show different principles to allocate embodied land use and deforestation to sectors. It is possible to start on the production side (left) to determine what agricultural commodities (like soy beans or palm oil) get allocated to final consumption. This reveals the origin, after processing, of final consumption. It is also possible to start on the consumption side (right) to determine what goods and services are consumed (like clothing or processed meat). This reveals the destination, after processing, of agricultural commodities. Both approaches are equally valid, they just provide a different allocation perspective.
Level of processing
Different methods have different levels of processing (supply chains), and this requires the different analyses to be interpreted differently. The analysis in CHAPTER 4 is at the level of “Apparent Consumption” which only partially considers processing and thus allocates embodied deforestation largely to intermediate consumption. The analysis in this chapter, is at the level of final consumption, which considers processing until goods and services are consumed by households, government, or capital investments (as defined by the system of national accounts). Apparent consumption usually considers a simple trade balance of an agricultural commodity, while final consumption considers the entire global supply chain with multiple levels of processing and international trade. It is rare that a household, for example, would consume the commodity soy bean, but instead would typically consume processed products that contain soy beans like tofu. Thus, an analysis of final consumption allocates embodied deforestation to highly processed goods and services that one would find on a supermarket shelf. Government and capital investments are also considered final consumption in the system of national accounts, and thus embodied deforestation may get allocated to broad sectors like health and education that consume goods and services that were associated with embodied deforestation. As a consequence, “services” can be allocated a significant share of embodied deforestation.

Annex I: methodological concepts of final consumption analysis (CHAPTER 5)
48
Figure (Annexes) 17: Different methods have different levels of processing along the supply chain. The analysis in CHAPTER 4 works at the level of “Apparent Consumption” which only partially considers processing. The analysis in this Chapter, works at the level of final consumption, which considers processing until goods and services are consumed by households, government, or capital investments as defined in the system of national accounts.
Dealing with multiple levels of processing in the supply chain
A challenge in interpreting the results from a final consumption perspective is that the same goods and services can be allocated to intermediate and final consumption (Figure (Annexes) 18). For example, the same oil can be consumed in a household for final consumption or consumed in a factory processing food. When allocating to final consumption, the oil used for processing is reallocated along the supply chain to final consumption, such as a hamburger. “Intermediate consumption” refers to goods and services which are consumed by an industry to make another good or service which may undergo further processing by another industry (e.g., processed oil used in a food processing factory). “Final production” refers to the last stage of processing where the factory sends the good or service to a final consumer (in other words, it is where the good or service is made). “Final consumption” refers to the point when the good and service undergoes no further processing. This can only occur for a final consumer (household, government, or capital investments). The location of final production and consumption may occur in different countries (for example, the EU27 consumes a packet of chips produced in China). The same types of goods and services can be consumed at all levels of processing, but generally, goods and services allocated to final consumption are more processed. A further challenge with multiple levels of processing is how to allocate goods and services along the international supply chain (Kanemoto et al., 2011). If the deforestation and agricultural production originates in Brazil, then it may undergo several levels of processing in different countries before arriving at its place of final consumption, for example, the EU27. Two methods of allocation are possible in this case, both answering different research questions. One option (A) is to allocate the embodied deforestation to the location of “final production”, China in this example. This would reveal where the processing occurred. Another option (B) is to provide the direct link

Annex I: methodological concepts of final consumption analysis (CHAPTER 5)
49
from where the deforestation and final consumption occurred. Both options are possible. In this chapter we take Option B, though the underlying results contain information for Option A also.
Figure (Annexes) 18: The same goods and services can be consumed at multiple points along the supply chain. In this example, oil is used to make a hamburger which is served to a patient in a hospital. From a final consumption perspective, the soy beans would be allocated to government hospital services. However, it is also possible that the oil and the hamburger are consumed by households.
Figure (Annexes) 19: With multiple levels of processing, goods and services can be allocated differently in international trade. In the case of soy bean harvested in Brazil that is processed in China for later consumption in the EU27, the allocation can be made from China to the EU27 (Option A) or directly from Brazil to the EU27 (Option B). Option B is used in this chapter to directly
Annex I: methodological concepts of final consumption analysis (CHAPTER 5)
50
link the agricultural commodity with final consumption, however, the underlying database provides all the information to use Option B.
Sector and Region Definitions and Classifications
In this chapter we use several terms to distinguish the level of processing. “Agricultural commodities” refer to commodities that are harvested or raised on cropland and pastures. “Forestry commodities” are harvested on forest land. These commodities are usually not purchased by final consumers, but undergo further transformation. “Goods and services” (collectively products) refer to highly processed goods and services purchased by final consumers, such as in a supermarket. We consider an aggregation of 10 agricultural and forestry commodities (eight grown on cropland, one raised on pastures, and one harvested from forest land). These 10 aggregated sectors cover all the agricultural commodities from CHAPTER 3. We consider an aggregation of 57 goods and services which covers all consumption globally. Thus, the 10 commodities can be consumed in 57 different sectors. Collectively, we refer to the goods and services as “sectors” of the economy. A country refers to a sovereign state, and a region is a collection of countries. The sectors and regions are defined more clearly in the classification schemes listed in Annex A and B. Both the region and sector classifications used in this chapter are hierarchical and use aggregation. In terms of sectors, the code “nec” (not elsewhere classified) is often used in sector names; e.g., there is a sector for ‘Meat: cattle, sheep, goats, horse’ and ‘Meat products nec’, where ‘Meat products nec’ is all other meat not in the sector ‘Meat: cattle, sheep, goats, horse’. This use of aggregation and this terminology is common practice and is to save having sector names containing potentially tens, hundreds or thousands of different products. In terms of regions, the “Rest of …” regions are the countries in a region that are not represented explicitly; for example, “Rest of East Asia” are the East Asian countries not uniquely identified in the database (Democratic Republic of Korea, Macau, and Mongolia). East Asia includes all East Asian countries: China, Hong Kong, Japan, Korea, and Taiwan in addition to Democratic Republic of Korea, Macau, and Mongolia. On occasion it may be useful to refer to the sector and region listings in Annex A and B to verify meanings.
SPECIFICS ON MRIOA
An analysis linking land use and deforestation to final consumers and international trade requires a method of enumerating the global supply chain (Peters, 2010). Most studies recommend accounting for the supply chain using multi-region input-output analysis (MRIOA) (Minx et al., 2009; Peters, 2010; Wiedmann, 2009). Input-output analysis (IOA) is a method specifically designed to enumerate and study supply chains (Leontief, 1936) and has been applied to environmental problems since the 1970’s (Ayres and Kneese, 1969; Leontief, 1970). Methods to study multiple regions and global supply chains were developed early (Isard, 1951; Oosterhaven, 1984) and are now one of the primary methods to study environmental repercussions arising globally (Wiedmann, 2009; Wiedmann et al., 2007). Input-output data are a key component of many economic models and the data is widely available - also for some key developing countries (Narayanan and Walmsley, 2008). Even though MRIOA is generally applied at the country and sector level rather than product or company level, such as in Life Cycle Assessment (LCA), MRIOA has the important advantage of representing the entire economic structure of different economies within a particular year including all trade linkages and can analyse large bundles of goods
Annex I: methodological concepts of final consumption analysis (CHAPTER 5)
51
simultaneously. For these reasons, MRIOA was determined to be ideal for the analysis presented in this report (Cuypers et al., 2011). An MRIO Table (MRIOT) contains information on the relationship between sectors in each country (intermediate consumption), the relationship between sectors in different countries (international trade), and the final consumption of households, government, and capital investments. The data is the core of the System of National Accounts in many countries (European Communities, 2008). Within an MRIOT goods and services can be consumed by industry and final consumers (households, government, and capital investments), and consequently, international trade can be consumed either by industry or directly by consumers. Final consumers are the end point of all consumption in MRIOA and intermediate consumption between industries exists to facilitate the production of goods and services entering into final consumption. Thus, the results are driven by final consumption, with the supply chain represented by intermediate consumption which ultimately dictates the land use and deforestation for a given final consumption. The distinction between intermediate and final consumption is important in MRIOA, and an area that may lead to some confusion. Industry consumes products which may equally be consumed by final consumers. For example, paper products are often used in industry to run a business, but final consumers can also use paper products such as a newspaper or book. When allocating land use associated with the production of paper products final consumers will be allocated a share of the land use (for example, to buy a book or newspaper), but other goods and services purchased by final consumers will also be allocated some of the land use (for example, the purchase of a car where the businesses along the supply chain have used paper products). Thus, paper products are ultimately not allocated to the consumption of the paper product sector, but rather, are allocated to the sectors which consume paper. These paper products are used in the supply chain to produce other goods and services and are not consumed directly by households. This important distinction between intermediate and final consumption will be emphasized and discussed further when the results are presented. In this analysis various versions of the Global Trade Analysis Project database have been used (Narayanan and Walmsley, 2008); version 5.4 for 1997, version 6 for 2001, and version 7.1 for 2004. The GTAP database is primarily compiled for use in economic analysis of international agricultural policies and is thus quite appropriate for the analysis of land use and deforestation. In each region and each year, the economy is divided into 57 economic sectors and three final consumers (households, government, capital investments). The world is divided into 78 countries and regions in 1997, 87 in 2001, and 112 in 2004. The method to convert the GTAP database into an MRIOT is described elsewhere (Peters et al., 2011a). The methods and data used in this report have been applied in several peer reviewed publications (Andrew et al., 2009; Hertwich and Peters, 2009; Peters and Hertwich, 2008; Peters et al., 2011b) and various forms of grey literature (Andrew et al., 2008; Carlsson-Kanyama et al., 2007; John Kornerup Bang et al., 2008; Minx et al., 2008; Peters, 2007b, c; Peters, 2008b, c; Peters and Solli, 2010; Reinvang and Peters, 2008).

Annex J: GTAP sector listing and description (MRIOA) for CHAPTER 5
52
ANNEX J: GTAP SECTOR LISTING AND DESCRIPTION (MRIOA) FOR CHAPTER 5
Code Sector Name Description1 pdr Paddy rice Paddy Rice: rice, husked and unhusked2 wht Wheat Wheat: wheat and meslin3 gro Cereal grains nec Other Grains: maize (corn), barley, rye, oats, other cereals4 v_f Vegetables, fruit, nuts Veg & Fruit: vegetables, fruits and vegetables, fruit and nuts,
potatoes, cassava, truffles, 5 osd Oil seeds Oil Seeds: oil seeds and oleaginous fruit; soy beans, copra 6 c_b Sugar cane, sugar beet Cane & Beet: sugar cane and sugar beet7 pfb Plant-based fibers Plant Fibres: cotton, flax, hemp, sisal and other raw vegetable
materials used in textiles 8 ocr Cropland nec Other Cropland: live plants; cut flowers and flower buds; flower
seeds and fruit seeds; vegetable seeds, beverage and spice cropland, unmanufactured tobacco, cereal straw and husks, unprepared, whether or not chopped, ground, pressed or in the form of pellets; swedes, mangolds, fodder roots, hay, lucerne (alfalfa), clover, sainfoin, forage kale, lupines, vetches and similar forage products, whether or not in the form of pellets, plants and parts of plants used primarily in perfumery, in pharmacy, or for insecticidal, fungicidal or similar purposes, sugar beet seed and seeds of forage plants, other raw vegetable materials
9 ctl Cattle,sheep,goats,horses Cattle: cattle, sheep, goats, horses, asses, mules, and hinnies; and semen thereof
10 oap Animal products nec Other Animal Products: swine, poultry and other live animals; eggs, in shell (fresh or cooked), natural honey, snails (fresh or preserved) except sea snails; frogs' legs, edible products of animal origin nec., hides, skins and furskins, raw , insect waxes and spermaceti, whether or not refined or coloured
11 rmk Raw milk Raw milk12 wol Wool, silk-worm cocoons Wool: wool, silk, and other raw animal materials used in textile13 frs Forestry Forestry: wood extraction, logging and related service activities14 fsh Fishing Fishing: hunting, trapping and game propagation including
related service activities, fishing, fish farms; service activities incidental to fishing
15 col Coal Coal: mining and agglomeration of hard coal, lignite and peat16 oil Oil Oil: extraction of crude petroleum and natural gas (part), service
activities incidental to oil and gas extraction excluding surveying (part)
17 gas Gas Gas: extraction of crude petroleum and natural gas (part), service activities incidental to oil and gas extraction excluding surveying (part)
18 omn Minerals nec Other Mining: mining of metal ores, uranium, gems. other mining and quarrying
19 cmt Meat: cattle,sheep,goats,horse
Cattle Meat: fresh or chilled meat and edible offal of cattle, sheep, goats, horses, asses, mules, and hinnies. raw fats or grease from any animal or bird.
20 omt Meat products nec Other Meat: pig meat and offal. preserves and preparations of meat, meat offal or blood, flours, meals and pellets of meat or inedible meat offal; greaves
21 vol Vegetable oils and fats Vegetable Oils: crude and refined oils of soya-bean, maize (corn),olive, sesame, ground-nut, olive, sunflower-seed,

Annex J: GTAP sector listing and description (MRIOA) for CHAPTER 5
53
safflower, cotton-seed, rape, colza and canola, mustard, coconut palm, palm kernel, castor, tung jojoba, babassu and linseed, perhaps partly or wholly hydrogenated, inter-esterified, re-esterified or elaidinised. Also margarine and similar preparations, animal or vegetable waxes, fats and oils and their fractions, cotton linters, oil-cake and other solid residues resulting from the extraction of vegetable fats or oils; flours and meals of oil seeds or oleaginous fruits, except those of mustard; degras and other residues resulting from the treatment of fatty substances or animal or vegetable waxes.
22 mil Dairy products Milk: dairy products23 pcr Processed rice Processed Rice: rice, semi- or wholly milled 24 sgr Sugar Sugar25 ofd Food products nec Other Food: prepared and preserved fish or vegetables, fruit
juices and vegetable juices, prepared and preserved fruit and nuts, all cereal flours, groats, meal and pellets of wheat, cereal groats, meal and pellets nec, other cereal grain products (including corn flakes), other vegetable flours and meals, mixes and doughs for the preparation of bakers' wares, starches and starch products; sugars and sugar syrups nec, preparations used in animal feeding, bakery products, cocoa, chocolate and sugar confectionery, macaroni, noodles, couscous and similar farinaceous products, food products nec
26 b_t Beverages and tobacco products
Beverages and Tobacco products
27 tex Textiles Textiles: textiles and man-made fibres 28 wap Wearing apparel Wearing Apparel: Clothing, dressing and dyeing of fur29 lea Leather products Leather: tanning and dressing of leather; luggage, handbags,
saddlery, harness and footwear 30 lum Wood products Lumber: wood and products of wood and cork, except furniture;
articles of straw and plaiting materials 31 ppp Paper products, publishing Paper & Paper Products: includes publishing, printing and
reproduction of recorded media 32 p_c Petroleum, coal products Petroleum & Coke: coke oven products, refined petroleum
products, processing of nuclear fuel 33 crp Chemical,rubber,plastic
prods Chemical Rubber Products: basic chemicals, other chemical products, rubber and plastics products
34 nmm Mineral products nec Non-Metallic Minerals: cement, plaster, lime, gravel, concrete35 i_s Ferrous metals Iron & Steel: basic production and casting 36 nfm Metals nec Non-Ferrous Metals: production and casting of copper,
aluminium, zinc, lead, gold, and silver 37 fmp Metal products Fabricated Metal Products: Sheet metal products, but not
machinery and equipment 38 mvh Motor vehicles and parts Motor Motor vehicles and parts: cars, lorries, trailers and semi-
trailers 39 otn Transport equipment nec Other Transport Equipment: Manufacture of other transport
equipment 40 ele Electronic equipment Electronic Equipment: office, accounting and computing
machinery, radio, television and communication equipment and apparatus
41 ome Machinery and equipment nec
Other Machinery & Equipment: electrical machinery and apparatus nec, medical, precision and optical instruments, watches and clocks
42 omf Manufactures nec Other Manufacturing: includes recycling 43 ely Electricity Electricity: production, collection and distribution

Annex J: GTAP sector listing and description (MRIOA) for CHAPTER 5
54
44 gdt Gas manufacture, distribution
Gas Distribution: distribution of gaseous fuels through mains; steam and hot water supply
45 wtr Water Water: collection, purification and distribution
46 cns Construction Construction: building houses factories offices and roads 47 trd Trade Trade: all retail sales; wholesale trade and commission trade;
hotels and restaurants; repairs of motor vehicles and personal and household goods; retail sale of automotive fuel
48 otp Transport nec Other Transport: road, rail ; pipelines, auxiliary transport activities; travel agencies
49 wtp Sea transport Water transport50 atp Air transport Air transport51 cmn Communication Communications: post and telecommunications 52 ofi Financial services nec Other Financial Intermediation: includes auxiliary activities but
not insurance and pension funding (see next) 53 isr Insurance Insurance: includes pension funding, except compulsory social
security 54 obs Business services nec Other Business Services: real estate, renting and business
activities 55 ros Recreation and other
services Recreation & Other Services: recreational, cultural and sporting activities, other service activities; private households with employed persons (servants)
56 osg PubAdmin/Defence/Health/Educat
Other Services (Government): public administration and defense; compulsory social security, education, health and social work, sewage and refuse disposal, sanitation and similar activities, activities of membership organizations nec, extra-territorial organizations and bodies
57 dwe Dwellings Dwellings: ownership of dwellings (imputed rents of houses occupied by owners)

Annex K: GTAP region listing and description (MRIOA – for CHAPTER 5)
55
ANNEX K: GTAP REGION LISTING AND DESCRIPTION (MRIOA – FOR CHAPTER 5)
Code Description 1 AUS Australia 2 NZL New Zealand 3 XOC Rest of Oceania: American Samoa, Cook Islands, Fiji, French Polynesia, Guam, Island of Wallis and
Futuna, Kiribati, Marshall Islands, Federated States ofMicronesia, Nauru, New Caledonia, Niue, Norfolk Island, Northern Mariana Islands, Palau, Papua New Guinea, Samoa, Solomon Islands, Tokelau, Tonga, Tuvalu, Vanuatu
4 CHN China 5 HKG Hong Kong 6 JPN Japan 7 KOR Korea 8 TWN Taiwan 9 XEA Rest of East Asia: Democratic Republic of Korea, Macau, Mongolia 10 KHM Cambodia 11 IDN Indonesia 12 LAO Lao People's Democratic Republic 13 MYS Malaysia 14 PHL Philippines 15 SGP Singapore 16 THA Thailand 17 VNM Vietnam 18 XSE Rest of Southeast Asia: Brunei Darussalam, Myanmar, Timor-Leste 19 BGD Bangladesh 20 IND India 21 PAK Pakistan 22 LKA Sri Lanka 23 XSA Rest of South Asia: Afghanistan, Bhutan, Maldives, Nepal 24 CAN Canada 25 USA United States of America 26 MEX Mexico 27 XNA Rest of North America: Bermuda, Greenland, Saint Pierre and Miquelon 28 ARG Argentina 29 BOL Bolivia 30 BRA Brazil 31 CHL Chile 32 COL Colombia 33 ECU Ecuador 34 PRY Paraguay 35 PER Peru 36 URY Uruguay 37 VEN Venezuela 38 XSM Rest of South America: Falkland Islands, French Guiana, Guyana, Suriname 39 CRI Costa Rica 40 GTM Guatemala 41 NIC Nicaragua 42 PAN Panama 43 XCA Rest of Central America: Belize, El Salvador, Honduras 44 XCB Caribbean: Anguilla, Antigua & Barbuda, Aruba, Bahamas, Barbados, Cayman Islands, Cuba, Dominica,
Dominican Republic, Grenada, Guadeloupe, Haiti, Jamaica, Martinique, Montserrat, Netherlands Antilles, Puerto Rico, Saint Kitts and Nevis, Saint Lucia, Saint Vincent and the Grenadines, Trinidad and Tobago, Turks and Caicos, British Virgin Islands, US Virgin Islands
45 AUT Austria 46 BEL Belgium 47 CYP Cyprus 48 CZE Czech Republic 49 DNK Denmark

Annex K: GTAP region listing and description (MRIOA – for CHAPTER 5)
56
50 EST Estonia 51 FIN Finland 52 FRA France 53 DEU Germany 54 GRC Greece 55 HUN Hungary 56 IRL Ireland 57 ITA Italy 58 LVA Latvia 59 LTU Lithuania 60 LUX Luxembourg 61 MLT Malta 62 NLD Netherlands 63 POL Poland 64 PRT Portugal 65 SVK Slovakia 66 SVN Slovenia 67 ESP Spain 68 SWE Sweden 69 GBR United Kingdom 70 CHE Switzerland 71 NOR Norway 72 XEF Rest of EFTA: Iceland, Liechtenstein 73 ALB Albania 74 BGR Bulgaria 75 BLR Belarus 76 HRV Croatia 77 ROU Romania 78 RUS Russian Federation 79 UKR Ukraine 80 XEE Rest of Eastern Europe:Republic of Moldova 81 XER Rest of Europe: Andorra, Bosnia and Herzegovina, Faroe Islands, Gibraltar, the former Yugoslav
Republic of Macedonia, Monaco, San Marino, Serbia and Montenegro 82 KAZ Kazakhstan 83 KGZ Kyrgyzstan 84 XSU Rest of Former Soviet Union: Tajikistan, Turkmenistan, Uzbekistan 85 ARM Armenia 86 AZE Azerbaijan 87 GEO Georgia 88 IRN Iran, Islamic Republic of 89 TUR Turkey 90 XWS Rest of Western Asia: Bahrain, Iraq, Israel, Jordan, Kuwait, Lebanon, Oman, Occupied Palestinian
Territory, Qatar, Saudi Arabia, Syrian Arab Republic, United Arab Emirates, Yemen 91 EGY Egypt 92 MAR Morocco 93 TUN Tunisia 94 XNF Rest of North Africa: Algeria, Libyan Arab Jamahiriya 95 NGA Nigeria 96 SEN Senegal 97 XWF Rest of Western Africa: Benin, Burkina Faso, Cape Verde, Cote d'Ivoire, Gambia, Ghana, Guinea,
Guinea-Bissau, Liberia, Mali, Mauritania, Niger, Saint Helena, Sierra Leone, Togo 98 XCF Rest of Central Africa: Cameroon, Central African Republic, Chad, Congo, Equatorial Guinea, Gabon, Sao
Tome and Principe 99 XAC Rest of South Central Africa: Angola, Democratic Republic of the Congo 100 ETH Ethiopia 101 MDG Madagascar 102 MWI Malawi 103 MUS Mauritius 104 MOZ Mozambique

Annex K: GTAP region listing and description (MRIOA – for CHAPTER 5)
57
105 TZA Tanzania 106 UGA Uganda 107 ZMB Zambia 108 ZWE Zimbabwe 109 XEC Rest of Eastern Africa: Burundi, Comoros, Djibouti, Eritrea, Kenya, Mayotte, Reunion, Rwanda,
Seychelles, Somalia, Sudan 110 BWA Botswana 111 ZAF South Africa 112 XSC Rest of South African Customs Union: Lesotho, Namibia, Swaziland

Annex L: extract from the expert workshop with regards to the ambiguity on rubber plantation reporting in FAO statistics
58
ANNEX L: EXTRACT FROM THE EXPERT WORKSHOP WITH REGARDS TO THE AMBIGUITY ON RUBBER PLANTATION REPORTING IN FAO STATISTICS
It is clear that this ambiguity should be brought to the attention of the FAO as it is clear how they have been treated in the FRA 2010, but it is unclear how these have been treated in the FAO LU domain, i.e. “in the land use domain, are they counted as forests or as agricultural crops and/or areas?, meaning that if they are counted as agricultural crops that this area is then consequently to be subtracted from the forest land when inputted by the FAO in the land use domain?” One could check this by checking consistency between FRA2010 reported forest areas and FAOSTAT land use forest data. If they are exactly the same, this would mean that they are counted as forests in the FAOSTAT land use domain. But it needs to be said that, while it is important from a scientific consistency point-of-view, the issue is rather marginal for a global study. To avoid putting too much emphasis on this detail we cite from FRA 2010 (underlining added): p212: definitions Rubber plantations Forest area with rubber tree plantations. p11 Rubber plantations are found in relatively few countries – primarily in Southeast Asia and Africa – and cover an estimated 10 million hectares. While the area of rubber increased rapidly in the 1990s, the rate of increase is now beginning to slow down and is currently decreasing in several countries. p27 Countries were asked to report separately on the areas of mangroves, bamboo and rubber plantations for FRA 2010 as these species groups are well defined and frequently used in countries where they exist. This allows for an analysis of trends in forest area excluding bamboo and rubber plantations, which are not defined as forest in all countries, but are included as forests in the FRA process. p33 RUBBER PLANTATIONS Rubber trees (primarily Hevea brasiliensis originating from Brazil) have been planted in many countries over the past 100 years. Most rubber tree plantations are located in South and Southeast Asia and some also exist in tropical West Africa. Many of the early plantations are not very productive and the senescent trees are increasingly entering the wood production chain.[this is extremely relevant for the furniture sector as a lot of this rubberwood is used in the furniture industry in Asia. So if these rubber trees are replanted it is no deforestation, if they are considered forests and converted to palm oil, then this is deforestation]. Thailand in particular has carved out a niche market in toys and handicrafts made from rubber wood. Status A total of 169 countries, accounting for 84 percent of the total forest area reported on the area of rubber plantation. Of these, only 19 reported the existence of rubber plantations. Annual statistics on the area harvested to produce natural rubber are collected by FAO as part of its agricultural statistics. In the FAOSTAT database, information is available for 28 countries. Combining the two sources of information yields a list of 32 countries, because four countries reported to FRA 2010 but are not included in FAOSTAT. Table 2.10 and Figure 2.13 show the combined list of countries and the estimated areas. The FAOSTAT figures refer to ‘area harvested’ and are therefore likely to result in an underestimate of the total area, as was also evident when comparing the two sources for countries that had reported to both processes. Nevertheless, the difference, in most cases, was relatively small. At the global level, it is estimated that at least 10 million hectares of rubber plantations exist. The vast majority of these are located in Southeast Asia (Indonesia, Thailand and Malaysia) and in China.

Annex L: extract from the expert workshop with regards to the ambiguity on rubber plantation reporting in FAO statistics
59
Trends Based on the information available, the area of rubber plantations has steadily increased by some 2 million hectares (or 25 percent) since 1990 (see Table 2.10). However, the area is decreasing in Malaysia and is expected to decrease even further in the future as older rubber plantations are being converted to other uses. Conclusions As a follow-up to the thematic studies on mangroves and bamboo undertaken for FRA 2005 and in order to obtain data on rubber plantations, which in some countries are not classified as forests, countries were asked to report separately on these three distinct forest types as part of FRA 2010. The results show that the area of mangroves is decreasing, while the area of bamboo and of rubber plantations is increasing. Although the response rate overall was fairly good, data were missing from some countries despite the fact that they had been reported in the FRA 2005 study or supplied to FAO’s statistical database on agriculture (FAOSTAT). Furthermore, analysis of the existing data on trends suggests that these should be treated with caution, so there is clearly room for improvement in future assessments of the status and trends of these selected forest types. p96 Some countries reported that areas of planted forests had been converted to other land uses during the period. For example, in Malaysia rubber plantations have been converted to other uses – in some cases oil palm plantations. p103 However, the figure for 2005 is an underestimate by at least 50 million cubic metres because China, Indonesia and Thailand provided only partial data and, for example, did not include wood removals from rubber plantations. Southeast Asia and China experienced a significant shift from logging in natural forests to planted forests over the two decades. The actual wood removals in Asia are now probably higher than during the 1990s.

Annex M: List of databases/datasets used (provided on CD)
60
ANNEX M: LIST OF DATABASES/DATASETS USED (PROVIDED ON CD)
Description of the datasets used and provided by IIASA for Chapter 3 and Chapter 4 (and appropriate annexes) Queries: Eva Hizsnyik [email protected], Sylvia Prieler, [email protected] The datasets can be divided into two. Those used as input data and the output files. Input:
1. IIASA uses FAO’s ‘Global Forest Resources Assessment 2010’ (FRA 2010) to assess the state of forests and deforestation trends. FRA 2010 database is freely available (http://www.fao.org/forestry/fra/fra2010/en/).
2. IIASA uses FAOSTAT database to estimate the contribution of different sectors to deforestation and to trace the land embodied in agricultural production via trade. All data (crop and livestock production, commodity balances, trade, land use) are publicly available, free of charge (http://faostat.fao.org). Further information and/or data download, can be attained directly from FAO. Please note the FAO disclaimer: “Disclaimer © FAO 2012
The data of the FAOSTAT database shown on this internet site are copyrighted by the Food and Agriculture Organization of the United Nations and are provided for your internal use only. They may not be re-disseminated in any form without written permission of the FAO Statistics Division.”
Methodologies are described in the Annex of the Task 2 Report. Output:
1. IIASA_Defor_v6_Dec2011_final.xls: contains embodied deforestation results from Chapter 3 per sector and per crop that were input in LANDFLOW and GTAP for calculating embodied deforestation in trade. A ReadMe sheet gives explanations.
2. Figures-Ch3.xlsx: contains all the data used for figures in Chapter 3
3. IIASA-Database-LANDFLOW-Results_V16jan.xls: contains LANDFLOW results for both land use and deforestation (Chapter 4 ), and indicators for Chapter 7. This database contains the complete and detailed results by region generated by the modelling at IIASA. It covers land use and embodied deforestation in agricultural production (crops in eight groups, livestock) and forest production, and all regions. A ReadMe sheet in the spreadsheet describes the results.
4. Figures-Ch4.xlsx: contains all the data used for figures in Chapter 4
5. Figures-annex.xlsx: contains all the data used for figures in the Annex and related to Chapter 4
Description of the datasets used and provided by CICERO for Chapter 5 Queries: Glen Peters, [email protected] The datasets can be divided into two. Those used as input data and the output files. Input:
Annex M: List of databases/datasets used (provided on CD)
61
1. CICERO uses the GTAP database as its data source for economic and international trade data (https://www.gtap.agecon.purdue.edu/). To update and maintain the database, GTAP charges a fee for a licence. A condition of this license is that CICERO is not allowed to distribute the database to third parties. The GTAP database, however, is openly available to anyone that choses to purchase a license. For further information, I invite the EC to contact GTAP to discuss legality issues of licensees.
a. The GTAP database is converted into another format for use in the analysis. The procedure is described here (http://www.tandfonline.com/doi/abs/10.1080/09535314.2011.563234).
2. For the time-series analysis, CICERO additionally uses the System of National Accounts Main Aggregates (GDP by expenditure) which is freely available (http://unstats.un.org/unsd/snaama/).
a. The method to perform the time-series analysis is described here (http://www.pnas.org/content/108/21/8903.abstract).
3. CICERO uses land use and deforestation data provided by IIASA (as used in the report).
Output
4. Chatper5_TablesFigures.xlsx provides all the data used in the tables and figures for Chapter 5.
5. Chapter5_EU27_CompleteResults.xls contains the complete and most detailed results generated by the modelling at CICERO. This covers all types of land use and land use associated with deforestation, all sectors, and all regions. A ReadMe sheet in the spreadsheet describes the results. This is the most detailed output available, and the EC can use various EXCEL functions to tabulate the data as required.
Description of the datasets used and provided by VITO Queries: Dieter Cuypers [email protected]; Arnoud Lust [email protected]
1. Biofuel consumption from NREAPs: contains the data and calculations used for NREAP biofuel foresights up to 2020 + figures (chapter 6)
2. Solid biomass consumption from NREAPs: containsthe data and calculations used for NREAP solid biomass foresights up to 2020 + figure (chapter 6)
3. Meat consumption foresights from FAPRI and OECD-FAO: contains the meat consumption foresights from FAPRI (2011) and OECD-FAO (2010) to guide scenarios (chapter 6)
4. Food consumption scenarios_2020_2030: contains the main modelling data and calculations for the scenarios of the different diets for the EU27 (chapter 6)

Annex N: Task 2 Expert Workshop Report (October 20, 2011)
62
ANNEX N: TASK 2 EXPERT WORKSHOP REPORT (OCTOBER 20, 2011)
This report is part of the deliverable to subtask 2.5 ‘The organization of an expert workshop on draft task 2 report” of task 2, the ‘Comprehensive analysis of the impact of EU consumption of imported food and non food commodities and manufactured goods on deforestation” for the study “The impact of EU consumption of imported food and non-food commodities on deforestation” funded by the European Commission, DG ENV Contract N° 070307/2010/577031/ETU/E2. The final report to task 2 of this study is expected to include recommendations and suggestions which come out of this workshop and therefore, these need to be outlined in this report. This report will also be attached to the final report for task 2 as an annex. Attending experts received:
• The preliminary results and methods; and
• A discussion paper to guide discussions during the day.
This report is based upon: • Notes taken during the workshop;
• Recorded discussions during the workshop as an add-on; and
• Additional received comments after the workshop from attending experts.
Below are listed the different presentations. Specific questions and comments are mentioned after each presentation when they are clarifying specifically. Secondly the big issues were grouped together after the presentations. Attached to this report are:
• The discussion paper;
• Pdf’s of the presentations; and
• A list of attending experts.
1. INTRODUCTION AND TOUR DE TABLE
Attendees presented themselves shortly, their main area of expertise and affiliation.
2. PRESENTATION ON THE STUDY BY GIULIANA TORTA (DG ENV) ON THE POLITICAL CONTEXT, OBJECTIVES, EXPECTATIONS AND NEXT STEPS OF THE STUDY.
There were no questions asked after this presentation (Annex 2a).
3. PRESENTATION ON THE PROGRAMME FOR THE DAY, THE COMBINED MODELLING AND GENERAL
CONCLUSIONS ON THE PRELIMINARY RESULTS BY DIETER CUYPERS (VITO).
Only one question was raised after the presentation (Annex 2b) on the further policy tasks and is taken up in the policy section of this report (section 2.c).

Annex N: Task 2 Expert Workshop Report (October 20, 2011)
63
4. PRESENTATION ON THE METHODOLOGY AND PRELIMINARY RESULTS OF THE LAND-USE CHANGE
ESTIMATION (DEFORESTATION) BY GÜNTHER FISCHER (IIASA).
This presentation (Annex 2c) and its method were specifically addressed in the discussion paper and most issues raised in section 0 are related to this methodology. In addition to that some specific comments were given during and after the workshop, which are listed hereunder.
• Slide 6: the terminology ‘forest management’ is very inappropriate and the scheme needs some rethinking. This slide causes too much confusion.
As it is not used in the report we will further refrain from using the scheme to illustrate the flows.
• Slide 7 mentions natural expansion. It is questioned whether these have been taken up in the FRA2010.
See section 2.iii for more explanation on that. the reporting on ‘natural expansion’ is by no means complete in FRA 2010 although quite a number of important countries with large forest sectors did provide data to the FAO. Also, the initial results published from the remote sensing survey of 1990-2005 do include natural expansion.
• It was stated that the allocation itself might be an issue, referring to what now is generally known as indirect land use change (iLUC). The conversions within the agricultural land have to be taken into account when one wants to attribute deforestation to different sectors and commodities. For example for Brazil it was stated that soy bean is not the main driver, but that other agricultural land uses push soy cultivation into forest land and then as such cause deforestation.
It must be noted that this has been taken into account (we refer to the method section for chapter 3 and Annex D, p148, point 3, the proportionality assumption). In fact the attribution to soy would have been much higher if this wouldn’t have been done. Part of the attribution to soy, as seen on the ground, has been attributed to other agricultural and livestock sectors/commodities in the model. The attribution to sectors and especially crop commodities (annual and perennial) is a combination of what can be really seen on the ground and a certain pressure from other commodities which force other commodities to intrude forest areas. One could thus say that a national iLUC factor has been used. So, this has been addressed.
• The presentation is not very clear on the issue on how the EU27 is concerned. EU27 is aggregated with Russia. The regional data are still relevant, but it would be better to have separate data for the EU27 available in the graphs, tables and figures.
The reworked data now include separate EU27 data. • It would be good to have specific country results for other relevant countries too, next to
Brazil and Indonesia. For the countries where the other models indicate that EU consumption is relevant for land use and deforestation, this chapter should provide specific country results in order to be able to interpret the outputs of the LANDFLOW and GTAP model.
In addition to the most important countries, Brazil and Indonesia, depending on final results and relevance for EU consumption and deforestation we will add examples of one or two additional countries in the report, such as for example Argentina.

Annex N: Task 2 Expert Workshop Report (October 20, 2011)
64
5. PRESENTATION ON THE METHODOLOGY AND PRELIMINARY RESULTS FROM LANDFLOW MODELLING OF
LAND-USE CHANGE (DEFORESTATION) BY GÜNTHER FISCHER.
The presentation (Annex 2d) outlined the results of the LANDFLOW modelling, including some new results from the Wood Balances. Some specific comments were raised in addition to the discussions later on.
• Slide 12 looks interesting but is also misleading as it does include all deforestation and actually does not go up to final consumptions.
Slide 12 in the presentation shows deforestation in net trade of respectively net importers and net exporters, i.e. respectively the net amount of deforestation that stays in a region after correcting for re-exports and the net amount of deforestation exported after correcting for a regions imports. The slide does NOT present all deforestation. It clearly says that there were 37 Mha of deforestation embodied the trade of agricultural products (total deforestation attributed to agriculture was about 129 Mha); net amounts are of course even less than 37 Mha. The calculations go up to final consumption to the extent this is possible within the FAO data. As discussed, the trade of some highly processed agricultural raw materials (e.g. shirts, leather bags, etc.) is not recorded in the FAO data. For the final report we will clearly quantify per commodity group the percentage that goes to the Other/Industrial use. Some relevant information is included in Ch4 of the report and in slide 11.
• The LANDFLOW generation of land use is not explained enough in the report, especially because the wood balances were not yet included in the preliminary results and methods.
The wood balances will be included in the final report and they will clarify better how the attribution is done.
• It was asked in which category stationary biomass was taken up in the study. Stationary biomass mainly consists of solid biomass, mainly wood for heating and electricity purposes and is increasingly used to substitute fossil fuels like charcoal.
The FAO Wood Balances distinguish between industrial roundwood (IRW) and fuelwood (FW). Fuelwood is mainly used by households, though recently becomes increasingly relevant for stationary biomass, though it still is a relatively marginal issue for the moment. So stationary biomass like wood pellets are in the category of IRW. Unfortunately it is very difficult to discern this novel forest product from other categories within this IRW. We even contacted Statistics Canada, the Canadian Biomass Association and the Wood Pellet Association Canada as most imports of wood pellets come from Canada, and they had to admit that reporting on this category is not consistent, sometimes they end up in chips and particles, sometimes sawdust and then again in other categories. EUROSTAT has import data as from January 2009 only in the category CN 44013020 for wood pellets.
• Where is charcoal in the forestry sector?
Charcoal is treated under fuelwood as defined by FAOSTAT; it is not disaggregated from fuelwood.
• Where are concrete answers on country/commodity impacts of EU consumption on deforestation and this for the EU27? Result, like presented in slide 18 are useful, but refer to : 1) EU27+, so how relevant are they?; and 2) do not inform on the country of origin and
Annex N: Task 2 Expert Workshop Report (October 20, 2011)
65
thus does not allow to compare with the other method, and do not answer the ToR questions.
On the first question, we have changed the regional groupings such that EU countries form a separate region, i.e. all results now refer to EU27 proper. The ‘+’ countries, e.g. Norway. Switherland, etc.; are now included in the ‘Other Europe’ region together with several Eastern European countries, including Russian Federation. On the second part: The LANDFLOW model runs on country data. We are keeping a record of exports (and associated deforestation) by country to regional markets. Based on this we are putting additional text for key commodities w.r.t. deforestation and EU consumption as to highlight the countries of origin of deforestation consumed in EU27. Yes, the figure mentioned shows regions and commodity groups, but if you pair the region with the commodity group then the source can be identified already now, e.g. imports from South America – oil crops -> soybeans from Brazil and Argentina. Nevertheless, this will be further improved.
6. PRESENTATION ON METHODOLOGY AND PRELIMINARY RESULTS FROM GTAP I-O MODELLING OF LAND-USE CHANGE (DEFORESTATION) BY GLEN PETERS (CICERO).
The presentation (Annex 2e) was followed by some comments and questions. • There are some unexpected results for Cambodian pasture land deforestation, and
Botswana, Zimbabwe and Venezuela for deforestation due to logging (IRW). These need to be checked.
We are aware of that and will check these results in depth, these are probably caused by the wrongful application of the preceding logging attribution to these countries (see section 2.ii). We will mend these artefacts.
• 2004 was chosen to analyse international trade streams as the most recent and detailed data from GTAP are only available for that year. It was noted that for Brazil 2004 was a deforestation year and deforestation dropped significantly afterwards.
It must be noted that while 2004 was chosen for the international trade strems with GTAP, that the actual deforestation rate used for this analysis is the smeared out deforestation for the period 2000-2008, so the deforestation rate applied to 2004 is actually the 2000-2008 average deforestation. Secondly, we will not base our following policy analysis on these results only and we are well aware that in the future the situation can change. Here, it was only the objective to re-enact the past to better understand the link between deforestation and EU consumption.
• Deforestation in Nigeria appears to be due to a huge variety of crops, while it is the third largest producer of palm oil. One would expect then palm oil to be the main driver among crops. Can you explain?
Data rank oil palm 6th for the period 1990-2008, after ground nuts, yams, cocoa, cassava and sweet potatoes. This is mainly due to the second period, as Nigerian oil palm expansion took place mainly in the 90’s, though it is not much bigger than for other crops. Expansion of oil palm over the period 2000-2008 was considerably smaller in Nigeria.
• It would be good for countries which pop up in the final results for EU consumption to have their country fiches in chapter 3.

Annex N: Task 2 Expert Workshop Report (October 20, 2011)
66
We will do that, once we figured out the odd-ones-out. Details are available at country level and can be used if needed.
• It is surprising to find meat consumption only responsible for 16% in slide 20, can you explain this? Also, there is a considerable share from deforestation for pastures in Brazil, which is surprising.
This is a result of the so-called aggregation error of GTAP and cannot be resolved as such as it is the way GTAP is constructed. This is because meat consumption as food for households only is represented here, while some meat consumption can be found under services and trade (restaurants, hospitals, etc.). As such the consumption of meat is smeared out in many sectors. This is the way GTAP was constructed and can be reviewed for specific purposes for the next versions of GTAP. As food hasn’t really been the main focus of the construction of GTAP this isn’t well discerned. We will see how we can address this shortcoming. On the pasture deforestation: these are results from the modelling and are not that surprising to us.
7. PRESENTATION ON RUNNING SUBTASK 2.4, EUS IMPACT VERSUS THE THEORETICAL SUSTAINABLE LEVEL OF
USE/CONSUMPTION BY THEO GEERKEN (VITO).
(Annex 2f) • It was asked why the focus is so much on the comparison with the Ecological Footprint
(EF), if the EF is presumed to be a weak indicator. What is the added value of the analysis?
We refer to the so-called basket of indicators that are proposed to evaluate to the progress on the EUs Sustainable Development Strategy and its Resource Strategy. In this basket are 4 indicators:
1. HANPP (Human Appropriation of Net Primary Productivity) and LEAC (Land and Ecosystem Accounts):
a. are mostly used for analyzing land-use related impacts of regions and countries and do not link the area of consumption to the area of production;
b. do not include aspects of burden shifting related to international trade of goods and services;
c. focus on land-cover and land-use issues and their changes over time
2. EF and EMC (Environmentally Weighted Material Consumption) as opposed to the former two:
a. Do not provide geographical specifications of the impacts, i.e. they do not inform, where exactly those impacts take place.
It is therefore our intention to investigate how the indicators developed in this project can complement the existing indicator set. We will particularly focus on the land-use related indicators. EMC and LEAC are not relevant for our discussions here as the former is focused

Annex N: Task 2 Expert Workshop Report (October 20, 2011)
67
rather on materials and products, and the latter is a land-use indicator, but focuses on land use in the EU. There is an added value in comparison with indicators such as the EF and HANPP, especially to point out the weaknesses thereof and to show what can be added by our indicators. It was acknowledged that the modelling for this study is already considerably more robust than the modelling for the EF. The discussion on this matter was only limited due to the very preliminary results thereof.
8. POLICY DISCUSSION
Due to time constraints this part was skipped, also because some of the important policy issues were already raised during the discussions. The issues are treated in section 2.c of this expert workshop, with additional comments and suggestions received after the workshop, as requested.
WORKSHOP DISCUSSIONS AND ISSUES
1. THE RELIABILITY OF, AND CONCEPTS AND DEFINITIONS BEHIND FAO STATISTICS
On many occasions it was stated that the basic data used for this study are the best available consistent data set. The study uses FRA 2010, FAOSTAT Land-Use (LU) domain and FAOSTAT production domain data for the models. The LANDFLOW model in addition uses the FAOSTAT supply utilization accounts, the fairly detailed country-level trade statistics and more than 10 million records of bilateral agricultural trade data. All three of the datasets have some limitations, uncertainties and inconsistencies between them. For as far as possible a lot of time has already gone into the checking of these consistencies between them and where possible inconsistencies have been resolved and also discussed with FAO. During the day sensitivity analysis was repeatedly asked for to complement the results. It must be noted that many of the requests for sensitivity analyses were aimed at the two models which simulate international trade streams, i.e. LANDFLOW and GTAP, but that the essential sensitivity analyses, in the end, apply to the first model which provides the input to the other models. GTAP and LANDFLOW are established models to track trade streams, the transition model is newly created, based on FAO data. Throughout the explanation below, the sensitivity analyses are integrated in the text below. a key sensitivity is the treatment of the ‘unexplained’ deforestation. The reality and truth probably lies somewhere in between the results that we are producing now (no primary deforestation from unsustainable roundwood production) and the results discussed in the workshop (all unexplained deforestation attributed to the forestry/fuelwood sector. Both FRA2010 and the FAOSTAT LU domain use the concept of Land Use (LU), in contrast to the Land Cover (LC) concept. It was generally acknowledged that the LU concept is the best way to go for a study on deforestation. It was also appreciated that, in contrast to what was earlier proposed, gross deforestation rates were used. In addition, the LU concept was also used for the recently published remote sensing survey conducted by FAO/JRC. It was agreed that an explanation on the LU concept needs to be included in the methods section to clarify what is exactly assessed in the study. Part of this explanation can be taken from the inception report to do so. The inception report was not tabled to the experts but includes these explanations. In general this means that some vegetation types which appear as a forest to many, are not considered forests as they are not used as forests, as for example grazing under tree cover,

Annex N: Task 2 Expert Workshop Report (October 20, 2011)
68
but also the other way round. Secondly, the forest definition includes plantations as these fall under the definition of forests by the FAO. The issue can be illustrated by an example and discussions on the results for Argentina when EU consumption of soy is concerned:
• It was mentioned that the appearance of Argentina in the top list of EU27 impacts is strange. The Dutch embassy in Argentina commented on a previous LEI study (Dutch trade and biodiversity) that a lot of conversion is actually taking place on shrubland and grassland. What basic dataset was used for the modelling? For carbon studies, that is a very critical point.
It was repeated that what is treated in the study is forests and deforestation and not carbon. It is mentioned in the report that it should be avoided to draw any quick conclusions on carbon emissions based on this study. A study on emissions from deforestation requires a similar but different study set-up, with different vegetation types and biomes; data which are not available from FAO but which demand a lot of ancillary data, also on the national level of countries where deforestation takes place. Though the output of the study provides a good basis to build upon. FAOSTAT land-use domain (up to 2008) and FRA2010 data were used, this means that the deforestation was reported by Argentina itself to the FAO according to the agreed forest definition, used by the FAO. A possible explanation could be that the shrub land conversion was rather the case in the last years if the LEI study was on recent deforestation, if the communication of the Dutch Embassy was right and based upon the FAO definition and not the physical appearance of what can be interpreted as shrub or forests by the Dutch Embassy. The data that are used in the two final models (LANDFLOW and GTAP) are using, respectively, the cumulative deforestation over the period 1990-2008, and smeared-out deforestation rates for the period 2000-2008 for the year 2004. Secondly the appearance of Argentina in the top list for the EU27 is not only based on the deforestation in Argentina, but also on the EU27 consumption. Current Fig 46 illustrates that traded Argentine deforestation is consumed mainly in the EU27 and China. For the USA, and even more so for Japan, Argentine deforestation is much less important for their consumption, than it is for the EU27. The figure below illustrates the land-use changes for Argentina for the two time periods (in 10³ ha). It can be seen that agricultural land (arable+pastures+permanent crops) expansion has gone at the expense of forests throughout the whole period, but that the expansion in the last period was mainly on the expense of ‘other land’, which contains shrubland. We will make sure this is (as a focus country) taken up in the final report.

Annex N: Task 2 Expert Workshop Report (October 20, 2011)
69
• It was asked whether this could mean that Argentine deforestation then could be overestimated, because if so, then sensitivity analysis should be done.
We believe this is not necessary as this was reported by Argentina itself to the FAO according to the agreed forest definition, used by the FAO. We are aware of the sometimes doubtful quality of reported data as both underreporting or over reporting can be, depending on international forest issues and funding, beneficial. It was then said that the choice for the FAO data is still the best to make and that FAO is currently doing a remote sensing survey to assess the reliability thereof. There are not better data around. For those willing to consult the deforestation data as reported by Argentine we refer to the country report: www.fao.org/docrep/aI4456/aI4456.pdf
Other issues referring to the FAO definitions were raised:
• The use of perennial tree crops and agroforestry;
• The issue of clearcutting; and
• Rubber plantations
• Oil palm plantations might classify as forests because of their crown cover, but are, due to
their agricultural use, not considered forests in an LU concept, as for other perennial crops like rubber, cocoa, coffee, tea, banana and plantain (see p33 of the report, footnote 8). The same applies to other agroforestry land uses. FRA2010 talks about trees outside forests when agroforestry is concerned, not forests. Probably some small-scale agroforestry done by local communities and indigenous peoples in remote areas could sometimes be
0
20000
40000
60000
80000
100000
120000
1990
1991
1992
1993
1994
1995
1996
1997
1998
1999
2000
Arable landPermanent cropsPermanent meadows and pasturesForest areaOther land
0
20000
40000
60000
80000
100000
120000
2000
2001
2002
2003
2004
2005
2006
2007
2008

Annex N: Task 2 Expert Workshop Report (October 20, 2011)
70
classified still as forests in countries with vast remote forest areas, but this is a minor issue, especially when international trade is concerned.
• Clearcutting of forest land (LU) remaining forest land does change the forest cover, but not the land use. Natural regrowth and reforestation happen in clear-cut forests, but do not change the land use, and clearcutting which does not result in a following conversion into agricultural land or a degradation which might result in the land classifying as ‘other land’. Clearcutting in forest land remaining forest land is a matter of forest management, not a matter of deforestation. The extent of clearcuts in some forest management systems (mainly applicable in temperate and boreal zones like the USA and Finland) is debatable, but it is not considered deforestation as there is a potential for regrowth (temporarily unstocked areas). The same applies to forest fires in Alaska, the land remains forest land and as such clearcutting and fires in forest land remaining forest land is rather a degradation issue than a deforestation issue. The same applies to for example pine and Eucalyptus plantations which are clearcut to produce pulp and paper. As these are considered as forest land use, this clearcutting as part of the management system is not considered deforestation when the plantation is not converted afterwards into other land use.
A theoretical example was given. Imagine a country with 100ha of forest land of which 10 ha is converted into agricultural land, 5ha into rubber plantations, 5 ha is clearcut but remaining forest land (a management or degradation issue) and 5ha is afforested. The country will thus report 10 ha of gross deforestation (forest to agricultural land conversion) and 5 ha net deforestation (10 ha minus 5ha afforestation). We are aware of this and it is addressed in the study although there are remaining questions regarding the issue of rubber plantations.
• Rubber plantations are then the outstanding issue as it appears that this category is ambiguously used in FAOSTAT (agricultural crop but unclear whether reported as cropland or forest land) and FRA 2010 (reported as forest land).
It is clear that this ambiguity should be brought to the attention of the FAO as it is clear how they have been treated in the FRA 2010, but it is unclear how these have been treated in the FAO LU domain, i.e. “in the land use domain, are they counted as forests or as agricultural crops and/or areas?, meaning that if they are counted as agricultural crops that this area is then consequently to be subtracted from the forest land when inputted by the FAO in the land use domain?” One could check this by checking consistency between FRA2010 reported forest areas and FAOSTAT land use forest data. If they are exactly the same, this would mean that they are counted as forests in the FAOSTAT land use domain. But it needs to be said that, while it is important from a scientific consistency point-of-view, the issue is rather marginal for a global study. To avoid putting too much emphasis on this detail we cite from FRA 2010 (underlining added):
p212: definitions Rubber plantations Forest area with rubber tree plantations. p11 Rubber plantations are found in relatively few countries – primarily in Southeast Asia and Africa – and cover an estimated 10 million hectares. While the area of rubber increased rapidly in the 1990s, the rate of increase is now beginning to slow down and is currently decreasing in several countries. p27

Annex N: Task 2 Expert Workshop Report (October 20, 2011)
71
Countries were asked to report separately on the areas of mangroves, bamboo and rubber plantations for FRA 2010 as these species groups are well defined and frequently used in countries where they exist. This allows for an analysis of trends in forest area excluding bamboo and rubber plantations, which are not defined as forest in all countries, but are included as forests in the FRA process. p33 RUBBER PLANTATIONS Rubber trees (primarily Hevea brasiliensis originating from Brazil) have been planted in many countries over the past 100 years. Most rubber tree plantations are located in South and Southeast Asia and some also exist in tropical West Africa. Many of the early plantations are not very productive and the senescent trees are increasingly entering the wood production chain.[this is extremely relevant for the furniture sector as a lot of this rubberwood is used in the furniture industry in Asia. So if these rubber trees are replanted it is no deforestation, if they are considered forests and converted to palm oil, then this is deforestation]. Thailand in particular has carved out a niche market in toys and handicrafts made from rubber wood. Status A total of 169 countries, accounting for 84 percent of the total forest area reported on the area of rubber plantation. Of these, only 19 reported the existence of rubber plantations. Annual statistics on the area harvested to produce natural rubber are collected by FAO as part of its agricultural statistics. In the FAOSTAT database, information is available for 28 countries. Combining the two sources of information yields a list of 32 countries, because four countries reported to FRA 2010 but are not included in FAOSTAT. Table 2.10 and Figure 2.13 show the combined list of countries and the estimated areas. The FAOSTAT figures refer to ‘area harvested’ and are therefore likely to result in an underestimate of the total area, as was also evident when comparing the two sources for countries that had reported to both processes. Nevertheless, the difference, in most cases, was relatively small. At the global level, it is estimated that at least 10 million hectares of rubber plantations exist. The vast majority of these are located in Southeast Asia (Indonesia, Thailand and Malaysia) and in China. Trends Based on the information available, the area of rubber plantations has steadily increased by some 2 million hectares (or 25 percent) since 1990 (see Table 2.10). However, the area is decreasing in Malaysia and is expected to decrease even further in the future as older rubber plantations are being converted to other uses. Conclusions As a follow-up to the thematic studies on mangroves and bamboo undertaken for FRA 2005 and in order to obtain data on rubber plantations, which in some countries are not classified as forests, countries were asked to report separately on these three distinct forest types as part of FRA 2010. The results show that the area of mangroves is decreasing, while the area of bamboo and of rubber plantations is increasing. Although the response rate overall was fairly good, data were missing from some countries despite the fact that they had been reported in the FRA 2005 study or supplied to FAO’s statistical database on agriculture (FAOSTAT). Furthermore, analysis of the existing data on trends suggests that these should be treated with caution, so there is clearly room for improvement in future assessments of the status and trends of these selected forest types. p96 Some countries reported that areas of planted forests had been converted to other land uses during the period. For example, in Malaysia rubber plantations have been converted to other uses – in some cases oil palm plantations. p103

Annex N: Task 2 Expert Workshop Report (October 20, 2011)
72
However, the figure for 2005 is an underestimate by at least 50 million cubic metres because China, Indonesia and Thailand provided only partial data and, for example, did not include wood removals from rubber plantations. Southeast Asia and China experienced a significant shift from logging in natural forests to planted forests over the two decades. The actual wood removals in Asia are now probably higher than during the 1990s. It is not up to this study to arrange for inconsistencies between the FAO datasets. We have removed inconsistencies up to the extent possible. For some this is still unsolved. Which brings us to the next big issue.
2. THE ATTRIBUTION OF DEFORESTATION TO THE FORESTRY SECTOR AND THE ISSUE OF FOREST DEGRADATION
Forest products originate from both deforested land and degraded forest land (which remains forest land and does not classify as deforestation). Most forest products actually come from the latter, either by selective logging or through clearcut systems in plantations or natural forests. Other forest products come from sustainably managed forests, either with or without certified forest management. This points to the fact that the impact of the consumption of forest products on forests would be better assessed through a study on the link between the consumption of forest products and both deforestation and forest degradation. This was acknowledged on many occasions during the day, but at the same time the ToR are clear on the analysis of deforestation, a binary problem: forest versus non forest. A degradation study would have another focus, and would require a lot of additional data. Secondly, global consistent degradation data are not available. Therefore this study can only capture a part of the impact of the consumption of forest products, i.e. to the extent that they are causing deforestation. This issue will be explicated in the final report as a limitation to the study. On the other hand the analysis attributes part of the deforestation to the forestry sector or forest products. It does so on two accounts: 1) One time for preceding logging before conversion into agricultural land, the so-called land
rent, which is, for example, very relevant for Indonesia where plantation forestry operates in joint-ventures with logging forms, to finance the plantation (see p148, Annex D, point 4). Especially for two focus countries Brazil and Indonesia the link between this preceding logging and further deforestation has been recently published on; and
2) A second time, after checking consistency and attributing edge effects of conversion to agricultural land to the agricultural sector (see p145, Annex D, point e), through the attribution of the residual category ‘other land’. Where deforestation was not explained by any other conversion category, including reported natural hazards, conversion was attributed to the forestry sector (see p145, Annex D, point f).
A lot of discussions during the day were mainly on this second attribution. Therefore considerable attention is given to that one here. Comments on the first assumption were mainly received after the workshop and we will treat them accordingly.
i. THE ATTRIBUTION OF THE REMAINING RESIDUAL FRACTION TO THE FORESTRY SECTOR
The attribution of deforestation to the forestry sector based on a conversion from forest land to ‘other land’, based on an elimination of other causes is a dangerous thing and might undermine the support for the results of the study. It was acknowledged, however, that a part of this attribution is relevant because in some circumstances the forestry sector, and especially fuelwood gathering in dry conditions causes deforestation when conditions do not allow for regrowth of the forest. But in general, as there are not enough clear data, reports or studies on the exact link between the two it
Annex N: Task 2 Expert Workshop Report (October 20, 2011)
73
remains a dangerous attribution. Therefore, it was concluded not to do so and create an ‘unexplainable’ category for which it will be explicated clearly that it might mask some effects of other sectors. In order to have a broad support for the outcome of the study this was deemed to be the best solution. This is changed now in the calculations and the methodological Annex. Any residual not attributed to agriculture, etc. Is called ‘unexplained’ and not attributed to any production, trade or consumption. Some additional information from the discussions during the workshop to underpin this conclusion are outlined hereunder: FAOSTAT defines ‘other land’ as “land not classified as agricultural or forest area. It includes built-up and related land, barren land, other wooded land etc.” (see p28, footnote 6 of the report). It must be noted that in our definition we excluded built-up land from ‘other land’ as we applied a model to calculate this specific category (see p144, Annex D, point c) in order to already partially make up for this residual category.
• Too much of the residual ‘other land’ has been attributed to the forestry sector (fuelwood and industrial roundwood).
While many countries in their country reports report over-exploitation and unsustainable utilization of wood resources as a reason for deforestation, it is difficult to assess this as scientific literature is scarce. Therefore it is recommended not to attribute the conversion from forest land into this residual category ‘other land’ just like that. Probably part of this conversion can be attributed to the forestry sector, but it is very difficult to pick this part as there is no hard data available. We decide thus not to do that, which will reduce the real impact of the forestry sector on the ground in the overall picture and results. We will thus state that clearly. As our focus is on EU consumption and thus mainly what is internationally traded, we shouldn’t either put too much emphasis on fuelwood causing degradation or deforestation, as this is a study on its own and not too relevant for this study. Form all the above it is clear that the impact of the forestry sector is mainly an impact on the quality of the forest land and thus a degradation issue. As the report is on deforestation and not degradation, this will be explicated in the report as a main concern for estimating the impact of forest product consumption vis-à-vis the quality of forests. On the other hand, instead of containing unexplained conversions, the category ‘other land’ might as well contain unreported agricultural LU conversions. Only a year-by-year analysis of regional and national data on changes to and from the ‘other land’ category can reveal, but then also even partially, what could be in that category, if it is a switch year by year between pastures and ‘other land’. The ‘other land’ category which cannot be explained by natural hazards can be partly attributed to the forestry sector, but as well to the agricultural sector. This also needs to be highlighted when an ‘unknown category’ is created.
• It was asked whether it is assumed that all fires are naturally occurring?
This refers back to the way reporting is done for the FRA. Countries report forest land lost due to natural hazards and to other uses. While conversion to other uses usually also involves burning the land, there is a clear distinction between the two. So all other burning involved in the conversion processes are not reported as natural hazards. One could still debate whether the natural hazards have somehow an anthropogenic cause when uncontrolled burning for land speculation is concerned, but it is difficult to prove that this is done on purpose and attribute it to the agricultural sector consequently. This is especially the case for Indonesia over the period 1990-2000. One could, if one knows what exactly happened to the burned areas afterwards (secondary regrowth or conversion into agricultural land) attribute it to one category or the other, but this is difficult.

Annex N: Task 2 Expert Workshop Report (October 20, 2011)
74
Methodologically this is of course possible but we would need detailed information to input and that is lacking.
ii. THE ATTRIBUTION OF DEFORESTATION TO THE FORESTRY SECTOR DUE TO PRECEDING LOGGING
As explained on p148, Annex D, point 4, a part of the deforestation for agricultural land has been attributed to preceding logging, based on an opportunity cost calculation, resulting in 0-5% attribution of deforestation for conversion into agricultural land to the forestry sector. Considering the fact that we concluded not to attribute the unknown conversions from forest land to the residual ‘other land’ this is then the only occasion when deforestation is attributed to the forestry sector. This issue deserves thus some extra attention, also because some comments were received after the workshop on the 0-5%, and the applicability of this assumption as a generalization:
• First of all it is clear that this situation is only applicable to countries in which these agricultural and forestry systems, as well as interesting species for the wood and pulp industry, exist. For now the land-rent allocation is indifferently used for all countries and this is clearly a too big generalization as this situation is not applicable for a lot of countries outside the tropical-subtropical zone where preceding logging for commercial species and/or natural forest pulping is a common practice.
One also needs to bear in mind that in some countries natural forests are selectively logged for interesting timber species, but instead of being converted into agricultural land (palm oil for example), the forest land remains forest land, remaining species are pulped to make way for plantations of fast-growing species for the pulp industry. This cannot be captured as it is no deforestation. One could capture it partially by inverting reported reforestation rates (as this is planted on forest land remaining forest land). This is a similar effect, but doesn’t count as deforestation. This is a first thing that should be remodelled for countries where this is relevant only. A list has to be made for which this assumption is not applicable. It is believed that changing this will also repair some quite surprising synthetic results for the modelling where countries like Botswana, Zimbabwe and Venezuela popped up in the final consumption analysis.
• Secondly, the 0-5% as a general rule was questioned in received comments after the workshop. Especially for some Asian countries this portion has to be reviewed upwards as the above-described practices generate higher percentages for these countries. The application of this rule will thus partially revise the impact of the forestry sector upwards, while the unattributed residual fraction from the ‘other land’ sector has revised them downwards.
We will address both issues to the extent possible and where data are available to do so.
iii. FURTHER SPECIFICITIES ON DEGRADATION, REFORESTATION AND AFFORESTATION
As already said above, the issue of forest degradation was repeatedly raised during the workshop, especially when concerning the forestry sector and wood products. As this study is on deforestation, it is not the focus of this study, but as forest degradation could be as important as deforestation from a climate and biodiversity perspective (the philosophy behind the COM (2008) 64555), it deserves special attention in the final report. Secondly, it is important as some policies
55 See http://eur-lex.europa.eu/LexUriServ/LexUriServ.do?uri=COM:2008:0645:FIN:EN:PDF

Annex N: Task 2 Expert Workshop Report (October 20, 2011)
75
which only focus on decreasing the impact of consumption on deforestation might create perverse incentives with regards to forest degradation. Which is to be avoided. We propose to address the issue of forest degradation in a special box on degradation. The analysis of forest land use done in the study allows to do so. The issue of degradation is not only important from the point-of-view of the impact of forest products, but also for the sustainability of consumption and production, to which this study wishes to provide a puzzle piece. Off course, when considering the sustainability and the ecosystem services forests deliver, natural forests would be a more logical focus (“plantations are not forests”). For a global study, however, even data on plantations, the multitude of differences among plantations (“plantations are not plantations”) and the exact differences between natural forests (“forests are not forests”), plantations, and even some tree-requiring agricultural systems on the delivery of ecosystem services, are not yet well assessed, especially in the Global South. We thus have to work with the FAO definitions as we are working with deforestation data which are based upon these definitions. If one would place some tree-requiring agricultural systems like old oil palm plantations, small-scale shade coffee or cacao cultivation systems next to natural forests with some tree monoculture plantations with fast-growing species, one can easily question the forest definition, considering the fact that the first three systems are not forests and the last one is. A quote from the workshop which illustrates the effect of the limitations for sustainability research due to current FAO definitions and data available: “The assumption on net deforestation...is the reforestation assumed to be of the same quality as the deforestation? Is basically a forest a forest? Is that good forest or bad forest?” Other raised issues which touch upon these:
• Throughout the workshop the terms afforestation and reforestation were used interchangeably, which caused some confusion among experts.
It must be noted that the FAO definitions used are mentioned in the report on p27 and 28: “Afforestation is the act of establishing forests through planting and/or deliberate seeding on land that is not classified as forest, while reforestation refers to the re-establishment of forest through planting and/or deliberate seeding on land classified as forest, for instance after a fire, storm or following clearfelling.” “Reforestation is the re-establishment of forest formations after a temporary condition with less than 10% canopy cover due to human-induced or natural perturbations (FAO, 2000)”. Reforestation thus happens on forest land remaining forest land. These two definitions clarify that from these two, only afforestation is captured in this study to calculate gross deforestation (including also natural expansion to do so), but not reforestation as this happens on forest land remaining forest land. Afforestation implies an increase in forest area through the conversion of land not bearing forest to forested land, while reforestation does not have an impact on the size of the total area of forest.
• On this account it was mentioned that data on natural expansion of forests are very scarce. So when gross deforestation is calculated from net deforestation in this study by adding either national afforestation data or calculating it from regional afforestation rates, it thus is an under- or overestimation because natural expansion has not been taken into account.
While this is an important issue for a global view on deforestation and re-establishment of forests and is acknowledged by the FAO itself, we believe that for this study it is less relevant and want to state that the transition model has been made for this study specifically and thus with the view on consumption of products linked to deforestation, for which natural expansion is less relevant. Chapter 3 of the document thus shouldn’t be read

Annex N: Task 2 Expert Workshop Report (October 20, 2011)
76
on its own, but against the background of the study. The results from the gross deforestation calculation are not complete, and neither do they pretend to be so. We cite FAO on this matter : “No attempt was made to quantify the area of forest regenerated through natural or assisted natural regeneration in FRA 2010. Of the 233 countries and areas covered by FRA 2010, 29 countries (12 percent) reported that they did not currently carry out any afforestation or reforestation measures and 74 countries (32 percent) did not report at all for 1990, 2000 and 2005. However, most of these countries and areas are small and would not influence the global figures in a significant way. Both afforestation and reforestation measures were reported by 60 countries(26 percent), while 30 countries (13 percent) reported only afforestation and 40 countries (17 percent) only reforestation measures. Reported figures for 1990, covering the period 1988 to 1992, appear incomplete. More complete datasets were reported for 2000 (covering the period 1998 to 2002) and for 2005 (covering the period 2003 to 2007). Therefore, status and trends of afforestation and reforestation measures were analysed and interpreted for regions and subregions only for the ten year period from 1998 to 2007.” Our calculation of gross deforestation has been calculated as follows (p28): For the attribution of deforestation to main sectors based on the land-use change between forest land and the land uses representing these sectors (cropland, pastures, built-up land,…), FRA 2010 net forest area changes need to be adjusted for any conversions of non-forest land to forest land (afforestation). For countries reporting afforestation and/or natural forest re-growth, gross deforestation has been calculated based on these figures. For countries that didn’t report these figures, average regional rates derived from the published estimates in the FRA 2010 main report have been used. The reporting on ‘natural expansion’ is by no means complete in FRA 2010 although quite a number of important countries with large forest sectors did provide data to the FAO. Also, the initial results published from the remote sensing survey of 1990-2005 do include natural expansion. The FRA 2010 remote sensing survey, which is expected to come out by the end of 2011, should improve on LU and LC changes related to natural expansion of forests. Currently only the ‘initial results’ were reported in Durban providing only very rough and general numbers by very broad regions. A more detailed report is announced for January but too late for us to use in the current phase of the study.
• It was asked to be more explicit on the numbers used from the FRA 2010 tables. The footnote on p 28 referring to Table 5.7 (p96) should mention clearly which columns have been used or the table (or part thereof) should be reproduced to clarify.
We will do so. • It was asked how Illegal logging is tracked in the study.
Illegal logging is not tracked because it is about consumption of forest products leading to degradation. It is not tracked in this study because its magnitude is not quantified in official statistics and its impact on land conversion is unrecorded as well.
• How have efforts in certification, differences in yields been taken into account in the basic data?
We worked with FAO data for this global study so averages have been used. It is, for a study at this scale not feasible to discern this due to the lack of specific data. While it might be possible that more sustainably produced products are being consumed in the EU, where sensitive markets are located, the share of the certified and/or organic and trade/production statistics are very scarce.

Annex N: Task 2 Expert Workshop Report (October 20, 2011)
77
• It was asked whether from a consumption point-of-view it is important where the sourced soybeans actually come from, from either a country where deforestation takes place or a country where production systems do not require land conversion? And whether it wouldn’t be better to attribute all deforestation for soy to all soy consumed, regardless of whether it was grown on recently deforested land or not. This would result in an average content in global soybeans. In the end, it is assumed that the exact country of consumption does not change the final result, and changing the imports does not either. International markets are very fluid. Time permitting, the LANDFLOW results can be analyzed to quantify the share of EU27 in total global soybean consumption or the EU27 share in total soybean imports.
We believe the analyses made reflect the link between consumption and deforestation and therefore also give a good basis to analyse the underlying policies and consumption patterns. The proposed average weighing of deforestation would rather be a value judgement. We are aware that this is an important issue for the following policy tasks, as changing imports of products from countries where they cause deforestation to countries where they don’t cause deforestation would not change the final result, as other importing countries with less sustainability concerns will fill up the gap quickly. Although it is not possible to discern sustainable products from unsustainable ones in a study on a global scale and due to the lack of consistent trade data on the former, the averaging-out would neglect this difference, if it were applied in possible future sustainability analyses.
• From the analysis it is clear that a lot of deforestation stays in the country of origin: 128 Mha of deforestation over the analysed period, of which 37Mha enters international trade, and 8% of the total is consumed in the EU27+. This is an important result to be explicated in the final report.
We have highlighted some of these findings in our report. • For the specific results for Brazil, a result that could require further details is linked to the
fact that most deforestation linked to pasture expansion in Brazil occurred in the Amazon, and foot-and-mouth disease is a barrier for this region's export to the EU. Of course, meat exports from other Brazilian regions and substitution in the domestic market have occurred but the causal links shall then be better explained, because the consequences for the analysis are different (It is not necessarily so much the export of meat exports to Europe that drove the expansion of pasture but rather domestic demand increase). Moreover, a puzzling assumption is made on page 36 : "although the total amount of reported pasture areas remained fairly constant after 2000, ruminant livestock numbers increased until 2008. According for this substantial increase of livestock number, pasture attributed to deforestation was estimated to be ranking in the order of te 1990-2000 period". I do not understand why such assumption had to be made and of course it directly increases the amount of deforestation linked with EU meat import, no? Doing such means that (i) under-reporting of cattle numbers before 2000 is neglected, whereas it might be important (ii) cattle ranching intensification, particularly in Southern Brazil, is completely neglected.
There have been comments in the workshop in both directions, namely to be less specific as to the origin of consumption (“what matters is the amount of soybean consumed, as

Annex N: Task 2 Expert Workshop Report (October 20, 2011)
78
share in world total, and total deforestation contained in soybeans”), as well as to go to more detail and discriminate between “good” and “bad” commodities within a country. The latter would very quickly lead to arguments similar to what is said in the iLUC discussion. In the approach used in this study, the deforestation associated with a commodity is spread equally to all use categories be it national use or for export.
b. INTEGRATION OF THE RESULTS OF BOTH MODELLING RESULTS
In general it was commented that a better integration of the different modelling exercises should be done. Specifically the following comments were given:
• The exact architecture of the models, the combination thereof and the added value of having two final models should be better explicated in the final report.
This will be better explained in the next version of the report. • What are exactly the differences between GTAP and LANDFLOW and how can these
differences influence the results of each of them and where do they give the same message?
We will make sure that in the new version these issues are explained better. • There were general questions on the issue of non-food consumption like furniture and
leather products as they are perceived to be very important.
LANDFLOW can only partially address these issues as these products are processed up to the level that they are not traceable by FAO statistics anymore. For leather this is up to tanned leather and if they are processed into shoes in China and then re-exported to the EU27, they are not tracked. Furniture cannot be tracked with LANDFLOW as the categories used by FAO go up to sawn wood, wood panels, wood residues, chips and particles, and wood pulp. It must be noted that leather products are treated by GTAP in slide 21 and merged with the textiles sector in slide 20 to make sure they were mentioned somewhere -just to illustrate their relative importance in the overall picture. Slide 21 is figure 48 in the report and ranks leather products (bottom right) as 11th with 3% of total deforestation embedded in products in 2004. At the same time figure 48 and the issue of leather products demonstrate well how final consumption works. The bottom right pie chart is the sum of the other pie charts and thus deforestation for leather products is composed of 15kha (7% of pasture deforestation-see bottom left pie chart), 4kha (3% of deforestation for wood extraction) and a remaining (not shown in upper left pie chart) 6kha (cropland deforestation). While the deforestation embodied in products from pastures is quite straightforward, the deforestation due to logging and cropland conversion is less straightforward but can be found in a multitude of additives from these sectors which are used to produce the final leather products. It is likely that for this study the impact of furniture on deforestation will be much smaller than expected by some as furniture is mainly exported from East Asia and made from wood grown on plantations, which thus in general does not classify as deforestation.
c. POLICY-RELATED QUESTIONS AND COMMENTS FROM THE WORKSHOP
Due to time constraints the final broad discussion on first policy ideas was not scheduled as planned, though during the workshop policy issues came up. They are outlined hereunder.

Annex N: Task 2 Expert Workshop Report (October 20, 2011)
79
Additionally it was asked the participants to send in additional policy comments and ideas after the workshop. These are also added to this report.
• It was asked how the sequencing of the study is set up, especially for the policy analysis. How will that be done?
Based on the analysis, a screening of the policies will be done. After this analysis we will go into propositions for new soft or hard legislation, review of existing policy, bilateral policies and so on. It could take many forms. I was emphasized that a bilateral focus on a product-origin country in a World with increasing international trade could just cause leakage as consumers are all around the World and can be replaced easily, which does not really address the problem, especially regarding emerging economies impacts. Therefore the analysis of the land use is also a very valuable part of the analysis as it points towards sourcing countries either with or without deforestation; a situation which can quickly change.
• What is likely to happen instead of what has happened, but it is the basis to start from. What about the emerging economies? What about recent developments like biofuel policies, migration of forest industries to the Global South, setting up plantations? How will be dealt with the world dynamics?
New developments are taken up to the extent they are captured by the most recent FAO data in FAOSTAT. Biofuels is a very recent phenomenon (since 2001-2002), it is very policy-driven, so they are partly reflected in the data of the last decade analysed, though it must be noted that at the time statistics were not ready to record some of the phenomena. Fot the issues above: FAO considers plantations as forests, still. For crops used as biofuel feedstock, it depends on the statistical data whether they are easily discernable from the same crops and derivatives used for other purposes. Stationary biomass for heating and electricity (mainly wood and more specifically wood pellets) is an even more recent phenomenon, as is illustrated by the fact that even EUROSTAT only records them since 2009 as a specific category. We will take into account the recent developments when the policy analysis will roll out. While data are not sufficient to have a quantitative analysis, indicative scenarios for these recent developments are being made. Secondly, the policy analysis and development will be done with a representative stakeholder group who are well up-to-date on the most recent threats and opportunities.
• Will only the negative impact of EU consumption be assessed? It might be possible that there is a positive impact of international trade for the sustainability of production in third countries through for example certification.
See below.
ADDITIONAL COMMENTS RECEIVED BY EMAIL: • It would be dangerous and counterproductive to focus on commodities-country of
deforestation combinations only for the policy analysis. Especially because the important countries from the current analysis are countries which already reduced or are reducing their deforestation thanks to bilateral, multilateral targeting, consumer group and NGO pressure. Leakage to countries where this isn’t the case yet should be taken into account when policy analysis and future policy development is done. On this account it would be good to also focus on the second in line, based on the geographic, climate and agricultural-system specifics of those countries, existing trade relationships with the EU. Based on that,

Annex N: Task 2 Expert Workshop Report (October 20, 2011)
80
it would allow identifying the countries where pro-active policies can help to prevent large-scale deforestation.
• Maybe look at differences between European countries, not to point out "good" and "bad" countries, but in order to understand better what makes some consumption patterns more or less prevalent, maybe to help design country-sensitive policy advices in terms of consumption.
• EU’s consumption might be more benign than average. Similarly the quality of those exports to the EU might provide the EU with greater leverage than its share of a given country’s exports might indicate. EU’s regulations like the due diligence and supply of illegal timber could, of properly implemented achieve domino effects.
Annex 1 Issue paper for the expert workshop Hereunder we outline some issues contained in the report on Methods and preliminary results to help guiding the discussions during the workshop. While the list is not exhaustive and you may want to add others during the discussions, we believe the following issues deserve some specific attention and your comments are welcome:
ABOUT THE PRELIMINARY RESULTS56
They are described in Chapter 2. • Are there any results that are unexpected, surprising? • Do you possess or are aware of other results that confirm or contradict the study results? • Are there other ongoing or completed studies, also targeting different import destination
(e.g. China, USA, Russia) of which you can share information? For example, based on our analysis: - one of the trends that can be identified is that a strong impact of EU consumption on deforestation is in South America, and more in particular in Brazil through both the import of animal feedstocks and direct import of meat, while deforestation studies, in general, link consumption to all the 3 tropical forest areas (Amazon basin, Congo basin and South East Asia); - deforestation links to demand for oil palm from Indonesia seems to be higher in relation to imports into China than into the EU.
ABOUT INPUT DATA:
In order to use consistent international data we have used data input from FAO (FAOSTAT data for land use, production, etc.) and FRA2010 for deforestation data. We know the reliability of some of these data, especially deforestation rates are debatable and FAO is doing a remote sensing survey to assess the reliability thereof. FAO data are based on nationally reported land-use data and deforestation data. Some other studies focus rather on land-cover, with other constraints. In the transition model (Chapter 3), we worked with gross deforestation data, as opposed to net deforestation, because gross deforestation data are more closely linked to the actual land conversions which take place, and to the subsequent production of agricultural commodities on
56 Some data and analysis are not yet available but the preliminary results already provide a good basis for discussion

Annex N: Task 2 Expert Workshop Report (October 20, 2011)
81
that land. For this purpose we calculated gross deforestation from net deforestation, and used regional afforestation rates where FRA 2010 country reports did not report national ones (i.e. reported net deforestation + afforested areas = estimates of gross deforestation, see chapter 3.3.1 and following).
ABOUT METHODOLOGY:
1) The transition model and its assumptions in Chapter 3, and especially the method of attribution of deforestation to sectors and commodities as explained in Annex D, drive our results. For the first time the ‘externality’ deforestation was developed and calculated based on certain assumptions and available international data, so we want to dedicate enough time to the discussion about this modelling. Some specific issues:
a) The topic of iLUC (Indirect land use change = land use changes that are not directly caused
by a certain cause, e.g. biofuel crop production, but that are caused by the displacement of certain crops (e.g. food crops), due to the introduction of the biofuel crops) is a highly debated topic since some years. The topic has been advocated for biofuels, but is in principle, applicable to all land-use changes. In our study we have addressed this issue at the national level, but not at the international level.
b) A part of the deforestation has been attributed to wood extraction (logging for industrial roundwood and fuelwood gathering) . This approach is not widespread in international study practice, but is based on: i) unaccountable land-use conversions from forest land to non-agricultural land (but on many occasions highlighted in the national reports as wood extraction leading to deforestation; and ii) a first land rent before conversion into agricultural land (cfr. Logging incomes to lower plantation investment costs for palm oil plantations).
We welcome suggestions on how deforestation (or land use) can be better integrated in sustainability assessment tools. Environmental indicators such as the Ecological Footprint (EF) do not take into account the initial impact of a conversion of forests into other land uses when land use is concerned. Secondly, indicators such as the EF allow for (and even promote) increasing biocapacity, thereby focusing on the productive ecosystem services mainly, while neglecting other ecosystem services provided by land. This might cause decreases in other ecosystem services. Other methods are available such as HANPP (Human Appropriation of Net Primary Production) and others you may wish to propose/comment on. Comments on the overall approach and chosen models to respond to the ToR. Annex 2 Attendance List Name Affiliation
Achard Frédéric JRC, EUBarrett John Leeds University, UKBoucher Douglas Union of Concerned Scientists, USAHarms Bette Wageningen University, the NetherlandsWilting Harry PBL, the NetherlandsHewitt James Independent consultant on markets for wood-based products and their trade, UKHorner Kate Friends of the Earth, USAHoughton Richard A. Woods Hole Research Center, USAKastner Thomas University of Klagenfurt, Austria

Annex N: Task 2 Expert Workshop Report (October 20, 2011)
82
Kauppi Pekka University of Helsinki, FinlandKoh Lian Pin Swiss Federal Institute of Technology, SwitzerlandMeyfroidt Patrick UCL, BelgiumMulligan Declan JRC, EU Ometto Jean P. INPE, Brazil Piketty Marie-Gabrielle CIRAD, FranceRoberts Mark W. EIA, USA van Helden Flip Dutch Ministry of Economic Affairs, Agriculture and Innnovation, the Netherlands Verwer Caspar Wageningen University, the Netherlands
Attending experts and support staff from the consortium Name AffiliationCuypers Dieter VITO, BelgiumLust Arnoud VITO, BelgiumGeerken Theo VITO, BelgiumFischer Günther IIASA, AustriaPeters Glen CICERO, NorwayDe Smet Lieven Leuven University, Belgium Dauwe Tom VITO, BelgiumGorissen Leen VITO, BelgiumVangoidsenhoven Marieke VITO, BelgiumBultynck Katrien VITO, Belgium Attending experts from EC Commission Services Name AffiliationTorta Giuliana DG ENV E2Gumbert Andreas DG AGRI DDG3 H4Rackonzay Zoltan DG ENV B1Muninger Maximilian DG AGRIGafo Maria DG AGRI Lazarova Raya DG ENV E1Lazzerini Irina DG ENV E1Bosquet Mathieu DEVCO DGA1 C2Bruneval John DEVCO DGA1 C2Agne Stefan DGCLIMA A1Eva Hugh JRC Oyvind Vessia DG ENER C1

Annex O: Task 1 Conclusions: Inception Report Summary
83
ANNEX O: TASK 1 CONCLUSIONS: INCEPTION REPORT SUMMARY
The proposed approach to analyze the trade of commodities issued from deforested land uses Input-Output modelling of an externality in supply chains and international trade i.e. ‘deforested land embedded in trade’ in analogy with other ‘traded’ externalities such as greenhouse gas emissions. On the basis of literature, FRA 2010 deforestation data and FAO land-use data typical land-use change transitions in specific regions and countries are modeled in the ‘transition pathways’ model. Combined with the land-use information from the LANDFLOW model, constructed with FAOSTAT data on commodities, this results in ‘deforested land in commodities’, i.e. deforestation will be attributed to the different commodities grown or raised on the deforested lands. The LANDFLOW model equally generates ‘land in commodities’ based on Supply Utilisation Accounts data (for agricultural commodities) and Wood Balances (for forestry products) as provided by the FAO. Both ‘deforested land in commodities’ and ’land in commodities’ will be fed into the trade matrices of three different models. The LANDFLOW model analizes international trade of these commodities and their factors ‘traded’ along, based on physical data. The monetary models used are TSTRADE and GMRIO. The trade matrices will be able to differentiate ‘deforested land embedded in trade’ and ‘land embedded in trade’ from land and deforested land used for domestic production in third countries. The combination of these three models allows for answering different policy questions. The I-O modeling of this ‘deforested land embedded in trade’ allows for analyzing the current consumption of selected goods by origin analysis (where deforestation takes place), destination analysis (which are the consumed goods causing this), structural path analysis (which supply chain links production and consumption), and temporal decomposition analysis (what factors have changed over time). Foresight scenarios in consumption trends will be developed, in particular for agricultural and forestry commodities as a function of population and per capita food consumption levels. Deforestation will be calculated for different degrees of EU reliance on imported agricultural products and different trade compositions. LANDFLOW equally generates land-use and land-use change indicators linked to different commodities. The developed indicators will allow for an assessment of the overall impact of EU consumption on deforestation. The main contribution of this study towards the monitoring of the progress of EU consumption towards sustainability is the contribution towards the improvement of the existing basket of indicators, especially the land-use related ones like the Ecological Footprint (EF) and/or relevant components thereof, and the assessment of the possibility of generating an add-on indicator on deforested land use. Results and methodology will be discussed in an expert workshop and final results will be disseminated to the general public through the appropriate communication channels. Stakeholders from a broad spectrum of stakeholders will be involved throughout the whole project to provide their input in the different phases from methodology development over commenting on the results to the evaluation of policy options.

Annex O: Task 1 Conclusions: Inception Report Summary
84
The analysis will result in the identification of the Community policy areas with the greatest potential for reducing pressure on forests in third countries through the use of a basic causal model. Later on potential options to reduce the impact of EU consumption and policies on deforestation will be proposed.
METHODOLOGY FOR ESTIMATING TRANSITION PATHWAYS FOR DEFORESTATION
DEFORESTATION DEFINITIONS AND CHOICE OF DEFORESTATION DATA
Forest change dynamics are complex and vary from region to region. They include cycles of forest land reduction and growth induced by both human activities and natural causes. Moreover, countries or studies may apply different definitions of “forests” according to specific classification systems, assessment methods and monitoring frequencies. It is therefore difficult to compile consistent data sets for major forest types and forest land development globally. At the same time the attribution of consumption patterns to deforestation requires a complete and consistent global picture of forest area and agricultural development since markets are closely interlinked by global trade.
For the attribution of drivers of deforestation and associated commodities derived from deforested land (timber and pulp) and use of land after deforestation (pasture, cropland, infrastructure, or mineral extraction), the question arises whether ‘net deforestation’ or ‘gross deforestation’ rates should be associated with the drivers, an issue closely related to the dynamics of forests as well as the quality of forests. Time dimension is of critical importance for the estimation of gross and net deforestation rates.
First of all it needs to be clear what is understood by forests. Many forest definitions exist and global efforts, trials on harmonization of these definitions have been conducted on many occasions, and proposed and used definitions are being contested. The best available and ‘best’ harmonized data of the state of world’s forests are the ones generated by the Food and Agriculture Organisation of the United Nations or FAO (FAO 2010, FAO 2011) and the FAO defines a forest or forest land as:
“Land spanning more than 0.5 hectares with trees higher than 5 meters and a canopy cover of more than 10 percent, or trees able to reach these thresholds in situ. It does not include land that is predominantly under agricultural or urban land use.”
Therefore, deforestation can be defined as the process that converts forest land that meets these criteria to other land that doesn’t meet these criteria. Or as defined by the FAO:
“deforestation implies that forests are cleared by people and the land converted to another use, such as agriculture or infrastructure. Also natural disasters may destroy forests, and when the area is incapable of regenerating naturally and no efforts are made to replant, it too converts to other land.”(FAO 2010)
Or
“The conversion of forest to another land use or the long-term reduction of the tree canopy cover below the minimum 10 percent threshold.”(FAO 2004)
Explanatory notes

Annex O: Task 1 Conclusions: Inception Report Summary
85
1. Deforestation implies the long-term or permanent loss of forest cover and implies transformation into another land use. Such a loss can only be caused and maintained by a continued human-induced or natural perturbation.
2. Deforestation includes areas of forest converted to agriculture, pasture, water reservoirs and urban areas.
3. The term specifically excludes areas where the trees have been removed as a result of harvesting or logging, and where the forest is expected to regenerate naturally or with the aid of silvicultural measures. Unless logging is followed by the clearing of the remaining logged-over forest for the introduction of alternative land uses, or the maintenance of the clearings through continued disturbance, forests commonly regenerate, although often to a different, secondary condition. In areas of shifting agriculture, forest, forest fallow and agricultural lands appear in a dynamic pattern where deforestation and the return of forest occur frequently in small patches. To simplify reporting of such areas, the net change over a larger area is typically used.
4. Deforestation also includes areas where, for example, the impact of disturbance, overutilization or changing environmental conditions affects the forest to an extent that it cannot sustain a tree cover above the 10 percent threshold.(FAO 2004)
It is clear from the above that the process of forest degradation does not fall under this definition. Although we recognize the impact of forest degradation on the ecosystem services forests locally and worldwide deliver, the reduction of forest cover in the spectrum from full canopy cover to a 10 percent canopy cover, is a study on its own, and an assessment of forest degradation would lead beyond the scope of this study.
As opposed to deforestation, an increase in forest area occurs through afforestation (plantation forests and reforestation) or natural expansion of forests (natural regeneration on e.g. abandoned agricultural land).
It is important to highlight that the FAO definitions are based on land-use classes rather than land-cover classes. Land-cover assessments might result in other data as the approaches differ, e.g. temporarily unstocked land (land on which recently trees have been cut) would be classified as deforestation when using the land-cover approach (Hansen et al. 2010), while the land-use approach treats this as a temporary coverless state in forest land.
In the framework of this study, where a link has to be established between deforestation and consumption, the land-use approach is the best way to go as this approach is clearly linked to the anthropogenic factor. Forests are being cleared for commodity production and by consequence the land use changes. Of course, land cover changes too in this case. On the other hand, when land cover changes temporarily (fire in forest land, temporarily unstocked areas with clear felling harvest practices) land use may still remain the same.
Clear definitions on gross and net deforestation are not easily found. A definition of gross deforestation can be deduced from the definition of net deforestation.
Net deforestation or net change in forest area is: “the net change is the sum of all negative changes due to deforestation and natural disasters and all positive changes due to afforestation and natural expansion of forests.” (FAO 2010)

Annex O: Task 1 Conclusions: Inception Report Summary
86
Gross deforestation or gross change in forest area, therefore, can be defined as the sum of all negative changes due to deforestation and natural disasters.
The only international time series of global land use and forest area development is provided by the FAO. The FAO, in cooperation with its member countries, has compiled major assessments of the world’s forest resources at five to ten year intervals since 1946 with the Global Forest Resources Assessment 2010 (the FRA 2010) being the most comprehensive assessment to date (FAO 2010). For FRA 2010, countries provided information on their forest area for four points in time. FRA 2010 reports ‘net deforestation’ for all countries averaged over the period 1990-2000, 2000-2005 and 2005-2010. In Figure (Annexes) 20 the difference between gross and net deforestation is graphically represented: gross deforestation takes only into account the arrow to the right; net deforestation takes into account both the arrow to the left and the one to the right.
Figure (Annexes) 20 Gross and Net deforestation from a Land-Use approach (from FAO, 2010)
A first glance at the results from the FRA 2010 reveal some unreliable results. Knowing that FRA data are compilations of reported national land-use data and that some of these data can depend upon which administration reports the data and that some countries do not have the necessary capacity to assess their national land-use, scrutinizing these data might be necessary. Where possible, complementing these data with other reliable estimates could be done.
FAO, in collaboration with countries and key partner organizations, is currently undertaking a global remote sensing survey – based on systematic sampling of some 13,500 sites around the globe – to provide additional and comparable information on deforestation, afforestation and natural expansion of forests at regional and biome levels from the period 1990-2005. Results are expected by October - November 2011. (see http://www.fao.org/forestry/fra/remotesensingsurvey/en/). We established communication with the FAO unit (Rémi D’Annunzio) conducting the survey and will stay in close contact to be kept updated.
In past decades, the vast majority of deforestation has been attributed to conversion of tropical forests to agricultural land (Rudel 2007; Hansen et al. 2010). At the global level, afforestation measures, together with natural expansion of forests in some countries and regions, have partly compensated for deforestation to a net loss of forest area of 8.3 million hectares annually in the 1990s and to 5.2 million hectares per year in the last decade, compared with the gross rate of loss through deforestation and natural causes, estimated at 16 million hectares per year in the 1990s and 13 million hectares per year in the last decade (FAO, 2010). Differences between gross and net deforestation are respectively 7.7 million ha and 7.8 million ha.
Although it looks straightforward to put these figures on the account of plantation and secondary forest establishment, it isn’t. As long as only national aggregated data are generated and no land-use change matrices are used, the real land-use changes that took place cannot be assessed unless time intervals are smaller than a year. For example plantations can be established on lands with

Annex O: Task 1 Conclusions: Inception Report Summary
87
secondary forests and when land-use change matrices are not available this cannot be tracked. Adding the simple sum of plantation establishment and secondary forest regrowth to net deforestation does not result in gross deforestation numbers as transitions between them are not tracked without these matrices (Figure (Annexes) 21).
Figure (Annexes) 21 Land-cover dynamics following forest clearing or logging. Land-cover transitions between agriculture, secondary forest, degraded land, and other land uses. It is critical to know how much land is put to the different uses, and how long it remains in those uses (from Ramankutty et al. 2007)
In data reported by countries and compiled by the FAO net deforestation is more readily available than gross deforestation. Data on afforestation and reforestation was introduced for the first time in FRA 2010 in order to provide better information on forest area change dynamics. Data analysis indicates that there are still significant data issues to be resolved before a complete balance sheet can be reported by countries displaying forest loss (through deforestation and natural causes) and forest gain (through afforestation and natural expansion of forests) over time.
Hansen et al. (2010) quantified gross forest cover loss (GFCL) between 2000 and 2005 using remote sensing analysis and therefore applying a land-cover approach, an approach mostly used when remote sensing is used to assess deforestation (in this case forest cover loss). In the boreal biome the majority (58%) of GFCL was due to naturally induced fire dynamics (Potapov et al. 2008), and thus not (directly) linked to consumption of wood products. The remaining 40% of boreal GFCL is attributable to logging and other change dynamics such as insect and disease-related forest mortality. For the same period Russia and Canada report in FRA 2010 no or negligible decreases in total forest areas, i.e. no net deforestation.
In contrast in the humid tropics the difference between gross and net deforestation is often closely related to forest degradation and biodiversity loss. For example primary forests account for 36

Annex O: Task 1 Conclusions: Inception Report Summary
88
percent of global forest area, but have decreased by more than 40 million hectares since 2000, a decrease largely due to reclassification of primary forest to ‘other naturally regenerated forest’ because of selective logging and other human interventions (FAO 2010).
In this study, the core target is attribution of deforestation (in terms of area) to consumption patterns of whole economies (here the countries of the European Union), and deforestation is defined as the permanent removal of forest cover and conversion to other land use (e.g. agricultural or infrastructure) then a country’s ‘net deforestation’ rate seems an appropriate measure for allocation to consumption. However, it should be noted that the consideration of only net deforestation might veil important forest conversion processes ongoing especially in the tropics where primary forest extent is reduced while plantations and secondary forests are expanding.
In this study we allocate net deforestation rates as reported in FRA 2010 to production, trade and consumption. For selected regions, where gross deforestation data are available (e.g. the Amazon) a sensitivity analysis will aim at discussing implications of gross versus net deforestation rates to drivers of deforestation.
ATTRIBUTION OF USE/TRANSITION PROBABILITIES TO DEFORESTATION
Many different commodities are grown or raised on the same land area consecutively, while, this area has only been deforested once. Moreover, some commodities are already sourced from this land when deforestation has not taken place yet, incentivizing deforestation through forest degradation .
To estimate the share or relative weight of impact caused by food and non-food commodities, an analysis of the drivers of deforestation and cause-consequence relationships is needed. As the causes of deforestation are multiple, complex, and vary from location to location and over time with cascades of drivers, a clear cause-consequence relationship is difficult to establish (e.g. Geist and Lambin 2001; Ramankutty 2007, 2010).
Typical cycles of land-use change differ from region to region but usually start with deforestation for infrastructure development for the extraction of forest commodities, ores and fossil fuels. Road construction does not cause much deforested land as such, but is an important trigger, which is often followed by economic timber extraction and/or wood fuel use at subsistence level as forests are being unlocked. In some regions timber extraction is done by clearcutting and thus deforestation, in other regions the forests species composition and commercial value rather leads to selective logging systems and can be seen as forest degradation in a first phase. All or part of degraded and deforested areas may be replanted or naturally re-grow to secondary forests, but in many cases the above processes are the precursors of a later clearing (Cederberg et al. 2011, Fearnside 2005; Asner et al. 2006). In some areas forests are cleared primarily for agricultural expansion. However, usually conversion to agricultural uses is preceded by at least selective logging when this first rent on the land is economically interesting. Agricultural uses comprise both grassland for cattle ranging and cropland expansion.
The critical issue is how to attribute a country’s deforested areas to subsequent products of the economy, which can be directly or indirectly related to the deforested land. This study aims for countries with net deforestation to describe annual transition probabilities for allocating deforested areas to the following main use categories: i) forestry products; ii) livestock; iii) crops; and iv) other.
Figure (Annexes) 22 shows the ‘transition pathways’ model (inside the box) and how it is linked to the first part of the LANDFLOW model (lower part outside the box, see 0.0.0.�) to determine for which commodity deforestation took place.

Annex O: Task 1 Conclusions: Inception Report Summary
89
Figure (Annexes) 22 Estimation of ‘transition pathways’ of deforested areas for primary agricultural and forestry commodities
Literature review will be a major source of providing transition pathways (e.g. for the Amazon: Fearnside 1997, 2005; Asner et al. 2005, Asner et al. 2006). The FAOSTAT time series (1990 to 2008) land resources database allows for the computation of land-use transition balances for the main categories forest, cultivated land, permanent grassland and other land. In addition FAOSTAT data on cropland expansion, development of livestock numbers, and timber extraction rates, will be used to estimate transition pathways. Where possible, and especially in countries with high deforestation rates (e.g. Brazil, Indonesia), sub-national agricultural and forestry statistics will be consulted to provide additional information for attributing observed deforestation to the main sectors and activities.
The IIASA spatially explicit land resources database includes distribution of land-use categories and year 2000 downscaled statistical data of main agricultural commodities. For the globe the spatial resolution is 5 by 5 minutes (longitude/latitude). For Brazil this data is available for a 30 arc-second grid. These databases provide an objective basis for relating individual commodities to agricultural land expansion.
In the case of cropland expansion direct and indirect effects will be included by allocating all crop expansion, whether into the deforested areas or elsewhere in the country, to the transition probabilities of the respective crops/livestock. In this way, for example, not only expanding soybean fields, which are grown on former forests in the Amazon will be attributed to deforestation, but also the expanding sugarcane areas in southern and central Brazil will carry a share of the burden for deforestation in proportion to its overall importance in the cropping sector.
Obviously considered timescales are of major importance for estimating transition probabilities. For example land-use changes following deforestation in the Brazilian Amazon are dynamic and complex and involve different cycles of clearing, grazing, cultivation, and secondary forest regrowth (Foley 2007). In theory accounting requires consideration of full land-use dynamics following deforestation until a new steady-state has been reached. However, chosen time periods are always arbitrary to some extent and are restricted by data availability.
Transitionpathways
FRA2010 deforestation
Land resourcestime series
Literaturestudies
Other Cultivated Pastures Forest
Crop1 Cr2 … Cr n Ruminants FuelwoodInd.RwdPrimaryProduction
Land use

Annex O: Task 1 Conclusions: Inception Report Summary
90
For data availability and practical reasons, this study aims for country-specific averages of transition probabilities related to the periods of reported net deforestation (i.e. 1990-2000, 2000-2005 and 2005-2010). Given these difficulties and uncertainties in describing accurate transition probabilities, assumptions will be kept simple and transparent. Sensitivity analysis will be used to highlight the range of possible results for the attribution of deforestation.
METHODOLOGIES FOR ESTIMATING FACTOR EMBODIMENTS IN INTERNATIONAL TRADE
LITERATURE REVIEW
→ Introduction
A common task in economic and environmental modeling is to estimate the “factors” embodied in supply chains, and particularly international trade. We use the generic term “factors” here to cover economic factors (such as labour and capital) and environmental externalities such as emissions to air (CO2 etc), land use, and deforestation. The factors are not usually a physical part of the international trade flows, but are used in the production of goods and services either directly or indirectly in the supply chain. Example applications include estimating the total labour required to increase economic output by a given amount or to estimate the CO2 emissions to produce the products imported into a country. There are a range of methods which can be used to estimate the factor embodiments: from detailed bottom-up approaches such as life cycle assessment (Finkbeiner et al. 2006) to generalized input-output analysis (Miller and Blair 2009). In this review we focus on methods which are appropriate and feasible for estimating ‘land embedded in trade’ and ‘deforested land embedded in trade’ in internationally traded products. We identified six suitable groups of methodologies:
• Product Level Bilateral Trade Approach (PBTA); • Extended Product Level Bilateral Trade Approach (E-PBTA); • GDP Approach (GDPA); • Extended GDP Approach (E-GDPA); • Sector Level Bilateral Trade Approach (SBTA); • Generalized Multiregional Input-Output Analysis (GMRIO).
Note that there are – apart from MRIO and (to some extent) EEBT (see Peters 2008) – no established names for the different approaches in the literature. We will introduce the approaches in the subsequent part of this section and identify the most suitable approaches for the purpose of this project, based on a set of review criteria.

Annex O: Task 1 Conclusions: Inception Report Summary
91
→ Review Criteria
From the project description and proposal the following project requirements can be identified:
1. Provide a baseline of ‘deforested land embedded in trade’ and ‘land embedded in trade’ in imports consumed in the EU;
2. Provide a more detailed analysis of ‘deforested land embedded in trade’ and ‘land embedded in trade’ of key products imported to the EU;
3. Provide a detailed analysis of EU final consumption including the analysis of drivers, supply chains etc.
4. Trace internationally traded products via multiple countries;
Based on the project requirements we have constructed a set of review criteria to establish which method(s) should be used. Often there is not one methodology that is better than all others. It is more appropriate to discuss the most adequate methodology for answering a particular research question given available data. In this section we introduce a set of review criteria to help us identifying the most adequate methodologies for the research tasks in this project:
• Uni- versus Multi-Layer Trade: Methods differ in their capability of tracing international trade flows via multiple countries. Uni-layer trade methods only consider the direct bi-lateral trade flows between countries and regions. In a uni-lateral trade approach factor embodiments such as ‘deforested land embedded in trade’ and ‘land embedded in trade’ are assigned to direct trade partners (e.g. countries B and C) of a country regardless whether the traded product is consumed in the receiving country or further processed before export.
Figure (Annexes) 23 Stylized example for uni-layer trade methods. Only direct trade of country A with countries B and C can be considered.
Multi-layer trade methods can trace indirect trade flows via multiple countries and assign factor embodiments to the consuming country. Factor embodiments of international trade flows are only assigned to the direct trading partner, if the traded product is consumed in that country (dashed black arrows). If the product is further processed and (re)exported to a third country and consumed there, the factor embodiment is assigned to the third country. These are the routes A→B→C and A→C→B in Figure (Annexes) 24.

Annex O: Task 1 Conclusions: Inception Report Summary
92
Figure (Annexes) 24 Stylized example for multi-layer trade methods. Direct (black arrows) and indirect trade via multiple countries (yellow [A to C via B] and red arrows [A to B via C]) can be considered.
• Consumption concept: Methods differ in terms of the definition of consumption. Many physical accounting approaches are based on the concept of apparent consumption. Apparent consumption is the amount of product produced within a country plus imports minus exports. The concept does not distinguish between different uses within a country (e.g. industry and final use).57 Some authors additionally distinguish between changes in stocks. Methods based on standard environmental economic accounts (United Nations Statistics Division 2005; European Commission et al. 2009), usually adhere to the concept of final consumption. Final consumption refers to consumption activities by individual households or government to satisfy individual or collective requirements (European Commission et al. 2009). If using final consumption, it is necessary also to consider intermediate consumption, which comprises all goods and services consumed by industries in the production of final goods and services, and this is ultimately allocated to final consumers via the supply chain. Consequently, apparent and final consumption are conceptually quite different with the former not including a full supply chain (apparent consumption) and the latter considering the supply chain in detail (final consumption). As a consequence, assigning factor embodiments to a consuming country means different things depending on which consumption concept is applied. Ultimately, the two consumption concepts respond to different policy or research questions.
• Supply chain coverage: Methods are capable of tracing supply chains to different degrees. Depending on the research question, it is necessary to trace global supply chains of products associated with high levels of ‘deforested land embedded in trade’ and ‘land embedded in trade’ across countries and industries. Supply chain coverage is relevant in the context of this project for two reasons: First, the more comprehensive and detailed the supply chain coverage, the better a particular method can assign factor embodiments
57 The concept is also not capable to trace wastes and losses in the production process (e.g. conversion losses in the case of energy).

Annex O: Task 1 Conclusions: Inception Report Summary
93
to a consuming region. Second, analysing the supply chain of key products provides a better understanding of how deforestation activities enter a particular product system. The identification of deforestation hotspots in the supply chain might enable discussions of how deforestation associated with a particular product system might be avoided in the future. Supply chain coverage of different methods can be limited from various viewpoints. Some methods do not provide any supply chain description, other only cover a few stages of the supply chain, and other methods provide a comprehensive description of the domestic supply chain. Only some methods are capable of tracing global supply chains of final products across countries and industries.
• Aggregation level: Different methods for assigning factor embodiments of internationally traded products to consuming countries work at different aggregation levels. Here we will distinguish three aggregation levels: Some methods trace factor embodiments of individual products. We will refer to this as micro- or product level. Other methods undertake the analysis at the meso- or sector level, while other work at the macro- or country level.
• Time coverage: While all methods are generally capable to trace factor embodiments of
internationally traded products across time, data requirements and availability can impose limits in terms of temporal coverage. We distinguish between methods based on data available for annual time series analysis and methods based on data only available for individual years.
• Measurement Units: Theoretically, no differences in the allocation of factor embodiments of internationally traded products to consuming countries should arise through a choice between monetary and physical production and trade data as long as both are measured consistently at the individual product level in a world of homogenous prices (Suh 2004; Dietzenbacher 2005; Minx 2008). However, in reality price differentiation and fluctuations occur. In this review we therefore distinguish between methods based on monetary and physical data. We consider physical data as being superior for the allocation of factor embodiments of internationally traded products to consuming countries as environmental pressures such as deforestation are determined by the quantities of products consumed. Fluctuating prices only add noise in such exercises.
→ Review of available methods
• Product Level Bilateral Trade Approach (PBTA)
The PBTA is frequently used to allocate factor embodiments of internationally traded products to countries of final consumption. Application areas include human appropriation of net primary production (HANPP) (Erb et al. 2009), net primary production (NPP), biomass flows (Krausmann et al. 2008; Kissinger and Rees 2010), land use (Würtenberger et al. 2006), water use (van Oel et al. 2009; Hoekstra et al. 2011), the Ecological Footprint (Monfreda et al. 2004) or deforestation activities (Meyfroidt et al. 2010) among other ecological impacts (Srinivasan et al. 2008). The
Annex O: Task 1 Conclusions: Inception Report Summary
94
method is based on the concept of apparent consumption, i.e. domestic production minus exports plus imports. Factor embodiments from production activities of exported products in a country are first estimated. These are then assigned to other countries using bilateral international trade statistics (e.g. COMTRADE, FAOSTAT). The factor embodiments of a country’s consumption of internationally traded products can then be estimated as the sum of all factor embodiments imported from all other countries. While the approach works at the level of individual products, a variety of studies estimate the total factor embodiments associated with the consumption of all imported products (e.g. Monfreda et al. 2004; van Oel et al. 2009; Hoekstra et al. 2011). Only direct trade or first-order trade relationships between countries are considered, i.e. PBTA is a uni-layer trade method. Only in exceptional cases where bilateral international trade data indicate the exports of a product, which is not domestically produced in a country, trade relationships are traced further. However, this is usually undertaken on a case-by-case basis (Kissinger and Rees 2010; Hoekstra et al. 2011) and there is often no clear documentation on how this is done and how frequent such a procedure has to be undertaken. Supply chain coverage of the PBTA method varies across studies, but always remains partial and in cases implicit (for example, if emission factors are taken from the literature or external databases). Partial supply chain coverage is unavoidable when the concept of apparent consumption is applied, because no clear distinction between intermediate and final products is made. This has at least two implications: First, the method cannot identify to which supply chain the product of the analysis belongs and assign factor embodiments to the end-product of that supply chain. Second, PBTA cannot adequately attribute factor embodiments to countries of final consumption. Take the example of deforestation embodiments of an imported sheet of paper. Based on the PBTA approach the deforestation embodiment will always be assigned to the importing country of that sheet of paper regardless whether it is used by an individual in that country to write a letter or by a company in the production of a car exported to a third country. The large majority of assessments based on the PBTA approach apply annual time series data (largely) based on physical measurement units.
• Extended Product Level Bilateral Trade Approach (E-PBTA)
In general, the discussion of PBTA applies to E-PBTA: it works at the product level, is based on the concept of apparent consumption, covers the supply chain partially and is often used for annual time series analysis usually based on data in physical measurement units. E-PBTA extends the PBTA approach by modifying the mathematical formalism to systematically consider multi-layer trade, i.e. the method therefore allows tracing factor embodiments from the consumption of imported products via multiple countries. A detailed methodological description can be found in Kastner et al. (2011) with an exemplary application to land requirements associated with consumption of soy products. The study illustrates that the consideration of multi-layer trade can lead to considerable, non-negligible differences in the allocation of factor embodiments associated with internationally traded products to consuming countries. As the mathematical formalism is straightforward and the general problem is well-known from life cycle inventory assessment literature (Heijungs 1994; Heijungs 1996; Suh and Huppes 2005), it is surprising not to find more studies applying this approach.

Annex O: Task 1 Conclusions: Inception Report Summary
95
• Sector Level Bilateral Trade Approach (SBTA)
This approach has gained prominence in the literature under the name “Emissions Embodied in Bilateral Trade” (EEBT) due to its application to the study of mainly CO2 and greenhouse gas (GHG) emission embodiments (Peters and Edgar G. Hertwich 2008; Peters and Hertwich 2008; Peters 2008; Wiedmann 2009; Sinden et al. 2011). For a more intuitive distinction from the other approaches in this review, and in order to highlight the more general applicability of the approach to any factor embodiment, we term the approach ‘sector level bilateral trade approach’ (SBTA) here. SBTA is based on input-output analysis (Miller and Blair 2009; Wiedmann 2009) and works at the sector level. Sectors can be viewed as collections of industrial economic activities producing a basket of different products. For example, the agricultural sector would include all industrial agricultural activities starting from crop production to animal farming. The sector breakdown of input-output tables differs across countries. For some countries like Japan or the US several hundred industries are distinguished, while input-output tables of many European countries often only show around 60 sectors. It is generally accepted that higher levels of aggregation lead to misallocation of factor embodiments to consuming sector final demands (Bullard and Sebald 1988), but these allocation errors tend to cancel out at the country level (Peters et al. 2011). This means that even if the SBTA approach is unsuitable for particular sector or product level analysis, it might still be useful at the aggregate level. SBTA allocates factor embodiments of imported products to countries and sectors of final consumption. The complete description of economic activities within a particular country in input-output tables allows for an unambiguous linkage of products to different supply chains. For example, SBTA allows to distinguish between the supply chain of the final product paper bought by an individual to write a letter and the intermediate product paper used by an automobile company in the production of a car exported to a third country. Compared to the PBTA and E-PBTA, SBTA assigns any embodied deforestation in the paper used by the automobile manufacturer to the third country. Still, the system coverage of SBTA is limited, because the method only considers a country’s domestic (and not the global) supply chain. Using information about bilateral international trade the method estimates domestic factor embodiments of export in all sectors of the economy to all other countries and regions in the world. However, due to this focus on the domestic supply chain only, SBTA only considers the direct trade relationships between countries like PBTA, i.e. it is a uni-layer trade method. Production and consumption activities in the SBTA are usually represented in monetary units – as typical for input-output tables. Factor inputs enter the analysis as sector intensities (e.g. tons per unit of monetary output). Input-output models in physical units can also be used for the allocation of factor embodiments to final demands, but have their own limitations (Giljum and Hubacek 2004; Suh 2004; Dietzenbacher 2005; Dietzenbacher et al. 2005; Minx 2008). Moreover, physical input-output tables are only available for a few individual countries and therefore not suitable for studies of bilateral trade between a larger set of countries. Hybrid unit input-output models would provide the most adequate framework for allocating factor embodiments to final demands (Herendeen 1973; Proops 1977; Bullard et al. 1978; Dietzenbacher 2005), but also in this case there are severe data restrictions in the context of global analysis. Annual time series analysis based on SBTA is not possible due to unavailability of global, country-specific input-output data. Available input-output databases are restricted to one or a small number of individual years.

Annex O: Task 1 Conclusions: Inception Report Summary
96
• Generalized Multi-regional input-output analysis (GMRIO)
GMRIO is another method rooted in input-output analysis for tracing factor embodiments associated with the final consumption of imported products. Therefore, all remarks made in the previous Section (SBTA) concerning aggregation level, consumption concept, measurement units and temporal coverage apply. GMRIO approaches have been applied to a variety of factors including CO2/GHG emissions (e.g. Lenzen et al. 2004; Munksgaard et al. 2005; Hertwich and Peters 2009; Minx et al. 2009; Baiocchi and Minx 2010), resource flows (Giljum et al. 2009) and land use (Giljum et al. 2009; Wilting and Vringer 2009). A review of GMRIO literature can be found in Wiedmann et al. (2007) and Wiedmann et al. (2009). Fundamentally, the philosophies of GMRIO and SBTA differ from eachother. While the latter mainly focuses on providing a pragmatic procedure for estimating consistent trade balances for countries, GMRIO specializes on tracing factor embodiments of sector final demands across global supply chains (Peters 2008). Choosing one over the other is therefore dependent on the research questions. Methodologically, GMRIO is capable of tracing factor embodiments across multiple countries (i.e. multi-layer trade method) and it provides a complete description of the global supply chain across countries and sectors.
• GDP Approach (GDPA)
Because the availability of data restricts GMRIO and SBTA to analysis of a few individual years, authors have tried to develop less data-intensive alternatives. This has led to attempts of building one-sector multi-regional input-output models based on country-specific Gross Domestic Product (GDP) and bilateral international trade data. The method allows for the attribution of factor embodiments of imported products to the country of final consumption (see Proops et al. 1999; Lenzen et al. 2007). Due to the lack of sectoral detail, the method only works at the country level and does not provide any supply chain representation. However, factor embodiments associated with international trade can be traced across multiple countries, i.e. GDP is a multi-layer trade method. Like input-output models production, consumption and international trade flows are represented in monetary units, while factor inputs are expressed as intensities per monetary unit of economic output. Following this approach annual time series studies can be accommodated.
• Extended GDP Approach (E-GDPA)
The E-GDPA approach tries to overcome the limitations of the GDPA approach associated with its country-level aggregation and lack of supply chain representation. All other properties in the previous section on GDPA related to consumption concept, time coverage, treatment of international trade flows and unit of measurement also apply to E-GDPA. Moran et al. (2009) use the standard GDPA approach to estimate the embodied CO2 emissions imported by different countries. This estimate is broken down in a second step to the product level using information on embodied energy taken from various sources. The factor embodiments arising in different supply chains of imported products are considered, but remain methodologically inconsistent and implicit. Peters et al. (2011) provide a more consistent sector

Annex O: Task 1 Conclusions: Inception Report Summary
97
level approach by explicitly linking GDP and input-output data for the years, where the latter is available. Similar to the SBTA this approach includes a representation of the domestic supply chain assuming that the supply chains of sectors have remained unchanged relative to the next year, where input-output data is available. We perceive the approach by Peters et al. (2011) superior to the one by Moran et al. (2009) – for matters of consistency, transparency and availability. When we use the term E-GDPA in the remainder of this paper, we refer to the approach by Peters et al. (2011).58
→ Choosing appropriate methods for this project
Three methods are broadly inadequate:
• first, the PBTA does not account for multi-layer trade (E-PBTA). • Second, GDPA is too restrictive in terms of aggregation level and supply chain coverage and
could lead to substantial misallocations as ‘deforested land embedded in trade’ and ‘land embedded in trade’ can be expected to cluster around a relatively small group of final products. Further, integrating the approach with input-output models (E-GDPA) allows overcoming these limitations.
• Third, the SBTA approach focuses on establishing environmental (i.e. ‘deforested land embedded in trade’ and ‘land embedded in trade’) trade balances, which are consistent with national economic accounts. This is outside the scope of this project, which focuses on consumption related ‘deforested land embedded in trade’ and ‘land embedded in trade’.
Table (Annexes) 2 Relevant characteristics of approaches for allocating factor embodiments of imported products to consumption activities
PBTA E-PBTA SBTA GMRIO GDPA E-GDPA Aggregation product product sector sector national sector Consumption concept
apparent Apparent final final final final
Trade coverage
uni-layer multi-layer uni-layer multi-layer multi-layer multi-layer
Supply chain coverage
partial partial domestic global no domestic
Temporal coverage
annual time series
annual time series
individual years
individual years
annual time series
annual time series
Measurement units
physical physical monetary monetary monetary monetary
All of the remaining three approaches (E-PBTA, GMRIO, E-GDPA) are capable of tracing factor (‘deforested land embedded in trade’ and ‘land embedded in trade’) embodiments associated with internationally traded products across multiple countries. Only the E-PBTA approach works at the product level and is purely based on physical data. E-PBTA and E-GDPA can both be used for annual time-series analysis, while GMRIO and E-GDPA apply the concept of final (rather than apparent) consumption. Only GMRIO takes into account the global supply chain and is therefore the only approach, which can trace factor embodiments to the ultimate final consumption activities. 58 We have called this approach in the proposal TSTRADE, but will refer to it here as E-GDPA approach for terminological consistency.

Annex O: Task 1 Conclusions: Inception Report Summary
98
Keeping these characteristics in mind, we propose three different methods for different purposes in this project:
1. We will use the E-GDPA method for estimating an (annual) time-series of ‘land embedded in trade’ and ‘deforested land embedded in trade' trade balances of the EU;
2. We use the E-PBTA to analyse the apparent consumption of individual key agricultural commodities such as soy, palm oil or beef.
3. We use the GMRIO method for estimating ‘land embedded in trade’ and ‘deforested land embedded in trade' of European final consumption activities and for in-depth studies of supply chains of key final demands.
It is important to highlight that these different methods have a different focus and will therefore lead to different results. It is one of the important aspects of this project to clearly communicate when which method is usefully applied.
METHOD AND DATA DESCRIPTION OF THE PROPOSED APPROACHES
In the previous section we have identified three general approaches suitable for quantifying ‘deforested land embedded in trade’ and ‘land embedded in trade’ in international trade in the context of this project. In this section we describe the particular model implementations of these approaches. These models will be used in the second phase of this project to estimate ‘deforested land embedded in trade’ and ‘land embedded in trade’ of Europe’s imports. Error! Reference source not found. the names of the models and relates each model to the respective approach for quantifying factor embodiments of international trade. In the next sections methodology and data sources of each model will be described.
Table (Annexes) 3 Model implementations used in this project for the estimation of ‘deforested land embedded in trade’ and ‘land embedded in trade’ in international trade
Approach Model name Model Developer E-PBTA LANDFLOW IIASA E-GDPA TSTRADE CICERO/TU Berlin GMRIO GTAP-MRIO CICERO/ TU Berlin
→ LANDFLOW
The land-intensive agricultural and forestry sectors are key economic activities associated with deforestation. In the context of a former project, “Modelling Opportunities and Limits for Restructuring Europe towards Sustainability” (MOSUS), the IIASA has developed a methodology for associating land with the full chain of production, trade and consumption of agricultural and forestry products (IIASA, 2006; Fischer et.al, 2007; Prieler et.al, 2006). The methodology (henceforth termed “LANDFLOW”) estimates for each country the amount of ha of land associated with production, trade (imports and exports) and domestic use (production + imports – export).

Annex O: Task 1 Conclusions: Inception Report Summary
99
The online database of the statistical service of the United Nations Food and Agricultural Organization (FAOSTAT, http://faostat.fao.org/) contains various domains of national level time-series data, including primary crop production, livestock production, land-use data, supply utilization accounts (SUA), food balance sheets, and national total and bilateral trade data. The latter are available in physical and monetary units.
Agricultural products include crops, livestock and fisheries, both primary as well as manufactured products. Forestry commodities include primary roundwood, manufactured wood and wood products, and pulp and paper products. FAOSTAT provides annual time series with the latest completed year currently being 2007.

Annex O: Task 1 Conclusions: Inception Report Summary
100
The methodology LANDFLOW associates land with the full chain of production, trade and consumption of agricultural and forestry products.
Figure (Annexes) 25 LANDFLOW (shaded inside the box) methodology overview, and how it is linked to the ‘transition pathways’ model
LANDFLOW traces ‘total land embedded in trade’ and ‘deforested land embedded in trade’. The method accounts for intermediate products along the agricultural processing chain and records cross-country flows of primary and secondary commodities using FAOSTATs large harmonized time
IndlR
oundw
ood
Transitionprobability
FRA2010 deforestation
Land resourcestime series
Literaturestudies
Other Cultivated Pastures Forest
Crop1 Cr2 … Cr n Ruminants
Monogastrics
FuelwoodInd.Rwd
PROD
IMPORT
from stock
FEED
IndustryWaste
FOOD
EXPORT
to stock
SUAs forprimary &processed
AgriculturalTrade matrix**
Ctry 1Ctry 2Ctry 3
Ctry n
other countries LANDFLOW
Supply Utilization Account (SUA)*
* SUA per country and commodity** Trade matrix per commodity
BilateralTrade
PrimaryProduction
PROD
IMP
Panels
Sawnwood
Pulp&
Paper
Industry
EXP
ForestryTrade matrix**
Wood balance
FAOSTATInput data
PrimaryProduction
Land use
Forestproducts
Trade forprimary &processed

Annex O: Task 1 Conclusions: Inception Report Summary
101
series data base. LANDFLOW operates on an annual basis (currently until 2007, the last year of complete FAOSTAT input data). The split and further destination of primary commodities into different intermediate and secondary products is taken from FAOs Supply Utilization Accounts (SUA) for agricultural products (crops and livestock) and a simple wood balance based on available FAOSTAT forest commodities. FAO also provides bilateral trade data.
Table (Annexes) 4 FAOSTAT country time series database
Domain Items Elements AGRICULTURE Land use Arable, permanent crops, permanent pasture,
forest and woodland, other land Area (ha)
Crops primary production
Commodity groups and detailed sub-commodity level for all primary crops
physical volumes (kg) Areas harvested (ha)
Supply Utilization Accounts
Primary crops, crops by-products and processed agricultural commodities (see Figure 2 for details)
physical volumes (kg)
Livestock Ruminants and Monogastric (pigs & poultry) at detailed livestock species level
Number of animals
Livestock products Meat (per livestock species), dairy products (milk, cheese,…), Eggs, Hides
physical volumes (kg,…)
Trade Imports and Exports for several hundred primary and processed crops and livestock products
physical volumes (kg) values ($)
Bilateral trade Primary and processed agricultural commodities
physical volumes (kg) values ($)
FORESTRY Primary production
Industrial roundwood, fuel wood production volumes (cum)
Forest products Sawn wood, Wood-based panels, Wood pulp, Wood residues, Chips & particles, Paper and paperboard, Recovered paper
production volumes (cum)
Trade Primary and forest products physical volumes (cum) values ($)
The resulting database provides for each country from 1990 to 2007 a detailed account of produced and traded agricultural and forestry commodities and associated total land and deforested land. Land related variables include land in production, land in trade (imports, exports, net exports), deforested land in trade, land in domestic consumption (production plus imports minus exports), land in feed use, and deforested land in domestic consumption. In LANDFLOW, the land linked with the intermediate use of products, notably animal feeds, is tracked along the food chain and recorded with the respective domestic use and trade of consumption items, e.g. livestock products in terms of meat, dairy products and eggs.
Results are presented for aggregate commodity groups describing in total the entire agricultural and forestry sector and selected commodities closely related to deforestation.

Annex O: Task 1 Conclusions: Inception Report Summary
102
The following describes details of individual components of LANDFLOW:
• Land associated with primary production of crops and timber
Land-use data in FAOSTAT include the elements arable land, permanent crops and permanent pasture, which are a relevant source for attributing land to the crops and livestock sector.
Arable land refers to “land under temporary crops (double-cropped areas are counted only once), temporary meadows for mowing or pasture, land under market and kitchen gardens and land temporarily fallow (less than five years)”.
Permanent crops refers to land cultivated with perennial crops occupying the land for long periods with no need of re-plantation after each harvest.
Permanent pasture is land “used permanently (five years or more) for herbaceous forage crops, either cultivated or growing wild”.
Crops primary production of the FAOSTAT database reports for all primary crops (on a detailed level with a total of 170 different commodities) the following elements: (i) Production (tons); (ii) Area harvested (ha); and (iii) Yields, extraction rates (kg/ha).
Land area requirements are estimated by applying country-specific yields to domestic production of individual commodities taking into account successive cropping of annual crops and fallow periods. Multiple land use in time, sequential cropping, and fallow periods are indicated by a multi-cropping index (MCI). By definition, permanent crops are assumed to have an MCI of 1, i.e. one harvest a year59. The MCI of annual crops can be lower than one (indicating fallow periods) or above 1 (indicating more than one harvest a year) per unit of physical area. Total harvested area of annual crops divided by arable land denotes a country’s average MCI, which is proportionally allocated to each crop.
Pasture land area is allocated to ruminant livestock. Because pasture productivity varies widely across regions, in addition to a country’s reported area of permanent pasture, a ‘pasture equivalent’ area is calculated. It expresses pasture areas in a globally comparable unit, a ‘reference pasture unit’, defined as providing a palatable yield of 5 tons dry matter per hectare.
For forestry products, the production of roundwood combined with forest productivity data provide an estimate of the productive forest area in a country. FAOSTAT reports roundwood (in cum) referring to all wood in its natural state obtained from removal. Roundwood comprises of industrial roundwood and wood fuel. How much area is associated with roundwood production depends on forest productivity, i.e. the equivalent of yields in the case of crops. For a large number of countries the Temperate and Boreal Forest Resource Assessment (TBFRA)-2000 report on “Forest Resources of Europe, CIS, North America, Australia, Japan and New Zealand” (UN-ECE/FAO, 2000) includes estimates of forest productivity and actual forest lands available for wood supply. Forest available for wood supply (FAWS) is defined as forest where legal, economic or specific environmental restrictions do not have a significant impact on the supply of wood. Roundwood production data (from FAOSTAT) combined with forest productivity on FAWS (from TBFRA-2000) provides an estimate of the productive forest area in a country.
For countries not included in the TBFRA-2000 report, forest productivity estimates are more difficult to obtain and less certain. The Global Fibre Supply Model (GFSM) Report (FAO, 1998)
59 Due to data inconsistencies in FAOSTAT, particularly for the early 1980s, the calculated MCI of perennials can sometimes exceed one. Here we assume and MCI of 1 for perennial crops.
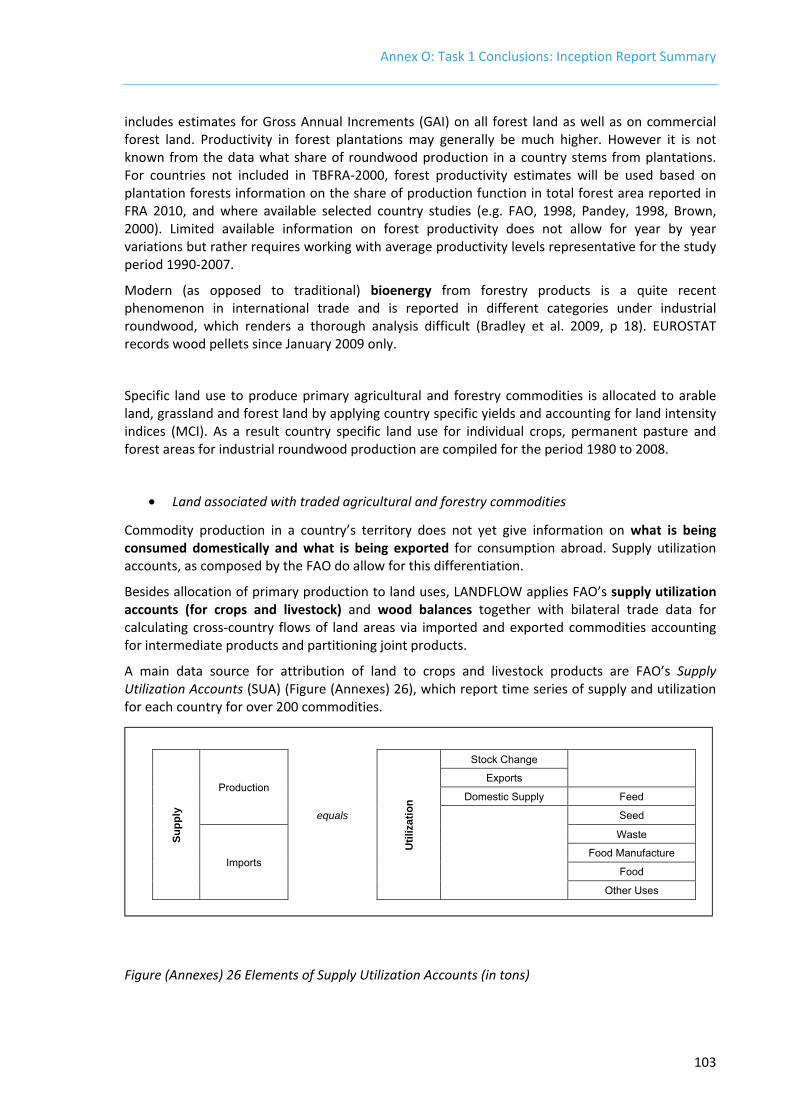
Annex O: Task 1 Conclusions: Inception Report Summary
103
includes estimates for Gross Annual Increments (GAI) on all forest land as well as on commercial forest land. Productivity in forest plantations may generally be much higher. However it is not known from the data what share of roundwood production in a country stems from plantations. For countries not included in TBFRA-2000, forest productivity estimates will be used based on plantation forests information on the share of production function in total forest area reported in FRA 2010, and where available selected country studies (e.g. FAO, 1998, Pandey, 1998, Brown, 2000). Limited available information on forest productivity does not allow for year by year variations but rather requires working with average productivity levels representative for the study period 1990-2007.
Modern (as opposed to traditional) bioenergy from forestry products is a quite recent phenomenon in international trade and is reported in different categories under industrial roundwood, which renders a thorough analysis difficult (Bradley et al. 2009, p 18). EUROSTAT records wood pellets since January 2009 only.
Specific land use to produce primary agricultural and forestry commodities is allocated to arable land, grassland and forest land by applying country specific yields and accounting for land intensity indices (MCI). As a result country specific land use for individual crops, permanent pasture and forest areas for industrial roundwood production are compiled for the period 1980 to 2008.
• Land associated with traded agricultural and forestry commodities
Commodity production in a country’s territory does not yet give information on what is being consumed domestically and what is being exported for consumption abroad. Supply utilization accounts, as composed by the FAO do allow for this differentiation.
Besides allocation of primary production to land uses, LANDFLOW applies FAO’s supply utilization accounts (for crops and livestock) and wood balances together with bilateral trade data for calculating cross-country flows of land areas via imported and exported commodities accounting for intermediate products and partitioning joint products.
A main data source for attribution of land to crops and livestock products are FAO’s Supply Utilization Accounts (SUA) (Figure (Annexes) 26), which report time series of supply and utilization for each country for over 200 commodities.
Su
pp
ly
Production
Uti
lizat
ion
Stock Change
Exports
Domestic Supply Feed
equals Seed
Imports
Waste
Food Manufacture
Food
Other Uses
Figure (Annexes) 26 Elements of Supply Utilization Accounts (in tons)

Annex O: Task 1 Conclusions: Inception Report Summary
104
Trade data: FAOSTAT provides an extensive trade data base reporting physical quantity (tons) as well as value (1000$) for primary crops, processed commodities, and livestock products. The commodity list includes over 700 different products covering a country’s entire trade of the agricultural sector. Processed commodities can be converted into its primary equivalent using published technical coefficients60. FAOSTAT trade data are consistent with SUA data by ensuring that primary equivalents in the trade data equal reported imports and exports in the supply utilization accounts. In this way it is possible to establish a relationship between trade data and their respective SUA item. FAOSTAT also includes bilateral trade data from the late 1980s to present for numerous commodities.
The crop sector accounts for intermediate products (e.g. wine from grapes, beer from barley), production and trade of jointly produced (e.g. flour and bran of wheat) as well as joint processed agricultural commodities (e.g. oilseed crops are processed into oil for human consumption and oilseed cakes for animal feed). Land areas associated with utilization of crops are estimated by applying country specific yields to domestic production (see above), imports (using relevant yields in country of origin) and exports of individual commodities.
In the livestock sector, ruminants (e.g. cattle, sheep, goats, horses) have been treated separately from monogastric animals (pigs and poultry). Ruminants rely on pastures, cultivated green fodder as well as feed from primary crops produced on arable land. Monogastrics animals do not eat green fodder or pastures and are fed with crops or crop by-products. Attributing land associated with the production of feed crops and by-products from primary crops used in feeding (e.g. brans or soybean cake) was done according to usability of feed sources for different animal types and estimated in proportion to national livestock herd energy requirements. By comparing energy supply from reported feed use and pastures with livestock energy requirements it was possible to allocate total feed use to amounts for ruminants and monogastric animals.
For forestry, a separation of forest products and associated land areas including trade was estimated for three sub-sectors: primary sector ‘industrial roundwood and wood fuel’; and two sectors for manufactured forest products, ‘wood and products of wood’ and ‘pulp, paper and paper products’. Estimates of land area associated with roundwood production for each sector are based on FAOSTAT forestry production and trade data combined with reported country-specific forest productivity and harvesting estimates. Land use in the paper sector takes into account recycled paper use and only land area requirements of each year’s roundwood use in paper production is counted.
Once land has been associated and partitioned for all commodities, land flows can be generated by means of country markets recording domestic production, imports, and exports of individual commodities with trade being based on bilateral trade matrices. Thus domestic use and associated land areas of a country for a specific commodity includes all inter-country land flows, accounts for intermediate products (livestock feed being the most important one) and partitioning of joint products.
LANDFLOW uses for calculations a detailed commodity list and then generates results for aggregate commodity groups, allowing a complete land balance of agricultural and forestry production. In addition selected important commodities closely related to deforestation will be traced separately including soybean and palm oil.
System boundaries of LANDFLOW relate to products in the supply chain which are not included in the agricultural and forestry statistical data. This refers in particular to industrial uses of agricultural commodities, where final consumption cannot be directly traced in the LANDFLOW accounts.
60 For example in the case of the primary commodity maize the following elements are included in the trade data base: Maize primary; Germ of Maize; Flour of Maize; and Bran of Maize.

Annex O: Task 1 Conclusions: Inception Report Summary
105
Examples include clothes from fibers (cotton, flex, hemp), fats and oils for soap, lubricants or cosmetics, or furniture made from wood.
Table (Annexes) 5 Aggregate commodity groups in LANDFLOW
Commodity group Land area associated 1. Crops Arable land 1a. Cereals Arable land1b. Other crops Arable land2. Livestock Arable land and pasture 2a. Ruminants Arable land and pasture 2b. Other livestock (pigs & poultry) Arable land3. Forestry Forest land 3a. Primary industrial roundwood Forest land3b. Wood products Forest land3c. Pulp & paper
of which recovered paper Forest land No land associated
→ TSTRADE
TSTRADE is a model implementation of the E-GDPA approach. TSTRADE provides an approximation of more comprehensive input-output models using fewer and more regularly available statistics. Therefore, TSTRADE addresses the problem that comprehensive global input-output models are only available for some individual years, while researchers are often interested in extended time series analysis. The TSTRADE method is therefore used in this project to estimate long-term trends in ‘deforested land embedded in trade’ and ‘land embedded in trade’ of Europe’s trade considering all final consumption of products in Europe. More specifically, TSTRADE approximates a uni-layer trade input-output model of the SBTA type. Such models are particularly suitable for establishing trade balances for factor embodiments. TSTRADE will be used in this project to estimate trade balances for land-use and deforestation over time for different world regions. The idea behind TSTRADE is to establish an annual global one-sector input-output model first and to add sector detail from comprehensive input-output data later. The one sector input-output model starts from expenditure-based GDP statistics as published in the United Nations Statistic Division (UNSD) National Accounts Main Aggregates Database. These statistics break GDP down into basic final expenditure components: household consumption, government consumption, capital investment and net trade (exports minus imports). We combine the GDP statistics with information from a SBTA type input-output model for the years 1997, 2001 and 2004 in order to bring the supply chain into the picture. For a given year we use comprehensive input-output data from the closest year. This means that we assume, for example, that the domestic supply chain in 1995 is identical to the one in 1997. We use our GTAP implementation of the SBTA approach, which we usually refer to as “EEBT model” (Peters 2008). For this purpose we aggregate the country-level GDP to the 113 regions of the GTAP 7 database (Narayanan and Walmsley 2008). This gives us the basic one sector input-output model. Information from the EEBT model is also used to disaggregate the one sector to a 57 sector model following the same rationale. The sector and region breakdown is provided in the Annexes. We use

Annex O: Task 1 Conclusions: Inception Report Summary
106
bi-lateral trade data from the GTAP7 database to represent the international trade activities between countries and sectors. Finally, we generalize the model by adding land-use and deforestation statistics previously constructed. The resulting model can be used estimate trade balances for land-use and deforestation for different regions in the world. The model calculus is detailed in Peters et al. (2011). The data sources used in the model are outlined below.
Table (Annexes) 6 Data Sources used for constructing the TSTRADE model
Area Type Year Source National account data
Input-output tables
1997 GTAP5 Database (Mastoris et al. 2002)
2001 GTAP6 Database (Dimaranan 2006) 2004 GTAP7 Database (Narayanan and Walmsley
2008) GDP statistics 1990-
2009 UNSD National Accounts Main Aggregates Database http://unstats.un.org/unsd/snaama/Introduction.asp
Environmental data
Land-Use 1990-2007
FAOSTAT
Deforestation 1990-2010
FAO FRA 2010
Trade statistics Bi-lateral trade data
1992-2006
GTAP7 (Narayanan and Walmsley 2008) (derived from COMTRADE)
Note that not all data is available for the same time periods. Where required we extend the data through extrapolation. For example, we extrapolate bi-lateral trade data beyond 2006 by assuming that regions’ trade activities as represented in GDP statistics have remained constant in their structure. We will use this data to trace ‘deforested land embedded in trade’ and ‘land embedded in trade’ between 1990 and 2010 (or 2007 when limited due to FAOSTAT time series availability).
→ GTAP-MRIO
GTAP-MRIO is a model implementation of the GMRIO approach. Such global multi-regional input-output models are useful to trace ‘deforested land embedded in trade’ and ‘land embedded in trade’ throughout the global supply chain across sectors and regions to the ultimate point of final consumption. This intuition is similar to life-cycle analysis, where we trace all industrial activities required to produce a particular product. Hence, while we use the TSTRADE model for establishing long-term trends in land-use and deforestation trade balances, we use the GTAP-MRIO model for in depth analysis analysis of ‘deforested land embedded in trade’ and ‘land embedded in trade’ of final consumption activities in Europe. This includes:
• Hot-spot analysis: Identifying which final consumption activities cause most deforestation across the world and how this has changed over time;
• Destination analysis: Tracing which consumption activities are related to key deforestation activities in individual countries and/or sectors like Brazil (soy beans, cattle) or Indonesia (palm oil);
• Origin analysis: Tracing the supply chain of key consumption activities in Europe back to deforestation activities around the globe (e.g. paper, leather, meat or fuel consumption);

Annex O: Task 1 Conclusions: Inception Report Summary
107
• Supply chain analysis: Identifying key deforestation activities across the supply chain of key consumption activities.
As such analysis is extremely data-intensive it will only be carried out for those years, where detailed input-output data is available: 1997, 2001, 2004. However, most of the analysis will focus on the most recent year 2004. The remainder of this section is a technical description of the model. It starts with an intuition and will then introduce the input-output formalism step-by-step. Non-technical readers might want to skip this part. The standard input-output model starts from an accounting balance of monetary flows (United Nations 1999), = + + − (1)
where x is the vector of total output in each sector, y is a vector of final consumption (household, government, capital), e is the vector of total exports, m ist he vector of total imports an Z=Ax is the matrix of intermediate consumption and = the (production) technology matrix where each column gives the inputs from each sector to produce one unit of output in another sector. This balance equation holds in all regions, r. The total trade components can also be expressed using bilateral trade data from region r to regions s, ers. The total exports are = ∑ (2)
and by symmetry the total imports are = ∑ (3)
To perform analysis with this model the imports are usually removed from the system, = + + ∑ (4)
which expresses the same balance than equation (1). The second superscript r is added to the technology matrix A and the final consumption vector y to highlight that the represented product flows are all from domestic economic activities in region r. In this balance equation, however, the export vector e contains both intermediate and final exports, = + (5)
where is a unity vector (for summation). We have highlighted that it is a distinct feature of a multi-regional model such as GTAP-MRIO, that it distinguishes between international traded intermediate and final products as shown in equation (5). Based on this extension we can expand our basic model from an individual to a total of m regions including all intermediate and final trade linkages across regions and sectors. Including internationally traded good explicitly into our technology matrix = , we can write a balance equation for a global economy with m world regions by = + + ∑ + ∑ (6)
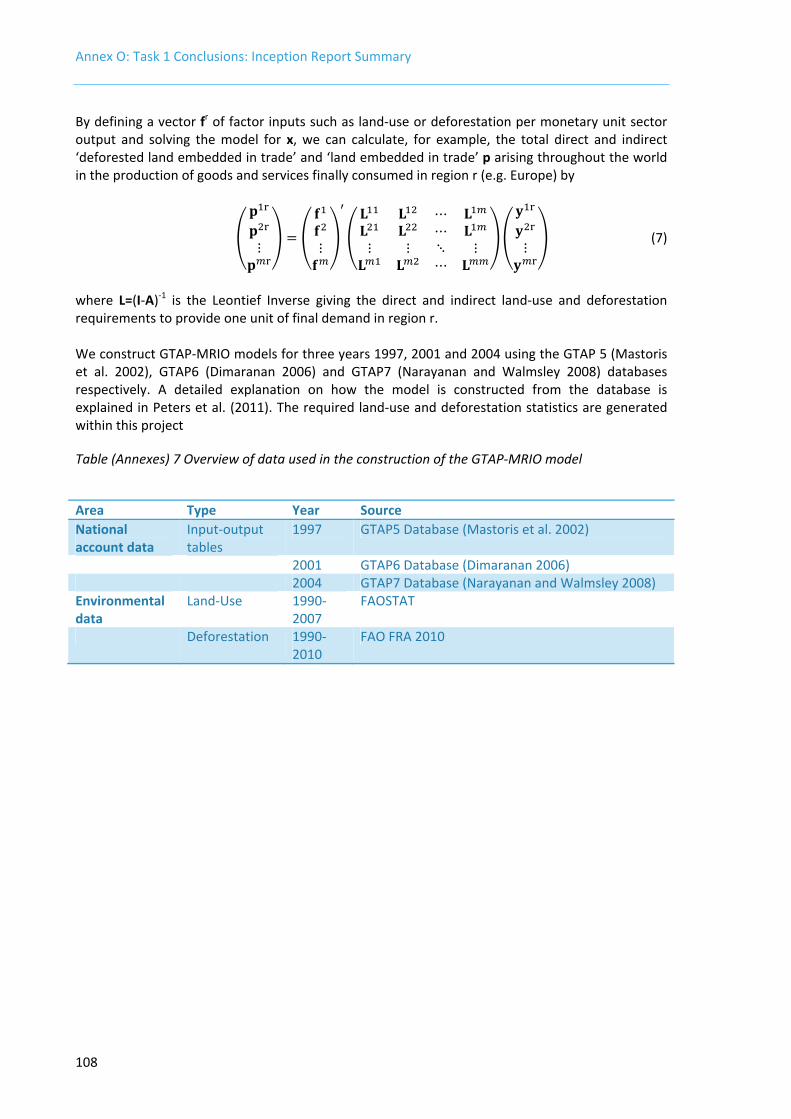
Annex O: Task 1 Conclusions: Inception Report Summary
108
By defining a vector fr of factor inputs such as land-use or deforestation per monetary unit sector output and solving the model for x, we can calculate, for example, the total direct and indirect ‘deforested land embedded in trade’ and ‘land embedded in trade’ p arising throughout the world in the production of goods and services finally consumed in region r (e.g. Europe) by
⋮ = ⋮ ⋯⋯⋮ ⋮ ⋱ ⋮⋯ ⋮ (7)
where L=(I-A)-1 is the Leontief Inverse giving the direct and indirect land-use and deforestation requirements to provide one unit of final demand in region r. We construct GTAP-MRIO models for three years 1997, 2001 and 2004 using the GTAP 5 (Mastoris et al. 2002), GTAP6 (Dimaranan 2006) and GTAP7 (Narayanan and Walmsley 2008) databases respectively. A detailed explanation on how the model is constructed from the database is explained in Peters et al. (2011). The required land-use and deforestation statistics are generated within this project
Table (Annexes) 7 Overview of data used in the construction of the GTAP-MRIO model
Area Type Year Source National account data
Input-output tables
1997 GTAP5 Database (Mastoris et al. 2002)
2001 GTAP6 Database (Dimaranan 2006) 2004 GTAP7 Database (Narayanan and Walmsley 2008) Environmental data
Land-Use 1990-2007
FAOSTAT
Deforestation 1990-2010
FAO FRA 2010


KH-30-13-329-EN-N
doi:10.2779/8226