the impact of dividend taxation on dividends and investment: new evidence based on a natural...
TRANSCRIPT

251The Impact of
Dividend Taxationon Dividends andInvestment: NewEvidence Based
on a NaturalExperiment
Seppo KariHanna Karikallio
Jukka Pirttilä
PALKANSAAJIEN TUTKIMUSLAITOS • T Y Ö P A P E R E I T A LABOUR INSTITUTE FOR ECONOMIC RESEARCH • DISCUSSION PAPERS
* We are grateful to Kristiina Huttunen, Håkan Selin, Jan Södersten and seminar participants at the University of Copenhagen, the CESifo Area Conference on Public Economics, the Labour Institute
for Economic Research and Government Institute for Economic Research for their useful comments. The financial support of the Nordic Tax Research Council, the Academy of Finland and the Taxation
Economics Programme of the Norwegian Research Council is gratefully acknowledged.
**Government Institute for Economic Research ***Pellervo Economic Research Institute
****University of Tampere and Labour Institute for Economic Research Corresponding Author. Address: Department of Economics,
33014 University of Tampere, Finland, email: [email protected]
Helsinki 2009
251
The Impact of Dividend Taxation on Dividends and Investment: New Evidence Based on a Natural experiment*
Seppo Kari** Hanna Karikallio*** Jukka Pirttilä****

ISBN 978−952−209−069−0
ISSN 1795−1801
3
ABSTRACT
There is a lack of clear evidence of the ways in which dividend taxation affects dividend
distributions and investment since the evidence is based mainly on the behaviour of large
listed companies. This paper utilises a large register-based panel data set, where the vast
majority of firms are small and medium-sized enterprises, to examine the responses to the
Finnish dividend tax increase of 2005. This reform creates a useful opportunity to measure
enterprise behaviour, since it involves exogenous variation in the tax treatment of different
types of firms. The results, based on differences- in-differences estimation and matching
methods, indicate that dividends declined somewhat in closely held corporations that faced a
tax increase, perhaps for timing reasons, while investments did not decline. These findings
are more in line with the new rather than the old view of dividend taxation.
Key words : corporate income taxation, dividends, investment, tax reform
JEL Classification: H25, H32
TIIVISTELMÄ
Empiiriset, usein pörssiyhtiöaineistoilla tehdyt tutkimukset eivät ole toistaiseksi antaneet sel-
keää kuvaa siitä, miten osinkoverotus vaikuttaa yritysten voitonjakoon ja investointeihin.
Tässä tutkimuksessa tarkastellaan yritysten reaktioita Suomessa vuonna 2005 toteutettuun
osinkoverouudistukseen laajalla verorekistereihin perustuvalla paneeliaineistolla, joka koos-
tuu pääosin listaamattomista yhtiöistä. Uudistuksessa muutokset kohdentuivat eri tavoin eri
yrityksiin ja siksi se tarjoaa hyvän lähtökohdan yritysten käyttäytymisreaktioiden mittaa-
miseen. Estimointitulosten mukaan yritysten osingot alenivat hieman enemmän niissä listaa-
mattomissa osakeyhtiöissä joiden osinkoverotus kiristyi. Kyseessä saattaa olla lyhyen aika-
välin ajoitusvaikutus. Investoinnit eivät muuttuneet. Tulokset sopivat paremmin yhteen osin-
koverotuksen uuden näkemyksen kuin vanhan näkemyksen kanssa.
Asiasanat: Yritysverotus, osingot, investoinnit, verouudistus

4
1. INTRODUCTION
The best-known theories of how dividend taxation affects dividend distributions and
investment behaviour are the so-called ‘old view’ – see for instance Harberger (1962),
Feldstein (1970) and Poterba and Summers (1985) – and the ‘new view’ – see for instance
King (1974), Auerbach (1979) and Bradford (1981). According to the old view, the marginal
source of funds is new equity, and dividend taxation distorts both dividend and investment
decisions. The new view, on the other hand, assumes that, at the margin, investment is
financed by cutting (or postponing) dividend distributions. In this setting, a constant dividend
tax reduces both the cost of the investment and the future return in the same proportion and
hence has no effect on the firm’s cost of capital or dividend distributions.1 And, of course, a
large number of alternative and complementary theories exist; these include the signalling
theory – see for instance Bernheim (1991) – and the agency theory of Chetty and Saez
(2007).
These theories mainly deal with the long-run impacts of dividend taxation. In recent years, an
interesting new literature has emerged, in particular the papers by Auerbach and Hassett
(2007) and Korinek and Stiglitz (2009), which also encompasses the short-run effects of
dividend tax changes.2 These impacts can arise if dividend tax changes are anticipated and
the firm’s owners can therefore seek to minimise the tax burden over time, paying out extra
dividends when the tax rate is low. Korinek and Stiglitz (2009) demonstrate that if firms face
liquidity constraints, then an anticipated dividend tax increase, accompanied with above-
average dividend distributions, can also reduce investments even if the long-run cost of
capital does not change.
While the theories are well developed, there is still considerable uncertainty about the
empirical magnitudes of these effects. Nonetheless, recent studies have successfully utilised
policy reforms to isolate the causal impacts of tax changes. Such evidence is available for
the Anglo-Saxon countries in particular (see e.g. Bond, Devereux and Klemm (2007) for UK
evidence and Chetty and Saez (2005) and Auerbach and Hassett (2007) for the US). The
findings in Auerbach and Hassett and Bond et al appear to be more in line with the new
1 The ‘Nucleus’ theory by Sinn (1991) combines the views. 2 For an early analysis of anticipation effects with policy uncertainty, see Alvarez, Kanniainen and Södersten (1998), who also examine the impacts of a rate-cut-cum-base-broadening tax change on investment behaviour.
5
rather than the old view, whereas Chetty and Saez (2007) argue that the evidence regarding
the US tax reform of 2003 is not readily compatible with either of the views. This finding is
the basis for their analysis of dividend taxation from an agency point of view, where the
asymmetry of information between the owners and managers of the company plays a key
role. The existing evidence, in particular in studies aiming to find a causal impact of tax
policy by studying tax reforms, is mainly based on the behaviour of large listed companies,
where signalling and agency behaviour may indeed be very relevant. This also means that it
may not be possible to arrive at a ‘pure’ separation of the old vs. the new view using data
from listed companies.
The present paper presents new evidence on the impacts of dividend tax changes on firm
behaviour based on a corporate income tax reform that took place in Finland in 2005. This
reform led, in particular, to increased taxation of dividends received by individual investors
from domestic firms listed on the stock exchange.3 The taxation of dividends paid to
institutional investors or foreign owners did not change. In closely held corporations,
dividends up to a certain threshold level were kept tax-free. The 2005 reform therefore
increased the dividend taxation of some, but not all enterprises, and the tax treatment was
based on determinants, such as ownership structure, that were to a large extent exogenous to
the firm at the time of the reform. This suggests that the reform involved sufficient
exogenous variation in tax treatment, and it therefore opens up a promising avenue for
empirical work.
Our analysis is based on a large register-based data set covering all Finnish corporations.
Thus the vast majority of our data is from small and medium-sized enterprises, where the
main owner and the manager are often the same person. Therefore concerns about the role of
asymmetric information between owners and managers or between firm representatives and
investors are likely to be of less significance.
An additional motivation for our analysis stems from the need to design the Nordic dual
income tax in a successful way. While all dual income tax systems of this type share the same
key features (progressive tax on labour income, flat tax on capital income), there are
significant differences in the institutional details of the systems. In particular, the earlier
Finnish tax system was seen to offer generous opportunities for shifting labour income into
6
more leniently taxed capital income (Lindhe, Södersten and Öberg 2004), while the new
Norwegian tax design is probably well sheltered against this behaviour (Sørensen 2005). An
increase in the dividend tax can basically reduce the scope for income-shifting, but on the
other hand it can have undesirable consequences on investments. Analysing the linkages
between dividend taxation and investment is therefore also of key importance for the proper
design of dual income tax, which is of interest per se because of the increased attention being
paid to dual income tax systems worldwide.
The analysis in this paper deals with differences in dividend payout and investment
behaviour in the years following the 2005 reform compared to the years when the blueprint
of the reform was not yet known (2000-2002).4 The reason for this choice is that we want to
have a base year for our analysis that purely reflects the earlier tax system. In our companion
paper (Kari et al 2008), we concentrated on the changes of the anticipated tax increase in the
years immediately before the tax reform. There we documented a large increase in dividend
payments by firms that were likely to face a dividend tax increase in the future. A similar
pattern was found by Alstadsaeter and Fjaerli (2009) for the years preceding the new
Norwegian tax system of 2006.
The results in this paper, based both on regression-based differences- in-differences analysis
and propensity score-matching, provide quite clear evidence that dividends declined in firms
that faced an increase in dividend taxation. 5 Since there was a large and anticipated increase
in dividend payments in the years before the reform when the coming reform was common
knowledge (Kari et al 2008), much of the response in dividends after the reform is likely to
be due to intertemporal tax planning or, in other words, timing effects. There are few robust
signs, however, that investments declined. All this is probably more compatible with the new
rather than the old view of dividend taxation, and it also appears that, at the aggregate level,
____________________ 3 The combined tax rate on distributed profit rose from 29 to 40.5 per cent. 4 Plans for the tax reform were unveiled in 2002 and 2003. Therefore dividend and investment behaviour were already affected by the anticipated reform as from 2003. 5 While matching combined with difference-in-differences is often seen as a very promising estimator in labour economics applications (see e.g. Smith and Todd 2005), it has not been used to such a large extent in public economics. In that respect, one of the contributions of this paper is to narrow the gap in methods between these two areas of economics.

7
firms that faced a tax increase were not cash-constrained in the years following their extra
dividend payments.6
The paper proceeds as follows. Section 2 presents the institutional details and the contents of
the Finnish tax reform. Section 3 discusses the theoretical predictions regarding firm
behaviour based in the short run on modelling of investment and dividend decisions and in
the long run under a dual income tax system. Section 4 describes the data and our empirical
strategy. The results are presented in Section 5. Section 6 concludes.
2. THE FINNISH CORPORATE INCOME TAX REFORM OF 2005
Dividend taxation before the 2005 reform
Finland has applied a Nordic-type dual income tax since 1993, under which personal capital
income is taxed at a flat tax rate and all other income (earned income) according to a
progressive tax rate schedule. Prior to the 2005 tax reform the tax rate on capital income and
corporate profits was 29 per cent 7, while the top MTR on earned income was around 55 per
cent.
A full imputation system was applied to prevent the double taxation of distributed profits.
This system led to a zero effective tax rate on dividends at the shareholder level, vbecause the
tax rates on corporate profits and personal capital income were the same. Dividends from
non- listed corporations, however, were treated differently. To avoid tax planning, induced by
the wide tax rate gap between capital income and earned income, dividends from non- listed
corporations were split into capital and earned income by categorizing capital income as an
imputed return on the firm’s net assets and interpreting the residual of income as earned
income. The proportion of dividends taxable as capital income was calculated as a 9.585 per
cent return on the firm’s net assets.
6Our results, therefore, confirm the ideas in Korinek and Stiglitz (2009) in respect of dividend payments, but not investment. However, the tax increase only hit relatively large, mature firms, where liquidity constraints are likely to be less severe. We would not want therefore to interpret these findings as a robust test of the implications of the Korinek and Stiglitz paper. 7 The flat capital income tax rate was 25 per cent in 1993–1995 and 28 per cent in 1996–1999.

8
One notable element of the pre-reform system was the taxation of net wealth. Personal net
wealth above a threshold of 185,000 euros was subject to taxation at a rate of 0.9 per cent.
The tax base was fairly narrow, however. Most types of interest-bearing assets were exempt
and only 70 per cent of the current value of shares in listed firms was reckoned as taxable
gross wealth. This share was only 30 per cent for closely held companies.
The 2005 reform
The 2005 reform was the first major attempt to revise the tax rules for capital income since
the tax reforms in the early 1990s, which introduced the dual income tax and the system of
imputation credit. The 2005 tax reform lowered the tax rate on corporate profits from 29 to
26 per cent and the personal capital income tax rate from 29 to 28 per cent. The most
important change from the point of view of this study was the replacement of the full
imputation system by a partial double taxation of distributed profits under which 70 per cent
of dividends are included in the recipient’s taxable capital income. Another important
element was the repeal of taxation of individual net wealth. This change was phased in as
from 2006, one year after the other major changes.8
The splitting of dividends into capital and earned income was maintained in the 2005 tax
reform with some fine tuning, however. The rate of the imputed return was lowered to 9 per
cent. One major exception from the overall approach of the new dividend tax system was that
the capital income part of dividends from non- listed corporations was made tax-exempt up to
90,000 euros. Any amount beyond that was taxed according to the main rule. The 70 per-cent
rule was also applied to the earned income part of the dividend.
The 2005 reform led to increased taxation of dividends received by individual investors from
Finnish listed firms (Table 2.1). The taxation of dividends paid to institutional investors or
foreign owners was not changed. In closely held corporations, dividends up to the threshold
level of 90,000 euros remained tax-free. For those receiving dividends in excess of that
amount, the reform led to increased taxation. The 2005 reform therefore increased the
dividend taxation of some, but not all enterprises, and the tax treatment was based on
8 The 2005 rules for net wealth tax included some complex mitigations.

9
determinants, such as ownership structure, that were to a large extent exogenous to the firm
at the time of the reform.
Table 2.1. Dividend taxation before and after the 2005 reform. Previous tax system 2005 reform Tax rate on corporate profits 29 26 Tax rate on capital income 29 28 Top MTR on earned income 55 55 Splitting parameter (effective) 9.585 9 ETR on capital gains 12 14 Method of dividend taxation full imputation partial relief Combined tax rate on distributed profits: Listed firms : Non-listed firms Capital income, = 90 t€ > 90 t€
29
29
40.5
26
40.5 Tax rate on net wealth 0.9 0 (2006)
3. THEORETICAL BACKGROUND
This section discusses the changes in incentives to invest and distribute dividends caused by
the 2005 tax reform. We first introduce three theories of the effects of dividend taxation: the
old view, the new view and the irrelevance view, and discuss how these predict short-run and
long-run behavioural changes. After that, we provide a more detailed analysis of the reform
by studying the changes in firms’ cost of capital, first for closely held corporations (all
corporations not listed on the stock exchange) and then for listed companies. Finally, we
discuss to what extent our data and the 2005 reform can be used to assess the theories
presented in this section.
3.1 Alternative views of dividend taxation
The old view of dividend taxation (Harberger 1962, 1966; Poterba & Summers 1985),
assumes that the marginal source of funds to finance new investments is new equity issued in
external capital markets. It predicts that dividend taxation raises the cost of capital and thus
has a negative impact on investments, dividends and overall economic efficiency in the
economy.

10
The new view (King 1974, Auerbach 1979, Bradford 1981), on the other hand, assumes that,
at the margin, investment is financed by cutting dividend distributions. Hence the firm’s
marginal source of funds is retained earnings. In this setting, dividend taxes reduce both the
cost of the investment and its future return. If the tax rate on dividends stays constant over
time, it reduces both the costs and revenues in the same proportion, and hence has no effect
on the firm’s cost of capital or dividend distributions. The dividend tax terms cancel out the
firm’s investment condition. So, while the old view has it that the burden of dividend tax falls
entirely on marginal investment projects and thus raises the cost of capital, the new view
predicts that dividend taxes capitalize into share values and leave the cost of capital intact.
Observe, however, the assumption of a constant dividend tax rate (new view).
The third key theory of the effects of dividend taxation, the irrelevance view (Stiglitz 1973),
claims that, at the margin, firms finance their real investments with debt or by cutting their
stock of financial capital. Due to the deductibility of interest costs in corporate taxation, the
firm’s cost of capital corresponds to the interest rate.9 Corporate and personal taxes only fall
on intra-marginal profits and leave the cost of capital unaffected.
While the new and old views analyse firm behaviour in the steady state (mature firm), the so-
called nucleus theory, elaborated in Sinn (1991), expands the scope of the dividend tax
theories to the birth and growth phases of a firm. It claims that the neutrality of the new view
breaks down in the case of a growing firm, even if the marginal source of financing is
retained earnings. It also claims that the cost of capital for the initial investment (the firm’s
birth stage), financed with outside equity, is high much higher than the cost of capital of
mature firms, as suggested by the old view.
Recent research has discussed the implications of dividend tax theories in the case of an
anticipated dividend tax change (Korinek and Stiglitz 2009, Auerbach and Hassett 2007 and
Kari et al. 2008). Such tax changes induce firms to engage in inter-temporal tax arbitrage by
shifting dividend payments from high-tax periods to low-tax periods. The goal is to reduce
the present value of the owners’ taxes. In the case of a future dividend tax hike, for example,
firms will aim to benefit from the present low tax rate by increasing distributions before and
reducing them after the tax increase. This short-run effect on dividends applies regardless of
the marginal source of funds and hence under all the above three theories (Table 3.1).

11
However, this shock slowly fades away and in the long run dividends return to their
equilibrium level. Observe that for the old view this long-run level is lower than the original
level and for the new view and the irrelevance view the long-run level is basically the old
one.
The short-run effect of an anticipated dividend tax cut on investment10 seems more
complicated. Under the old view it is likely that a dividend tax increase leads to a reduction
in investment both before and after the reform. The reason is that the tax increase reduces the
present value of after-tax dividends regardless of the timing of an investment, before or after
the anticipated reform.
The new view basically predicts no change in investments after the reform but a decrease in
investments in the anticipation phase. The reason for the latter outcome is that the tax
increase reduces the present value of the after-tax dividend stream while the opportunity cost
of investing is left unchanged. This increases the firm’s cost of capital and affects negatively
the amount invested before the reform (Korinek and Stiglitz 2009). After the reform, the
opportunity cost of investing also declines and the cost of capital returns to its original level.
Under the tax irrelevance view the neutrality of dividend taxation in respect of investment
applies both in the anticipation stage and after the reform. Investment is solely determined by
the cost of debt, which is not affected by the tax treatment of dividends.
Note, however, that if firms are cash-constrained, the extra dividends paid by the firms in the
anticipation phase can lead to reduced investments during the anticipation years and, if the
effect is very strong, also during the first years after the reform. This can happen both under
the tax irrelevance view and the new view. 11
____________________ 9 This assumes that the corporate tax base before interest deduction equals the economic profit. 10 The reform may affect investment not only through the firm’s cost of capital but also through second-order general equilibrium effects. We focus in this paper on the cost of capital effects. 11 In the model by Korinek and Stiglitz (2009) investment opportunities are stochastic and due to capital market imperfections the firm holds cash balances to be able to quickly respond to investment opportunities as they arise. An increase in dividends as a response to an anticipated tax cut leads to a transitory reduction in cash balances and further to reduced investments until the optimal amount of cash has been restored through internal savings.

12
This discussion is summarised in Table 3.1, which summarises the predictions of the three
theories for the short-run effects. The minus sign in parenthesis refers to the potential
negative effects on investment in the case of credit-constrained firms.
Table 3.1. Short-run effects of an anticipated dividend tax cut. Dividend Investment Anticipation
stage After reform Anticipation
stage After reform
Old view + - - - New view + - - 0 (-) Tax irrelevance view + - 0 (-) 0 (-)
In Kari et al. (2008), we observe a sizeable abnormal increase in dividends by firms which
expected an increase in dividend taxation in 2005. The observation was interpreted as
evidence of an anticipatory response to the reform. As regards investment, however, we did
not find any statistically significant change in the anticipation phase. Hence when we focus
on the behavioural responses of firms to the reform in the years after its implementation, we
may expect to find a (short-run) drop in dividends regardless of which theory best describes
behaviour. For investments the situation is different. While the old view predicts an
unambiguous drop in investments, the two other views predict an unchanged level of
investment if firms are not credit-constrained in the years following the reform.
3.2 The effect of the tax reform on the cost of capital
This section analyses the effects of the Finnish 2005 tax reform on the long-run cost of
capital. The treatment is split into two sections because tax rules for non- listed and listed
firms differ widely in the Finnish dual income tax system. Two alternative sources of finance
are discussed: retained earnings and new share issues. The cost of capital for debt-financed
investment did not change in the reform.
Closely held corporations: the effects of the split model
Under the Finnish dual income tax, all dividends received by individual shareholders from
non- listed companies are subject to a split into capital income and earned income. Due to the

13
tax rate gap between these income types, this system is likely to distort firms’ investment and
dividend decisions. These special incentive effects are non-existent in the case of listed firms.
Hietala and Kari (2006)12 derive the following expression for the cost of capital of a non-
listed company:13
(1) ρβαπ −= rKK )( ,
where π depicts operating profit, K is the capital stock, r is the gross real rate of return
required by the owner and ρ is the splitting parameter that determines the maximum amount
of dividends taxable as capital income. Any dividends in excess of that amount of are taxed
as earned income.
Assuming the “new view” case, under which investment is financed from retained earnings,
α takes the standard form
(2) )1)(1(
1
gf
c
τττ
α−−
−=
where τc is the (proportional) tax rate on capital income, τf is the corporate tax rate and τg is
the accrual effective tax rate on capital gains.
If the firm’s distribution exceeds the maximum amount of dividends taxable as capital
income, i.e. dividends are taxed as earned income at the margin, β takes the value
(3) )1)(1( ef
ce
ττττ
β−−
−=
where τe is the marginal tax rate on earned income.
12 Incentives in the Finnish tax system before the reform are also covered in Lindhe, Södersten and Öberg (2004). 13 Here we leave aside the effect of net wealth taxation to simplify the analysis. For investors whose taxable net wealth exceeded the threshold this tax produced a small additional burden on equity-financed investment in the pre-reform tax system.

14
Hence in (1) and in (2) and (3), the first term equals the standard-form expression of the cost
of capital under the new view. The second term captures the special incentive effects of the
Finnish DIT, produced by the tax rate gap and the method of calculating imputed capital
income. For an owner with τe > τc the second term βρ is positive and hence takes the firm’s
cost of capital below its standard level. Observe that the term depends on dividend taxes even
if the new view assumptions are satisfied.
The 2005 tax reform mainly changed the values of the tax parameters but left the broader
structure of the taxation of profits intact. Table 3.2 below shows the calculations made by
Hietala and Kari (2006) on the cost of capital of non-listed firms in the old and the new tax
system. 14
The figures show that in the case where dividends are taxed entirely as capital income
(Section A), the reform slightly lowered the cost of capital. This decrease is the result of two
opposing changes. The cut in the corporate tax rate reduces the cost of capital (equations (13)
and (16) in Hietala and Kari), while the increase in the effective capital gains tax rate
increases it. Observe that the dividend tax rules, including the 90,000 euro threshold, do not
have any effect here. This is an implication of the new view.
Table 3.2. Cost of capital for non-listed firms in the old and new tax systems (retained earnings).
Dividends taxed at the margin as … B. Earned income Marginal tax rate on earned income
Regime A. Capital income
31.92 35.92 41.92 47.92 54.92
4.4 3.8 2.9 1.8 0.32
New system ≤ 90,000 € > 90,000 € 7.9
7.5 7.0 6.2 5.4 4.2 Old system 8.0 7.4 6.5 5.0 3.1 0.2
In the case where dividends are taxed as earned income at the margin (Section B), the nature
of the change depends on the owner’s marginal tax rate (MTR) τe and also whether dividends

15
exceed 90,000 euros or not. The cost of capital decreases in most cases when dividends are
below the threshold and increases in the opposite case. Observe that the cost of capital is
very low, close to zero, when the owner’s MTR is high.
We have thus far excluded the effect of the repeal of net wealth taxation as from 2006. This
tax raised the level of the cost of capital by 0.4-0.6 per centage points if an entrepreneur paid
this tax in the margin. So the effect of the repeal of the tax as from 2006 either made the
reduction in the cost of capital larger or the increase smaller by the same amount.
Let us next consider the incentive changes in the old view case, i.e. when an investment is
financed by new share issues (see Hietala-Kari 2006, Table 7). The changes follow a fairly
similar pattern in the case where dividends are taxed as earned income. The reform increased
the cost of capital for firms above the 90,000 euro threshold and lowered it below the
threshold in most cases.
The main difference in the changes in the cost of capital between the two financing forms
occurs when dividends are taxed entirely as capital income. The old view assumptions now
lead to the outcome that the 90,000 euro threshold very much affects the level of the cost of
capital. The parameters α and β of the cost of capital formula (1) are now
(4) )1)(1(
1
df
c
τττ
α−−
−= and β = 0.
Where τd is the tax rate on dividends. It takes the value τd = 0 under the old system (due to
the full imputation credit), and τd = 0 below the threshold (exemption) and τd = 19.6% above
the threshold (70% taxable at 28%) under the new tax system.
Table 3.3. The cost of capital for non listed firms, dividends taxed as capital income (new share issues). Regime Old tax system New tax system Div = 90,000 € 7.0 6.8 Div > 90,000 € 7.0 8.5
____________________ 14 The calculations assume r= 7% and no inflation. The effective tax rate on capital gains τg is 12 per cent under the pre-reform regime and 14 per cent under the post-reform regime, calculated using the approach introduced in King (1977).

16
As Table 3.3 shows, the cost of capital is slightly reduced when dividends are below the
threshold and the cost of capital is notably increased above the threshold. If we include the
effect from the repeal of the net wealth tax, the reduction (= 90,000 euros) is 0.4-0.6 per cent
points higher and the increase (> 90,000 euros) smaller by the same amount.
Listed corporations
For listed corporations the cost of capital follows from (1) with β=0 and α as in (2) in the
new view case and as in (4) in the old view case. Table 3.3 calculates the change in the cost
of capital using the same parameter values as above.
Table 3.4. The cost of capital for listed corporations . Financing form Old tax system New tax system Retained earnings (new view) 8.0 7.9 New share issues (old view) 7.0 8.5
3.3 Testable hypotheses
Consider first non-listed firms. The differences between Tables 3.1 and 3.3 provide an
interesting opportunity to test to which model actual behaviour corresponds more closely. For
this, we first divide firms into two groups: those that distribute dividends at the margin as
earned income and those who distribute dividends at the margin as capital income. For the
first group, the tax reform moved the cost of capital in the same direction both according to
the old and the new view. This implies that the behaviour of firms that distribute excess
dividends taxed as earned income cannot be used to distinguish between the old and the new
view.
Firms that distribute dividends as capital income can be further divided into two groups:
firms whose dividend distributions to the main shareholder are below the 90,000 threshold
and firms above the threshold. When dividends are below the threshold, there were no major
changes in the cost of capital either in the old or the new view case. However, when
dividends are above the threshold, the new view predicts that there were no major impacts in
the cost of capital, whereas according to the old view the cost of capital increased
substantially. This division can be used to separate firms into treatment and control groups.

17
The treatment group consists of firms that distribute dividends as capital income and their
dividend distribution is above the 90,000 threshold. All other firms are assigned to the control
group.
If the old view is correct, investments in the treatment group should decrease, relative to the
control group, due to an increase in the cost of capital as a result of the reform. If, however,
the new view or the tax irrelevance view is correct and the firms are not cash-constrained,
investments should not decrease more in treated firms. Hence we should be able to
differentiate between the old view and the new and irrelevance views if investments do not
decline. However, we do not have the tools to infer which of the latter two views explains the
outcome. And if investments are really reduced, this could in principle be due to the old view
or severe cash constraints that the firms will still have after having paid extra dividends
before the reform. Regarding dividends, we expect to see a short-run drop in dividends after
the reform and we will not be able to use this information in differentiating between the
different views.
Consider finally companies that are listed on the stock exchange (Table 3.4). For all domestic
individual owners, dividends became partially double-taxed after the reform. However, the
dividend tax did not affect domestic institutional owners or foreign owners. This means that
firms where most of the owners are domestic individual owners were more affected by the
tax increase than companies with foreign or institutional owners. This means that the larger is
the share of domestic individual owners, the more the cost of capital increased, , and
therefore that the larger this share is the more investments should decrease.
4. DATA AND THE EMPIRICAL APPROACH
The panel data employed contains information on the financial statements and taxation of
Finnish corporations in the period 1999–2006. It was collected by the Finnish Tax
Administration and is based on firms’ tax declarations. The data set also includes tax return
information on the principal shareholders of all dividend-distributing corporations. In
comparison to similar studies that use smaller data sets, an important quality of our data is
that there is no restriction on the size of the firm or the sector it operates in. However, since

18
the tax increase only affected relatively large firms, we removed the sma ller half of closely
held corporations (that is, 50% of firms according to the total value of their balance sheet)
from our sample to reduce the heterogeneity between firms that were affected by the tax
increase and firms in the control group. The descriptive statistics are presented in Appendix
1.
Our aim is to estimate the causal effects of a dividend tax increase on dividend distributions
and investment. Since the tax treatment differs depending on the stock market status of firms,
we examine listed and non-listed firms separately.
Estimation strategy for non-listed firms
Given what we know from Section 3, the idea is to investigate whether dividends and
investments are lower in closely held corporations that faced a dividend tax increase in 2005.
Since the tax increase is dependent on how much the firms pay out in dividends, firms can
themselves influence their tax bill and thus their treatment status. To overcome this problem,
we determine the treatment status based on pre-reform dividend levels at a time when the
future tax details were unknown. Hence the firm is placed in the treatment group if it
distributed a large amount (more than 90,000 euros) of normal dividends taxed as capital
income before the reform. Otherwise the firm is placed in the control group. Using this
strategy the treatment status is exogenous to the firms at the time of the tax increase.
This idea is analysed by the differences-in-differences approach. We first use regression-
based differences-in-differences specifications of the fo llowing type (here for investments)
titititiiti aftergroupaftergroupXinv ,,,, * εγηδβα +++++= ,
where inv denotes real investments in firm i at time t, measured either as investments-to-
assets ratios or as the log of investments. The variable group is assigned a value of 1 if the
firm is in the treatment group and otherwise 0, while after is a time dummy which is 0 before
the reform and 1 after the reform. Our main interest is in the interaction of these two, the tax
increase variable group*after, which is 1 in 2005 for firms whose dividends, taxed as capital
income, exceeded the 90,000 euro threshold before the reform, and otherwise 0.

19
We also include a group of control variables, X. For the sake of comparability with the
matching estimates (discussed below), the set of control variables is the same as those used in
the matching procedure to explain the propensity score, and includes the number of
employees, turnover, the total value of the balance sheet, the level of indebtedness, profits,
and the third-order polynomial of all these variables. The constant is either the same for all
firms or firm specific, depending on the specification. When we do not include a firm-
specific dummy variable, the standard errors are adjusted for clustering by firms. When no
firm-levelfixed effect is included, we also include dummies for industry and region in the
control variables.
The identifying assumption is that, apart from the tax increase, all other factors that affect
investment behaviour stay constant over time, so that these unobservable factors can be
captured by firm or group- level fixed effects. While unobservable factors can always be
present, we are not aware of any other reasons why investment behaviour might change over
these years differently for firms in different groups. The fact that we can separate firms
depending both on their ownership status and the level of dividend payments implies that in
our empirical strategy we can control for more differences among firms than is usually the
case in empirical tax analysis. This, in our view, increases confidence in interpreting the
estimates as causal effects.
To further reduce the scope for other potential differences between treated and non-treated
firms, we combine propensity score matching with the difference- in-differences analysis,
inspired by the ideas of Heckman, Ichimura and Todd (1997).15 The benefit of this method is
that it makes the treated firms and the control group firms as similar as possible in terms of
the observable variables, which is likely to be important in our case, since the size of the
firms in the control group is on average much smaller than the size of the treated firms.
In this method, we match firms according to their pre-reform observable variables and then
examine if the change in investments differs between matched pairs of treated and non-
treated firms. In more formal terms, we estimate the average treatment effect on the treated
(ATT) as follows:
15 For an intuitive overview of matching methods, see e.g. Blundell and Costa Dias (2000).

20
( )∑ ∑∩∈ ∩∈
−−
−−−=
STi SCjjtjtijitit
T
invinvinvinvN
ATT 11 )0()0()0()1(1
ω ,
where TN is the number of units in the treatment group, T refers to the treatment group and
C to the control group, and S denotes the region of common support (see below). The
estimator compares the change in the outcome variable, here investment in treated firms,
from the pre (time t-1) to the post-reform (time t) period, 1)0()1( −− itit invinv , and to the
weighted corresponding change in the control group, ( )∑∩∈
−−PSCj
jtjtij invinv 1)0()0(ω . Here 0
refers to a situation with no tax increase and 1 to the outcome with the tax increase, and ω
denotes the weight used for the control group observations.
The weights are determined on the basis of propensity score estimates. The idea is to explain
the propensity score, i.e. the probability of facing a tax increase (in this case, that dividend
payments are above the taxable threshold before the reform), with a set of observable
variables. We use a probit regression to explain this probability using pre-reform values of
the following variables: number of employees, turnover, total value of the balance sheet,
level of indebtedness, and profits, and the third-order polynomial of all these variables. We
use both nearest neighbour and kernel matching, using in the former case one nearest
neighbour and in the latter case the Epanechnikov kernel. With nearest neighbour matching,
each treated firm is matched with one firm from the control group with the nearest value for
the propensity score. In the case of kernel matching, a number of control group firms are used
as a comparison with each treated firm. These control group firms come from a certain area
with the values of the propensity score close enough to the corresponding value for the
treated firm. This area is called the bandwidth, and we also conduct sensitivity analysis in
respect of the bandwidth in kernel matching. Within the bandwidth, firms closest to the
treated firm, in terms of the propensity score value, get the highest weight.
The common support assumption (that only firms that have the characteristics of X that are
simultaneously observed for both treated and control firms are compared) is invoked. As
usual, the standard errors are obtained by bootstrapping. Tests of how well matching
succeeded are also provided.

21
Because the outcome variable is the change in investment, we can allow for time- invariant
differences in levels of investment between firms in the treatment and the control groups. But
of course we need to assume, as in the regression-based difference- in-differences analysis,
that investments by firms in the control group would have evolved from the pre- to the post-
reform period in the same way as investments by firms in the treatment group would have
done had these firms not been treated.16
Above, we consider the impacts of the dividend tax increase on investments. We also
examine the corresponding effects on actual dividend distributions. In the specifications
above, investment variables are replaced with variables measuring dividend payments; all
other variables and estimation techniques remain the same.
There are also some additional complications that need to be considered. First, the measure of
how close to the threshold level the dividends are in the pre-reform period can affect the
incentives to reduce dividends. We therefore examine the robustness of dividend and
investment regression results to changes in the threshold levels for pre-reform dividends.
Second, and probably most seriously, we need to take into account that the reform was
common knowledge as of the latter part of 2003, when the government’s tax reform plan was
published. Even a year before that, in November 2002, an initial blueprint for the reform,
designed by a group of tax lawyers nominated by the government, was unveiled. This plan
also included a tightening in the tax treatment of dividends. For these reasons, company
managers had ample time to plan dividend distributions in advance so as to obtain tax savings
by distributing relatively more dividends before than after the reform. In Kari et al (2008), we
indeed find strong empirical support that dividend payments increased in 2003 and 2004 in
firms that anticipated a tax increase on their dividend distributions after the reform. If we
simply took the 2003 or 2004 values, we would therefore mistakenly document a strong drop
in dividend behaviour for treated firms after the reform. In order to deal with this problem,
the pre-reform data is taken from years when the tax bill was unknown. In the basic analysis,
we use the mean values for 2000-2002, but we also analyse the sensitivity of the results to the
selected pre-reform years. The year after the reform is 2006, when all the elements of the tax
16 Since we examine a balanced panel where the difference in investment is measured within the same firm, there is less need to use the post-reform values of observable variables in matching than would be the case if the data came from repeated cross-sections. For an analysis (for a different research topic) where matching combined with difference-in-differences is used in the same manner as here, see Huttunen (2007).
22
reform were in force and the tax rules should have been common knowledge to company
managers.
Estimation strategy for listed firms
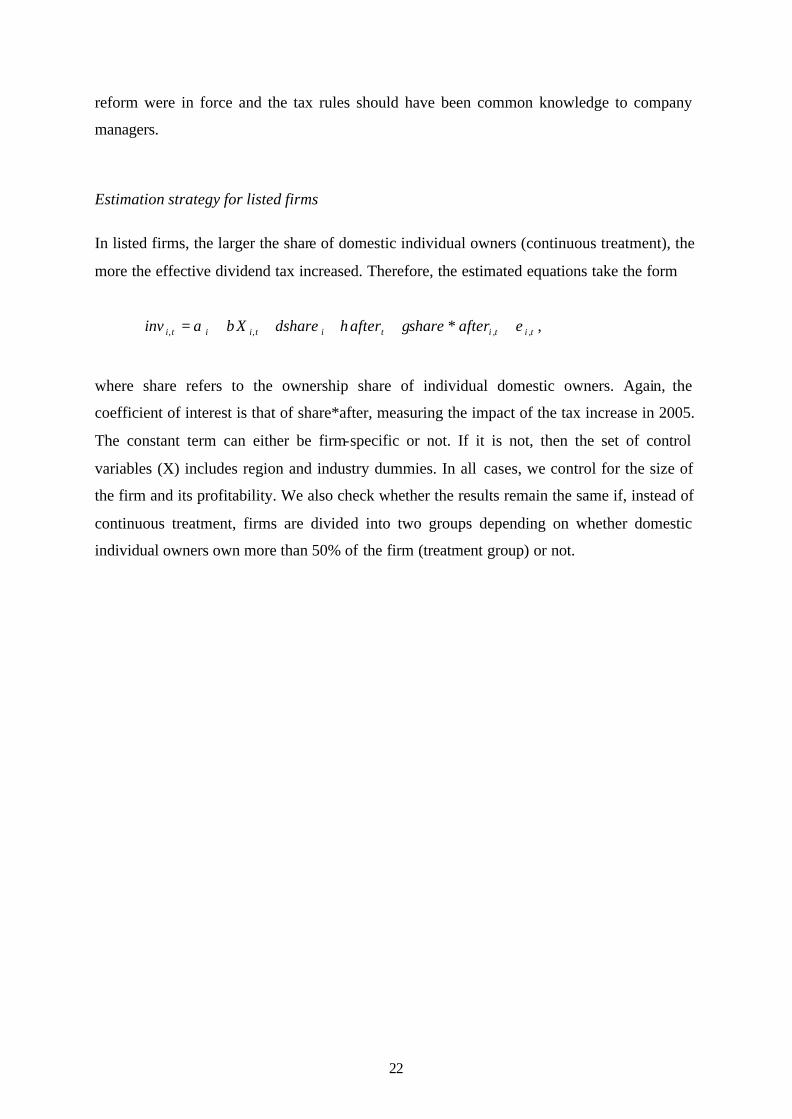
In listed firms, the larger the share of domestic individual owners (continuous treatment), the
more the effective dividend tax increased. Therefore, the estimated equations take the form
titititiiti aftershareaftershareXinv ,,,, * εγηδβα +++++= ,
where share refers to the ownership share of individual domestic owners. Again, the
coefficient of interest is that of share*after, measuring the impact of the tax increase in 2005.
The constant term can either be firm-specific or not. If it is not, then the set of control
variables (X) includes region and industry dummies. In all cases, we control for the size of
the firm and its profitability. We also check whether the results remain the same if, instead of
continuous treatment, firms are divided into two groups depending on whether domestic
individual owners own more than 50% of the firm (treatment group) or not.

23
5. EMPIRICAL RESULTS
For a preliminary view of what the data is telling us, we compare the pattern of mean
dividends between the treatment and control groups in the period of 1999–2006 in Figures
5.1 and 5.2.
Figure 5.1. Median dividend in listed corporations .
0
1
2
3
4
5
6
7
1999 2000 2001 2002 2003 2004 2005 2006
Mill
ion
Eu
ros
Treatment group Control group
Figure 5.2. Median dividend in non-listed corporations .
0
50
100
150
200
250
300
350
1999 2000 2001 2002 2003 2004 2005 2006
Thou
sand
eur
os
Treatment group Control group

24
This information suggests that the median dividend in the treatment group increased in 2003
and 2004 compared to the mean dividend in the control group. This is probably a sign of
anticipation effects; more about this in Kari et al 2008. However, a more relevant observation
from this paper’s point of view is a moderate decrease in treatment group dividends
compared to control group dividends in 2005.
Table 5.1 provides more information on the mean change in dividends and investments in
treatment and control firms.17 In non- listed firms, dividends increased in firms in the control
group, whereas they fell in treated firms. Investments in non- listed firms do not follow any
clear pattern. In listed firms, dividends increased and investment dropped, but there were no
systematic differences in these changes between treatment and control firms.
Table 5.1. Comparison of treated and non-treated firms. a) Non-listed firms ddivid, million € dlogdivid dinv, million € dloginv non-treated .033929 .4128043 -.0780709 -.1520273 (3.073787) (1.007568) (14.02529) (1.783085) [42489] [21081] [43866] [26931] treated -.0725417 -.0537045 .0094096 -.3917077 (1.002207) (.8754251) (1.378833) (1.525629) [800] [653] [808] [598]
b) Listed firms ddivid, million € dlogdivid dinv, million € dloginv non-treated 9.388596 .7592586 -6.606392 -.2550419 (171.1179) (1.015789) (56.93541) (1.872465) [84] [59] [82] [79] treated 3.360575 .5090159 -.3964901 -.2230041 (14.58871) (.7642247) (4.636289) (1.903146) [37] [25] [34] [34]
Notes: The mean change in dividends (ddivid), the log of dividends (dlogdivid), investments (dinv) and the log of investments (dloginv) in firms facing a tax increase or not. Standard errors in parentheses and the number of observations in squared brackets.
17 For expositional purposes, listed firms are also divided here into treatment and control groups, depending on whether the main shareholder is a domestic individual owner or not.

25
5.1. Dividends in non-listed firms
As argued above, our interest is to examine whether dividends per shareholder were reduced
below the threshold level of 90,000 euros. Some support for this hypothesis is received from
Figure 5.2, which plots the distribution of dividends before and after the reform. In the
interval of 50,000 to 200,000, one can see a peak under the 90,000 threshold (the vertical
line) where dividends become taxable in 2005. There were no peaks around that dividend
level in any years before the reform.
Figure 5.2. Distribution of dividends in non-listed firms before and after the tax reform.
0.1
.2
50000 100000 150000 50000 100000 150000
pre reform post reform
Fra
ctio
n
Dividends per main shareholderGraphs by vuosi
The actual estimation results concerning the change in the magnitude of all dividends18 paid
out by non- listed corporations are presented in Table 5.2. We used both dividends directly (in
millions of euros) and the logarithm of dividends as dependent variables. The estimation
results of the model specification with a group dummy are presented in columns (1) and (3)
and the results of the specification with a firm-level dummy in columns (2) and (4). As
18 In the regressions below, the dependent variable is all dividends paid by the firm instead of dividends to the main shareholder. If we used the latter measure, we might document a dividend drop even if total dividends did
26
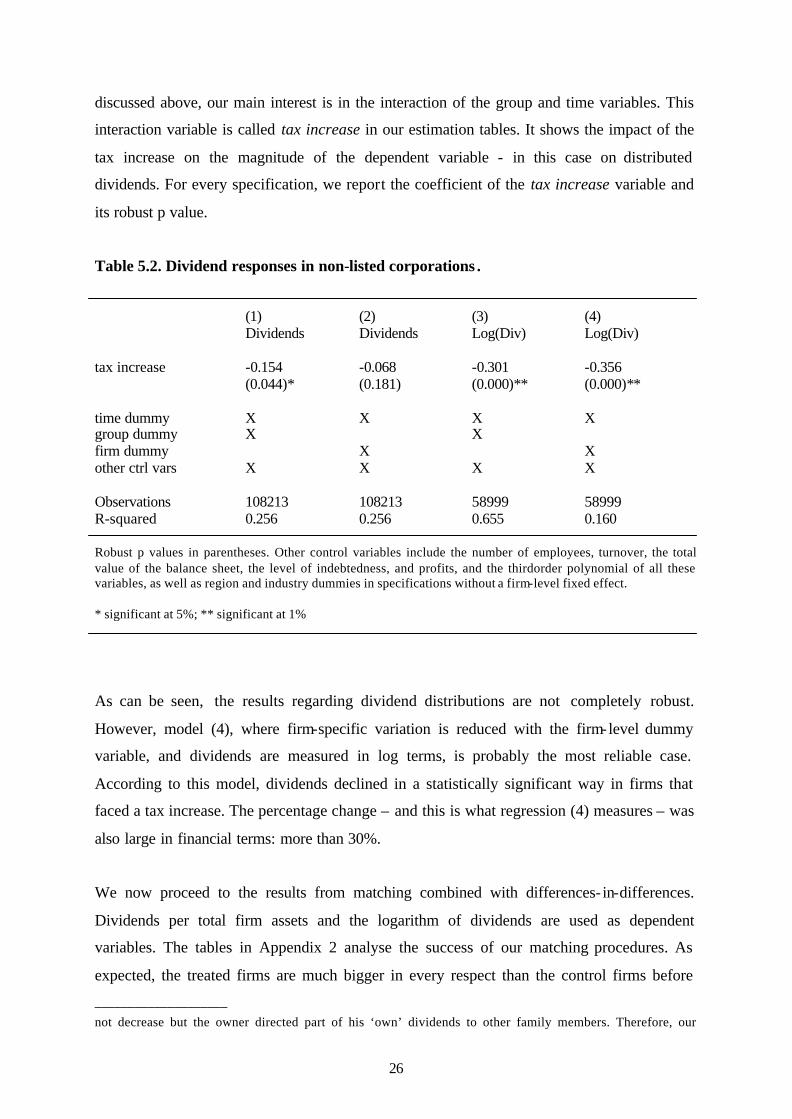
discussed above, our main interest is in the interaction of the group and time variables. This
interaction variable is called tax increase in our estimation tables. It shows the impact of the
tax increase on the magnitude of the dependent variable - in this case on distributed
dividends. For every specification, we report the coefficient of the tax increase variable and
its robust p value.
Table 5.2. Dividend responses in non-listed corporations . (1) (2) (3) (4) Dividends Dividends Log(Div) Log(Div) tax increase -0.154 -0.068 -0.301 -0.356 (0.044)* (0.181) (0.000)** (0.000)** time dummy X X X X group dummy X X firm dummy X X other ctrl vars X X X X Observations 108213 108213 58999 58999 R-squared 0.256 0.256 0.655 0.160 Robust p values in parentheses. Other control variables include the number of employees, turnover, the total value of the balance sheet, the level of indebtedness, and profits, and the thirdorder polynomial of all these variables, as well as region and industry dummies in specifications without a firm-level fixed effect. * significant at 5%; ** significant at 1%
As can be seen, the results regarding dividend distributions are not completely robust.
However, model (4), where firm-specific variation is reduced with the firm-level dummy
variable, and dividends are measured in log terms, is probably the most reliable case.
According to this model, dividends declined in a statistically significant way in firms that
faced a tax increase. The percentage change – and this is what regression (4) measures – was
also large in financial terms: more than 30%.
We now proceed to the results from matching combined with differences- in-differences.
Dividends per total firm assets and the logarithm of dividends are used as dependent
variables. The tables in Appendix 2 analyse the success of our matching procedures. As
expected, the treated firms are much bigger in every respect than the control firms before
____________________
not decrease but the owner directed part of his ‘own’ dividends to other family members. Therefore, our

27
matching, but both the nearest neighbour and the kernel matching methods succeed in
reducing these differences to a very large extent.19
The estimates of the average treatment effects on the treated (ATT) are reported in Table 5.3.
We report the coefficient of the treatment effect and the bootstrapped standard errors. The
coefficient of the ATT is statistically significant in models with logged dividends and
negative but not so significant in models with dividends in euros as the outcome variable.
When firms are matched, the results provide some evidence that dividend distributions
declined in firms that faced a tax increase. In addition, the point estimate also increases,
suggesting that dividends dropped by roughly 40 per cent in firms whose dividend taxation
increased. Among the estimators we study, propensity score matching with the outcome
variable in the first differences probably performs best by eliminating potential biases most
effectively.
Table 5.3. Dividend responses in non-listed corporations: Matching estimates. d(Dividends) dLog(Divid) NN Kernel NN Kernel ATT (std error)
-0.310 (0.179)
-0.215** (0.079)
-0.417** (0.091)
-0.387** (0.053)
Obs 693 37865 570 19395 Results from propensity score matching, dependent variable either the change in dividends or the change in the log of dividends. The propensity score is estimated with a probit model with the number of employees, turnover, the total value of the balance sheet, the level of indebtedness, and profits, and the third-order polynomial of all these variables as explanatory variables. The common support assumption is invoked. Bootstrapped standard errors in parenthesis. The matching method is either nearest neighbour or Epanechnikov kernel matching with a bandwidth of 0.05.
In sum, while the results regarding dividend distributions are not entirely robust, it seems that
reducing the scope for the potential differences between the treated and non-treated firms
indicates that dividends decreased more in firms that faced higher taxes.
One potential worry in the estimates below is that the results are sensitive to some
extraordinarily large dividend payouts in pre-reform years (2000-2002), which put some
firms in the treatment group even if they in some sense should not be there. To examine the
seriousness of this risk, we determined the treatment status on the basis of mean dividends in
____________________
dependent variable is closer to the notion of real behavioural changes. We return to this issue in Section 5.3
28
1998-2002, which reduces the weight given to outlying values from a single year. The results
remained essentially the same with this modification. 20
We also conduct sensitivity analysis in respect of the limit of 90,000 euros. The treatment
consists of firms whose dividend payments exceeded the threshold before the reform, which
means that the limit that affected the behaviour of firms might differ from 90,000 euros. In
addition, the tax reform of 2005 reduced the corporate tax rate from 29 to 26 per cent. In
some cases, this reduction lowered the total tax burden of a firm even if its dividends
exceeded 90,000 euros. The results of the sensitivity analysis concerning both dividend and
investment, based on matching methods – since these are our preferred specifications – are
reported in Appendix 3. The pattern of the results remains broadly the same irrespective of
whether the treatment group consists of firms whose dividend payments exceeded either
70,000 or 100,000 euros before the reform. However, the dividend drop appears to be bigger,
the higher the threshold value used.
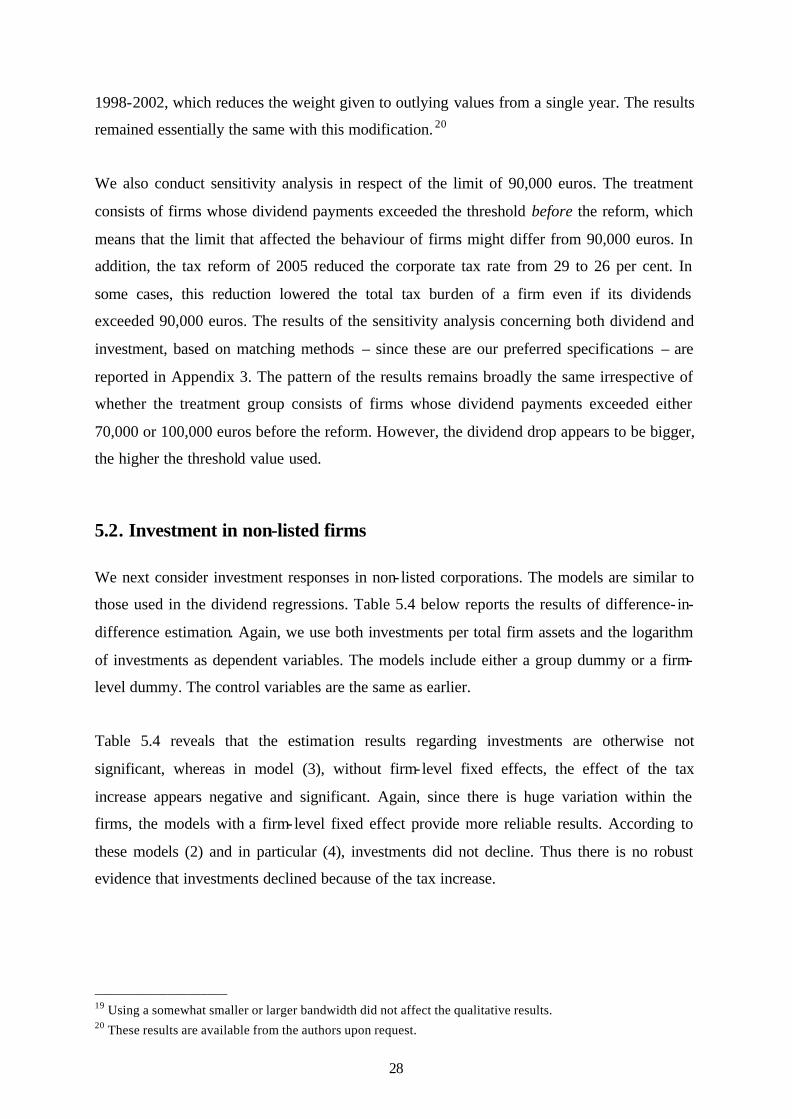
5.2. Investment in non-listed firms
We next consider investment responses in non- listed corporations. The models are similar to
those used in the dividend regressions. Table 5.4 below reports the results of difference- in-
difference estimation. Again, we use both investments per total firm assets and the logarithm
of investments as dependent variables. The models include either a group dummy or a firm-
level dummy. The control variables are the same as earlier.
Table 5.4 reveals that the estimation results regarding investments are otherwise not
significant, whereas in model (3), without firm-level fixed effects, the effect of the tax
increase appears negative and significant. Again, since there is huge variation within the
firms, the models with a firm-level fixed effect provide more reliable results. According to
these models (2) and in particular (4), investments did not decline. Thus there is no robust
evidence that investments declined because of the tax increase.
____________________ 19 Using a somewhat smaller or larger bandwidth did not affect the qualitative results. 20 These results are available from the authors upon request.
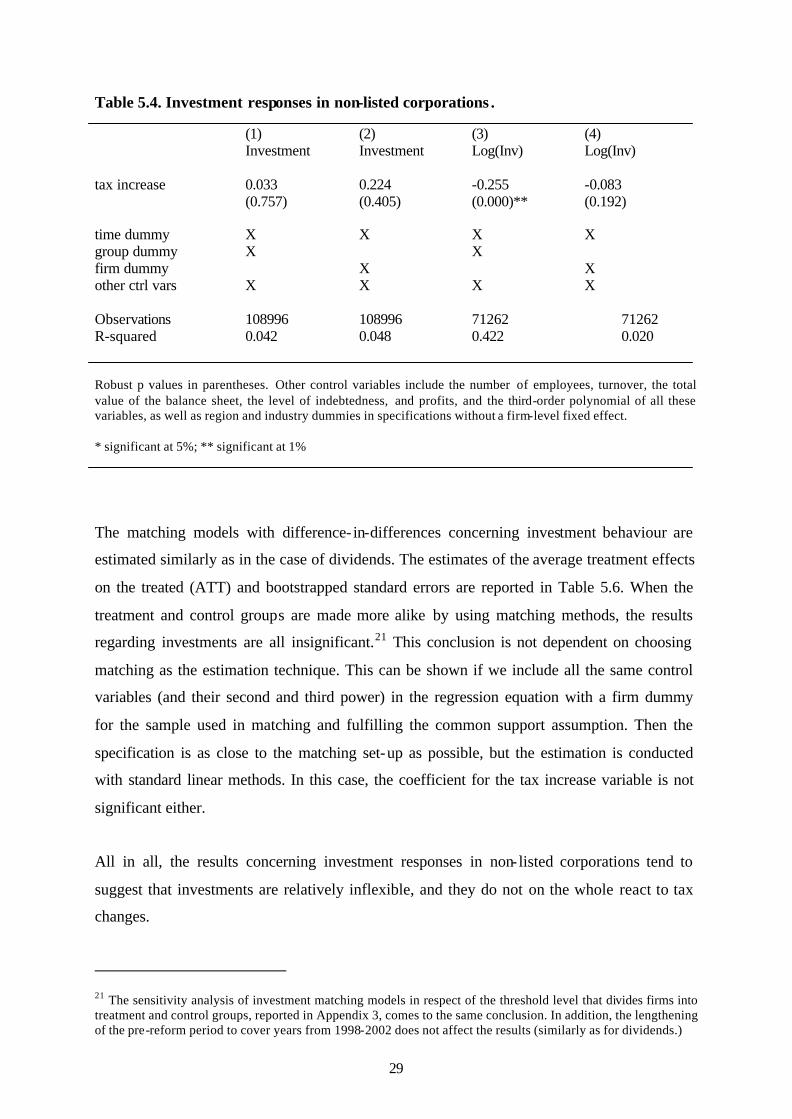
29
Table 5.4. Investment responses in non-listed corporations . (1) (2) (3) (4) Investment Investment Log(Inv) Log(Inv) tax increase 0.033 0.224 -0.255 -0.083 (0.757) (0.405) (0.000)** (0.192) time dummy X X X X group dummy X X firm dummy X X other ctrl vars X X X X Observations 108996 108996 71262 71262 R-squared 0.042 0.048 0.422 0.020 Robust p values in parentheses. Other control variables include the number of employees, turnover, the total value of the balance sheet, the level of indebtedness, and profits, and the third-order polynomial of all these variables, as well as region and industry dummies in specifications without a firm-level fixed effect. * significant at 5%; ** significant at 1%
The matching models with difference- in-differences concerning investment behaviour are
estimated similarly as in the case of dividends. The estimates of the average treatment effects
on the treated (ATT) and bootstrapped standard errors are reported in Table 5.6. When the
treatment and control groups are made more alike by using matching methods, the results
regarding investments are all insignificant.21 This conclusion is not dependent on choosing
matching as the estimation technique. This can be shown if we include all the same control
variables (and their second and third power) in the regression equation with a firm dummy
for the sample used in matching and fulfilling the common support assumption. Then the
specification is as close to the matching set-up as possible, but the estimation is conducted
with standard linear methods. In this case, the coefficient for the tax increase variable is not
significant either.
All in all, the results concerning investment responses in non- listed corporations tend to
suggest that investments are relatively inflexible, and they do not on the whole react to tax
changes.
21 The sensitivity analysis of investment matching models in respect of the threshold level that divides firms into treatment and control groups, reported in Appendix 3, comes to the same conclusion. In addition, the lengthening of the pre-reform period to cover years from 1998-2002 does not affect the results (similarly as for dividends.)

30
Table 5.3. Investment responses in non-listed corporations: Matching estimates. d(Investment) dLog(Inv) NN Kernel NN Kernel ATT (std error)
0.339 (0.444)
0.101 (0.144)
-0.050 (0.121)
-0.017 (0.065)
Obs 697 38365 562 25358 Results from propensity score matching, dependent variable either the change in investment or the change in the log of investment. The propensity score is estimated with a probit model with the number of employees, turnover, the total value of the balance sheet, the level of indebtedness, and profits, and the third-order polynomial of all these variables as explanatory variables. The common support assumption is invoked. Bootstrapped standard errors in parenthesis. The matching method is either nearest neighbour or Epanechnikov kernel matching with a bandwidth of 0.05.
5.3. An additional margin: changes in ownership
Since the 90,000 euro threshold is defined per person, owners of family firms could
potentially also influence their tax payments by spreading their ownership within their
family. We examine this using similar regression techniques as above, but with the
ownership share of the main owner as the dependent variable.22 The hypothesis then is that
owners whose dividends were large before the reform have a stronger incentive to reduce
their own ownership and distribute it to e.g. their children. The results (not reported here for
the sake of space) reveal that the sign of the tax increase variable is indeed negative, but it is
not statistically significant. Owners might have thus lowered their tax burden by other means
than simply cutting dividends. In any case, the measured dividend drop above represents a
real decrease in dividends since the dependent variable was all dividends paid by the firm.
5.4. Results for listed firms
The impact of the tax increase faced by listed firms on the magnitude of dividends and
investments is analysed using the same simple difference- in-difference estimation strategy as
in the case of non-listed firms. As earlier, we have two model specifications: one with a
group dummy and another with a firm dummy. Again, we used both dividends (investments)
per total firm assets and the logarithm of dividends (investments) as dependent variables.
22 The data set does not contain a more direct measure of ownership within the family.

31
Our main interest is in the interaction between the proportional share of domestic individual
ownership and time variables.23 In the case of listed firms, this measures the impact of the tax
increase in 2005. This is the variable tax increase in the estimation tables. We used the same
sets of control variables as in the previous analyses. The proportional share of ownership by
domestic individuals (dom ownership)is an additional control variable in specifications
without a firm-level fixed effect.
Table 5.7. Dividend responses in listed corporations . . (1) (2) (3) (4) Dividends Dividends Log(Div) Log(Div) tax increase -15.135 -47.373 -0.484 -1.158 (0.612) (0.087) (0.513) (0.024)* time dummy X X X X dom ownership X X firm dummy X X other ctrl vars X X X X Observations 189 189 124 124 R-squared 0.671 0.349 0.806 0.625 Robust p values in parentheses. Other control variables include turnover, profitability and employment as well as region and industry dummies in specs without a firm-level fixed effect. significant at 5%; ** significant at 1%
The estimation results regarding dividends (Table 5.7) mostly suggest that dividends in listed
companies did not drop more in firms that experienced a tax increase. The results across
specifications regarding investment (Table 5.8) indicate that investments did not change in
response to the tax reform. We conclude that listed firms did not change their dividend or
investment policy even when they faced fairly high tax increases. This implies that taxation
has only a minor impact on the financing decisions of listed firms or that it takes longer for
the effects of the tax increase to materialise.
23 We also categorised the share of ownership variable by dummy variables and used it and their interactions with the time variable in the estimation models. However, this did not change the results.

32
Table 5.8. Investment responses in listed corporations . (1) (2) (3) (4) Investment Investment Log(Inv) Log(Inv) tax increase -13.063 -3.569 -0.349 0.215 (0.134) (0.582) (0.649) (0.733) time dummy X X X X dom ownership X X firm dummy X X other ctrl vars X X X X Observations 186 186 135 139 R-squared 0.747 0.236 0.782 0.384 Robust p values in parentheses. Other control variables include turnover, profitability, employment and indebtedness as well as region and industry dummies in specs without a firm-level fixed effect. * significant at 5%; ** significant at 1%
6. CONCLUSION
This paper examines how dividend distributions and investments in Finnish corporations
reacted to the 2005 corporate and capital income tax reform. Since the reform treated
different types of corporations differently, it involved exogenous variations to their tax
treatment, offering an opportunity for promising empirical estimates. In addition, as the vast
majority of our data comes from non- listed companies, the analysis is not blurred – at least to
a large extent – by concerns of asymmetric information between owners and managers.
Our results indicate that dividend distribution declined somewhat after the reform. Since
there were large anticipatory increases in dividend distributions before the reform, this drop
can also be a reaction to these earlier, abnormally large dividend distributions. This part of
the results therefore serves as further confirmation of the results by Korinek and Stiglitz
(2009): anticipated tax changes lead to large impact on the timing of dividends. Since
dividends can be altered due to intertemporal tax planning also under the new view, the drop
in dividend distribution is compatible both with the old and the new view of dividend
taxation.

33
The results regarding investment do not indicate that investments declined more in firms that
were subject to a dividend tax increase. While this result must be interpreted cautiously
because our data covers a relatively short period (two years) after the reform, it is perhaps
more in line with the new rather than the old view of dividend taxation. Since the reform was
also known roughly two years in advance, the ‘effective’ reaction time for investment
decisions that we measure covers approximately four years, thus increasing the likelihood
that at least part of the long-term reactions are captured.
Another possibility is that firms suffer from liquidity constraints, and thus have lower
investment activity after paying extraordinarily high dividends in the years before the reform,
but on average this does not appear to be the case either for firms in our data set. However,
because the dividend tax hike in the Finnish case hit mature firms which were able to pay
large dividends even before the reform, this reform does not open up the best possibility to
examine the link between liquidity constraints and investments. And of course, even if this
dividend tax did not affect the investment of (mature) firms, a different kind of dividend tax
increase (which would also be faced by firms that are more likely to be young, growing
firms) could have different impacts.
REFERENCES
Alstadsaeter, A. and E. Fjaerli (2009) Neutral taxation of shareholder income? Corporate
responses to an announced dividend tax, forthcoming in International Tax and Public
Finance.
Alvarez, L.H.R., Kanniainen, V. and J. Södersten (1998) Tax policy uncertainty and
corporate investment. A theory of tax- induced investment spurts. Journal of Public
Economics 69, 17-48.
Auerbach, A. (1979) ‘Wealth maximization and the cost of capital’, Quarterly Journal of
Economics 94, 433–436.
Auerbach, A. – K.A. Hassett (2007): The 2003 Dividend Tax Cuts and the Value of the Firm:
An Event Study. In Auerbach, A. – Hines, J.R. – Slemrod, J. (eds.): Taxing Corporate
Income in the 21st Century, Cambridge University Press.

34
Bernheim, D. (1991) Tax policy and the dividend puzzle. RAND Journal of Economics 22,
455-76.
Blundell, R. and M. Costa Dias (2000) Evaluation methods for non-experimental data, Fiscal
Studies 21, 427-468.
Bond, S.R. – M.P. Devereux – A. Klemm (2007): Dissecting Dividend Decisions: Some
Clues about the Effects of Dividend Taxation from Recent UK Reforms. In Auerbach, A. –
Hines, J.R. – Slemrod, J. (eds.): Taxing Corporate Income in the 21st Century, Cambridge
University Press
Bradford, D. F. (1981) ‘The incidence and allocation effects of a tax on corporate distrib-
utions’ Journal of Public Economics 15, 1-22.
Chetty, R. – E. Saez (2005): Dividend taxes and corporate behavior: Evidence from the 2003
dividend tax cut. Quarterly Journal of Economics, vol CXX, 791–833.
Chetty, R. and E. Saez (2007) An agency theory of dividend taxation. NBER Working Paper
No. 13538.
Feldstein, M. (1970) ‘Corporate taxation and Dividend Behavior’, Review of Economic
Studies 37, 57-72.
Harberger, A.C. (1966) ‘Efficiency effects of taxes on income from capital’, in: M.
Krzyzaniak, ed., Effects of corporation income tax (Wayne State University Press, Detroit).
Heckman, J., H. Ichimura and P. Todd (1997) Matching as an econometric evaluation
estimator, Review of Economic Studies 64, 605-54.
Hietala, H. – Kari, S. (2006): Investment Incentives in Closely Held Corporations and
Finland’s 2005 Tax Reform, Finnish Economic Papers 19, 41–57.
Huttunen, K. (2007) The effect of foreign acquisition on employment and wages: Evidence
from Finnish establishments, Review of Economics and Statistics 89, 497-509.
King, M.A. (1974) ‘Taxation and the cost of capital’, Review of Economic Studies 41, 21–35.
Kari, S., H. Karikallio and J. Pirttilä (2008) ’Anticipating tax changes: Evidence from the
Finnish corporate income tax reform of 2005’, Fiscal Studies 29, 167-196.
Korinek, A. and Stiglitz, J.E. (2009) ‘Dividend taxation and intertemporal tax arbitrage’,
Journal of Public Economics 93, 142-159.

35
Lindhe, T. – Södersten, J. – Öberg A. (2004): Economic effects of taxing different
organizational forms under the Nordic dual income tax. International Tax and Public
Finance 11, 469–486.
Poterba, J.and L. Summers (1985) ‘The Economic Effects of Dividend Taxation’, in E.
Altman and M. Subrahmanyam, eds. Recent Advances in Corporation Finance (Homewood,
IL: Dow Jones-Irwin), 227-284.
Sinn, H.-W.– (1991) ‘The vanishing Harberger triangle’, Journal of Public Economics 45,
271–300.
Smith, J.A. and P.E. Todd (2005) Does matching overcome LaLonde’s critique of
nonexperimental estimators? Journal of Econometrics 125, 305-353.
Sørensen, P.B. (2005). ‘Neutral taxation of shareholder income’, International Tax and
Public Finance 12, 777-801.

36
APPENDIX 1: Descriptive statistics. Obs Mean Std. Dev. Min Max NON-LISTED FIRMS Dividends* 129255 .0853564 2.280798 0 600 Investment* 134138 .2084316 8.528886 0 2813.623 Turnover* 139520 3.403713 53.85463 0 11512.61 Nr of personnel 138899 21.11148 150.0728 0 16842 Balance sheet* 139451 6.614561 161.4212 .1288697 45093.78 Profit* 137436 -.6361726 301.3087 -111680.5 1743.529 Debt* 139397 2.519004 103.8281 -12.97514 26640.72 Net assets* 135867 1.263971 18.34198 -519.2112 2593.67 LISTED FIRMS Dividends* 267 45.31508 270.1771 0 4000 Investment* 257 13.91131 48.83482 .0009984 399.1752 Turnover* 241 306.6733 2138.952 .0035297 32212.98 Nr of personnel 267 745.6617 2233.524 1 28466 Balance sheet* 267 2152.083 15649.07 .2792644 248238.4 Profit* 228 31.70876 193.7652 -116.2483 2517.52 Debt* 267 828.0427 7348.071 0 117681 Domestic, individ owners 209 .3683637 .2867675 .0013 .9612
Note: Variables denoted by * are expressed in millions of EUR.

37
APPENDIX 2: Comparison of unmatched and matched firms in the treatment and control groups . a) Nearest neighbour matching Mean %reduct t-test Variable Sample Treated Control %bias bias t p>t turnover Unmatched 12.934 3.348 31.1 7.02 0.000 Matched 12.934 14.722 -5.8 81.4 -1.34 0.180 balance Unmatched 21.628 5.3637 25.9 5.41 0.000 statement Matched 21.628 24.05 -3.9 85.1 -1.07 0.284 nr of Unmatched 85.08 24.169 29.7 12.37 0.000 personnel Matched 85.08 95.101 -4.9 83.5 -0.81 0.421 profits Unmatched .97924 -2.8961 0.9 0.18 0.860 Matched .97924 1.0042 0 99.4 -0.33 0.739 debt Unmatched 4.374 2.367 2 0.37 0.710 Matched 4.374 4.8416 -0.5 76.7 -0.70 0.483
b) Kernel matching Mean %reduct t-test Variable Sample Treated Control %bias bias t p>t turnover Unmatched 12.934 3.348 31.1 7.02 0.000 Matched 12.934 14.531 -5.2 83.3 -1.12 0.261 balance Unmatched 21.628 5.3637 25.9 5.41 0.000 statement Matched 21.628 23.458 -2.9 88.7 -0.78 0.438 nr of Unmatched 85.08 24.169 29.7 12.37 0.000 personnel Matched 85.08 87.47 -1.2 96.1 -0.20 0.841 profits Unmatched .97924 -2.8961 0.9 0.18 0.860 Matched .97924 .7661 0.1 94.5 0.04 0.968 debt Unmatched 4.374 2.367 2 0.37 0.710 Matched 4.374 4.927 -0.5 72.4 -0.38 0.705

38
APPENDIX 3: Sensitivity analysis using matching with difference-in-differences. Dividend responses in non-listed corporations, dividend limit 70,000 euros
d(Dividends) dLog(Divid) NN Kernel NN Kernel ATT (std error)
-.074 (0.106)
-.144* (0.074)
-.357** (0.065)
-.345** (0.046)
Obs 879 37865 718 19395
Dividend responses in non-listed corporations, dividend limit 100,000 euros
d(Dividends) dLog(Divid) NN Kernel NN Kernel ATT (std error)
-0.351* (0.156)
-.289** (0.089)
-0.480** (0.087
-.403** (0.055)
Obs 562 37865 460 19395
Investment responses in non-listed corporations, dividend limit 70,000 euros
d(Investment) dLog(Inv) NN Kernel NN Kernel ATT (std error)
-.057 (0.073)
.064 (0.307)
-0.050 (0.121)
-0.017 (0.065)
Obs 883 38365 562 25358
Investment responses in non-listed corporations, dividend limit 100,000 euros
d(Investment) dLog(Inv) NN Kernel NN Kernel ATT (std error)
-.0988 (0.106)
.206 (0.352)
.095 (0.113)
.022 (0.084)
Obs 565 38365 461 25358