the impact of directive 2000/36/ec on the economies of ... chain and price developments..... 83...
TRANSCRIPT
LMC INTERNATIONAL
Prepared for:
European Commission - DG Agriculture and Rural Development Rue de la Loi 130 B - 1049 Brussels
Belgium
This study has been financed by the Commission of the European Union. The conclusions, recommendations and opinions presented in this report reflect the opinion of the consultant and
do not necessarily reflect the opinion of the Commission.
LMC International Ltd LMC International Ltd 14-16 George Street 1841 Broadway Oxford OX1 2AF New York, NY 10023 England USA Tel: +44 1865 791737 Tel: +1 (212) 586-2427 Fax: +44 1865 791739 Fax: +1 (212) 397-4756 Email: [email protected] Email: [email protected]
Website: http://www.lmc.co.uk
Ccsa501 June 2006
The Impact of Directive 2000/36/EC on the Economies of those Countries
Producing Cocoa and Vegetable Fats other than Cocoa Butter
Main Report

While LMC International has endeavoured to ensure the accuracy of the data, estimates and forecasts contained in this study, any decisions based on them (including those involving investment and planning) are at the client's own risk. LMC International can accept no liability regarding information, analysis and forecasts contained in this study.
Contents (i)
Table of Contents
Executive Summary....................................................................................................E1
EU Chocolate Consumption and Cocoa Imports ..........................................................E1 Vegetable Fat Imports and CBE Production.................................................................E2 Impact of the Directive on Cocoa and Vegetable Fat Producers..................................E7
Cocoa Producers.................................................................................................E7 Vegetable Fat Producers.....................................................................................E7
Conclusions ..................................................................................................................E8
Chapter 1: Background and Introduction................................................................... 1
Introduction..................................................................................................................... 1 CBE Manufacture ........................................................................................................... 2 Adoption of the Directive................................................................................................. 3
Chapter 2: EU Chocolate Consumption and Production .......................................... 6
EU-15.............................................................................................................................. 6
Chocolate Product Consumption........................................................................... 6 Chocolate Product Trade .................................................................................... 10 Chocolate Product Production............................................................................. 11
Retail Chocolate Prices ................................................................................................ 13 Central and Eastern Europe ......................................................................................... 14
Chocolate Consumption ...................................................................................... 14 Chocolate Trade.................................................................................................. 15 Chocolate Production .......................................................................................... 16
Chapter 3: The EU Market for Cocoa ........................................................................ 19
Net Imports ................................................................................................................... 19 Imports by Origin .......................................................................................................... 23 EU grindings ................................................................................................................. 27 Intra EU-15 Trade......................................................................................................... 28 Impact of the Directive on cocoa imports...................................................................... 28 EU-10 Cocoa Demand.................................................................................................. 30
Chapter 4: EU-15 Imports of Vegetable Fats Allowed by Directive 2000/36/EC for the Manufacturer of Chocolate ............................................................................ 32
Exotics .......................................................................................................................... 33
Sheanuts and Butter............................................................................................ 33 Sal, Mango Kernel and Kokum............................................................................ 37 Total Exotic Imports............................................................................................. 39

Contents (ii)
Palm Oil ........................................................................................................................ 40
Chapter 5: The Use of Vegetable Fats in Chocolate in the EU-15 and CBE Production................................................................................................................... 42
The use of the permitted fats for the production of Chocolate in the EU-15................. 42
Countries that Permitted the Use of CBEs Prior to 2000..................................... 42 Countries Not Permitting the Use of CBEs Prior to 2000 .................................... 46 Artisanal Production ............................................................................................ 50 Private and Own Label ........................................................................................ 51
EU-15 CBE Production ................................................................................................. 51 Demand for CBEs outside EU-15 Chocolate Production.............................................. 52
Coatings and Fillings ........................................................................................... 53 Export Demand ................................................................................................... 54
Prices and Margins ....................................................................................................... 54 The Importance of the CBE Industry to the EU-15 ....................................................... 55 Summary ...................................................................................................................... 56
Chapter 6: Impact of the Directive on Cocoa Producers ........................................ 57
Economic Developments .............................................................................................. 57 Importance of the Cocoa Sector ................................................................................... 57 Overview of Production and Export Trends .................................................................. 59
Production Trends ............................................................................................... 59 Export Trends...................................................................................................... 62
Value Addition............................................................................................................... 65 Price Developments...................................................................................................... 66 Impact of the Directive .................................................................................................. 69
Estimating The Impact Using LMC’s Forecasting Model..................................... 69 Results ................................................................................................................ 70
Chapter 7: Impact of the Directive on Vegetable Oil Producers ............................ 79
Sheanuts....................................................................................................................... 79
Importance of Exotic Fats to the Economy.......................................................... 79 Value Chain and Price Developments................................................................. 83 Impact of the Directive......................................................................................... 86
Indian Exotic Fats ......................................................................................................... 87
Importance of Exotic Fats to the Economy.......................................................... 87 Sal ....................................................................................................................... 87 Mango Kernel Oil................................................................................................. 89 Kokum ................................................................................................................. 92 Impact of the Directive......................................................................................... 93
Contents (iii)
Illipe Nuts ...................................................................................................................... 94
Impact of the Directive......................................................................................... 96
Palm Oil ........................................................................................................................ 96 Conclusions .................................................................................................................. 98
Chapter 8: Conclusions and Recommendations................................................... 100
Conclusions ................................................................................................................ 100
EU Chocolate Consumption and Cocoa Imports............................................... 100 Vegetable Fat Imports and CBE Production ..................................................... 101 Impact of the Directive on Cocoa and Vegetable Fat Producers ...................... 104
Conclusion.................................................................................................................. 105
Contents (iv)
List of Tables
Table EXEC.1: EU-15 Exotic Fat Imports ....................................................................E3 Table EXEC.2: Forecast Global Cocoa Prices, 2003/04-2010/11 ...............................E7
Table 1.1: Permitted Fats and Main Producing Countries ..................................... 1 Table 1.2: Implementation of Directive 2000/36/EC............................................... 4
Table 2.1: EU-15 Chocolate Consumption............................................................. 7 Table 2.2: Consumption by Type, UK, Germany, France and Italy........................ 9 Table 2.3: EU-15 Chocolate Production............................................................... 12 Table 2.4: Central European Member States — Chocolate Product
Consumption ....................................................................................... 14 Table 2.5: Central European Member States — Chocolate Trade ...................... 15 Table 2.6: Central European Member States — Chocolate Production............... 16 Table 2.7: Poland and Hungary — Chocolate Production by Type...................... 17
Table 3.1: Net Imports of Cocoa Beans and Cocoa Products by Major EU-15 Importers ............................................................................................. 20
Table 3.2: Net Imports of Cocoa Beans and Cocoa Products by Product Category.............................................................................................. 22
Table 3.3: Imports of Cocoa Beans and Cocoa Products by Exporting Region and Country......................................................................................... 24
Table 3.4: Western Europe — Cocoa Grindings, 1999-2005............................... 27 Table 3.5: Intra-EU Trade in Cocoa Beans and Cocoa Products by Product
Category.............................................................................................. 29 Table 3.6: EC-10 — Net Cocoa Bean and Product Imports by Country .............. 30 Table 3.7: EC-10 — Net Cocoa Bean and Product Imports by Type................... 30
Table 4.1: EU-15 Sheanut Imports....................................................................... 33 Table 4.2: EU-15 Shea Butter Imports ................................................................. 34 Table 4.3: Estimated Indian Exotic Oil Exports to EU-15..................................... 37 Table 4.4: Illipe Imports to the EU-15................................................................... 39
Table 5.1: Chocolate Product Consumption Countries Permitting CBEs Prior to 2000 ................................................................................................ 43
Table 5.2: Chocolate Biscuit Consumption Countries Permitting CBEs Prior to 2000 ................................................................................................ 43
Table 5.3: Cadbury Dairy Milk, Filling Weights .................................................... 44 Table 5.4: UK Chocolate Bar Production by Type ............................................... 44 Table 5.5: Impact of the Directive on CBE Consumption in EU-15 Countries
Permitting the Use of CBEs Prior to 2000........................................... 47 Table 5.6: Chocolate Product Consumption in EU-15 Countries Not Permitting
CBEs Prior to 2000 ............................................................................. 47 Table 5.7: Chocolate Biscuit Consumption in EU-15 Countries Not Permitting
CBEs Prior to 2000 ............................................................................. 48 Table 5.8: Estimated EU-15 CBE Production ...................................................... 52
Table 6.1: Côte d’Ivoire, Ghana and Togo — Macroeconomic Data ................... 58

Contents (v)
Table 6.2: Importance of Cocoa as % of Total Export Earnings .......................... 59 Table 6.3: Cocoa Production, 1995/96-2004/05 .................................................. 61 Table 6.4: Exports of Cocoa Beans and Cocoa Products, 2001/02-2004/05....... 62 Table 6.5: Exports of Cocoa Beans and Cocoa Products by Destination,
2001/02-2004/05 ................................................................................. 63 Table 6.6: Cocoa Exports by Type, 2001/02-2004/05.......................................... 65 Table 6.7: Cocoa Bean Export Prices, 1995/96-2004/05..................................... 66 Table 6.8: Cocoa Product Export Prices, 2001/02-2004/05................................. 68 Table 6.9: Forecast Global Cocoa Prices, 2003/04-2010/11 ............................... 70 Table 6.10: Larger Producers — Cocoa Production Forecasts,
2004/05-2010/11 ................................................................................. 71 Table 6.11: Larger Producers — Cocoa Export Earnings Forecasts,
2004/05-2010/11 ................................................................................. 72 Table 6.12: Smaller Producers — Cocoa Production Forecasts,
2004/05-2010/11 ................................................................................. 74 Table 6.13: Smaller Producers — Cocoa Export Earnings Forecasts,
2004/05-2010/11 ................................................................................. 75
Table 7.1: Shea Producing Countries, Average Per Capita Income .................... 79 Table 7.2: Estimated Local Shea Consumption ................................................... 81 Table 7.3: Sheanut Exports.................................................................................. 82 Table 7.4: Per Annum Collected Sheanuts .......................................................... 83 Table 7.5: Estimated Collector Prices, 2004/05 ................................................... 85 Table 7.6: Estimated Sal Exports......................................................................... 88 Table 7.7: Estimated Mango Kernel Exports........................................................ 91 Table 7.8: Estimated Kokum Butter Exports ........................................................ 92
Table 8.1: EU-15 Exotic Fat Imports .................................................................. 101 Table 8.2: Forecast Global Cocoa Prices, 2003/04-2010/11 ............................. 104

Contents (vi)
List of Diagrams
Diagram EXEC 1: Total EU-15 Net Imports of Cocoa Beans and Cocoa Products .....E2 Diagram EXEC 2: EU-15 CBE Production....................................................................E3 Diagram EXEC 3: EU-15 CBE Consumption for Chocolate Production .......................E5 Diagram EXEC 4: Difference Between EU-15 CBE Production ...................................E6
Diagram 1.1: Palm Mid-fraction Production ........................................................... 3 Diagram 1.2: Labelling Requirements.................................................................... 5
Diagram 2.1: Change in Consumption 2003 v 2005 .............................................. 8 Diagram 2.2: Per Capita Chocolate Consumption, 2005 ....................................... 8 Diagram 2.3: Consumption by Type....................................................................... 9 Diagram 2.4: Intra-EU Chocolate Product Trade ................................................. 10 Diagram 2.5: Net EU-15 Exports.......................................................................... 11 Diagram 2.6: France Chocolate Retail Price Index .............................................. 13 Diagram 2.7: Germany Milk Chocolate Retail Price Index ................................... 14 Diagram 2.8: Central European Member States —Chocolate Product
Consumption .................................................................................. 15 Diagram 2.9: Central European Member States — Chocolate Trade.................. 16 Diagram 2.10: Central European Member States — Chocolate Production .......... 17 Diagram 2.11: Poland and Hungary — Chocolate Production by Type ................. 18
Diagram 3.1: Total EU-15 Net Imports of Cocoa Beans and Cocoa Products..... 21 Diagram 3.2: EU-15 Cocoa Imports % of Total.................................................... 25 Diagram 3.3: EU-15 Share of Total Cocoa Exports by Producing Countries....... 26 Diagram 3.4: EU-15 Share of Total Cocoa Exports ............................................. 26 Diagram 3.5: Western Europe – Cocoa Grindings............................................... 27 Diagram 3.6: EU-15 Share of Total Cocoa Exports ............................................. 28 Diagram 3.7: EC-10 — Changes in Net Cocoa Bean and Product Imports by
Type................................................................................................ 31
Diagram 4.1: EU-15 Sheanut Imports, 1996–2005 .............................................. 34 Diagram 4.2: EU-15 Shea Butter Imports ............................................................ 35 Diagram 4.3: India — Sheanut Imports................................................................ 36 Diagram 4.4: EU-15 Sheanut Imports .................................................................. 36 Diagram 4.5: India — Exotic Oil Exports.............................................................. 38 Diagram 4.6: Sal, Kokum and Mango Kernel Exports from India to the EU-15 ... 38 Diagram 4.7: Exotic Fat Imports to EU-15 ........................................................... 40 Diagram 4.8: EU-15 Palm Oil Imports.................................................................. 41
Diagram 5.1: Chocolate Use in EU-15 Countries Permitting CBEs Prior to 2000................................................................................................ 45
Diagram 5.2: CBE Demand in EU-15 Countries .................................................. 46 Diagram 5.3: Chocolate Product Consumption in Countries................................ 49 Diagram 5.4: Difference Between EU-15 CBE Production and that used for
EU-15 Chocolate Manufacture ....................................................... 53 Diagram 5.5: Estimated CBE Prices .................................................................... 55 Diagram 5.6: Estimated CBE Use in EU-15 Chocolate........................................ 56
Contents (vii)
Diagram 6.1: Ghana and Côte d’Ivoire: Cocoa as % of Total Export Earnings and Cocoa Prices ........................................................................... 59
Diagram 6.2: West Africa — Cocoa Production ................................................... 60 Diagram 6.3: West Africa — Global Cocoa Production Shares ........................... 60 Diagram 6.4: Exports of Cocoa Beans and Cocoa Products ............................... 63 Diagram 6.5: Exports of Cocoa Beans and Cocoa Products by Destination ....... 64 Diagram 6.6: EU-15 Shares of Cocoa Exports .................................................... 64 Diagram 6.7: Cocoa Exports by Type .................................................................. 66 Diagram 6.8: Cocoa Bean Export Prices and Global Supply-Demand Balance .. 67 Diagram 6.9: Producer Shares of Cocoa Bean Export Prices ............................. 68 Diagram 6.10: Cocoa Product Export Prices ......................................................... 69 Diagram 6.11: Forecast Global Cocoa Prices, 2003/04-2010/11........................... 71 Diagram 6.12: Larger Producers — Cocoa Production Forecasts,
2004/05-2010/11 ............................................................................ 72 Diagram 6.13: Larger Producers — Cocoa Export Earnings Forecasts,
2004/05-2010/11 ............................................................................ 73 Diagram 6.14: Smaller Producers — Cocoa Production Forecasts,
2004/05-2010/11 ............................................................................ 74 Diagram 6.15: Smaller Producers — Cocoa Export Earnings Forecasts,
2004/05-2010/11 ............................................................................ 75 Diagram 6.16: Cocoa Exports as % of GDP .......................................................... 76 Diagram 6.17: Changes in Cocoa Tax Revenue.................................................... 77 Diagram 6.18: Changes in Yields........................................................................... 78 Diagram 6.19: Changes in Harvested Area ........................................................... 78
Diagram 7.1: Average GDP Growth ................................................................... 80 Diagram 7.2: Importance of Sheanuts to Export Earnings................................... 80 Diagram 7.3: Regional Sheanut Exports.............................................................. 82 Diagram 7.4: Sheanut Marketing Chain ............................................................... 84 Diagram 7.5: Estimated Sheanut Export Prices................................................... 85 Diagram 7.6: Stylised Sheanut Value Chain, 2004 .............................................. 86 Diagram 7.7: Estimated Sal Production ............................................................... 87 Diagram 7.8: Sal Prices and Margins................................................................... 89 Diagram 7.9: Mango Kernel Harvested Production.............................................. 90 Diagram 7.10: Mango Kernel Marketing Margins, 2005......................................... 91 Diagram 7.11: Estimated Kokum Nut Production................................................... 92 Diagram 7.12: Kokum Marketing Margins, 2005.................................................... 93 Diagram 7.13: Indian Exotic Fat Export Prices ...................................................... 94 Diagram 7.14: EU-15 Illipe Butter Imports ............................................................. 95 Diagram 7.15: Estimated Illipe Butter Export Unit Values...................................... 96 Diagram 7.16: Palm Oil Production, 1996-2005..................................................... 97 Diagram 7.17: Palm Olein Prices, c.i.f. Europe...................................................... 98
Diagram 8.1: EU-15 CBE Production................................................................. 102 Diagram 8.2: Difference Between EU-15 CBE Production and that used for
EU-15 Chocolate Manufacture ..................................................... 103
EXECUTIVE SUMMARY PAGE E1
© LMC International Ltd, 2006
Executive Summary
The European Parliament and Council adopted Directive 2000/36/EC on 23 June 2000. The aim of the Directive was to allow the use of up to 5% of a limited number of vegetable fats in the production of chocolate. The objective of the Directive was to simplify Community provisions concerning chocolate, with a view to allowing the free movement of chocolate products within the Internal Market. The Directive was implemented by member states during 2003.
The vegetable fats that were permitted for use required strict technical characteristics and were limited to six (Illipe, palm oil, sal, shea, kokum gurgi, and mango kernel). Five of these (illipe, sal, shea, kokum gurgi and mango kernel) can be classed as exotic fats; that is, the fat is obtained from the seeds/nuts of trees that are mainly growing wild in the tropics. Enzymic modification of the fats was prohibited.
This study provides an evaluation of the impact of the Directive as required under the Directive. The aim of the evaluation is to:
Determine the impact of Directive 2000/36/EC on the economies of those countries producing cocoa and vegetable fats other than cocoa butter; and
Provide guidance to the Commission on whether or not to amend the list of vegetable fats other than cocoa butter that are permitted for use in chocolate. In this regard, three options are considered:
― To maintain the list for a further period of time;
― To shorten the list; or
― To extend the list.
EU CHOCOLATE CONSUMPTION AND COCOA IMPORTS
EU-15 consumption of chocolate products is around 2.2 million tonnes. There has been little change in total consumption since the Directive was adopted in 2003. Four markets, UK, Germany, Italy and France account for close to 80% of EU-15 chocolate consumption.
There are a number of reasons for the slow growth in consumption:
Slow growth in income. Per capita consumption is related to per capita incomes, and the slow growth of incomes in recent years adversely affected demand;
Market saturation in some of the mature markets; and
Increasing concerns over obesity.
Not all segments of the market have experienced the same growth rates; in particular there has been growth in whole bar (tablet) consumption over other products. This has been driven by campaigns highlighting the benefits of cocoa consumption (in particular, the presence of the antioxidant flavanol which has been found to reduce blood pressure) and the growth of speciality products such as single origin bars. Both of these types of products have a higher cocoa content.

EXECUTIVE SUMMARY PAGE E2
© LMC International Ltd, 2006
Net imports of cocoa beans and cocoa products in bean equivalent (b.e.) terms from outside the EU-15 countries have increased from around 1.2 million tonnes in 1996 to over 1.4 million tonnes in 2005, recording an average annual growth rate of 2.1% over the last 10 years (Diagram EXEC 1). This is somewhat higher than the growth of chocolate production and consumption, which has grown by 0.6% per annum over the period. Over the last two years, since the adoption of the Directive, the rate of growth of net cocoa imports has accelerated to 3.5% despite a flat chocolate product market. This points towards the increased cocoa solids content of chocolate as well as the increased use of cocoa products for other food applications.
Diagram EXEC 1: Total EU-15 Net Imports of Cocoa Beans and Cocoa Products
0
200
400
600
800
1,000
1,200
1,400
1,600
1996 1997 1998 1999 2000 2001 2002 2003 2004 2005
Net
Coc
oa Im
ports
('00
0 to
nnes
b.e
.)
Total Trend

EXECUTIVE SUMMARY PAGE E3
© LMC International Ltd, 2006
VEGETABLE FAT IMPORTS AND CBE PRODUCTION
When converted to the raw materials that are used for CBE manufacture, exotic fat imports have increased from 8,000 tonnes in 1996 to 24,500 tonnes in 2005 (Table EXEC 1). Since the adoption of the Directive, imports of these exotic fat raw materials have increased by 25%.
Table EXEC.1: EU-15 Exotic Fat Imports (tonnes)
1996 1997 1998 1999 2000 2001 2002 2003 2004 2005
Sheanuts 31,938 24,856 52,757 30,155 29,396 59,575 48,787 80,802 67,626 85,040Shea butter 138 241 1,542 3,543 1,590 2,177 7,502 10,358 7,049 15,397Sal Oil 278 324 174 177 330 401 230 544 201 900Sal Stearin 650 757 405 412 770 936 537 1,269 469 2,100Mango Kernel Stearin 331 1,001 142 1,300 0 125 141 744 146 437Illipe nuts 30 20 19 24 4 4 4,187 44 2 52Illipe butter 1,688 857 327 47 31 9 121 646 193 1,446 CBE raw material 7,987 6,865 9,884 8,587 6,285 11,393 11,776 19,638 14,979 24,459
Source: LMC.
While it is possible to get an impression of the level of exotic fat imports and use in CBEs, the level of palm oil (or more specifically palm mid-fraction) is more difficult to gauge owing to the large number of end uses. The use of palm mid-fraction (PMF) varies between 10% to 100% of the weight of a CBE, depending upon what the product is to be used for. A lower proportion of exotics are used in “soft” CBEs (up to 30% exotic) while a higher proportion is used in “hard” CBEs (greater than 30%). The choice of CBE depends on the market and application.
Typically, soft CBEs are used in the UK and Ireland, and hard CBEs are used elsewhere. Splitting exotic fat use this way, with the balance being made up of PMF gives total EU-15 CBE production of 58,600 tonnes in 2005. Production has grown by 11% per annum since 2000 and at a similar rate since the adoption of the Directive (Diagram EXEC 2).

EXECUTIVE SUMMARY PAGE E4
© LMC International Ltd, 2006
Diagram EXEC 2: EU-15 CBE Production
0
10
20
30
40
50
60
1996 1997 1998 1999 2000 2001 2002 2003 2004 2005
EU-1
5 C
BE P
rodu
ctio
n ('
000
tonn
es)
While exotic fat imports and CBE production have increased, the key question is: “Is this due to increased demand from chocolate manufacturers in the EU-15 following the implementation of the Directive? Or, are there other explanations?”
The Use of CBEs in EU-15 Chocolate
To determine the use of CBEs in EU-15 chocolate it is helpful to split the EU-15 market into two segments: those that permitted the use of CBEs in chocolate prior to 2000; and those that did not, and consider trends in each of these segments.
Our analysis suggests that the market for CBE use in chocolate in the EU-15 countries was 20,500 tonnes in 2005 (Diagram EXEC 3). This level of demand has been unchanged for three years, although this hides two changes:
In countries permitting the use of CBEs in chocolate prior to 2000, CBE use as a proportion of chocolate weight has fallen by 3% since the adoption of the Directive. This is due to the Directive’s definition of milk chocolate. Under the definition, vegetable fat is not included in the calculation of total fat that must be a minimum of 25% for a product to be called milk chocolate. Thus for a typical low cost milk chocolate recipe with 28.3% fat, the maximum vegetable fat that can be added is 3.3%. If 5% was previously being used then the amount of permitted vegetable fat has fallen. Consequently, we estimate that CBE demand is some 600 tonnes lower than would have been the case in the absence of the Directive.
In countries previously not permitting the use of CBEs in chocolate, there has been no increase in demand from branded and artisanal chocolate manufacturers. There has been an increase of some 1,000 tonnes amongst the industrial chocolate manufacturers producing product for the biscuit and ice cream industries.

EXECUTIVE SUMMARY PAGE E5
© LMC International Ltd, 2006
Net, there has been a 400 tonne increase in CBE demand since the adoption of the Directive.
Diagram EXEC 3: EU-15 CBE Consumption for Chocolate Production
0
5
10
15
20
25
1996 1997 1998 1999 2000 2001 2002 2003 2004 2005
CB
E D
eman
d ('0
00 to
nnes
)
DEMAND FOR CBES OUTSIDE EU-15 CHOCOLATE PRODUCTION
This suggests that the growth of EU-15 CBE production has not been due to CBE use in EU-15 chocolate but due to other factors. The evidence above suggests that there is a growing difference between EU-15 CBE production and the amount of CBE used for EU-15 chocolate manufacture. The difference has increased from around 11,000 tonnes in 1996 to its current level of around 40,000 tonnes (Diagram EXEC 4).

EXECUTIVE SUMMARY PAGE E6
© LMC International Ltd, 2006
Diagram EXEC 4: Difference Between EU-15 CBE Production and that used for EU-15 Chocolate Manufacture
0
5
10
15
20
25
30
35
40
45
1996 1997 1998 1999 2000 2001 2002 2003 2004 2005
Diff
eren
ce P
rodu
ctio
n an
d C
BE fo
r Cho
cola
te C
onsu
mpt
ion
('000
tonn
es)
Two issues warrant consideration and can explain this trend:
The use of CBE-type fats for coatings and fillings; and
Export demand.
For many years, EU chocolate companies have used CBEs in their fillings, even if they are not using them in chocolate. The Directive does not cover this use of CBEs. Our analysis suggests that demand for CBEs for fillings and coatings in the EU-15 has grown to between 20,000 to 25,000 tonnes. Demand growth has been steady over the reporting period and is growing as the market for these products increases.
Export demand is in the order of 15,000 to 20,000 tonnes and has grown sharply in recent years. This is due to:
Changes in legislation to allow the use of CBEs in chocolate (for instance, in Brazil and Oceania);
Substitution of Cocoa Butter Replacers (CBRs) in compound chocolate by CBEs. This is because CBRs are high in transfats; and
Increased demand for chocolate/compound chocolate containing CBEs.
IMPACT OF THE DIRECTIVE ON COCOA AND VEGETABLE FAT PRODUCERS
Cocoa Producers
Cocoa typically accounts for over one third of total export earnings in Ghana and Côte d’Ivoire, and around 10% in the case of Cameroon. It is less important in

EXECUTIVE SUMMARY PAGE E7
© LMC International Ltd, 2006
Nigeria and Togo. As would be expected, cocoa prices are a major determinant of cocoa’s share of export earnings in Ghana and Côte d’Ivoire.
As can be surmised from the above, the Directive has had little impact on cocoa producers to date. We have calculated the impact (and potential impact) of the Directive under three scenarios.
― The base case scenario calculates the impact of the Directive on the market to date;
― Scenario 1 calculates what would have been the state of the market had the Directive not been implemented in 2003/04; and
― Scenario 2 calculates what would have been the impact of the Directive if it had been fully implemented in 2003/04, i.e., CBE usage in chocolate rose to 5% in the EU-8.
The forecast levels of prices under the different scenarios between 2003/04 and 2010/11 are shown in Table EXEC.2.
Table EXEC.2: Forecast Global Cocoa Prices, 2003/04-2010/11 (Real US$ per tonne)
2003/04 2004/05 2005/06 2006/07 2007/08 2008/09 2009/10 2010/11
Base Case 1,431 1,419 1,439 1,554 1,649 1,604 1,559 1,531 Scenario 1 1,435 1,421 1,441 1,555 1,650 1,605 1,560 1,532 Scenario 2 1,311 1,344 1,384 1,521 1,625 1,561 1,514 1,490
Source: LMC.
Comparing the prices forecast under the base case scenario with those forecast under Scenario 1 suggests that the impact of not implementing the Directive in 2003/04 would have been modest i.e. a price difference of less than $5 per tonne.
Were the Directive to have been implemented fully in 2003/04, the results suggest that the price impact would have been more pronounced.
Vegetable Fat Producers
In terms of the total economy, the importance of the exotic fats is relatively small. However, in the regions where they are collected, they are very important for employment and income generation. In the case of shea, collection is primarily by women, while for illipe and the Indian exotics, collection is by tribal people living off non-timber forest products.
For sheanuts, demand is from both the local market and for export. The other exotics are primarily export orientated, the only exception being for sal when production is higher than that which can be absorbed by the export market. In this case, the balance is used domestically.
For all the exotics, with the exception of kokum, there can be extreme fluctuations in production between years. This is due to the uncultivated nature of production.

EXECUTIVE SUMMARY PAGE E8
© LMC International Ltd, 2006
There has been an increase in demand for exotics from the European CBE manufacturers: for shea since 2000, sal since 2003 and illipe in 2005.
Trends in prices follow the supply-demand balance of the individual crops, thus in years of high production there is a tendency for prices to fall and vice-versa.
For the Indian exotic fats and illipe, almost all processing occurs at origin and processed products are exported. This is not the case with sheanuts where the export is more of nuts than products.
Both shea and the Indian exotics remain underdeveloped in terms of their potential. In both cases, there is scope to increase collection and improve the quality of the product, although whether this occurs is partly dependent upon the price paid to collectors. In the case of shea, some governments have recognised the crop’s potential and are seeking to increase the development of the crop as part of a diversification strategy. For illipe, production potential is declining as palm oil development reduces the illipe forests.
Palm oil production has grown dramatically since the adoption of the Directive. However, the growth of CBE demand is small in relation to the total volumes of palm oil produced and marketed.
The increase in demand for these products, although beneficial for the sector, cannot be attributed to the Directive.
CONCLUSIONS
Our analysis suggests that the Directive has had very little impact on the global cocoa market as very few EU-15 chocolate manufacturers have incorporated CBEs into their recipes. The same is true of the vegetable fat producers, although increased demand for CBEs from outside of the EU-15 chocolate market has increased demand for their products. However, although the Directive was passed in 2000, it was only implemented in 2003. Hence the market has only had two years to adjust to the new realities.
On the basis of this evidence, there is no need to change the list of permitted fats and our recommendation is to maintain the list for a further period of time, until the impact of the use of vegetable fats other than cocoa butter on the economies of developing countries can be further assessed.
There are a number of additional considerations:
Two years is a very short time period for end users to make wholesale changes to recipes. A further review of the market in five to ten years time would be useful. This would allow time for manufacturers to work though the implications of the Directive and test consumer perceptions of products containing CBEs. As yet, this has not been possible, as no one has changed recipes.
The shortage of shea and sal during 2005/06 has reduced exotic availability and led to a run down in exotic fat stocks. This has increased exotic prices and placed pressure on CBE manufacturers. This highlights the dangers of restricting the number of fats, as it reduces the scope for substitution. Any reduction in the list of permitted fats would create a worse situation.

EXECUTIVE SUMMARY PAGE E9
© LMC International Ltd, 2006
With the global market for CBEs increasing and the variability of annual exotic fat production, in the longer term there is potential for a shortage of exotic fats. This suggests that in the longer term, consideration could be given to one or all of the following:
― Crop development for the permitted exotics. At present shea, sal and mango kernel are all underdeveloped wild crops. There is scope, in the longer term, to increase crop potential. For instance, in West Africa the local production of shea butter could be enhanced though the provision of basic hand expellers. This would reduce the time needed to produce local shea butter and increase processing efficiency. In both cases, the provision of nuts would increase: first, by allowing more time for nut collection; and, second, by reducing the quantity of nuts required to yield a certain volume of butter. Additionally it could be possible to reduce the gestation period for the trees. In the case of sal, the proportion of the crop collected is small in relation to total production.
― Expanding the list of permitted fats. However, the number of possible fats is limited, with aceituno oil probably the largest.

CHAPTER 1: BACKGROUND AND INTRODUCTION PAGE 1
© LMC International Ltd, 2006
Chapter 1: Background and Introduction
INTRODUCTION
The European Parliament and Council adopted Directive 2000/36/EC on 23 June 2000. The aim of the Directive was to allow the use of up to 5% of a limited number of vegetable fats in the production of chocolate. The objective of the Directive was to simplify Community provisions concerning chocolate with a view to allowing the free movement of chocolate products within the Internal Market. Member States were obliged to enact the Directive by August 2003.
The vegetable fats that were permitted for use required strict technical characteristics as set out in Annex II of the Directive and were limited to six (Illipe, palm oil, sal, shea, kokum gurgi, and mango kernel), see Table 1.1. Five of these (illipe, sal, shea, kokum gurgi and mango kernel) can be classed as exotic fats; that is, the fat is obtained from the seeds/nuts of trees that are mainly growing wild in the tropics.
Table 1.1: Permitted Fats and Main Producing Countries
Fat Main regions of production
Shea butter West Africa Illipe fat South East Asia Sal fat India Kokum gurgi oil India Mango kernel oil India Palm oil South East Asia
Source: EU Directive and LMC
Prior to the passing of the Directive, eight of the EU-15 countries prohibited the use of vegetable fats in chocolate production; namely, Germany, France, Netherlands, Belgium, Luxembourg, Italy, Greece and Spain. If the chocolate manufacturers changed their recipes for products sold in these markets, there would be two direct outcomes upon producers:
For cocoa producers, a loss of market; and
For producers of the other vegetable fats, an increase in demand.
This study provides an evaluation of the impact of the Directive as required under the Directive. The aim of the evaluation is to:
Determine the impact of Directive 2000/36/EC on the economies of those countries producing cocoa and vegetable fats other than cocoa butter; and
Provide guidance to the Commission on whether or not to amend the list of vegetable fats other than cocoa butter that are permitted for use in chocolate. In this regard, three options are considered:

CHAPTER 1: BACKGROUND AND INTRODUCTION PAGE 2
© LMC International Ltd, 2006
― To maintain the list for a further period of time, until the impact of the use of vegetable fats other than cocoa butter on the economies of developing countries can be further assessed.
― To shorten the list, assessing whether this may lead to a reduction of the quantities of vegetable fats other than cocoa butter in the production of chocolate.
― To extend the list, considering which other vegetable fats other than cocoa butter from developing countries could be allowed for use in the manufacture of chocolate.
The report is in eight chapters. Chapter 1 outlines the scope of the evaluation, presents a background to the manufacture of CBEs and discusses the implementation of the Directive in the individual member states; Chapter 2 examines trends in EU chocolate production and consumption; Chapter 3 presents trends in cocoa bean and product imports; while Chapter 4 discusses trends in the importation of the permitted vegetable fats. Chapter 5 examines what has happened in the chocolate industry since the introduction of the Directive, and Chapters 6 and 7 discuss the impact of the Directive on cocoa and vegetable oils producers, respectively. Chapter 8 presents the conclusions and recommendations.
CBE MANUFACTURE
In this report, we refer to blends of the permitted fats as cocoa butter equivalents (CBEs). CBEs are fats, which behave like and are compatible with cocoa butter in any proportion. For a product to be called chocolate in the EU the proportion of CBEs used cannot exceed 5% of the chocolate and the choice of fat is limited to the above.
Furthermore, all the fats have to comply with the following criteria:
1. They are non-lauric fats which are rich in symmetrical triglycerides of the type POP, POS, SOS;
2. They are miscible in any proportion with cocoa butter and are compatible with its physical properties (melting point and crystallisation temperature, melting rate and need for a tempering phase);
3. They are obtained only by the process of refining and/or fractionation, which excludes enzymatic modification of the triglyceride structure1.
The choice of fat blend used in a particular CBE is dependent upon the end use of that CBE. A standard CBE would typically contain 50% of an exotic fat or its fraction and 50% palm oil mid-fraction (PMF). However, technical improvements in the production of CBEs mean that they are becoming increasingly specialised according to the requirements of end users: where a CBE is being used as a Cocoa Butter Improver (CBI), to increase the hardness of a product for instance, the proportion of the exotic fat used will be higher; where the CBE is being used in a reformulation of the whole fat phase to achieve specific desirable functional properties, the proportion of PMF will probably be higher.
1 Specifically this prohibits interesterification, which can be used to transform the properties of palm oil.
CHAPTER 1: BACKGROUND AND INTRODUCTION PAGE 3
© LMC International Ltd, 2006
The choice of exotics is determined by the structure of the triglycerides contained in each product, particularly SOS. Shea stearin and kokum are the most valuable followed by mango kernel stearin and illipe. Sal stearin is quite variable in quality and contains up to 10% of another triglyceride, SOA. However, with technical know-how and a good product it can be almost as valuable as shea stearin and kokum.
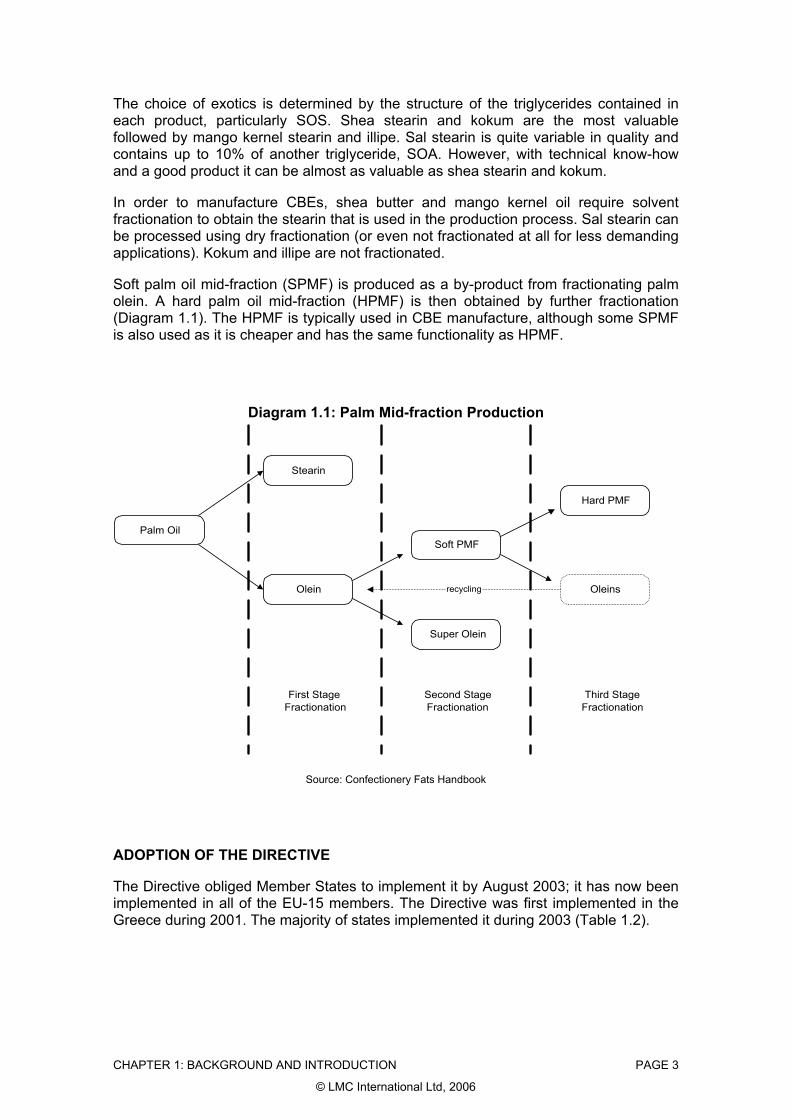
In order to manufacture CBEs, shea butter and mango kernel oil require solvent fractionation to obtain the stearin that is used in the production process. Sal stearin can be processed using dry fractionation (or even not fractionated at all for less demanding applications). Kokum and illipe are not fractionated.
Soft palm oil mid-fraction (SPMF) is produced as a by-product from fractionating palm olein. A hard palm oil mid-fraction (HPMF) is then obtained by further fractionation (Diagram 1.1). The HPMF is typically used in CBE manufacture, although some SPMF is also used as it is cheaper and has the same functionality as HPMF.
Diagram 1.1: Palm Mid-fraction Production
Palm OilSoft PMF
Olein
Stearin
Super Olein
Hard PMF
Third StageFractionation
Second StageFractionation
First StageFractionation
Oleinsrecycling
Source: Confectionery Fats Handbook
ADOPTION OF THE DIRECTIVE
The Directive obliged Member States to implement it by August 2003; it has now been implemented in all of the EU-15 members. The Directive was first implemented in the Greece during 2001. The majority of states implemented it during 2003 (Table 1.2).

CHAPTER 1: BACKGROUND AND INTRODUCTION PAGE 4
© LMC International Ltd, 2006
Table 1.2: Implementation of Directive 2000/36/EC
Date of Implementation
UK 03-Aug-03 Sweden 03-Aug-03 Greece 01-Feb-01 Denmark 03-Aug-03 Belgium 29-Mar-03 France 29-Jul-03 Ireland 11-Jun-03 Austria 30-Dec-03 Germany 15-Dec-03 Luxembourg 25-Jul-03 Netherlands 02-Nov-01 Finland 03-Aug-03 Portugal 27-Sep-03 Spain 03-Aug-03 Italy 03-Aug-03
Note: In Germany, manufacturers were able to maintain recipes for 6 months after the implementation of the Directive. In Italy, the regulations contained a provision for "pure chocolate".
Source: National Regulation.
The regulations cover all chocolate products packaged after the date of adoption of the Directive. For products containing vegetable fats the product needs to be labelled “contains vegetable fats in addition to cocoa butter”. This labelling only appears after the date of implementation, hence for a period two differently labelled products appeared side by side on supermarket shelves; products that were packaged before the implementation date and those packaged afterwards. How long this occurred for depends on the distribution of chocolate production during the year and the shelf life of chocolate products. For example, assuming that production was equally distributed throughout the year and that the shelf life of a product is 12 months, newly packaged products would appear side by side for a 12-month period, with the proportion of old packaged products declining over time (Diagram 1.2).

CHAPTER 1: BACKGROUND AND INTRODUCTION PAGE 5
© LMC International Ltd, 2006
Diagram 1.2: Labelling Requirements
0%
10%
20%
30%
40%
50%
60%
70%
80%
90%
100%
J F M A M J J A S O N D J
Labe
ls a
s a
% o
f Mar
ket
New labels Old Labels
For the purpose of this evaluation, we assume that the Directive was fully implemented by the end of 2003 and we compare the position before and after 2003.

CHAPTER 2: EU CHOCOLATE CONSUMPTION AND PRODUCTION PAGE 6
© LMC International Ltd, 2006
Chapter 2: EU Chocolate Consumption and Production
This chapter examines chocolate consumption and production trends in the EU over the reporting period. The first part of the chapter considers the EU-15, while the second part considers the EU-10 accession states.
EU-15
Chocolate Product Consumption
Data on chocolate product1 production and consumption to 2004 were provided by Caobisco. These data were supplemented by consumer market research data for the major markets for 2005. For the other smaller markets, we assume that consumption continues to follow its longer term trend. Trade data are from Eurostat.
EU-15 consumption of chocolate products is around 2.2 million tonnes. There has been little change in total consumption since the Directive was adopted in 2003, although there are variations between countries (Diagram 2.1). Four markets, UK, Germany, Italy and France account for close to 80% of EU-15 chocolate consumption. Per capita consumption levels are highest in UK, Ireland and Germany (Diagram 2.2).
1 Chocolate products are defined as chocolate confectionery i.e., the chocolate plus the filling or other non-
chocolate components, i.e., added fruit and nuts. This comprises the Caobisco categories of unfilled bars, filled bars, bonbon, and sugar containing cocoa.

Table 2.1: EU-15 Chocolate Consumption (tonnes)
1996 2000 2001 2002 2003 2004 2005 Annual Growth since 2003
Annual Growth 5 years
Annual Growth 10 years
UK 487,415 491,516 475,981 509,241 530,226 529,187 500,381 -1.9% 1.0% 0.3% Austria 70,235 50,013 60,183 53,225 49,688 54,322 53,676 2.6% -2.3% -2.7% Sweden 52,265 56,708 59,239 60,899 58,173 59,742 58,447 0.2% -0.3% 1.1% Ireland 30,458 31,839 30,726 32,827 35,192 34,460 33,426 -1.7% 1.7% 0.9% Finland 18,245 27,942 30,511 30,364 31,157 32,289 32,612 1.5% 1.3% 6.0% Denmark 38,575 40,942 42,971 44,217 40,977 42,594 41,596 0.5% -0.6% 0.8% Portugal 11,660 21,229 24,598 25,213 21,695 19,237 20,500 -1.9% -3.6% 5.8% Germany 689,620 677,128 666,786 670,859 661,870 681,941 668,746 0.3% 0.1% -0.3% France 270,405 297,435 287,510 287,990 280,616 280,231 285,064 0.5% -0.2% 0.5% Netherlands 70,395 76,105 74,900 74,200 71,300 73,100 73,300 0.9% -0.4% 0.4% Italy 150,730 162,932 169,959 183,821 191,570 196,915 202,490 1.9% 3.6% 3.0% Belgium 55,225 60,863 49,072 63,612 68,295 71,545 70,912 1.3% 7.6% 2.5% Spain 64,175 61,025 64,250 64,655 65,285 68,235 71,874 3.3% 2.3% 1.1% Greece 24,700 29,045 30,591 32,502 34,781 37,131 39,226 4.1% 5.1% 4.7% Total 2,034,103 2,084,721 2,067,278 2,133,625 2,140,824 2,180,927 2,152,250 0.2% 0.8% 0.6%
Source: CAOBISCO, Market Research Data, LMC.
CH
AP
TER
2: EU
CH
OC
OLA
TE C
ON
SUM
PTIO
N A
ND
PR
OD
UC
TION
P
AG
E 7
© LM
C International Ltd, 2006

CHAPTER 2: EU CHOCOLATE CONSUMPTION AND PRODUCTION PAGE 8
© LMC International Ltd, 2006
Diagram 2.1: Change in Consumption 2003 v 2005
-3% -2% -1% 0% 1% 2% 3% 4% 5%
UK
Austria
Sweden
Ireland
Finland
Denmark
Portugal
Germany
France
Netherlands
Italy
Belgium
Spain
Greece
Total
Consumption Change since 2003 (%)
Diagram 2.2: Per Capita Chocolate Consumption, 2005
0
1
2
3
4
5
6
7
8
9
Spain
Portug
alIta
ly
Greece
Netherl
ands
France
Finlan
d
Sweden
Austria
Belgium
Denmark
German
y
Irelan
d UK
Per c
apita
con
sum
ptio
n (k
g)
There are a number of reasons for the slow growth in consumption:
Slow growth in income. Per capita consumption is related to per capita incomes and the slow growth of incomes in recent years has adversely affected demand;

CHAPTER 2: EU CHOCOLATE CONSUMPTION AND PRODUCTION PAGE 9
© LMC International Ltd, 2006
In some of the mature markets, the market is saturated; and
Increasing concerns over obesity.
Not all segments of the market have experienced the same level of growth. There has been growth in whole bar (tablet) consumption which has been driven by campaigns highlighting the benefits of cocoa consumption. This is due to the presence of the antioxidant flavanol which has been found to reduce blood pressure. In addition, there has been growth in speciality/gourmet products, such as single origin and dark chocolate. Both of these products have a higher cocoa content and are positioned as premium products with a higher price.
The strongest growth, albeit from a low base, has been for the small bite segment (Table 2.2 and Diagram 2.3).
Table 2.2: Consumption by Type, UK, Germany, France and Italy (tonnes)
2003 2004 2005
Tablets 446,230 458,289 449,096 Bars 435,069 429,092 407,497 Box/pralines 244,374 252,183 243,388 Small bites 120,319 125,234 131,583 Seasonal/selection 196,867 200,935 195,562 Total 1,442,859 1,465,733 1,427,126
Source: Market Research Data
Diagram 2.3: Consumption by Type
85
90
95
100
105
110
115
2003 2004 2005
cons
umpt
ion
Inde
x (2
003
= 10
0)
Tablets Bars Box/pralines Small bites Seasonal/selection

CHAPTER 2: EU CHOCOLATE CONSUMPTION AND PRODUCTION PAGE 10
© LMC International Ltd, 2006
Chocolate Product Trade
Increasing volumes of chocolate products are being shipped around the EU-15 as the confectionery industry consolidates. This is due to the economies of scale in the production of chocolate products. The volume of intra-regional trade (i.e., trade between the EU-15 member states) increased from 624,000 tonnes to 834,000 tonnes between 1997 and 2004. The traded volume fell back in 2005 (Diagram 2.4). This means that there is increasing dislocation of consumption and production.
Diagram 2.4: Intra-EU Chocolate Product Trade
500
550
600
650
700
750
800
850
900
1997 1998 1999 2000 2001 2002 2003 2004 2005
Intra
-EU
Impo
rts (0
00 to
nnes
)
The EU-15 is a net exporter of chocolate products. Net exports (to countries outside of the EU-15) fell substantially in 1997 and 1998 as exports to Eastern Europe declined. However, since then net exports have remained stable at around 140,000 tonnes per annum (Diagram 2.5)

CHAPTER 2: EU CHOCOLATE CONSUMPTION AND PRODUCTION PAGE 11
© LMC International Ltd, 2006
Diagram 2.5: Net EU-15 Exports
100
150
200
250
300
350
1997 1998 1999 2000 2001 2002 2003 2004 2005
Intra
-EU
Impo
rts (0
00 to
nnes
)
Chocolate Product Production
Chocolate product production is defined as:
Production = Consumption + Exports – Imports.
Table 2.3 highlights the major trends. Total EU-15 production has been unchanged since the adoption of the Directive, although this hides trends in individual countries. Of the major producers production has fallen by 5% in the UK as imports have increased.

Table 2.3: EU-15 Chocolate Production (tonnes)
1996 2000 2001 2002 2003 2004 2005 Annual Growth since 2003
Annual Growth 5 years
Annual Growth 10 years
UK 515,620 473,255 469,300 464,245 482,238 459,637 406,375 -5.5% -2.8% -2.4% Austria 55,640 56,860 63,030 56,175 55,285 55,160 58,807 2.1% -1.4% 0.6% Sweden 52,265 52,075 51,650 50,325 47,970 45,027 46,144 -1.3% -2.2% -1.2% Ireland 59,823 58,473 56,811 68,563 75,109 63,640 59,962 -7.2% 1.1% 0.0% Finland 35,105 33,910 34,080 34,050 33,015 32,395 31,518 -1.5% -1.6% -1.1% Denmark 20,130 24,440 27,550 25,795 25,660 28,195 28,827 4.0% 0.9% 3.7% Portugal 2,465 2,305 2,800 1,545 1,040 1,230 1,262 6.7% -14.7% -6.5% Germany 811,871 719,175 730,660 751,410 753,208 798,599 786,169 1.4% 1.5% -0.3% France 282,335 275,971 275,403 281,061 264,626 284,050 268,146 0.4% -0.5% -0.5% Netherlands 173,205 185,866 188,597 182,353 180,387 162,498 185,265 0.9% -0.4% 0.7% Italy 166,655 165,800 174,300 189,550 193,800 201,500 204,047 1.7% 3.2% 2.0% Belgium 131,515 173,665 171,605 195,850 196,405 218,765 214,866 3.0% 4.6% 5.0% Spain 69,565 38,615 46,165 50,780 47,149 52,460 62,678 10.0% 6.3% -1.0% Greece 22,300 20,700 21,000 21,200 22,000 22,500 26,675 6.6% 4.9% 1.8% Total 2,398,494 2,281,110 2,312,950 2,372,902 2,377,893 2,425,656 2,380,741 0.0% 0.6% -0.1%
Source: LMC
CH
AP
TER
2: EU
CH
OC
OLA
TE C
ON
SUM
PTIO
N A
ND
PR
OD
UC
TION
P
AG
E 12
© LM
C International Ltd, 2006

CHAPTER 2: EU CHOCOLATE CONSUMPTION AND PRODUCTION PAGE 13
© LMC International Ltd, 2006
RETAIL CHOCOLATE PRICES
Of the major EU chocolate producers, retail price data (as collected for consumer price indices) only include chocolate in two cases: France and Germany. These data suggest the real prices have risen by 1.5% per annum in Germany, but have fallen by 1.2% per annum in France since the adoption of the Directive.
Diagram 2.6: France Chocolate Retail Price Index
90
95
100
105
110
115
120
125
130
135
140
1996 1997 1998 1999 2000 2001 2002 2003 2004 2005
Pric
e In
dex
(199
6=10
0)
Nominal Price Real Price

CHAPTER 2: EU CHOCOLATE CONSUMPTION AND PRODUCTION PAGE 14
© LMC International Ltd, 2006
Diagram 2.7: Germany Milk Chocolate Retail Price Index
80
90
100
110
120
130
140
1996 1997 1998 1999 2000 2001 2002 2003 2004 2005
Pric
e In
dex
(199
6=10
0)
Nominal Price Real Price
CENTRAL AND EASTERN EUROPE
Confectionery markets are growing more quickly in the EU-10 accession countries than is the case in the EU-15. Poland is the hub, both in terms of consumption and production. There has also been an increase in the export of chocolate products.
Chocolate Consumption
The chocolate confectionery market in the Central European member states is estimated at around 200,000 tonnes in 2005, having grown by 3% per year on average over the last five years. The most rapid growth has been in Poland, which is also by far the largest market, accounting for approaching 100,000 tonnes (Table 2.4 and Diagram 2.8).
Table 2.4: Central European Member States — Chocolate Product Consumption (tonnes)
1999 2001 2001 2002 2003 2004 2005 Growth 5 years
Czech Rep 28,096 29,032 30,000 31,000 32,000 33,000 33,000 2% Poland 69,342 72,115 75,000 78,000 80,000 89,000 97,000 5% Hungary 35,078 36,026 37,000 38,000 39,000 39,000 40,000 2% Slovakia 20,000 20,000 20,000 20,000 20,000 20,000 21,000 1% Slovenia 6,652 6,484 6,324 6,755 6,998 6,289 7,328 3% Total 159,168 163,658 168,324 173,755 177,998 187,289 198,328 3%
Source: NCA, LMC.

CHAPTER 2: EU CHOCOLATE CONSUMPTION AND PRODUCTION PAGE 15
© LMC International Ltd, 2006
Diagram 2.8: Central European Member States — Chocolate Product Consumption
0
20
40
60
80
100
120
140
160
180
200
1999 2001 2001 2002 2003 2004 2005
Sale
s ('0
00 to
nnes
)
Poland Hungary Czech Rep Slovakia Slovenia
Chocolate Trade
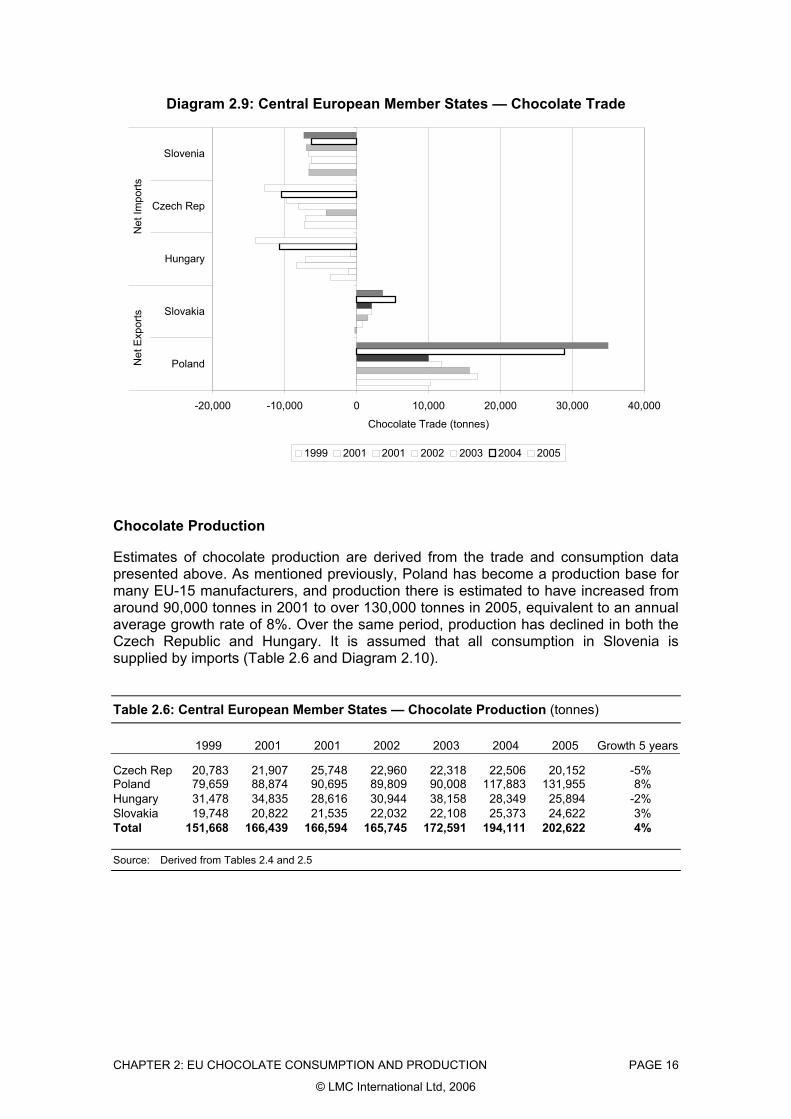
As is the case with the EU-15, there is an increasing volume of trade in chocolate confectionery products between both within the EU-10 (particularly the Central European member states) and with the EU-15. Poland is becoming the regional hub and has become a significant net exporter. This is partly the influence of the EU-15 chocolate manufacturers who over the last ten years have made significant acquisitions in the market and are using the country as a base for production for both the local market and for export.
Net chocolate exports by Poland have grown from below 16,000 tonnes in 2001 to almost 35,000 tonnes in 2005, an average annual increase of 17%. Over the same period, net imports by Hungary, the Czech Republic and Slovenia have risen by an average of 13% per year (Table 2.5 and Diagram 2.9).
Table 2.5: Central European Member States — Chocolate Trade (tonnes)
1999 2001 2001 2002 2003 2004 2005 Growth 5 years
Net Exports Poland 10,317 16,759 15,695 11,809 10,008 28,883 34,955 17% Slovakia -252 822 1,535 2,032 2,108 5,373 3,622 19% Total 10,065 17,581 17,230 13,841 12,116 34,256 38,577 17%
Net Imports Hungary -3,600 -1,191 -8,384 -7,056 -842 -10,652 -14,106 11% Czech Rep -7,312 -7,125 -4,252 -8,040 -9,682 -10,494 -12,848 25% Slovenia -6,652 -6,484 -6,324 -6,755 -6,998 -6,289 -7,328 3% Total -17,565 -14,800 -18,960 -21,851 -17,523 -27,435 -34,283 13%
Source: Eurostat.
CHAPTER 2: EU CHOCOLATE CONSUMPTION AND PRODUCTION PAGE 16
© LMC International Ltd, 2006
Diagram 2.9: Central European Member States — Chocolate Trade
-20,000 -10,000 0 10,000 20,000 30,000 40,000
Poland
Slovakia
Hungary
Czech Rep
SloveniaN
et E
xpor
tsN
et Im
ports
Chocolate Trade (tonnes)
1999 2001 2001 2002 2003 2004 2005
Chocolate Production
Estimates of chocolate production are derived from the trade and consumption data presented above. As mentioned previously, Poland has become a production base for many EU-15 manufacturers, and production there is estimated to have increased from around 90,000 tonnes in 2001 to over 130,000 tonnes in 2005, equivalent to an annual average growth rate of 8%. Over the same period, production has declined in both the Czech Republic and Hungary. It is assumed that all consumption in Slovenia is supplied by imports (Table 2.6 and Diagram 2.10).
Table 2.6: Central European Member States — Chocolate Production (tonnes)
1999 2001 2001 2002 2003 2004 2005 Growth 5 years
Czech Rep 20,783 21,907 25,748 22,960 22,318 22,506 20,152 -5% Poland 79,659 88,874 90,695 89,809 90,008 117,883 131,955 8% Hungary 31,478 34,835 28,616 30,944 38,158 28,349 25,894 -2% Slovakia 19,748 20,822 21,535 22,032 22,108 25,373 24,622 3% Total 151,668 166,439 166,594 165,745 172,591 194,111 202,622 4%
Source: Derived from Tables 2.4 and 2.5

CHAPTER 2: EU CHOCOLATE CONSUMPTION AND PRODUCTION PAGE 17
© LMC International Ltd, 2006
Diagram 2.10: Central European Member States — Chocolate Production
0
20
40
60
80
100
120
140
1999 2001 2001 2002 2003 2004 2005
Prod
uctio
n ('0
00 to
nnes
)
Poland Hungary Slovakia Czech Rep
The derived production estimates are supported by the Prodcom data, which also show how production is broken down by type in Poland and Hungary. In Poland, production of unfilled bars (which account for over half of total output) and bonbons grew by an annual average of 13% between 2002 and 2004. In Hungary, the data suggests a sharp fall in chocolate bar production (Table 2.7 and Diagram 2.11).
Table 2.7: Poland and Hungary — Chocolate Production by Type (tonnes)
2002 2003 2004 Growth 3 Years
Poland Unfilled Bars 46,750 52,822 67,885 13% Filled Bars 23,063 25,183 28,878 8% Bonbons 16,722 22,557 24,406 13%
Hungary Unfilled Bars 10,158 8,824 3,707 -29% Filled Bars 10,706 8,481 5,392 -20% Bonbons 6,519 8,353 8,405 9%
Source: Prodcom.

CHAPTER 2: EU CHOCOLATE CONSUMPTION AND PRODUCTION PAGE 18
© LMC International Ltd, 2006
Diagram 2.11: Poland and Hungary — Chocolate Production by Type
0
10
20
30
40
50
60
70
Unfilled Bars Filled Bars Bonbons Unfilled Bars Filled Bars Bonbons
Poland Hungary
Prod
uctio
n ('0
00 to
nnes
)
2002 2003 2004
The data point to strong growth in chocolate production in Poland over the last few years as EU-15 manufacturers have established their operations there. However, there is considerable over-capacity in the Polish market and a degree of consolidation is taking place:
In 2005, Nestlé Polska sold its Poznan production facility (which manufactures Goplana brand confectionery) to a local manufacturer, Jutrzenka;
In 2005, the Swedish manufacturer Cloetta Fazer closed its Polish subsidiary in Gdansk due to falling sales;
In 2006, Barry Callebaut announced plans to construct a 25,000 tonne chocolate factory in Russia, a market that it had previously supplied from its Polish plant.

CHAPTER 3: THE EU MARKET FOR COCOA PAGE 19
© LMC International Ltd, 2006
Chapter 3: The EU Market for Cocoa
As cocoa and the vegetable fats used in the manufacture of chocolate are produced outside of the EU, import data can be used to gain an indication of the market size. This chapter examines trends in both cocoa and cocoa product imports, while the following chapter examines the imports of the vegetable fats permitted for use in chocolate.
NET IMPORTS
The EU imports cocoa beans as well as cocoa mass (liquor), cocoa butter and cocoa powder/cake. In order to determine the level of net imports on a consistent basis, cocoa product imports have to be converted to a cocoa bean equivalent. For this, we have used the ICCO’s standard conversions1.
Net imports of cocoa beans and cocoa products in bean equivalent (b.e.) terms from outside the EU-15 countries have increased from around 1.2 million tonnes in 1996 to over 1.4 million tonnes in 2005, recording an average annual growth rate of 2.1% over the last 10 years. Since 2003, the growth rate has increased to 3.5%; almost all of this growth occurred in 2005. The major EU-15 importers are the Netherlands (accounting for 38% of net imports in 2005), France (16%), Belgium (14%) and the UK (10%). Net imports into Belgium have grown by 16% per year since 2003, while German and Italian net imports have fallen (Table 3.1 and Diagram 3.1).
1 The ICCO conversions are: Beans: liquor /mass/paste 1.25:1 Beans: butter 1.33:1 Beans: powder/cake 1.18:1

Table 3.1: Net Imports of Cocoa Beans and Cocoa Products by Major EU-15 Importers (tonnes b.e.)
1996 1997 1998 1999 2000 2001 2002 2003 2004 2005 Annual Growth since 2003
Belgium (and Luxembourg) 55,222 87,379 92,962 47,139 105,001 92,496 123,981 122,463 148,399 190,842 15.9% France 172,996 134,467 141,070 164,282 169,436 195,709 176,114 197,999 217,498 214,683 2.7% Germany 188,195 185,615 182,347 161,424 159,844 143,441 134,032 134,951 104,271 134,321 -0.2% Italy 74,937 69,756 68,206 65,821 73,285 66,221 53,303 70,448 59,036 60,836 -4.8% Netherlands 383,902 211,688 243,741 437,294 369,189 471,517 392,195 517,750 514,723 549,120 2.0% Spain 53,921 62,527 69,988 72,494 72,735 77,007 82,019 82,915 86,258 94,789 4.6% UK 197,513 144,571 171,663 217,090 128,707 139,052 121,820 135,244 140,603 139,546 1.0% Other EU-15 27,684 33,887 33,336 17,865 28,139 15,815 17,372 11,673 14,388 27,794 33.5% Total EU-15 1,154,370 929,889 1,003,312 1,183,410 1,106,335 1,201,257 1,100,836 1,273,444 1,285,176 1,411,931 3.5%
Source: Eurostat.
CH
AP
TER
3: THE
EU
MA
RK
ET FO
R C
OC
OA
P
AG
E 20
© LM
C International Ltd, 2006

CHAPTER 3: THE EU MARKET FOR COCOA PAGE 21
© LMC International Ltd, 2006
Diagram 3.1: Total EU-15 Net Imports of Cocoa Beans and Cocoa Products
0
200
400
600
800
1,000
1,200
1,400
1,600
1996 1997 1998 1999 2000 2001 2002 2003 2004 2005
Net
Coc
oa Im
ports
('00
0 to
nnes
b.e
.)
Total Trend
The majority of EU-15 cocoa imports are in the form of raw beans. Cocoa product imports, particularly of paste, have grown more rapidly, mainly due to the increase in downstream processing in producing countries such as Côte d’Ivoire. The EU-15 is a net exporter of cocoa powder (Table 3.2).
This growth in processing at origin has been led by the multinational cocoa processors increasing their investment at origin. These products can be incorporated into standard blends and the companies have invested in good quality control procedures that ensure that bacterial contamination, particularly of paste products, can be avoided.
Factors that have encouraged this downstream processing are:
Access to beans, including the lower quality mid-crop beans, which can be obtained at a discount. In Côte d’Ivoire though, over the last two years, high demand has forced the price of mid-crop beans upwards;
Advantageous export tax rates for processed products;
Investment incentives; and
Lower average shipping costs as shell is not being exported.
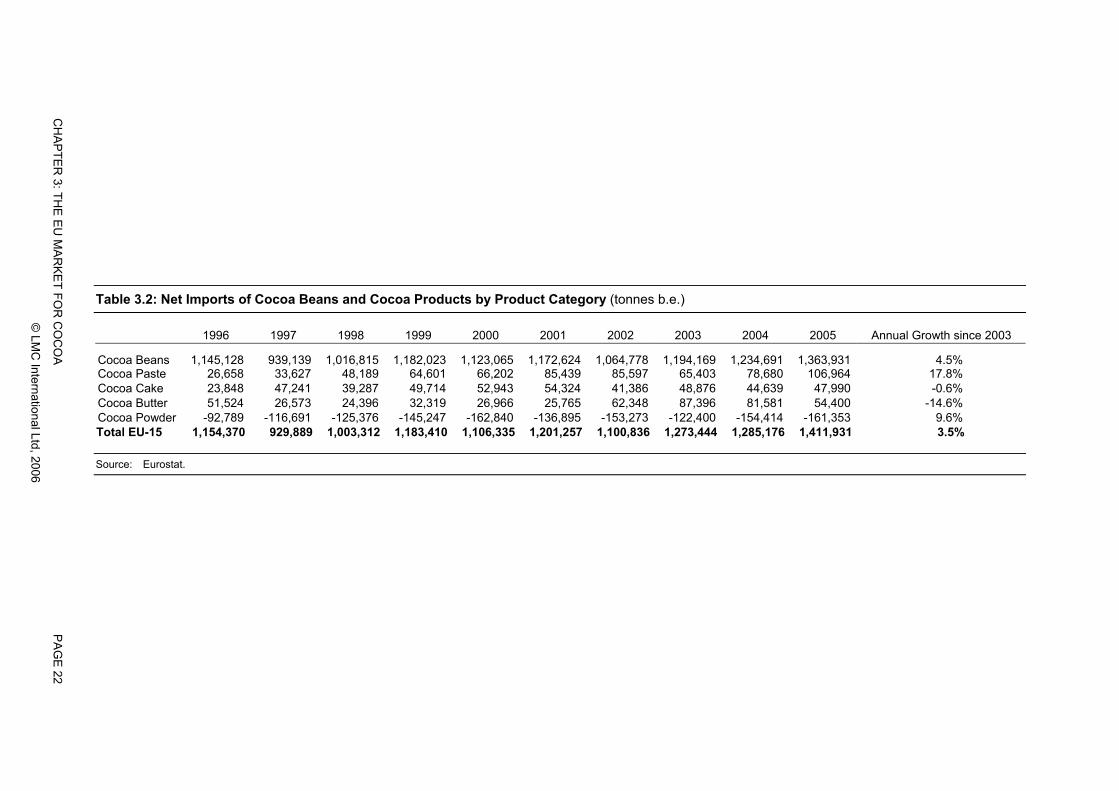
Table 3.2: Net Imports of Cocoa Beans and Cocoa Products by Product Category (tonnes b.e.)
1996 1997 1998 1999 2000 2001 2002 2003 2004 2005 Annual Growth since 2003
Cocoa Beans 1,145,128 939,139 1,016,815 1,182,023 1,123,065 1,172,624 1,064,778 1,194,169 1,234,691 1,363,931 4.5% Cocoa Paste 26,658 33,627 48,189 64,601 66,202 85,439 85,597 65,403 78,680 106,964 17.8% Cocoa Cake 23,848 47,241 39,287 49,714 52,943 54,324 41,386 48,876 44,639 47,990 -0.6% Cocoa Butter 51,524 26,573 24,396 32,319 26,966 25,765 62,348 87,396 81,581 54,400 -14.6% Cocoa Powder -92,789 -116,691 -125,376 -145,247 -162,840 -136,895 -153,273 -122,400 -154,414 -161,353 9.6% Total EU-15 1,154,370 929,889 1,003,312 1,183,410 1,106,335 1,201,257 1,100,836 1,273,444 1,285,176 1,411,931 3.5%
Source: Eurostat.
CH
AP
TER
3: THE
EU
MA
RK
ET FO
R C
OC
OA
P
AG
E 22
© LM
C International Ltd, 2006

CHAPTER 3: THE EU MARKET FOR COCOA PAGE 23
© LMC International Ltd, 2006
IMPORTS BY ORIGIN
The majority of EU-15 cocoa imports are from West Africa, which supplied approaching 1.6 million tonnes of beans and cocoa products in 2005. Côte d’Ivoire alone accounted for 33% of total 2005 imports, with three other West African origins (Ghana, Nigeria and Cameroon) accounting for a further 49%. Imports from Central and South America have grown by an average of 5% per year, although the region’s import share is still only 5%, similar to that of Asia and Oceania (Table 3.3).
Over the reporting period, imports from Côte d’Ivoire as a proportion of total imports peaked in 2000 and have fallen since. Exports from other West African producers have increased to compensate (Diagram 3.2).
In any one year changes in imports by country, on top of the underlying trend growth, can be attributed to:
Statistical error;
Seasonal fluctuation in the timing of the crop: for instance, as the crop is harvested towards the end of a calendar year, an early crop could see an increase in imports in December as opposed to January; and
Cross-border movements: There has long been a trade in cocoa between Ghana and East Côte d’Ivoire, with the direction of the trade depending upon relative prices. In addition, the rise in imports from Togo since 2003 is largely attributed to increased smuggling from Côte d’Ivoire.
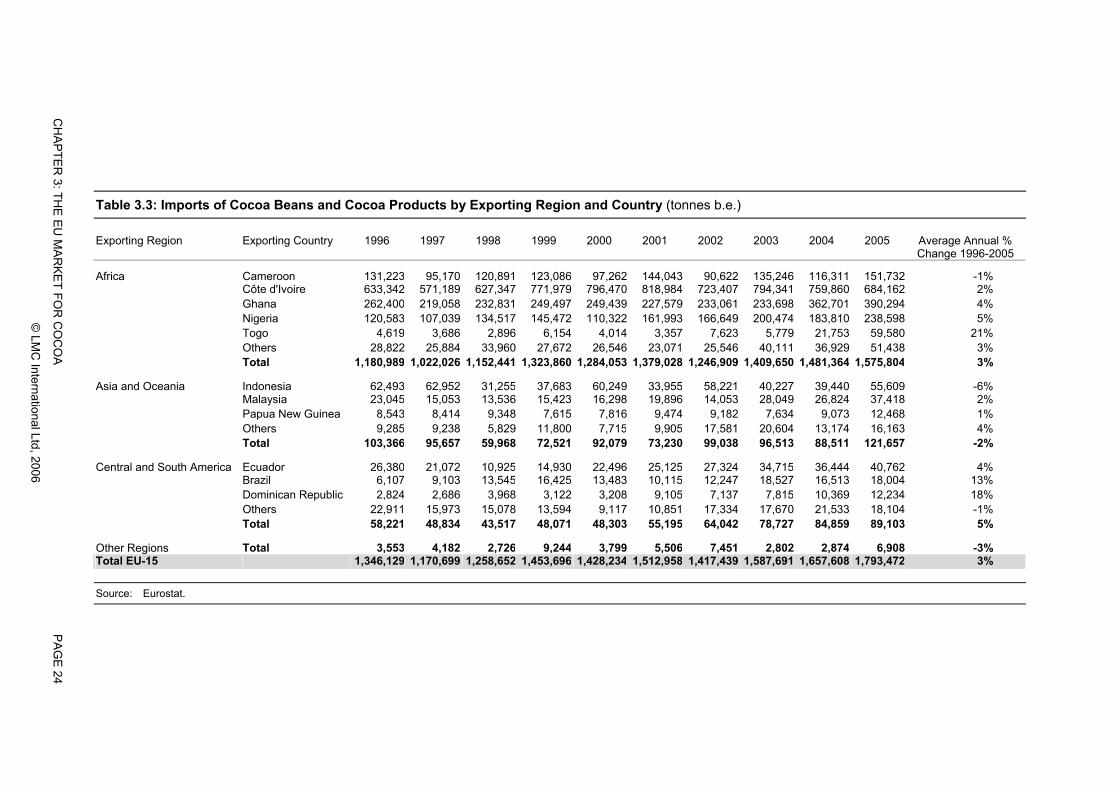
Table 3.3: Imports of Cocoa Beans and Cocoa Products by Exporting Region and Country (tonnes b.e.) Exporting Region Exporting Country 1996 1997 1998 1999 2000 2001 2002 2003 2004 2005 Average Annual %
Change 1996-2005
Africa Cameroon 131,223 95,170 120,891 123,086 97,262 144,043 90,622 135,246 116,311 151,732 -1% Côte d'Ivoire 633,342 571,189 627,347 771,979 796,470 818,984 723,407 794,341 759,860 684,162 2% Ghana 262,400 219,058 232,831 249,497 249,439 227,579 233,061 233,698 362,701 390,294 4% Nigeria 120,583 107,039 134,517 145,472 110,322 161,993 166,649 200,474 183,810 238,598 5% Togo 4,619 3,686 2,896 6,154 4,014 3,357 7,623 5,779 21,753 59,580 21% Others 28,822 25,884 33,960 27,672 26,546 23,071 25,546 40,111 36,929 51,438 3% Total 1,180,989 1,022,026 1,152,441 1,323,860 1,284,053 1,379,028 1,246,909 1,409,650 1,481,364 1,575,804 3%
Asia and Oceania Indonesia 62,493 62,952 31,255 37,683 60,249 33,955 58,221 40,227 39,440 55,609 -6% Malaysia 23,045 15,053 13,536 15,423 16,298 19,896 14,053 28,049 26,824 37,418 2% Papua New Guinea 8,543 8,414 9,348 7,615 7,816 9,474 9,182 7,634 9,073 12,468 1% Others 9,285 9,238 5,829 11,800 7,715 9,905 17,581 20,604 13,174 16,163 4% Total 103,366 95,657 59,968 72,521 92,079 73,230 99,038 96,513 88,511 121,657 -2%
Central and South America Ecuador 26,380 21,072 10,925 14,930 22,496 25,125 27,324 34,715 36,444 40,762 4% Brazil 6,107 9,103 13,545 16,425 13,483 10,115 12,247 18,527 16,513 18,004 13% Dominican Republic 2,824 2,686 3,968 3,122 3,208 9,105 7,137 7,815 10,369 12,234 18% Others 22,911 15,973 15,078 13,594 9,117 10,851 17,334 17,670 21,533 18,104 -1% Total 58,221 48,834 43,517 48,071 48,303 55,195 64,042 78,727 84,859 89,103 5%
Other Regions Total 3,553 4,182 2,726 9,244 3,799 5,506 7,451 2,802 2,874 6,908 -3% Total EU-15 1,346,129 1,170,699 1,258,652 1,453,696 1,428,234 1,512,958 1,417,439 1,587,691 1,657,608 1,793,472 3%
Source: Eurostat.
CH
AP
TER
3: THE
EU
MA
RK
ET FO
R C
OC
OA
P
AG
E 24
© LM
C International Ltd, 2006

CHAPTER 3: THE EU MARKET FOR COCOA PAGE 25
© LMC International Ltd, 2006
Diagram 3.2: EU-15 Cocoa Imports % of Total
0%
10%
20%
30%
40%
50%
60%
1996 1997 1998 1999 2000 2001 2002 2003 2004 2005
Tota
l Im
ports
(%)
Cameroon Côte d'Ivoire Ghana NigeriaTogo Indonesia Ecuador Other
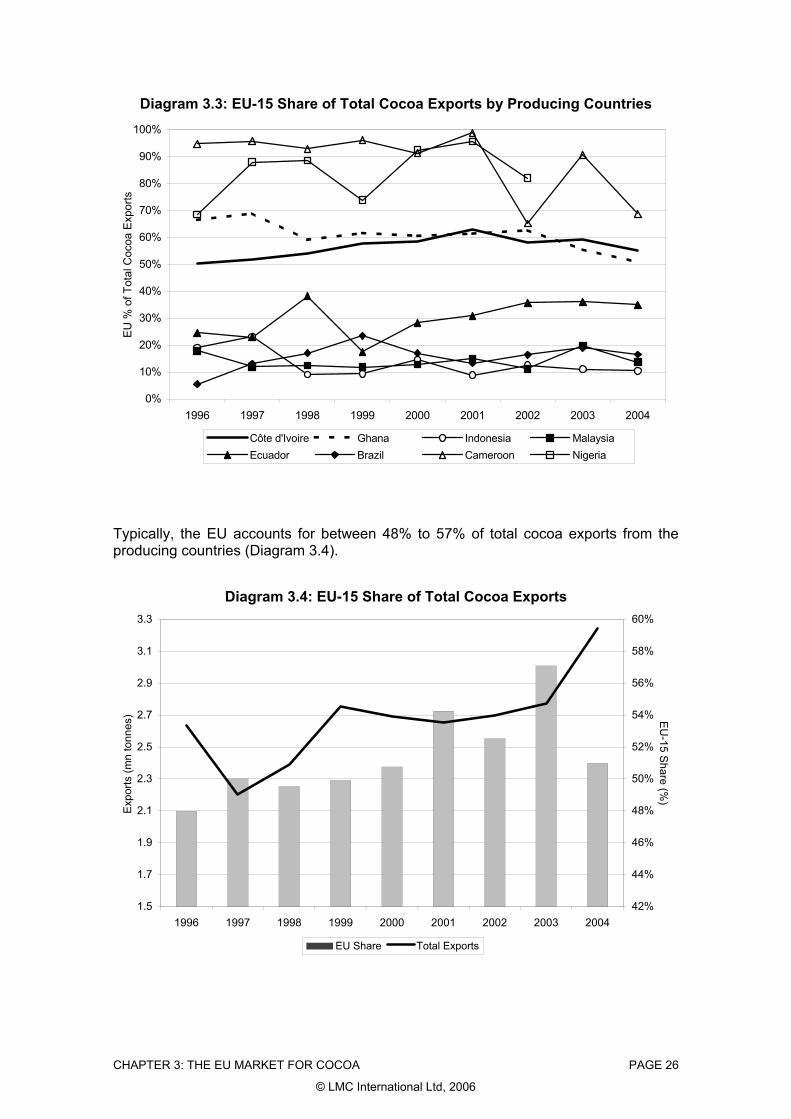
In order to illustrate the importance of the EU-15 markets to cocoa producing countries, a comparison has been made between the import data and export data mainly compiled from official sources by the International Cocoa Organisation (ICCO).
This analysis shows that, in the case of Cameroon and Nigeria, EU-15 imports typically account for around 80% of total cocoa exports, while for Côte d’Ivoire and Ghana, the share is over 50%. These are much higher shares than those for exports from Asian producers, such as Indonesia and Malaysia (both less than 20%), and from South American producers, such as Ecuador (less than 40%) and Brazil (less than 25%) (Diagram 3.3).
CHAPTER 3: THE EU MARKET FOR COCOA PAGE 26
© LMC International Ltd, 2006
Diagram 3.3: EU-15 Share of Total Cocoa Exports by Producing Countries
0%
10%
20%
30%
40%
50%
60%
70%
80%
90%
100%
1996 1997 1998 1999 2000 2001 2002 2003 2004
EU %
of T
otal
Coc
oa E
xpor
ts
Côte d'Ivoire Ghana Indonesia MalaysiaEcuador Brazil Cameroon Nigeria
Typically, the EU accounts for between 48% to 57% of total cocoa exports from the producing countries (Diagram 3.4).
Diagram 3.4: EU-15 Share of Total Cocoa Exports
1.5
1.7
1.9
2.1
2.3
2.5
2.7
2.9
3.1
3.3
1996 1997 1998 1999 2000 2001 2002 2003 2004
Exp
orts
(mn
tonn
es)
42%
44%
46%
48%
50%
52%
54%
56%
58%
60%
EU
-15 Share (%
)
EU Share Total Exports

CHAPTER 3: THE EU MARKET FOR COCOA PAGE 27
© LMC International Ltd, 2006
EU GRINDINGS
CAOBISCO and the European Cocoa Association (ECA) jointly publish cocoa grinding statistics covering the EU and Switzerland. The data account for around 95% of total Western European grindings. Grindings over the 1999 to 2005 period have grown at an annual average rate of 2.0%, a similar growth rate to that reported for net EU-15 bean imports over the last ten years. The increase in imports in 2005 is also picked up by the higher grind in 2005. The fluctuation in annual growth is related to changes in processing margins, which are in turn driven by cocoa product stock levels and prices (Table 3.4 and Diagram 3.5).
Table 3.4: Western Europe — Cocoa Grindings, 1999-2005 (tonnes) Grindings Annual Growth
1999 1,032,105 2000 1,131,452 10% 2001 1,124,623 -1% 2002 1,031,683 -8% 2003 1,084,494 5% 2004 1,106,025 2% 2005 1,165,128 5% Growth 7 Years 2.0%
Source: ECA.
Diagram 3.5: Western Europe – Cocoa Grindings
0.0
0.2
0.4
0.6
0.8
1.0
1.2
1999 2000 2001 2002 2003 2004 2005
Grin
ding
s (to
nnes
)
-10%
-6%
-2%
2%
6%
10%
14%
Grindings grow
th (%)
Grindings Annual Growth Trend (Annual Grindings)

CHAPTER 3: THE EU MARKET FOR COCOA PAGE 28
© LMC International Ltd, 2006
INTRA EU-15 TRADE
Since cocoa is a tropical crop, the majority of trade is extra EU-15 imports. However, the increasing concentration of cocoa shipping, storage and processing/manufacturing activities, has also driven an increase in intra EU-15 trade (Table 3.5).
IMPACT OF THE DIRECTIVE ON COCOA IMPORTS
Since the Directive was implemented in 2003, the rate of net cocoa imports has accelerated due to higher imports in 2005. However, as seen in Chapter 2, in an essentially flat chocolate market, this suggests that more cocoa solids are being used in chocolate products. This is in keeping with the trend towards the consumption of darker chocolate and gourmet chocolate products. Diagram 3.6 uses simple trend lines to compare the performance of cocoa imports before and after the adoption of the Directive. Since the adoption of the Directive the slope of the trend line has increased, pointing to higher growth. However, the sample is limited as it is only based on two years’ worth of data.
Diagram 3.6: EU-15 Share of Total Cocoa Exports
0
200
400
600
800
1,000
1,200
1,400
1,600
1996 1997 1998 1999 2000 2001 2002 2003 2004 2005
Net
Impo
rts ('
000
tonn
es)
Total to 2003 Total 2003 to 2005Linear (Total to 2003) Linear (Total 2003 to 2005)

Table 3.5: Intra-EU Trade in Cocoa Beans and Cocoa Products by Product Category (tonnes b.e.)
1996 1997 1998 1999 2000 2001 2002 2003 2004 Average Annual % Change 1996-2004
Imports Cocoa Beans 154,867 185,582 168,209 170,036 189,975 177,977 159,919 144,539 183,447 2% Cocoa Paste 126,280 118,415 118,525 116,665 119,677 112,077 140,627 148,653 142,252 1% Cocoa Butter 245,077 244,521 253,119 274,140 260,326 283,469 276,256 272,254 283,298 2% Cocoa Powder 135,237 136,977 137,327 146,490 165,776 184,906 166,890 161,131 168,664 3%
Source: Eurostat.
CH
AP
TER
3: THE
EU
MA
RK
ET FO
R C
OC
OA
P
AG
E 29
© LM
C International Ltd, 2006

CHAPTER 3: THE EU MARKET FOR COCOA PAGE 30
© LMC International Ltd, 2006
EU-10 COCOA DEMAND
Net cocoa imports into the EU-10 have grown by 2% per year on average between 2001 and 2005. The Central European member states account for almost 95% of the total. Imports have remained relatively stable over the last three years at around 117,000 tonnes, after rising from below 110,000 tonnes in 2001 and 2002. Poland accounts for almost 70% of imports (Table 3.6).
Table 3.6: EU-10 — Net Cocoa Bean and Product Imports by Country (tonnes, b.e.)
1999 2000 2001 2002 2003 2004 2005 Growth 5 years
Cyprus 359 360 328 454 323 332 339 1% Malta 52 48 6 25 47 49 45 50% Total 411 408 334 479 370 381 384 3%
Czech Rep 14,479 12,419 13,698 13,740 13,570 11,411 12,404 -2% Poland 63,308 72,952 68,552 66,896 71,836 80,110 79,168 3% Hungary 10,755 10,823 10,548 11,970 11,900 8,811 7,605 -6% Slovakia 1,117 1,064 -422 -2,092 1,452 594 -1,038 20% Slovenia 7,619 7,934 8,833 11,379 10,847 8,303 11,419 5% Total 97,278 105,192 101,208 101,894 109,605 109,229 109,559 2%
Estonia 1,598 1,581 1,342 1,321 1,305 1,601 1,396 1% Latvia 1,648 1,569 1,793 1,952 2,031 2,750 2,203 4% Lithunania 3,364 2,743 3,639 3,501 2,851 2,294 3,179 -3% Total 6,609 5,893 6,774 6,773 6,186 6,645 6,778 0%
Total 104,298 111,492 108,317 109,146 116,161 116,255 116,721 2%
Source: Eurostat.
While EU-10 imports of cocoa beans (and consequently the cocoa grind) have fallen by an average of 11% per year between 2001 and 2005, increasing volumes are being imported as processed products. This is particularly the case for cocoa paste and cocoa butter (the ingredients for chocolate manufacturing) since 2003 (Table 3.7 and Diagram 3.7).
Table 3.7: EU-10 — Net Cocoa Bean and Product Imports by Type (tonnes, b.e.)
1999 2000 2001 2002 2003 2004 2005 Growth 5 years
Cocoa beans 55,015 52,269 60,312 55,558 56,770 46,567 34,361 -11% Cocoa paste 12,278 20,796 15,640 10,779 12,378 20,138 24,119 9% Cocoa butter 11,508 12,656 9,899 16,535 20,914 21,985 27,243 22% Cocoa cake/powder 25,496 25,771 22,466 26,275 26,099 27,566 30,998 7% Total 104,298 111,492 108,317 109,146 116,161 116,255 116,721 2%
Source: Eurostat.
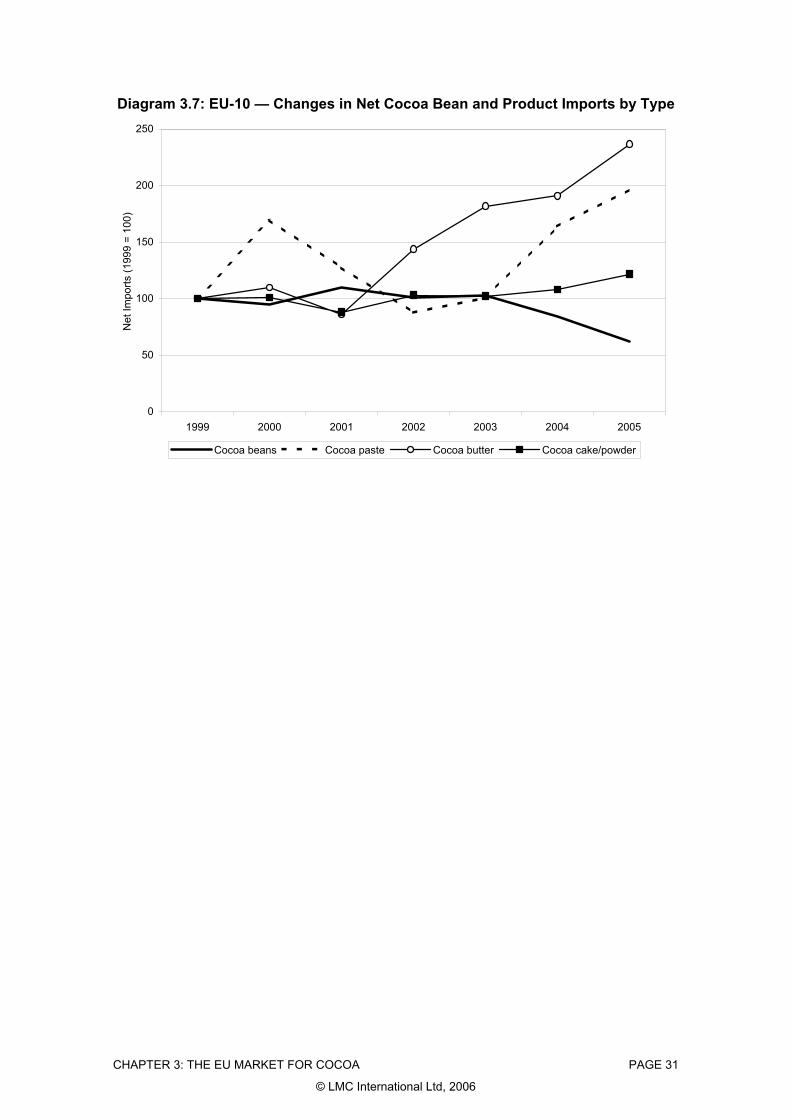
CHAPTER 3: THE EU MARKET FOR COCOA PAGE 31
© LMC International Ltd, 2006
Diagram 3.7: EU-10 — Changes in Net Cocoa Bean and Product Imports by Type
0
50
100
150
200
250
1999 2000 2001 2002 2003 2004 2005
Net
Impo
rts (1
999
= 10
0)
Cocoa beans Cocoa paste Cocoa butter Cocoa cake/powder
CHAPTER 4: THE EU MARKET FOR VEGETABLE FATS PAGE 32
© LMC International Ltd, 2006
Chapter 4: EU-15 Imports of Vegetable Fats Allowed by Directive 2000/36/EC for the Manufacturer of Chocolate
While all the permitted fats are imported, the calculation of the EU-15 market size for CBEs is more complex than is the case for cocoa. This is because:
The HS codes used for the vegetable oils are not specific to CBEs. Prior to 2001, sheanut imports were recorded under HS code 12079290 while other tropical fats were under code 12079998. In 2002, the codes were revised and shea nuts were also placed under 120799. As this is a more general category, the only way of distinguishing individual products is to make assumptions based on the source country. Hence products coming from West Africa are assumed to be shea, products from Indonesia illipe and products from India either sal, kokum or mango kernel. Processed products are mainly imported under code 151590 and the same assumptions have to be applied as the code does not distinguish between individual products.
Sheanut trade data are suppressed for Denmark, the largest importer in the EU. The level of imports were determined by examining Western African export data as well as discussions with exporters and importers conducted as part of the case studies.
A proportion of sheanuts are being exported to India, processed and then imported into Europe. Imports of sheanuts to India can be picked up from Indian import statistics, but exports of products from India are not so clearly defined.
Sal, kokum and mango kernel are imported in relatively small quantities and are not adequately picked up in trade statistics. The Solvent Extractors’ Association of India data provide some estimates but these are incomplete. These data were enhanced by information gained during the case studies.
CBEs comprise blends of the permitted vegetable fats. In the case of palm oil, palm mid-fraction is used for the production of CBEs; however, the large volume of palm oil entering foreign trade does not identify mid-fractions on their own; this makes it impossible to determine what is being used for CBEs from trade data alone. Estimates of the levels of mid-fractions used are based on CBE recipes.
An increasing proportion of CBEs is exported from the EU-15 to Central and Eastern Europe and Latin America. These exports are not contained in specific HS codes and hence estimates of the volume of exports have been derived.
Chocolate manufacture is not the sole use of these fats and adjustments have to be made for CBE and other applications. Three applications are worth considering:
― Filling fats: these have the same components as CBEs but are used as fillings for confectionery products. For instance, filling fats for use in products such as truffles are commonly used in the Netherlands, Germany and Belgium;
― Similarly some CBE type products are used as coatings for compound chocolate products; and

CHAPTER 4: THE EU MARKET FOR VEGETABLE FATS PAGE 33
© LMC International Ltd, 2006
― Personal care products: these use shea butter, although many use shea olein, rather than stearin in their manufacture. As shea stearin is required for CBEs, products using shea olein can be considered as joint products with shea use in CBEs.
Given these difficulties, initial estimates on the size of imports and the CBE market have been refined following the case studies in both Europe and producing countries. This chapter discusses the importation of vegetable fats, while the following chapter presents estimates of the market size and EU-15 CBE production.
EXOTICS
Sheanuts and Butter
Sheanut imports for EU countries were derived from Eurostat data for all countries with the exception of Denmark. Denmark’s imports were estimated from the case study data. These data only show the port of entry into the EU for sheanuts and not the final point of processing or use. Sheanut imports to the EU-15 show considerable fluctuation between years due to the fluctuation and timing of the crop. There is also considerable variation in the supplying countries as production varies considerably between years. However, the underlying trend is upwards (Diagram 4.1). Imports in 2006 will be considerably lower than those of 2005 due to the failure of the shea crop; this has placed pressure on available supplies.
Table 4.1: EU-15 Sheanut Imports (tonnes) 1996 1997 1998 1999 2000 2001 2002 2003 2004 2005
Total 31,938 24,856 52,757 30,155 29,396 59,576 48,787 80,802 67,626 85,040of which from: Mali 0 0 0 0 0 0 0 0 0 0Burkina Faso 0 0 2,844 0 0 5,316 1,983 1,805 1,244 0Ivory Coast 63 18 5,742 565 1,048 1,051 1,710 636 679 597Ghana 19,801 15,166 24,585 18,457 16,851 40,501 41,753 47,780 47,031 60,059Togo 3,252 3,477 2,036 2,353 3,514 180 889 8,408 1,576 0Benin 8,822 6,195 17,534 7,852 7,928 11,647 1,786 22,171 17,095 24,381Nigeria 0 0 15 929 54 881 667 2 1 3
Note: Derives from HS codes 12079290 (from 1996 - 2001), and 12079998 afterwards and West African export data.
Source: Eurostat and LMC estimates.

CHAPTER 4: THE EU MARKET FOR VEGETABLE FATS PAGE 34
© LMC International Ltd, 2006
Diagram 4.1: EU-15 Sheanut Imports, 1996–2005
0
10
20
30
40
50
60
70
80
90
100
1996 1997 1998 1999 2000 2001 2002 2003 2004 2005
Estim
ated
Impo
rts ('
000
tonn
es)
Imports Trend
Shea butter imports have risen substantially over the reporting period, peaking at 15,400 tonnes in 2005. The main exporting countries are Togo and Ghana. The main importing country is the Netherlands. Part of the reason for the increase in butter imports in 2005 is the reduction in processing in the UK, which has resulted in this crushing moving to West Africa (Table 4.2 and Diagram 4.2).
Table 4.2: EU-15 Shea Butter Imports (tonnes) 1996 1997 1998 1999 2000 2001 2002 2003 2004 2005
Total from Listed Origins 138 241 1,542 3,543 1,590 2,177 7,502 10,358 7,049 15,397of which from: Mali 0 0 0 514 53 22 14 0 0 0Burkina Faso 0 64 327 245 184 252 87 335 350 255Ivory Coast 66 37 874 2,199 424 10 32 2 0 17Ghana 20 43 322 585 666 949 2,965 5,664 4,497 5,343Togo 52 97 19 0 263 944 3,717 4,356 2,201 9,747Benin 0 0 0 0 0 0 2 1 1 35Nigeria 0 0 0 0 0 0 687 0 0 0
of which to: UK 0 0 0 0 0 2 12 0 0 27Denmark 0 42 402 1,120 268 2 0 0 0 0Netherlands 56 43 989 2,244 1,099 1,950 7,363 9,888 6,320 14,651France 58 126 138 145 166 129 3 228 186 215Germany 0 0 0 0 0 2 0 0 19 3Italy 0 1 13 34 57 92 109 77 108 42Belgium 0 29 0 0 0 0 0 165 416 426Sweden 0 0 0 0 0 0 15 0 0 34Total 114 241 1,542 3,543 1,590 2,177 7,502 10,358 7,049 15,397
Note: Derived from HS 15159059 and 15159099.
Source: Eurostat.

CHAPTER 4: THE EU MARKET FOR VEGETABLE FATS PAGE 35
© LMC International Ltd, 2006
Diagram 4.2: EU-15 Shea Butter Imports
0
2
4
6
8
10
12
14
16
1996 1997 1998 1999 2000 2001 2002 2003 2004 2005
Impo
rts ('
000
tonn
es)
There is a further level of imports of shea stearin from India, which is not being picked up by the sheanut HS codes. The flow of this trade is that sheanuts are exported from West Africa to India, processed in India and then re-exported as shea stearin, the raw material for CBE manufacture. A proportion of this production is exported to the EU-15. This trade and processing is currently undertaken by only one India processing company, Foods, Fats and Fertilisers (FFF). Data from India on sheanut imports suggests that this trade has risen to over 12,000 tonnes of nuts per annum (Diagram 4.3). This leads to the production and re-export of around 2,000 tonnes of shea stearin1. Around 50% of this shea stearin is exported to the EU.
1Based on the standard conversions of: Sheanuts: shea butter 1:0.45 Shea butter: shea stearin 1:0.35 Illipe nuts: illipe butter 1:0.5

CHAPTER 4: THE EU MARKET FOR VEGETABLE FATS PAGE 36
© LMC International Ltd, 2006
Diagram 4.3: India — Sheanut Imports
0
2
4
6
8
10
12
14
1996/97 1997/98 1998/99 1999/00 2000/01 2001/02 2002/03 2003/04 2004/05 2005/06
Impo
rts ('
000
tonn
es)
Converting the sheanut, butter and stearin imports to a nut equivalent basis suggests that approaching 130,000 tonnes of sheanuts were imported into the EU-15 in 2005. There is an upward trend in sheanut imports and this trend has accelerated since 2000/01 (Diagram 4.4).
Diagram 4.4: EU-15 Sheanut Imports (nut equivalent basis)
0
20
40
60
80
100
120
140
1996 1997 1998 1999 2000 2001 2002 2003 2004 2005
Impo
rts ('
000
tonn
es, n
ut e
quiv
alen
t ter
ms)
Sheanuts (1996 - 2001) Sheanuts (2001 - 2005)Linear (Sheanuts (1996 - 2001)) Linear (Sheanuts (2001 - 2005))

CHAPTER 4: THE EU MARKET FOR VEGETABLE FATS PAGE 37
© LMC International Ltd, 2006
The EU-15 is the most important importer of sheanuts. accounting for over 80% of African regional exports.
Sal, Mango Kernel and Kokum
The imports of sal, mango kernel and kokum are solely from India and it is difficult to determine import levels from Eurostat data alone. Greater detail on sal, kokum and mango kernel exports are available from the Solvent Extractors’ Association of India (SEA), however, these data underestimate the total volume of trade. Our import numbers supplement the SEA data with information gained during the field visits. Imports are in the form of intermediate products that can be incorporated into CBEs (sal stearin2, mango kernel stearin and kokum butter).
Sal oil and sal stearin are the main EU-15 imports from India. As is the case with sheanuts, there is considerable fluctuation in imports each year. This is dependent upon crop production levels. With a large sal crop in 2005, sal stearin imports to the EU rose to 2,100 tonnes. Mango kernel imports show a similar level of volatility. There is less fluctuation in kokum production and import levels although the total size of the crop is low (Table 4.3 and Diagram 4.5).
Table 4.3: Estimated Indian Exotic Oil Exports to EU-15 (tonnes)
1996 1997 1998 1999 2000 2001 2002 2003 2004 2005
Sal Oil 278 324 174 177 330 401 230 544 201 900Sal Stearin 650 757 405 412 770 936 537 1,269 469 2,100Mango Kernel Stearin 331 1,001 142 1,300 0 125 141 744 146 437Kokum 175 168 197 175 180 180 198 198 190 200
2 Some sal oil is also imported into the EU for further processing or use as a filling fat.

CHAPTER 4: THE EU MARKET FOR VEGETABLE FATS PAGE 38
© LMC International Ltd, 2006
Diagram 4.5: India — Exotic Oil Exports
0
500
1,000
1,500
2,000
2,500
3,000
3,500
4,000
4,500
1996 1997 1998 1999 2000 2001 2002 2003 2004 2005
(Exp
orts
to E
U-1
5 (T
onne
s)
Sal (oil basis) Mango Kernel Stearin Kokum
Around 40% of Indian exotic fat exports are destined for the EU. The other main destination is Japan (Diagram 4.6).
Diagram 4.6: Sal, Kokum and Mango Kernel Exports from India to the EU-15
0
500
1,000
1,500
2,000
2,500
3,000
3,500
4,000
4,500
1996 1997 1998 1999 2000 2001 2002 2003 2004 2005
Exp
orts
to E
U-1
5 (to
nnes
)
10%
15%
20%
25%
30%
35%
40%
45%
50%
55%
Proportion of total exports (%
)
Exports to EU EU % of Total

CHAPTER 4: THE EU MARKET FOR VEGETABLE FATS PAGE 39
© LMC International Ltd, 2006
Illipe Nuts
Illipe nut/butter imports are sporadic and suffer from severe fluctuations. The majority of imports are butter. Every three or four years there is a bumper crop. There were high imports in 2002 and 2005 (Table 4.4).
Table 4.4: Illipe Imports to the EU-15 (tonnes)
1996 1997 1998 1999 2000 2001 2002 2003 2004 2005
Nuts 30 20 19 24 4 4 4,187 44 2 52 Illipe butter Belgium 0 0 97 1 0 0 0 108 0 193UK 18 0 0 0 0 0 120 200 : 200Germany 647 173 0 10 31 9 1 319 90 353France 0 0 0 0 0 0 0 0 0 0Italy 1,023 684 230 35 0 0 0 19 102 0Netherlands 0 0 0 0 0 0 0 0 0 700Total 1,688 857 327 47 31 9 121 646 193 1,446
Source: Eurostat.
Total Exotic Imports
Combining the above data and converting it to a CBE raw material form (i.e., shea stearin, sal stearin, mango kernel stearin, kokum and illipe butter) suggest that the volume of exotic raw material imports was almost 25,000 tonnes in 2005. This volume fluctuates each year, necessitating the holding of stocks by processors. An impression of underlying demand can be gained by using a trendline. We have split the trend pre-2000/01 and post 2000/01 as the volume of exotics being used begins to increase after this period.

CHAPTER 4: THE EU MARKET FOR VEGETABLE FATS PAGE 40
© LMC International Ltd, 2006
Diagram 4.7: Exotic Fat Imports to EU-15
0
5
10
15
20
25
30
1996 1997 1998 1999 2000 2001 2002 2003 2004 2005
EU Im
ports
('oo
o to
nnes
, CBE
equ
ival
ent b
asis
) .
Exotic Use trend
PALM OIL
While it is possible to get an impression of the level of exotic fat imports and use in CBEs, the level of palm oil (or more specifically palm mid-fraction) is more difficult to gauge owing to the large number of end uses. While the level of palm oil imports has more than doubled over the last ten years (Diagram 4.8), this presents a misleading picture of usage for CBEs.

CHAPTER 4: THE EU MARKET FOR VEGETABLE FATS PAGE 41
© LMC International Ltd, 2006
Diagram 4.8: EU-15 Palm Oil Imports
1,500
2,000
2,500
3,000
3,500
4,000
4,500
1995/96 1996/97 1997/98 1998/99 1999/00 2000/01 2001/02 2002/03 2003/04 2004/05
Impo
rts ('
000
tonn
es)
The use of palm mid-fraction (PMF) varies between 10% to 100% of the weight of a CBE, depending upon what the product is to be used for. A lower proportion of exotics are used in “soft” CBEs (up to 30% exotic) while a higher proportion is used in “hard” CBEs (greater than 30%). The choice of CBE depends on the market and application. While the split between hard and soft CBEs provides a broad indication of CBE use, increasingly, CBE products are changing from more generalised commodity products to speciality products that are formulated according to the exact demands of the end user.
In order to determine total CBE production (and the amount of PMF used) in the CBE we have divided the market between soft and hard CBEs. This is discussed further in Chapter 5.
CHAPTER 5: THE USE OF VEGETABLE FATS IN CHOCOLATE PAGE 42
© LMC International Ltd, 2006
Chapter 5: The Use of Vegetable Fats in Chocolate in the EU-15 and CBE Production
THE USE OF THE PERMITTED FATS FOR THE PRODUCTION OF CHOCOLATE IN THE EU-15
An analysis of CAOBISCO data allows us to estimate the usage of CBEs in the EU-15 and any change in demand since the adoption of the Directive. We split the analysis between countries who permitted the use of CBEs prior to the Directive and those who did not. Given an increasing trade in chocolate products, we have based our CBE estimates on consumption in particular markets. For instance, the UK has always used CBEs and the majority of chocolate products consumed contain CBEs, even if this chocolate is manufactured in countries that did not use CBEs prior to the adoption of the Directive. Hence there are flows of chocolate products containing CBEs that are produced in a market that they are not destined for. Prior to the adoption of the Directive this would have been prohibited in some markets.
Countries that Permitted the Use of CBEs Prior to 2000
Chocolate product consumption in countries permitting the use of CBEs in chocolate prior to 2000 was some 740,000 tonnes in 2005. In addition, chocolate biscuit production was 450,000 tonnes (Tables 5.1 and 5.2).

Table 5.1: Chocolate Product Consumption Countries Permitting CBEs Prior to 2000 (tonnes) 1996 2000 2001 2002 2003 2004 2005 Annual Growth
since 2003 Annual Growth
5 years Annual Growth
10 years
UK 487,415 491,516 475,981 509,241 530,226 529,187 500,381 -1.9% 1.0% 0.3% Austria 70,235 50,013 60,183 53,225 49,688 54,322 53,676 2.6% -2.3% -2.7% Sweden 45,905 56,708 59,239 60,899 58,173 59,742 58,447 0.2% -0.3% 2.4% Ireland 30,458 31,839 30,726 32,827 35,192 34,460 33,426 -1.7% 1.7% 0.9% Finland 18,245 27,942 30,511 30,364 31,157 32,289 32,612 1.5% 1.3% 6.0% Denmark 38,575 40,942 42,971 44,217 40,977 42,594 41,596 0.5% -0.6% 0.8% Portugal 11,660 21,229 24,598 25,213 21,695 19,237 20,500 -1.9% -3.6% 5.8% Total 702,493 720,188 724,210 755,985 767,107 771,830 740,639 -1.2% 0.4% 0.5%
Source: Caobisco, LMC.
Table 5.2: Chocolate Biscuit Consumption Countries Permitting CBEs Prior to 2000 (tonnes)
1996 2000 2001 2002 2003 2004 2005 Annual Growth since 2003
Annual Growth 5 years
Annual Growth 10 years
UK 296,660 343,800 360,675 356,435 402,795 398,020 393,245 -0.8% 1.7% 2.9% Austria na 24,015 26,605 28,375 26,845 25,095 23,345 -4.5% -2.6% Sweden na 1,165 1,740 1,160 1,425 1,425 1,425 0.0% -3.9% Ireland 13,000 10,420 10,420 10,420 10,420 9,572 9,742 -2.2% -1.3% -2.8% Finland 8,638 8,220 8,575 9,290 10,635 9,290 10,462 -0.5% 4.1% 1.9% Denmark 3,055 3,410 3,330 4,165 4,345 4,180 4,653 2.3% 6.9% 4.3% Portugal 800 4,365 3,930 4,875 4,555 5,340 5,386 5.7% 6.5% 21.0% Total 322,153 395,395 415,275 414,720 461,020 452,922 448,257 -0.9% 1.5%
Note: 2005 data are estimates based on trends.
Source: Caobisco, LMC.
CH
AP
TER
5: THE
US
E O
F VEG
ETA
BLE
FATS
IN C
HO
CO
LATE
P
AG
E 43
© LM
C International Ltd, 2006

CHAPTER 5: THE USE OF VEGETABLE FATS IN CHOCOLATE PAGE 44
© LMC International Ltd, 2006
In order to determine the amount of chocolate used in these products we assume:
Unfilled chocolate bars comprise 100% solid chocolate bars and those containing added fruits, cereals and nuts. The breakdown between these unfilled products is based on Eurostat Prodcom data. Solid chocolate bars are assumed to be 100% chocolate, while bars with added fruit etc, are assumed to be 80% chocolate (this is in line with the weight of chocolate in mixed products that are produced by Cadbury, the largest manufacturer of chocolate in the UK) (Table 5.3).
Table 5.3: Cadbury Dairy Milk, Filling Weights (%) Filling weight
Fruit and Nut 23% Whole Nut 15% Turkish 14% Wafer 29% Mint chips 28%
Source: Supermarket Research.
In the UK, there has been an increase in the production of solid bars at the expense of bars with added fruit, etc. (Table 5.4).
Table 5.4: UK Chocolate Bar Production by Type (tonnes) 1996 1997 1998 1999 2000 2001 2002 2003 2004
Solid Chocolate 62,107 62,000 61,420 69,304 75,829 96,332 101,242 106,922 112,752Added fruit, nuts, etc 35,825 34,012 40,035 42,393 38,779 17,572 17,412 16,753 13,060Other 17,275 23,658 17,599 21,028 19,470 22,603 41,424 43,660 42,542Total 115,208 119,671 119,054 132,724 134,078 136,508 160,079 167,335 168,354% Solid Chocolate 54% 52% 52% 52% 57% 71% 63% 64% 67%
Source: Prodcom.
Filled tablets and bonbons, pralines, etc. contain 40% chocolate (based on standard ICCO conversions).
Chocolate biscuits contain 25% chocolate (based on typical UK recipes).
This gives rise to chocolate consumption of 500,000 tonnes in countries that did use CBEs prior to 2000 (Diagram 5.1).

CHAPTER 5: THE USE OF VEGETABLE FATS IN CHOCOLATE PAGE 45
© LMC International Ltd, 2006
Diagram 5.1: Chocolate Use in EU-15 Countries Permitting CBEs Prior to 2000
0
100
200
300
400
500
600
1996 1997 1998 1999 2000 2001 2002 2003 2004 2005
Cho
cola
te C
onsu
mpt
ion
('000
tonn
es)
In calculating CBE use in these countries, there are a number of factors that need to be taken into account:
Danish confectioners, although permitted to use CBEs, stopped using them in 2000 in response to consumers’ concerns following adverse publicity surrounding the adoption of the Directive;
In Sweden, only one of the two chocolate major manufacturers uses CBEs;
In Finland, confectioners were permitted to use 10% of CBEs prior to the adoption of the Directive. However, not all manufacturers were using CBEs and not all products contained CBEs. Since the adoption of the Directive, there has been some change in recipes, and some products which did not previously contain CBEs, do now.
The Directive’s definition for milk chocolate has meant that manufacturers have had to reduce the proportion of CBE used in milk chocolate products. This is because the vegetable fat is not included in the calculation of total fat that must be a minimum of 25% in milk chocolate. Thus for a typical low cost milk chocolate recipe with 28.3% fat, the maximum vegetable fat that can be added is 3.3%. Even at 30% of true total fat (i.e. including the vegetable fat) you cannot have 5% vegetable fat as you have to allow for indiscernibles, which at a minimum includes vanillin, lecithin and other emulsifiers. As shown in the case studies, in the UK, at one extreme, one manufacturer has not changed its usage of CBEs, while at the other, usage has fallen from 5% to 4.5%. For the UK market, once allowance is made for companies not using CBEs in their recipes, CBE consumption has fallen from 4.4% to 4.1%.
CBE consumption for chocolate products in these markets is estimated to be in the order of 20,000 tonnes per annum. Consumption has fallen by 1,500 tonnes since the

CHAPTER 5: THE USE OF VEGETABLE FATS IN CHOCOLATE PAGE 46
© LMC International Ltd, 2006
adoption of the Directive (Diagram 5.2). This is partly due to the fall in chocolate consumption, but also to the impact of the Directive. The adoption of the Directive in these countries is estimated to have reduced demand by around 600 tonnes per annum (Table 5.5).
Visits to supermarkets in these countries confirm that labels have been changed to reflect the Directive. Thus in the UK, for instance, a Cadbury Dairy Milk bar, in addition to the ingredient list, carries the statement: “Milk solids 20% minimum, Cocoa Solids 20% minimum, contains vegetable fats in addition to cocoa butter”.
Diagram 5.2: CBE Demand in EU-15 Countries Permitting the Use of CBEs Prior to 2000
0
5
10
15
20
25
1996 1997 1998 1999 2000 2001 2002 2003 2004 2005
CBE
Dem
and
('000
tonn
es)
Countries Not Permitting the Use of CBEs Prior to 2000
Chocolate product consumption in countries not permitting the use of chocolate prior to 2000 was some 1.4 million tonnes in 2005 (Diagram 5.3). In addition, chocolate biscuit production was some 600,000 tonnes (Tables 5.6 and 5.7).

Table 5.5: Impact of the Directive on CBE Consumption in EU-15 Countries Permitting the Use of CBEs Prior to 2000 (tonnes)
1996 2000 2001 2002 2003 2004 2005 Annual Growth
since 2003 Annual Growth
5 years Annual Growth
10 years
Adoption of Directive 18,482 18,450 18,804 19,519 20,817 20,198 19,508 -2.1% 0.7% 0.5% No Adoption 18,482 18,450 18,804 19,519 20,817 20,867 20,133 -1.1% 1.4% 0.9% Impact of Directive 0 -669 -625
Source: LMC.
Table 5.6: Chocolate Product Consumption in EU-15 Countries Not Permitting CBEs Prior to 2000 (tonnes)
1996 2000 2001 2002 2003 2004 2005 Annual Growth since 2003
Annual Growth 5 years
Annual Growth 10 years
Germany 689,620 677,128 666,786 670,859 661,870 681,941 668,746 0.3% 0.1% -0.3% France 270,405 297,435 287,510 287,990 280,616 280,231 285,064 0.5% -0.2% 0.5% Netherlands 70,395 76,105 74,900 74,200 71,300 73,100 73,300 0.9% -0.4% 0.4% Italy 150,730 162,932 169,959 183,821 191,570 196,915 202,490 1.9% 3.6% 3.0% Belgium 55,225 60,863 49,072 63,612 68,295 71,545 70,912 1.3% 7.6% 2.5% Spain 64,175 61,025 64,250 64,655 65,285 68,235 71,874 3.3% 2.3% 1.1% Greece 24,700 29,045 30,591 32,502 34,781 37,131 39,226 4.1% 5.1% 4.7% Total 1,325,250 1,364,533 1,343,068 1,377,640 1,373,717 1,409,098 1,411,611 0.9% 1.0% 0.6%
Source: Caobisco, LMC.
CH
AP
TER
5: THE
US
E O
F VEG
ETA
BLE
FATS
IN C
HO
CO
LATE
P
AG
E 47
© LM
C International Ltd, 2006

Table 5.7: Chocolate Biscuit Consumption in EU-15 Countries Not Permitting CBEs Prior to 2000 (tonnes)
1996 2000 2001 2002 2003 2004 2005 Annual Growth
since 2003 Annual Growth
5 years Annual Growth
10 years
Germany 249,420 268,962 282,713 296,465 298,920 334,090 340,169 4.4% 3.8% 3.2% France 43,090 57,720 59,020 61,790 63,640 62,835 65,456 0.9% 2.1% 4.3% Netherlands 0 0 0 0 0 0 0 Italy 43,300 47,700 52,400 54,500 54,200 55,600 58,160 2.4% 2.1% 3.0% Belgium 128,750 113,140 73,625 83,475 77,795 76,050 77,571 -0.1% 1.0% -4.9% Spain 6,960 12,590 15,900 14,775 15,430 23,325 22,704 13.7% 7.4% 12.6% Greece 10,200 18,920 19,805 20,935 22,320 22,380 23,703 2.0% 3.7% 8.8% Total 481,720 519,032 503,463 531,940 532,305 574,280 587,763 3.4% 3.1% 2.0%
Note: 2005 data are estimates based on trends.
Source: Caobisco, LMC.
CH
AP
TER
5: THE
US
E O
F VEG
ETA
BLE
FATS
IN C
HO
CO
LATE
P
AG
E 48
© LM
C International Ltd, 2006

CHAPTER 5: THE USE OF VEGETABLE FATS IN CHOCOLATE PAGE 49
© LMC International Ltd, 2006
Diagram 5.3: Chocolate Product Consumption in Countries Not Permitting CBEs Prior to 2000
1,280
1,300
1,320
1,340
1,360
1,380
1,400
1,420
1996 1997 1998 1999 2000 2001 2002 2003 2004 2005
Cho
cola
te P
rodu
ct C
onsu
mpt
ion
('000
tonn
es)
Chocolate production in these countries can be divided into three segments:
Branded products;
Artisanal production; and
Private label
Branded Products
The results of the case studies reveal that no major chocolate manufacturer has changed its recipes to include CBEs as a result of the Directive. Recipes have changed in other ways though. This is because the calculations of fat contents must now take account of both 'discernible' and 'indiscernible' substances in the chocolate. Previously, if whey or soy powder, for instance, were added and ground up so you could not see/discern it, it was part of the chocolate (as happened in Germany for instance). Now, the indiscernibles are excluded and many Continental chocolate recipes have had to be reformulated.
The decision not to use CBEs has primarily been a marketing one and the major chocolate manufacturers have been unwilling to change recipes for fear of adverse publicity that could lead to a loss of market share. For these companies, the value is in the brand.
In some markets, stating that the fat content of the chocolate is 100% cocoa solids has become a marketing tool and an additional stamp has been added to the packaging. In France, for instance, Cote d’Or chocolate products contain a logo stating “pur buerre de cacao” while for Poulain products the logo says “chocolat – pur beurre de cacao”. In Italy, Novi products show a “puro” seal.

CHAPTER 5: THE USE OF VEGETABLE FATS IN CHOCOLATE PAGE 50
© LMC International Ltd, 2006
In Belgium the “Ambao” mark, which was devised to identify special quality chocolate products and chocolate containing no vegetable fats, is no longer promoted, although it remains on a few product labels. The organisation set up by the government to administer it was officially wound up in December 2005. It did not have enough support from industry for the following reasons:
Consumers were unclear about the meaning of Ambao;
It was not only associated with Belgian chocolate (foreign manufacturers could also apply to use it);
Branded manufacturers preferred to promote their own brand (while private label manufacturers saw using the Ambao mark as a way of upgrading their products);
Artisanal producers wanted coverage to be extended to ingredients other than cocoa; and
Manufacturers were reluctant to pay the additional inspection, certification and administration costs involved.
In Belgium and the Netherlands, product testing by consumer associations confirms that CBEs have not been added to chocolate bars. The laboratory sampling of 40 brands in the Netherlands and 26 brands in Belgium confirmed that no vegetable fats were present in any of the chocolate tablets sampled.
In France, tests of 72 products by DGCCRF found that in half of the cases (those of solid tablets) vegetable fats were not present, but in the other half the results were inconclusive due to the presence of vegetable fats in the filled centres. The conclusion from the analysis was that in filled products it was not possible to tell if the vegetable fat in the filling had migrated to the chocolate or whether the fat was already present in the chocolate. The EC is currently developing testing procedures for chocolate products .
In Italy and Germany, it has been felt unnecessary to test products to date as manufacturers have not changed their recipes.
Artisanal Production
The artisan segment of the market was probably the most vocal in its opposition to the introduction of the Directive and as far as we are aware no recipes have been changed in response to the Directive. In Italy, the artisans’ associations together with consumers’ associations have applied to the EC to gain Traditionally Specialty Guaranteed (STG) status. If granted this would mean that producers would preserve their recipes, giving a guarantee to consumers that members’ chocolate only contained cocoa solids.
In addition, the main market growth is for higher quality products and greater differentiation. This means more specialty chocolates, for instance, dark chocolate, single origins, etc. These are higher quality products requiring higher cocoa solid contents. This trend does not support the use of CBEs which many consumers consider results in an inferior product.
Private and Own Label
In most cases, the economies of scale in chocolate production mean that private and own label products are produced by the large industrial chocolate manufacturers. Of

CHAPTER 5: THE USE OF VEGETABLE FATS IN CHOCOLATE PAGE 51
© LMC International Ltd, 2006
the companies interviewed, there has been a marginal increase in CBE demand, with some biscuit and ice cream manufacturers changing their recipes.
Among the retailers’ own label brands, there has been no change of recipes to incorporate CBEs. There are a number of reasons for this:
Cocoa butter/CBE price differential has not been large enough to justify a change in recipe;
Retailers do not want their own label products to contain CBEs. This is partly because retailers have sought to upgrade their own label products and adding CBEs is perceived to be making the product inferior; and
Private label buyers do not want CBEs in their chocolate.
From the point of view of the industrial chocolate manufacturer, there are additional costs associated with producing products with CBEs, including installing additional storage tanks, piping etc. Buyers of industrial chocolate who do not want their products to contain CBEs are also insisting that there is no adulteration of their products. In addition, as CBEs become more specialised and tailored to the needs of individual confectioners, the more complicated it becomes for industrial chocolate producers to use these products, as more down time is required between production runs.
Future evidence can be gleaned from an analysis of retail prices. The use of CBEs would reduce the cost of chocolate production and in a competitive market this would be expected to reduce retail prices. Cocoa solids account for around 10% to 15% of the total retail price and the use of CBEs in a recipe would reduce fat costs by between 5% and 10%. This would result in a 1% fall in retail prices. The evidence is mixed and, as shown in Chapter 2, German retail prices have risen, while French prices have fallen, since the introduction of the Directive.
On the basis of our interviews, we put the increase in demand for CBEs arising from the Directive at 1,000 tonnes per annum. This increase is in the industrial chocolate segment.
EU-15 CBE PRODUCTION
As suggested in Chapter 4, the volume of exotic raw material for CBE manufacture imported into the EU was almost 25,000 tonnes in 2005. To determine CBE production it is necessary to determine the use of soft and hard CBEs. We have assumed that CBEs destined for the UK and Ireland chocolate market, where a soft tasting product is preferred, are soft CBEs containing 10% of exotics, the balance being PMF. The remaining exotics are assumed to be hard CBE containing 50% exotic and 50% PMF.
This gives total EU-15 CBE production of 58,600 tonnes in 2005. Production has grown by 11% per annum since 2000 and a similar proportion since the adoption of the Directive (Table 5.8).

CHAPTER 5: THE USE OF VEGETABLE FATS IN CHOCOLATE PAGE 52
© LMC International Ltd, 2006
Table 5.8: Estimated EU-15 CBE Production (tonnes)
1996 1997 1998 1999 2000 2001 2002 2003 2004 2005
Exotic Use (Trend) 8,594 8,762 8,931 9,099 9,267 10,063 13,191 16,319 19,447 22,576 CBE Production Soft CBE UK and Ireland 15,754 14,718 15,133 15,375 16,149 16,199 16,983 18,434 17,529 16,842Exotic Proportion 10% Exotic Use 1,575 1,472 1,513 1,538 1,615 1,620 1,698 1,843 1,753 1,684PMF Use 14,179 13,246 13,620 13,838 14,534 14,579 15,285 16,591 15,776 15,158 Hard CBEs Exotic Balance 7,019 7,291 7,417 7,561 7,652 8,443 11,492 14,476 17,695 20,892Exotic Proportion 50% PMF Use 7,019 7,291 7,417 7,561 7,652 8,443 11,492 14,476 17,695 20,892Total hard CBE 14,038 14,581 14,835 15,123 15,304 16,885 22,985 28,951 35,389 41,783 TOTAL CBE Production 29,792 29,299 29,968 30,498 31,453 33,084 39,968 47,385 52,918 58,625Average exotic % 29% 30% 30% 30% 29% 30% 33% 34% 37% 39%
Source: LMC
DEMAND FOR CBES OUTSIDE EU-15 CHOCOLATE PRODUCTION
The case study evidence as discussed above points to a stable market for vegetable fats for chocolate in the EU-15, whereas the evidence from the importation of vegetable fats points to growing production of CBEs. The difference between EU-15 CBE production and the amount of CBE used for EU-15 chocolate manufacture has increased from around 11,000 tonnes in 1996 to its current level of around 40,000 tonnes (Diagram 5.4).
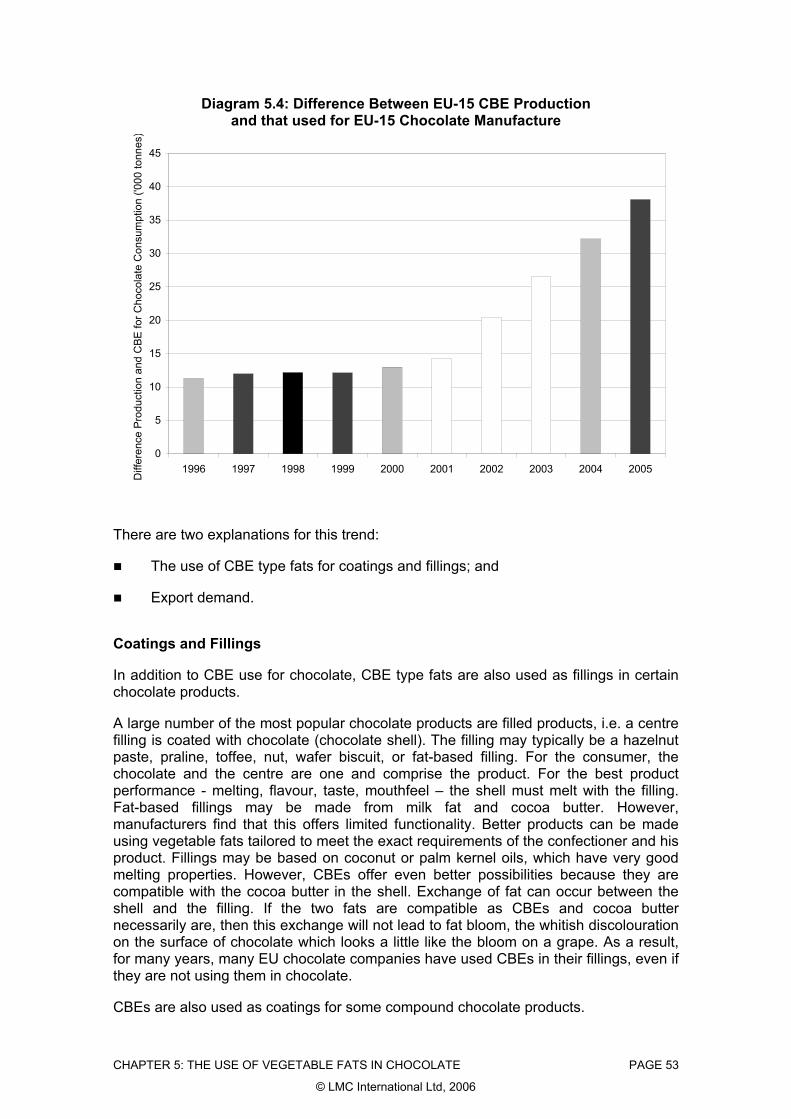
CHAPTER 5: THE USE OF VEGETABLE FATS IN CHOCOLATE PAGE 53
© LMC International Ltd, 2006
Diagram 5.4: Difference Between EU-15 CBE Production and that used for EU-15 Chocolate Manufacture
0
5
10
15
20
25
30
35
40
45
1996 1997 1998 1999 2000 2001 2002 2003 2004 2005
Diff
eren
ce P
rodu
ctio
n an
d C
BE fo
r Cho
cola
te C
onsu
mpt
ion
('000
tonn
es)
There are two explanations for this trend:
The use of CBE type fats for coatings and fillings; and
Export demand.
Coatings and Fillings
In addition to CBE use for chocolate, CBE type fats are also used as fillings in certain chocolate products.
A large number of the most popular chocolate products are filled products, i.e. a centre filling is coated with chocolate (chocolate shell). The filling may typically be a hazelnut paste, praline, toffee, nut, wafer biscuit, or fat-based filling. For the consumer, the chocolate and the centre are one and comprise the product. For the best product performance - melting, flavour, taste, mouthfeel – the shell must melt with the filling. Fat-based fillings may be made from milk fat and cocoa butter. However, manufacturers find that this offers limited functionality. Better products can be made using vegetable fats tailored to meet the exact requirements of the confectioner and his product. Fillings may be based on coconut or palm kernel oils, which have very good melting properties. However, CBEs offer even better possibilities because they are compatible with the cocoa butter in the shell. Exchange of fat can occur between the shell and the filling. If the two fats are compatible as CBEs and cocoa butter necessarily are, then this exchange will not lead to fat bloom, the whitish discolouration on the surface of chocolate which looks a little like the bloom on a grape. As a result, for many years, many EU chocolate companies have used CBEs in their fillings, even if they are not using them in chocolate.
CBEs are also used as coatings for some compound chocolate products.

CHAPTER 5: THE USE OF VEGETABLE FATS IN CHOCOLATE PAGE 54
© LMC International Ltd, 2006
The demand for CBEs for fillings and coatings in the EU-15 is in the order of 20,000 to 25,000 tonnes tonnes per annum. Demand growth has been steady over the reporting period and is growing as the market for these products increases.
Export Demand
The EU-15 has become the hub of global CBE production with most global demand, with the exception of Japan, being met by the EU-15 CBE manufacturers. There is also a small amount of CBE production in the ASEAN region. Export demand is in the order of 15,000 to 20,000 tonnes. Export demand has grown sharply in recent years because of:
Changes in legalisation to allow the use of CBEs in chocolate. In particular, in Brazil and Oceania, legislation has changed to allow the use of CBEs in chocolate. Legislation was changed in 2003. In these markets, chocolate manufacturers have begun to change recipes to incorporate CBEs. This has been partly driven by price but also by the improved functionality that the incorporation of CBEs can give to products. In particular using a hard CBE raises the melting point of the chocolate which can be useful in hotter climates. Evidence from the case studies suggests that the Brazilian market has grown from zero in 2003 to a level of around 8,000 tonnes at the end of 2005.
Reduced demand for Cocoa Butter Replacers (CBRs). CBRs are produced by the hydrogenation of liquid oils such as soybean, cottonseed, rapeseed (canola) or palm olein. They are hydrogenated either alone or as a blend under selective, trans-promoting conditions to give relatively steep solid fat content melting curves. They are high in trans-fats and as health concerns have arisen from the use of trans-fats, many users have sought to replace them in compound chocolate products. One way of replacing them has been to use CBEs. There has been increased use of CBEs for this application in Latin America (including Brazil) and Central and Eastern Europe.
Increased demand of chocolate/compound chocolate containing CBEs. This is particularly the case in Eastern Europe where rising incomes have led to an increase in chocolate demand and products containing CBEs.
CBE demand in the EU-10 accession countries has risen due to a combination of a replacement for CBRs and increased use in some chocolate recipes. However, as is the case with EU-15 chocolate manufacturers, there has been some reluctance among companies to change recipes in countries that did not previously permit the use of CBEs. We estimate EU-10 CBE consumption at around 2,500 to 3,000 tonnes.
PRICES AND MARGINS
CBE prices vary according to application and the components of the CBEs. Historically, traditional CBEs (50% exotic, 50% PMF) were priced in relation to cocoa butter, with a standard price being 80% of the cocoa butter price. However, in recent years, this relationship has broken down and pricing is much more in accordance with the prices of the individual raw materials plus a margin. This has led to a fall in CBE prices and a reduction of processors’ margins. This is due to increasing competition in the industry and the price pressure that is being placed on the industry by end users (Diagram 5.5).

CHAPTER 5: THE USE OF VEGETABLE FATS IN CHOCOLATE PAGE 55
© LMC International Ltd, 2006
Diagram 5.5: Estimated CBE Prices
0
200
400
600
800
1,000
1,200
1,400
1,600
1,800
2,000
2001 2002 2003 2004 2005
CBE
Pric
e (E
uro/
tonn
e)
0%
10%
20%
30%
40%
50%
60%
70%
80%
90%
100%H
ard CB
E %
Cocoa B
utter
Soft CBE Hard CBE Hard CBE % of Cocoa Butter Price
Soft CBE prices, where the majority of the product is PMF, are closely aligned with palm olein prices.
THE IMPORTANCE OF THE CBE INDUSTRY TO THE EU-15
The main CBE manufacturers in Europe are:
AarhusKarlshamns;
Loders Croklaan;
Britannia Food Ingredients;
Fuji Oil Europe;
ADM Noblee; and
Walter Rau.
AarhusKarlshamns is the largest manufacturer, a position that was produced by the merger of Aarhus United and Karlshamns.
The importance of the industry has grown as production and demand have grown. To date, the international growth of the industry has benefited the EU and export sales. However, with a flat market in the EU, any future new investment is likely to be nearer to other end use markets.
Comparing import prices with finished product prices allows us to calculate the value addition of the industry. During 2004 and 2005, the industry annually transformed €53 million worth of raw materials into €85 million of final products. This assumes that all palm oil is already imported in PMF form. In the case where fractionation is occurring in
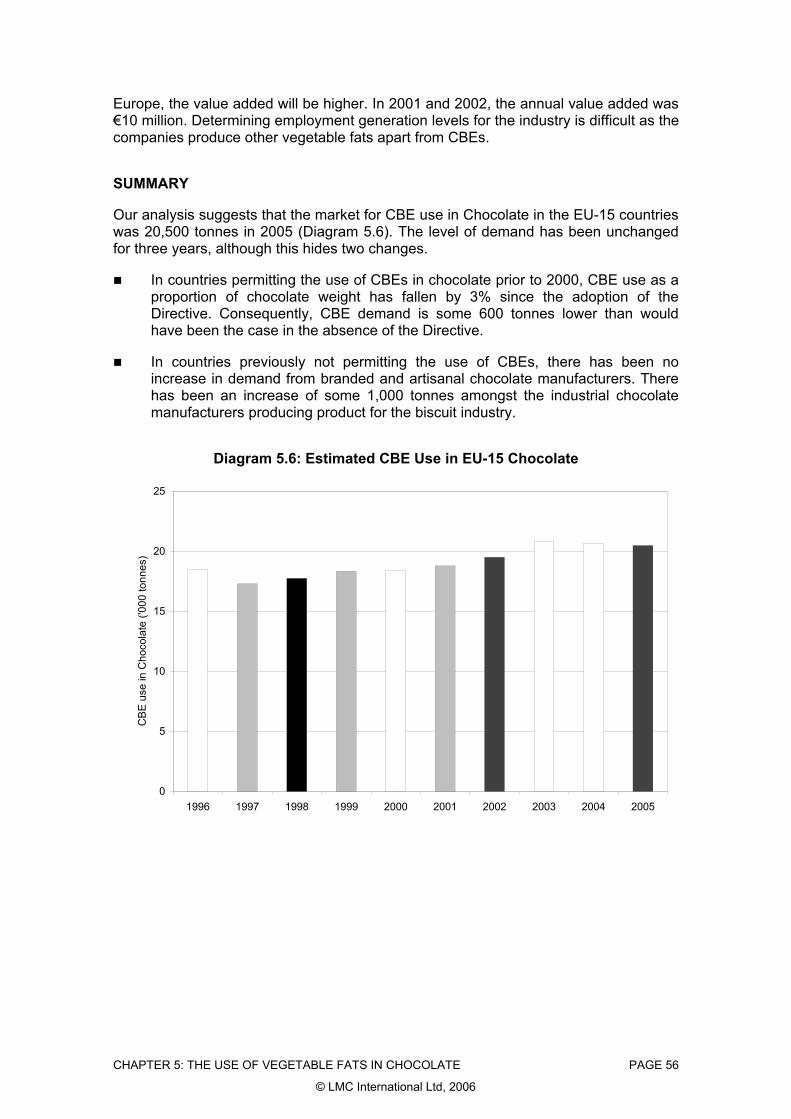
CHAPTER 5: THE USE OF VEGETABLE FATS IN CHOCOLATE PAGE 56
© LMC International Ltd, 2006
Europe, the value added will be higher. In 2001 and 2002, the annual value added was €10 million. Determining employment generation levels for the industry is difficult as the companies produce other vegetable fats apart from CBEs.
SUMMARY
Our analysis suggests that the market for CBE use in Chocolate in the EU-15 countries was 20,500 tonnes in 2005 (Diagram 5.6). The level of demand has been unchanged for three years, although this hides two changes.
In countries permitting the use of CBEs in chocolate prior to 2000, CBE use as a proportion of chocolate weight has fallen by 3% since the adoption of the Directive. Consequently, CBE demand is some 600 tonnes lower than would have been the case in the absence of the Directive.
In countries previously not permitting the use of CBEs, there has been no increase in demand from branded and artisanal chocolate manufacturers. There has been an increase of some 1,000 tonnes amongst the industrial chocolate manufacturers producing product for the biscuit industry.
Diagram 5.6: Estimated CBE Use in EU-15 Chocolate
0
5
10
15
20
25
1996 1997 1998 1999 2000 2001 2002 2003 2004 2005
CBE
use
in C
hoco
late
('00
0 to
nnes
)

CHAPTER 6: IMPACT OF THE DIRECTIVE ON COCOA PRODUCERS PAGE 57
© LMC International Ltd, 2006
Chapter 6: Impact of the Directive on Cocoa Producers
Case studies to determine the impact of the Directive on producers were conducted in Côte d’Ivoire, Togo and Ghana.
ECONOMIC DEVELOPMENTS
Following recession in the late 1990s, the cocoa-producing economies of Côte d’Ivoire, Ghana and Togo recovered over the 2000-2004 period, with Ghana growing at a faster rate than the Sub-Saharan African region as a whole. However, per capita incomes in Ghana and Togo are still significantly lower than the regional average (Table 6.1).
Ghana’s recent economic success is mainly attributed to the combination of good governance and freedom from political conflict. In contrast, the Ivorian economy has been facing a political crisis that has split the country into two parts since 2002, with all sectors except oil, telecommunication and cocoa in stagnation. Political problems have also constrained the smaller Togolese economy.
IMPORTANCE OF THE COCOA SECTOR
Cocoa typically accounts for over one third of total export earnings in Ghana and Côte d’Ivoire, and around 10% in the case of Cameroon. It is less important in Nigeria and Togo (exports of smuggled Ivorian cocoa account for the increase in Togo’s 2004 share). As would be expected, cocoa prices are a major determinant of cocoa’s share of export earnings in Ghana and Côte d’Ivoire (Table 6.2 and Diagram 6.1).

Table 6.1: Côte d’Ivoire, Ghana and Togo — Macroeconomic Data 1996 1997 1998 1999 2000 2001 2002 2003 2004 Average Annual % Growth 1996-2000 2000-2004
GDP (US$ Billions) Côte d'Ivoire 12.14 11.72 12.88 12.57 10.46 10.56 11.52 13.76 15.50 -4% 10% Ghana 6.93 6.88 7.47 7.71 5.00 5.30 6.15 7.62 8.85 -8% 15% Togo 1.65 1.69 1.59 1.58 1.33 1.30 1.45 1.70 2.03 -5% 11% Sub-Saharan Africa 349.53 350.36 327.55 328.83 338.35 334.58 355.42 433.71 526.21 -1% 12% Population (Millions) Côte d'Ivoire 15.17 15.59 16.00 16.38 16.74 17.05 17.34 17.60 17.87 2% 2% Ghana 18.16 18.59 19.01 19.43 19.87 20.31 20.76 21.21 21.66 2% 2% Togo 4.66 4.83 5.01 5.19 5.36 5.53 5.68 5.84 5.99 4% 3% Sub-Saharan Africa 662.90 678.81 694.55 710.55 725.82 2% GDP per Capita Côte d'Ivoire 800 752 805 768 625 620 664 782 867 -6% 9% Ghana 381 370 393 397 252 261 296 359 409 -10% 13% Togo 355 350 317 304 249 235 255 291 339 -9% 8% Sub-Saharan Africa 510 493 512 610 725 9%
Sources: IMF, World Bank.
CH
AP
TER
6: IMP
AC
T OF TH
E D
IRE
CTIV
E O
N C
OC
OA
PR
OD
UC
ER
S
PA
GE
58
© LM
C International Ltd, 2006

CHAPTER 6: IMPACT OF THE DIRECTIVE ON COCOA PRODUCERS PAGE 59
© LMC International Ltd, 2006
Table 6.2: Importance of Cocoa as % of Total Export Earnings
1996 1997 1998 1999 2000 2001 2002 2003 2004
Ghana 45% 31% 28% 26% 29% 28% 34% 41% 40%Côte d'Ivoire 37% 35% 37% 34% 26% 33% 44% 42% 34%Cameroon 10% 10% 11% 12% 6% 8% 12% 11% 10%Togo 7% 6% 3% 2% 1% 1% 2% 2% 7%Nigeria 1% 1% 2% 2% 1% 1% 2% 2% 1%
Source: IMF, FAO.
Diagram 6.1: Ghana and Côte d’Ivoire: Cocoa as % of Total Export Earnings and Cocoa Prices
0%
5%
10%
15%
20%
25%
30%
35%
40%
45%
50%
1996 1997 1998 1999 2000 2001 2002 2003 2004
Coc
oa %
of t
otal
exp
orts
0
200
400
600
800
1,000
1,200
1,400
1,600
1,800
2,000
SDR
s per tonne
Ghana Côte d'Ivoire ICCO Average Price
OVERVIEW OF PRODUCTION AND EXPORT TRENDS
Production Trends
West Africa accounts for around 70% of global cocoa production, and output in the region has grown by 2% per year on average between 1995/96 and 2004/05, compared to global production growth of around 1% per year. Good weather contributed to regional output reaching 2.526 million tonnes in 2003/04, before falling back to 2.298 million tonnes in 2004/05 (Table 6.3).
Individual producing country production data is estimated to take account of the smuggling of crop occurring within the West African region. While Côte d’Ivoire remains the dominant world producer, accounting for around 40% of global output, production in Ghana is estimated to have grown more rapidly than in Côte d’Ivoire; consequently, Ghana’s share of global production reached 17% in 2003/04, compared to 12% in the mid-1990s. Nigeria and Cameroon have maintained their shares at around 6% and 4%

CHAPTER 6: IMPACT OF THE DIRECTIVE ON COCOA PRODUCERS PAGE 60
© LMC International Ltd, 2006
of global output, respectively, over the review period, while the Togolese share is less than 1% (Diagram 6.2 and Table 6.3).
Diagram 6.2: West Africa — Cocoa Production
0.0
0.5
1.0
1.5
2.0
2.5
1995/96 1996/97 1997/98 1998/99 1999/00 2000/01 2001/02 2002/03 2003/04 2004/05
Pro
duct
ion
(mill
ion
tonn
es)
64%
66%
68%
70%
72%
74%
% of w
orld production
Côte d'Ivoire Ghana Nigeria Cameroon West Africa % of world production
Diagram 6.3: West Africa — Global Cocoa Production Shares
0%
10%
20%
30%
40%
50%
60%
70%
80%
1995/96 1996/97 1997/98 1998/99 1999/00 2000/01 2001/02 2002/03 2003/04 2004/05
% o
f glo
bal p
rodu
ctio
n
Côte d'Ivoire Ghana Nigeria Cameroon

Table 6.3: Cocoa Production, 1995/96-2004/05 (‘000 tonnes)
Annual % Change 1995/96 1996/97 1997/98 1998/99 1999/00 2000/01 2001/02 2002/03 2003/04 2004/05 1995/96-2004/05
World 2,940 2,757 2,744 2,905 3,045 2,851 2,835 3,152 3,526 3,307 1% of which: West Africa 1,943 1,792 1,914 2,009 2,168 1,950 1,939 2,232 2,526 2,298 2% of which: Côte d'Ivoire 1,186 1,108 1,113 1,125 1,396 1,175 1,225 1,300 1,340 1,273 1% Ghana 421 342 429 405 447 415 371 498 605 560 3% Nigeria 163 157 166 192 157 174 188 178 175 190 2% Cameroon 118 117 113 122 117 135 131 152 160 178 5% Togo 5 9 6 7 7 6 6 6 5 4 -4%
Sources: BNETD, Togo Customs, LMC.
CH
AP
TER
6: IMP
AC
T OF TH
E D
IRE
CTIV
E O
N C
OC
OA
PR
OD
UC
ER
S
PA
GE
61
© LM
C International Ltd, 2006

CHAPTER 6: IMPACT OF THE DIRECTIVE ON COCOA PRODUCERS PAGE 62
© LMC International Ltd, 2006
Ivorian cocoa production grew strongly (at an annual average rate of 7%) between 1960 and 1990 due to the expansion of the planted area into the western forest zones, supported by an influx of labour from neighbouring countries such as Burkina Faso, Guinea and Mali. More recently, however, a number of factors have combined to contain further increases in Ivorian output, including: Lack of land for further expansion;
Declining soil fertility in the western forest zones;
Progressive ageing of plantings in the eastern zones;
Shortage of labour due to the political crisis; and
Low usage of inputs such as fungicide and fertiliser.
The contrasting rise in Ghanaian production is attributed to a number of factors, including:
Provision of subsidised inputs such as fungicide and fertiliser;
Government involvement in supporting and regulating producer prices; and
Strong currency devaluation.
Togolese production is declining due to ageing trees, disease problems and lack of maintenance.
Export Trends
Total exports of cocoa beans and cocoa products by the four large West African producers (Côte d’Ivoire, Ghana, Nigeria and Cameroon) plus Togo, increased from 2.034 million tonnes in 2002/03 to 2.261 million tonnes in 2004/05, reflecting an annual average growth rate of 5%. Ivorian exports, which rose steadily between 2001/02 and 2003/04, declined in 2004/05, mainly due to the impact of the political crisis (which resulted in the closure of feeder roads and ports). However, Ivorian crop was instead smuggled into Ghana and Togo, contributing to an increase in exports from those countries (Table 6.4 and Diagram 6.4).
Table 6.4: Exports of Cocoa Beans and Cocoa Products, 2001/02-2004/05 (tonnes b.e.)
Annual % Change 2001/02 2002/03 2003/04 2004/05 2002/03-2004/05
Côte d'Ivoire 1,296,056 1,358,642 1,409,883 1,264,256 -4% Ghana 290,509 348,651 637,141 598,184 31% Nigeria 186,333 170,341 169,000 200,141 8% Cameroon 128,452 148,894 156,858 184,842 11% Togo 5,700 7,900 21,600 13,300 30% Total of above 1,907,050 2,034,428 2,394,482 2,260,723 5%
Sources: BCC, Togo Customs, Cocobod.

CHAPTER 6: IMPACT OF THE DIRECTIVE ON COCOA PRODUCERS PAGE 63
© LMC International Ltd, 2006
Diagram 6.4: Exports of Cocoa Beans and Cocoa Products
0.0
0.5
1.0
1.5
2.0
2.5
2001/02 2002/03 2003/04 2004/05
Exp
orts
(mill
ion
tonn
es b
.e.)
Côte d'Ivoire Ghana Nigeria Cameroon Togo
According to the producing country data between 2001/02 and 2004/05, the EU-15 share of exports of cocoa beans and cocoa products declined from 93% to 61% in Côte d’Ivoire, and from 90% to 72% in Togo; on the other hand, the EU-15 share of Ghanaian exports increased from 74% to 78%. While the EU-15 is still by far the largest export destination for all three producers, the increase in Ivorian exports to other (notably American) destinations in particular has caused the EU-15 share of exports from the three producers to decline from 90% in 2001/02 to 67% in 2004/05 (Table 6.5 and Diagrams 6.5 and 6.6). These data somewhat contradict EU Eurostat import data and it is possible that there has been some misclassification of exports by destination, while the overall total remains correct.
Table 6.5: Exports of Cocoa Beans and Cocoa Products by Destination, 2001/02-2004/05 (tonnes b.e.)
Annual % Change 2001/02 2002/03 2003/04 2004/05 2002/03-2004/05
Côte d'Ivoire EU-15 1,208,433 1,108,621 1,024,134 771,196 -17% Others 87,623 250,021 385,749 493,060 40%
Ghana EU-15 214,517 231,088 490,130 467,440 42% Others 75,992 117,563 147,011 130,744 5%
Togo EU-15 5,130 6,715 19,440 9,576 19% Others 570 1,185 2,160 3,724 77%
Sources: BCC, Togo Customs, Cocobod.

CHAPTER 6: IMPACT OF THE DIRECTIVE ON COCOA PRODUCERS PAGE 64
© LMC International Ltd, 2006
Diagram 6.5: Exports of Cocoa Beans and Cocoa Products by Destination
0
200
400
600
800
1,000
1,200
1,400
EU-15 Others EU-15 Others EU-15 Others
Côte d'Ivoire Ghana Togo
Expo
rts ('
000
tonn
es b
.e.)
2001/02 2002/03 2003/04 2004/05
Diagram 6.6: EU-15 Shares of Cocoa Exports
0%
10%
20%
30%
40%
50%
60%
70%
80%
90%
100%
EU-15 Others EU-15 Others EU-15 Others EU-15 Others
Côte d'Ivoire Ghana Togo Total
% o
f exp
orts
2001/02 2002/03 2003/04 2004/05
The decline in Ivorian cocoa exports to the EU-15 countries is also reflected in the official import data, while the increase in exports to America is partly attributed to US cocoa processors sourcing Ivorian rather than Indonesian beans (which are increasingly in demand by processors in the Asian region) as well as increased bean imports by Brazilian processors.
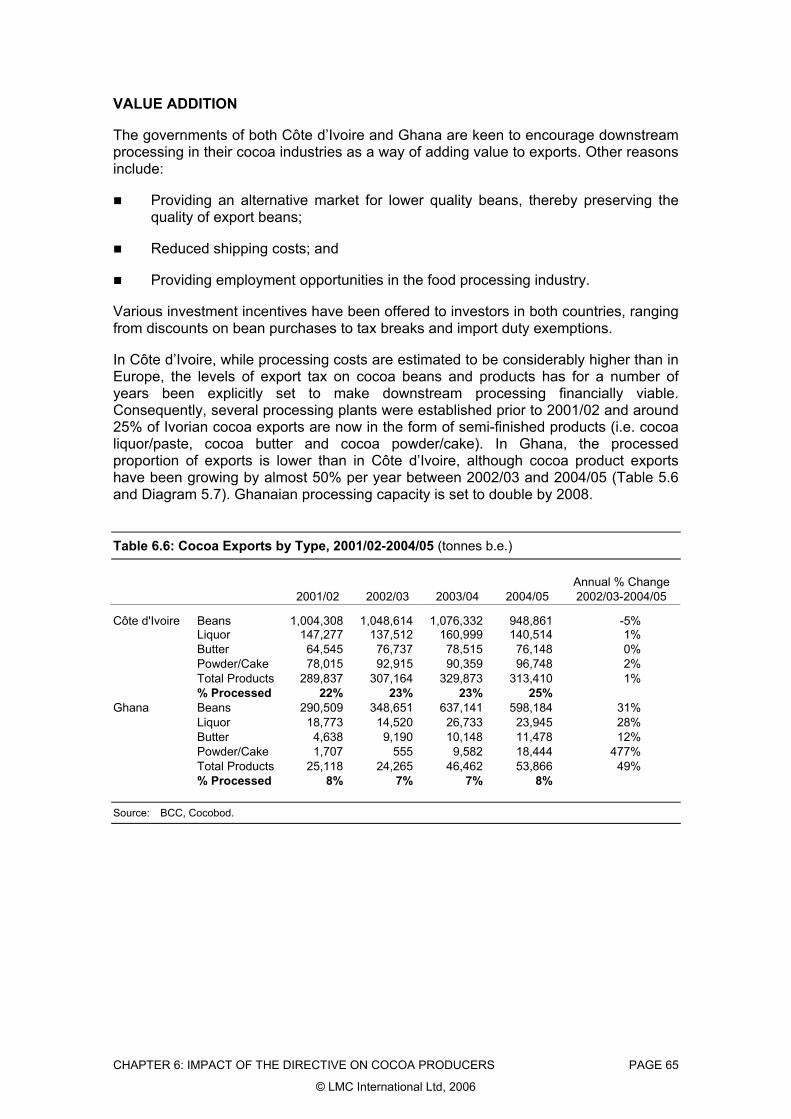
CHAPTER 6: IMPACT OF THE DIRECTIVE ON COCOA PRODUCERS PAGE 65
© LMC International Ltd, 2006
VALUE ADDITION
The governments of both Côte d’Ivoire and Ghana are keen to encourage downstream processing in their cocoa industries as a way of adding value to exports. Other reasons include:
Providing an alternative market for lower quality beans, thereby preserving the quality of export beans;
Reduced shipping costs; and
Providing employment opportunities in the food processing industry.
Various investment incentives have been offered to investors in both countries, ranging from discounts on bean purchases to tax breaks and import duty exemptions.
In Côte d’Ivoire, while processing costs are estimated to be considerably higher than in Europe, the levels of export tax on cocoa beans and products has for a number of years been explicitly set to make downstream processing financially viable. Consequently, several processing plants were established prior to 2001/02 and around 25% of Ivorian cocoa exports are now in the form of semi-finished products (i.e. cocoa liquor/paste, cocoa butter and cocoa powder/cake). In Ghana, the processed proportion of exports is lower than in Côte d’Ivoire, although cocoa product exports have been growing by almost 50% per year between 2002/03 and 2004/05 (Table 5.6 and Diagram 5.7). Ghanaian processing capacity is set to double by 2008.
Table 6.6: Cocoa Exports by Type, 2001/02-2004/05 (tonnes b.e.)
Annual % Change 2001/02 2002/03 2003/04 2004/05 2002/03-2004/05
Côte d'Ivoire Beans 1,004,308 1,048,614 1,076,332 948,861 -5% Liquor 147,277 137,512 160,999 140,514 1% Butter 64,545 76,737 78,515 76,148 0% Powder/Cake 78,015 92,915 90,359 96,748 2% Total Products 289,837 307,164 329,873 313,410 1% % Processed 22% 23% 23% 25%
Ghana Beans 290,509 348,651 637,141 598,184 31% Liquor 18,773 14,520 26,733 23,945 28% Butter 4,638 9,190 10,148 11,478 12% Powder/Cake 1,707 555 9,582 18,444 477% Total Products 25,118 24,265 46,462 53,866 49% % Processed 8% 7% 7% 8%
Source: BCC, Cocobod.

CHAPTER 6: IMPACT OF THE DIRECTIVE ON COCOA PRODUCERS PAGE 66
© LMC International Ltd, 2006
Diagram 6.7: Cocoa Exports by Type
0
200
400
600
800
1,000
1,200
Cocoa Beans Cocoa Products Cocoa Beans Cocoa Products
Côte d'Ivoire Ghana
Expo
rts ('
000
tonn
es b
.e.)
2001/02 2002/03 2003/04 2004/05
There is no incentive to promote the downstream processing of cocoa in Togo.
PRICE DEVELOPMENTS
Between 1995/96 and 2004/05, cocoa bean export prices averaged $1,280 per tonne in Togo, $1,313 per tonne in Côte d’Ivoire and US$1,425 per tonne in Ghana; Ghanaian beans normally receive a premium over other origins on the international markets, partly due to their higher quality. The fluctuations in annual prices (including the steady decline between 2002/03 and 2004/05) are largely explained by changes in the global supply-demand balance (Table 6.7 and Diagram 6.8).
Table 6.7: Cocoa Bean Export Prices, 1995/96-2004/05 (US$ per tonne f.o.b.)
1995/96 1996/97 1997/98 1998/99 1999/00 2000/01 2001/02 2002/03 2003/04 2004/05 Average
Côte d'Ivoire 1,314 1,213 1,374 1,383 694 859 1,307 2,112 1,480 1,393 1,313 Ghana 1,365 1,460 1,662 1,490 1,126 978 1,160 1,902 1,624 1,487 1,425 Togo 696 851 1,419 1,839 1,434 1,444 1,280
Sources: BNETD, Togo Customs, Cocobod.

CHAPTER 6: IMPACT OF THE DIRECTIVE ON COCOA PRODUCERS PAGE 67
© LMC International Ltd, 2006
Diagram 6.8: Cocoa Bean Export Prices and Global Supply-Demand Balance
0
500
1,000
1,500
2,000
2,500
3,000
1995/96 1996/97 1997/98 1998/99 1999/00 2000/01 2001/02 2002/03 2003/04 2004/05
Exp
ort p
rice
(US
$ pe
r ton
ne)
-300
-200
-100
0
100
200
300S
-D balance ('000 tonnes)
Global S-D Balance Côte d'Ivoire Ghana Togo
The share of the export price received by producers largely depends on government policy towards the cocoa sector in the respective countries:
In Côte d’Ivoire, the domestic market was liberalised in 1999, although a number of state authorities still regulate and service the sector, while the government imposes a significant tax on bean exports (amounting to almost 30% of the export price).
In Ghana, the Cocobod licenses private buyers to carry out internal marketing, while its own subsidiary is responsible for export sales. Producer prices are fixed annually by a government-appointed committee in order to stabilise prices and support producer incomes during periods of low international prices. The export tax is 15%.
In Togo, the domestic market was liberalised in 1996, and is only lightly regulated by a single agency. There is no export tax.
Lighter regulation and the lack of an export tax means that the producer share of the cocoa bean export price is much higher in Togo (at around 80%) than in Côte d’Ivoire and Ghana, although the Ghanaian share has improved markedly (from 53% to approaching 70%) over the last three seasons; meanwhile, in Côte d’Ivoire, the producer share has fallen from 57% to 41% over the same period (Diagram 6.9). The disparity between producer prices explains in large part the smuggling of crop from Côte d’Ivoire into Ghana and Togo.

CHAPTER 6: IMPACT OF THE DIRECTIVE ON COCOA PRODUCERS PAGE 68
© LMC International Ltd, 2006
Diagram 6.9: Producer Shares of Cocoa Bean Export Prices
30%
40%
50%
60%
70%
80%
90%
1995/96 1996/97 1997/98 1998/99 1999/00 2000/01 2001/02 2002/03 2003/04 2004/05
% o
f exp
ort p
rice
Côte d'Ivoire Ghana Togo
In Côte d’Ivoire, the movement in export prices of cocoa products between 2001/02 and 2004/05 largely reflected the movement in bean export prices over the same period, with prices peaking in 2002/03. In Ghana, while this was also true for liquor prices, butter prices rose strongly over the period (more in line with butter prices on the international markets) (Table 6.8 and Diagram 6.10).
Table 6.8: Cocoa Product Export Prices, 2001/02-2004/05 (US$ per tonne f.o.b.)
2001/02 2002/03 2003/04 2004/05
Côte d'Ivoire Liquor 1,622 2,063 1,602 1,554 Butter 1,629 2,099 1,604 1,554 Powder 1,271 2,061 1,594 1,546 Cake 1,605 2,083 1,621 1,563
Ghana Liquor 1,699 2,402 1,977 1,906 Butter 2,293 3,169 3,282 4,127 Powder 1,124 Cake 445
Sources: BCC, Cocobod.

CHAPTER 6: IMPACT OF THE DIRECTIVE ON COCOA PRODUCERS PAGE 69
© LMC International Ltd, 2006
Diagram 6.10: Cocoa Product Export Prices
0
500
1,000
1,500
2,000
2,500
3,000
3,500
4,000
4,500
Liquor Butter Powder Cake Liquor Butter
Côte d'Ivoire Ghana
Expo
rt pr
ice
(US$
per
tonn
e)
2001/02 2002/03 2003/04 2004/05
IMPACT OF THE DIRECTIVE
The impression gained from interviews with stakeholders in the cocoa producing countries is the Directive per se has so far had little impact on cocoa producers i.e. the demand for cocoa has not been affected to date.
Smuggling, particularly from Côte d’Ivoire into Ghana and Togo, complicates an analysis of the export data. Ivorian cocoa exports to the EU-15 appear to have fallen between 2002/03 and 2004/05, although this is partly due to higher demand from US processors; meanwhile, exports to the EU-15 from Ghana and Togo have increased. The changes in cocoa prices that have occurred over the same period are largely explained by changes in the global supply-demand balance situation.
Estimating The Impact Using LMC’s Forecasting Model
In the following section, LMC’s forecasting model is used to compare the impact of changes in demand on supply-demand balances and prices. The repercussions of a price change on profitability for large and small cocoa producers are then considered.
CBE Usage
The impact of the Directive is calculated under three scenarios.
The base case scenario calculates the impact of the Directive on the market to date. It follows the assumptions set out in Chapter 5: that is, from 2003/04:
In UK and Ireland CBE use has fallen from 4.4% to 4.1%; while

CHAPTER 6: IMPACT OF THE DIRECTIVE ON COCOA PRODUCERS PAGE 70
© LMC International Ltd, 2006
In Germany, France, Belgium/Luxembourg, Italy, the Netherlands, Spain and Greece (the so-called EU-8) CBE consumption has increased by 1,000 tonnes.
Scenario 1 calculates what would have been the state of the market had the Directive not been implemented in 2003/04, i.e., the following levels of CBE usage in chocolate apply:
In UK and Ireland, CBE use remains at 4.4%;
In the EU-8, usage is zero.
Scenario 2 calculates what would have been the impact of the Directive if it had been fully implemented in 2003/04, i.e., CBE usage in chocolate rose to 5% in the EU-8. This would have increased demand for CBEs by 52,600 tonnes (70,000 tonnes of cocoa in bean equivalent terms).
Results
Global Prices
The forecast levels of prices under the different scenarios between 2003/04 and 2010/11 are shown in Table 6.9 and Diagram 6.11.
Table 6.9: Forecast Global Cocoa Prices, 2003/04-2010/11 (Real US$ per tonne)
2003/04 2004/05 2005/06 2006/07 2007/08 2008/09 2009/10 2010/11
Base Case 1,431 1,419 1,439 1,554 1,649 1,604 1,559 1,531 Scenario 1 1,435 1,421 1,441 1,555 1,650 1,605 1,560 1,532 Scenario 2 1,311 1,344 1,384 1,521 1,625 1,561 1,514 1,490
Source: LMC.
Comparing the prices forecast under the base case scenario with those forecast under Scenario 1 suggests that the impact of not implementing the Directive in 2003/04 would have been modest i.e. a price difference of less than $5 per tonne.
Were the Directive to have been implemented fully in 2003/04, the results suggest that the price impact would have been more pronounced: comparing the prices forecast under the base case scenario with those forecast under Scenario 2 suggests that in 2003/04, the average price would have been $120 per tonne lower if the Directive had been fully implemented. However, the price difference between the scenarios narrows to less than $40 per tonne on average between 2006/07 and 2010/11.

CHAPTER 6: IMPACT OF THE DIRECTIVE ON COCOA PRODUCERS PAGE 71
© LMC International Ltd, 2006
Diagram 6.11: Forecast Global Cocoa Prices, 2003/04-2010/11
1,200
1,300
1,400
1,500
1,600
1,700
2003/04 2004/05 2005/06 2006/07 2007/08 2008/09 2009/10 2010/11
Aver
age
Pric
e (U
S$ p
er to
nne)
Base Case Scenario 1 Scenario 2
Production and Export Earnings
The price forecasts are partly derived from global production estimates, which can be disaggregated to evaluate the impact of the Directive on production and export earnings in individual producing countries. The period of analysis begins in 2004/05 (the first year in which producers respond to a change in price that occurred in 2003/04). Export earnings are calculated as Forecast Production x Forecast Global Price and hence do not take account of any export differentials earned as a result of variations in bean quality, nor of any additional earnings received from exports of cocoa products as opposed to beans.
Larger Producers
In the case of Côte d’Ivoire and Ghana, the two largest cocoa producers, the impact of the different scenarios on production between 2004/05 and 2010/11 are shown in Table 6.10 and Diagram 6.12.
Table 6.10: Larger Producers — Cocoa Production Forecasts, 2004/05-2010/11 (‘000 tonnes)
2004/05 2007/08 2010/11
Cote d'Ivoire Base Case 1,420.2 1,215.9 1,264.6 Scenario 1 1,420.9 1,216.9 1,265.3 Scenario 2 1,396.0 1,184.8 1,240.5
Ghana Base Case 582.8 641.2 665.2 Scenario 1 583.1 641.6 665.4 Scenario 2 572.3 627.3 656.0
Source: LMC.

CHAPTER 6: IMPACT OF THE DIRECTIVE ON COCOA PRODUCERS PAGE 72
© LMC International Ltd, 2006
Diagram 6.12: Larger Producers — Cocoa Production Forecasts, 2004/05-2010/11
0
200
400
600
800
1,000
1,200
1,400
1,600
Base Case Scenario 1 Scenario 2 Base Case Scenario 1 Scenario 2
Cote d'Ivoire Ghana
Prod
uctio
n ('0
00 to
nnes
)
2004/05 2007/08 2010/11
Comparing the levels of production forecast under the base case scenario with those forecast under Scenario 1 suggests that the impact of not implementing the Directive in 2003/04 would have been minimal. In Côte d’Ivoire, estimated annual production increases by less than 1,000 tonnes (0.1%) during the forecast period, while production in Ghana increases by less than 500 tonnes.
The impact of full implementation of the Directive in 2003/04 (Scenario 2) on production would have been larger. In Côte d’Ivoire, estimated annual production decreases by around 25,000 tonnes (or 2% of the total on average) while production in Ghana decreases by around 11,000 tonnes (a similar proportion to Côte d’Ivoire).
The impact of the different scenarios on export earnings between 2004/05 and 2010/11 are shown in Table 6.11 and Diagram 6.13.
Table 6.11: Larger Producers — Cocoa Export Earnings Forecasts, 2004/05-2010/11 (US$ mn)
2004/05 2007/08 2010/11
Cote d'Ivoire Base Case 2,014.5 2,005.5 1,935.8 Scenario 1 2,018.9 2,007.9 1,938.4 Scenario 2 1,875.7 1,925.1 1,848.5
Ghana Base Case 826.7 1,057.5 1,018.2 Scenario 1 828.5 1,058.6 1,019.4 Scenario 2 768.9 1,019.3 977.5
Source: LMC.
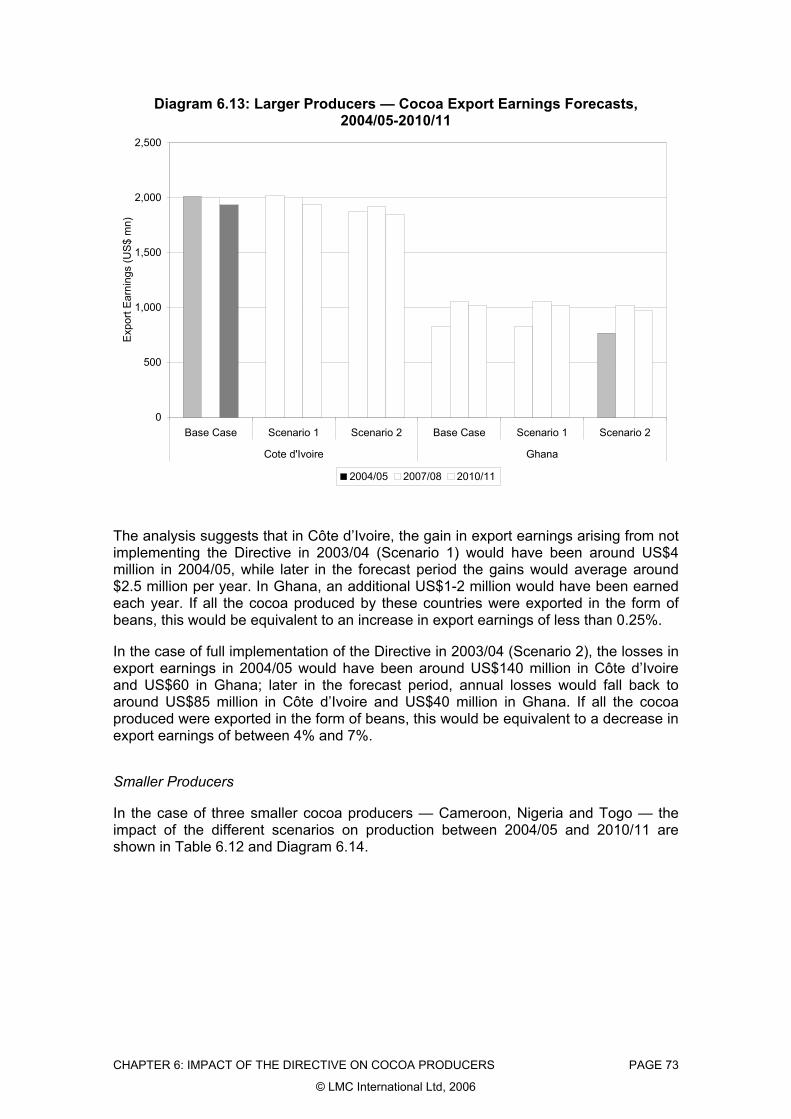
CHAPTER 6: IMPACT OF THE DIRECTIVE ON COCOA PRODUCERS PAGE 73
© LMC International Ltd, 2006
Diagram 6.13: Larger Producers — Cocoa Export Earnings Forecasts, 2004/05-2010/11
0
500
1,000
1,500
2,000
2,500
Base Case Scenario 1 Scenario 2 Base Case Scenario 1 Scenario 2
Cote d'Ivoire Ghana
Expo
rt Ea
rnin
gs (U
S$ m
n)
2004/05 2007/08 2010/11
The analysis suggests that in Côte d’Ivoire, the gain in export earnings arising from not implementing the Directive in 2003/04 (Scenario 1) would have been around US$4 million in 2004/05, while later in the forecast period the gains would average around $2.5 million per year. In Ghana, an additional US$1-2 million would have been earned each year. If all the cocoa produced by these countries were exported in the form of beans, this would be equivalent to an increase in export earnings of less than 0.25%.
In the case of full implementation of the Directive in 2003/04 (Scenario 2), the losses in export earnings in 2004/05 would have been around US$140 million in Côte d’Ivoire and US$60 in Ghana; later in the forecast period, annual losses would fall back to around US$85 million in Côte d’Ivoire and US$40 million in Ghana. If all the cocoa produced were exported in the form of beans, this would be equivalent to a decrease in export earnings of between 4% and 7%.
Smaller Producers
In the case of three smaller cocoa producers — Cameroon, Nigeria and Togo — the impact of the different scenarios on production between 2004/05 and 2010/11 are shown in Table 6.12 and Diagram 6.14.

CHAPTER 6: IMPACT OF THE DIRECTIVE ON COCOA PRODUCERS PAGE 74
© LMC International Ltd, 2006
Table 6.12: Smaller Producers — Cocoa Production Forecasts, 2004/05-2010/11 (‘000 tonnes)
2004/05 2007/08 2010/11
Cameroon Base Case 180.4 179.1 195.3 Scenario 1 180.6 179.3 195.5 Scenario 2 176.7 173.6 190.1
Nigeria Base Case 195.6 185.3 195.6 Scenario 1 195.7 185.4 195.7 Scenario 2 191.7 180.1 191.3
Togo Base Case 6.8 6.3 6.5 Scenario 1 6.8 6.3 6.5 Scenario 2 6.7 6.2 6.3
Source: LMC.
Diagram 6.14: Smaller Producers — Cocoa Production Forecasts, 2004/05-2010/11
0
20
40
60
80
100
120
140
160
180
200
Base Case Scenario 1 Scenario 2 Base Case Scenario 1 Scenario 2 Base Case Scenario 1 Scenario 2
Cameroon Nigeria Togo
Prod
uctio
n ('0
00 to
nnes
)
2004/05 2007/08 2010/11
As in the case of the larger producers, a comparison between the levels of production forecast under the base case scenario with those forecast under Scenario 1 suggests that the impact of not implementing the Directive in 2003/04 would also have been minimal in the smaller producers. In Cameroon and Nigeria (where total production is of a similar magnitude) estimated annual production increases by around 150 tonnes during the forecast period, while annual production in Togo increases by less than 10 tonnes (less than 0.1% of total production in each country).
The impact of full implementation of the Directive in 2003/04 (Scenario 2) on production would have been much larger. In Cameroon and Nigeria, estimated annual production decreases by between 3,500 and 5,500 tonnes, while in Togo production decreases by around 200 tonnes, equivalent to around 2.5% of total production in each country.

CHAPTER 6: IMPACT OF THE DIRECTIVE ON COCOA PRODUCERS PAGE 75
© LMC International Ltd, 2006
The impact of the different scenarios on export earnings between 2004/05 and 2010/11 are shown in Table 6.13 and Diagram 6.15.
Table 6.13: Smaller Producers — Cocoa Export Earnings Forecasts, 2004/05-2010/11 (US$ mn)
2004/05 2007/08 2010/11
Cameroon Base Case 256.0 295.4 298.9 Scenario 1 256.5 295.8 299.4 Scenario 2 237.5 282.1 283.3
Nigeria Base Case 277.5 305.6 299.4 Scenario 1 278.1 306.0 299.8 Scenario 2 257.5 292.6 285.0
Togo Base Case 9.6 10.4 9.9 Scenario 1 9.7 10.5 9.9 Scenario 2 8.9 10.0 9.4
Source: LMC.
Diagram 6.15: Smaller Producers — Cocoa Export Earnings Forecasts, 2004/05-2010/11
0
50
100
150
200
250
300
350
BaseCase
Scenario1
Scenario2
BaseCase
Scenario1
Scenario2
BaseCase
Scenario1
Scenario2
Cameroon Nigeria Togo
Expo
rt Ea
rnin
gs (U
S$ m
n)
2004/05 2007/08 2010/11
The analysis suggests that in Cameroon and Nigeria, the gain in export earnings arising from not implementing the Directive in 2003/04 (Scenario 1) would have been around US$0.6 million each in 2004/05, while later in the forecast period the gains would average around $0.4 million per year. In Togo, an additional US$10-20,000 would have been earned each year. If all the cocoa produced by these countries were exported in the form of beans, this would be equivalent to an increase in export earnings of around 0.2%.

CHAPTER 6: IMPACT OF THE DIRECTIVE ON COCOA PRODUCERS PAGE 76
© LMC International Ltd, 2006
In the case of full implementation of the Directive in 2003/04 (Scenario 2), the losses in export earnings in 2004/05 would have been around US$20 million in Cameroon and Nigeria; later in the forecast period, annual losses would fall back to US$10-15 million. In Togo, annual losses would be between US$0.5 million and US$0.7 million. If all the cocoa produced were exported in the form of beans, this would be equivalent to a decrease in export earnings of between 4% and 7%.
Macro Economic Impact
To gain an impression of the macro economic impact of the scenarios examined by the model, it is possible to compare the estimates of gains and losses in foreign exchange earnings with the GDP forecasts published by the IMF (Diagram 6.16).
Diagram 6.16: Cocoa Exports as % of GDP
0%
2%
4%
6%
8%
10%
12%
14%
Base Case Scenario 1 Scenario 2 Base Case Scenario 1 Scenario 2
2005 2006
Coc
oa E
xpor
ts a
s %
of G
DP
Cameroon Côte d'Ivoire Ghana Nigeria Togo
The analysis suggests that the macro economic impact of not implementing the Directive in 2003/04 (Scenario 1) in terms of the contribution of cocoa exports to the producing countries’ GDP in 2005 and 2006 would have been minimal. Even in Côte d’Ivoire (where cocoa exports historically contribute at least 10% of total GDP) the impact would have been an increase of only around 0.03% of GDP in 2005.
The macro economic impact of full implementation of the Directive in 2003/04 (Scenario 2) would have resulted in a decline in the contribution of cocoa exports to the GDP of the two larger producers (Côte d’Ivoire and Ghana) of between 0.5% and 0.9%. In Cameroon, the impact would have been a 0.1% decrease, while the impact in Nigeria and Togo would have been minimal.
Apart from their contribution to GDP, the cocoa sectors are a major source of state tax revenue in the larger producers, particularly Côte d’Ivoire where the main export tax (the DUS — Droit Unique de Sortie) accounts for approaching 30% of the cocoa price. The analysis suggests that Côte d’Ivoire would have gained US$0.3-0.4 million in
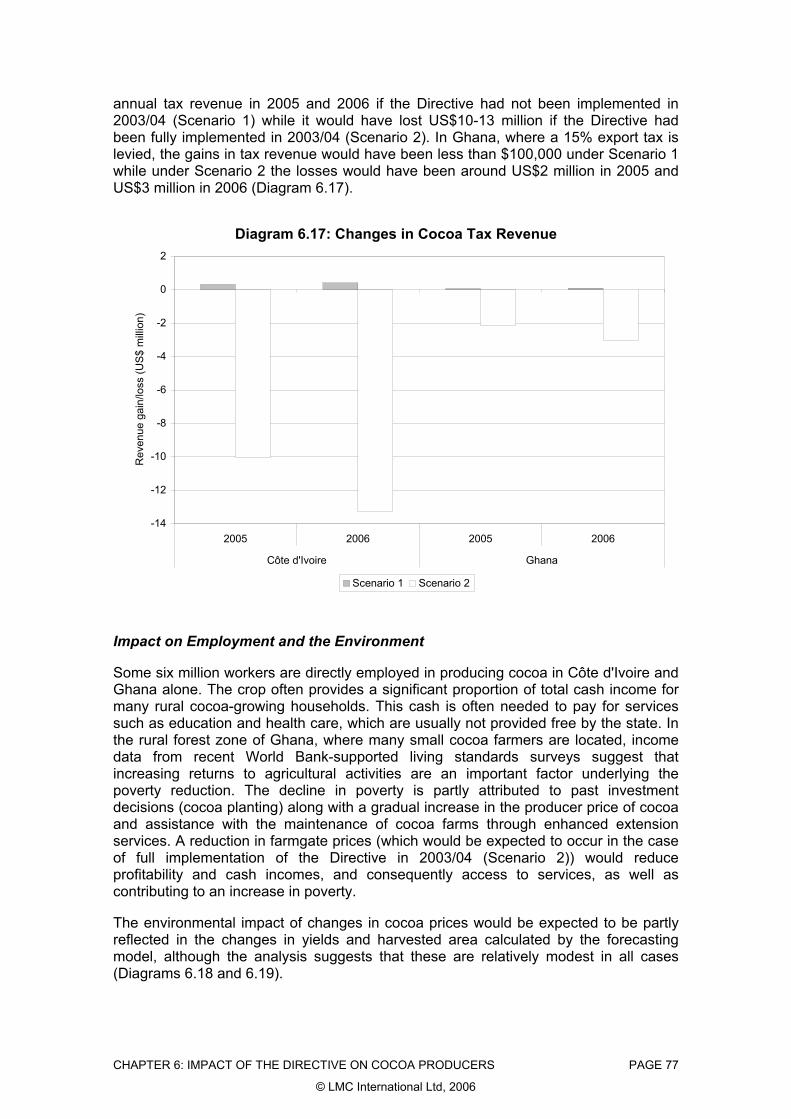
CHAPTER 6: IMPACT OF THE DIRECTIVE ON COCOA PRODUCERS PAGE 77
© LMC International Ltd, 2006
annual tax revenue in 2005 and 2006 if the Directive had not been implemented in 2003/04 (Scenario 1) while it would have lost US$10-13 million if the Directive had been fully implemented in 2003/04 (Scenario 2). In Ghana, where a 15% export tax is levied, the gains in tax revenue would have been less than $100,000 under Scenario 1 while under Scenario 2 the losses would have been around US$2 million in 2005 and US$3 million in 2006 (Diagram 6.17).
Diagram 6.17: Changes in Cocoa Tax Revenue
-14
-12
-10
-8
-6
-4
-2
0
2
2005 2006 2005 2006
Côte d'Ivoire Ghana
Rev
enue
gai
n/lo
ss (U
S$ m
illio
n)
Scenario 1 Scenario 2
Impact on Employment and the Environment
Some six million workers are directly employed in producing cocoa in Côte d'Ivoire and Ghana alone. The crop often provides a significant proportion of total cash income for many rural cocoa-growing households. This cash is often needed to pay for services such as education and health care, which are usually not provided free by the state. In the rural forest zone of Ghana, where many small cocoa farmers are located, income data from recent World Bank-supported living standards surveys suggest that increasing returns to agricultural activities are an important factor underlying the poverty reduction. The decline in poverty is partly attributed to past investment decisions (cocoa planting) along with a gradual increase in the producer price of cocoa and assistance with the maintenance of cocoa farms through enhanced extension services. A reduction in farmgate prices (which would be expected to occur in the case of full implementation of the Directive in 2003/04 (Scenario 2)) would reduce profitability and cash incomes, and consequently access to services, as well as contributing to an increase in poverty.
The environmental impact of changes in cocoa prices would be expected to be partly reflected in the changes in yields and harvested area calculated by the forecasting model, although the analysis suggests that these are relatively modest in all cases (Diagrams 6.18 and 6.19).

CHAPTER 6: IMPACT OF THE DIRECTIVE ON COCOA PRODUCERS PAGE 78
© LMC International Ltd, 2006
Diagram 6.18: Changes in Yields
0
100
200
300
400
500
600
700
BaseCase
Scen1
Scen2
BaseCase
Scen1
Scen2
BaseCase
Scen1
Scen2
BaseCase
Scen1
Scen2
BaseCase
Scen1
Scen2
Cote d'Ivoire Ghana Cameroon Nigeria Togo
Yiel
d (k
g pe
r hec
tare
)
2004/05 2007/08 2010/11
Diagram 6.19: Changes in Harvested Area
0
500
1,000
1,500
2,000
2,500
BaseCase
Scen1
Scen2
BaseCase
Scen1
Scen2
BaseCase
Scen1
Scen2
BaseCase
Scen1
Scen2
BaseCase
Scen1
Scen2
Cote d'Ivoire Ghana Cameroon Nigeria Togo
Har
vest
ed A
rea
('000
hec
tare
s)
2007/08 2010/11

CHAPTER 7: IMPACT OF THE DIRECTIVE ON VEGETABLE OIL PRODUCERS PAGE 79
© LMC International Ltd, 2006
Chapter 7: Impact of the Directive on Vegetable Oil Producers
This chapter examines the impact of the Directive on the vegetable oil producers. Firstly, we provide a macro-economic background with a view to determining the importance of the sector to the economy. Next, we provide an overview of production trends and exports. In this case, all the exotics have one thing in common: they are wild crops that are not cultivated; rather they are collected from the forests. This leads to extreme variability in annual collection levels. Following this, we examine developments in the value chain and price developments, and finally we investigate the impact of the Directive on producers. This chapter is based on analysis of case study data.
The chapter is in four sections: Part 1 deals with sheanuts; Part 2 the Indian exotics; Part 3 illipe; and Part 4 palm oil.
SHEANUTS
Importance of Exotic Fats to the Economy
Sheanuts are cultivated in West Africa. Nigeria is the most important sheanut producer although very little is exported, with most nuts being used internally. Trends in Nigeria are not discussed in this report. Togo, Ghana and Benin are the most important regional exporters. Production from Mali and Burkina Faso is also exported, largely to Togo and Ghana, and then re-exported.
Per capita incomes among the producing countries are under $500 per annum (Table 7.1), while the economies have grown between 2.5% and 6.5% per annum over the last five years (Diagram 7.1).
Table 7.1: Shea Producing Countries, Average Per Capita Income
$
Burkina Faso 399 Benin 495 Mali 376 Togo 339 Ghana 409
Source: IMF.

CHAPTER 7: IMPACT OF THE DIRECTIVE ON VEGETABLE OIL PRODUCERS PAGE 80
© LMC International Ltd, 2006
Diagram 7.1: Average GDP Growth
0%
1%
2%
3%
4%
5%
6%
7%
Benin Burkina Faso Ghana Mali Togo
Aver
age
Gro
wth
Annual export earnings from sheanuts and products account for up to US$25 million. The importance of export earnings to the economies varies significantly between years according to the size of the crop. In 2004, export earnings accounted for up to 2.5% of total export earnings (Diagram 7.2).
Diagram 7.2: Importance of Sheanuts to Export Earnings
0.0%
0.5%
1.0%
1.5%
2.0%
2.5%
Benin Mali Togo Burkina Faso Ghana
Expo
rt Ea
rnin
gs (%
)
CHAPTER 7: IMPACT OF THE DIRECTIVE ON VEGETABLE OIL PRODUCERS PAGE 81
© LMC International Ltd, 2006
However, to consider export earnings alone underestimates the importance of the sector. Sheanut collection provides important income earning opportunities for women in rural areas and the shea butter1 when used domestically is an important cooking oil throughout the region.
The market can be split into two components:
Local market: where shea is an important cooking oil. It can also be used for locally produced cosmetics, medicine and the production of traditional soaps.
Export market: where sheanuts are exported for use by CBE manufacturers and to a much lesser extent by cosmetics manufacturers.
The importance of the local market varies between country (Table 7.2), while West African exports (excluding intra-regional trade) have averaged 100,000 tonnes over the last five years. Around 80,000 tonnes are exported in nut form and 20,000 tonnes in butter form (on a nut equivalent basis)2 (Diagram 7.3).
Table 7.2: Estimated Local Shea Consumption (% of Total) local
Burkina Faso 85%Benin < exportsMali 95%Togo 60%Ghana 50%
Source: Case Studies.
1 Butter is a common name for the fat.
2 It is assumed that the EU accounts for all butter exports and export figures are derived from EU Eurostat import data.

CHAPTER 7: IMPACT OF THE DIRECTIVE ON VEGETABLE OIL PRODUCERS PAGE 82
© LMC International Ltd, 2006
Diagram 7.3: Regional Sheanut Exports
0
20
40
60
80
100
120
140
1996 1997 1998 1999 2000 2001 2002 2003 2004 2005
Reg
iona
l Exp
orts
('00
0 to
nnes
)
Nuts Butter (nut equivalent)
Our export figures have been derived from the case study material for nuts and Eurostat import data for butter. What is clear from the case studies is that formal data from the sector is sparse and export figures between sources often conflict. From the studies, Eurostat data and discussions with importers we have derived our best estimates of the size of these flows. The data, while not tying up exactly with our derived import series (Chapter 4), do have the same annual average volume. One of the explanations for the differences is the timing of exports and imports as these cross calendar years.
Table 7.3: Sheanut Exports (tonnes) 1996 2000 2001 2002 2003 2004 2005
Benin 6,301 8,531 13,299 7,092 28,300 25,100 19,700Burkina Faso 10,004 11,575 17,980 36,920 26,686 12,177 3,035Ghana 21,467 35,983 45,281 27,627 47,312 33,946 83,202Mali 2,975 4,205 12,379 4,000 3,730 4,100 2,200Togo 8,330 4,764 368 1,166 3,819 100Total 49,077 65,058 89,307 76,806 109,847 75,423 108,137of which: EU 35,617 44,276 53,730 34,437 79,068 55,569 77,355Africa 13,181 17,022 33,447 35,918 17,411 17,326 9,233Asia 279 3,760 2,131 6,450 13,368 2,528 21,549
Source: Case Studies.
Table 7.3 reveals the trends in exports. The export data reveal:

CHAPTER 7: IMPACT OF THE DIRECTIVE ON VEGETABLE OIL PRODUCERS PAGE 83
© LMC International Ltd, 2006
A proportion of exports are within the West African region. Togo, Ghana and Benin are the most important exporters from the region. The majority of exports from Mali and Burkina Faso are exported to other African countries.
Of West African exports, the EU is the most important importing market, accounting for over 80% of exports.
The trend in West African exports is upwards as EU-15 import demand has increased. It is unclear whether this increase can be accounted for by an increase in nut collection or from a reduction in local consumption.
Butter exports are increasing. This has occurred as one of the major European CBE manufacturers has increased its toll processing at origin.
There is considerable variability in the level of exports per year. This occurs due to the wild nature of the product, which means that there are considerable fluctuations in annual production. The fluctuations in exports between countries can be even more extreme as there are changing trade flows between producers and because flowering and production patterns are not uniform across the region.
Using the export data and estimated proportions of local consumption we can derive collected nut figures. Given the variability of collection, we present these data as a five-year average. On the basis of these data, exports averaged 112,000 tonnes per annum, around 26% of total collection (Table 7.4).
Table 7.4: Per Annum Collected Sheanuts (tonnes, five-year average)
Local Exports Total
Burkina Faso 113,325 19,999 133,324 Benin 28,076 18,717 46,793 Mali 100,697 5,300 105,997 Togo 17,360 11,573 28,933 Ghana 57,182 57,182 114,365 Total 316,640 112,771 429,411
Source: LMC.
Value Chain and Price Developments
Sheanuts are collected and unshelled by village women. Once they have unshelled the nuts they can:
Sell the kernels immediately (either to local traders or village processors);
Store them for further processing or sale;
Extract shea butter themselves and use the shea butter for their own consumption or sell it.
The choice of these possibilities depends on the price offered by potential buyers and financial needs.

CHAPTER 7: IMPACT OF THE DIRECTIVE ON VEGETABLE OIL PRODUCERS PAGE 84
© LMC International Ltd, 2006
Where nuts are processed for the local market, the extraction of the butter occurs at village level and is undertaken by individual women or women’s groups. The process is entirely manual, although some groups have obtained basic mechanical equipment. High quality locally produced butter is also exported, in small quantities, for use in cosmetics. The marketing of these products is often linked to an NGO. A stylised marketing chain is presented in Diagram 7.4. The traditional shea butter price fluctuates considerably from year to year depending on the level of production and, within a year, on the temperature. Prices are highest in the coldest months as the butter remains solid prior to use.
Diagram 7.4: Sheanut Marketing Chain
Collector(collection and unshelling)
Own/Village Processing(to extract butter)Own Consumption Village Traders
Large Traders
EXPORTER PROCESSORS(to extract butter)
EXPORT- cosmetics
LOCAL MARKET- cooking oil- cosmetics- soap- medicine
Export
In the formal sector, sheanut buying is in the hands of the private sector, although in some countries the government sets minimum buying prices and the opening and closing of the buying season. Actual prices paid are set by the market and vary as supply and demand conditions (both local and international) alter. Prices change during the season according to quality and availability. Given the flow of product between countries, buying prices are at similar levels with the exception of Mali and Ghana (at the beginning of the season). In Mali, the poor quality of the crop points to lower collector prices (Table 7.5). In 2006, with a low shea crop (the worst in over 20 years), collector prices have risen considerably.

CHAPTER 7: IMPACT OF THE DIRECTIVE ON VEGETABLE OIL PRODUCERS PAGE 85
© LMC International Ltd, 2006
Table 7.5: Estimated Collector Prices, 2004/05 (US$ per tonne)
High Low
Burkina Faso 170 114 Benin 129 Mali 76 Togo 218 142 Ghana 150 55
Source: Case Studies.
Export price data are sparse; hence we have constructed price series from Eurostat data minus freight charges. These data give an average export price for the region. These data suggest that export prices are between €200 to €300 per tonne, with the exception of 2004 when prices rose to €400 per tonne. The rise in prices coincides with lower exports suggesting increased demand pushed prices higher (Diagram 7.5).
Only limited volumes of shea butter are exported and most of this is processed on a tolling basis.
Diagram 7.5: Estimated Sheanut Export Prices
200
250
300
350
400
450
1996 1997 1998 1999 2000 2001 2002 2003 2004 2005
Nut
Exp
ort P
rices
(Eur
o)
Using the estimated collector prices and export prices, we can construct a value chain. This suggests that around 50% of the export value is received by the producers (Diagram 7.6). Intermediaries’ margins include those attributed to village traders, larger traders and exporters. Depending upon the country, transport costs can be high. Details of individual country value chains are presented in the case studies.
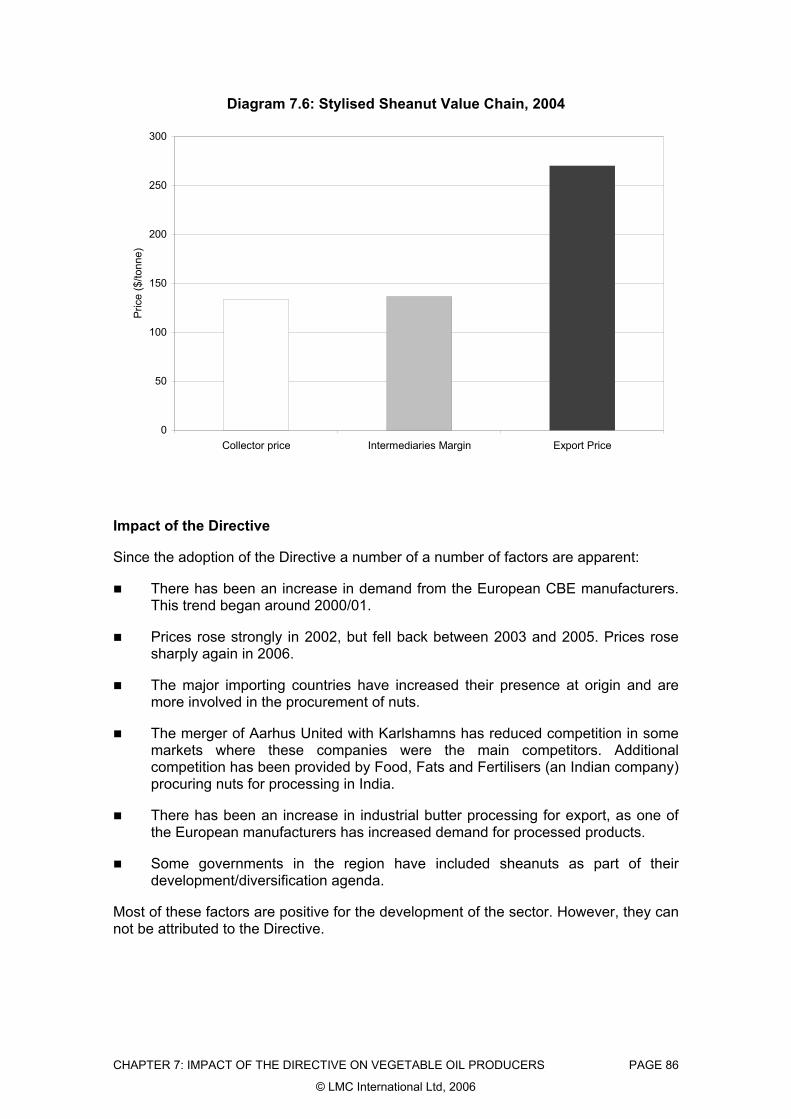
CHAPTER 7: IMPACT OF THE DIRECTIVE ON VEGETABLE OIL PRODUCERS PAGE 86
© LMC International Ltd, 2006
Diagram 7.6: Stylised Sheanut Value Chain, 2004
0
50
100
150
200
250
300
Collector price Intermediaries Margin Export Price
Pric
e ($
/tonn
e)
Impact of the Directive
Since the adoption of the Directive a number of a number of factors are apparent:
There has been an increase in demand from the European CBE manufacturers. This trend began around 2000/01.
Prices rose strongly in 2002, but fell back between 2003 and 2005. Prices rose sharply again in 2006.
The major importing countries have increased their presence at origin and are more involved in the procurement of nuts.
The merger of Aarhus United with Karlshamns has reduced competition in some markets where these companies were the main competitors. Additional competition has been provided by Food, Fats and Fertilisers (an Indian company) procuring nuts for processing in India.
There has been an increase in industrial butter processing for export, as one of the European manufacturers has increased demand for processed products.
Some governments in the region have included sheanuts as part of their development/diversification agenda.
Most of these factors are positive for the development of the sector. However, they can not be attributed to the Directive.

CHAPTER 7: IMPACT OF THE DIRECTIVE ON VEGETABLE OIL PRODUCERS PAGE 87
© LMC International Ltd, 2006
INDIAN EXOTIC FATS
Importance of Exotic Fats to the Economy
In terms of export earnings and GDP, the exotic fats have little impact in India. Export earnings peaked in 2005 in the order of US $13 million. However, sal and mango kernel are particularly important in terms of employment in the Orissa and Chhattisgarh states where they provide valuable employment opportunities for rural communities with few income earning opportunities. There are an estimated 4 million people dependent upon the fats for their livelihoods.
The fats are processed in India and fractionated when required. In the case of sal, this means that both sal oil and sal stearin are exported. For the other fats, mango kernel stearin and kokum butter are exported. These are the raw materials for CBE manufacturing. Sal is the most important of the exotic fats produced in India.
Sal
Production and Exports
Sal is a nationalised forest crop and production is concentrated in the Chhattisgarh and Orissa States. There is a small amount of production in other states. As a forest crop, there are very large natural annual fluctuations in production. Usually there is a three-year crop cycle but with changing weather conditions, this has changed to a two-year cycle over the last six years.
Production peaked at over 100,000 tonnes of nuts in both 2003 and 2005. In between, production fell to just 17,000 tonnes in 2004. 2006 production is estimated between 25,000 and 30,000 tonnes (Diagram 7.7). The Solvent Extractors Association data are lower than this as the data do not have full coverage.
Diagram 7.7: Estimated Sal Production
0
20
40
60
80
100
120
1996 1997 1998 1999 2000 2001 2002 2003 2004 2005
Prod
uctio
n ('0
00 to
nnes
)

CHAPTER 7: IMPACT OF THE DIRECTIVE ON VEGETABLE OIL PRODUCERS PAGE 88
© LMC International Ltd, 2006
Potential production is considerably higher than actual production, with prices determining how far into the forest collectors go to collect sal. The state governments are the sole buyers of sal, although this may be changing, and government buying policies dictate how much of the crop is collected. If growers are not paid in a timely fashion then marketed production will decline. In 2005, despite a total marketed crop of over 100,000 tonnes, marketed production fell in Orissa as the government reduced its buying. This follows buying losses in 2003 and 2005. The Orissa state government is reportedly in the process of privatising buying.
The crop is processed into sal oil, which can then be fractionated into sal stearin for use in CBEs, and sal olein which is processed into an edible oil (either for cooking oil or as a shortening).
Both sal oil and sal stearin are exported. Sal oil is exported to Japan, while a combination of sal oil and stearin are exported to the EU-15 and Malaysia. Stearin exports dominate exports to the EU-15. The level of exports in any one year is determined by both production and demand. In a poor crop year, all of the sal oil and stearin are exported, whereas in a good crop year production is greater than export demand and the balance is used on the domestic market.
In 2005, a good year for production, exports were in the order of 8,000 tonnes (oil and stearin combined), with around 3,000 tonnes going to the EU-15. With higher production, this left around 4,500 tonnes for use on the domestic market, where the oil is used for shortenings and margarine. The EU-15 accounts for between 35% and 50% of total exports (Table 7.6).
Demand for sal stearin to the EU-15 has reportedly picked up over the last two years. This is thought to be due to a poor shea crop in 2005, which has led CBE manufacturers to seek alternative exotics for CBE blends.
Table 7.6: Estimated Sal Exports (tonnes) Total EU EU EU Japan Malaysia Oil Stearin Oil Stearin
1996 4,500 928 278 650 2,953 619 1997 4,800 1,081 324 757 2,998 721 1998 1,931 579 174 405 965 386 1999 1,963 589 177 412 982 393 2000 5,300 1,100 330 770 3,467 733 2001 5,800 1,337 401 936 3,572 891 2002 2,559 768 230 537 1,280 512 2003 6,500 1,812 544 1,269 3,480 1,208 2004 2,235 670 201 469 1,117 447 2005 8,000 3,000 900 2,100 3,500 1,500
Source: LMC.
Value Chain
The sal value chain is very short; collectors gather the fallen sal nuts, and these are then sold to the state governments, who then sell on to the processors.

CHAPTER 7: IMPACT OF THE DIRECTIVE ON VEGETABLE OIL PRODUCERS PAGE 89
© LMC International Ltd, 2006
In Chattisgarh, government buying is through the Chattisgarh State Minor Forest Product (Trading and Development) Federation. The Federation sets minimum buying prices and then tenders the collected seed to buyers. These tenders are either prior to collection or once seed has been delivered into the Federation’s warehouse. In the case where the selling price is higher than the buying price, a second payment is made to collectors at the end of the season. In the case where the selling price is lower than the buying price, the State government absorbs the losses. Losses were made in 2003 and 2005 (Diagram 7.8). A similar buying system exists in Orissa.
In 2005, minimum grower prices were Rp 5,000 per tonne ($114) of nuts, and the tendered buying price to the processors was around Rp 3,500 per tonne, implying a loss of Rp 1,500 per tonne ($34) of nuts sold. Export prices rose considerably during the year as the low shea crop in West Africa led to increased demand. At the beginning of the year, sal oil prices were around $1,200 per tonne, while sal stearin prices ranged between $1,500 and $1,900 per tonne, depending on the quality of the final product. Solvent fractionated product tends to have a $200 - $300 per tonne premium over dry fractionated product.
Diagram 7.8: Sal Prices and Margins
400
600
800
1,000
1,200
1,400
1,600
2001 2002 2003 2004 2005
Pric
es ($
/Ton
ne, o
il eq
uiva
lent
)
-500
-400
-300
-200
-100
0
100 State Governm
ent Revenue ($/Tonne, oil equivalent)
State Government (right hand axis) Collector PriceProcessor Selling Price Processor Buying Price
Mango Kernel Oil
Production and Exports
Mango kernels are either collected wild from the countryside around Chhattisgarh and Orissa States, or collected in the villages following the consumption of the fruit. The season is limited to June and July. The kernels from mango pulping factories are not used, as the pulping process disturbs the kernel. As with sal, as a forest crop there are very large natural annual fluctuations in production. The mango crop cycle has no relationship to the sal cycle. Maximum production is in the order of 30,000 tonnes,

CHAPTER 7: IMPACT OF THE DIRECTIVE ON VEGETABLE OIL PRODUCERS PAGE 90
© LMC International Ltd, 2006
while a low crop is in the order of 5,000 tonnes. Annual average production is in the order of 15,000 tonnes of kernels.
Most mango kernel is processed into stearin before export, with the olein used on the domestic market. There is greater risk involved in processing mango kernel as FFA levels can get very high. The kernels need to be processed soon after harvest.
While actual production figures for particular years are not available, an indication of the trend can be gained from the Solvent Extractors Association data. We have adjusted this data following discussions with the industry, to give a closer reflection of the level of production and exports (Diagram 7.9).
Diagram 7.9: Mango Kernel Harvested Production
0
5
10
15
20
25
30
35
40
45
50
1996 1997 1998 1999 2000 2001 2002 2003 2004 2005
Man
go K
erne
l Nut
s ('0
00 to
nnes
)
As with sal, potential production is considerably higher, with the amount collected dependent upon the price paid and the incentives offered to collectors to collect the kernels.
Most exports are in the form of mango kernel stearin. The EU is the main export market, with some production also going to Malaysia.
While trade data are available from the Solvent Extractors Association, these data do not have full coverage of the industry and therefore understate total trade flows. We have derived potential exports by applying the extraction rate to production and then sought trade estimates as to the level of exports (Table 7.7).

CHAPTER 7: IMPACT OF THE DIRECTIVE ON VEGETABLE OIL PRODUCERS PAGE 91
© LMC International Ltd, 2006
Table 7.7: Estimated Mango Kernel Exports (tonnes) Total EU EU EU Japan Malaysia Oil Stearin Oil Stearin
1996 414 331 331 83 1997 1,252 1,001 1,001 250 1998 178 142 142 36 1999 1,625 1,300 1,300 325 2000 0 0 0 0 2001 156 125 125 31 2002 177 141 141 35 2003 930 744 744 186 2004 182 146 146 36 2005 546 437 437 109
Source: LMC.
Value Chain
The marketing chain is unorganised, with store keepers in many villages acting as the traders who purchase the nuts from collectors. Collectors pick the kernels and the remove the nut from the kernel and deliver it to the storekeepers who then sell the nuts to the processors. Storekeeper prices vary between Rp 3,000 and Rp 4,500 per tonne ($68 to $102). The storekeepers’ gross margin is in the order of 10% (Diagram 7.10).
Mango kernel stearin export prices are typically 10% higher than sal stearin prices. The meal and olein are sold on the local market.
Diagram 7.10: Mango Kernel Marketing Margins, 2005
0
200
400
600
800
1,000
1,200
1,400
1,600
1,800
2,000
US
$/to
nne
Collector Storekeeper Processor

CHAPTER 7: IMPACT OF THE DIRECTIVE ON VEGETABLE OIL PRODUCERS PAGE 92
© LMC International Ltd, 2006
Kokum
Production and Exports
Kokum is the smallest of the crops. It is produced in Maharashtra State. The crop is wild, but it can also be cultivated. It is often intercropped with mangos. There is less annual variation in production than is the case with sal and mango kernel. Average production is around 1,000 tonnes of nuts. Once the butter is expelled from the nut there is no further processing. Around 400 tonnes of butter are produced per year.
As with Mango Kernel oil, the main markets are Western Europe and Malaysia.
Statistics on production and exports are poor. Our estimates based on discussions with the processors are presented in Diagram 7.11 and Table 7.8.
Diagram 7.11: Estimated Kokum Nut Production
750
800
850
900
950
1,000
1,050
1996 1997 1998 1999 2000 2001 2002 2003 2004 2005
Prod
uctio
n (to
nnes
)
Table 7.8: Estimated Kokum Butter Exports (tonnes) Total EU Malaysia
1996 351 175 175 1997 337 168 168 1998 393 197 197 1999 349 175 175 2000 360 180 180 2001 360 180 180 2002 396 198 198 2003 396 198 198 2004 380 190 190 2005 400 200 200
Source: LMC.

CHAPTER 7: IMPACT OF THE DIRECTIVE ON VEGETABLE OIL PRODUCERS PAGE 93
© LMC International Ltd, 2006
Value Chain
The marketing chain is unorganised. The kokum nuts are sold to local traders who then sell on to processors. Grower prices vary between Rp 20,000 and Rp 35,000 per tonne ($455 to $795) (Diagram 7.12).
Diagram 7.12: Kokum Marketing Margins, 2005
0
200
400
600
800
1,000
1,200
1,400
1,600
1,800
2,000
US$
/tonn
e
Collector Storekeeper Processor
Impact of the Directive
Since the adoption of the Directive, a number of factors are apparent:
Sal is the most important of the Indian exotic fats. There was been an increase in demand from the European CBE manufacturers. This trend began around 2003. There has been an increase in demand for mango kernel, although production and collection levels are variable.
For some CBE manufacturers, the Indian fats are essential components of blends, while for others they are more of an opportunistic buy according to both price and the availability of other exotics.
In a good year, production quantities are more than can be accommodated by the international market and the balance is absorbed on the local market.
Mango kernel and kokum prices have a premium over sal. However, the volumes marketed are considerably smaller (Diagram 7.13). According to SEA data the kokum premium is falling. Prices have risen sharply in 2006.
With an increase in demand and a rise in prices there is scope for marketing additional quantities. However, the sector is relatively underdeveloped.
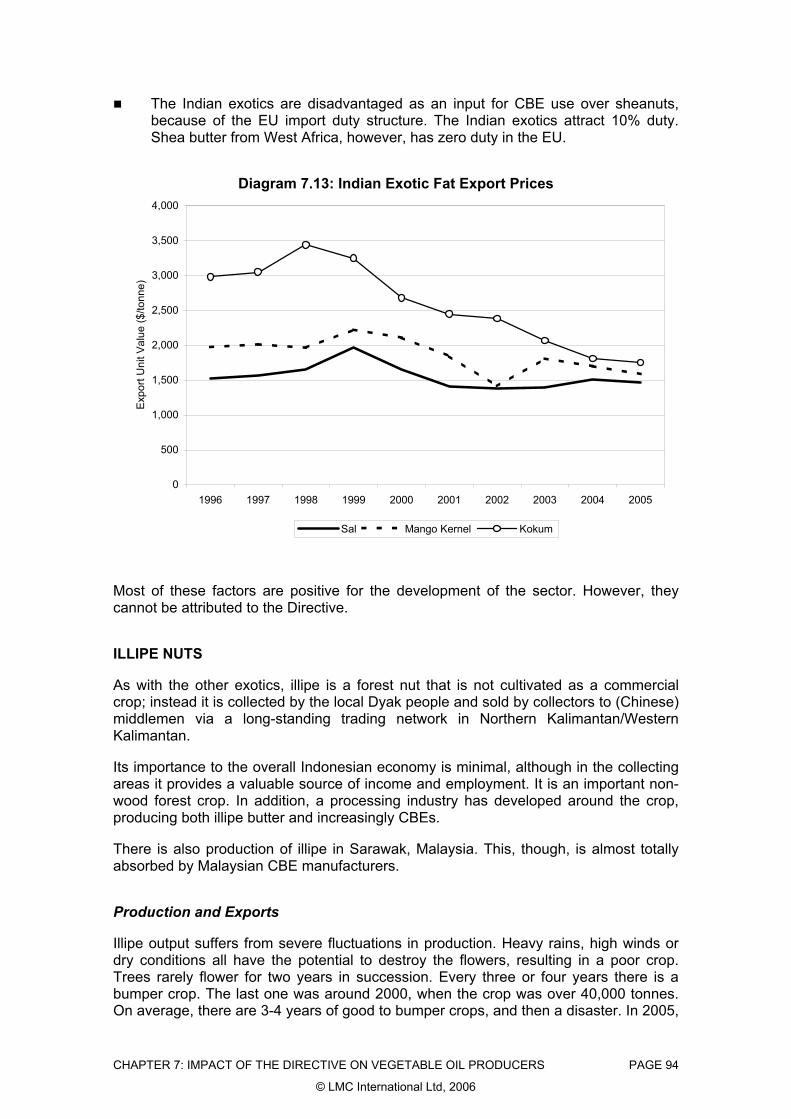
CHAPTER 7: IMPACT OF THE DIRECTIVE ON VEGETABLE OIL PRODUCERS PAGE 94
© LMC International Ltd, 2006
The Indian exotics are disadvantaged as an input for CBE use over sheanuts, because of the EU import duty structure. The Indian exotics attract 10% duty. Shea butter from West Africa, however, has zero duty in the EU.
Diagram 7.13: Indian Exotic Fat Export Prices
0
500
1,000
1,500
2,000
2,500
3,000
3,500
4,000
1996 1997 1998 1999 2000 2001 2002 2003 2004 2005
Expo
rt U
nit V
alue
($/to
nne)
Sal Mango Kernel Kokum
Most of these factors are positive for the development of the sector. However, they cannot be attributed to the Directive.
ILLIPE NUTS
As with the other exotics, illipe is a forest nut that is not cultivated as a commercial crop; instead it is collected by the local Dyak people and sold by collectors to (Chinese) middlemen via a long-standing trading network in Northern Kalimantan/Western Kalimantan.
Its importance to the overall Indonesian economy is minimal, although in the collecting areas it provides a valuable source of income and employment. It is an important non-wood forest crop. In addition, a processing industry has developed around the crop, producing both illipe butter and increasingly CBEs.
There is also production of illipe in Sarawak, Malaysia. This, though, is almost totally absorbed by Malaysian CBE manufacturers.
Production and Exports
Illipe output suffers from severe fluctuations in production. Heavy rains, high winds or dry conditions all have the potential to destroy the flowers, resulting in a poor crop. Trees rarely flower for two years in succession. Every three or four years there is a bumper crop. The last one was around 2000, when the crop was over 40,000 tonnes. On average, there are 3-4 years of good to bumper crops, and then a disaster. In 2005,

CHAPTER 7: IMPACT OF THE DIRECTIVE ON VEGETABLE OIL PRODUCERS PAGE 95
© LMC International Ltd, 2006
a typical good year, production was over 20,000 tonnes. In 2006, the crop will be almost zero. The production system is under threat from logging and the expansion of the oil palm sector. This could reduce the illipe area, meaning that collectors have to walk further into the forest to collect the nuts.
Very few illipe nuts are exported. The majority of exports are as butter, although the major trading company handling the crop also produces its own CBEs. This has reduced the export of illipe butter.
Over the last 5 years, a total of around 6,000 tonnes of illipe butter and 4,000 tonnes of illipe nuts were exported from Indonesia. During a bumper crop, annual exports can rise to 2,500 tonnes, while in the other years only a few hundred tonnes are exported. In 2005, with a good illipe crop, imports to the EU-15 rose to 1,500 tonnes (Diagram 7.14). The strength of exports was also a reflection of the poor shea crop which necessitated the use of other exotics for CBE manufacture.
Eurostat data are at odds with destination figures from the Indonesian statistics. Discussions with EU CBE manufacturers confirm the magnitude of the product flows to the EU-15.
Illipe imports are disadvantaged as an input for CBE use because of the EU import duty structure. Illipe butter attracts a 10% duty and nuts zero. Shea butter from West Africa, however, has zero duty in the EU.
Diagram 7.14: EU-15 Illipe Butter Imports
0
200
400
600
800
1,000
1,200
1,400
1,600
1,800
1996 1997 1998 1999 2000 2001 2002 2003 2004 2005
But
ter I
mpo
rts (t
onne
s)
Value Chain
The illipe nut price has been quite stable over time, in the $300-$400 per tonne range, with the maximum maximum-minimum difference around $200 per tonne (i.e., from $250 to $450/ tonne). If the price is higher than usual, collectors will go deeper into the forest to collect nuts. If prices fall, collectors seek alternative incomes. In particular, the

CHAPTER 7: IMPACT OF THE DIRECTIVE ON VEGETABLE OIL PRODUCERS PAGE 96
© LMC International Ltd, 2006
rise in rubber prices has encouraged some producers to tap rubber rather than collect nuts. With export prices in the order of $2,000 per tonne, collector prices are typically 30% of the export price (Diagram 7.15).
Diagram 7.15: Estimated Illipe Butter Export Unit Values
1,400
1,500
1,600
1,700
1,800
1,900
2,000
2,100
2,200
2,300
2000 2001 2002 2003 2004 2005
Estim
ated
Exp
ort U
nit V
alue
($ p
er to
nne)
Impact of the Directive
Since the adoption of the Directive, a number of factors are apparent:
Illipe butter/nut exports fluctuate dramatically between years.
A large proportion of illipe butter is processed locally into CBEs. These are sold into markets outside the EU-15.
EU-15 imports rose strongly in 2005.
Prices rose strongly in 2002, but fell back between 2003 and 2005.
PALM OIL
Palm oil production has increased from 16 million tonnes to 34 million tonnes during the reporting period, with 85% of production coming from Indonesia and Malaysia. CBE production accounts for a small proportion of this market (Diagram 7.16).

CHAPTER 7: IMPACT OF THE DIRECTIVE ON VEGETABLE OIL PRODUCERS PAGE 97
© LMC International Ltd, 2006
Diagram 7.16: Palm Oil Production, 1996-2005
0
5,000
10,000
15,000
20,000
25,000
30,000
35,000
40,000
45,000
1996 1997 1998 1999 2000 2001 2002 2003 2004 2005
Palm
Oil
Prod
uctio
n ('0
00 to
nnes
)
76%
77%
78%
79%
80%
81%
82%
83%
84%
85%M
alaysia & Indonesia Proportion (%)
World Malaysia & Indonesia %
Palm mid-fraction (PMF), the product used in CBEs, is derived from fractionated palm olein. As palm oil production has grown and plantation companies have added downstream processing capacity, so prices and margins for PMF have fallen. PMF prices are determined by palm olein prices plus a premium. The premium for the first fractionation is between $50 and $100 per tonne above palm olein, and this price rises with subsequent fractionations. The third fraction which is used in the production of hard CBEs commands a premium between $300 and $500 per tonne.
Palm olein prices peaked in 1998 at $700 per tonne and following a slump in 2001 recovered to over $500 per tonne in 2004 (Diagram 7.17).

CHAPTER 7: IMPACT OF THE DIRECTIVE ON VEGETABLE OIL PRODUCERS PAGE 98
© LMC International Ltd, 2006
Diagram 7.17: Palm Olein Prices, c.i.f. Europe
200
300
400
500
600
700
800
1996 1997 1998 1999 2000 2001 2002 2003 2004 2005
Pric
es (c
if Eu
rope
, $/to
nne)
CONCLUSIONS
In terms of the total economy, the importance of the exotic fats is relatively small. However, in the regions where they are collected, they are very important for employment and income generation. In the case of shea, collection is primarily by women, while for illipe and the Indian exotics, collection is by tribal peoples living off non-timber forest products.
For sheanuts, demand is from both the local market and for export. The other exotics are primarily export orientated, the only exception being sal when production is higher than that which can be absorbed by the export market. In this case, the balance is used domestically.
For all the exotics, with the exception of kokum, there can be extreme fluctuations in production between years. This is due to the uncultivated nature of production.
There has been an increase in demand for exotics from the European CBE manufacturers: for shea since 2000, sal since 2003 and illipe in 2005. From the case studies, it is not possible to attribute this growth to the EU Directive; all that can be said is that demand has increased and so has the volume of product that is destined for EU-15.
Trends in prices follow the supply-demand balance of the individual crops, thus in years of high production there is a tendency for prices to fall and vice-versa.
For the Indian exotic fats and illipe almost all processing occurs at origin and processed products are exported. This is not the case with sheanuts where the export is more of nuts than products. The reasons for this are:
― There is a distinct season for sheanut collection and it is difficult to store nuts for processing for the whole year. The harvest is also very variable
CHAPTER 7: IMPACT OF THE DIRECTIVE ON VEGETABLE OIL PRODUCERS PAGE 99
© LMC International Ltd, 2006
both between regions and years, making it difficult to secure nuts in a particular year. The most successful sheanut processing facility is in Togo. This is successful because it also processes cottonseed, which ensures high levels of capacity utilisation. In India, there are a variety of products that can be crushed to produce oil, so in the absence of exotics, other oils can be produced (one processor even imports sheanuts from West Africa for processing). In India, fractionation of products is also possible as the by-products can be used on the domestic market.
― There are no specific incentives for industrial sheanut processing in West Africa. This contrasts with cocoa where incentives are offered: beans can be cheaper and the level of export tax can be lower for processed products.
― In the case of illipe, as PMF is also produced in Malaysia and Indonesia, CBEs are being produced. This adds further value to illipe nut production. These CBE products tend to be sold in markets outside of the EU.
― Shea processing to produce stearin requires solvent (preferably acetone) fractionation both to remove a latex gum and produce a good yield of shea stearin. The infrastructure in West Africa does not easily support such a production facility.
Both shea and the Indian exotics remain underdeveloped in terms of their potential. In both cases, there is scope to increase collection and improve the quality of the product, although whether this occurs is partly dependent upon the price paid to collectors. In the case of shea, some governments have recognised the crop’s potential and are seeking to increase the development of the crop as part of a diversification strategy. For illipe, production potential is declining as palm oil development reduces the illipe forests.
Palm oil production has grown dramatically since the adoption of the Directive. However, the growth of CBE demand is small in relation to the total volumes of palm oil produced and marketed.

CHAPTER 8: CONCLUSIONS AND RECOMMENDATIONS PAGE 100
© LMC International Ltd, 2006
Chapter 8: Conclusions and Recommendations
The European Parliament and Council adopted Directive 2000/36/EC on 23 June 2000. The aim of the Directive was to allow the use of up to 5% of a limited number of vegetable fats in the production of chocolate. The objective of the Directive was to simplify Community provisions concerning chocolate with a view to allowing the free movement of chocolate products within the Internal Market. The Directive was implemented by member states during 2003.
The vegetable fats that were permitted for use required strict technical characteristics and were limited to six (Illipe, palm oil, sal, shea, kokum gurgi, and mango kernel). Five of these (illipe, sal, shea, kokum gurgi and mango kernel) can be classed as exotic fats; that is, the fat is obtained from the seeds/nuts of trees that are mainly growing wild in the tropics. Enzymic modification of the fats was prohibited.
CONCLUSIONS
EU Chocolate Consumption and Cocoa Imports
EU-15 consumption of chocolate products is around 2.2 million tonnes. There has been little change in total consumption since the Directive was adopted in 2003. Four markets, UK, Germany, Italy and France account for close to 80% of EU-15 chocolate consumption.
There are a number of reasons for the slow growth in consumption:
Slow growth in income. Per capita consumption is related to per capita incomes, and the slow growth of incomes in recent years adversely affected demand;
Market saturation in some of the mature markets; and
Increasing concerns over obesity.
Not all segments of the market have experienced the same growth rates; in particular there has been growth in whole bar (tablet) consumption over other products. This has been driven by campaigns highlighting the benefits of cocoa consumption (in particular, the presence of the antioxidant flavanol which has been found to reduce blood pressure) and the growth of more speciality products such as single origin bars. Both of these types of products have a higher cocoa content.
Net imports of cocoa beans and cocoa products in bean equivalent (b.e.) terms from outside the EU-15 countries have increased from around 1.2 million tonnes in 1996 to over 1.4 million tonnes in 2005, recording an average annual growth rate of 2.1% over the last 10 years. This is somewhat higher than the growth of chocolate production and consumption, which has grown at 0.6% over the period. Over the last two years, since the adoption of the Directive, the rate of growth of net cocoa imports has accelerated to 3.5% despite a flat chocolate product market. This points towards the increased cocoa solids content of chocolate as well as increased use of cocoa products for other food applications.

CHAPTER 8: CONCLUSIONS AND RECOMMENDATIONS PAGE 101
© LMC International Ltd, 2006
Vegetable Fat Imports and CBE production
When converted to the raw materials that are used for CBE manufacture, exotic fat imports have increased from 8,000 tonnes in 1996 to 24,500 tonnes in 2005 (Table 8.1). Since the adoption of the Directive, imports of these exotic fat raw materials has increased by 25%.
Table 8.1: EU-15 Exotic Fat Imports (tonnes)
1996 1997 1998 1999 2000 2001 2002 2003 2004 2005
Sheanuts 31,938 24,856 52,757 30,155 29,396 59,575 48,787 80,802 67,626 85,040Shea butter 138 241 1,542 3,543 1,590 2,177 7,502 10,358 7,049 15,397Sal Oil 278 324 174 177 330 401 230 544 201 900Sal Stearin 650 757 405 412 770 936 537 1,269 469 2,100Mango Kernel Stearin 331 1,001 142 1,300 0 125 141 744 146 437Illipe nuts 30 20 19 24 4 4 4,187 44 2 52Illipe butter 1,688 857 327 47 31 9 121 646 193 1,446 CBE raw material 7,987 6,865 9,884 8,587 6,285 11,393 11,776 19,638 14,979 24,459
Source: Chapter 7 and LMC.
While it is possible to get an impression of the level of exotic fat imports and use in CBEs, the level of palm oil (or more specifically palm mid-fraction) is more difficult to gauge owing to the large number of end uses. The use of palm mid-fraction (PMF) varies between 10% to 100% of the weight of a CBE, depending upon what the product is to be used for. A lower proportion of exotics are used in “soft” CBEs (up to 30% exotic) while a higher proportion is used in “hard” CBEs (greater than 30%). The choice of CBE depends on the market and application.
Typically, soft CBEs are used in the UK and Ireland, and hard CBEs are used elsewhere. Splitting exotic fat use this way, with the balance being made up of PMF gives total EU-15 CBE production of 58,600 tonnes in 2005. Production has grown by 11% per annum since 2000 and at a similar rate since the adoption of the Directive (Diagram 8.1).

CHAPTER 8: CONCLUSIONS AND RECOMMENDATIONS PAGE 102
© LMC International Ltd, 2006
Diagram 8.1: EU-15 CBE Production
0
10
20
30
40
50
60
70
1996 1997 1998 1999 2000 2001 2002 2003 2004 2005
EU-1
5 C
BE P
rodu
ctio
n ('
000
tonn
es)
While exotic fat imports and CBE production have increased, the key question is: “Is this due to increased demand from chocolate manufacturers in the EU-15 following the implementation of the Directive? Or, are there other explanations?”
The Use of CBEs in EU-15 Chocolate
To determine the use of CBEs in EU-15 chocolate it is helpful to split the EU-15 market into two segments: those that permitted the use of CBEs in chocolate prior to 2000; and those that did not, and consider trends in each of these segments.
Our analysis suggests that the market for CBE use in chocolate in the EU-15 countries was 20,500 tonnes in 2005. The level of demand has been unchanged for three years, although this hides two changes.
In countries permitting the use of CBEs in chocolate prior to 2000, CBE use as a proportion of chocolate weight has fallen by 3% since the adoption of the Directive. Consequently, CBE demand is some 600 tonnes lower than would have been the case in the absence of the Directive.
In countries previously not permitting the use of CBEs in chocolate, there has been no increase in demand from branded and artisanal chocolate manufacturers. There has been an increase of some 1,000 tonnes amongst the industrial chocolate manufacturers producing product for the biscuit and ice cream industries.
Net, there has been a 400 tonne increase in CBE demand since the adoption of the Directive.
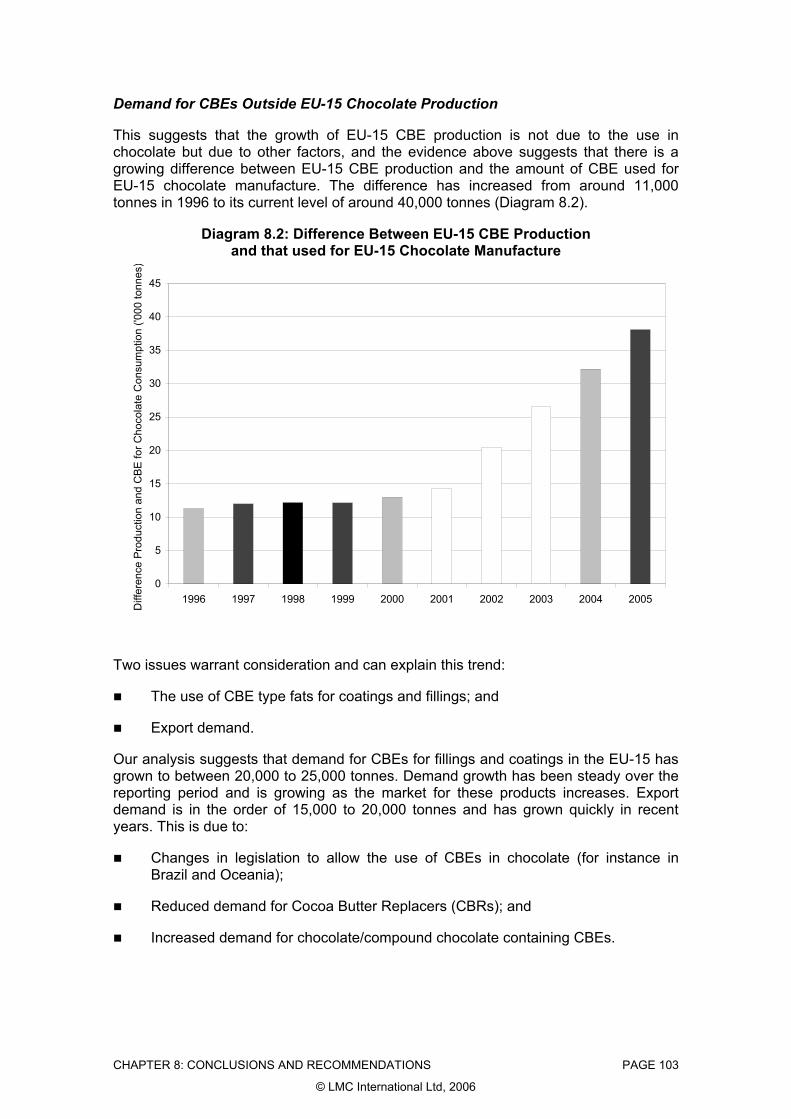
CHAPTER 8: CONCLUSIONS AND RECOMMENDATIONS PAGE 103
© LMC International Ltd, 2006
Demand for CBEs Outside EU-15 Chocolate Production
This suggests that the growth of EU-15 CBE production is not due to the use in chocolate but due to other factors, and the evidence above suggests that there is a growing difference between EU-15 CBE production and the amount of CBE used for EU-15 chocolate manufacture. The difference has increased from around 11,000 tonnes in 1996 to its current level of around 40,000 tonnes (Diagram 8.2).
Diagram 8.2: Difference Between EU-15 CBE Production and that used for EU-15 Chocolate Manufacture
0
5
10
15
20
25
30
35
40
45
1996 1997 1998 1999 2000 2001 2002 2003 2004 2005
Diff
eren
ce P
rodu
ctio
n an
d C
BE fo
r Cho
cola
te C
onsu
mpt
ion
('000
tonn
es)
Two issues warrant consideration and can explain this trend:
The use of CBE type fats for coatings and fillings; and
Export demand.
Our analysis suggests that demand for CBEs for fillings and coatings in the EU-15 has grown to between 20,000 to 25,000 tonnes. Demand growth has been steady over the reporting period and is growing as the market for these products increases. Export demand is in the order of 15,000 to 20,000 tonnes and has grown quickly in recent years. This is due to:
Changes in legislation to allow the use of CBEs in chocolate (for instance in Brazil and Oceania);
Reduced demand for Cocoa Butter Replacers (CBRs); and
Increased demand for chocolate/compound chocolate containing CBEs.

CHAPTER 8: CONCLUSIONS AND RECOMMENDATIONS PAGE 104
© LMC International Ltd, 2006
Impact of the Directive on Cocoa and Vegetable Fat Producers
Cocoa Producers
Cocoa typically accounts for over one third of total export earnings in Ghana and Côte d’Ivoire, and around 10% in the case of Cameroon. It is less important in Nigeria and Togo. As would be expected, cocoa prices are a major determinant of cocoa’s share of export earnings in Ghana and Côte d’Ivoire.
As can be surmised from the above, the Directive has had little impact on producers to date. We have calculated the impact (and potential impact) of the Directive under three scenarios.
― The base case scenario calculates the impact of the Directive on the market to date;
― Scenario 1 calculates what would have been the state of the market had the Directive not been implemented in 2003/04; and
― Scenario 2 calculates what would have been the impact of the Directive if it had been fully implemented in 2003/04, i.e., CBE usage in chocolate rose to 5% in the EU-8.
The forecast levels of prices under the different scenarios between 2003/04 and 2010/11 are shown in Table 8.2.
Table 8.2: Forecast Global Cocoa Prices, 2003/04-2010/11 (Real US$ per tonne)
2003/04 2004/05 2005/06 2006/07 2007/08 2008/09 2009/10 2010/11
Base Case 1,431 1,419 1,439 1,554 1,649 1,604 1,559 1,531 Scenario 1 1,435 1,421 1,441 1,555 1,650 1,605 1,560 1,532 Scenario 2 1,311 1,344 1,384 1,521 1,625 1,561 1,514 1,490
Source: LMC.
Comparing the prices forecast under the base case scenario with those forecast under Scenario 1 suggests that the impact of not implementing the Directive in 2003/04 would have been modest i.e. a price difference of less than $5 per tonne.
Were the Directive to have been implemented fully in 2003/04, the results suggest that the price impact would have been more pronounced.
Vegetable Fat Producers
In terms of the total economy, the importance of the exotic fats is relatively small. However, in the regions where they are collected, they are very important for employment and income generation. In the case of shea, collection is primarily by women, while for illipe and the Indian exotics, collection is by tribal people living off non-timber forest products.
For sheanuts, demand is from both the local market and for export. The other exotics are primarily export orientated, the only exception being for sal when

CHAPTER 8: CONCLUSIONS AND RECOMMENDATIONS PAGE 105
© LMC International Ltd, 2006
production is higher than that which can be absorbed by the export market. In this case, the balance is used domestically.
For all the exotics, with the exception of kokum, there can be extreme fluctuations in production between years. This is due to the uncultivated nature of production.
There has been an increase in demand for exotics from the European CBE manufacturers: for shea since 2000, sal since 2003 and illipe in 2005.
Trends in prices follow the supply-demand balance of the individual crops, thus in years of high production there is a tendency for prices to fall and vice-versa.
For the Indian exotic fats and illipe, almost all processing occurs at origin and processed products are exported. This is not the case with sheanuts where the export is more of nuts than products.
Both shea and the Indian exotics remain underdeveloped in terms of their potential. In both cases, there is scope to increase collection and improve the quality of the product, although whether this occurs is partly dependent upon the price paid to collectors. In the case of shea, some governments have recognised the crop’s potential and are seeking to increase the development of the crop as part of a diversification strategy. For illipe, production potential is declining as palm oil development reduces the illipe forests.
Palm oil production has grown dramatically since the adoption of the Directive. However, the growth of CBE demand is small in relation to the total volumes of palm oil produced and marketed.
The increase in demand for these products, although beneficial for the sector, cannot be attributed to the Directive.
CONCLUSION
Our analysis suggests that the Directive has had very little impact on the global cocoa market as very few EU-15 chocolate manufacturers have incorporated CBEs into their recipes. The same is true of the vegetable fat producers, although increased demand for CBEs from outside of the EU-15 chocolate market has increased demand for their products. However, although the Directive was passed in 2000, it was only implemented in 2003. Hence the market has only had two years to adjust to the new realities.
On the basis of this evidence, there is no need to change the list of permitted fats and our recommendation is to maintain the list for a further period of time, until the impact of the use of vegetable fats other than cocoa butter on the economies of developing countries can be further assessed.
There are a number of additional considerations:
Two years is a very short time period for end users to make wholesale changes to recipes. A further review of the market in five to ten years time would be useful. This would allow time for manufacturers to work though the implications of the Directive and test consumer perceptions of products containing CBEs. As yet, this has not been possible, as no one has changed recipes.
The shortage of shea and sal during 2005/06 has reduced exotic availability and led to a run down in exotic fat stocks. This has increased exotic prices and placed

CHAPTER 8: CONCLUSIONS AND RECOMMENDATIONS PAGE 106
© LMC International Ltd, 2006
pressure on CBE manufacturers. This highlights the dangers of restricting the number of fats, as it reduces the scope for substitution. Any reduction in the list of permitted fats would create a worse situation.
With the global market for CBEs increasing and the variability of annual exotic fat production, in the longer term there is potential for a shortage of exotic fats. This suggests that in the longer term, consideration could be given to one or all of the following:
― Crop development for the permitted exotics. At present shea, sal and mango kernel are all underdeveloped wild crops. There is scope, in the longer term, to increase crop potential. For instance, in West Africa the local production of shea butter could be enhanced though the provision of basic hand expellers. This would reduce the time needed to produce local shea butter and increase processing efficiency. In both cases, the provision of nuts would increase: first, by allowing more time for nut collection; and, second, by reducing the quantity of nuts required to yield a certain volume of butter. Additionally it could be possible to reduce the gestation period for the trees. In the case of sal, the proportion of the crop collected is small in relation to total production.
― Expanding the list of permitted fats. However, the number of possible fats is limited, with aceituno oil probably the largest.