the impact of different packaging and storage time …
TRANSCRIPT
1
THE IMPACT OF DIFFERENT PACKAGING AND STORAGE TIME ON PHISYCOCHEMICAL PROPERTIES AND
COLOR OF RED WINES
Nebojša Kojić*1
, Lidija Jakobek2
Address(es): BSc. Nebojša Kojić, 1Vupik plus d.o.o., Food Industry, Sajmište 113c, HR-32000 Vukovar, Croatia, +385 99 827 31 82 2Josip Juraj Strossmayer University of Osijek, Faculty of Food Technology Osijek, Department of Applied Chemistry and Instrumental Methods, F. Kuhača 20, HR-
31000 Osijek, Croatia.
*Corresponding author: [email protected] ABSTRACT
Keywords: packaging, phisyco-chemical properties, oxygen, color
INTRODUCTION
Packaging of wine is an important factor for wine quality evolution. Usually wine is packed in glass containers but in recent years PET containers (polyethylene
terephthalate) have become an option for packaging. They can be produced as
single-layer or multi-layer containers (Ghidossi et al., 2012). Other packagings of wine include bag-in-box or multilayer packaging. Bag-in-box packaging
consists of a bag (single or multilayer) and an outer box or a container
(Robertson, 1993). A multilayer packaging consists of several layers, usually plastic, aluminum foil and paper. One of the main characteristics of packaging
that affects the quality of wine is the transfer of gases through the packaging
material (Ghidossi et al., 2012). Gases can permeate through the packaging material or the closure and affect the wine characteristics (Lopes et al., 2009;
Dimkou et al., 2011; Hopfer et al., 2012; Toussaint et al., 2014).
Storage time also affects wine evolution and quality. For example, the storage time affects the evolution of phenolic compounds (Monagas et al., 2005),
oxygen amount dissolved in wine, SO2 amount (Dimkou et al., 2011; Ghidossi
et al., 2012; Gambuti et al., 2013; Toussaint et al., 2014), sensory characteristics and color (Skouroumounis et al., 2005; Caillé et al., 2010). One
of the main parameters that connects the influence of packaging type and storage
time on the wine evolution, is the oxygen content in wine. Namely, oxygen can be present in wine as dissolved oxygen or in the headspace
of the packaging container but it can also permeate into the package through the
packaging material or the closure. Once inside the package (in the wine), oxygen can cause an oxidation reaction that affects SO2 decrease in wine (Dimkou et al.,
2011; Ghidossi et al., 2012), phenolic compound evolution (Gambuti et al.,
2013), and color change or other sensory property changes (Skouroumounis et
al., 2005; Lopes et al. 2009; Caillé et al., 2010; Dimkou et al., 2011; Ghidossi
et al., 2012). All of these changes are time dependent. Therefore, packaging and storage time are important factors controlling the O2 amount after bottling, and
consequently the wine quality evolution. Furthermore, the influence of oxygen on
the quality of wine can depend on the storage temperature. Wine is usually stored in wine cellars at 10 to 14 °C. But in stores, the storage temperature can be
higher. The conditions of temperature can also influence the amount of oxygen in
the wine and by that the changes in wine during storage. The influence of oxygen on the wine quality and the influence of packaging and storage time are still not
completely understood.
The aim of this work was to study the influence of packaging (glass bottles, PET bottles and multilayer containers), and storage (0, 3, 6, 9 and 12 months, room
temperature 25 °C) on wine characteristics (wine specific weight, distillate
specific weight, alcohol percentage, total dry extract, total acids, volatile acids,
free and total SO2) and color. The study was conducted on four red wines
(Cabernet Sauvignon, Frankovka, Merlot, and Pinot noir). Oxygen was measured during the whole storage period.
MATERIAL AND METHODS
Samples
Grapes from Vitis vinifera L. (Cabernet sauvignon, Frankovka, Merlot and Pinot
noir) were cultivated in a vineyard in Baranja County, Croatia. After producing
the wine from a 2018 vintage in a winery, wines were packed in glass bottles (Versus, PP neck - Vetropack, Croatia), polyethylene terephthalate bottles (PCO
28, transparent - Keples, Croatia) and multilayer packaging (multilayer
paperboard with metallocene PE resin and aluminium foil (> 99 % aluminium) - SIG Combibloc, Switzerland). The volume was 0.5 L for all packages. Wine was
stored at a controlled room temperature 25 °C, and analyzed at the time of
packaging and after 3, 6, 9 and 12 months of storage. At each time period, new packages were opened for the analysis.
Physico-chemical properties
All analyses of the physico-chemical properties of wine were performed
according to standard procedures of the International Organization of Vine and Wine (OIV, 2019). Alcohol in wine was determined by using OIV-MA-AS312-
01B. Total acidity (as tartaric acid) was determined by the neutralization method
with 0.1 M NaOH and a bromothymol blue as an indicator. Volatile acids were determined by using OIV-MA-AS313-02. Specific weights were determined by
using OIV-MA-AS2-01A. Free and total sulfur dioxide in wine were determined by using the iodometric method by Ripper. Total dry extract was determined by
using OIV-MA-AS2-03B. These methods were already described earlier (Kojić
and Jakobek, 2019).
Dissolved oxygen measurement
Determination of dissolved oxygen was carried out using an oximeter
(AL20OXY, Aqualytic, Germany). The wine was poured into a laboratory glass,
placed on a magnetic stirrer and mixed. The oximeter electrode was calibrated according to the oxygen content of the air. Electrode was then, immersed into the
wine and the dissolved oxygen amount (mg/L) was measured.
Packaging and storage time are very important factors that can significantly affect the physicochemical properties of wine and wine
quality. The aim of this study was to investigate physicochemical properties and color of wine packed in three different packaging
materials (glass, PET (polyethylene terephthalate) and multilayer containers), during the storage period of one year (3, 6, 9 and 12
months). The results showed that during the period of one year, total SO2, free SO2 and oxygen amount decreased, while other properties
of wine were constant. Color changed during one year of storage too (yellow color, color intensity and hue increased, while red and blue
percentage decreased). In glass and PET containers those changes were less pronounced.
ARTICLE INFO
Received 24. 4. 2020
Revised 9. 12. 2020
Accepted 17. 12. 2020
Published 1. 6. 2021
Regular article
https://doi.org/10.15414/jmbfs.3036

J Microbiol Biotech Food Sci / Kojić and Jakobek et al. 2021 : 10 (6) e3036
2
Color measurement
Measurements were carried out on a UV-VIS spectrophotometer (Perkin Elmer,
Lambda 2, Germany) in a 1 cm thick quartz cuvette versus distilled water as a blank. Using absorbance values at 420, 520 and 620 nm, five chromatic
parameters were calculated according to the Glories method (Glories, 1984).
These parameters were color intensity (CI), hue (H), percentage of yellow (Yellow %), percentage of red (Red %), percentage of blue (Blue %). These five
chromatic parameters were calculated according to
CI = (Abs420 + Abs520 + A620) H = Abs420/Abs520
Yellow% = (Abs420/CI) x 100% Red% = (Abs520/CI) x 100%
Blue% = (Abs620/CI) x 100%
Statistical analyses
All results for the physico-chemical parameters and color were analyzed with multiple regression with main effects and two variable interactions using Minitab
software (Minitab LLC., State College, PA, USA). The three variables from
which regression terms were constructed are type of packaging, time of storage, and type of wine. Contrasts in the variables were defined for the regression to
facilitate comparisons, and were typically arranged to be orthogonal contrasts to
facilitate the identification of the subset of strongly significant terms (p < 0.001). Some three variable interactions were introduced when called for by residual
analysis, so that no residuals had standardized values larger than 3. The purpose
was to find statistically significant differences between wine characteristics and to create a model with fitted values and standard errors (SE) for each wine
characteristic measurement.
RESULTS AND DISCUSSION
The changes in the chemical composition of wine depend on the storage time but also on the packaging material. Because of such changes in the first several
months, wines are often packed and stored for a time period of approximately one
year (Hopfer et al., 2012). Various wine characteristics may quantify these changes across time, including numerous physicochemical parameters like
alcohol percentage, specific weight of wine and distillate, amounts of acids or SO2, and color of wine. In this study four different wines were packed in three
different packaging materials during one year and physicochemical parameters
were analysed every three months to see the changes in those changes during time and the possible influence of packaging material on those changes. The
results for the physicochemical properties of analyzed wines (Cabernet
sauvignon, Frankovka, Merlot, Pinot noir) during storage time of 3, 6, 9 and 12 months were shown in table 1 and figures 1 to 4. The values for specific wine
weight (0.99310 – 0.99500), specific distillate weight (0.98000 – 0.98375),
alcohol percentage (12.59 – 15.65), total dry extract (28.7 – 36.7 g/L), total acids (4.94 – 6.75 g/L), volatile acids (0.43 – 0.76 g/L), free SO2 (7.9 – 41 mg/L) and
total SO2 (13.0 – 102 mg/L) were in accordance with data from literature
(Dimkou et al., 2011; Ghidossi et al., 2012; Hopfer et al., 2012) and with our earlier study (Kojić and Jakobek, 2019).
Table 1 Physico-chemical properties of wine during 12 months of storage at 25 °C
Time
(months)
Cabernet sauvignon Frankovka Merlot Pinot noir
Glass PET Multilayer Glass PET Multilayer Glass PET Multilayer Glass PET Multilayer
Specific weight of wine
0 0.99410 0.99410 0.99410 0.99435 0.99435 0.99435 0.99460 0.99460 0.99460 0.99375 0.99375 0.99375
3 0.99415 0.99410 0.99430 0.99415 0.99410 0.99430 0.99480 0.99440 0.99445 0.99355 0.99350 0.99375
6 0.99430 0.99425 0.99470 0.99425 0.99405 0.99500 0.99470 0.99395 0.99310 0.99390 0.99360 0.99430
9 0.99425 0.99420 0.99485 0.99415 0.99420 0.99445 0.99430 0.99370 0.99345 0.99350 0.99340 0.99405
12 0.99410 0.99405 0.99490 0.99455 0.99405 0.99450 0.99470 0.99355 0.99355 0.99385 0.99350 0.99435
Specific weight of distillate
0 0.98060 0.98060 0.98060 0.98300 0.98300 0.98300 0.98140 0.98140 0.98140 0.98165 0.98165 0.98165
3 0.98055 0.98050 0.98040 0.98295 0.98275 0.98295 0.98120 0.98115 0.98125 0.98155 0.98150 0.98150
6 0.98065 0.98020 0.98095 0.98280 0.98260 0.98375 0.98095 0.98065 0.98140 0.98185 0.98125 0.98205
9 0.98060 0.98000 0.98110 0.98280 0.98240 0.98295 0.98060 0.98045 0.98170 0.98145 0.98140 0.98190
12 0.98085 0.98000 0.98105 0.98345 0.98240 0.98300 0.98090 0.98030 0.98205 0.98180 0.98145 0.98230
Alcohol (% vol.)
0 15.11 15.11 15.11 12.97 12.97 12.97 14.40 14.40 14.40 14.15 14.15 14.15
3 15.15 15.20 15.30 13.00 13.08 13.00 14.59 14.61 14.52 14.22 14.24 14.25
6 15.05 15.48 14.80 13.13 13.30 12.32 14.79 15.07 14.39 13.99 14.50 13.77
9 15.11 15.60 14.64 13.15 13.52 13.03 15.10 15.21 14.11 14.32 14.38 13.95
12 14.87 15.65 14.70 12.59 13.45 12.98 14.81 15.38 13.76 14.02 14.33 13.56
Total dry extract (g/L)
0 34.9 34.9 34.9 29.3 29.3 29.3 34.1 34.1 34.1 31.2 31.2 31.2
3 35.1 35.1 35.9 28.9 29.3 29.3 35.1 34.2 34.1 31.0 31.0 31.6
6 35.2 36.3 35.5 29.5 29.5 29.0 35.5 34.3 30.2 31.1 31.9 31.6
9 35.2 36.7 35.5 29.3 30.5 29.7 35.4 34.2 30.3 31.1 31.0 31.4
12 34.2 36.3 35.7 28.7 30.1 29.7 35.6 34.2 29.7 31.1 31.1 31.1
Some physicochemical parameters of wine, like specific weight of wine, specific
weight of distillate, alcohol percentage and dry extract were fairly stable during
the period of storage of one year in different packaging (Table 1). Nevertheless, with statistical regression analysis, some statistically significant differences in
these characteristics with time became visible (Table S1). Namely, specific
weight of wine showed statistically significant difference over time in wines packed in multilayer and PET packaging. Specific weight of distillate and alcohol
percentage were significantly different in wines packed in PET and multilayer
packaging. Percentage of dry extract was significantly different in multilayer packaging after 6 months of storage. According to these results, glass bottles can
be suggested as a good packaging for wine comparing to multilayer and PET
containers, since no significant differences were shown in specific weight of wine, specific weight of distillate, alcohol percentage and dry extract in wines
packed in glass bottles. However, it should be mentioned that all of wine
parameters showed small differences. So, even though the statistical analysis
pointed to some differences in physico-chemical parameters in wines packed in
different packaging, those differences are not big. After creating regression
models with the selected significant terms, the fitted values of the measured characteristics and their standard errors were also determined and shown (Table
2).
The amount of total and volatile acids in wines packed in different packaging during one year was similar (Figures 1 and 2). Again, with statistical regression
analysis, some differences can be quantified (Table S1). Statistically significant
differences were found for the change of volatile acid amount in time for wines packed in multilayer packaging (Table S1). Accordingly, it can be suggested that
glass and PET packaging preserved total and volatile acids better than multilayer
container. Fitted values of these parameters with their standard errors were shown in table 2.

J Microbiol Biotech Food Sci / Kojić and Jakobek et al. 2021 : 10 (6) e3036
3
Figure 1 Total acids amount during storage of 12 months at 25 °C
Figure 2 Volatile acids amount during storage of 12 months at 25 °C
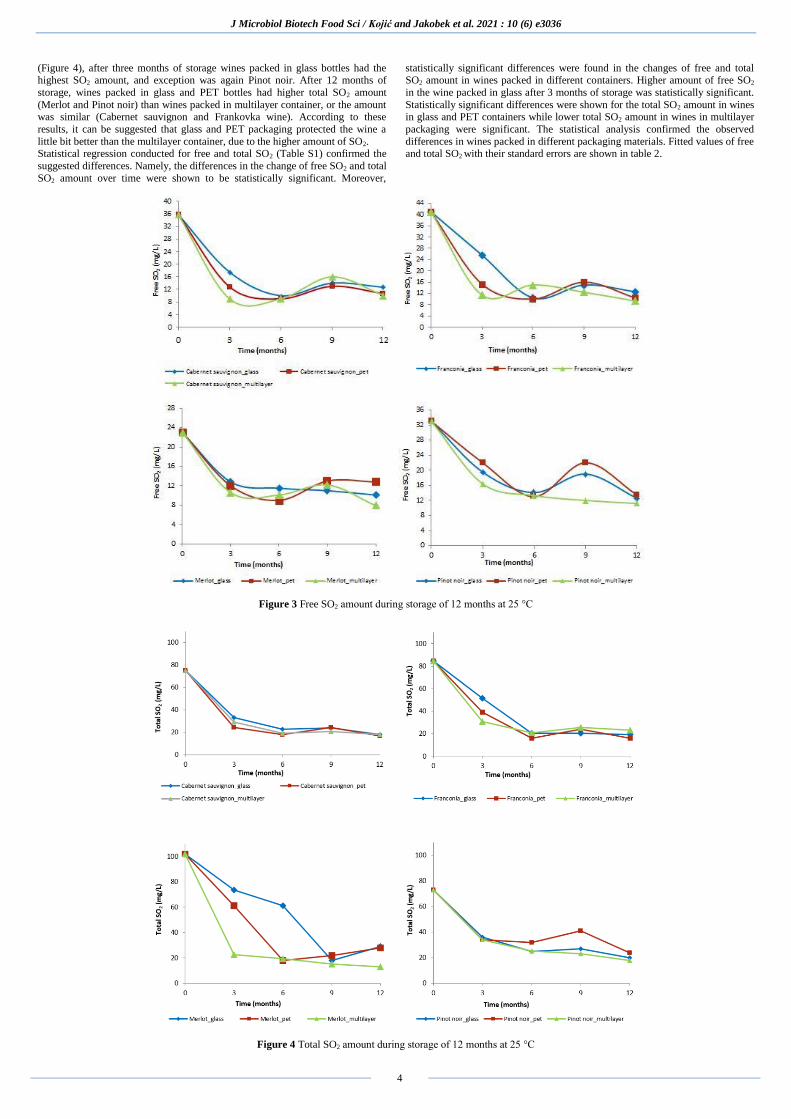
Some differences can be seen in the free and total SO2 amount in dependence
with time (Figures 3 and 4). Namely, the free and total SO2 were decreasing with
time which is in accordance with earlier studies (Dimkou et al., 2011; Ghidossi
et al., 2012). The central role played by SO2 is the consumption of oxygen. The
decrease of SO2 concentration suggests that O2 is consumed and by that decreases
the amount of SO2. Moreover, some differences in the free and total SO2 amount
can also be seen in wines packed in different packaging. In the case of free SO2
(Figure 3), after three months of storage, wines packed in glass bottles contained
the highest free SO2 amount, except Pinot noir. After 12 months of storage, higher free SO2 was found in wines packed in glass bottles (Cabernet sauvignon
and Frankovka wine) or in PET bottles (Merlot, Pinot noir). In addition, free SO2
was the lowest in wines packed in multilayer containers. In the case of total SO2
J Microbiol Biotech Food Sci / Kojić and Jakobek et al. 2021 : 10 (6) e3036
4
(Figure 4), after three months of storage wines packed in glass bottles had the highest SO2 amount, and exception was again Pinot noir. After 12 months of
storage, wines packed in glass and PET bottles had higher total SO2 amount
(Merlot and Pinot noir) than wines packed in multilayer container, or the amount was similar (Cabernet sauvignon and Frankovka wine). According to these
results, it can be suggested that glass and PET packaging protected the wine a
little bit better than the multilayer container, due to the higher amount of SO2. Statistical regression conducted for free and total SO2 (Table S1) confirmed the
suggested differences. Namely, the differences in the change of free SO2 and total
SO2 amount over time were shown to be statistically significant. Moreover,
statistically significant differences were found in the changes of free and total SO2 amount in wines packed in different containers. Higher amount of free SO2
in the wine packed in glass after 3 months of storage was statistically significant.
Statistically significant differences were shown for the total SO2 amount in wines in glass and PET containers while lower total SO2 amount in wines in multilayer
packaging were significant. The statistical analysis confirmed the observed
differences in wines packed in different packaging materials. Fitted values of free and total SO2 with their standard errors are shown in table 2.
Figure 3 Free SO2 amount during storage of 12 months at 25 °C
Figure 4 Total SO2 amount during storage of 12 months at 25 °C

J Microbiol Biotech Food Sci / Kojić and Jakobek et al. 2021 : 10 (6) e3036
5
Table 2 Fited values of physico-chemical parameters and their standard errors (SE) obtained by using multiple regression and two variable interactions Time
(months) Cabernet sauvignon Frankovka Merlot Pinot noir
Glass PET Multilaye
r Glass PET Multilayer Glass PET Multilayer Glass PET Multilayer
Specific weight of wine
0 0.994228
(0.000035)
0.994228
(0.000035)
0.994228
(0.000035)
0.994228
(0.000035)
0.994228
(0.000035)
0.994228
(0.000035)
0.994690
(0.000062)
0.994690
(0.000062)
0.994690
(0.000062)
0.993765
(0.000053)
0.993765
(0.000053)
0.993765
(0.000053)
3 0.994228
(0.000035)
0.994141
(0.000032)
0.994374
(0.000032)
0.994228
(0.000035)
0.994141
(0.000032)
0.994374
(0.000032)
0.994565
(0.000051)
0.994478
(0.000048)
0.994711
(0.000051)
0.993765
(0.000053)
0.993678
(0.000049)
0.993911
(0.000048)
6 0.994228
(0.000035)
0.994054
(0.000042)
0.994520
(0.000043)
0.994228
(0.000035)
0.994054
(0.000042)
0.994520
(0.000043)
0.994439
(0.000058)
0.994265
(0.000056)
0.993346
(0.000118)
0.993765
(0.000053)
0.993591
(0.000053)
0.994057
(0.000054)
9 0.994228
(0.000035)
0.993967
(0.000058)
0.994666
(0.000062)
0.994228
(0.000035)
0.993967
(0.000058)
0.994666
(0.000062)
0.994313
(0.000079)
0.994052
(0.000080)
0.993367
(0.000111)
0.993765
(0.000053)
0.993504
(0.000065)
0.994203
(0.000068)
12 0.994228
(0.000035)
0.993880
(0.000077)
0.994812
(0.000083)
0.994228
(0.000035)
0.993880
(0.000077)
0.994812
(0.000083)
0.994187
(0.000107)
0.993839
(0.000110)
0.993387
(0.000118)
0.993765
(0.000053)
0.993417
(0.000081)
0.994349
(0.000085)
Specific weight of distillate
0 0.980577
(0.000048)
0.980577
(0.000081)
0.980577
(0.000081)
0.982920
(0.000048)
0.982920
(0.000081)
0.982920
(0.000081)
0.981366
(0.000035)
0.981366
(0.000074)
0.981366
(0.000074)
0.981366
(0.000035)
0.981366
(0.000074)
0.981366
(0.000074)
3 0.980577
(0.000048)
0.980552
(0.000081)
0.980602
(0.000081)
0.982920
(0.000048)
0.982895
(0.000081)
0.982945
0.000081)
0.981235
(0.000038)
0.981210
(0.000076)
0.981260
(0.000076)
0.981497
(0.000037)
0.981472
(0.000075)
0.981522
(0.000075)
6 0.980577
(0.000048)
0.980147
(0.000062)
0.981007
(0.000062)
0.982920
(0.000048)
0.982490
(0.000062)
0.983350
(0.000062)
0.981104
(0.000047)
0.980674
(0.000058)
0.981534
(0.000063)
0.981628
(0.000044)
0.981197
(0.000059)
0.982058
(0.000058)
9 0.980577
(0.000048)
0.980147
(0.000062)
0.981007
(0.000062)
0.982920
(0.000048)
0.982490
(0.000062)
0.983350
(0.000062)
0.980973
(0.000057)
0.980543
(0.000067)
0.981403
(0.000072)
0.981758
(0.000054)
0.981328
(0.000068)
0.982189
(0.000066)
12 0.980577
(0.000048)
0.980147
(0.000062)
0.981007
(0.000062)
0.982920
(0.000048)
0.982490
(0.000062)
0.983350
(0.000062)
0.980842
(0.000070)
0.980412
(0.000077)
0.982050
(0.000186)
0.981889
(0.000066)
0.981459
(0.000078)
0.982319
(0.000075)
Alcohol (% vol.)
0 15.1253
(0.0430)
15.1253
(0.0729)
15.1253
(0.0729)
13.0307
(0.0430)
13.0307
(0.0729)
13.0307
(0.0729)
14.4089
(0.0310)
14.4089
(0.0665)
14.4089
(0.0665)
14.4089
(0.0310)
14.4089
(0.0665)
14.4089
(0.0665)
3 15.1253
(0.0430)
15.1328
(0.0729)
15.1178
(0.0729)
13.0307
(0.0430)
13.0382
(0.0729)
13.0232
(0.0729)
14.5280
(0.0343)
14.5355
(0.0681)
14.5205
(0.0681)
14.2897
(0.0329)
14.2972
(0.0674)
14.2822
(0.0674)
6 15.1253
(0.0430)
15.5051
(0.0553)
14.7456
(0.0553)
13.0307
(0.0430)
13.4104
(0.0553)
12.6509
(0.0553)
14.6471
(0.0417)
15.0269
(0.0523)
14.2673
(0.0563)
14.1706
(0.0393)
14.5504
(0.0528)
13.7908
(0.0522)
9 15.1253
(0.0430)
15.5051
(0.0553)
14.7456
(0.0553)
13.0307
(0.0430)
13.4104
(0.0553)
12.6509
(0.0553)
14.7662
(0.0514)
15.1460
(0.0598)
14.3865
(0.0642)
14.0515
(0.0484)
14.4312
(0.0604)
13.6717
(0.0589)
12 15.1253
(0.0430)
15.5051
(0.0553)
14.7456
(0.0553)
13.0307
(0.0430)
13.4104
(0.0553)
12.6509
(0.0553)
14.8853
(0.0623)
15.2651
(0.0690)
13.7600
(0.1664)
13.9324
(0.0591)
14.3121
(0.0697)
13.5526
(0.0674)
Total dry extract (g/L)
0 35.427
(0.132)
35.427
(0.132)
35.427
(0.132)
29.427
(0.132)
29.427
(0.132)
29.427
(0.132)
34.575
(0.148)
34.575
(0.148)
34.575
(0.148)
31.240
(0.132)
31.240
(0.132)
31.240
(0.132)
3 35.427
(0.132)
35.427
(0.132)
35.427
(0.132)
29.427
(0.132)
29.427
(0.132)
29.427
(0.132)
34.575
(0.148)
34.575
(0.148)
34.575
(0.148)
31.240
(0.132)
31.240
(0.132)
31.240
(0.132)
6 35.427
(0.132)
35.427
(0.132)
35.427
(0.132)
29.427
(0.132)
29.427
(0.132)
29.427
(0.132)
34.575
(0.148)
34.575
(0.148)
30.067
(0.296)
31.240
(0.132)
31.240
(0.132)
31.240
(0.132)
9 35.427
(0.132)
35.427
(0.132)
35.427
(0.132)
29.427
(0.132)
29.427
(0.132)
29.427
(0.132)
34.575
(0.148)
34.575
(0.148)
30.067
(0.296)
31.240
(0.132)
31.240
(0.132)
31.240
(0.132)
12 35.427
(0.132)
35.427
(0.132)
35.427
(0.132)
29.427
(0.132)
29.427
(0.132)
29.427
(0.132)
34.575
(0.148)
34.575
(0.148)
30.067
(0.296)
31.240
(0.132)
31.240
(0.132)
31.240
(0.132)
Total acid (g/L)
0 5.7937
(0.0212)
5.7937
(0.0212)
5.7937
(0.0212)
6.4121
(0.0406)
6.4121
(0.0406)
6.4121
(0.0406)
5.7754
(0.0406)
5.7754
(0.0406)
5.7754
(0.0406)
5.1934
(0.0406)
5.1934
(0.0406)
5.1934
(0.0406)
3 5.7937
(0.0212)
5.7937
(0.0212)
5.7937
(0.0212)
6.4121
(0.0406)
6.4121
(0.0406)
6.4121
(0.0406)
5.7754
(0.0406)
5.7754
(0.0406)
5.7754
(0.0406)
5.1934
(0.0406)
5.1934
(0.0406)
5.1934
(0.0406)
6 5.7937
(0.0212)
5.7937
(0.0212)
5.7937
(0.0212)
6.4121
(0.0406)
6.4121
(0.0406)
6.4121
(0.0406)
5.7754
(0.0406)
5.7754
(0.0406)
5.7754
(0.0406)
5.1934
(0.0406)
5.1934
(0.0406)
5.1934
(0.0406)
9 5.7937
(0.0212)
5.7937
(0.0212)
5.7937
(0.0212)
6.4121
(0.0406)
6.4121
(0.0406)
6.4121
(0.0406)
5.7754
(0.0406)
5.7754
(0.0406)
5.7754
(0.0406)
5.1934
(0.0406)
5.1934
(0.0406)
5.1934
(0.0406)
12 5.7937
(0.0212)
5.7937
(0.0212)
5.7937
(0.0212)
6.4121
(0.0406)
6.4121
(0.0406)
6.4121
(0.0406)
5.7754
(0.0406)
5.7754
(0.0406)
5.7754
(0.0406)
5.1934
(0.0406)
5.1934
(0.0406)
5.1934
(0.0406)
Volatile acid (g/L)
0 0.6714
(0.0128)
0.6714
(0.0128)
0.6714
(0.0128)
0.4360
(0.0214)
0.4360
(0.0214)
0.4360
(0.0214)
0.5244
(0.0094)
0.5244
(0.0094)
0.5244
(0.0094)
0.5244
(0.0094)
0.5244
(0.0094)
0.5244
(0.0094)
3 0.6714
(0.0128)
0.6714
(0.0128)
0.6903
(0.0125)
0.4690
(0.0153)
0.4690
(0.0153)
0.4879
(0.0155)
0.5244
(0.0094)
0.5244
(0.0094)
0.5433
(0.0089)
0.5244
(0.0094)
0.5244
(0.0094)
0.5433
(0.0089)
6 0.6714
(0.0128)
0.6714
(0.0128)
0.7092
(0.0141)
0.5021
(0.0128)
0.5021
(0.0128)
0.5399
(0.0141)
0.5244
(0.0094)
0.5244
(0.0094)
0.5622
(0.0110)
0.5244
(0.0094)
0.5244
(0.0094)
0.5622
(0.0110)
9 0.6714
(0.0128)
0.6714
(0.0128)
0.7281
(0.0171)
0.5351
(0.0160)
0.5351
(0.0160)
0.5918
(0.0182)
0.5244
(0.0094)
0.5244
(0.0094)
0.5811
(0.0147)
0.5244
(0.0094)
0.5244
(0.0094)
0.5811
(0.0147)
12 0.6714
(0.0128)
0.6714
(0.0128)
0.7470
(0.0209)
0.5681
(0.0225)
0.5681
(0.0225)
0.6437
(0.0253)
0.5244
(0.0094)
0.5244
(0.0094)
0.6000
(0.0190)
0.5244
(0.0094)
0.5244
(0.0094)
0.6000
(0.0190)
Free SO2 (mg/L)
0 33.18
(0.83)
12.80
(0.42)
12.80
(0.42)
25.60
(2.86)
10.93
(0.52)
10.93
(0.52)
10.88 (0.68) 10.88
(0.68)
10.88
(0.68)
16.58
(0.68)
32.29
(1.15)
32.29
(1.15)
3 12.80
(0.42)
12.80
(0.42)
12.80
(0.42)
10.93
(0.52)
10.93
(0.52)
10.93
(0.52)
10.88 (0.68) 10.88
(0.68)
10.88
(0.68)
16.58
(0.68)
16.58
(0.68)
16.58
(0.68)
6 12.80
(0.42)
12.80
(0.42)
12.80
(0.42)
10.93
(0.52)
10.93
(0.52)
10.93
(0.52)
10.88 (0.68) 10.88
(0.68)
10.88
(0.68)
16.58
(0.68)
16.58
(0.68)
16.58
(0.68)
9 12.80
(0.42)
12.80
(0.42)
12.80
(0.42)
10.93
(0.52)
10.93
(0.52)
10.93
(0.52)
10.88 (0.68) 10.88
(0.68)
10.88
(0.68)
16.58
(0.68)
16.58
(0.68)
16.58
(0.68)
12 33.18
(0.83)
33.18
(0.83)
40.64
(1.47)
40.64
(1.47)
40.64
(1.47)
26.59
(1.15)
26.59 (1.15) 26.59
(1.15)
32.29
(1.15)
32.29
(1.15)
16.58
(0.68)
16.58
(0.68)
Total SO2 (mg/L)
0 78.30
(1.54)
78.30
(1.54)
78.30
(1.54)
85.50
(1.25)
85.50
(1.25)
85.50
(1.25)
100.00 (2.12) 100.00
(2.12)
100.00
(2.12)
71.00
(2.12)
71.00
(2.12)
71.00
(2.12)
3 28.15
(2.37)
28.15
(2.37)
28.15
(2.37)
49.66
(1.59)
49.66
(1.59)
30.70
(4.19)
65.73 (2.67) 65.73
(2.67)
22.60
(4.19)
33.59
(2.26)
33.59
(2.26)
33.59
(2.26)
6 19.51
(1.31)
19.51
(1.31)
19.51
(1.31)
21.94
(0.82)
21.94
(0.82)
21.94
(0.82)
61.00 (4.19) 19.93
(1.33)
19.93
(1.33)
23.94
(1.33)
23.94
(1.33)
23.94
(1.33)
9 19.51
(1.31)
19.51
(1.31)
19.51
(1.31)
21.94
(0.82)
21.94
(0.82)
21.94
(0.82)
19.93 (1.33) 19.93
(1.33)
19.93
(1.33)
23.94
(1.33)
41.00
(4.19)
23.94
(1.33)
12 19.51
(1.31)
19.51
(1.31)
19.51
(1.31)
21.94
(0.82)
21.94
(0.82)
21.94
(0.82)
19.93 (1.33) 19.93
(1.33)
19.93
(1.33)
23.94
(1.33)
23.94
(1.33)
23.94
(1.33)
Oxygen (mg/L)
0 9.016
(0.196)
8.501
(0.178)
8.501
(0.178)
9.016
(0.196)
8.501
(0.178)
8.501
(0.178)
6.865 (0.311) 6.350
(0.300)
6.350
(0.300)
9.437
(0.218)
8.922
(0.202)
8.922
(0.202)
3 2.326
(0.124)
1.811
(0.092)
1.811
(0.092)
2.326
(0.124)
1.811
(0.092)
1.811
(0.092)
2.337 (0.166) 1.822
(0.144)
1.822
(0.144)
2.747
(0.157)
2.232
(0.133)
2.232
(0.133)

J Microbiol Biotech Food Sci / Kojić and Jakobek et al. 2021 : 10 (6) e3036
6
6 2.326
(0.124)
1.811
(0.092)
1.811
(0.092)
2.326
(0.124)
1.811
(0.092)
1.811
(0.092)
2.337 (0.166) 1.822
(0.144)
1.822
(0.144)
2.747
(0.157)
2.232
(0.133)
2.232
(0.133)
9 2.326
(0.124)
1.811
(0.092)
1.811
(0.092)
2.326
(0.124)
1.811
(0.092)
1.811
(0.092)
2.337 (0.166) 1.822
(0.144)
1.822
(0.144)
2.747
(0.157)
2.232
(0.133)
2.232
(0.133)
12 2.326
(0.124)
1.811
(0.092)
1.811
(0.092)
2.326
(0.124)
1.811
(0.092)
1.811
(0.092)
2.337 (0.166) 1.822
(0.144)
1.822
(0.144)
2.747
(0.157)
2.232
(0.133)
2.232
(0.133)
The oxygen amount in wine was shown in figure 5. The amount of dissolved
oxygen in wines (0.85 – 9.49 mg/L) was similar to amounts reported in the literature (Dimkou et al., 2011; Ghidossi et al., 2012). During storage, the
oxygen amount was decreasing in all studied wines and packaging. This is in
accordance with earlier studies (Vidal and Moutounet, 2006; Dimkou et al.,
2011). This also agrees with the SO2 decrease shown in figure 3 and 4.
Furthermore, oxygen decrease was mostly pronounced after 3 months of the
storage, and after that period the changes in oxygen amounts were slower. This is in accordance with some other studies where it was stated that the decrease in
oxygen amount was faster during the first months of storage (Dimkou et al.,
2011; Vidal and Moutounet, 2011; Toussaint et al., 2014). This suggests that at the beginning of the storage period, most of the oxygen was consumed and the
changes in wine were occurring. After that period, the oxygen consumption
becomes lower. Further changes can depend mostly on the packaging material. If the oxygen permeates through the package, the oxygen amount will slowly
increase and further changes in the wine will occur. In our study, further increase
of oxygen amount was somewhat higher for wines packed in glass (Cabernet sauvignon and Pinot noir, which might be due to closure, and not the glass
material), or it was similar for all packaging materials. After multiple regression
(Table S1) the statistically significant difference in oxygen amount during the storage period of one year was shown. The analysis also confirmed the
differences in the oxygen amount in wines packed in glass containers. Fitted
values of oxygen amounts together with standard errors was shown in table 2.
Figure 5 Oxygen concentration during storage of 12 months at 25 °C
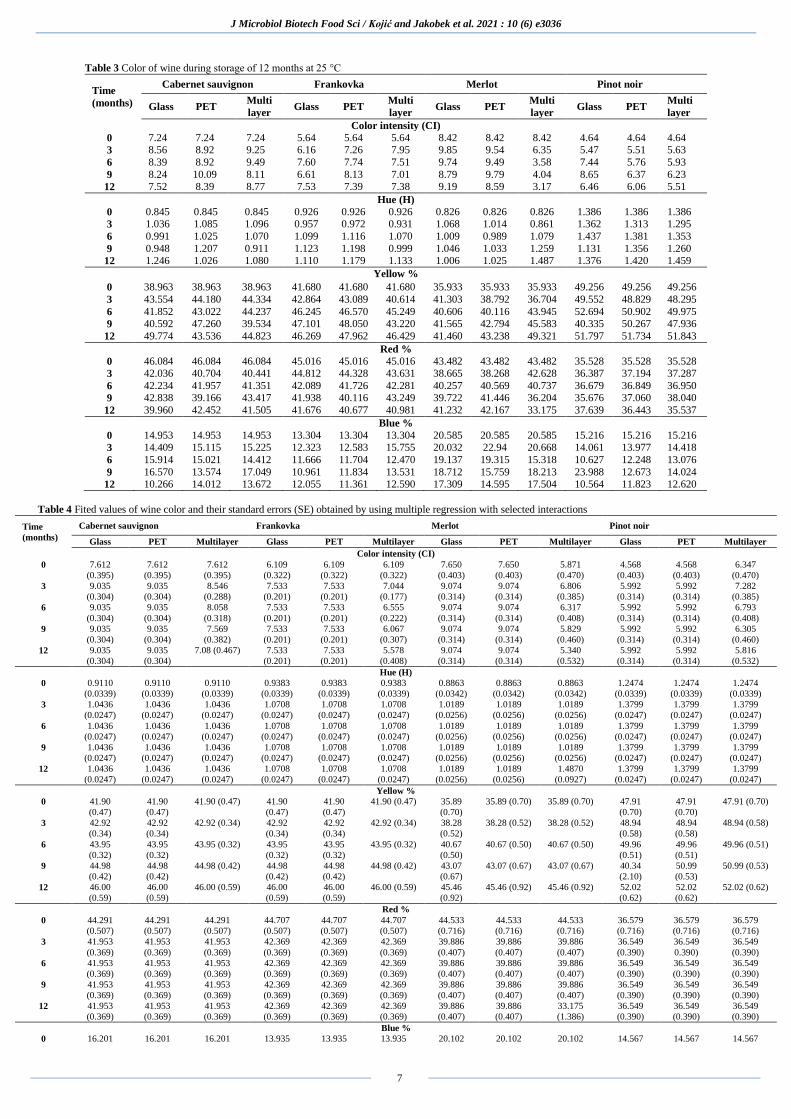
Table 3 showed the color of wine, its intensity, hue, percentage of yellow, red and blue color. The color intensity and hue were increasing during storage in all
packaging, the same as the yellow color percentage. But the percentage of red
and blue color were decreasing. Statistical analysis with multiple regression (Table S1) confirms that those characteristics change with time. Namely, the
increase in color intensity was statistically significant (only in Merlot packed in
multilayer container, a decrease was shown). The increase of hue and yellow percentage with time in all packaging was also statistically significant (the
biggest increase in these color parameters was shown for Merlot wine in
multilayer containers). The decrease in red and blue percentage were also statistically significant. Fitted values of color parameters together with standard
errors was showed in table 4.
Earlier studies also showed that the yellow color increases with storage (Lopes et
al., 2009; Hopfer et al., 2012). The increase in hue and decrease in red color
shown in our study was also shown in an earlier study (Lopes et al., 2009).
Measuring A at 420 nm (yellow color) is a helpful tool for the determination of wine development and the degree of oxidation (Lopes et al., 2009). Namely, the
increase in yellow color has been attributed to the formation of brown pigments
from the polymerization of flavanols and dimeric cyanidins (Francia-Aricha et
al. 1998; Drinkine et al. 2007). Similar reactions might have occurred in wines
in this study.
In general, oxygen is an important factor for the wine quality. It can be dissolved in the wine before bottling or it can come from the headspace of the container.
During storage, the oxygen amount decreases, because oxygen is consumed through oxidation reactions by various compounds (Dimkou et al., 2011;
Ghidossi et al., 2012). Oxidation processes can be seen through changes in wine,
such as changes in the wine color or SO2 decrease. Namely, the products of oxidation reactions can cause SO2 to decrease (Dimkou et al., 2011; Ghidossi et
al., 2012). The oxygen and free and total SO2 decrease was shown in our study in
all wines and packaging types, which suggests the oxidation processes occurred in wine during the storage period. Changes in wine color were also observed in
our study (color intensity, hue and yellow color increase, red and blue color
decrease) which also suggests that the oxidation reaction occurred in the wine during the storage.
There were some differences in physico-chemical parameters of wine packed in
different packaging materials. Namely, statistically significant changes in specific weight of wine and distillate, percentage of alcohol and total dry extract were
shown in wines packed in multilayer and PET containers but not in glass
packaging. Furthermore, the SO2 decrease, the changes of total and volatile acids were less pronounced in wines packed in glass and PET containers, in
comparison to multilayer containers. All of this makes glass and PET containers
a little bit better than multilayer packaging materials. It can be added that in all
wines, the SO2 was above 10 mg/L at the end of storage period, which suggests
that all three types of packaging could maintain the wine quality in a period of
one year.
J Microbiol Biotech Food Sci / Kojić and Jakobek et al. 2021 : 10 (6) e3036
7
Table 3 Color of wine during storage of 12 months at 25 °C
Time
(months)
Cabernet sauvignon Frankovka Merlot Pinot noir
Glass PET Multi
layer Glass PET
Multi
layer Glass PET
Multi
layer Glass PET
Multi
layer
Color intensity (CI)
0 7.24 7.24 7.24 5.64 5.64 5.64 8.42 8.42 8.42 4.64 4.64 4.64
3 8.56 8.92 9.25 6.16 7.26 7.95 9.85 9.54 6.35 5.47 5.51 5.63
6 8.39 8.92 9.49 7.60 7.74 7.51 9.74 9.49 3.58 7.44 5.76 5.93
9 8.24 10.09 8.11 6.61 8.13 7.01 8.79 9.79 4.04 8.65 6.37 6.23
12 7.52 8.39 8.77 7.53 7.39 7.38 9.19 8.59 3.17 6.46 6.06 5.51
Hue (H)
0 0.845 0.845 0.845 0.926 0.926 0.926 0.826 0.826 0.826 1.386 1.386 1.386
3 1.036 1.085 1.096 0.957 0.972 0.931 1.068 1.014 0.861 1.362 1.313 1.295
6 0.991 1.025 1.070 1.099 1.116 1.070 1.009 0.989 1.079 1.437 1.381 1.353
9 0.948 1.207 0.911 1.123 1.198 0.999 1.046 1.033 1.259 1.131 1.356 1.260
12 1.246 1.026 1.080 1.110 1.179 1.133 1.006 1.025 1.487 1.376 1.420 1.459
Yellow %
0 38.963 38.963 38.963 41.680 41.680 41.680 35.933 35.933 35.933 49.256 49.256 49.256
3 43.554 44.180 44.334 42.864 43.089 40.614 41.303 38.792 36.704 49.552 48.829 48.295
6 41.852 43.022 44.237 46.245 46.570 45.249 40.606 40.116 43.945 52.694 50.902 49.975
9 40.592 47.260 39.534 47.101 48.050 43.220 41.565 42.794 45.583 40.335 50.267 47.936
12 49.774 43.536 44.823 46.269 47.962 46.429 41.460 43.238 49.321 51.797 51.734 51.843
Red %
0 46.084 46.084 46.084 45.016 45.016 45.016 43.482 43.482 43.482 35.528 35.528 35.528
3 42.036 40.704 40.441 44.812 44.328 43.631 38.665 38.268 42.628 36.387 37.194 37.287
6 42.234 41.957 41.351 42.089 41.726 42.281 40.257 40.569 40.737 36.679 36.849 36.950
9 42.838 39.166 43.417 41.938 40.116 43.249 39.722 41.446 36.204 35.676 37.060 38.040
12 39.960 42.452 41.505 41.676 40.677 40.981 41.232 42.167 33.175 37.639 36.443 35.537
Blue %
0 14.953 14.953 14.953 13.304 13.304 13.304 20.585 20.585 20.585 15.216 15.216 15.216
3 14.409 15.115 15.225 12.323 12.583 15.755 20.032 22.94 20.668 14.061 13.977 14.418
6 15.914 15.021 14.412 11.666 11.704 12.470 19.137 19.315 15.318 10.627 12.248 13.076
9 16.570 13.574 17.049 10.961 11.834 13.531 18.712 15.759 18.213 23.988 12.673 14.024
12 10.266 14.012 13.672 12.055 11.361 12.590 17.309 14.595 17.504 10.564 11.823 12.620
Table 4 Fited values of wine color and their standard errors (SE) obtained by using multiple regression with selected interactions
Time
(months)
Cabernet sauvignon Frankovka Merlot Pinot noir
Glass PET Multilayer Glass PET Multilayer Glass PET Multilayer Glass PET Multilayer
Color intensity (CI)
0 7.612
(0.395)
7.612
(0.395)
7.612
(0.395)
6.109
(0.322)
6.109
(0.322)
6.109
(0.322)
7.650
(0.403)
7.650
(0.403)
5.871
(0.470)
4.568
(0.403)
4.568
(0.403)
6.347
(0.470)
3 9.035
(0.304)
9.035
(0.304)
8.546
(0.288)
7.533
(0.201)
7.533
(0.201)
7.044
(0.177)
9.074
(0.314)
9.074
(0.314)
6.806
(0.385)
5.992
(0.314)
5.992
(0.314)
7.282
(0.385)
6 9.035
(0.304)
9.035
(0.304)
8.058
(0.318)
7.533
(0.201)
7.533
(0.201)
6.555
(0.222)
9.074
(0.314)
9.074
(0.314)
6.317
(0.408)
5.992
(0.314)
5.992
(0.314)
6.793
(0.408)
9 9.035
(0.304)
9.035
(0.304)
7.569
(0.382)
7.533
(0.201)
7.533
(0.201)
6.067
(0.307)
9.074
(0.314)
9.074
(0.314)
5.829
(0.460)
5.992
(0.314)
5.992
(0.314)
6.305
(0.460)
12 9.035
(0.304)
9.035
(0.304)
7.08 (0.467) 7.533
(0.201)
7.533
(0.201)
5.578
(0.408)
9.074
(0.314)
9.074
(0.314)
5.340
(0.532)
5.992
(0.314)
5.992
(0.314)
5.816
(0.532)
Hue (H)
0 0.9110
(0.0339)
0.9110
(0.0339)
0.9110
(0.0339)
0.9383
(0.0339)
0.9383
(0.0339)
0.9383
(0.0339)
0.8863
(0.0342)
0.8863
(0.0342)
0.8863
(0.0342)
1.2474
(0.0339)
1.2474
(0.0339)
1.2474
(0.0339)
3 1.0436
(0.0247)
1.0436
(0.0247)
1.0436
(0.0247)
1.0708
(0.0247)
1.0708
(0.0247)
1.0708
(0.0247)
1.0189
(0.0256)
1.0189
(0.0256)
1.0189
(0.0256)
1.3799
(0.0247)
1.3799
(0.0247)
1.3799
(0.0247)
6 1.0436
(0.0247)
1.0436
(0.0247)
1.0436
(0.0247)
1.0708
(0.0247)
1.0708
(0.0247)
1.0708
(0.0247)
1.0189
(0.0256)
1.0189
(0.0256)
1.0189
(0.0256)
1.3799
(0.0247)
1.3799
(0.0247)
1.3799
(0.0247)
9 1.0436
(0.0247)
1.0436
(0.0247)
1.0436
(0.0247)
1.0708
(0.0247)
1.0708
(0.0247)
1.0708
(0.0247)
1.0189
(0.0256)
1.0189
(0.0256)
1.0189
(0.0256)
1.3799
(0.0247)
1.3799
(0.0247)
1.3799
(0.0247)
12 1.0436
(0.0247)
1.0436
(0.0247)
1.0436
(0.0247)
1.0708
(0.0247)
1.0708
(0.0247)
1.0708
(0.0247)
1.0189
(0.0256)
1.0189
(0.0256)
1.4870
(0.0927)
1.3799
(0.0247)
1.3799
(0.0247)
1.3799
(0.0247)
Yellow %
0 41.90
(0.47)
41.90
(0.47)
41.90 (0.47) 41.90
(0.47)
41.90
(0.47)
41.90 (0.47) 35.89
(0.70)
35.89 (0.70) 35.89 (0.70) 47.91
(0.70)
47.91
(0.70)
47.91 (0.70)
3 42.92
(0.34)
42.92
(0.34)
42.92 (0.34) 42.92
(0.34)
42.92
(0.34)
42.92 (0.34) 38.28
(0.52)
38.28 (0.52) 38.28 (0.52) 48.94
(0.58)
48.94
(0.58)
48.94 (0.58)
6 43.95
(0.32)
43.95
(0.32)
43.95 (0.32) 43.95
(0.32)
43.95
(0.32)
43.95 (0.32) 40.67
(0.50)
40.67 (0.50) 40.67 (0.50) 49.96
(0.51)
49.96
(0.51)
49.96 (0.51)
9 44.98
(0.42)
44.98
(0.42)
44.98 (0.42) 44.98
(0.42)
44.98
(0.42)
44.98 (0.42) 43.07
(0.67)
43.07 (0.67) 43.07 (0.67) 40.34
(2.10)
50.99
(0.53)
50.99 (0.53)
12 46.00
(0.59)
46.00
(0.59)
46.00 (0.59) 46.00
(0.59)
46.00
(0.59)
46.00 (0.59) 45.46
(0.92)
45.46 (0.92) 45.46 (0.92) 52.02
(0.62)
52.02
(0.62)
52.02 (0.62)
Red %
0 44.291
(0.507)
44.291
(0.507)
44.291
(0.507)
44.707
(0.507)
44.707
(0.507)
44.707
(0.507)
44.533
(0.716)
44.533
(0.716)
44.533
(0.716)
36.579
(0.716)
36.579
(0.716)
36.579
(0.716)
3 41.953
(0.369)
41.953
(0.369)
41.953
(0.369)
42.369
(0.369)
42.369
(0.369)
42.369
(0.369)
39.886
(0.407)
39.886
(0.407)
39.886
(0.407)
36.549
(0.390)
36.549
0.390)
36.549
(0.390)
6 41.953
(0.369)
41.953
(0.369)
41.953
(0.369)
42.369
(0.369)
42.369
(0.369)
42.369
(0.369)
39.886
(0.407)
39.886
(0.407)
39.886
(0.407)
36.549
(0.390)
36.549
(0.390)
36.549
(0.390)
9 41.953
(0.369)
41.953
(0.369)
41.953
(0.369)
42.369
(0.369)
42.369
(0.369)
42.369
(0.369)
39.886
(0.407)
39.886
(0.407)
39.886
(0.407)
36.549
(0.390)
36.549
(0.390)
36.549
(0.390)
12 41.953
(0.369)
41.953
(0.369)
41.953
(0.369)
42.369
(0.369)
42.369
(0.369)
42.369
(0.369)
39.886
(0.407)
39.886
(0.407)
33.175
(1.386)
36.549
(0.390)
36.549
(0.390)
36.549
(0.390)
Blue %
0 16.201 16.201 16.201 13.935 13.935 13.935 20.102 20.102 20.102 14.567 14.567 14.567

J Microbiol Biotech Food Sci / Kojić and Jakobek et al. 2021 : 10 (6) e3036
8
(0.307) (0.307) (0.307) (0.423) (0.423) (0.423) (0.423) (0.423) (0.423) (0.426) (0.426) (0.426)
3 15.503
(0.217)
15.503
(0.217)
15.503
(0.217)
13.237
(0.362)
13.237
(0.362)
13.237
(0.362)
19.404
(0.362)
19.404
(0.362)
19.404
(0.362)
13.869
(0.369)
13.869
(0.369)
13.869
(0.369)
6 14.806
(0.179)
14.806
(0.179)
14.806
(0.179
12.539
(0.339)
12.539
(0.339)
12.539
(0.339)
18.706
(0.339)
18.706
(0.339)
18.706
(0.339)
13.171
(0.350)
13.171
(0.350)
13.171
(0.350)
9 14.108
(0.220)
14.108
(0.220)
14.108
(0.220)
11.841
(0.362)
11.841
(0.362)
11.841
(0.362)
18.009
(0.362)
18.009
(0.362)
18.009
(0.362)
23.988
(1.372)
12.474
(0.375)
12.474
(0.375)
12 13.410
(0.310)
13.410
(0.310)
13.410
(0.310)
11.143
(0.422)
11.143
(0.422)
11.143
(0.422)
17.311
(0.422)
17.311
(0.422)
17.311
(0.422)
11.776
(0.436)
11.776
(0.436)
11.776
(0.436)
CONCLUSION
The results showed that the physicochemical properties of wine are influenced by
the storage time and packaging material. Namely, some small changes with time
in specific weight of wine and distillate, alcohol percentage and dry extract were shown. On the other hand, the concentration of sulfur dioxide and oxygen
decreased significantly over storage time. The color also showed statistically
significant change with storage time (the color intensity, hue and yellow percentage showed an increased with storage period, blue and red color, on the
other hand, decreased). This suggests the oxidation processes occurred in wine
during the storage period. Changes in wine parameters with packaging type were
also shown. The specific weight of wine and distillate, alcohol percentage, and
total dry extract showed small changes in wines packed in PET and multilayer
containers but not in glass bottles. The SO2 amount decrease was lower in wines packed in glass and PET containers. According to these results, it can be
suggested that glass and PET packaging are somewhat better for wine than
multilayer packaging.
Acknowledgements: Authors are very grateful to Kolar family cellar and winery
Pinkert for giving wine samples for examination. We would also like to thank to prof. Andrew R. Barron (Yale University, USA) for his help in statistical analysis
of the data.
REFERENCES
Caillé, S., Samson, A., Wirth, J., Diéval, J., Vidal, S., & Cheynier, V. (2010). Sensory characteristics changes of red Grenache wines submitted to different
oxygen exposures pre and post bottling. Analytica chimica acta, 660(1-2), 35-42.
http://doi.org/10.1016/j.aca.2009.11.049 Dimkou, E., Ugliano, M., Diéval, J. B., Vidal, S., Aagaard, O., Rauhut, D., &
Jung, R. (2011). Impact of headspace oxygen and closure on sulfur dioxide,
color, and hydrogen sulfide levels in a Riesling wine. American Journal of Enology and Viticulture, 62(3), 261-269.
http://dx.doi.org/10.5344/ajev.2011.11006
Drinkine, J., Lopes, P., Kennedy, J. A., Teissedre, P.-L., & Saucier, C. (2007). Ethylidene-bridged flavan-3-ols in red wine and correlation with wine age.
Journal of Agricultural and Food Chemistry, 55(15), 6292-6299.
https://doi.org/10.1021/jf070038w Francia-Aricha, E. M., Rivas-Gonzalo, J. C., & Santos-Buelga, C. (1998). Effect
of malvidin-3-monoglucoside on the browning of monomeric and dimeric
flavanols. Zeitschrift fur Lebensmitteluntersuchung Und –Forschung A, 207(3), 223-228. https://doi.org/10.1007/s002170050323
Gambuti, A., Rinaldi, A., Ugliano, M., & Moio, L. (2013). Evolution of Phenolic Compounds and Astringency during Aging of Red Wine:Effect of Oxygen
Exposure before and after Bottling. Journal of Agricultural and Food Chemistry,
61(8), 1618−1627. https://doi.org/10.1021/jf302822b Ghidossi, R., Poupot, C., Thibon, C., Pons, A., Darriet, P., Riquier, L., De Revel,
G., & Mietton-Peuchot, M. (2012). The influence of packaging on wine
conservation. Food Control, 23(2), 302-311. https://doi.org/10.1016/j.foodcont.2011.06.003
Glories, Y. (1984). La couleur des vins rouges. 2e partie: mesure, origine et
interprétation. OENO One, 18(4), 253–271. https://doi.org/10.20870/oeno-one.1984.18.4.1744
Hopfer, H., Ebeler, S. E., & Heymann, H. (2012). The combined effects of
storage temperature and packaging type on the sensory and chemical properties of Chardonnay. Journal of Agricultural and Food Chemistry, 60(43), 10743-
10754. https://doi.org/10.1021/jf302910f
International Organisation of Vine and Wine. (2007). Compendium of International Methods of Wine and Must Analysis, Volume 1. OIV, Paris,
France: http://www.oiv.int/public/medias/6619/compendium-2019-en-vol1.pdf.
Kojić, N., & Jakobek, L. (2019). Chemical and sensory properties of red wines from Baranja vineyards. In: S Tomas, Đ Ačkar (eds.). Proceedings of
International Conference 17th Ružička days “Today Science – Tomorrow
industry”, 63-71. Lopés, P., Silva, M. A., Pons, A., Tominaga, T., Lavigne, V., Saucier, C., Darriet,
P., Teissedre, P. - L., & Dubourdieu, D. (2009). Impact of oxygen dissolved at
bottling and transmitted through closures on the composition and sensory properties of a Sauvignon blanc wine during bottle storage. Journal of
Agricultural and Food Chemistry, 57(21), 10261-10270.
https://doi.org/10.1021/jf9023257 Monagas, M., Gómez-Cordovés, C. & Bartolomé, B. (2005). Evolution of
polyphenols in red wines from Vitis vinifera L. during aging in the bottle.
European Food Research and Technology, 220, 607-614.
https://doi.org/10.1007/s00217-004-1108-x Robertson, G. L. (1993). Aseptic Packaging of Foods. In: Food packaging:
principles and practice, 381-408. Marcel Dekker, New York.
Skouroumounis, G. K., Kwiatkowski, M. J., Francis, I. L., Oakey, H., Capone, D. L., Duncan, B., Sefton, M. A., & Waters, E. J. (2005). The impact of closure type
and storage conditions on the composition, colour and flavour properties of a
Riesling and a wooded Chardonnay wine during five years' storage. Australian Journal of Grape and Wine Research, 11(3), 369-377.
https://doi.org/10.1111/j.1755-0238.2005.tb00036.x
Toussaint, M., Vidal, J. - C., & Salmon, J. - M. (2014). Comparative Evolution of
Oxygen, Carbon Dioxide, Nitrogen, and Sulfites during Storage of a Rosé Wine
Bottled in PET and Glass. Journal of Agricultural and Food Chemistry, 62(13),
2946-2955. https://doi.org/10.1021/jf405392u Vidal, J. - C., & Moutounet, M. (2006). Monitoring of oxygen in the gas and
liquide phases of bottles of wine at bottling and during storage. OENO One,
40(1), 35-45. https://doi.org/10.20870/oeno-one.2006.40.1.884 Vidal, J. - C., & Moutounet, M. (2011). Impact of operating conditions during
bottling and of technical cork permeabiliy on the oxygen content and evolution of
bottled Sauvignon blanc. Internet Journal of Viticulture and Enology, 4/3, 1-15.

J Microbiol Biotech Food Sci / Kojić and Jakobek et al. 2021 : 10 (6) e3036
9
SUPLEMENTARY MATERIAL
Table S1 The results of the multiple regression with the selected strongly significant (p < 0.001) main effects and
interactions for all physico-chemical parameters and color in wine
Term Coefficient Standard error of
coefficient P-Value
PHYSICO-CHEMICAL PROPERTIES OF
WINE
Specific weight of wine
Constant 0.994228 0.000035 0,000
Merlot vs Pinot noir 0.000925 0.000092 0,000
multilayer vs time 0.000049 0.000008 0.000
PET vs time -0.000029 0.000007 0.000
Merlot vs time -0.000042 0.000011 0.000
Merlot : multilayer : time at least 6 months -0.001384 0.000148 0.000
Specific weight of distillate
Constant 0.981557 0.000024 0.000
multilayer vs PET 0.000526 0.000060 0.000
Cabernet vs others -0.001307 0.000056 0.000
Frankovka vs Merlot and Pinot noir 0.001554 0.000059 0.000
multilayer vs PET : time 0 months vs others -0.000658 0.000148 0.000
multilayer vs PET :-time 3 months vs larger -0.000810 0.000153 0.000
Merlot vs Pinot noir : time -0.000087 0.000010 0.000
Merlot : multilayer : time 12 months 0.000778 0.000204 0.000
Alcohol (% vol.)
Constant 14.2434 0.0217 0.000
multilayer vs PET -0.4587 0.0534 0.000
Cabernet vs others 1.1759 0.0498 0.000
Frankovka vs Merlot and Pinot noir -1.3782 0.0530 0.000
multilayer vs PET : time 0 months vs others 0.573 0.132 0.000
multilayer vs PET : time 3 months vs larger 0.745 0.137 0.000
Merlot vs Pinot noir : time 0.07942 0.00870 0.000
Merlot : multilayer : time 12 months -0.746 0.182 0.000
Total dry extract (g/L)
Constant 32.6671 0.0681 0.000
Merlot vs Pinot noir 3.335 0.198 0.000
Cabernet vs others 3.679 0.154 0.000
Frankovka vs Merlot and Pinot noir -3.481 0.165 0.000
Merlot : multilayer : time at least 6 months -4.508 0.331 0.000
Total acid (g/L)
Constant 5.7937 0.0212 0.000
Frankovka vs Merlot and Pinot noir 0.9277 0.0519 0.000
Merlot vs Pinot noir 0.582 0.0599 0.000
Volatile acid (g/L)
Constant 0.53906 0.00799 0.000
Cabernet vs others 0.1765 0.01550 0.000
Frankovka vs Merlot and Pinot noir -0.0884 0.02340 0.000
Frankovka vs time 0.01101 0.00297 0.000
Multilayer : time 0.0063 0.00168 0.000
Free SO2 (mg/L)
Constant 16.872 0.372 0.000
Merlot vs Pinot noir -5.71 1.04 0.000
time 0 months vs others 20.379 0.925 0.000
Frankovka vs Merlot and Pinot noir : time 0
months vs larger
14.01 2.27 0.000
Frankovka : glass : time 3 months 14.67 2.91 0.000
Total SO2 (mg/L)
Constant 38.394 0.563 0.000
Cabernet vs others -7.2 1.27 0.000
Merlot vs Minot noir 9.82 1.62 0.000
time 0 months vs others 56.63 1.36 0.000
time 3 months vs larger 22.95 1.53 0.000
Cabernet vs others : time 3 months vs larger -19.08 3.33 0.000
Merlot vs Pinot noir-time 0 months vs larger 23.97 3.88 0.000
Merlot vs Pinot noir-time 3 months vs larger 36.16 4.34 0.000
Merlot : glass : time 6 months 41.07 4.39 0.000
Merlot : multilayer : time 3 months -43.13 4.97 0.000
Frankovka : multilayer : time 3 months -18.96 4.48 0.000
Pinot noir : PET : time-9 months 17.06 4.39 0.000
Oxygen (mg/L)
Constant 3.3203 0.0679 0.000
time 0 months vs others 6.690 0.196 0.000
glass vs others 0.516 0.144 0.001
Merlot vs Pinot noir -0.843 0.192 0.000
Merlot : time 0 months vs others -2.162 0.392 0.000

J Microbiol Biotech Food Sci / Kojić and Jakobek et al. 2021 : 10 (6) e3036
10
COLOR OF WINE
Color intensity (CI)
Constant 7.624 0.160 0.000
Cabernet vs others 1.502 0.322 0.000
Merlot vs Pinot noir 3.082 0.484 0.000
time 0 months vs others -1.424 0.362 0.000
Merlot vs Pinot noir : multilayer -3.558 0.838 0.000
Multilayer : time -0.1629 0.0387 0.000
Hue (H)
Constant 1.1018 0.0121 0.000
time 0 months vs others -0.1326 0.0300 0.000
Merlot vs Pinot noir -0.3610 0.0345 0.000
Cabernet vs others -0.1130 0.0277 0.000
Frankovka vs Merlot and Pinot noir -0.1286 0.0295 0.000
Merlot : multilayer : time 12 months 0.4681 0.0962 0.000
Yellow (%)
Constant 40.657 0.181 0.000
Merlot vs Pinot noir 4.260 0.515 0.000
Cabernet vs others 2.352 0.415 0.000
Frankovka vs Merlot and Pinot noir 4.152 0.441 0.000
time 0 months vs others 2.338 0.448 0.000
Merlot vs Pinot noir : time 0 months vs larger 4.62 1.27 0.001
Merlot : multilayer : time 12 months -6.71 1.44 0.000
Red (%)
Constant 41.899 0.470 0.000
Merlot vs Pinot noir -12.03 1.05 0.000
time 0.3420 0.0703 0.000
Merlot:time 0.456 0.115 0.000
Pinot noir : glass : time 9 months -10.66 2.17 0.000
Blue (%)
Constant 16.201 0.307 0.000
Merlot vs Pinot noir 5.535 0.510 0.000
time -0.2326 0.0419 0.000
Frankovka vs Merlot and Pinot noir -3.400 0.436 0.000
Pinot noir : glass : time 9 months 11.51 1.42 0.000 Regression main effect terms are built from indicators of the indicated condition (1 if true and 0 otherwise). Main effect orthogonal contrasts
(vs) are built from differences of multiples of indicators (such that the coefficient would be the difference in the means, when the other terms
are orthogonal thereto). Interaction terms (marked with :) are built from products of these. Time as a continuous variable is also considered,
with care in subset selection as it is not orthogonal to the other contrasts. Term selection is by preservation of strong significance (p < 0.001),
set especially small to avoid large models and because we are not otherwise accounting for multiple comparisons. Three way interaction
terms appear only when residual analysis of the best two way interaction model reveals large standardized residuals (magnitude > 3) at the
corresponding measurement, such that no such large residuals occur in the final model. Terms are shown in bold when they correspond to
time changes as a main effect or time changes in interaction with the type of packaging.