the impact of covid-19 on zambian enterprises
TRANSCRIPT
Business Survey Report the Impact of Covid-19 on
Zambian Enterprises
REPUBLIC OF ZAMBIA

Table of Content
Acknowledgment 2
Executive Summary 3
1.0 Introduction 6
1.1 Situational Analysis 6
1.2 SWOT Analysis 7
1.3 Objective 9
SURVEY DESIGN AND METHODOLOGY 10
3.0 Limitations 12
4.0 Findings 13
4.1 Demographic profile of Enterprise Main Respondents 13
4.2 Impact of Covid-19 on the Employment 16
4.3 Impact of Covid-19 on the Business Revenue 19
4.4 Impact of Covid-19 on the operations of Businesses 20
4.5 Significant challenges faced by business markets due to Covid-19 22
4.7 Support needed by business 29
4.8 Support by Businesses to the Government in its fight against Covid-19 31
5.0 Policy Recommendations 32
5.1 Government: 32
5.2 Enterprises: 34
5.3 Financial institutions 34
5.4 Commercial partners: 34
5.5 The international community: 35
Annex 1: A summary of policies released by the Zambian government during the Covid-19
outbreak to support enterprises 38
Annex 2: Survey 43
Annex 3: Sustainable Development Goals 53
Annex 4: Analysis of Frequencies for Covid-19 Survey 2020 54
Annex 5: Tables for Covid-19 Survey 2020 62
List of Figures
Foreword
ii
1
ii
List of tables
List of Figures
Table 1: Gender and Age group of respondents 13
Table 2: Sector Respondents by Province 62
Table 3: Number of employees per sector before COVID 19 outbreak 63
Table 4: Number of employees by sector during the Covid-19 pandemic 64
Table 5: Impact of the COVID 19 pandemic on revenue of businesses 65
Table 6: Recommendations by businesses on how to reactivate (Short term, Medium
term and Longterm) 66
Table 7: Other Services 67
Figure 1: Respondents by province 11
Figure 2; Position of Respondents in a company 13
Figure 3: Respondents by Province 14
Figure 4: Number of respondents per sector 14
Figure 5: Sector Respondents by Province 15
Figure 6: Number of employees per sector before Covid-19 outbreak 16
Figure 7: Number of employees per sector during Covid-19 outbreak 17
Figure 8: Number of employees per sector during Covid-19 outbreak 17
Figure 9: Employees covered by health Insurance 18
Figure 10: Health Insurance Provision 18
Figure 11: Impact of Covid-19 on the Business Revenue 19
Figure 12: Impact of Covid-19 on the Business Revenue 19
Figure 13: Impact of Covid-19 on the operations of business (by sector) 20
Figure 14: Impact on business operations (Overall) 20
Figure 15: Impact of Covid-19 on business operations by Province 21
Figure 16: Respondents according to preferred communication channel 21
Figure 17: Significant challenges faced by business markets 22
Figure 18: Loss of customers due to Covid-19 22
Figure 19: Loss of customers due to Covid-19 (by Province) 23
Figure 20: Measures taken by businesses 23
Figure 21: Measures regarding operating costs 24
Figure 22: Measures to close business indefinitely (by Province) 24
Figure 23: Measures to close business indefinitely (by sector) 25
Figure 24: Telework as a measure 25
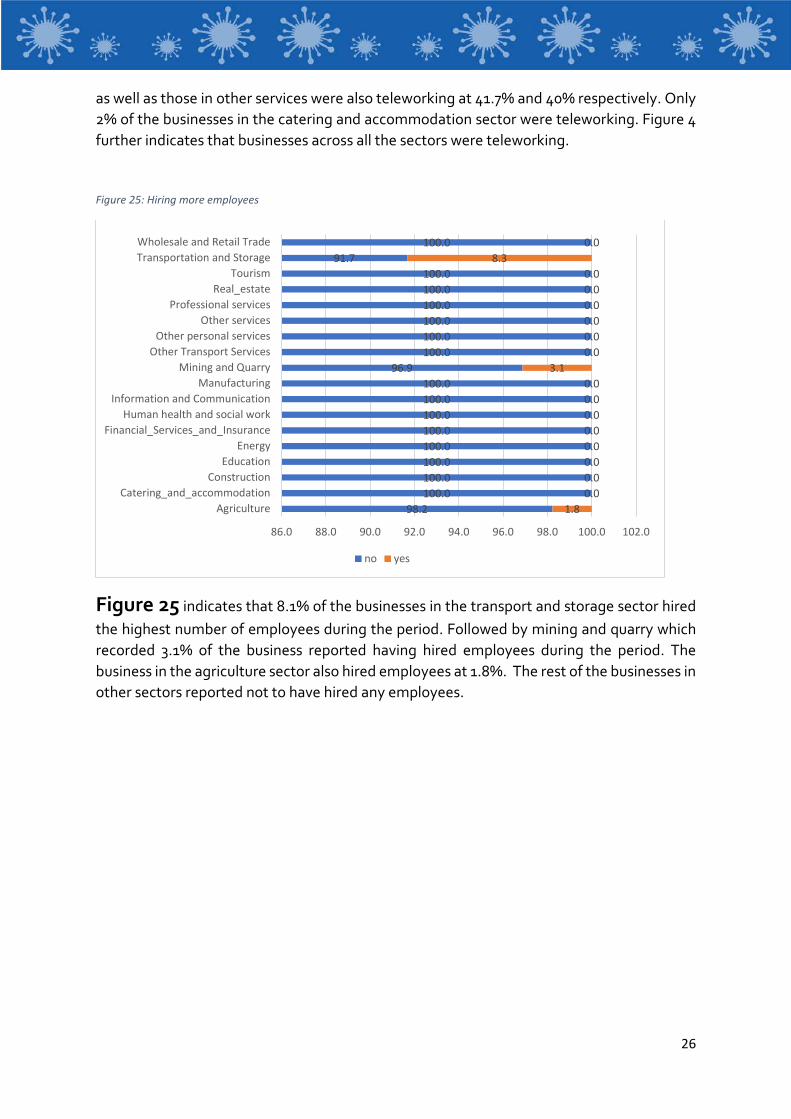
Figure 25: Hiring more employees 26
Figure 26: Postponed investment or growth plans as a measure 27
Figure 27: Measures regarding customers 27
Figure 28: Measures regarding suppliers 28
Figure 29: Impact of pandemic on future development strategy 28
Figure 30: Support provided 31
1
Foreword With the onset of the Covid-19 pandemic globally, the Ministry of Commerce, Trade and Industry working closely with the United Nations Development Programme commissioned a Business Survey to assess the impact of Covid-19 on enterprises in Zambia.
The Business Survey was necessitated by the need to ascertain the socio-economic impact of Covid-19 on Large, Micro, Small and Medium-sized enterprises and Cooperatives. Further, the survey aimed at providing evidence-based data to inform government on the necessary measures required to help businesses cope during and beyond the Pandemic. The information collected was digitally mapped and aggregated by region and size of the business.
Notwithstanding the difficulty of quantifying the real impact of the Covid19, due to the rapidly evolving nature of the pandemic, the survey focused on understanding the possible socio-economic repercussions in order to propose policy recommendations aimed at mitigating the impact on the economy.
It is my expectation that the report has generated sufficient information indicating the areas that need improvement in terms of policy interventions for private sector development. In view of the foregoing, it is in the best interest of both government and private sector to note the findings of the study.
With this Survey Report, I am confident that the Survey Results will give a clear indication of how business enterprises have been affected in Zambia and provide comprehensive policy actions aimed at mitigating the impact of the disease on the economy.
Hon. Christopher B. Yaluma, MP MINISTER OF COMMERCE, TRADE AND INDUSTRY

2
Acknowledgment This document is a result of extensive and comprehensive consultations with various stakeholders which included; Quasi Government institutions, Private Sector Associations and Academia.
The Ministry wishes to recognize and extend special acknowledgements to the United Nations Development Programme (UNDP) for the financial and technical support rendered throughout the process of conceptualizing and undertaking the Business Survey. Further, I take recognition of the enormous contributions made by my staff from Ministry of Commerce, Trade and Industry, Zambia Chamber of Commerce and Industry (ZACCI) among others for working tirelessly in carrying out the Business Survey. My hope is that Government and the Private Sector will work together in implementing the recommendations of the Survey.
I also wish to express special gratitude to respondents from various business Institutions countrywide for the cooperation in providing information and whose feedback we value.
Mushuma Mulenga Permanent Secretary MINISTRY OF COMMERCE, TRADE AND INDUSTRY
3
Executive Summary
The 2019 novel coronavirus disease (Covid-19), was declared by the World Health Organization as a pandemic on 11th March 2020. The outbreak has taken a toll on people’s safety and global economic development. As the impact of the pandemic becomes evident worldwide, global growth forecasts are constantly being adjusted downwards. The International Monetary Fund (IMF) projected annual global GDP growth to drop to 3% in 2020, while the Zambian economy is now projected to contract by 2.6% in 2020 from the earlier projection of 3.6%. With the continuous spreading of Covid-19 worldwide, the outbreak has greatly increased uncertainty and the risk of a global recession, broadly defined by the IMF as growth slipping below 2.5% a year. Supply chains have been disrupted, market confidence significantly damaged, consumer and investment demand is shrinking, while global economic activity has weakened significantly. All these pose even greater challenges for the resilience, governance, and international cooperation effectiveness of impacted economies.
In Zambia, the pandemic has had a huge impact on the economy in the short run, possibly expanding to the medium and long run as well, owing to the negative impact on net exports, significant drop in commodity prices and tourism resulting from market global slowdown and travel restrictions. Zambian enterprises are faced with great challenges during the prevention and control stages of the outbreak, which has restricted their production and operation activities and posed risks to operations.
The Ministry of Commerce Trade and Industry with support from the United Nations Development Programme (UNDP) conducted this business survey in order to assess the impact of the Covid-19 pandemic on various enterprises in Zambia, including large, medium, small and micro enterprises (MSMEs) and cooperatives. It proposes recommendations on relevant policies and provides baselines for international organizations to design projects that will assist the private sector to survive. The policy recommendations highlighted in this report are based on real-time evidence, gathered from the online survey conducted in May 2020, covering 706 large, medium, small and micro enterprise respondents, as well as a thorough review of reports and research literature published by different organizations on the impact of the pandemic.
4
Key findings in this report are as follows:
(i) Covid-19 has adversely affected business operation with 71% of the respondents indicating that they were partially closed while 14% of businesses were totally closed. Only 15% reported to have maintained normal operations.
(ii) The Education, Transport and Catering and Accommodation Sectors were impacted particularly hard compared to others like Health and Social Work, Energy among others. 85% of the organisations working in Education reported to be completely closed, while 60% of businesses in the Human Health and Social Work sector maintained normal operations
(iii) Covid-19 has caused a number of challenges to enterprises, with the most significant challenges being loss of customers rated at 77.3 % of the total responding enterprises. Other reported challenges include supply chain cuts at 37.7%, high commodity prices/ material prices reported at 36.0 % and problems with late payments at 32.3% among others. These challenges are expected to affect operating revenue for enterprises.
(iv) To keep afloat during the pandemic period some businesses have adopted measures, ranging from communicating with employees about layoff and temporal salary reductions reported by 37.3% of the total responding enterprises. Flexible shifts, working from home was reported by 33.6%, with those reported to have shutdown certain productions lines and outlets rated at 22.8%), resumption of work and production as soon as possible at 169% among other measures.
(v) The Survey noted that the majority enterprises are determined to continue their operations by adhering to the new normal requirement during the Covid-19 outbreak. Enterprises have further resolved to adopt new development strategy by embracing and exploration of new business models (45%), accelerating technological, product and services innovation (57%), and strengthening global reach of supply chain and expansion of overseas market (21%). However, 7% of the total responding enterprises reported to have failed to cope with the epidemic and expressed their intention to withdraw from the market.
(vi) In terms of support, an overwhelming number of enterprises indicated that it is of uttermost important for government to come up with policy decisions that will support the business environment to economically re-activate business operation such as cash grants (76%), followed by loan facilities (51%), equipment (45%), improvements to market access (44%), improved information about markets and prices (41%), digital media training (23%, alternative payment methods to cash (16%) and legal support (13%).
5
(vii) Enterprises also look forward to more government support on offering access to affordable financing and flexible payment periods, clearing of outstanding payment to suppliers of goods and services, and offer relief from payment of statutory obligations (ZRA, NAPSA and Council Levy) for a period.
(viii) On the other side business are also willing to support government in its fight against Covid-19 in several ways. Thirty-seven per cent of the businesses indicated that they would support government in its fight against Covid-19 through communication; that is by disseminating information about Covid-19 to communities. About 16% of the business in the survey indicated that they would assist government in kind, that is by providing goods like hand soap, protective clothing or other materials in addition to disseminating information on Covid-19. About 8% opted for the assistance, supporting it in different way (other ways) other than communication, transport, finance and provision of goods and services.
6
1.0 Introduction The 2019 novel coronavirus disease (Covid-19), was declared by the World Health Organization as a pandemic on 11thMarch 2020. The outbreak has taken a toll on people’s safety and global economic development. As the impact of the pandemic becomes evident worldwide, global growth forecasts are constantly being adjusted downwards. The International Monetary Fund (IMF) projected annual global GDP growth to drop to 3% in 2020, while the Zambian economy is now projected to contract by 2.6% in 2020 from the earlier projection of 3.6%. With the continuous spreading of Covid-19 worldwide, the outbreak has greatly increased uncertainty and the risk of a global recession, broadly defined by the IMF as growth slipping below 2.5% a year.
Supply chains have been disrupted, market confidence significantly damaged, consumer and investment demand are shrinking, while global economic activity has weakened significantly. All these pose even greater challenges for the resilience and governance of impacted economies.
In view of the above, the Ministry of Commerce, Trade and Industry with support from the United Nations Development Programme undertook a survey to ascertain the possible impact of Covid-19 on Zambian Businesses and propose mitigation measures to support the economy during and post Covid-19 pandemic. The survey was targeted at large, micro, medium and small enterprises as well as cooperatives.
1.1 Situational Analysis The first case of the Coronavirus 2019 (Covid-19) case was recorded in Wuhan City of Hubei Province in China. Following the wide and continued spread of the virus around the world, the World Health Organization (WHO) declared the outbreak of the Covid-19 a Global Public Health Emergency on 30th January 2020. In response to the WHO pronouncement, the Government of the Republic of Zambia through the Ministry of Health established preventative and control measures to upscale national preparedness, surveillance and response to the threat of the outbreak.
These preventative measures were implemented with support from cooperating partners and included the following:
i. Activated the National Public Health Emergency Operations Center (PHEOC)ii. Screening of all international passengers at all point of entry and following up those
from high risk countries for 14 daysiii. Designated isolation facilities at district level across the countryiv. Enhanced Laboratory testing capacities in hospitalsv. Enhanced public awareness through radio, TV, and social Media platforms
vi. Establishment of a call center to report concerns and receive information on thedisease.
vii. Facilitated specialized training for key healthcare workers and surge staff includingimmigration, customs, defense, security and point of entry personnel
viii. Established an Emergency Fund to provide resources for Covid-19 preparedness,surveillance and response.
7
On 18th March 2020, Zambia reported the first cases of Covid-19 and to prevent the further spread of the disease, the government directed the closure of all schools, Colleges and Universities. Following the progressive increase in the COVID-19 cases after the initial reported cases in the country, the Government instituted the following measures;
i. The review of issuance of Visas for travelers to Zambia from countries affected by the Covid-19
ii. Screening and quarantining of travelers who exhibit symptoms of Covid-19 for 14days at their own costs in a designated medical facility for treatment.
iii. Suspension of non-essential foreign traveliv. Restriction of public gathering to at least 50 people subject to complying with Public
Health Authority Guidelinesv. Adjustment of normal operations of restaurants to only operate on takeaway and
delivery basis.vi. Closure of all Bars, Night Clubs, Cinemas, Gyms and Casinos.
vii. Closure of all international airports except for Kenneth Kaunda International Airportto ensure efficient and effective screening of travelers.
According to the Ministry of Finance, the Zambian economy like many other countries has been affected negatively by the Covid-19 pandemic. Zambia’s economy for 2020 was projected to grow at 3.2% before the pandemic. Taking into context the effect of the pandemic on the economy, the growth is now projected to be lower at around 2.0%. The tourism, mining, manufacturing, construction as well as wholesale and retail trade sectors are projected to slow down particularly. This is expected to reduce Government revenues under the 2020 budget, due to the decline in the Collections under VAT, Customs Duties, income Tax and Mineral royalty.
The economic slowdown resulting from the measures implemented in the fight against the spread of CCovid-19 at global and regional levels has affected the prices of major commodities. For instance, the price of copper, major export commodity for Zambia, declined, by 23%. The decline in the copper prices has contributed to the depreciation of the Zambian kwacha by more than 20% against major currencies.
The partial lockdown for Zambia was both a historic and necessary step for countering the spread of the virus. In the meantime, the Government of the Republic of Zambia undertook many initiatives to defend the country against CCovid-19. However, in order to devise an effective strategy for fighting CCovid-19 while minimizing risks and maximizing results, it is crucial to identify the internal and external factors correctly.
1.2 SWOT Analysis A SWOT analysis has been done to assess Zambia’s current position in tackling the pandemic. This analysis examines Zambia’s Strengths, Weaknesses, Opportunities and Threats on the Covid-19 front and aims to come out with responses that can help battle the crisis. This will also act as the foundation for various stakeholders to pursue and convert opportunities into strengths and prevent weaknesses from turning into threats.
8
STRENGTHS WEAKNESSES
Frontline staff were geared to take the new challenge.
Lack of testing kits and relief materials like medical equipment, PPE, masks, and ventilators
Donations and aid-kind received towards the Covid-19 fight from business and non-business houses
Lack of capacity by local manufacturers to produce testing kits and PPE making the country to rely on imports.
Rapid measures were undertaken such as imposing travel restrictions and partial lockdown that enabled Zambia to access to essential goods and services.
Lack of awareness, and/or denial/mistrust among specific sections of the society on the seriousness of the virus
All domestic/international Travelers and offices are mandated to undergo a compulsory thermal screening check
Psychological barrier relating to isolation: people fear the quarantine conditions
All citizens have been mandated to wear face masks in public
High incubation period ranging from 1 to 14 days
Transparent communication by the government/Ministry of Health led to compliance of requisite directions given to the masses to minimise the spread of Covid-19.
Shortage of emergency healthcare infrastructure and professionals: Doctor to patient ratio; hospital beds to people ratio; ventilators to population ratio
OPPORTUNITIES THREATS Created national level incident management system for the Covid-19 preparedness response
Failure in contact tracing may lead to worsening of the present situation and increase in the probability of being hit by the second wave of Covid-19
Zambia can emerge victorious in this fight (setting an example for other nations in the region on how to fight the crisis)
Breach of partial lockdown protocols and social-distancing norms (health guidelines).
Development of standard operating policies and procedures in the form of emergency preparedness and response plan for the present and future outbreaks
Increased chances of spread of infection due to high population and poverty in some areas in Zambia
Involve start-ups, MSME, corporate R&D and academic institutions for providing innovative solutions for fighting Covid-19, poverty, gender inequality among others
Higher chances of frontline workers contracting the disease
Economic stimulus facilities: K10 billion targeting small and medium scale indigenous businesses and tax related stimuli
Dwindled the economy and overall growth of the nation
Locally produced products like vegetables to be sold in Supermarkets/Chain store
Impact on stock markets as well as a global, national, and local trade
Citizen have developed new ways of doing things and sustaining themselves-New normal
Worldwide lockdown catalyzing slow down into recession leading to increase the unemployment and poverty levels
9
Support (K2.7 billion) from bilateral and multilateral cooperating partners.
Abuse of social media: circulating unverified information about the spread and the effects of Covid-19.
Existing infrastructure like hotels, lodges and learning institutions were converted into quarantine centres Local companies produced and donated ethanol for making hand sanitiser.
1.3 Objective The Business Survey was aimed at assessing the impact of the Covid-19 pandemic on Zambian Enterprises including Large, Medium, Small and Micro-sized enterprises as well as cooperatives, and determined the support by them. It also aimed at providing data for Government and its Cooperating Partners to focus their assistance. The Survey further proposes comprehensive actions aimed at mitigating the social economic impact and contribute towards economic recovery.
10
2. SURVEY DESIGN AND METHODOLOGY Survey Design This report combines the methodology of survey data analytics and literature reviews from reports and research by government agencies and ministries on the social-economic impact of COVID-19 on business enterprises, measures enterprises have put in place and to determine the future development strategy and the support given by government to the enterprises. The survey adopted an online and unrestricted, self-selected survey design. Unrestricted, self-selected survey in the sense that the survey was open to all the businesses to participate through established website questionnaire link. This particular design was employed to have wider coverage and allow as many businesses to freely participate at a minimum cost.
Survey Coverage and Unit of Enquiry
The survey was conducted in all the ten (10) provinces of Zambia and designed to cover enterprises of all sizes (MSMEs and Large) across all the economic sectors classified according to the Industrial Standard Industrial Classification (ISIC). At section level the sectors included; Agriculture, Catering and accommodation, Construction, Education, Energy, Financial Services and Insurance, Human health and social work, Information and Communication, Manufacturing, Mining and Quarry, Other personal services, other services, Other Transport Services, Professional services, Real estate, Tourism, Transportation and Storage and Wholesale and Retail Trade.
Sample Design and Distribution
The survey targeted a minimum of 500 enterprises countrywide or at least 50 enterprises per province. This sample size was considered adequate and representative to address the survey object. Non-probability samples, sometimes called convenience samples, was employed as either the probability that every unit or respondent included in the sample could not be determined since each respondent was encouraged to participate in the survey.
The Zambia Chamber of Commerce and Industry, through the provincial chambers of commerce, Zambia Association of Manufacturers as well as the Provincial Cooperatives registers provided the frame from which the survey questionnaire online link invitation was directed. A total of 706 enterprises comprising MSMEs and large responded to the survey.
11
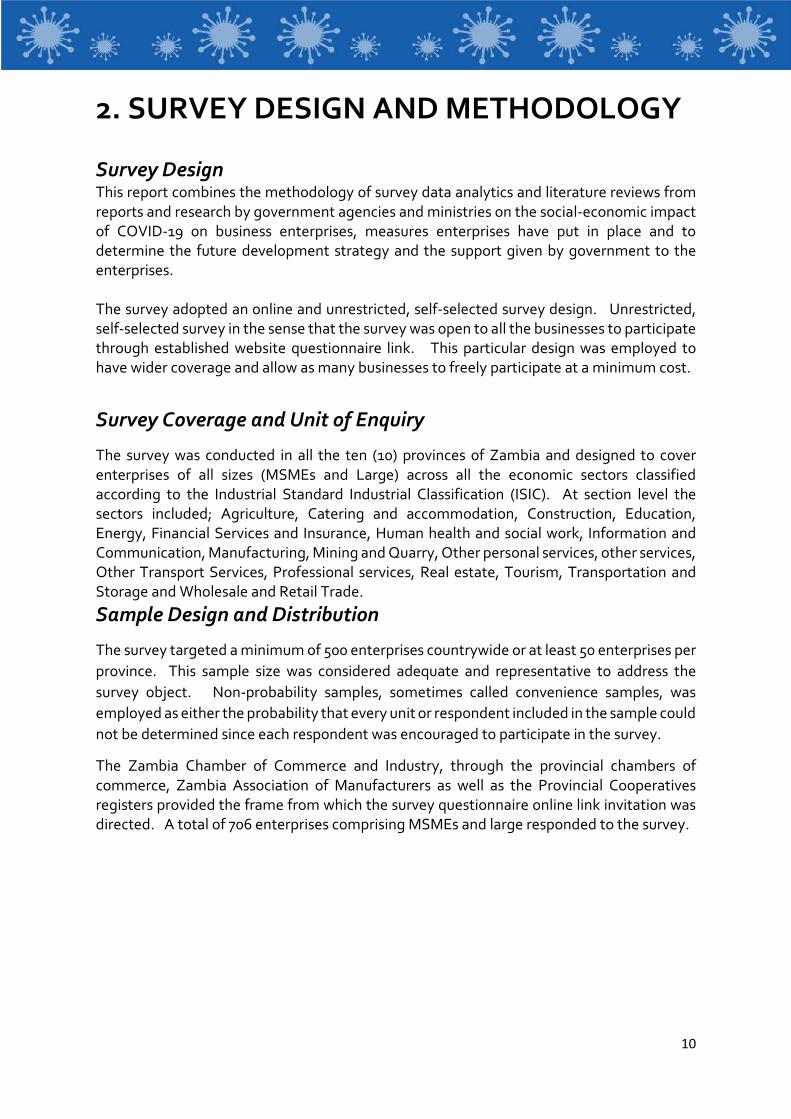
Figure 1: Respondents by province
Number of Enterprises Covered by Province
Actual Number Responded
Province Response rate(%)
Luapula 27,0 Northwestern 20,0 Lusaka 12,9 Eastern 9,3 Central 8,0 Northern 6,9 Western 6,7 Southern 3,8 Copperbelt 3,6 Muchinga 1,6 Total 100
Of the total enterprises covered 4,4% were large firms and 95,6% were MSMEs according to the 2009 MSME Policy definitions. Of the total MSMEs 250 were cooperatives societies.
Method of Data Collection The survey was launched on Thursday 21st May 2020 and ended on Sunday 7th June 2020. The survey data collection was online through a web-based questionnaire invitation link posted on the Ministerial and Business Associations websites and allowed any enterprise browsing through to take part. Where online interviews could not be obtained, especially in rural provinces, data collection was supplemented by personal interviews and later submitted online. This approach was taken to ensure a high response rate.
Data Capture, Cleaning, Validation and Analysis Data was captured online using Kobo Toolbox, user friendly and powerful enough to handle the most complex study applications and the format can easily be exported to other format such as MS Excel, SPSS and STATA for further analysis. Data cleaning involved the identification of inconsistent data and making necessary adjustments. The inconsistencies detected may have been caused at the time of data capture, corruption in transmission or storage. Data cleaning edit programs were developed in both MS Excel and SPSS software. Based on the objectives of the study, tabulation and analysis plan was used to run various tables in MS Excel and SPSS.
12
3.0 Limitations
The following are some of the limitations of the survey:
a) Limitation of Non-probability Samples
The Non-probability/convenience samples employed in this survey has obvious limitation as formal statistical inference cannot be used. However, the method is adequate enough to determine the findings useful for identifying issues under study.
b) Limited participation levels
The online method of data collection disadvantaged many respondents with limited or no access to ICT, especially those allocated in peri-urban and rural areas. To improve the participation rate back stopping was done by conducting physical interviews and later on transmit the data on line.
c) Limited time
The survey timeframe was very limited as such not all respondents managed to provide feedback on time. This affected the participation and/or response rate.
d) Limited Resources
The Ministry could not reach out to all the targeted respondents due to limited publicity as a result of limited resources. To mitigate this, in some cases local community radio stations were utilised to sensitize and call out businesses to participate in the online survey. The local Chamber of Commerce were also utilized to physically visit their members.
e) Low literacy levels
Because of the complexity of online questionnaire and procedure, some respondents had difficulties in understanding and interpreting the questionnaire due to low literacy levels. In such cases physical meetings were held to aid the affected respondents to interpret the intentions of the questions and accessing and submission of feedback.
f) Lockdown measures in progress
Data collection in Muchinga Province was hindered at the time of the survey, as Nakonde and surrounding districts were under full lockdown measures from the Government. The team however still managed to collect 11 respondents from Muchinga through the online platform.
13
4.0 Findings This section analyzes the impacts of the Covid-19 pandemic from the following aspects:
(i) Demographic profile of respondents (ii) Impact of the CO VID -19 pandemic (iii) Measures taken due to the impact of the pandemic (iv) Needs for Support (v) Expectations and suggestions about future development
4.1 Demographic profile of Enterprise Main Respondents
Table 1: Gender and Age group of respondents
Age Range Total Gender 15_24_years 25_34_years 35_44_years 45_55_years 56_65_years 66_above female 8 25 61 45 22 3 164
42.10% 23.40% 26.30% 22.60% 19.10% 8.80% 23.20% male 11 82 171 154 93 31 542
57.90% 76.60% 73.70% 77.40% 80.90% 91.20% 76.80% Total 19 107 232 199 115 34 706
Analysis in table 1 shows that there were more males (76.8%) than female respondents (23.2%). Further analysis across age groups shows that the age group 35-44 years is more represented followed by the age group 45-55 years while the age group 15-24 years is least represented.
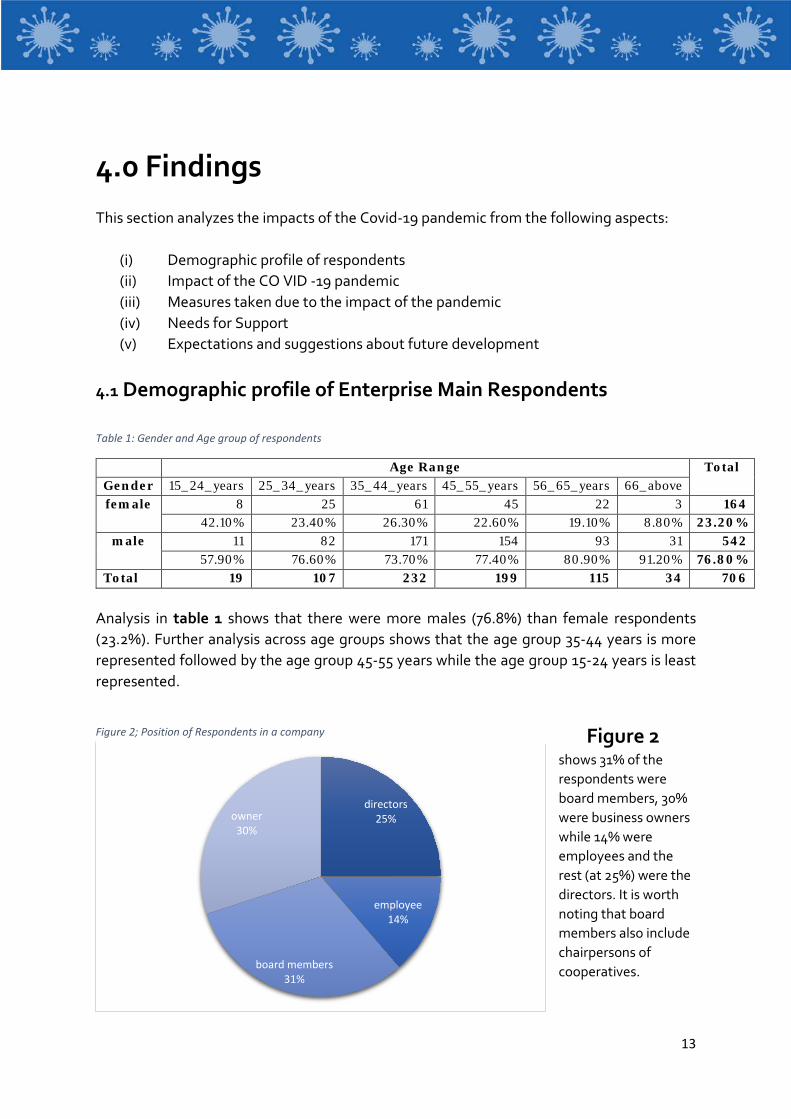
Figure 2 shows 31% of the respondents were board members, 30% were business owners while 14% were employees and the rest (at 25%) were the directors. It is worth noting that board members also include chairpersons of cooperatives.
directors25%
employee14%
board members31%
owner30%
Figure 2; Position of Respondents in a company
14
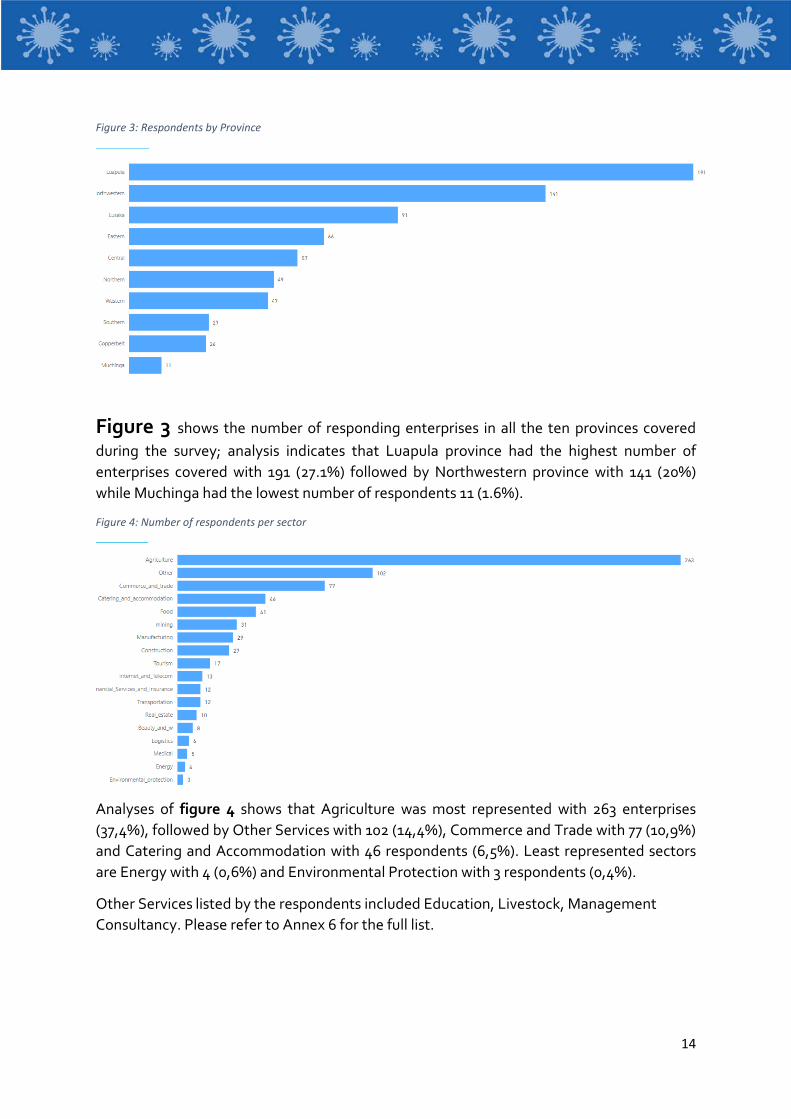
Figure 3: Respondents by Province
Figure 3 shows the number of responding enterprises in all the ten provinces coveredduring the survey; analysis indicates that Luapula province had the highest number of enterprises covered with 191 (27.1%) followed by Northwestern province with 141 (20%) while Muchinga had the lowest number of respondents 11 (1.6%).
Figure 4: Number of respondents per sector
Analyses of figure 4 shows that Agriculture was most represented with 263 enterprises (37,4%), followed by Other Services with 102 (14,4%), Commerce and Trade with 77 (10,9%) and Catering and Accommodation with 46 respondents (6,5%). Least represented sectors are Energy with 4 (0,6%) and Environmental Protection with 3 respondents (0,4%).
Other Services listed by the respondents included Education, Livestock, Management Consultancy. Please refer to Annex 6 for the full list.
15
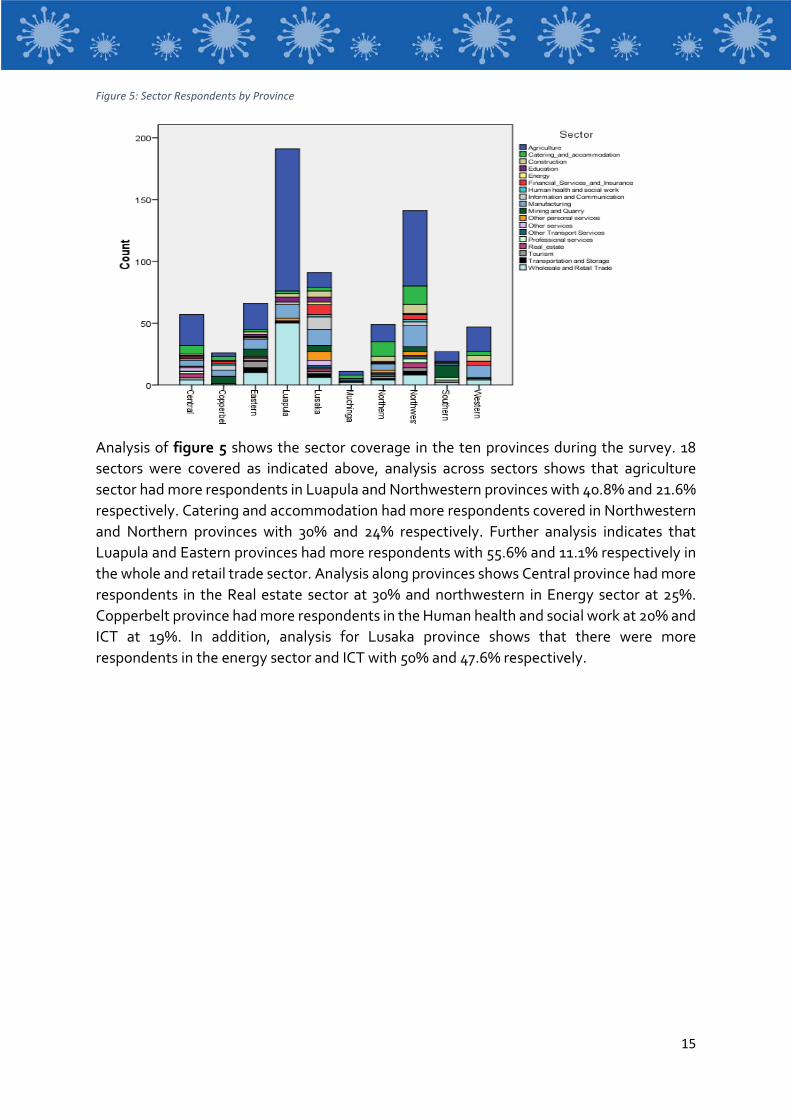
Figure 5: Sector Respondents by Province
Analysis of figure 5 shows the sector coverage in the ten provinces during the survey. 18 sectors were covered as indicated above, analysis across sectors shows that agriculture sector had more respondents in Luapula and Northwestern provinces with 40.8% and 21.6% respectively. Catering and accommodation had more respondents covered in Northwestern and Northern provinces with 30% and 24% respectively. Further analysis indicates that Luapula and Eastern provinces had more respondents with 55.6% and 11.1% respectively in the whole and retail trade sector. Analysis along provinces shows Central province had more respondents in the Real estate sector at 30% and northwestern in Energy sector at 25%. Copperbelt province had more respondents in the Human health and social work at 20% and ICT at 19%. In addition, analysis for Lusaka province shows that there were more respondents in the energy sector and ICT with 50% and 47.6% respectively.
16
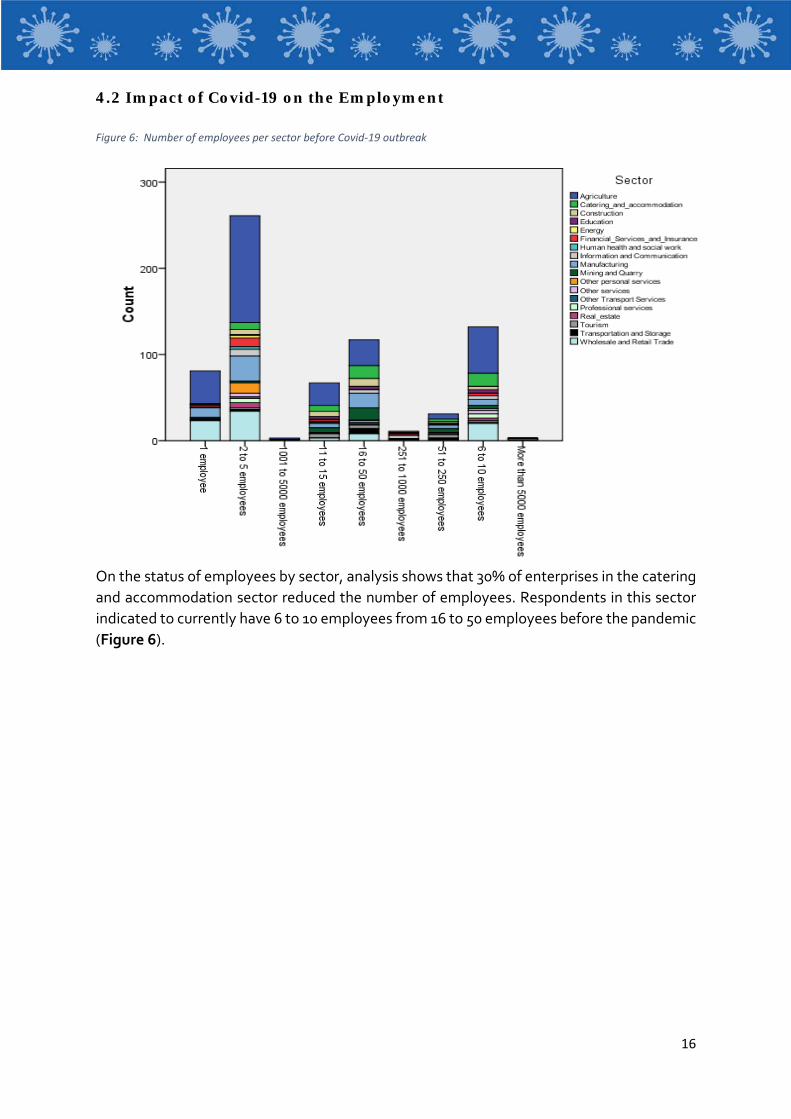
4.2 Impact of Covid-19 on the Employment Figure 6: Number of employees per sector before Covid-19 outbreak
On the status of employees by sector, analysis shows that 30% of enterprises in the catering and accommodation sector reduced the number of employees. Respondents in this sector indicated to currently have 6 to 10 employees from 16 to 50 employees before the pandemic (Figure 6).
17
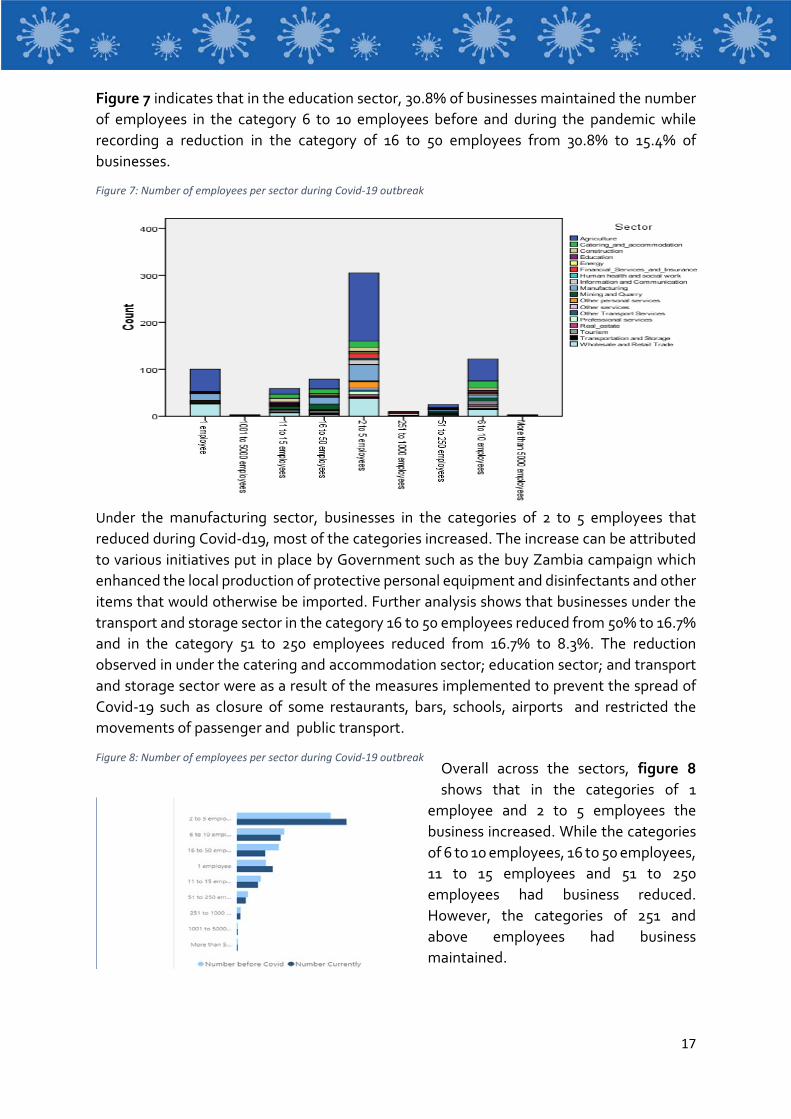
Figure 7 indicates that in the education sector, 30.8% of businesses maintained the number of employees in the category 6 to 10 employees before and during the pandemic while recording a reduction in the category of 16 to 50 employees from 30.8% to 15.4% of businesses.
Figure 7: Number of employees per sector during Covid-19 outbreak
Under the manufacturing sector, businesses in the categories of 2 to 5 employees that reduced during Covid-d19, most of the categories increased. The increase can be attributed to various initiatives put in place by Government such as the buy Zambia campaign which enhanced the local production of protective personal equipment and disinfectants and other items that would otherwise be imported. Further analysis shows that businesses under the transport and storage sector in the category 16 to 50 employees reduced from 50% to 16.7% and in the category 51 to 250 employees reduced from 16.7% to 8.3%. The reduction observed in under the catering and accommodation sector; education sector; and transport and storage sector were as a result of the measures implemented to prevent the spread of Covid-19 such as closure of some restaurants, bars, schools, airports and restricted the movements of passenger and public transport.
Overall across the sectors, figure 8 shows that in the categories of 1
employee and 2 to 5 employees the business increased. While the categories of 6 to 10 employees, 16 to 50 employees, 11 to 15 employees and 51 to 250 employees had business reduced. However, the categories of 251 and above employees had business maintained.
Figure 8: Number of employees per sector during Covid-19 outbreak
18
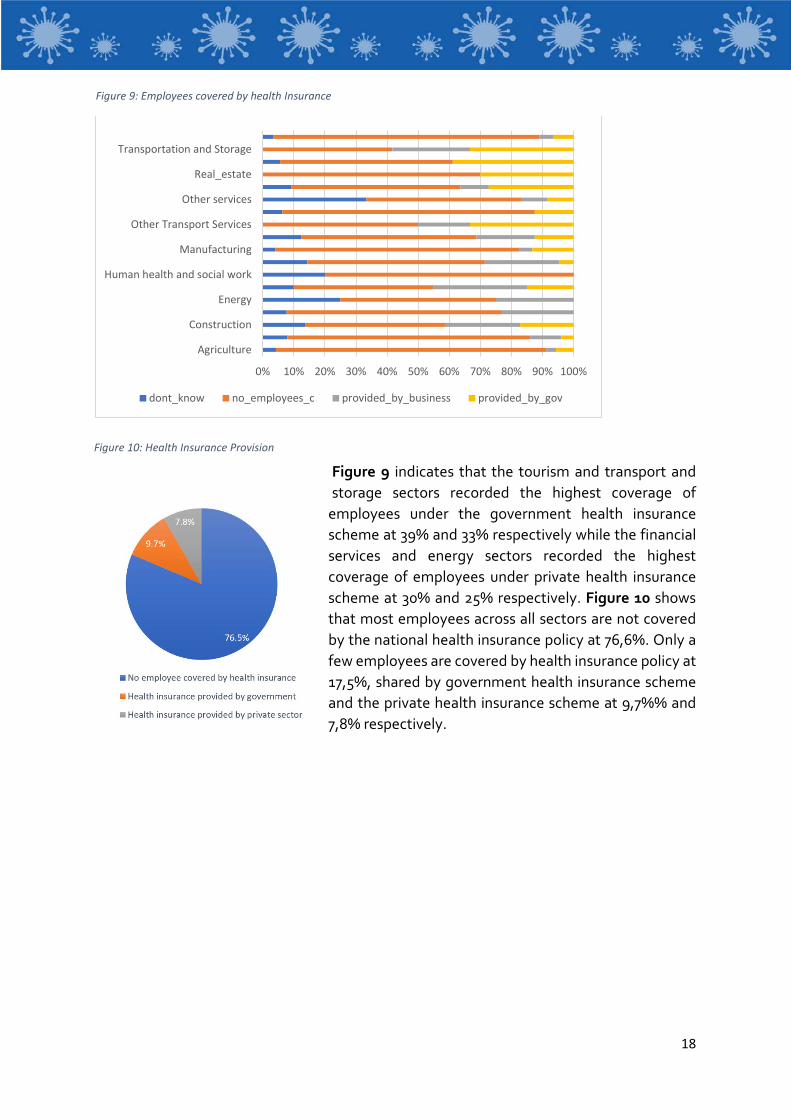
Figure 9: Employees covered by health Insurance
Figure 9 indicates that the tourism and transport and storage sectors recorded the highest coverage of
employees under the government health insurance scheme at 39% and 33% respectively while the financial services and energy sectors recorded the highest coverage of employees under private health insurance scheme at 30% and 25% respectively. Figure 10 shows that most employees across all sectors are not covered by the national health insurance policy at 76,6%. Only a few employees are covered by health insurance policy at 17,5%, shared by government health insurance scheme and the private health insurance scheme at 9,7%% and 7,8% respectively.
0% 10% 20% 30% 40% 50% 60% 70% 80% 90% 100%
Agriculture
Construction
Energy
Human health and social work
Manufacturing
Other Transport Services
Other services
Real_estate
Transportation and Storage
dont_know no_employees_c provided_by_business provided_by_gov
Figure 10: Health Insurance Provision
19
4.3 Impact of Covid-19 on the Business Revenue Figure 11: Impact of Covid-19 on the Business Revenue
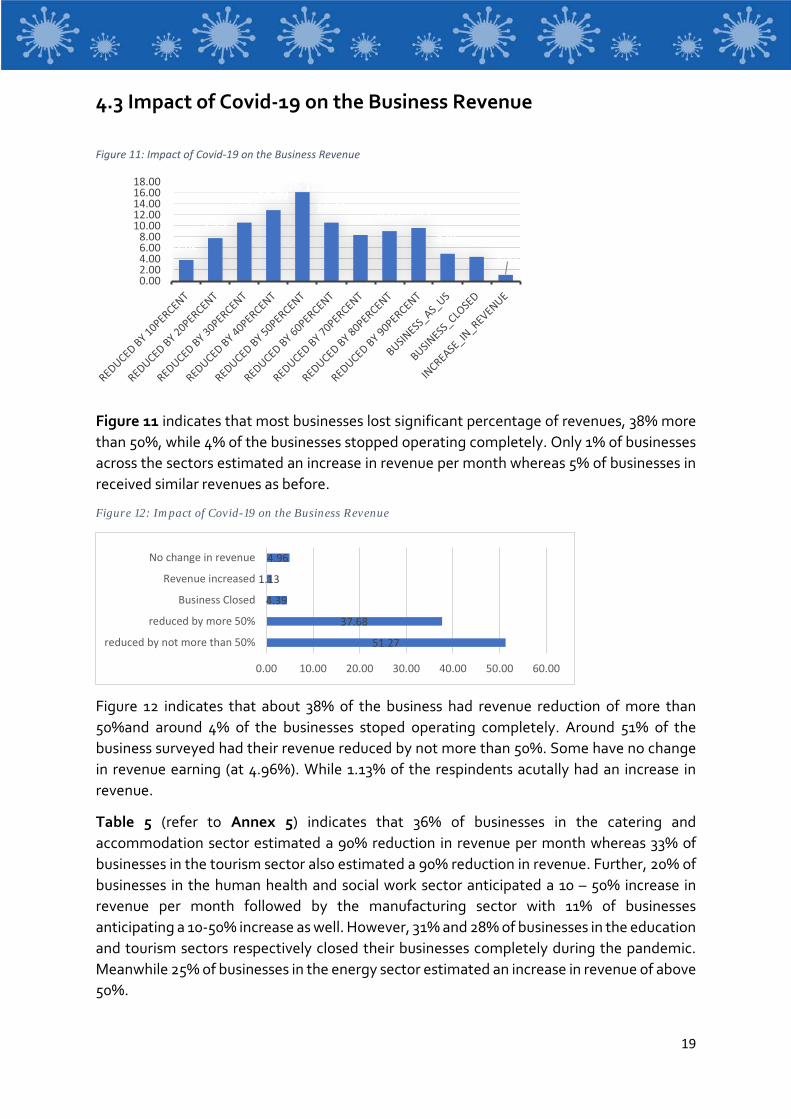
Figure 11 indicates that most businesses lost significant percentage of revenues, 38% more than 50%, while 4% of the businesses stopped operating completely. Only 1% of businesses across the sectors estimated an increase in revenue per month whereas 5% of businesses in received similar revenues as before.
Figure 12: Impact of Covid-19 on the Business Revenue
Figure 12 indicates that about 38% of the business had revenue reduction of more than 50%and around 4% of the businesses stoped operating completely. Around 51% of the business surveyed had their revenue reduced by not more than 50%. Some have no change in revenue earning (at 4.96%). While 1.13% of the respindents acutally had an increase in revenue.
Table 5 (refer to Annex 5) indicates that 36% of businesses in the catering and accommodation sector estimated a 90% reduction in revenue per month whereas 33% of businesses in the tourism sector also estimated a 90% reduction in revenue. Further, 20% of businesses in the human health and social work sector anticipated a 10 – 50% increase in revenue per month followed by the manufacturing sector with 11% of businesses anticipating a 10-50% increase as well. However, 31% and 28% of businesses in the education and tourism sectors respectively closed their businesses completely during the pandemic. Meanwhile 25% of businesses in the energy sector estimated an increase in revenue of above 50%.
3.82
7.7910.62
12.8916.15
10.628.36 9.07 9.63
4.96 4.391.13
0.002.004.006.008.00
10.0012.0014.0016.0018.00
51.27
37.68
4.39
1.13
4.96
0.00 10.00 20.00 30.00 40.00 50.00 60.00
reduced by not more than 50%
reduced by more 50%
Business Closed
Revenue increased
No change in revenue
20
4.4 Impact of Covid-19 on the operations of Businesses Figure 13: Impact of Covid-19 on the operations of business (by sector)
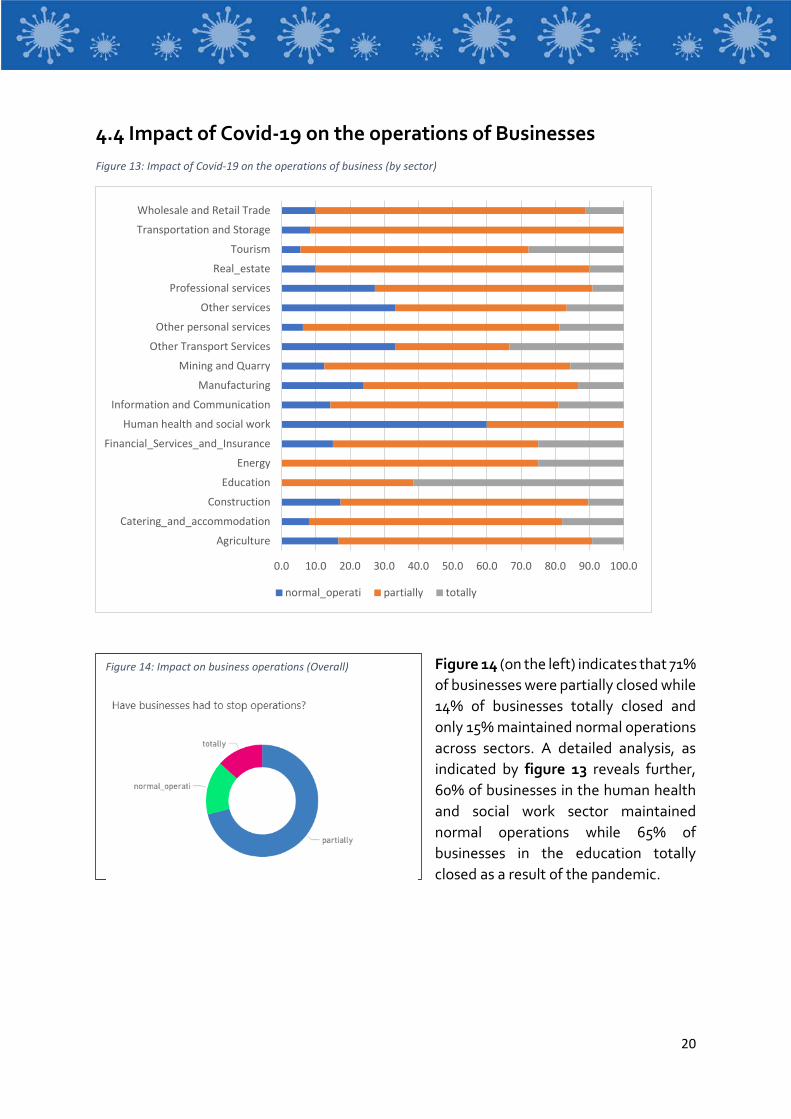
Figure 14 (on the left) indicates that 71% of businesses were partially closed while 14% of businesses totally closed and only 15% maintained normal operations across sectors. A detailed analysis, as indicated by figure 13 reveals further, 60% of businesses in the human health and social work sector maintained normal operations while 65% of businesses in the education totally closed as a result of the pandemic.
0.0 10.0 20.0 30.0 40.0 50.0 60.0 70.0 80.0 90.0 100.0
Agriculture
Catering_and_accommodation
Construction
Education
Energy
Financial_Services_and_Insurance
Human health and social work
Information and Communication
Manufacturing
Mining and Quarry
Other Transport Services
Other personal services
Other services
Professional services
Real_estate
Tourism
Transportation and Storage
Wholesale and Retail Trade
normal_operati partially totally
Figure 14: Impact on business operations (Overall)
21
Figure 15: Impact of Covid-19 on business operations by Province
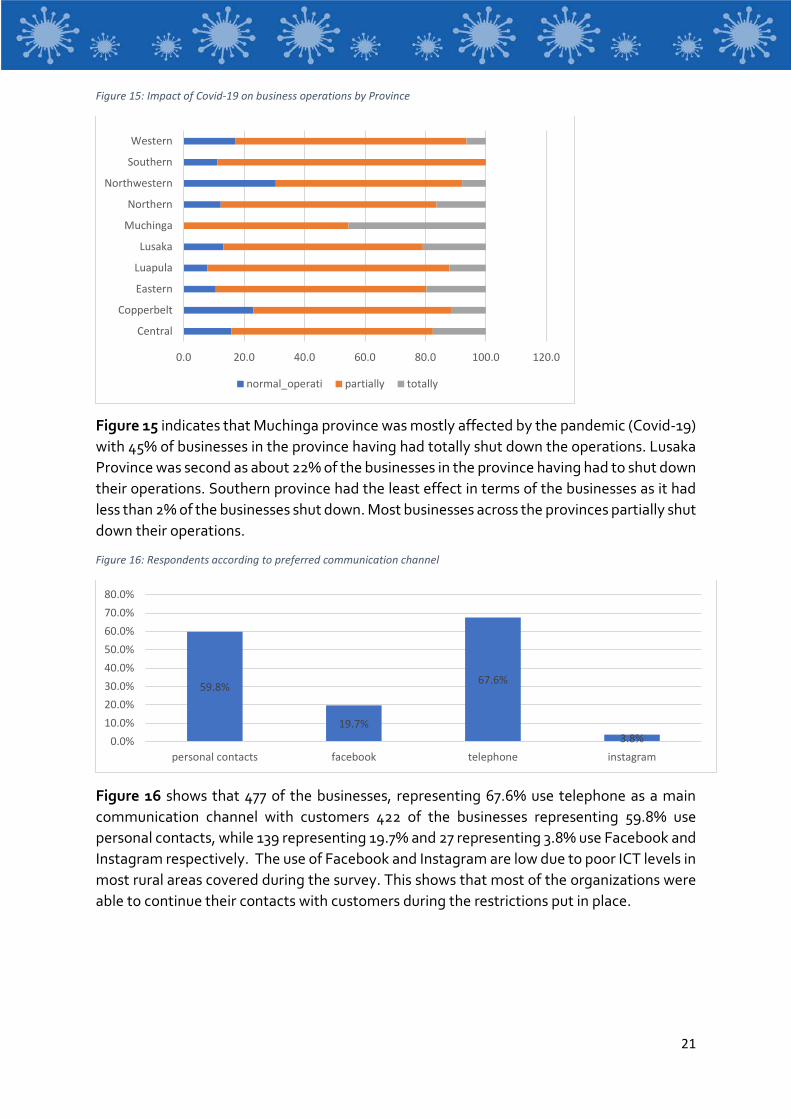
Figure 15 indicates that Muchinga province was mostly affected by the pandemic (Covid-19) with 45% of businesses in the province having had totally shut down the operations. Lusaka Province was second as about 22% of the businesses in the province having had to shut down their operations. Southern province had the least effect in terms of the businesses as it had less than 2% of the businesses shut down. Most businesses across the provinces partially shut down their operations.
Figure 16: Respondents according to preferred communication channel
Figure 16 shows that 477 of the businesses, representing 67.6% use telephone as a main communication channel with customers 422 of the businesses representing 59.8% use personal contacts, while 139 representing 19.7% and 27 representing 3.8% use Facebook and Instagram respectively. The use of Facebook and Instagram are low due to poor ICT levels in most rural areas covered during the survey. This shows that most of the organizations were able to continue their contacts with customers during the restrictions put in place.
0.0 20.0 40.0 60.0 80.0 100.0 120.0
Central
Copperbelt
Eastern
Luapula
Lusaka
Muchinga
Northern
Northwestern
Southern
Western
normal_operati partially totally
59.8%
19.7%
67.6%
3.8%0.0%10.0%20.0%30.0%40.0%50.0%60.0%70.0%80.0%
personal contacts facebook telephone instagram
22
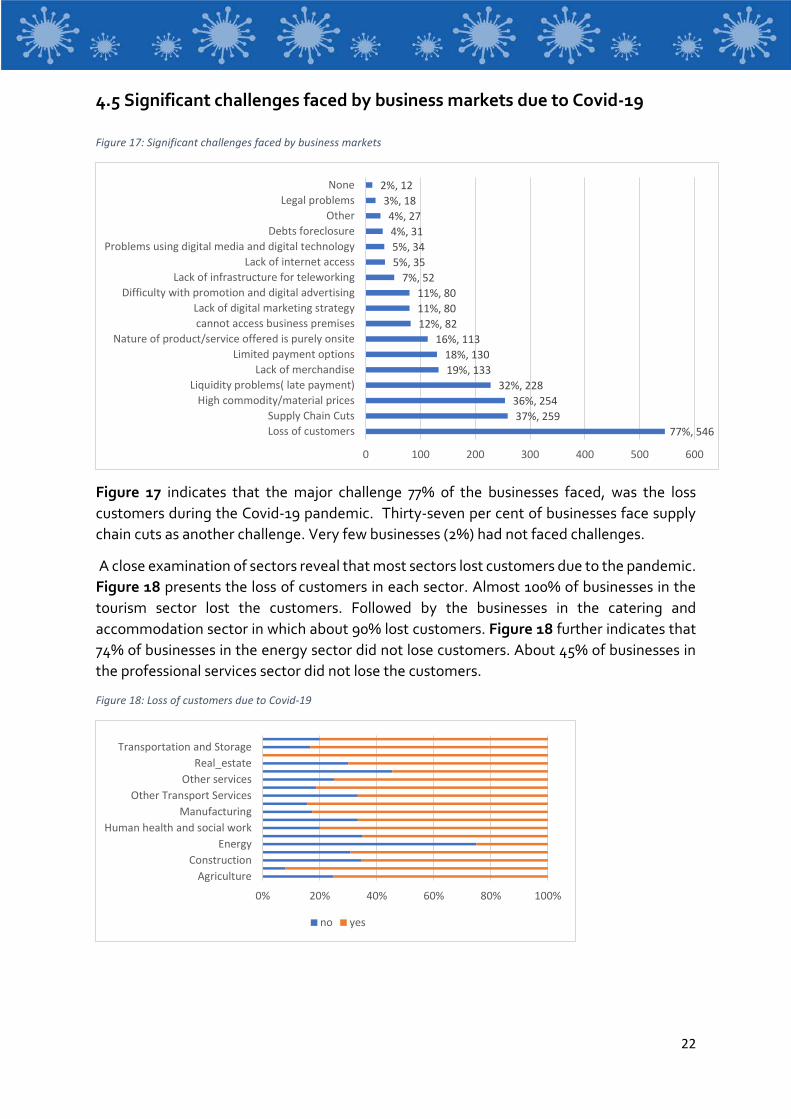
4.5 Significant challenges faced by business markets due to Covid-19 Figure 17: Significant challenges faced by business markets
Figure 17 indicates that the major challenge 77% of the businesses faced, was the loss customers during the Covid-19 pandemic. Thirty-seven per cent of businesses face supply chain cuts as another challenge. Very few businesses (2%) had not faced challenges.
A close examination of sectors reveal that most sectors lost customers due to the pandemic. Figure 18 presents the loss of customers in each sector. Almost 100% of businesses in the tourism sector lost the customers. Followed by the businesses in the catering and accommodation sector in which about 90% lost customers. Figure 18 further indicates that 74% of businesses in the energy sector did not lose customers. About 45% of businesses in the professional services sector did not lose the customers.
Figure 18: Loss of customers due to Covid-19
77%, 54637%, 259
36%, 25432%, 228
19%, 13318%, 130
16%, 11312%, 8211%, 8011%, 80
7%, 525%, 355%, 344%, 314%, 27
3%, 182%, 12
0 100 200 300 400 500 600
Loss of customersSupply Chain Cuts
High commodity/material pricesLiquidity problems( late payment)
Lack of merchandiseLimited payment options
Nature of product/service offered is purely onsitecannot access business premisesLack of digital marketing strategy
Difficulty with promotion and digital advertisingLack of infrastructure for teleworking
Lack of internet accessProblems using digital media and digital technology
Debts foreclosureOther
Legal problemsNone
0% 20% 40% 60% 80% 100%
AgricultureConstruction
EnergyHuman health and social work
ManufacturingOther Transport Services
Other servicesReal_estate
Transportation and Storage
no yes
23
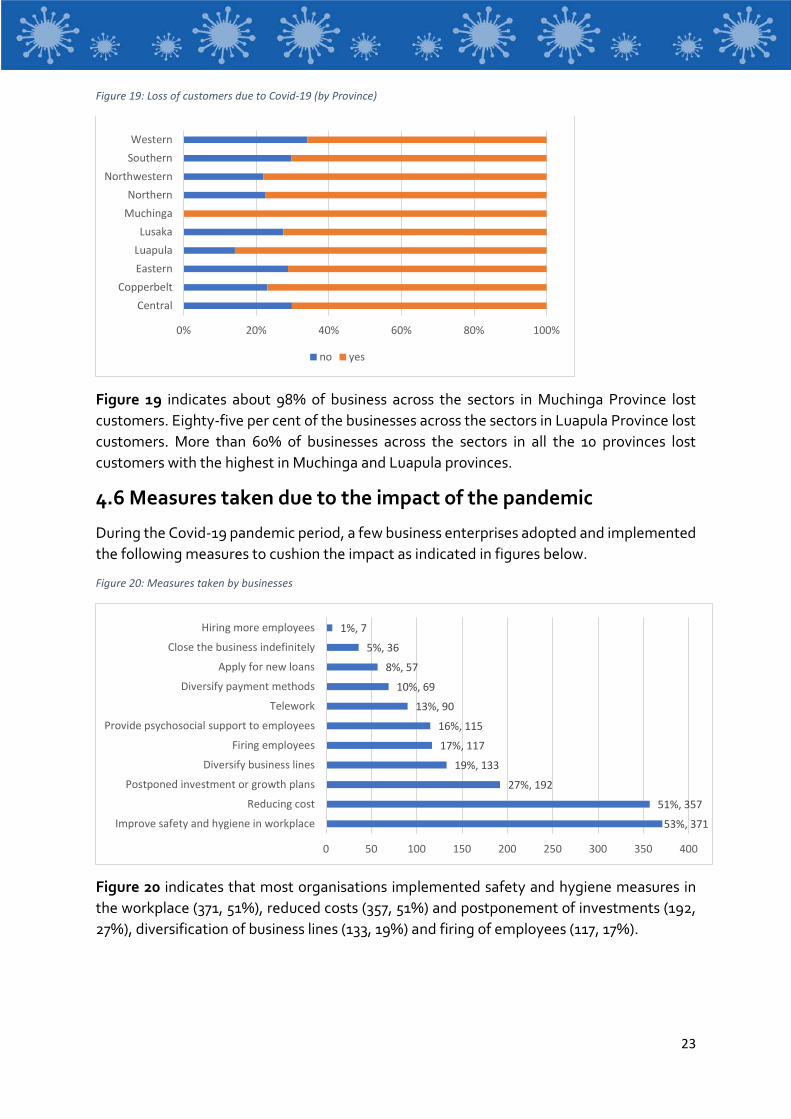
Figure 19: Loss of customers due to Covid-19 (by Province)
Figure 19 indicates about 98% of business across the sectors in Muchinga Province lost customers. Eighty-five per cent of the businesses across the sectors in Luapula Province lost customers. More than 60% of businesses across the sectors in all the 10 provinces lost customers with the highest in Muchinga and Luapula provinces.
4.6 Measures taken due to the impact of the pandemic
During the Covid-19 pandemic period, a few business enterprises adopted and implemented the following measures to cushion the impact as indicated in figures below.
Figure 20: Measures taken by businesses
Figure 20 indicates that most organisations implemented safety and hygiene measures in the workplace (371, 51%), reduced costs (357, 51%) and postponement of investments (192, 27%), diversification of business lines (133, 19%) and firing of employees (117, 17%).
0% 20% 40% 60% 80% 100%
CentralCopperbelt
EasternLuapulaLusaka
MuchingaNorthern
NorthwesternSouthernWestern
no yes
53%, 371
51%, 357
27%, 192
19%, 133
17%, 117
16%, 115
13%, 90
10%, 69
8%, 57
5%, 36
1%, 7
0 50 100 150 200 250 300 350 400
Improve safety and hygiene in workplace
Reducing cost
Postponed investment or growth plans
Diversify business lines
Firing employees
Provide psychosocial support to employees
Telework
Diversify payment methods
Apply for new loans
Close the business indefinitely
Hiring more employees
24
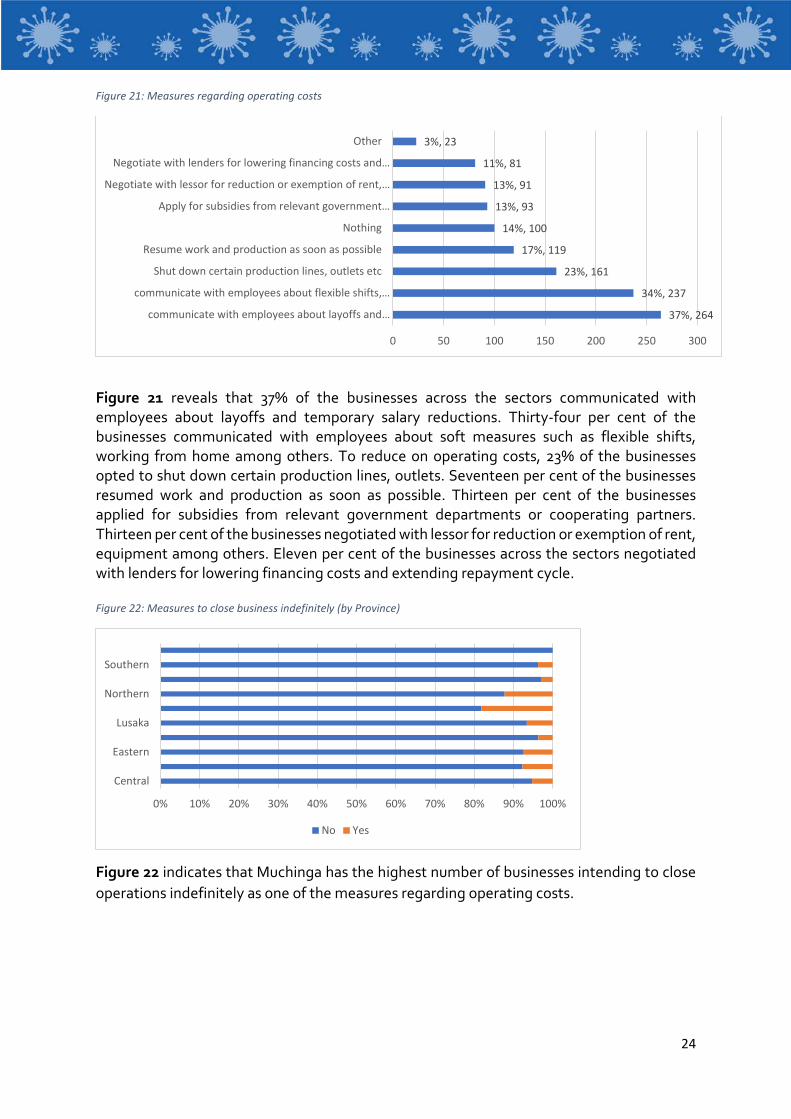
Figure 21: Measures regarding operating costs
Figure 21 reveals that 37% of the businesses across the sectors communicated with employees about layoffs and temporary salary reductions. Thirty-four per cent of the businesses communicated with employees about soft measures such as flexible shifts, working from home among others. To reduce on operating costs, 23% of the businesses opted to shut down certain production lines, outlets. Seventeen per cent of the businesses resumed work and production as soon as possible. Thirteen per cent of the businesses applied for subsidies from relevant government departments or cooperating partners. Thirteen per cent of the businesses negotiated with lessor for reduction or exemption of rent, equipment among others. Eleven per cent of the businesses across the sectors negotiated with lenders for lowering financing costs and extending repayment cycle. Figure 22: Measures to close business indefinitely (by Province)
Figure 22 indicates that Muchinga has the highest number of businesses intending to close operations indefinitely as one of the measures regarding operating costs.
37%, 264
34%, 237
23%, 161
17%, 119
14%, 100
13%, 93
13%, 91
11%, 81
3%, 23
0 50 100 150 200 250 300
communicate with employees about layoffs and…
communicate with employees about flexible shifts,…
Shut down certain production lines, outlets etc
Resume work and production as soon as possible
Nothing
Apply for subsidies from relevant government…
Negotiate with lessor for reduction or exemption of rent,…
Negotiate with lenders for lowering financing costs and…
Other
0% 10% 20% 30% 40% 50% 60% 70% 80% 90% 100%
Central
Eastern
Lusaka
Northern
Southern
No Yes
25
Figure 23: Measures to close business indefinitely (by sector)
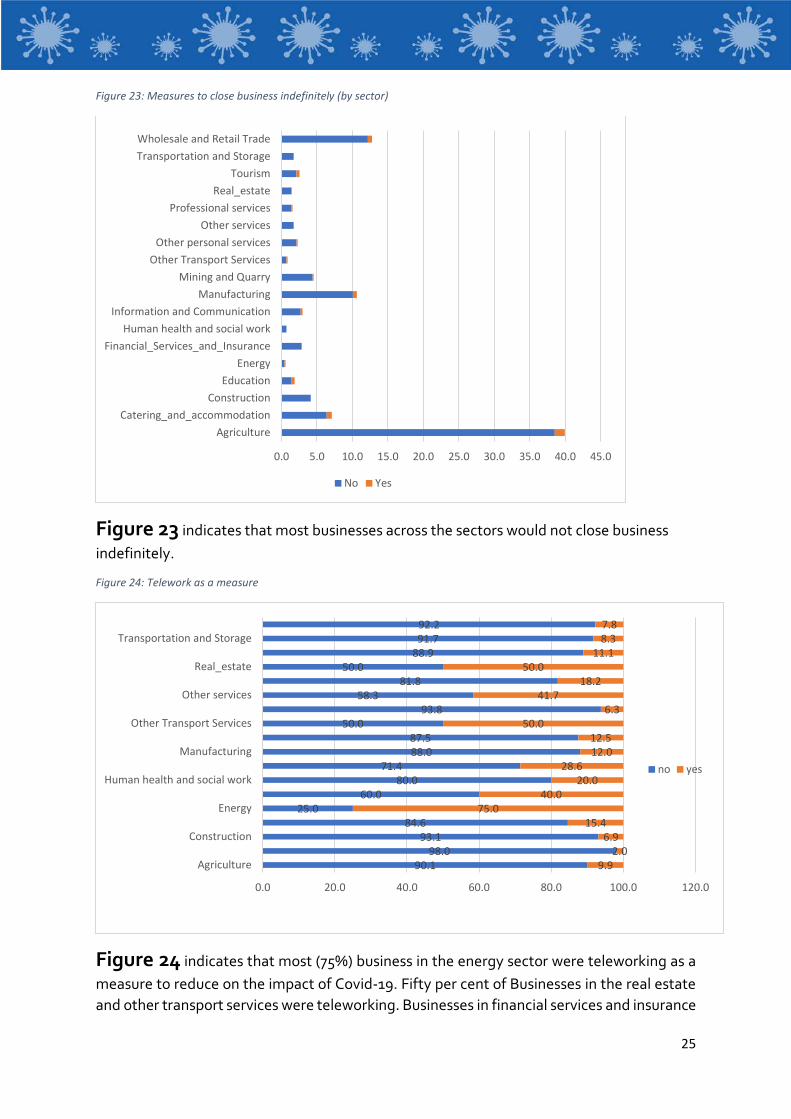
Figure 23 indicates that most businesses across the sectors would not close business indefinitely.
Figure 24: Telework as a measure
Figure 24 indicates that most (75%) business in the energy sector were teleworking as a measure to reduce on the impact of Covid-19. Fifty per cent of Businesses in the real estate and other transport services were teleworking. Businesses in financial services and insurance
0.0 5.0 10.0 15.0 20.0 25.0 30.0 35.0 40.0 45.0
AgricultureCatering_and_accommodation
ConstructionEducation
EnergyFinancial_Services_and_Insurance
Human health and social workInformation and Communication
ManufacturingMining and Quarry
Other Transport ServicesOther personal services
Other servicesProfessional services
Real_estateTourism
Transportation and StorageWholesale and Retail Trade
No Yes
90.198.0
93.184.6
25.060.0
80.071.4
88.087.5
50.093.8
58.381.8
50.088.991.792.2
9.92.0
6.915.4
75.040.0
20.028.6
12.012.5
50.06.3
41.718.2
50.011.1
8.37.8
0.0 20.0 40.0 60.0 80.0 100.0 120.0
Agriculture
Construction
Energy
Human health and social work
Manufacturing
Other Transport Services
Other services
Real_estate
Transportation and Storage
no yes
26
as well as those in other services were also teleworking at 41.7% and 40% respectively. Only 2% of the businesses in the catering and accommodation sector were teleworking. Figure 4 further indicates that businesses across all the sectors were teleworking.
Figure 25: Hiring more employees
Figure 25 indicates that 8.1% of the businesses in the transport and storage sector hiredthe highest number of employees during the period. Followed by mining and quarry which recorded 3.1% of the business reported having hired employees during the period. The business in the agriculture sector also hired employees at 1.8%. The rest of the businesses in other sectors reported not to have hired any employees.
98.2100.0100.0100.0100.0100.0100.0100.0100.0
96.9100.0100.0100.0100.0100.0100.0
91.7100.0
1.80.00.00.00.00.00.00.00.0
3.10.00.00.00.00.00.0
8.30.0
86.0 88.0 90.0 92.0 94.0 96.0 98.0 100.0 102.0
AgricultureCatering_and_accommodation
ConstructionEducation
EnergyFinancial_Services_and_Insurance
Human health and social workInformation and Communication
ManufacturingMining and Quarry
Other Transport ServicesOther personal services
Other servicesProfessional services
Real_estateTourism
Transportation and StorageWholesale and Retail Trade
no yes
27
Figure 26: Postponed investment or growth plans as a measure
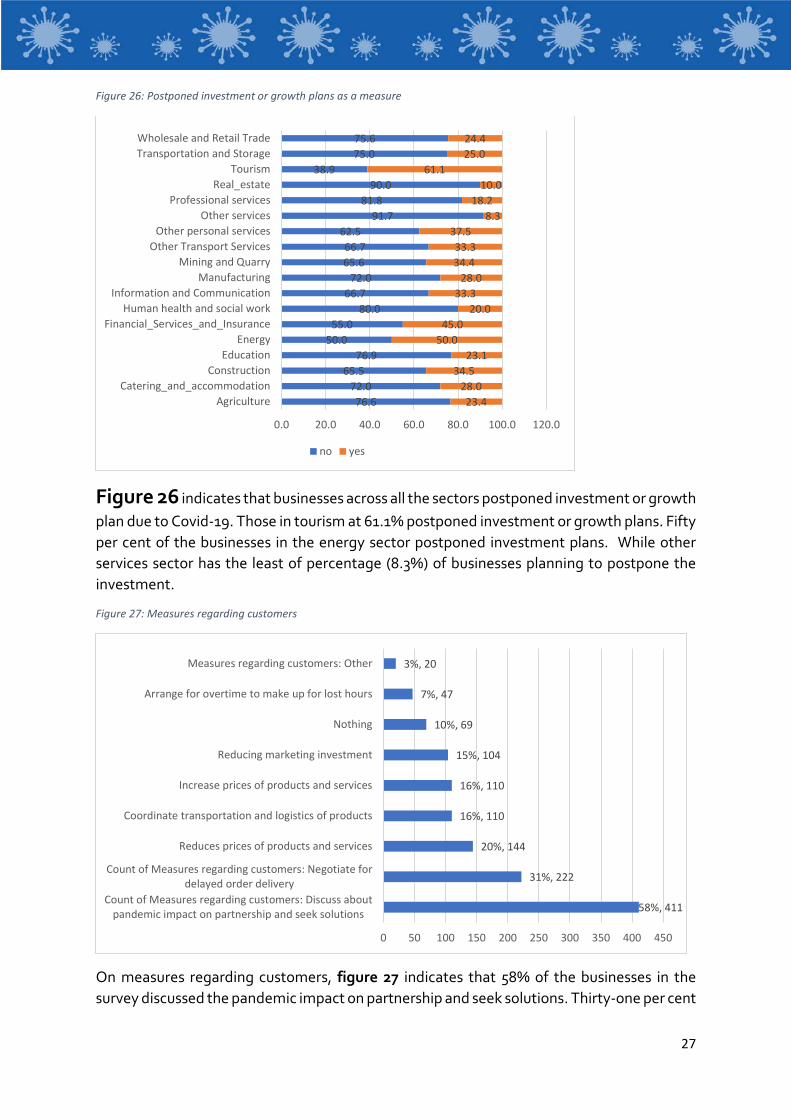
Figure 26 indicates that businesses across all the sectors postponed investment or growth plan due to Covid-19. Those in tourism at 61.1% postponed investment or growth plans. Fifty per cent of the businesses in the energy sector postponed investment plans. While other services sector has the least of percentage (8.3%) of businesses planning to postpone the investment.
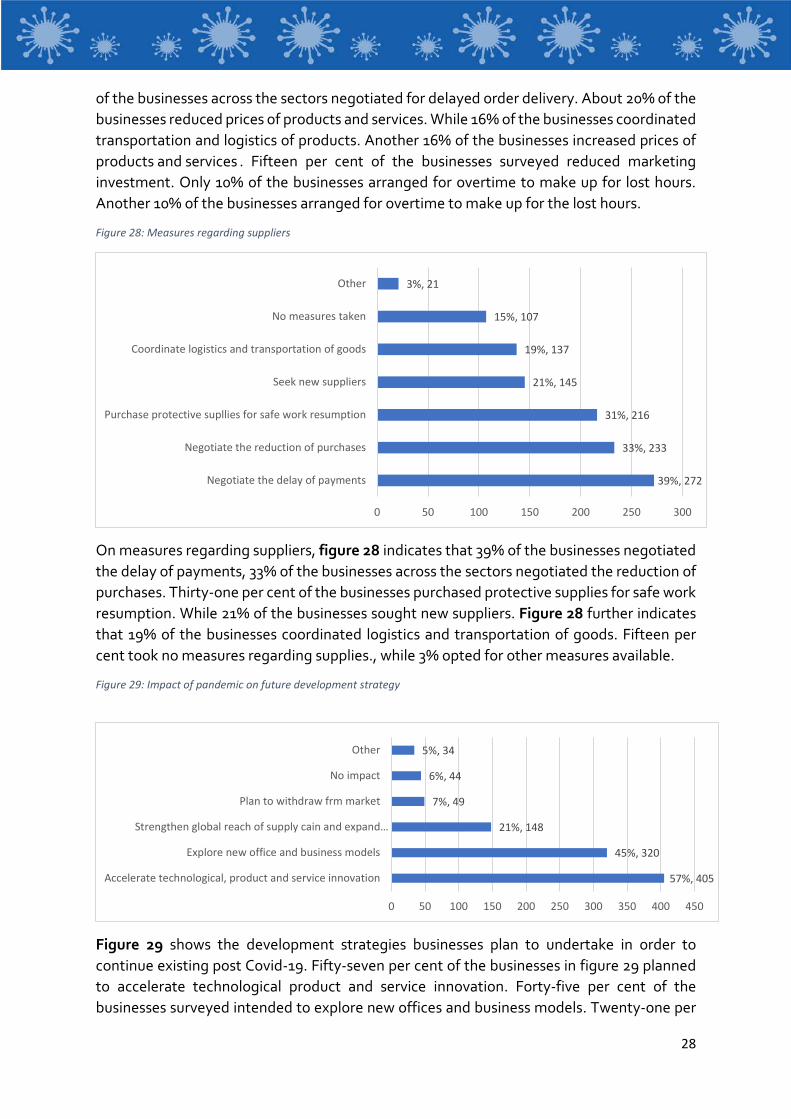
Figure 27: Measures regarding customers
On measures regarding customers, figure 27 indicates that 58% of the businesses in the survey discussed the pandemic impact on partnership and seek solutions. Thirty-one per cent
76.672.0
65.576.9
50.055.0
80.066.7
72.065.666.7
62.591.7
81.890.0
38.975.075.6
23.428.0
34.523.1
50.045.0
20.033.3
28.034.433.3
37.58.3
18.210.0
61.125.024.4
0.0 20.0 40.0 60.0 80.0 100.0 120.0
AgricultureCatering_and_accommodation
ConstructionEducation
EnergyFinancial_Services_and_Insurance
Human health and social workInformation and Communication
ManufacturingMining and Quarry
Other Transport ServicesOther personal services
Other servicesProfessional services
Real_estateTourism
Transportation and StorageWholesale and Retail Trade
no yes
58%, 411
31%, 222
20%, 144
16%, 110
16%, 110
15%, 104
10%, 69
7%, 47
3%, 20
0 50 100 150 200 250 300 350 400 450
Count of Measures regarding customers: Discuss aboutpandemic impact on partnership and seek solutions
Count of Measures regarding customers: Negotiate fordelayed order delivery
Reduces prices of products and services
Coordinate transportation and logistics of products
Increase prices of products and services
Reducing marketing investment
Nothing
Arrange for overtime to make up for lost hours
Measures regarding customers: Other
28
of the businesses across the sectors negotiated for delayed order delivery. About 20% of the businesses reduced prices of products and services. While 16% of the businesses coordinated transportation and logistics of products. Another 16% of the businesses increased prices of products and services . Fifteen per cent of the businesses surveyed reduced marketing investment. Only 10% of the businesses arranged for overtime to make up for lost hours. Another 10% of the businesses arranged for overtime to make up for the lost hours.
Figure 28: Measures regarding suppliers
On measures regarding suppliers, figure 28 indicates that 39% of the businesses negotiated the delay of payments, 33% of the businesses across the sectors negotiated the reduction of purchases. Thirty-one per cent of the businesses purchased protective supplies for safe work resumption. While 21% of the businesses sought new suppliers. Figure 28 further indicates that 19% of the businesses coordinated logistics and transportation of goods. Fifteen per cent took no measures regarding supplies., while 3% opted for other measures available.
Figure 29: Impact of pandemic on future development strategy
Figure 29 shows the development strategies businesses plan to undertake in order to continue existing post Covid-19. Fifty-seven per cent of the businesses in figure 29 planned to accelerate technological product and service innovation. Forty-five per cent of the businesses surveyed intended to explore new offices and business models. Twenty-one per
39%, 272
33%, 233
31%, 216
21%, 145
19%, 137
15%, 107
3%, 21
0 50 100 150 200 250 300
Negotiate the delay of payments
Negotiate the reduction of purchases
Purchase protective supllies for safe work resumption
Seek new suppliers
Coordinate logistics and transportation of goods
No measures taken
Other
57%, 405
45%, 320
21%, 148
7%, 49
6%, 44
5%, 34
0 50 100 150 200 250 300 350 400 450
Accelerate technological, product and service innovation
Explore new office and business models
Strengthen global reach of supply cain and expand…
Plan to withdraw frm market
No impact
Other
29
cent of the businesses were strengthening global reach of supply chain and expand overseas market. The rest (7%) of the of the businesses planned to withdraw from the market or does not see any impact (6%).
4.7 Support needed by business This section covers any form of assistance business entities received and from whom, and what assistance they require to economically reactivate their businesses.
Figure 30: Support provided
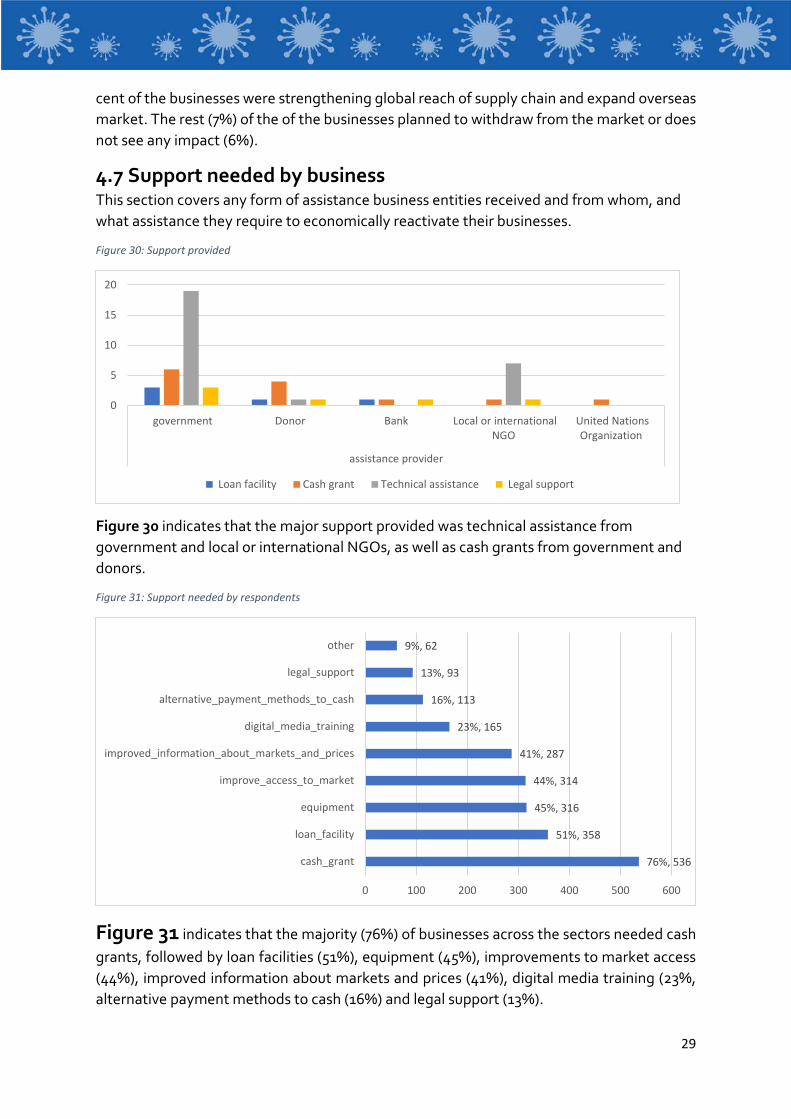
Figure 30 indicates that the major support provided was technical assistance from government and local or international NGOs, as well as cash grants from government and donors.
Figure 31: Support needed by respondents
Figure 31 indicates that the majority (76%) of businesses across the sectors needed cashgrants, followed by loan facilities (51%), equipment (45%), improvements to market access (44%), improved information about markets and prices (41%), digital media training (23%, alternative payment methods to cash (16%) and legal support (13%).
0
5
10
15
20
government Donor Bank Local or internationalNGO
United NationsOrganization
assistance provider
Loan facility Cash grant Technical assistance Legal support
76%, 536
51%, 358
45%, 316
44%, 314
41%, 287
23%, 165
16%, 113
13%, 93
9%, 62
0 100 200 300 400 500 600
cash_grant
loan_facility
equipment
improve_access_to_market
improved_information_about_markets_and_prices
digital_media_training
alternative_payment_methods_to_cash
legal_support
other
30
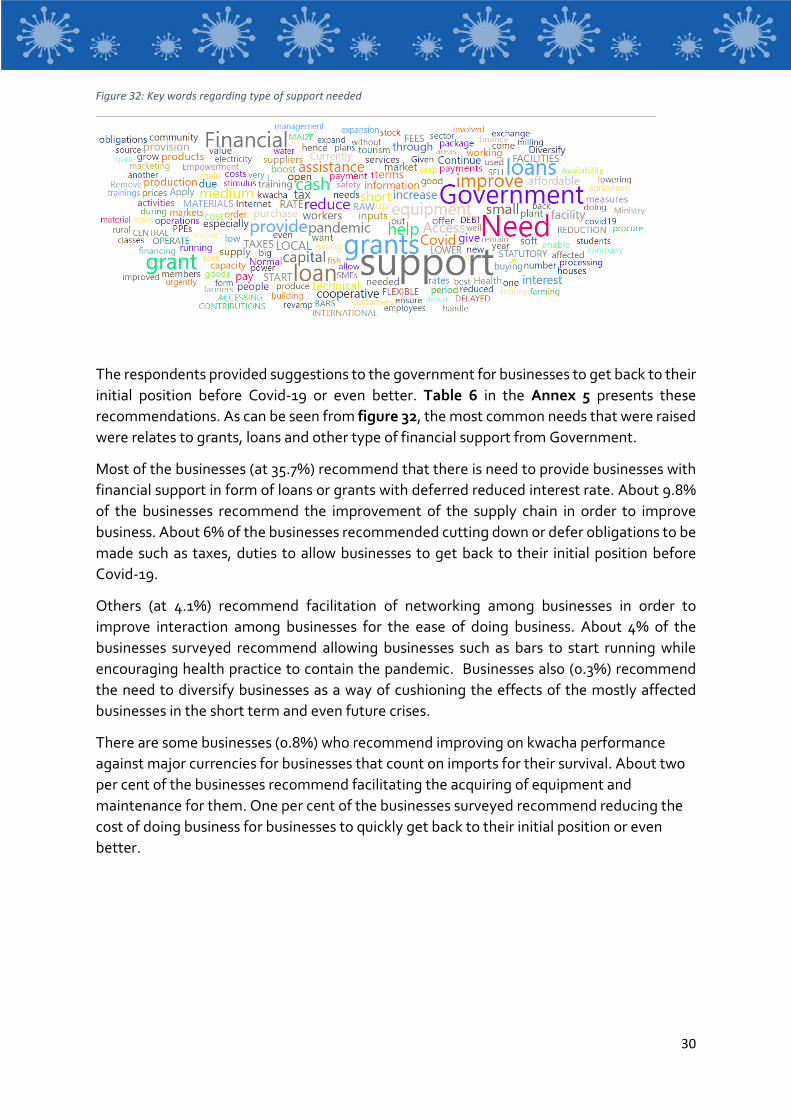
Figure 32: Key words regarding type of support needed
The respondents provided suggestions to the government for businesses to get back to their initial position before Covid-19 or even better. Table 6 in the Annex 5 presents these recommendations. As can be seen from figure 32, the most common needs that were raised were relates to grants, loans and other type of financial support from Government.
Most of the businesses (at 35.7%) recommend that there is need to provide businesses with financial support in form of loans or grants with deferred reduced interest rate. About 9.8% of the businesses recommend the improvement of the supply chain in order to improve business. About 6% of the businesses recommended cutting down or defer obligations to be made such as taxes, duties to allow businesses to get back to their initial position before Covid-19.
Others (at 4.1%) recommend facilitation of networking among businesses in order to improve interaction among businesses for the ease of doing business. About 4% of the businesses surveyed recommend allowing businesses such as bars to start running while encouraging health practice to contain the pandemic. Businesses also (0.3%) recommend the need to diversify businesses as a way of cushioning the effects of the mostly affected businesses in the short term and even future crises.
There are some businesses (0.8%) who recommend improving on kwacha performance against major currencies for businesses that count on imports for their survival. About two per cent of the businesses recommend facilitating the acquiring of equipment and maintenance for them. One per cent of the businesses surveyed recommend reducing the cost of doing business for businesses to quickly get back to their initial position or even better.
31
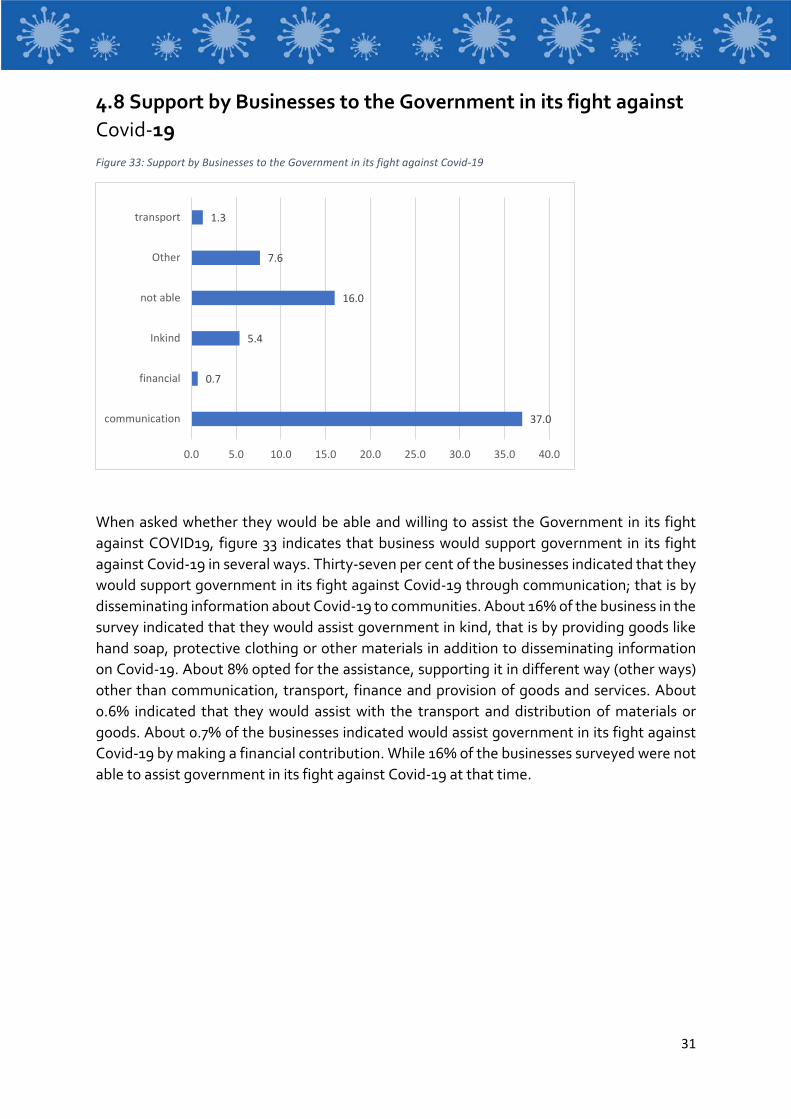
4.8 Support by Businesses to the Government in its fight against Covid-19
Figure 33: Support by Businesses to the Government in its fight against Covid-19
When asked whether they would be able and willing to assist the Government in its fight against COVID19, figure 33 indicates that business would support government in its fight against Covid-19 in several ways. Thirty-seven per cent of the businesses indicated that they would support government in its fight against Covid-19 through communication; that is by disseminating information about Covid-19 to communities. About 16% of the business in the survey indicated that they would assist government in kind, that is by providing goods like hand soap, protective clothing or other materials in addition to disseminating information on Covid-19. About 8% opted for the assistance, supporting it in different way (other ways) other than communication, transport, finance and provision of goods and services. About 0.6% indicated that they would assist with the transport and distribution of materials or goods. About 0.7% of the businesses indicated would assist government in its fight against Covid-19 by making a financial contribution. While 16% of the businesses surveyed were not able to assist government in its fight against Covid-19 at that time.
37.0
0.7
5.4
16.0
7.6
1.3
0.0 5.0 10.0 15.0 20.0 25.0 30.0 35.0 40.0
communication
financial
Inkind
not able
Other
transport
32
5.0 Policy Recommendations
In mitigating the impact of Covid-19 on Zambian Businesses and achieve economic recovery, it is important that stakeholders – including government agencies, international organizations, commercial partners, financial institutions as well as enterprises – to jointly work together. Based on the analysis of the findings and of the information received from surveys, the Report offers the following recommendations for these five main stakeholders:
5.1 Government:
(i) Set up a coordinated policy package to address the current challenges In view of the challenges experienced as a result of the Covid-19 pandemic, it was noted that there is need for government to put up deliberate policies that will ensure continuity in the event of disruptions in the economy. Specifically, government should:
(a) Analyze relevant policies on public emergencies, selecting and
classifying them according to time horizons (short-term, medium and long term) and type (fiscal, financial, service improvement, etc.);
(b) Develop and implement policies that support access to affordable financing and flexible payment periods, timely payment to suppliers of goods and services by Government, and offer relief from payment of statutory obligations (ZRA, NAPSA and Council Levy) during emergency times, This was mentioned by 35.7% of the respondents as an urgent need; and
(c) Ensure thorough consultations with all relevant institutions when developing
an emergency policy response such as the K10 billion stimulus package aimed at providing medium term liquidity facility to help enterprises cope with the pandemic. The Report notes the need to establish clear modalities on how the policy measure will be implemented.
(ii) Ensure timely Implementation of policies to achieve greater impact. According
to the findings, many Zambian Businesses have reduced their operations affecting their cash flow which calls for urgent and timely government support to prevent these companies from collapsing.
33
(iii) Strengthen cooperation with the Private Sector in fighting Covid19; The survey showed that there is great willingness from the private sector to contribute to the fight against Covid19 that the Government can tap into more. The respondents not only indicated their willingness to communicate the risks and measures to prevent Covid19 to their staff (37%), but also that they would assist government in kind (16%), by providing goods like hand soap, protective clothing or other materials. Another 8% of the respondents was willing to support Government in different ways.
(iv) Strengthen local testing capacity to meet international standards;
Government should invest in strengthening capacity of local testing institutions to meet international standards, as the survey showed that due to travel restrictions some companies were not able send their samples for testing abroad, prior to exporting their goods internationally.
(v) Standard Operating Procedures: There is the need to develop Standard
Operating Procedures per Sector that preserve health and safety of workers and customers in the context of Covid-19 as restrictions are being lifted.
(vi) Covid19 Business Platform; Government will strengthen the existing platforms
where businesses can find opportunities to contribute to the fight against Covid19 and learn how other companies are adopting their businesses to Covid19 successfully. Such ‘success stories’ of those who managed to meet demand for goods and services urged by pandemic will be both motivational and guidance material for those who still struggle through the situation.
(vii) Grants for MSMEs to adopt: Most of the businesses (at 35.7%) recommended
that there is need to provide businesses with financial support in form of loans or grants with deferred reduced interest rate. To this end Government in close cooperation with its Cooperating Partners will explore grant mechanisms and financing opportunities that can support enterprises to stimulate revitalization of the complicated economic situation and provide people who lost their jobs due to pandemic with self-employment and income-generation opportunities.
(viii) Review National Industrial Policy; Government will take stock of the National
Industry Policy and where needed, update its implementation plan in light of the findings from this Survey and Covid19.
34
5.2 Enterprises:
(i) Adaptation to market changes to capture new demand. Enterprises should actively study and capture changes in market demand and take actions promptly to reduce negative impacts by rapidly adjusting their manufacturing plan and sales strategy. For instance, some companies have voluntarily shifted to manufacturing Personal Protective Equipment (PPEs) supplies, benefitting both themselves and society. Others have also been speeding-up their business transformations to adapt to consumer preferences and competition patterns that may change after the pandemic.
(ii) Streamline businesses and reduce costs rapidly. When confronted with sudden crises, enterprises should take timely measures to preserve cash flow. For enterprises suffering from heavy losses, measures such as telecommunication, employee time-sharing and stimulating employees’ creativity for new business models should be fully explored, before considering layoffs and salary cuts.
(iii) Enhanced risk management. The pandemic has highlighted the importance of risk management. Therefore, there is need for enterprises to have a sound risk management to prepare to cushion the adverse effects of future emergencies. Furthermore, there is the need to apply the Governments Standard Operating Procedures per Sector that preserve health and safety of workers and customers in the context of Covid-1919 as restrictions are being lifted.
5.3 Financial institutions:
(i) Improve credit provision. The report recommends the provision of credit guarantee schemes to support MSMEs access to financial resources by Government and its Cooperating Partners. This should to be supplemented with the support of commercial banks. Private lending, inclusive finance and online banking, among others, could also provide timely financial support for SMEs.
(iv) Development of new financial products. In the medium and long-term, it is necessary to consider innovative financial products, so as to provide more diversified financing channels for MSMEs, as well as helping them finance in more effective ways and at lower costs.
5.4 Commercial partners:
(i) Enhance communication and mutual trust. Commercial partners should
enhance communication with forward and backward business linkages along
35
the supply chains, improve mutual understanding, trust and support, and jointly identify solutions through collaboration and coordination;
(ii) Protection and unlocking value chains. Commercial partners should, through networks such as international and local organizations, identify value chains barriers on time, and jointly take measures to solve bottlenecks related to the supply of inputs and logistics. About 9.8% of the respondents to the survey recommended the improvement of supply chains in order to improve their business; and
(iii) Diffuse risks of supply chains by sourcing more locally. Joint efforts by Government and Private Sector should be made to explore optimized supply chain models where Zambia has a comparative advantage with a level of diversification to disperse potential risks and to create value and sustainable jobs locally. Commercial partners should share the negative impacts of unforeseeable circumstances and try to balance expectations and demands of all parties. Commercial partners with global supply chains should also explore and develop alterative supply chain options within the COMESA and SADC regions, in order to improve business resilience when global events such as Covid-19 happen.
5.5 The international community:
(i) Encourage international exchanges and policy coordination, such as preventing and controlling the Covid-19 pandemic, drug research and development, as well as public governance. This will help to increase the transparency of data provided regarding the spread of the virus and latest situation, enhance public knowledge on pandemic prevention and control, as well as empower governments to combat the pandemic more effectively and scientifically (e.g. jointly pushing for a vaccine on an accelerated path). It will also strengthen understanding and trust among countries during global emergencies and deepen international economic cooperation to safeguard pandemic-hit value chains.
(ii) Reinforce global economic analysis with a focus on value chains. A global database on the status of major value chains and how they have been impacted by the pandemic should be established. This can serve as a basis for all relevant stakeholders to jointly promote the recovery of the chains themselves and reduce risks.
(iii) Develop capacity-building of enterprises to pursue best practices in the following aspects: coping with emergencies, public crisis, and enhancing resilience; building the capacity for sustainable development and SDGs attainment; speeding up digital transformation, etc.
36
(iv) Beyond Stabilization; Development Partners, including the United Nations are ready to assist Government to take on the longer-term challenge of transitioning to a more sustainable economy and working with its key partners support the co-design of a green stimulus package to address the economic crisis (growing inequalities) and the climate crisis. This work would fall into 4 areas: 1) Impact investment for the transition to a green economy;2) Green businesses and green jobs through local economic development, urban planning, sustainable homes, sustainable procurement, and innovation.3) Nature-based solutions and green infrastructure; 4) Social protection system that adequately protect vulnerable workers in the labour market.
ANNEXES
37
38
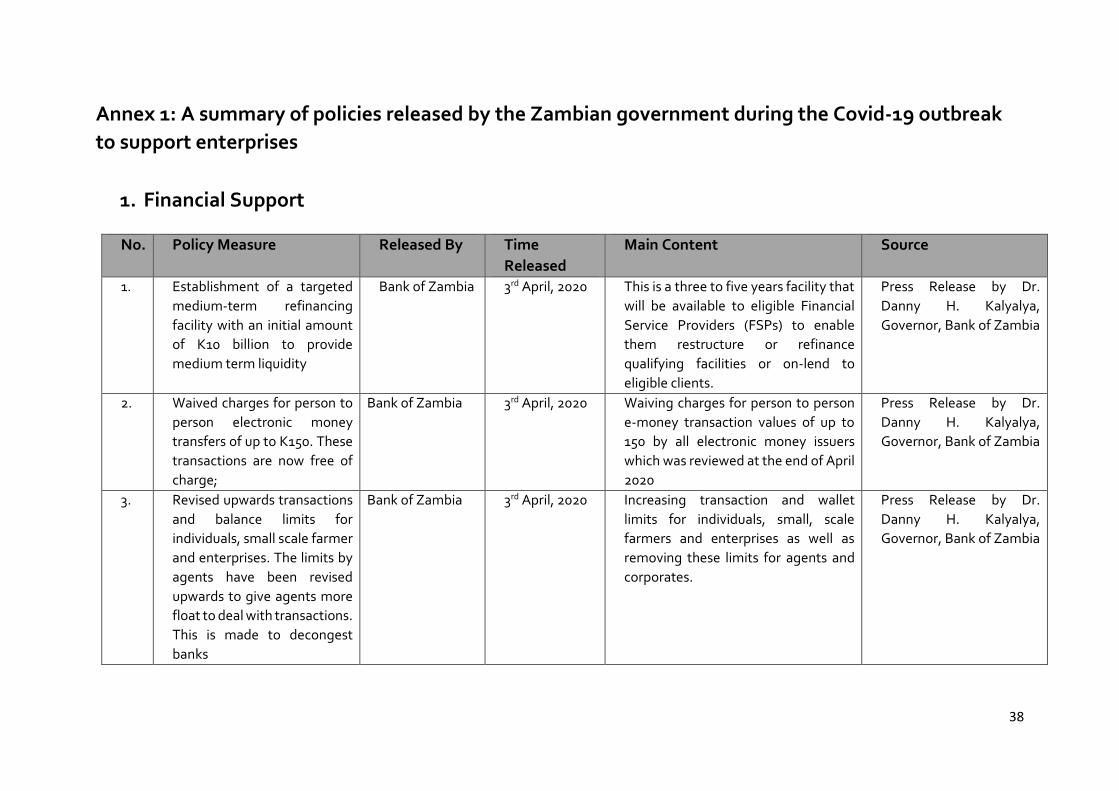
Annex 1: A summary of policies released by the Zambian government during the Covid-19 outbreak to support enterprises
1. Financial Support
No. Policy Measure Released By Time Released
Main Content Source
1. Establishment of a targeted medium-term refinancing facility with an initial amount of K10 billion to provide medium term liquidity
Bank of Zambia 3rd April, 2020 This is a three to five years facility that will be available to eligible Financial Service Providers (FSPs) to enable them restructure or refinance qualifying facilities or on-lend to eligible clients.
Press Release by Dr. Danny H. Kalyalya, Governor, Bank of Zambia
2. Waived charges for person to person electronic money transfers of up to K150. These transactions are now free of charge;
Bank of Zambia 3rd April, 2020 Waiving charges for person to person e-money transaction values of up to 150 by all electronic money issuers which was reviewed at the end of April 2020
Press Release by Dr. Danny H. Kalyalya, Governor, Bank of Zambia
3. Revised upwards transactions and balance limits for individuals, small scale farmer and enterprises. The limits by agents have been revised upwards to give agents more float to deal with transactions. This is made to decongest banks
Bank of Zambia 3rd April, 2020 Increasing transaction and wallet limits for individuals, small, scale farmers and enterprises as well as removing these limits for agents and corporates.
Press Release by Dr. Danny H. Kalyalya, Governor, Bank of Zambia
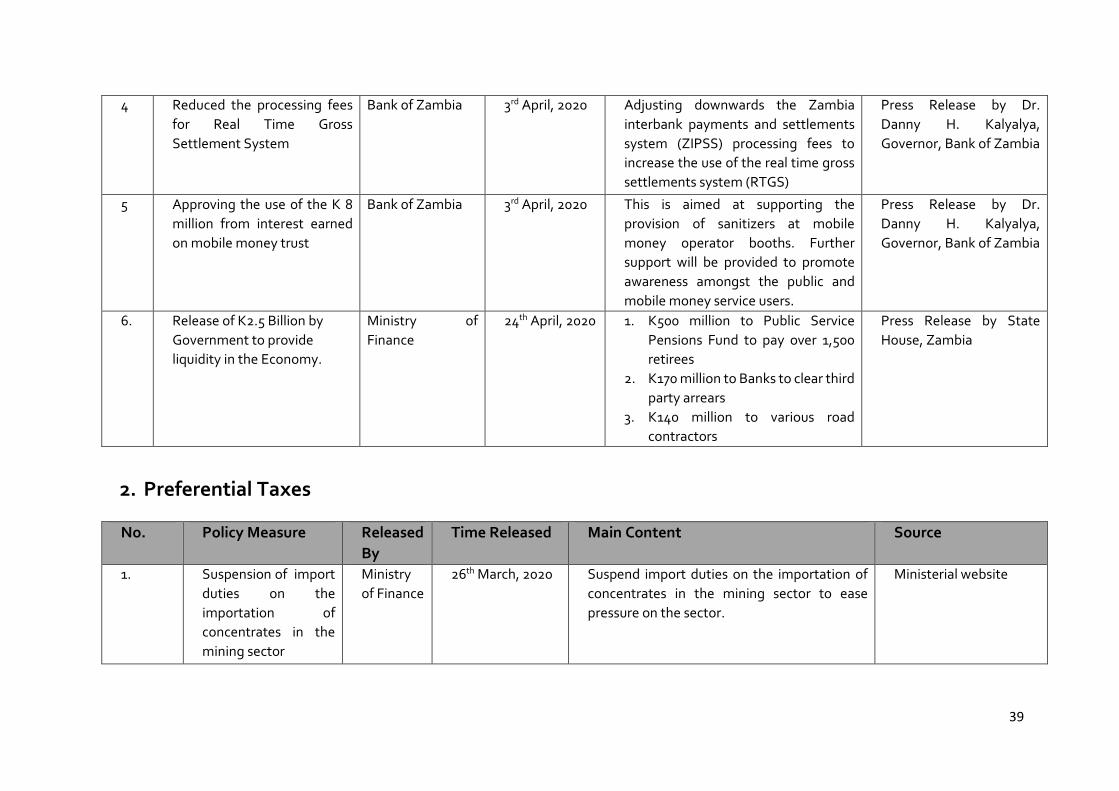
39
4 Reduced the processing fees for Real Time Gross Settlement System
Bank of Zambia 3rd April, 2020 Adjusting downwards the Zambia interbank payments and settlements system (ZIPSS) processing fees to increase the use of the real time gross settlements system (RTGS)
Press Release by Dr. Danny H. Kalyalya, Governor, Bank of Zambia
5 Approving the use of the K 8 million from interest earned on mobile money trust
Bank of Zambia 3rd April, 2020 This is aimed at supporting the provision of sanitizers at mobile money operator booths. Further support will be provided to promote awareness amongst the public and mobile money service users.
Press Release by Dr. Danny H. Kalyalya, Governor, Bank of Zambia
6. Release of K2.5 Billion by Government to provide liquidity in the Economy.
Ministry of Finance
24th April, 2020 1. K500 million to Public ServicePensions Fund to pay over 1,500retirees
2. K170 million to Banks to clear third party arrears
3. K140 million to various roadcontractors
Press Release by State House, Zambia
2. Preferential Taxes
No. Policy Measure Released By
Time Released Main Content Source
1. Suspension of import duties on the importation of concentrates in the mining sector
Ministry of Finance
26th March, 2020 Suspend import duties on the importation of concentrates in the mining sector to ease pressure on the sector.
Ministerial website
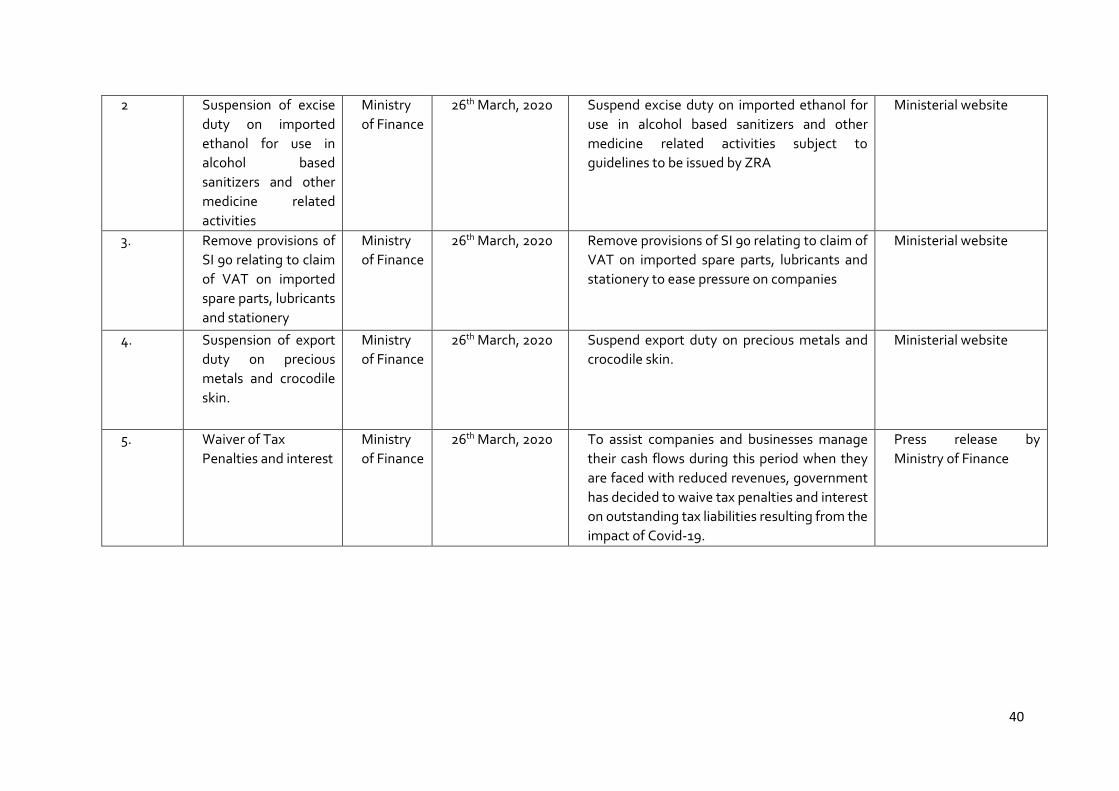
40
2 Suspension of excise duty on imported ethanol for use in alcohol based sanitizers and other medicine related activities
Ministry of Finance
26th March, 2020 Suspend excise duty on imported ethanol for use in alcohol based sanitizers and other medicine related activities subject to guidelines to be issued by ZRA
Ministerial website
3. Remove provisions of SI 90 relating to claim of VAT on imported spare parts, lubricants and stationery
Ministry of Finance
26th March, 2020 Remove provisions of SI 90 relating to claim of VAT on imported spare parts, lubricants and stationery to ease pressure on companies
Ministerial website
4. Suspension of export duty on precious metals and crocodile skin.
Ministry of Finance
26th March, 2020 Suspend export duty on precious metals and crocodile skin.
Ministerial website
5. Waiver of Tax Penalties and interest
Ministry of Finance
26th March, 2020 To assist companies and businesses manage their cash flows during this period when they are faced with reduced revenues, government has decided to waive tax penalties and interest on outstanding tax liabilities resulting from the impact of Covid-19.
Press release by Ministry of Finance
41
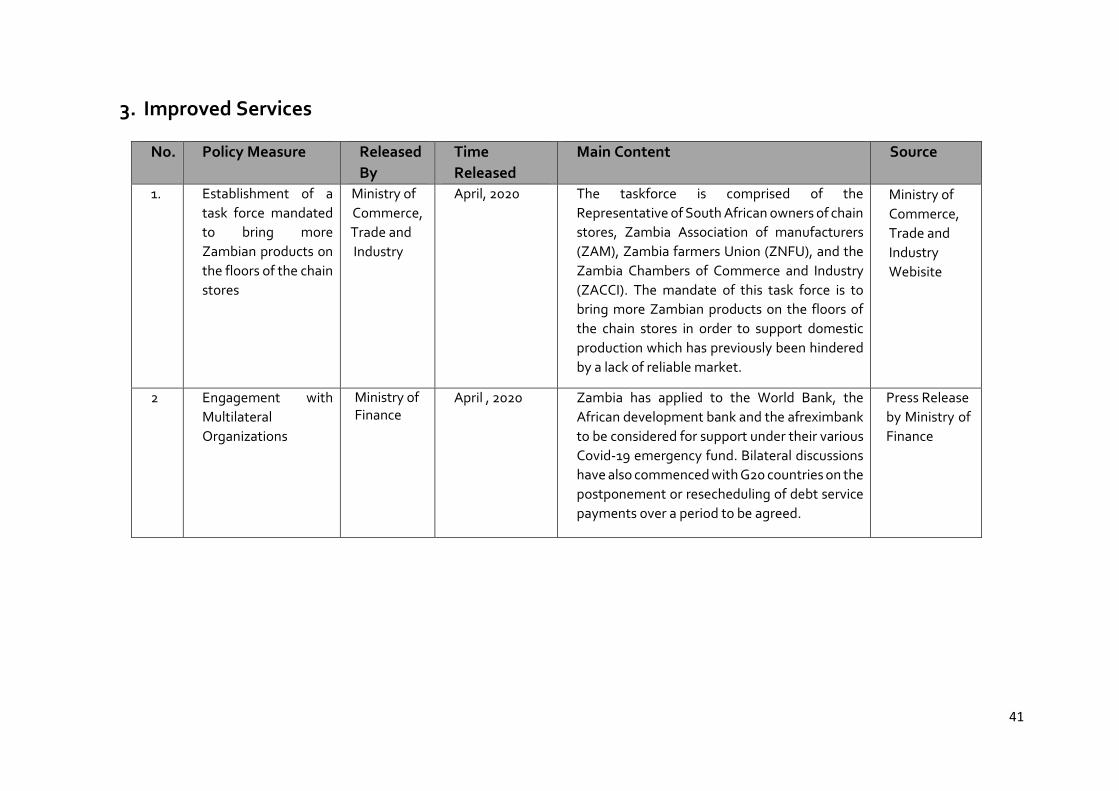
3. Improved Services
No. Policy Measure Released By
Time Released
Main Content Source
1. Establishment of a task force mandated to bring more Zambian products on the floors of the chain stores
Ministry of Commerce,Trade and Industry
April, 2020 The taskforce is comprised of the Representative of South African owners of chain stores, Zambia Association of manufacturers (ZAM), Zambia farmers Union (ZNFU), and the Zambia Chambers of Commerce and Industry (ZACCI). The mandate of this task force is to bring more Zambian products on the floors of the chain stores in order to support domestic production which has previously been hindered by a lack of reliable market.
Ministry of Commerce,Trade and Industry Webisite
2 Engagement with Multilateral Organizations
Ministry of Finance
April , 2020 Zambia has applied to the World Bank, the African development bank and the afreximbank to be considered for support under their various Covid-19 emergency fund. Bilateral discussions have also commenced with G20 countries on the postponement or resecheduling of debt service payments over a period to be agreed.
Press Release by Ministry ofFinance
42
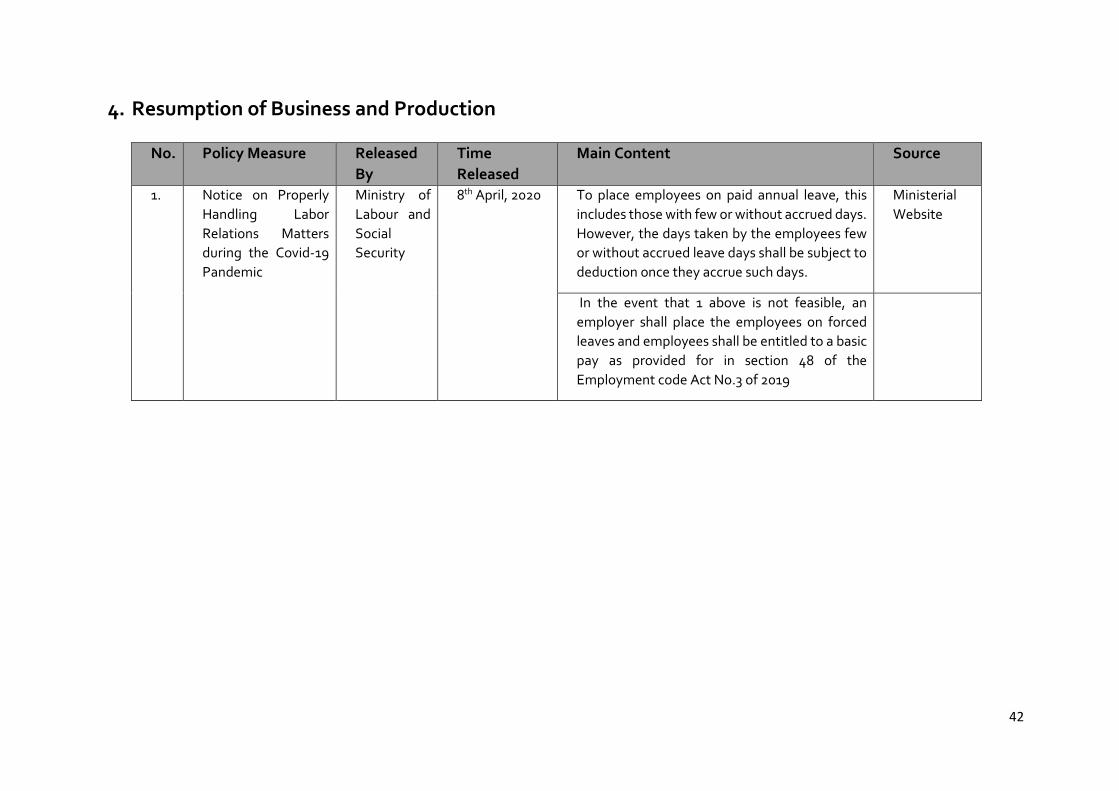
4. Resumption of Business and Production
No. Policy Measure Released By
Time Released
Main Content Source
1. Notice on Properly Handling Labor Relations Matters during the Covid-19 Pandemic
Ministry of Labour and Social Security
8th April, 2020 To place employees on paid annual leave, this includes those with few or without accrued days. However, the days taken by the employees few or without accrued leave days shall be subject to deduction once they accrue such days.
Ministerial Website
In the event that 1 above is not feasible, an employer shall place the employees on forced leaves and employees shall be entitled to a basic pay as provided for in section 48 of the Employment code Act No.3 of 2019
43
Annex 2: Survey
Survey on the Impact of the Covid-19 Pandemic on Zambian Enterprises
May, 2020
Introduction
Dear respondent, thank you for your interest and time to take this survey. The objective of the survey is to learn about the socio-economic situation of large, micro, small and medium-sized enterprises affected by the Covid-19 crisis, in order to propose comprehensive actions aimed at improving their economic situation and situation in the market.
The survey collects information that will be digitally mapped and aggregated by region, sector and size of business. 15 minutes of your time and some clicks will allow us to produce dashboards and reports showing trends, aggregated numbers and tendencies, never personal data. The dashboards and reports will inform the support measures required. This survey is designed by UNDP and the Ministry of Commerce, Trade and Industry.
Respondent
Name and Surname ……………………………………….
E-mail …………………………@………………………….
Gender
� Male
� Female
What is your position at the company that you are completing the survey for?
� Owner
� Board member
� Director
� Employee
Age range
� 15-24 years old
44
� 25-34 years old
� 35-44 years old
� 45-55 years old
� 56-65 years old
� Above 65
Basic information about your company
Company Name: ……………………………………………………..
Place of Business Province
� Central Province
� Copperbelt Province
� Eastern Province
� Luapula Province
� Lusaka Province
� Muchinga Province
� Northern Province
� Northwestern Province
� Southern Province
� Western Province
District ……………………………………
City or Town ………………………………………..
45
Estimated operating revenue in 2019 (KW) …………………………..
Number of employees currently (tick appropriate ):
� 1 employee
� 2-5 employees
� 6-10 employees
� 11-15 employees
� 16-50 employees
� 51-250 employees
� More than 250 employees
Percentage of Female employees:
…… Percentage
Number of employees before Covid-19 outbreak (tick appropriate): � 1 employee
� 2-5 employees
� 5-10 employees
� 11-15 employees
� 16-50 employees
� 51-250 employees
� More than 250 employees
Are your employees covered by Health Insurance? � Covered through the National Health Insurance Scheme
� Covered by Private Health Insurance (additional)
� Don't know
� No employees are covered
Sector (tick appropriate)
� Agriculture
� Beauty and well-being
� Catering_and_accommodation
46
� Commerce_and_trade
� Construction
� Energy
� Environmental protection
� Financial_Services_and_Insurance
� Food Processing
� Internet_and_Telecom
� Livestock
� Logistics
� Manufacturing
� Medical
� Mining
� Real estate
� Tourism
� Transportation
� Other, ……………………………………………
Major market (tick appropriate):
� Domestic market
� Regional International market
� International market
II. The impact of the Covid-19 pandemic
1. Have you had to stop your operations?
� Totally
� Partially
� Normal Operations
2. What are the measures your business has taken as a result of the crisis? (tick appropriate)
� Firing employees
� Hiring more employees
47
� Telework measures
� Reducing costs
� Postponed investments or growth plans
� Close the business indefinitely
� Apply for new loans
� Diversify payment methods
� Diversify business lines
� Improve safety and hygiene standards in workplace
� Provide psychosocial support to employees
� None
� Other, ………………………………………………
3. Does the nature of your business allow you to telecommunicate?
� Yes
� Partially
� No
4. How do you currently distribute products or services to your customers?
� At my store or point of sale
� Home delivery using own channels
� Home delivery using third party platform
� By internet (especially for services)
� Other, …………………………………………………………………..
5. What are your main communication channels with customers?
� Facebook Group
� Personal contacts
� Telephone
� Other, …………………………………………………………
48
6. What payment options do you have? (tick appropriate )
� Cash
� Debit cards
� Credit cards
� Mobile wallets
� Bank transfers
� Link on webpage
7. How much do you estimate the impact as a result of Covid-19 on your revenues per month(percentage)?
� No reduction in revenues, business as usual
� 10% reduction in revenues
� 20% reduction in revenues
� 30% reduction in revenues
� 40% reduction in revenues
� 50% reduction in revenues
� 60% reduction in revenues
� 70% reduction in revenues
� 80% reduction in revenues
� 90% reduction in revenues
� Business has been closed completely
� Increase in revenues 10-50%
� Increase in revenues more than 50%
49
8. What are the most significant challenges to the business market?(tick and prioritize three choices):
� Loss of customers
� Limited payment options
� Difficulty with promotion and digital advertising
� Lack of digital marketing strategy
� Nature of the product or service offered is purely onsite
� Lack of merchandise
� Liquidity problems (late payment)
� Lack of infrastructure for teleworking
� Lack of internet access
� Problems using digital media and digital technology
� Debts foreclosure
� Supply chain cuts
� High commodity/material prices
� Cannot access business premises
� Legal problems
� Other, …………………………………………..
III. Measures you/your company has taken due to the impact ofthe pandemic:
9. Regarding your suppliers (tick all the measures taken):
� Negotiate the reduction of purchases
� Negotiate the delay of payments
� Coordinate logistics and transportation of goods
� Seek new suppliers
� Purchase protective supplies for safe work resumption
10. For lowering the operating cost (tick all the measures taken):
� Communicate with relevant departments to resume work and production as soon aspossible
� Communicate with employees about layoffs and temporary salary reductions
�
50
� Communicate with employees about implementing flexible shifts, working from home, and so on
� Negotiate with the lessor for the reduction or exemption of rent, equipment rental fees, etc.
� Negotiate with lenders for lowering the financing cost and extending the repayment cycle
� Apply for subsidies from relevant government departments
� Shut down certain production lines, outlets, etc.
11. Regarding your costumers (tick all the measures taken)
� Discuss with customers about the impact of the pandemic on the partnership and seek solutions
� Negotiate with customers for delayed order delivery
� Arrange for overtime to make up for the lost hours of production and work
� Coordinate the transportation and logistics of the products sold
� Reduce marketing investment
� Reduce the prices of products and services
� Increase the prices of products and services
12. Impact of pandemic on the future development strategy of the company (tick all the answers):
� Accelerate technological, product, and service innovation
� Explore new office and business models
� Strengthen the global reach of the supply chain and expand overseas markets
� Plan to withdraw from the market
V. Needs for support
13. Has your business received any assistance for Covid-19?� Loan facility
� Cash grant
� Technical assistance
� Legal support
� Other, …………………………………………………….……….
51
14. Who provided this assistance?� Government
� Local or International NGO
� Donors
� United Nations Organization
� Financial Institution
� Other, ………………………………………………………………………………………………………..…………
15. What do you need to economically reactivate your business? (1 being the most important).Choose the 5 most important items and use a scale from 1 to 5
� Digital media training
� Personalized advice and technical assistance
� Alternative payment methods to cash
� Procuring inputs or merchandise
� Loan facility
� Cash grant
� Equipment
� Improve access to market
� Improved information about markets and prices
� Legal support
� Other, ……………………………………………………………………………………………………….............…………
VI. Expectations and suggestions about future development
16. What suggestions do you have to improve support for your business at this current time? (this isan open question and you can offer recommendations in terms of short-, medium-, and long-term support)…………………………………………………………………………………………………………………………………………………………………………………………………………………………………………………………………….
52
� In kind, by providing goods like hand soap, protective clothing or other materials
� Assist with the transport and distribution of materials or goods
� By making a financial contribution
� Disseminating information about Covid-19 to communities
� Supporting in different way, please specify …………………………………………………………………………………………………………………………….
� I am not able to contribute at this point
18. Contact details of the person from your company to contact in regards of possible support toGovernment (name, email, telephone number)
…………………………………………………………………………………………………………………………………….…..
VII. Assist Government in the fight against Covid-19
17. Would you be able and willing to assist the Government in its fight against Covid-19?
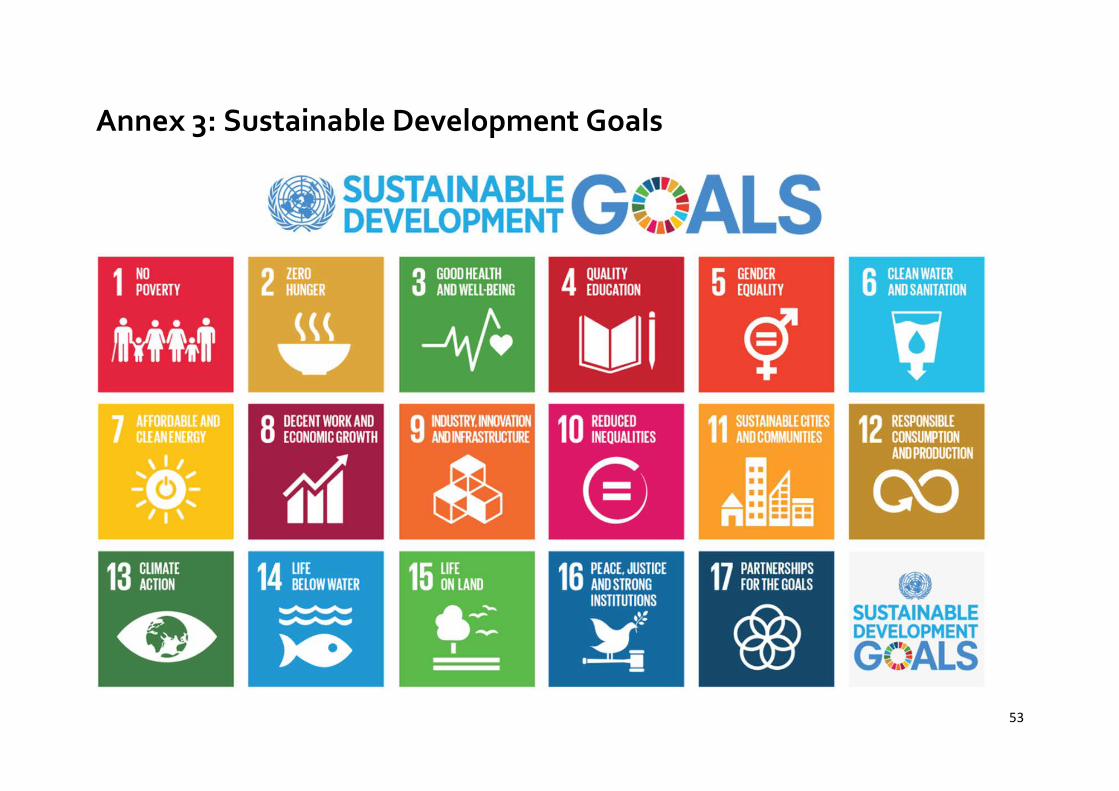
53
Annex 3: Sustainable Development Goals
54
Annex 4: Analysis of Frequencies for Covid-19 Survey 2020
1. GENDER
Sample Size: 706 Variable Frequency Percentage Female 164 23.2 Male 542 76.8
Table above shows the distribution of respondents by gender. In a randomly selected sample size of 706 respondents. 23.2% (164) were female, whereas 76.8 % were males. This indicates male dominancy in Micro, Small and Medium Enterprises (MSMEs) sector centrally to the population distribution in favour of the female gender. This gender imbalance may as well be interpreted to mean fewer females are in MSMEs compared to males.
2. POSITION IN THE ENTERPRISE
Sample Size: 706
Variable Respondents Percentage Board Member 221 31.3 Directors 176 24.9 Employees 97 13.7 Owner 212 30
Table above shows that Board members mainly of Cooperatives accounted for 31.3% (221) of the respondents to the business survey inquiry on the position of respondent in the enterprise. Whereas directors and employees accounted for 24.9% and 13.7% respectively, while owners made up of the remaining 30% (212) respondents. This indicates that MSMEs sector in Zambia is dominated by owners operated given that cooperative board members are also shareholders in the enterprises. This scenarios is also indicative of the lack of delegation in the
55
management structure of the majority MSMEs in Zambia meaning that directors are seemingly managers of the enterprises. A scenarios not good enough for job creation in a growing economy.
3. AGE OF RESPONDENTSample Size: 706
Variable Frequency Percentage 15-24 years 19 2.7 25-34 years 107 15.2 35-44 years 232 32.9 45-55 years 199 28.2 56- 65 years 115 16.3 Above 65 years 34 4.8
Table above shows the age of respondents to the business survey in a sample of 706. The median and modal age of the respondents to the business survey ranged from 35 to 44 years 32.9% (232). While youths accounted for approximately 17.9% (2.7% plus 15.2%), the aged participation in enterprise management is estimated at 4.8%. This shows that there are fewer youths and aged (above 65 years) in Zambia’s MSMEs.
4. DISTRIBUTION BY PROVINCE
Sample Size: 706
Variable Frequency Percentage Luapula 191 27.1 North- Western 141 20.0 Lusaka 91 12.9 Eastern 66 9.3 Central 57 8.1 Northern 49 6.9 Western 47 6.7 Southern 27 3.8 Copperbelt 26 3.7 Muchinga 11 1.6
56
The table above shows the distribution of respondents by province from a sample of 706, with Luapula recording the highest number of respondents at 27.1% (141), followed by North-Western at 20%. Muchinga recorded the lowest respondents at 1.6% (11).
5. NUMBER OF CURRENT EMPLOYEESSample Size: 706
Variable Frequency Percentage 1 employee 100 14.2 2- 5 employees 305 43.2 6- 10 employees 122 17.3 11-15 employees 59 8.1 16-50 employees 79 11.2 51-250 employees 25 3.5 251- 1000 employees 10 1.4 1001 – 5000 employees 3 0.4 More than 5000 employees 3 0.4
The table above shows that the majority of enterprises that responded to the business survey had 2 to 5 employees. Indicating that the average enterprise employs about between 2 to 5 employs. However, the number enterprise with employees above 5000 was 0.4% (3).
6. NUMBER OF EMPLOYEES BEFORE Covid-19 OUTBREAKSample Size: 706
Variable Frequency Percentage 1 employee 81 11.5 2- 5 employees 261 37 6- 10 employees 132 18.7 11-15 employees 67 9.5 16-50 employees 117 16.6 51-250 employees 31 4.4 251- 1000 employees 11 1.6 1001 – 5000 employees 3 0.4 More than 5000 employees 3 0.4
57
The table above show the number of employees of an enterprise before the outbreak of Covid-19, the majority of the respondents recorded employees between 2 and 5 representing 37% (261), followed by 6-10 employees 18.7% (132). Those with 16 to 50 employees accounted for 16.6% (117), while those with more than 5000 employees were at 0.4% (3).
Note: there was no significant change in number of employees the during the pandemic.
___________________________________________________________
7. EMPLOYEES COVERED BY HEALTH INSURANCENo. employees covered – 537 respondents (75.53%)
Covered by National Health Insurance Scheme – 71 respondents (9.99%)
Covered by Private Health Insurance – 57 respondents (8.02%)
Don’t Know – 38 respondents (5.34%).
Out of the 703 respondents to this question, 537 representing 75.53% had no employees insurance cover, 71 respondents representing 9.99% had employees on national health insurance scheme while 57 respondents representing 8.02% had employees covered by private health insurance. The remaining 38 representing 5.34% did not have knowledge about insurance cover.
8. MAJOR MARKETS
Sample Size: 706
Variable Respondents Percentage Domestic Market 617 87.4 International Market 23 3.3 Regional Market 66 9.3 Total 100
58
Out of 711 respondents who answered this question 618 representing 86.92% operated in the domestic market, while 68 respondents representing 9.56% had operations in the regional market and 25 respondents had operations in the international markets.
9. STOPPAGE OF BUSINESS DUE TO Covid-19Sample Size: 706
Variable Frequency Percentage Normal operations 109 15.4 Partially 502 71.1 Totally 95 13.5
Out of the 711 respondents to this question 502 respondents representing 70.6% partially closed their businesses, 110 representing 15.47% had normal operations and 99, representing 13.92% had completely closed their businesses during Covid-19.
10. MEASURES UNDERTAKEN DURING Covid-19
Variable Frequency Percentage Improve safety and hygiene standards in work places
371 52.5
Reduce costs 357 50.6 Postponed investments and growth plans
192 27.2
Fired employees 117 16.6 Diversified their payments methods
69 9.8
Applied for new loans 57 8.1 Opted to close their businesses indefinitely
36 5.1
Hiring employees 7 1 Telework 90 12.7 Diversify business lines 133 18.8 Provide psychosocial support 115 16.3
Several measures were undertaken by enterprises in an effort to mitigate the effects of Covid-19. The majority of respondents (52.18%) embarked on
59
efforts to improve safety and hygiene standards in work places, 50.77% reported having employed some measures to reduce costs and 27.71% of respondents postponed investments and growth plans. 120 respondents representing 16.88% fired employees. While 70, representing 9.85% diversified their payments methods, 58 representing 8.16% applied for new loans and 38 representing 5.34% opted to close their businesses indefinitely.
11. HOW PRODUCTS AND SERVICES ARE CURRENTLY DISTRIBUTED
Value
Variable Respondents Percentage Point of Sale 457 64.7 Home Delivery (Own Channels) 172 24.4 Internet 78 11.10 Home Delivery (Third Party) 67 9.5 Others 93 13.2
From the respondents, 458 respondents representing 64.42% distributed their products and services at their points of sale or stores while 171 respondents representing 24.05% distributed their products through home delivery channels. 79 respondents representing 11.11% used internet while 67 respondents representing 9.42% used third party to deliver their products or services to customers. However, the remaining 98 respondents representing 13.78% used other channels to deliver their products of services.
12. MAIN COMMUNICATION CHANNELS WITH CUSTOMERS
Variable Respondents Percentage WhatsApp 304 43.1 Facebook Group 139 19.7 Instagram 27 3.8 Personal contacts 423 59.31 Email 247 35 Telephone 477 67.6 Other 33 4.7
60
The most common methods of communication with customers were telephone and personal contact represented by 68.07% and 59.31% respectively. 308 respondents representing 43.32% used WhatsApp to communicate with customers, while 252 respondents representing 35.44% used email, 142 representing 19.79% used Facebook groups. 28 respondents representing 3.94% used Instagram while 35 respondents representing 4.92% used other channels to communicate with customers.
Q.6 PAYMENT METHODS
61
Table 6: Sample Size: 706
Variable Frequencies Percentage Cash 611 86.5 Debt Cards 69 9.8 Credit Cards 55 7.8 Mobile Wallets 255 36.1 Bank Transfers 312 44.2 Link on Webpage 7 1.00
The majority respondents, representing 86.5% used cash payments, followed by Bank transfers at 44.2%, Mobile wallet at 36.1%, Debt Cards at 9.8% and credit cards at 7.8%. The least used method of payment is Webpage which is representing 1.00%. This indicates that Zambian enterprises’ transactions are predominantly cash based. However, Bank transfers and mobile wallets are also highly rated methods of transacting.
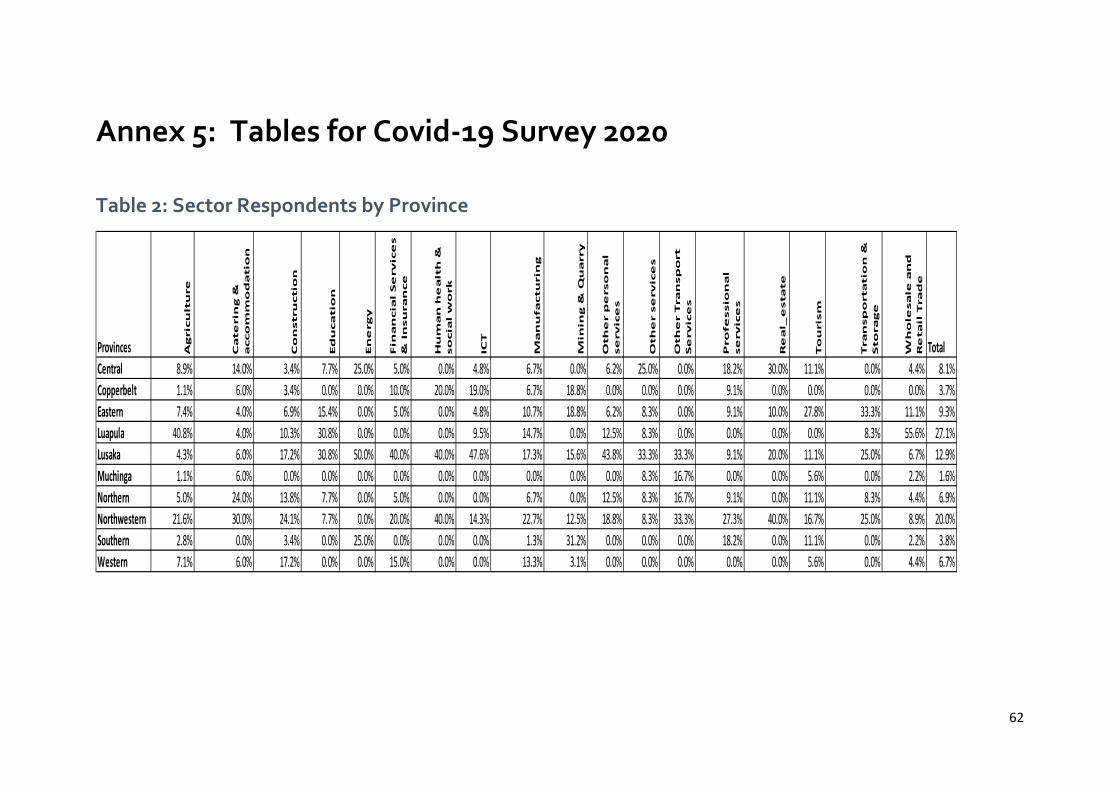
62
Annex 5: Tables for Covid-19 Survey 2020
Table 2: Sector Respondents by Province
Provinces Ag
ric
ult
ure
Ca
te
rin
g &
a
cco
mm
od
atio
n
Co
nstru
ctio
n
Ed
uca
tio
n
En
erg
y
Fin
an
cia
l S
erv
ice
s
& I
nsu
ra
nce
Hu
ma
n h
ea
lth
&
so
cia
l w
ork
ICT
Ma
nu
fa
ctu
rin
g
Min
ing
& Q
ua
rry
Oth
er p
erso
na
l se
rv
ice
s
Oth
er s
erv
ice
s
Oth
er T
ra
nsp
ort
Se
rv
ice
s
Pro
fe
ssio
na
l se
rv
ice
s
Re
al_
esta
te
To
uris
m
Tra
nsp
orta
tio
n &
S
to
ra
ge
Wh
ole
sa
le a
nd
R
eta
il T
ra
de
TotalCentral 8.9% 14.0% 3.4% 7.7% 25.0% 5.0% 0.0% 4.8% 6.7% 0.0% 6.2% 25.0% 0.0% 18.2% 30.0% 11.1% 0.0% 4.4% 8.1%Copperbelt 1.1% 6.0% 3.4% 0.0% 0.0% 10.0% 20.0% 19.0% 6.7% 18.8% 0.0% 0.0% 0.0% 9.1% 0.0% 0.0% 0.0% 0.0% 3.7%Eastern 7.4% 4.0% 6.9% 15.4% 0.0% 5.0% 0.0% 4.8% 10.7% 18.8% 6.2% 8.3% 0.0% 9.1% 10.0% 27.8% 33.3% 11.1% 9.3%Luapula 40.8% 4.0% 10.3% 30.8% 0.0% 0.0% 0.0% 9.5% 14.7% 0.0% 12.5% 8.3% 0.0% 0.0% 0.0% 0.0% 8.3% 55.6% 27.1%Lusaka 4.3% 6.0% 17.2% 30.8% 50.0% 40.0% 40.0% 47.6% 17.3% 15.6% 43.8% 33.3% 33.3% 9.1% 20.0% 11.1% 25.0% 6.7% 12.9%Muchinga 1.1% 6.0% 0.0% 0.0% 0.0% 0.0% 0.0% 0.0% 0.0% 0.0% 0.0% 8.3% 16.7% 0.0% 0.0% 5.6% 0.0% 2.2% 1.6%Northern 5.0% 24.0% 13.8% 7.7% 0.0% 5.0% 0.0% 0.0% 6.7% 0.0% 12.5% 8.3% 16.7% 9.1% 0.0% 11.1% 8.3% 4.4% 6.9%Northwestern 21.6% 30.0% 24.1% 7.7% 0.0% 20.0% 40.0% 14.3% 22.7% 12.5% 18.8% 8.3% 33.3% 27.3% 40.0% 16.7% 25.0% 8.9% 20.0%Southern 2.8% 0.0% 3.4% 0.0% 25.0% 0.0% 0.0% 0.0% 1.3% 31.2% 0.0% 0.0% 0.0% 18.2% 0.0% 11.1% 0.0% 2.2% 3.8%Western 7.1% 6.0% 17.2% 0.0% 0.0% 15.0% 0.0% 0.0% 13.3% 3.1% 0.0% 0.0% 0.0% 0.0% 0.0% 5.6% 0.0% 4.4% 6.7%
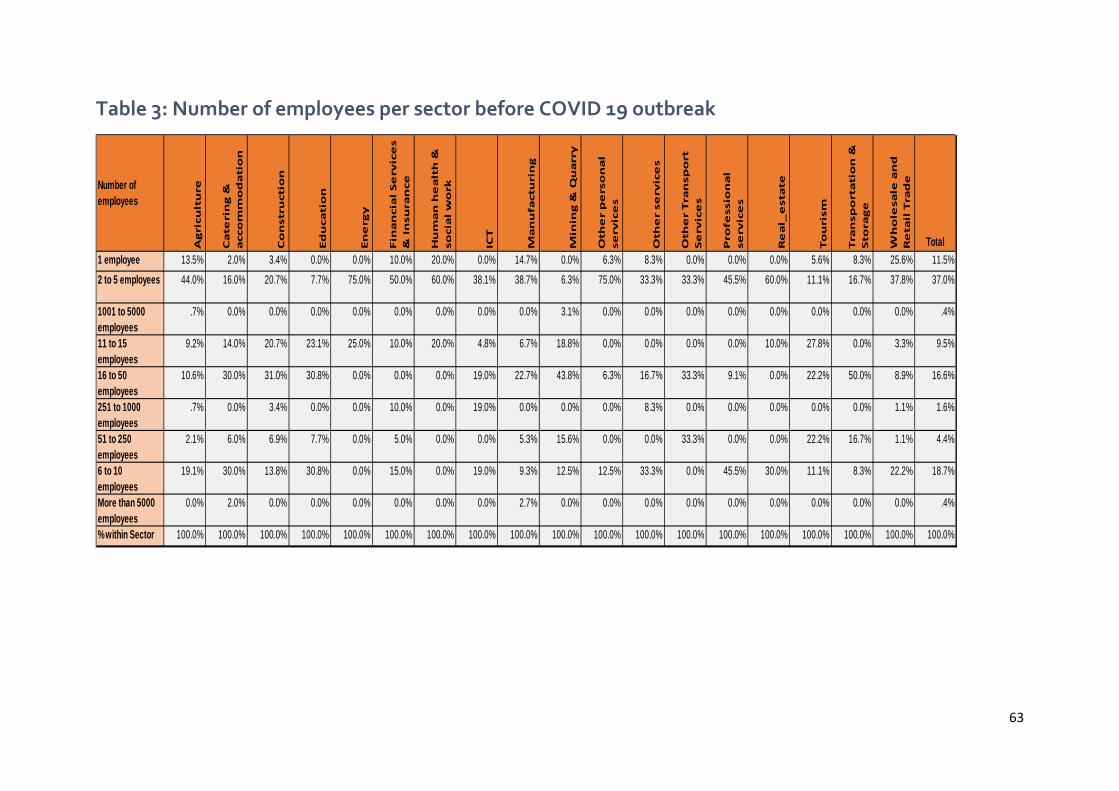
63
Table 3: Number of employees per sector before COVID 19 outbreak
Number of employees
Ag
ricu
ltu
re
Ca
teri
ng
&
acc
om
mo
da
tio
n
Co
nst
ruct
ion
Ed
uca
tio
n
En
erg
y
Fin
an
cia
l S
erv
ice
s &
In
sura
nce
Hu
ma
n h
ea
lth
&
soci
al
wo
rk
ICT
Ma
nu
fact
uri
ng
Min
ing
& Q
ua
rry
Oth
er
pe
rso
na
l se
rvic
es
Oth
er
serv
ice
s
Oth
er
Tra
nsp
ort
S
erv
ice
s
Pro
fess
ion
al
serv
ice
s
Re
al_
est
ate
To
uri
sm
Tra
nsp
ort
ati
on
&
Sto
rag
e
Wh
ole
sale
an
d
Re
tail
Tra
de
Total1 employee 13.5% 2.0% 3.4% 0.0% 0.0% 10.0% 20.0% 0.0% 14.7% 0.0% 6.3% 8.3% 0.0% 0.0% 0.0% 5.6% 8.3% 25.6% 11.5%2 to 5 employees 44.0% 16.0% 20.7% 7.7% 75.0% 50.0% 60.0% 38.1% 38.7% 6.3% 75.0% 33.3% 33.3% 45.5% 60.0% 11.1% 16.7% 37.8% 37.0%
1001 to 5000 employees
.7% 0.0% 0.0% 0.0% 0.0% 0.0% 0.0% 0.0% 0.0% 3.1% 0.0% 0.0% 0.0% 0.0% 0.0% 0.0% 0.0% 0.0% .4%
11 to 15 employees
9.2% 14.0% 20.7% 23.1% 25.0% 10.0% 20.0% 4.8% 6.7% 18.8% 0.0% 0.0% 0.0% 0.0% 10.0% 27.8% 0.0% 3.3% 9.5%
16 to 50 employees
10.6% 30.0% 31.0% 30.8% 0.0% 0.0% 0.0% 19.0% 22.7% 43.8% 6.3% 16.7% 33.3% 9.1% 0.0% 22.2% 50.0% 8.9% 16.6%
251 to 1000 employees
.7% 0.0% 3.4% 0.0% 0.0% 10.0% 0.0% 19.0% 0.0% 0.0% 0.0% 8.3% 0.0% 0.0% 0.0% 0.0% 0.0% 1.1% 1.6%
51 to 250 employees
2.1% 6.0% 6.9% 7.7% 0.0% 5.0% 0.0% 0.0% 5.3% 15.6% 0.0% 0.0% 33.3% 0.0% 0.0% 22.2% 16.7% 1.1% 4.4%
6 to 10 employees
19.1% 30.0% 13.8% 30.8% 0.0% 15.0% 0.0% 19.0% 9.3% 12.5% 12.5% 33.3% 0.0% 45.5% 30.0% 11.1% 8.3% 22.2% 18.7%
More than 5000 employees
0.0% 2.0% 0.0% 0.0% 0.0% 0.0% 0.0% 0.0% 2.7% 0.0% 0.0% 0.0% 0.0% 0.0% 0.0% 0.0% 0.0% 0.0% .4%
% within Sector 100.0% 100.0% 100.0% 100.0% 100.0% 100.0% 100.0% 100.0% 100.0% 100.0% 100.0% 100.0% 100.0% 100.0% 100.0% 100.0% 100.0% 100.0% 100.0%
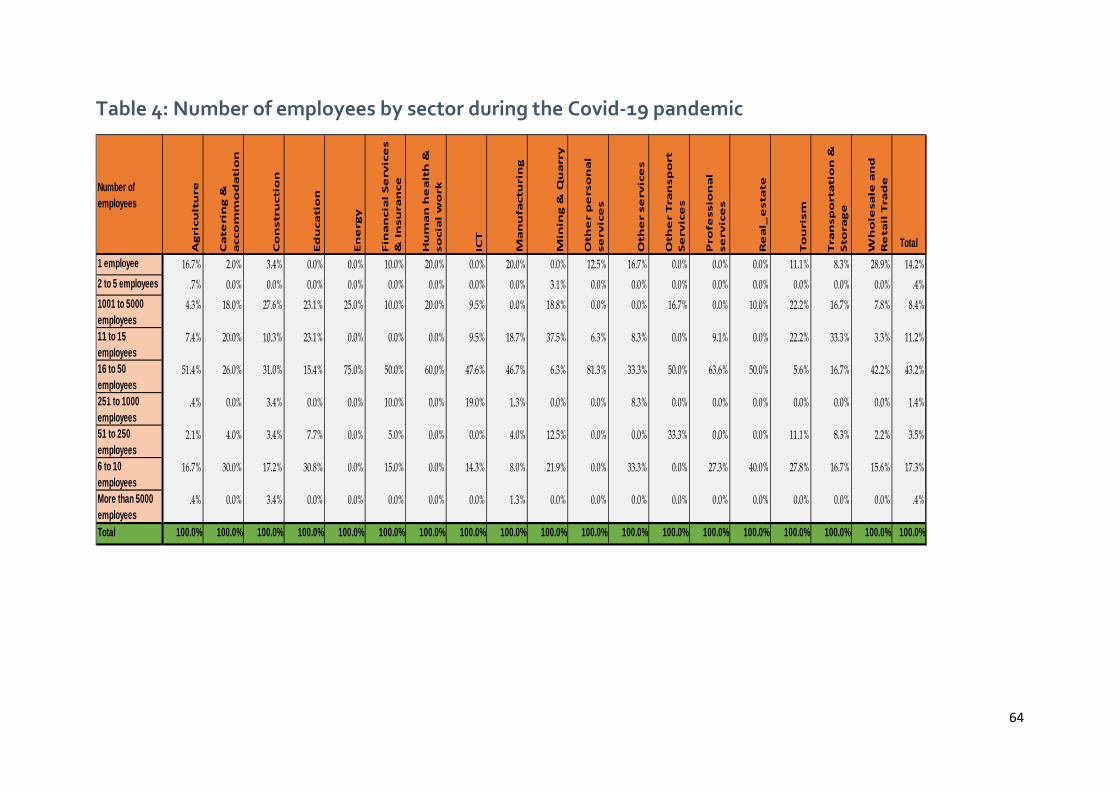
64
Table 4: Number of employees by sector during the Covid-19 pandemic
Number of employees
Ag
ricu
ltu
re
Ca
teri
ng
&
acco
mm
od
ati
on
Co
nstr
ucti
on
Ed
uca
tio
n
En
erg
y
Fin
an
cia
l S
erv
ice
s
& I
nsu
ran
ce
Hu
ma
n h
ea
lth
&
so
cia
l w
ork
ICT
Ma
nu
factu
rin
g
Min
ing
& Q
ua
rry
Oth
er
pe
rso
na
l se
rvic
es
Oth
er
se
rvic
es
Oth
er
Tra
nsp
ort
S
erv
ice
s
Pro
fessio
na
l se
rvic
es
Re
al_
esta
te
To
uri
sm
Tra
nsp
ort
ati
on
&
Sto
rag
e
Wh
ole
sa
le a
nd
R
eta
il T
rad
e
Total1 employee 16.7% 2.0% 3.4% 0.0% 0.0% 10.0% 20.0% 0.0% 20.0% 0.0% 12.5% 16.7% 0.0% 0.0% 0.0% 11.1% 8.3% 28.9% 14.2%2 to 5 employees .7% 0.0% 0.0% 0.0% 0.0% 0.0% 0.0% 0.0% 0.0% 3.1% 0.0% 0.0% 0.0% 0.0% 0.0% 0.0% 0.0% 0.0% .4%1001 to 5000 employees
4.3% 18.0% 27.6% 23.1% 25.0% 10.0% 20.0% 9.5% 0.0% 18.8% 0.0% 0.0% 16.7% 0.0% 10.0% 22.2% 16.7% 7.8% 8.4%
11 to 15 employees
7.4% 20.0% 10.3% 23.1% 0.0% 0.0% 0.0% 9.5% 18.7% 37.5% 6.3% 8.3% 0.0% 9.1% 0.0% 22.2% 33.3% 3.3% 11.2%
16 to 50 employees
51.4% 26.0% 31.0% 15.4% 75.0% 50.0% 60.0% 47.6% 46.7% 6.3% 81.3% 33.3% 50.0% 63.6% 50.0% 5.6% 16.7% 42.2% 43.2%
251 to 1000 employees
.4% 0.0% 3.4% 0.0% 0.0% 10.0% 0.0% 19.0% 1.3% 0.0% 0.0% 8.3% 0.0% 0.0% 0.0% 0.0% 0.0% 0.0% 1.4%
51 to 250 employees
2.1% 4.0% 3.4% 7.7% 0.0% 5.0% 0.0% 0.0% 4.0% 12.5% 0.0% 0.0% 33.3% 0.0% 0.0% 11.1% 8.3% 2.2% 3.5%
6 to 10 employees
16.7% 30.0% 17.2% 30.8% 0.0% 15.0% 0.0% 14.3% 8.0% 21.9% 0.0% 33.3% 0.0% 27.3% 40.0% 27.8% 16.7% 15.6% 17.3%
More than 5000 employees
.4% 0.0% 3.4% 0.0% 0.0% 0.0% 0.0% 0.0% 1.3% 0.0% 0.0% 0.0% 0.0% 0.0% 0.0% 0.0% 0.0% 0.0% .4%
Total 100.0% 100.0% 100.0% 100.0% 100.0% 100.0% 100.0% 100.0% 100.0% 100.0% 100.0% 100.0% 100.0% 100.0% 100.0% 100.0% 100.0% 100.0% 100.0%
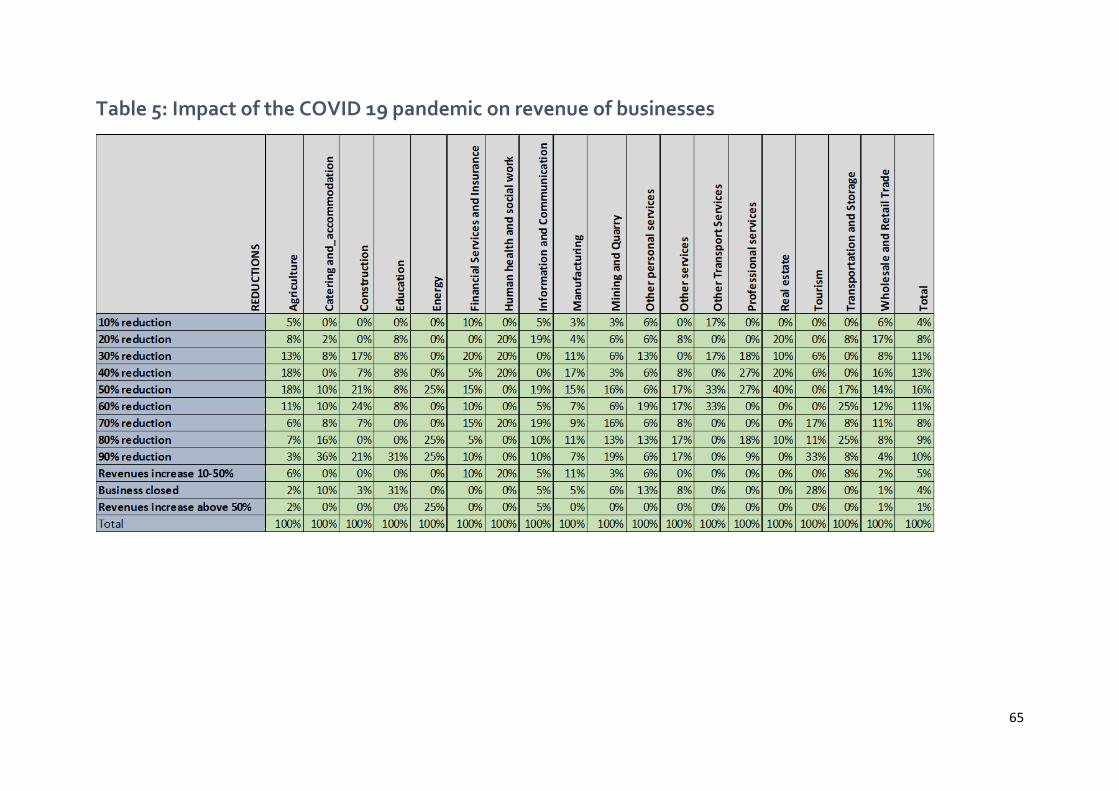
65
Table 5: Impact of the COVID 19 pandemic on revenue of businesses
66
Table 6: Recommendations by businesses on how to reactivate (Short term, Medium term and Long term)
RECOMMENDATION FREQUENCY PERCENTAGE Cut down or defer obligations to be made such as taxes, duties to allow businesses to get back initial position before Covid-19
37 5.2
Facilitate networking among businesses in order to improve interaction among businesses for the ease of doing business
29 4.1
Improve the supply chain in order to improve business 69 9.8 To allow businesses such as bars to start running while encouraging health practice to contain the pandemic
27 3.8
Diversify businesses as a way of cushioning the effects of the mostly affected businesses
2 0.3
Improve on kwacha performance against major currencies for businesses that count on imports for their survival
6 0.8
Provide financial support in form of loans or grants with deferred reduced interest rate
252 35.7
Reduce cost of doing business for businesses to quickly get back to their initial position
8 1.1
Facilitate the acquiring of Equipment and maintenance of them 15 2.1 Others 1 0.001
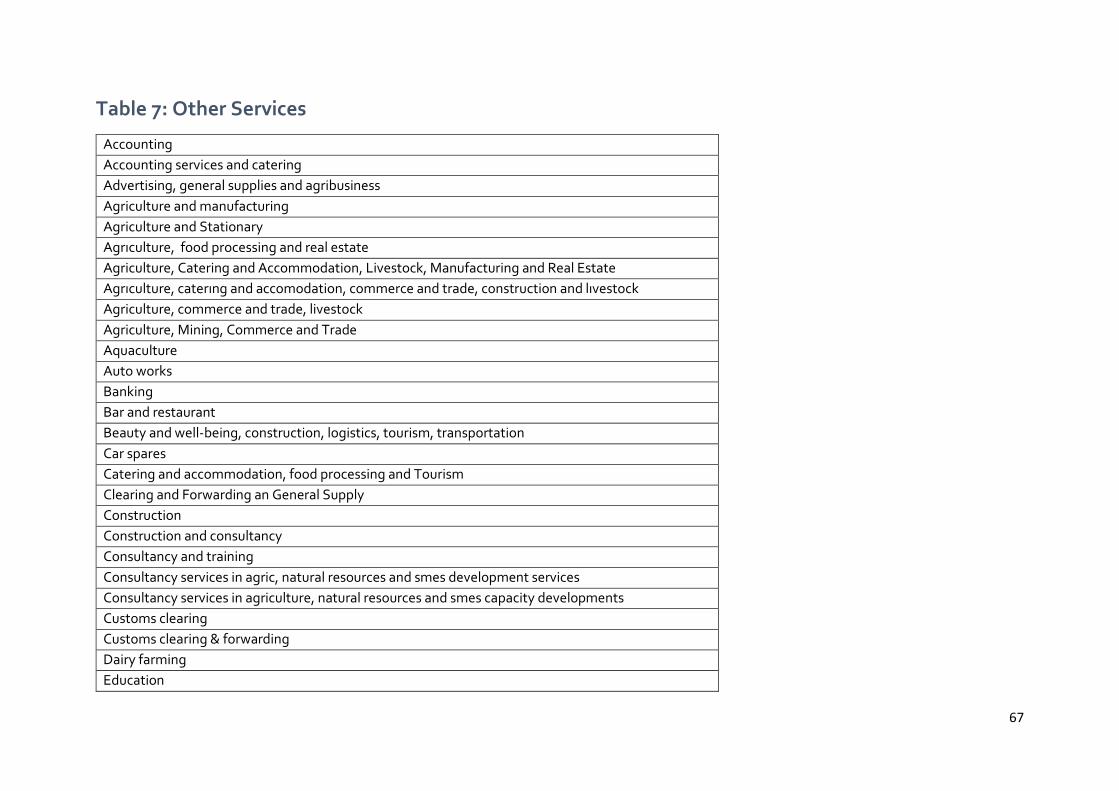
67
Table 7: Other Services
Accounting Accounting services and catering Advertising, general supplies and agribusiness Agriculture and manufacturing Agriculture and Stationary Agrıculture, food processing and real estate Agriculture, Catering and Accommodation, Livestock, Manufacturing and Real Estate Agrıculture, caterıng and accomodation, commerce and trade, construction and lıvestock Agriculture, commerce and trade, livestock Agriculture, Mining, Commerce and Trade Aquaculture Auto works Banking Bar and restaurant Beauty and well-being, construction, logistics, tourism, transportation Car spares Catering and accommodation, food processing and Tourism Clearing and Forwarding an General Supply Construction Construction and consultancy Consultancy and training Consultancy services in agric, natural resources and smes development services Consultancy services in agriculture, natural resources and smes capacity developments Customs clearing Customs clearing & forwarding Dairy farming Education
68
Engineering Entertainment Event management Event planner Management Events management Events Management and Events Decorations Events planning, management and Hire of events equipment Financial services and transportation Fisheries General, Stationery and Secretarial Hardware Hiring out of party items and jumping castles Honey production Hospitality Hygiene chemical distribution Investments Legal and law Legal services Lending to customers within and outside the cooperative Livestock Management consultancy Media Milling and rearing of village chickens Milling plant Milling services Mobile money agents Mobile money business Multimedia Printing
69
Printing and Advertising Purchasing and general supplies Quarrying Radio Retail Retail Clothing, hair and hair accessories Retailing Savings and credit Stationary and graphic designing and printing Supplier of agro inputs Tailoring and designing Technology and T-shirt Printing and Designing Training Water supply and Sanitation Services We are a member of National Development Coordinating Committee(NDCC) and operate under the road map of 7th National Development Plan and we work with key line Government Ministries. We support the ophans in education and nutrition Wood processing

This report was supported by the United Nations Development Programme
in Zambia.