the impact of covid-19 and locust invasion on farm
TRANSCRIPT

ASIAN DEVELOPMENT BANK
AsiAn Development BAnk6 ADB Avenue, Mandaluyong City1550 Metro Manila, Philippineswww.adb.org
Publication title in 12-point Ideal Sans MediumPublication subtitle in 10-point Ideal Sans Book Italic
Publication blurb (limt to 100 words): Lorem ipsum dolor sit amet, pro probo facilis at, vel alii probo accusamus eu, quis omnium est ex. At sale adipisci usu. Eu has vide consequat, mea nonumes appetere in, graece iisque ad vel. Tamquam meliore vivendum sea ex, an qui sapientem assentior adversarium, dolor omittam ullamcorper eam an. Everti minimum vivendum in eos. Ea vide erat principes nam. Nec viderer tamquam ea. Sumo detraxit reformidans et duo, pertinax disputationi vel et. Omnis consulatu vix et, eam debet eirmod commodo an. Quis ridens qui ut. Cum purto doming petentium ex vidit velit et mea.
About the Asian Development Bank
ADB is committed to achieving a prosperous, inclusive, resilient, and sustainable Asia and the Pacific, while sustaining its efforts to eradicate extreme poverty. Established in 1966, it is owned by 68 members —49 from the region. Its main instruments for helping its developing member countries are policy dialogue, loans, equity investments, guarantees, grants, and technical assistance.
THE IMPACT OF COVID-19 AND LOCUST INVASION ON FARM HOUSEHOLDS IN PUNJAB AND SINDHANALYSIS FROM CROSS-SECTIONAL SURVEYS IN PAKISTAN
Takashi Yamano, Noriko Sato, and Babur Wasim Arif
adb CENTRaL aNd WEST aSIa WoRkINg papER SERIES
NO. 10
July 2021
ASIAN DEVELOPMENT BANK6 ADB Avenue, Mandaluyong City1550 Metro Manila, Philippineswww.adb.org
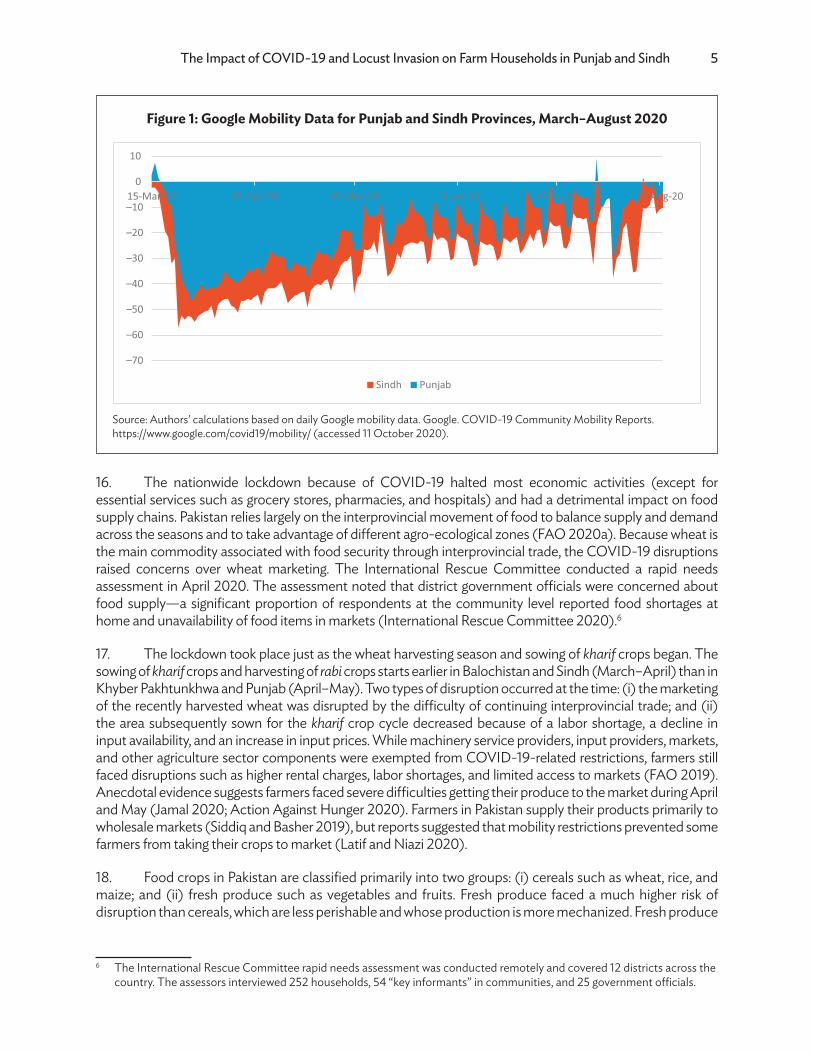
The Impact of COVID-19 and Locust Invasion on Farm Households in Punjab and Sindh Analysis from Cross-Sectional Surveys in Pakistan
This paper presents the results of two mobile phone surveys conducted by the Asian Development Bank among farmers in Punjab and Sindh provinces in Pakistan in mid-2020 during the coronavirus disease (COVID-19) pandemic. The surveys collected information about how COVID-19-related measures and economic and transport disruptions affected farmers’ harvests, marketing efforts, input prices, and financial needs. The surveys found that the COVID-19 pandemic had significant negative impacts on farm households in both provinces. The paper provides additional context on COVID-19-related effects on local and regional economies and food supply chains. It also covers a simultaneous locust invasion along the India–Pakistan border, which has created “crisis within a crisis” in the surveyed provinces and exacerbated conditions that could lead to famine, disease, and increased poverty.
About the Asian Development Bank
ADB is committed to achieving a prosperous, inclusive, resilient, and sustainable Asia and the Pacific, while sustaining its efforts to eradicate extreme poverty. Established in 1966, it is owned by 68 members —49 from the region. Its main instruments for helping its developing member countries are policy dialogue,loans, equity investments, guarantees, grants, and technical assistance.


ASIAN DEVELOPMENT BANK
ADB Central and West Asia Working Paper Series
The Impact of COVID-19 and Locust Invasion on Farm Households in Punjab and Sindh:Analysis from Cross-Sectional Surveys in Pakistan
Takashi Yamano, Noriko Sato, and Babur Wasim Arif
No. 10 | July 2021
Takashi Yamano, senior economist, Economic Analysis and Operational Support Division, Asian Development Bank
Noriko Sato, natural resources specialist, Environment, Natural Resources and Agriculture Division, Asian Development Bank
Babur Wasim Arif, economist (independent consultant)

Creative Commons Attribution 3.0 IGO license (CC BY 3.0 IGO)
© 2021 Asian Development Bank 6 ADB Avenue, Mandaluyong City, 1550 Metro Manila, Philippines Tel +63 2 8632 4444; Fax +63 2 8636 2444 www.adb.org
Some rights reserved. Published in 2021.
ISSN 2313-7355 (print), 2313-7363 (electronic)Publication Stock No. WPS210259-2DOI: http://dx.doi.org/10.22617/WPS210259-2
The views expressed in this publication are those of the authors and do not necessarily reflect the views and policies of the Asian Development Bank (ADB) or its Board of Governors or the governments they represent.
ADB does not guarantee the accuracy of the data included in this publication and accepts no responsibility for any consequence of their use. The mention of specific companies or products of manufacturers does not imply that they are endorsed or recommended by ADB in preference to others of a similar nature that are not mentioned.
By making any designation of or reference to a particular territory or geographic area, or by using the term “country” in this document, ADB does not intend to make any judgments as to the legal or other status of any territory or area.
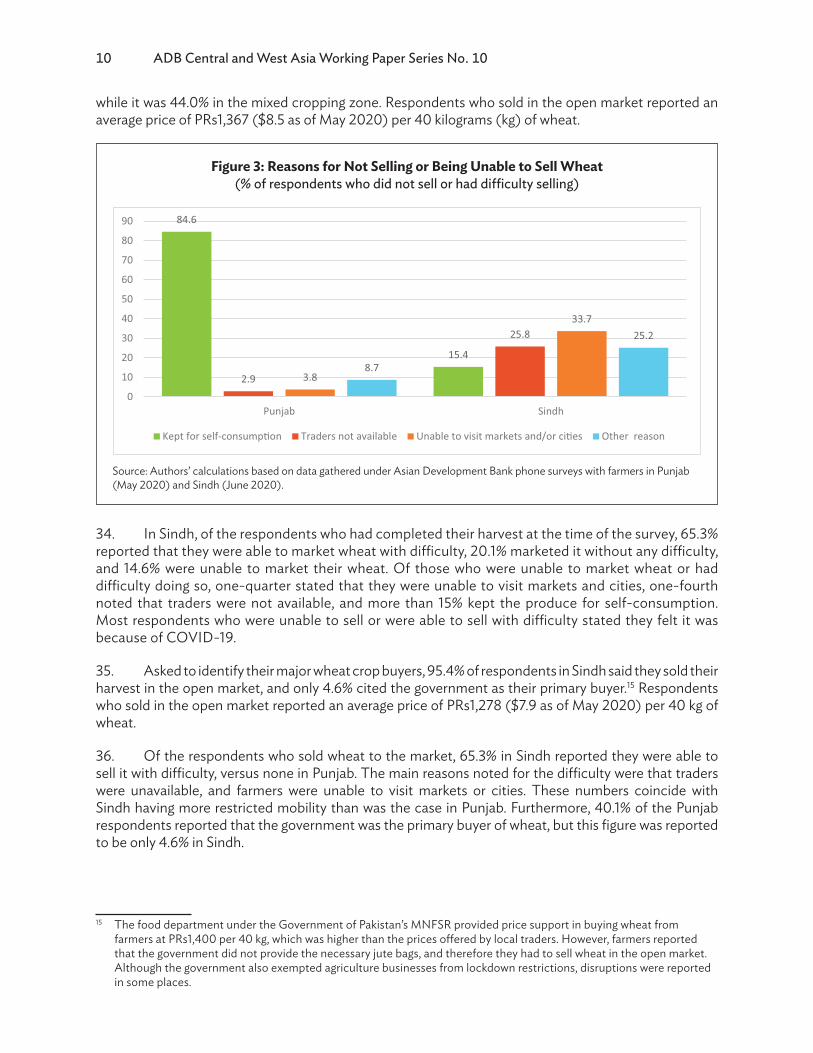
This work is available under the Creative Commons Attribution 3.0 IGO license (CC BY 3.0 IGO) https://creativecommons.org/licenses/by/3.0/ igo/. By using the content of this publication, you agree to be bound by the terms of this license. For attribution, translations, adaptations, and permissions, please read the provisions and terms of use at https://www.adb.org/terms-use#openaccess.
This CC license does not apply to non-ADB copyright materials in this publication. If the material is attributed to another source, please contact the copyright owner or publisher of that source for permission to reproduce it.
ADB cannot be held liable for any claims that arise as a result of your use of the material.
Please contact [email protected] if you have questions or comments with respect to content, or if you wish to obtain copyright permission for your intended use that does not fall within these terms, or for permission to use the ADB logo.
Corrigenda to ADB publications may be found at http://www.adb.org/publications/corrigenda.
Notes: In this publication, “$” refers to United States dollars and “PRs” to Pakistan rupees.
The ADB Central and West Asia Department (CWRD) Working Paper Series is a forum for stimulating discussion and eliciting feedback on ongoing and recently completed economic, sector, and policy work undertaken by ADB staff members, consultants, or resource persons in the context of the operational work of CWRD. The series deals with economic and development issues in Central and West Asia, and aims to improve the knowledge of Central and West Asia’s development and policy challenges, strengthen subregional and country operations, and contribute to national and regional policy dialogue.
The series is a quick-disseminating, informal publication. The working papers may subsequently be revised and published elsewhere.

TABLES, FIGURES, AND MAP iv
ACKNOWLEDGMENTS v
ABBREVIATIONS vi
EXECUTIVE SUMMARY vii
I. INTRODUCTION 1
II. COVID-19, RESTRICTIONS, AND CENTRAL AND WEST ASIAN ECONOMIES 2
III. COVID-19 AND RESTRICTIONS ON FOOD SUPPLY CHAINS IN PAKISTAN 4
IV. LOCUST SWARMS AND FOOD SECURITY IN PAKISTAN 6
V. SAMPLED FARMERS 7
A. Punjab 7B. Sindh 7
VI. SURVEY RESULTS AND DISCUSSION 8
A. COVID-19 Impacts on Households 8B. COVID-19 Impacts on Crops, Dairy, and Farm Inputs 8C. Impacts of Locust Swarms 18D. Farmers’ Preferred Policy Measures 20
VII. GOVERNMENT ACTION 21
VIII. CONCLUSION 22
APPENDIXES
1. Survey Results Tables 232. Pakistan’s Policies on Crop Procurement and Price Control 373. Index Used to Identify Preferences for Suggested Policy Measures 38
REFERENCES 40
CONTENTS

TABLES
1 Stringency Policy Levels, Community Mobility, and Gross Domestic Product Growth 3
2 Security of Employment 4
3 Locust Impacts and Preventive Measures in Sindh 19
FIGURES
1 Google Mobility Data for Punjab and Sindh Provinces, March–August 2020 5
2 Farm Households’ Experience during COVID-19 in Punjab and Sindh 8
3 Reasons for Not Selling or Being Unable to Sell Wheat 10
4 Reasons for Not Selling or Being Unable to Sell Fruits and Vegetables 12
5 Reasons for Not Selling or Being Unable to Sell Tomatoes 14
6 Reasons for Not Selling or Being Unable to Sell Milk 15
7 Farm Input Price Increases Attributed to COVID-19 16
8 Farmers’ Financial Concerns 17
9 Farmers’ Preferred Policy Measures 20
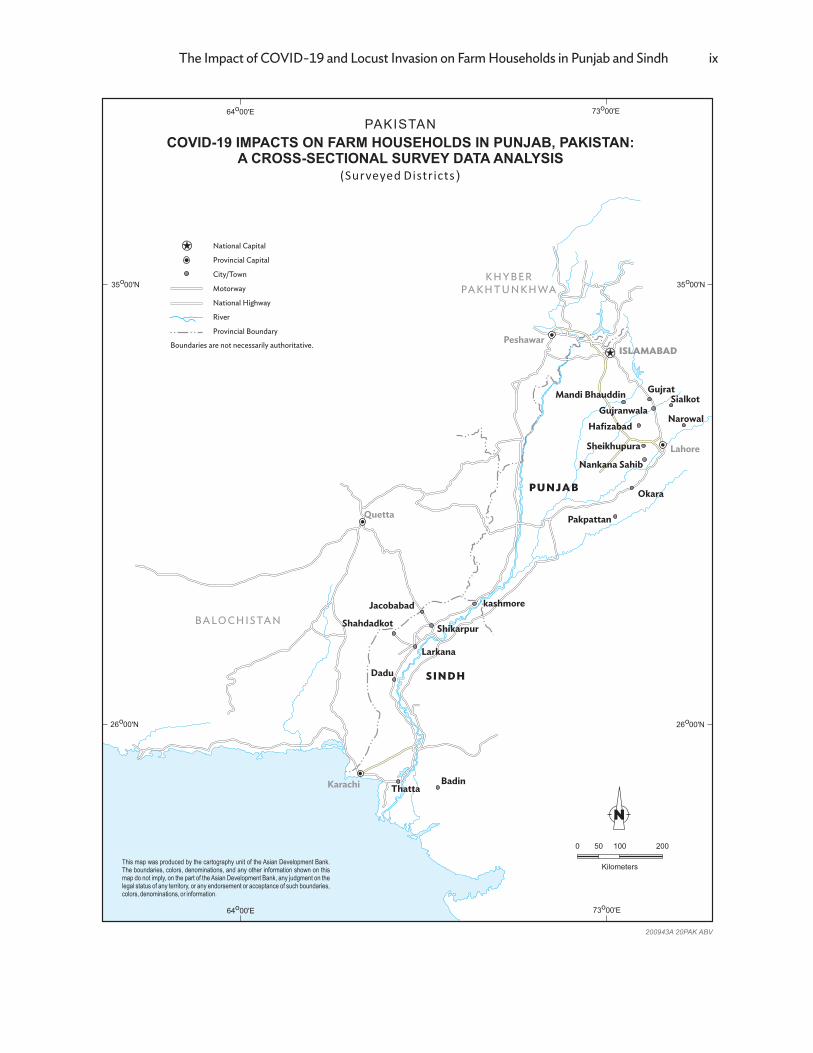
MAP ix
TABLES, FIGURES, AND MAP

This working paper was written by Takashi Yamano, senior economist, Economic Research and Regional Cooperation Department (ERCD), Asian Development Bank (ADB); Noriko Sato, natural resources specialist, Central and West Asia Department (CWRD), ADB; and Babur Wasim Arif, economist (independent consultant). It was prepared based on the outcomes of two farm household surveys—(i) COVID-19 Impact on Farm Households in Punjab, Pakistan: Analysis of Data from a Cross-Sectional Survey; and (ii) Impact of COVID-19 and Locust Swarms on Farm Households in Sindh, Pakistan: Analysis of Data from a Cross-Sectional Survey. The surveys were conducted under ADB’s knowledge and support technical assistance: Enhancing Technology-Based Agriculture and Marketing in Rural Punjab.
The authors benefited from the contribution of the following ADB staff members: Ahsan Tayyab, former principal natural resources economist, CWRD; Asad Ali Zafar, senior project officer (water resources), CWRD; and Jindra Nuella Samson, senior economics officer, ERCD. Kiyoshi Taniguchi, principal economist, CWRD; Shingo Kimura, senior natural resources and agriculture specialist, Environment, Natural Resources, and Energy Division of the East Asia Department; and Md. Abul Basher, natural resources and agriculture specialist, Sustainable Development and Climate Change Department, provided technical reviews and comments. Kristine Joy S. Villagracia, operations assistant at CWRD, provided administrative assistance to the publishing process.
The following consultants provided support for the farm household surveys: Shahid Ahmad, agriculture sector specialist; Sahibzada Mansoor Ali, agriculture value chain specialist; Umer Saeed, agriculture specialist; Muhammad Ali Khawaja, environmental safeguard specialist; Ahmad Nawaz, agriculture specialist (climate change); and Shakeel Ahmad, plant protection specialist of the Centre for Agriculture and Bioscience International. Computer-assisted mobile phone interviews were conducted by Centre for Agriculture and Bioscience International field technical support staff—Zeeshan Haydar, Muhammad Umair Ashraf, Gohar Gulshan Mahmood, Muhammad Hassan, Muhammad Ameen ul Zaman, and Hamza Muneer Asam—for the Punjab survey; and by the staff members of the Research and Development Foundation—Ashfaq Soomro, Niaz Sial, Zahoor Palijo, Moula Bux, Farkhanda Laghari—for the Sindh survey. Jill Gale de Villa, knowledge management specialist (independent consultant) provided substantial edits for this publication.
ACKNOWLEDGMENTS

ADB – Asian Development BankCOVID-19 – coronavirus diseaseESCAP – Economic and Social Commission for Asia and the PacificFAO – Food and Agriculture Organization of the United NationsGDP – gross domestic product IRRI – International Rice Research Institutekg – kilogramkm2 – square kilometerMNFSR – Ministry of National Food Security & ResearchPBS – Pakistan Bureau of StatisticsUK – United Kingdom
ABBREVIATIONS

EXECUTIVE SUMMARY
To combat the coronavirus disease (COVID-19) outbreak, provincial and federal governments in Pakistan introduced non-pharmaceutical interventions, including restrictions on movements of people and lockdowns of cities during March–May 2020. Anticipating that the lockdowns and movement restrictions would have negative impacts on the marketing of agricultural and food products, they were exempted from the restrictions. However, anecdotal evidence suggests that marketing of agricultural and food products was negatively affected despite the exemptions.
To gather reliable empirical evidence on the issue, the Asian Development Bank (ADB) conducted two mobile phone surveys with 429 farmers in Punjab province in May 2020 and 410 farmers in Sindh province in June 2020. The surveys collected information about how COVID-19-related measures and disruptions affected (i) the harvesting and marketing of rabi crops (crops that are sown and harvested from about November to April) and milk, (ii) the availability and price of inputs, and (iii) farmers’ financial needs.
The two surveys found that the COVID-19 pandemic had significant negative impacts on farm households in Punjab and Sindh. In both provinces, one-third of farm households experienced losses in wages and nonfarm earnings, and almost one-quarter reported that at least one family member had returned from urban or other areas. Thus, farm households needed to support more family members but with decreased wages and nonfarm earnings. About 10% of farm households in Punjab and more than half the farm households in Sindh reported reduced food and nonfood expenditures.
Regarding agricultural impacts, farmers in both provinces cited market closures and traders’ unavailability due to movement restrictions among their main difficulties. Furthermore, as many restaurants and markets closed, the demand for high-value agricultural products, such as milk and tomatoes, collapsed, resulting in low market prices. In addition, farmers faced acute problems for kharif crops (crops that are sown and harvested during the monsoon season, which lasts from about June to November) because of the limited availability and increased prices of farm inputs, particularly seeds. Overall, the COVID-19 pandemic impacted Sindh farm households’ marketing of agriculture products more heavily than was the case in Punjab. Some farm households in Sindh suffered from locust invasion and crop damage during the kharif season.
Although the transport and marketing of agricultural and food products was exempted from the movement restrictions and lockdowns, this working paper found the COVID-19 pandemic had negative impacts on rural households, including reduced cash nonagricultural income and difficulties with marketing agricultural products in Punjab and Sindh. In addition, they faced increased prices of agricultural inputs. These findings suggest the need for better monitoring and support for agricultural marketing, supplies, and services during movement restrictions under the pandemic. As Pakistan and other countries struggle under the pandemic and prepare for recovery, it is critical to maintain normal flows of agricultural and food products in the markets to secure food availability during the pandemic.

viii ADB Central and West Asia Working Paper Series No. 10
Key Findings
• In May–June 2020, more than 830 farmers were surveyed by phone in Punjab and Sindh provinces, Pakistan, on the impact of the nationwide lockdown in response to the coronavirus disease (COVID-19) pandemic and the locust invasion.
• In both provinces, one-third of farm households experienced losses in wages and nonfarm earnings. More than half of the surveyed farm households in Sindh and about one-tenth in Punjab reported reduced food and nonfood expenditures because of the pandemic.
• Farmers faced difficulties in marketing of vegetables, fruits, and milk in Punjab and Sindh, and tomatoes, especially in Sindh.
• Supply chain disruptions directly resulted in economic losses for farmers and increased food prices for consumers. Despite the government’s efforts to minimize the disruptions in the food supply chain, the survey results indicate that farmers still suffered economic losses.
• Almost all respondents from upper Sindh reported locust swarms, with over a third of lower Sindh respondents state they had also been affected. In Punjab, locust swamps were reported in two southern districts in the surveyed areas, resulting in production losses for farmers who have already been suffering from the COVID-19 pandemic.
Recommendations
• As the COVID-19 pandemic continues, more farmers and low-income consumers become highly vulnerable due agricultural income losses and declining cash income. The provincial and federal governments need to continue close monitoring of agricultural production, storage availability, and domestic and international market conditions. Greater preparedness is required to assist farmers and to ensure national food security.
• Farmers in Punjab and Sindh reported limited government response as a source of information about locust swarms or relief in the form of surveys and spraying. Early warning systems, supported by digital technologies, and effective locus response plans need to be prepared by federal government in coordination with the provinces against future locust invasions.
• Evidence-based policy making and greater emphasis on a more rigorous provincial monitoring program should be adopted by the government agencies. This will enable preemptive and informed decision making to tackle future pest infestations, and overall market disruptions.
• The Asian Development Bank (ADB) and other development partners are providing urgent responses to support government agencies, specifically ADB’s knowledge and support technical assistance: Strengthening Food Security Post-COVID-19 and Locust Attacks (TA 6663-PAK, which aims to help Pakistan improve its resilience and sustainability in the food security system and agriculture sector.
The Impact of COVID-19 and Locust Invasion on Farm Households in Punjab and Sindh ix
ISLAMABADPeshawar
Karachi
Lahore
Quetta
BALOCHISTAN
PUNJAB
KHYBERPAKHTUNKHWA
SINDH
Boundaries are not necessarily authoritative.
National Capital
Provincial Capital
City/Town
Motorway
National Highway
River
Provincial Boundary
COVID-19 IMPACTS ON FARM HOUSEHOLDS IN PUNJAB, PAKISTAN: A CROSS-SECTIONAL SURVEY DATA ANALYSIS
PAKISTAN
(Surveyed Districts)
1000 20050
Kilometers
N
73 00'Eo
73 00'Eo
35 00'No35 00'No
26 00'No
64 00'Eo
64 00'Eo
26 00'No
200943A 20PAK ABV
This map was produced by the cartography unit of the Asian Development Bank. The boundaries, colors, denominations, and any other information shown on this map do not imply, on the part of the Asian Development Bank, any judgment on the legal status of any territory, or any endorsement or acceptance of such boundaries, colors, denominations, or information.
Okara
Pakpattan
Hafizabad
Mandi BhauddinGujranwala
Sialkot
Narowal
Gujrat
Sheikhupura
Jacobabad
Larkana
Dadu
ThattaBadin
ShikarpurShahdadkot
kashmore
Nankana Sahib


1. The agriculture sector in developing countries is no stranger to external shocks such as extreme weather and price volatilities. However, the shock caused by the coronavirus disease (COVID-19) outbreak is at a different magnitude altogether. Beginning in early 2020, many governments introduced non-pharmaceutical interventions, including restrictions on movements of people and lockdowns of cities (Castex et al. 2020; Imai et al. 2020). While limiting the spread of the virus, these restrictions disrupted agricultural marketing and production by constraining the transport of agriculture products, inputs, machines, and workers. Although the restrictions exempted grocery stores, food markets, and food supply chains in some countries to minimize food supply chain disruptions, the negative impacts remained (Organisation for Economic Co-operation and Development 2020). As the COVID-19 pandemic continues, the impacts of these disruptions on agricultural incomes and food security could be grave.
2. In Pakistan, the agriculture sector holds an important place in the economy. It contributes 19% of the gross domestic product (GDP) and employs 39% of the labor force (Pakistan Bureau of Statistics [PBS] 2020). Agriculture is the backbone of the rural populace, which constitutes 63% of the country’s total population (PBS 2017) and supplies a large share of Pakistan’s exports (Economic Adviser’s Wing 2020). Before the COVID-19 outbreak, Pakistan’s GDP growth for 2019–2020 was projected at 3.2%, and the agriculture sector’s growth at 2.9% (Economic Adviser’s Wing 2020). However, the COVID-19 outbreak adversely affected Pakistan’s economy, slowing it down. Consequently, the country’s GDP growth for 2019–2020 was –0.4% (PBS 2020a). In addition, in early 2020, Pakistan experienced one of the largest locust attacks since 1993, which contributed to farm sector losses and risks (Food and Agriculture Organization of the United Nations [FAO] 2020b, FAO 2020c).
3. For Pakistan, the dual challenge of responding to the health crisis while mitigating widespread economic devastation is severe because of its fragile economic and political base. The lockdown acutely affected the informal sector and daily wage earners.1 Using the data of the Pakistan Labor Force Survey 2017–2018 conducted by the PBS, Gallup Pakistan analyzed and assessed the risk of joblessness because of COVID-19-related lockdowns. For agriculture, an estimated 32% of workers employed in the sector risk losing their jobs: 25% of the workers are at high risk and 53% are at medium risk (Gallup Pakistan 2020). However, few studies have measured the impact of the COVID-19 pandemic on agricultural marketing, employment, and farm household welfare in Pakistan.
4. The Asian Development Bank (ADB) conducted two mobile phone surveys with farmers in May and June 2020 in two provinces (Punjab and Sindh) in Pakistan.2 The focus was on these two provinces because Punjab has the largest share of population among Pakistan’s provinces, and Sindh has the second largest share. Punjab alone contributes about 57% of the value of agricultural production in Pakistan, and produces more than 70% of the country’s wheat and cotton, almost two-thirds of its sugarcane, and about half of its maize. Punjab’s horticultural output represents 67% of national production (Government of the Punjab 2018). Sindh has the country’s second largest total cropped area, at 3.6 million hectares (Ministry of National Food Security & Research [MNFSR] 2019). Sindh also contributes significantly
1 The informal sector is estimated to support 72% of employment (World Bank 2020c).2 The survey in Punjab was done under ADB technical assistance to Pakistan for Enhancing Technology-Based
Agriculture and Marketing in Rural Punjab (ADB 2019), with the Punjab Agriculture Department as the executing agency. Phone interviews were conducted by staff members of Centre for Agriculture and Bioscience International, Pakistan. See also ADB (2020a) and ADB (2020b). Phone interviews were conducted by staff members of the Research and Development Foundation, Sindh, Pakistan. Appendix 1 provides raw survey results.
I. INTRODUCTION

2 ADB Central and West Asia Working Paper Series No. 10
to the country’s overall agricultural production of major crops: 41% of rice, 31% of sugarcane, 21% of wheat, and 15% of cotton. Less than half (47%) of Sindh’s population lives in rural areas (PBS 2017), which is considerably less than the share of the rural population in other provinces. However, 65% of the labor force in rural Sindh is engaged in agriculture, which is the highest agriculture labor share among Pakistan’s provinces (PBS 2018).
5. In Punjab, ADB contacted 668 farmers for a survey across 10 districts and interviewed 429 farmers in May 2020. In Sindh, ADB contacted 721 farmers across 8 districts and interviewed 410 farmers in June 2020. The surveys collected information about how COVID-19-related measures and disruptions affected (i) the harvesting and marketing of rabi crops (crops that are sown and harvested from about November to April) and milk, (ii) the availability and price of inputs, and (iii) farmers’ financial needs. The surveys also sought to determine the impact of the locust invasion in these two provinces.
6. The two surveys found significant negative impacts of the COVID-19 pandemic on farm households in Punjab and Sindh, as discussed in detail in this working paper. In Sindh, locust swarms exacerbated the negative impacts on rural households. On policy measures against the COVID-19 pandemic and locust swarms, the surveys asked farmers for their preferred policy measures (paras. 72–76). As the pandemic persists and hampers the movement of goods and people, it is important to facilitate the movement of agricultural and food products to protect people’s food security, especially for vulnerable groups.
II. COVID-19, RESTRICTIONS, AND CENTRAL AND WEST ASIAN ECONOMIES
7. Globally, countries produced various policy responses designed to limit the proliferation of COVID-19 and alleviate the pressure on health systems. The measures ranged from very drastic lockdown policies in Asia and Southern Europe to less stringent approaches elsewhere (Mendolia, Stavrunova, and Yerokhin 2020). The varying policy measures aimed to cope with the pandemic's ill effects continue to be the topic of debate around the world. Discussions are focused on evaluating the costs and benefits of varying levels of lockdown measures. The United Nations Economic and Social Commission for Asia and the Pacific (ESCAP) (ESCAP 2020) has calculated the stringency level of lockdown in Central and West Asian countries (Table 1).3 The stringency levels are coupled with the countries’ average community mobility and GDP growth, which helps to assess and understand the impact that the measures have on the economies.4
8. Nepal exercised the most stringent lockdown methods. Nepal has been swamped with complaints regarding the loss of business, income, and even lives because of harsh public movement restrictions (The Statesman 2020). However, other Central and West Asian economies have not been far behind in the stringency of their policy levels during the pandemic. Average community movement was limited across all Central and West Asian economies. In India, Nepal, and Sri Lanka, community mobility was more restricted than during the reference period (3 January–6 February 2020), but in Afghanistan, Bangladesh, and Pakistan, community mobility was increasing during the same period
3 The stringency index was calculated by ESCAP considering several containment measures implemented by governments. The measures include closing schools and workplaces, banning public gatherings, requiring people to stay at home, closing public transport, and limiting domestic and international travel.
4 A comparison of growth estimates before and after the beginning of the crisis shows a range of –2.7% to 6.1% for Central and West Asia (ESCAP 2020). This is a very substantial loss of 8.8% of income for the Central and West Asian countries, posing severe consequences for livelihoods.

The Impact of COVID-19 and Locust Invasion on Farm Households in Punjab and Sindh 3
to allow the resumption of normal economic operations. Moreover, after lockdown measures were implemented, mobility declined sharply, triggering unprecedented supply disruptions. These, in turn, impacted incomes and amplified risk aversion, which reduced demand across all sectors (The World Bank, 2020f). Although all countries’ levels of community mobility have remained very low during the lockdowns, most of the economies have slowly started to open.
Table 1: Stringency Policy Levels, Community Mobility, and Gross Domestic Product Growth
Item Afghanistan Bangladesh India Nepal Pakistan Sri LankaStringency level 84 82 79 93 80 77Average community mobility (%) 9.3 2.8 (17.7) (16.3) 1.8 (17.0)
GDP growth (%)
2019 3.0 7.9 4.2 7.1 3.3 2.32020 (5.5) 1.6 (3.2) 1.8 (2.6) (3.2)
( ) = negative, GDP = gross domestic product.
Sources: University of Oxford, Blavatnik School of Government. COVID-19 Government Response Tracker. https://www.bsg.ox.ac.uk/research/research-projects/coronavirus-government-response-tracker#data (accessed 12 October 2020); Google. COVID-19 Community Mobility Reports. https://www.google.com/covid19/mobility/ (accessed 11 October 2020); and World Bank. 2021. Global Economic Prospects, January 2021. Washington, DC. https://openknowledge.worldbank.org/bitstream/handle/10986/34710/9781464816123.pdf.
9. Owing to such stringent lockdown measures and their detrimental impact on the supply chain, official GDP growth has decelerated significantly. All the economies display a downward trajectory in annual growth of GDP. GDP growth in the most severely impacted economies—Afghanistan, India, Pakistan, and Sri Lanka—has turned negative. Bangladesh, Bhutan, and Nepal may still see their economies grow even at marginal rates. These projections hint that the pandemic could be contained while reviving economic activities. A World Bank report (2020e) on Central and West Asia’s economies dated 12 April 2020 revised its regional GDP growth forecast for 2020 from 6.3% to the range of 1.8%–2.8%. The prediction has been true in the case of Bangladesh and Nepal. However, in the remaining countries, the GDP decline has been more severe than anticipated. This has been Central and West Asia’s worst annual economic performance since 1981.
10. In addition to the disruptions of domestic food supply chains and loss of incomes and remittances, the COVID-19 pandemic has elevated food security risks. Despite stable global food prices, numerous countries are experiencing varying food price inflation levels at the retail level, reflecting supply disruptions because of COVID-19 (FAO 2020e). This has affected low-, and middle-income countries more than high-income countries, as a larger share of income is spent on food in the low- and middle-income countries. Moreover, the World Bank (2020e) has revealed that COVID-19 will leave lasting scars on Central and West Asia’s economies. The FAO (FAO et al. 2019) notes that before COVID-19 hit, 820 million people globally were undernourished, of which 135 million people were experiencing acute food insecurity (World Food Programme 2020). In Central and West Asian economies, 254.3 million people were undernourished (World Bank—accessed 15 October 2020), and about 51% of the population was already suffering from food insecurity. As incomes fall, malnutrition will worsen with long-lasting impacts, as 40 million to 60 million more people will be living in extreme poverty, depending on the scale of the economic shock (World Bank 2020a).
11. The global pandemic started as a health emergency but has transformed into a humanitarian crisis that has endangered hundreds of millions of people. Real growth will continue to slow in the face of a reversal of globalization and falling working populations (Goodhart and Pradhan 2020). About 68.2% of the employed population in Central and West Asia make their living in the informal economy, and 94.7% of agricultural employment is informal in the region (International Labour Organization 2018).

4 ADB Central and West Asia Working Paper Series No. 10
12. As a large proportion of workers in Central and West Asia have no access to formal social protection because of the informal nature of their jobs (Table 2), they are at a high risk of falling into extreme poverty. The crisis has accentuated inequalities while creating new forms of exclusion. In Afghanistan, Bangladesh, Nepal, and Pakistan, more than 96% of the workforce has no security of employment (Table 2). In India, 89.7% of the workforce lacks security and in Sri Lanka it is 75.9% of the workforce (ESCAP 2018). In addition, about 47.4% of Central and West Asia’s labor force without social security is employed in agriculture (Liu et al. 2020). Such workers are vulnerable to economic shocks that affect their livelihoods.
Table 2: Security of Employment (%)
Security of Employment Afghanistan Bangladesh India Nepal Pakistan Sri Lanka
With security 3.7 2.5 10.3 3.4 3.9 24.1Without security 96.3 97.5 89.7 96.6 96.1 75.9
Source: United Nations Economic and Social Commission for Asia and the Pacific. 2018. Achieving the Sustainable Development Goals in Central and West Asia: Key Policy Priorities and Implementation Challenges. https://www.unescap.org/sites/default/files/publications/UNESCAP%20-%20SRO-SSWA%20SDG%20Report_Sep2018.pdf.
13. Given the urgency of the COVID-19-induced challenges and the limitations on the abilities of agriculture-dependent countries to cope with the disruptions, international agencies have prioritized the agriculture and food sectors while developing assistance programs. For example, $96 million allocated in Bangladesh will include cash transfers to vulnerable dairy and poultry farmers for business continuation (World Bank—Food Security and COVID-19). In Pakistan, the World Bank has financed projects that provide direct livelihood support to 18,000 female-headed households to develop kitchen gardens, small-scale livestock, and agricultural activities (World Bank—Food Security and COVID-19).
III. COVID-19 AND RESTRICTIONS ON FOOD SUPPLY CHAINS IN PAKISTAN
14. Pakistan’s first confirmed case of COVID-19 was reported on 26 February 2020 in Sindh province. By 18 March 2020, COVID-19 cases had been registered in all four of Pakistan’s provinces, the two autonomous territories, and the federal capital of Islamabad. The governments of Balochistan and Sindh announced province-wide lockdowns on 24 March 2020. The federal government followed soon after, imposing on 1 April 2020 a nationwide lockdown, which lasted until 9 May 2020. Lockdown restrictions brought mobility in Pakistan down by about 65% as early as 11 April, according to Google mobility data (Google—accessed 11 October 2020).5 Figure 1 shows mobility data for March–August 2020 in Punjab and Sindh provinces.
15. At the provincial level, the lockdown was stricter in Sindh than in Punjab. On average, Sindh experienced 11% more restricted mobility after 15 March 2020 when cases increased strikingly across Balochistan and Sindh.
5 The daily aggregate mobility was computed by taking the ordinary average percentage change in mobility from the baseline period (15 February 2020) for retail and recreation, groceries and pharmacies, parks, transit stations, workplaces, and residential.
The Impact of COVID-19 and Locust Invasion on Farm Households in Punjab and Sindh 5
Figure 1: Google Mobility Data for Punjab and Sindh Provinces, March–August 2020
–70
–60
–50
–40
–30
–20
–10
0
10
15-Mar-20 15-Apr-20 15-May-20 15-Jun-20 15-Jul-20 15-Aug-20
Sindh Punjab
Source: Authors’ calculations based on daily Google mobility data. Google. COVID-19 Community Mobility Reports. https://www.google.com/covid19/mobility/ (accessed 11 October 2020).
16. The nationwide lockdown because of COVID-19 halted most economic activities (except for essential services such as grocery stores, pharmacies, and hospitals) and had a detrimental impact on food supply chains. Pakistan relies largely on the interprovincial movement of food to balance supply and demand across the seasons and to take advantage of different agro-ecological zones (FAO 2020a). Because wheat is the main commodity associated with food security through interprovincial trade, the COVID-19 disruptions raised concerns over wheat marketing. The International Rescue Committee conducted a rapid needs assessment in April 2020. The assessment noted that district government officials were concerned about food supply—a significant proportion of respondents at the community level reported food shortages at home and unavailability of food items in markets (International Rescue Committee 2020).6
17. The lockdown took place just as the wheat harvesting season and sowing of kharif crops began. The sowing of kharif crops and harvesting of rabi crops starts earlier in Balochistan and Sindh (March–April) than in Khyber Pakhtunkhwa and Punjab (April–May). Two types of disruption occurred at the time: (i) the marketing of the recently harvested wheat was disrupted by the difficulty of continuing interprovincial trade; and (ii) the area subsequently sown for the kharif crop cycle decreased because of a labor shortage, a decline in input availability, and an increase in input prices. While machinery service providers, input providers, markets, and other agriculture sector components were exempted from COVID-19-related restrictions, farmers still faced disruptions such as higher rental charges, labor shortages, and limited access to markets (FAO 2019). Anecdotal evidence suggests farmers faced severe difficulties getting their produce to the market during April and May (Jamal 2020; Action Against Hunger 2020). Farmers in Pakistan supply their products primarily to wholesale markets (Siddiq and Basher 2019), but reports suggested that mobility restrictions prevented some farmers from taking their crops to market (Latif and Niazi 2020).
18. Food crops in Pakistan are classified primarily into two groups: (i) cereals such as wheat, rice, and maize; and (ii) fresh produce such as vegetables and fruits. Fresh produce faced a much higher risk of disruption than cereals, which are less perishable and whose production is more mechanized. Fresh produce
6 The International Rescue Committee rapid needs assessment was conducted remotely and covered 12 districts across the country. The assessors interviewed 252 households, 54 “key informants” in communities, and 25 government officials.
6 ADB Central and West Asia Working Paper Series No. 10
requires more labor, and therefore a labor shortage could adversely affect it. Because fresh produce is highly perishable, disruptions and delays in its distribution to the market can cause farmers to suffer huge losses. Similarly, the livestock sector, with a 60.6% share of agriculture and an 11.7% share of the overall economy, is also vulnerable to restriction of movement, as livestock produce is also highly perishable (PBS 2020a).
IV. LOCUST SWARMS AND FOOD SECURITY IN PAKISTAN
19. Locusts are considered to be the most destructive migratory pest in the world. They are highly mobile and can form swarms containing millions of the insects, leading to devastating impacts on crops, pasture, and fodder (World Bank 2020b). The desert locust threat to food security and livelihoods is increasing in Central and West Asia. Before the onset of the monsoon rains, many of the spring-bred swarms migrated to the India–Pakistan border. The FAO (2020c) noted,
“An upsurge [of locusts] developed in 2019 as a result of two cyclones that brought heavy rains to the Empty Quarter on the Arabian Peninsula in May and October 2018 that was exacerbated by Desert Locust outbreaks along the Red Sea coast during the winter of 2018/2019. The cyclones allowed at least three generations of unprecedented breeding in the Empty Quarter that was not detected. Swarms emigrated from these areas to spring breeding areas in the Central and Eastern regions from January to March 2019. Two generations of spring breeding occurred that spread to the Horn of Africa and to the Indo-Pakistan border in June. Three more generations occurred in the latter area as a result of the best monsoon rains in 25 years, leading to locust attacks in June 2020.”
In Pakistan, the locust swarms hit Balochistan and Khyber Pakhtunkhwa provinces first and then moved to Sindh and southern Punjab.
20. A report by the United Nations Office for the Coordination of Humanitarian Affairs estimated that 1.5 million people were affected by the locust infestation in Pakistan, noting that 46 districts in Pakistan (11 in Balochistan, 14 in Khyber Pakhtunkhwa, 13 in Punjab, and 8 in Sindh) are prone to desert locust infestation and 12 districts (10 in Balochistan and 2 in Sindh) had the infestation (United Nations Office for the Coordination of Humanitarian Affairs 2020). As of 1 November 2020, 636,280 square kilometers (km2) had been surveyed, and 11,345 km2 had been treated for locusts in Pakistan in an ongoing control operation using aircraft, vehicle-mounted sprayers, power sprayers, and manual sprayers (Government of Pakistan, National Locust Control Centre 2020). Furthermore, the FAO estimated that, without effective measures, locust infestations would cause up to PRs688.5 billion ($4.3 billion as of May 2020) in damage to the kharif crops and PRs705.8 billion ($4.4 billion as of May 2020) to the rabi crops, assuming 25% damage to crops (FAO 2020f). An infestation of such magnitude has not occurred since 1993, and the outdated government infrastructure for locust control is ill-equipped to fight the new locust attacks.
21. The Office for Coordination of Humanitarian Affairs has reported that losses because of the desert locust were expected to range from $3.4 billion to $10.2 billion during the agricultural seasons in 2020 and 2021. More than 3 million people in Pakistan are facing severe acute food insecurity. An estimated 34,000 households will need emergency livelihood and food security assistance because of crop losses. The actual number of people affected by crop losses leading to price hikes in essential commodities could be more than reported (United Nations Office for the Coordination of Humanitarian Affairs 2020). The National Disaster Management Authority reported that desert locusts in 43 of Pakistan’s districts were alarming farmers and the local population. The swarms engulfed several Punjab and Sindh cities, including Muzaffargarh, Rahim Yar Khan, and Sukkur, threatening vegetable and other crops (FAO 2020c).

The Impact of COVID-19 and Locust Invasion on Farm Households in Punjab and Sindh 7
22. Because the locust crisis overlaps with the COVID-19 pandemic, it has created a crisis within a crisis. The COVID-19 pandemic alone could create a severe food security crisis in Pakistan, as agricultural production contracts and food imports decline. The combined impacts of the COVID-19 pandemic and locust swarms raise grave concerns about agricultural production and food security in Sindh province, which was the most severely hit. Together, the two crises could generate the conditions for famine, disease, and increased poverty.
23. Local agri-food supply chains are already experiencing disruptions, including reduced access to inputs and services, labor movement, transport, and credit or liquidity because of the COVID-19 pandemic. In particular, the pandemic is disrupting the supply chains for pesticides and other equipment necessary to control the spread of locusts. Border closures and delays posed by quarantine measures are restricting the movement of personnel and equipment needed for the locust response (World Bank 2020b).
V. SAMPLED FARMERS
A. Punjab
24. Punjab province has five cropping zones: (i) rice–wheat, (ii) mixed cropping, (iii) cotton–wheat, (iv) rain fed or arid, and (v) low intensity (FAO 2019). In 2017, ADB conducted a survey of 350 farmers in 8 districts in the rice–wheat zone.7 Among them, phone numbers were collected only from 256 respondents. Similarly, a list of 369 farmers from 4 districts—2 (Hafizabad and Sheikhupura) in the rice–wheat zone and 2 (Okara and Pakpattan) in the mixed cropping zone—and their contact details were compiled as part of ADB project activities through farmer listing or with the help of the agriculture extension services.8 In addition, 43 farmers’ names and contact details were collected from initial respondent farmers, for a total of 668 farmers from 10 districts of Punjab. The study team successfully completed phone interviews with 429 farmers.9
B. Sindh
25. Sindh province is divided into three zones based on climatic and soil conditions and suitability for different crops: Siro (the upper part), Wicholo (the middle part), and Lar (the lower part). In 2016, the International Rice Research Institute (IRRI) conducted a rice monitoring survey of 420 farmers from 8 of Sindh’s rice-producing districts: 6 districts in upper Sindh and 2 in lower Sindh. Of the 420 farmers IRRI surveyed, phone numbers were available for only 326. Phone numbers of an additional 395 farmers were collected from initial respondent farmers through “snowballing.”10 In total, the IRRI study team contacted 721 farmers and successfully completed computer-assisted phone interviews with 410 farmers.11
7 The survey was done under ADB technical assistance to Pakistan for the Punjab Basmati Rice Value Chain (ADB 2013).8 The list was compiled under ADB technical assistance to Pakistan for Enhancing Technology-Based Agriculture and
Marketing in Rural Punjab (ADB 2019). 9 Of the 668 target farmers, 80 had their phones switched off or did not answer despite several (at least five) attempts to
call on different days, the contact numbers of 118 farmers were incorrect or the person contacted was not a farmer and not the same person listed, and 41 farmers declined to participate in the survey.
10 Snowballing or chain-referral sampling is a method that involves a primary data source nominating other potential data sources that will be able to participate in the study or research.
11 Of the 721 target farmers, 228 had their phones switched off or did not answer despite several (at least five) attempts to call on different days, the contact numbers of 59 farmers were incorrect or the person contacted was not a farmer and not the same person listed, and 24 farmers declined to participate in the survey.

8 ADB Central and West Asia Working Paper Series No. 10
VI. SURVEY RESULTS AND DISCUSSION
A. COVID-19 Impacts on Households
26. Among farm households in Punjab, one-third experienced losses in wages and nonfarm earnings, more than 22% reported that at least one family member had returned from urban and/or other areas, more than 11% reported reduced nonfood expenditures, and just under 10% reported lower food consumption (Figure 2). These percentages were slightly higher in the rice–wheat zone than in the mixed cropping zone. Among farm households in Sindh, more than one-half reported lower food consumption, nearly one-half reported reduced nonfood expenditures, more than one-third reported that at least one family member had returned from urban and/or other areas, and more than one-third reported losses in wages and nonfarm earnings (Figure 2).
Figure 2: Farm Households’ Experience during COVID-19 in Punjab and Sindh (% of respondents)
33.337.3
22.6
39.5
9.8
58.3
11.2
45.4
2.8 2.20
10
20
30
40
50
60
70
Punjab Sindh
Experienced losses in wage and nonfarm income Family members returned from urban and/or other placesReduced food consump�on Reduced nonfood expenditureOther
ADB = Asian Development Bank, COVID-19 = coronavirus disease.
Sources: Authors’ calculations based on data gathered under ADB phone surveys with farmers in Punjab in May 2020 and Sindh in June 2020.
27. This loss in livelihood can have a detrimental impact on decades of gains from development. In addition, the loss casts a shadow over food security of households involved in agriculture, because of reduced income. Further, loss of income can lead to financial distress for farming households during the interval from sowing to harvesting, in the absence of income support from the government.
B. COVID-19 Impacts on Crops, Dairy, and Farm Inputs
28. Crops grown during the 2019 rabi season. In Punjab, the predominant rabi season crop is wheat, which was produced by 96.7% of survey respondents. Berseem, a fodder crop for livestock, was

The Impact of COVID-19 and Locust Invasion on Farm Households in Punjab and Sindh 9
the second most frequently grown crop, produced by 49.9% of respondents. In addition, 12.8% grew maize, which is used widely for poultry feed; 11.7% raised vegetables; 5.1% grew fruit; and 6.1% planted miscellaneous other crops.
29. In Sindh, the predominant rabi season crop is also wheat, as reported by 90.0% of respondents. Oilseed was grown by 27.3% of respondents, followed by tomatoes at 25.6%. Sindh farmers also produced a substantial quantity of two fodder crops: lucerne (20.0%) and berseem (19.3%). In addition, farmers grew onion (as indicated by 9.3% of respondents), melon (5.1%), sugarcane (3.9%), and banana (1.2%). A few (2.2%) grew miscellaneous fruits, and some (7.8%) planted other crops. Finally, 20.2% of producers grew a variety of vegetables.
30. COVID-19 impact on the wheat harvest. In Punjab, 97.3% of respondents reported having completed harvesting wheat—for a majority of them, the harvesting period started from the last week of April to the second week of May 2020.12 Although 50.7% of farm households in Punjab reported a delayed wheat harvest, the main cause cited was rain, not the COVID-19 pandemic. Looking together at Google mobility data and harvesting dates, the number of farmers who completed their harvest remained minimal during the restrictions, but the number increased as mobility restrictions were eased.
31. In Sindh, all but one respondent reported having completed harvesting wheat. The majority had completed their harvest by the fourth week of March, although this was much more prevalent in upper Sindh (81.7%) than in lower Sindh (57.1%). In lower Sindh, 39.0% of respondents had completed their wheat harvest by the fourth week of March, with the rest completing their harvest later. One-third of the respondents felt that their wheat harvest had been delayed compared with the past years; of these, 38.6% cited rain as the reason, 26.8% stated that harvesting machines were not available on time, and 18.9% noted a shortage of labor during harvest time. The share of respondents reporting unavailability of labor was higher in lower than in upper Sindh. Respondents who did not cite rain as a reason for delay were asked whether the COVID-19 pandemic had an impact on the delay of their wheat harvest—84.3% of them answered that the harvest delay was caused by the pandemic.13
32. Although the harvest time in Sindh is earlier than in Punjab, the COVID-19 pandemic struck Sindh before it hit the rest of Pakistan. Sindh went into lockdown on 22 March 2020, while the rest of the country imposed a nationwide lockdown on 1 April 2020. By the third week of March, community mobility was largely restricted in Sindh, coinciding with the time when 16.2% of crops were harvested.
33. COVID-19 impact on wheat marketing. Of the respondents who had completed their harvest at the time of the survey in Punjab, 74.6% reported that they were able to market wheat without difficulty.14 Most of those who did not sell wheat kept the produce for self-consumption (Figure 3). Only a few respondents faced difficulty selling their wheat. Asked to identify their major wheat crop buyers, 40.1% of respondents cited the government as their primary buyer; the remaining 59.9% sold their harvest in the open market. By area, the proportion of sales in the open market in the rice–wheat zone was 61.2%,
12 Only five respondents reported not having completed their wheat harvest at the time of the survey and stated that they would complete harvesting by the fourth week of May. Six more respondents could not harvest their wheat crop mostly because of waterlogging resulting from excessive rains. About 83.9% of respondents felt that their harvests were delayed relative to previous years, mostly because of late rain.
13 During interviews, farmers explained that combine harvesters used in Sindh largely come from Punjab and, because of the lockdown, machines were not allowed to move from one province to another. Some farmers also noted that every season, machines need repair before going into the fields and, again because of the lockdown, workshops were closed and that is why machines were delayed in reaching Sindh.
14 The food department under the Government of Pakistan’s MNFSR provided price support in buying wheat from farmers at PRs1,400 per 40 kilograms (kg), which was higher than the prices offered by local traders. The government also exempted agriculture businesses from lockdown restrictions. However, disruptions were reported in some places. Appendix 2 provides information about the government crop procurement policy.
10 ADB Central and West Asia Working Paper Series No. 10
while it was 44.0% in the mixed cropping zone. Respondents who sold in the open market reported an average price of PRs1,367 ($8.5 as of May 2020) per 40 kilograms (kg) of wheat.
Figure 3: Reasons for Not Selling or Being Unable to Sell Wheat (% of respondents who did not sell or had difficulty selling)
84.6
15.4
2.9
25.8
3.8
33.7
8.7
25.2
0
10
20
30
40
50
60
70
80
90
Punjab Sindh
Kept for self-consump�on Traders not available Unable to visit markets and/or ci�es Other reason
Source: Authors’ calculations based on data gathered under Asian Development Bank phone surveys with farmers in Punjab (May 2020) and Sindh (June 2020).
34. In Sindh, of the respondents who had completed their harvest at the time of the survey, 65.3% reported that they were able to market wheat with difficulty, 20.1% marketed it without any difficulty, and 14.6% were unable to market their wheat. Of those who were unable to market wheat or had difficulty doing so, one-quarter stated that they were unable to visit markets and cities, one-fourth noted that traders were not available, and more than 15% kept the produce for self-consumption. Most respondents who were unable to sell or were able to sell with difficulty stated they felt it was because of COVID-19.
35. Asked to identify their major wheat crop buyers, 95.4% of respondents in Sindh said they sold their harvest in the open market, and only 4.6% cited the government as their primary buyer.15 Respondents who sold in the open market reported an average price of PRs1,278 ($7.9 as of May 2020) per 40 kg of wheat.
36. Of the respondents who sold wheat to the market, 65.3% in Sindh reported they were able to sell it with difficulty, versus none in Punjab. The main reasons noted for the difficulty were that traders were unavailable, and farmers were unable to visit markets or cities. These numbers coincide with Sindh having more restricted mobility than was the case in Punjab. Furthermore, 40.1% of the Punjab respondents reported that the government was the primary buyer of wheat, but this figure was reported to be only 4.6% in Sindh.
15 The food department under the Government of Pakistan’s MNFSR provided price support in buying wheat from farmers at PRs1,400 per 40 kg, which was higher than the prices offered by local traders. However, farmers reported that the government did not provide the necessary jute bags, and therefore they had to sell wheat in the open market. Although the government also exempted agriculture businesses from lockdown restrictions, disruptions were reported in some places.

The Impact of COVID-19 and Locust Invasion on Farm Households in Punjab and Sindh 11
37. Policies adopted by the Punjab and Sindh provincial governments caused disruptions in wheat marketing:
(i) On 5 April 2020, the Government of Sindh decided not to procure grain largely because of the panic buying created by the rapid spread of COVID-19 and the countrywide lockdown (Dawn 2020b). The economic disruptions caused by the COVID-19 pandemic were blamed for severe wheat flour shortages and the consequent sharp price spike in the province. As a result, the interprovincial ban on wheat transport from Sindh was expected to lead to flour shortages in Punjab because four major mills in Punjab largely depended on wheat purchased from Sindh, where the harvest is earlier in the year than in Punjab. The Sindh provincial government delayed transport of wheat purchased by Punjab mills to first meet its own procurement target of 1.4 million tons from the harvest (Jamal 2020).
(ii) Consequently, the Government of the Punjab restricted the movement of wheat in the districts of Punjab (Dawn 2020c). Simultaneously, the Punjab provincial government decided to set a wheat procurement target of 4.5 million metric tons; PRs158 billion ($985 million as of May 2020) were to be spent to benefit the farmers and uplift the rural economy, while ensuring food security of the province (The Express Tribune 2020b).
As a result, farm households in Sindh were left worse off than those in Punjab.16
38. COVID-19 impact on vegetable and fruit harvests. The COVID-19 pandemic impacted perishable food items first and then the staple foods (Pakistan Institute of Development Economics 2020). Perishable food items need to be picked, packed, and shipped daily, which demands continuity of farm labor supply and human-to-human interaction. Thus, the COVID-19 pandemic could disrupt the supply chain.
39. In Punjab, 65 respondents had grown vegetables or fruit in the previous rabi season (November 2019–May 2020). Of those, 29.2% stated they had completed their entire harvest for the season, and a further 53.8% reported having completed at least one harvest.17 In Sindh, 128 respondents had grown vegetables or fruit other than tomatoes in the previous rabi season. At the time of the survey, 81.3% of those who had grown vegetables or fruits stated that they had completed the entire harvest for the season, and a further 17.2% reported having completed at least one harvest.18 One-third of the vegetable and fruit farmers (32.5%) felt their harvest had been delayed compared with the past years; 41.5% of them cited labor unavailability as the primary reason for the delay and a further 14.6% noted that they were waiting for a better market price. When asked if the COVID-19 pandemic had contributed to the delay, all responded affirmatively.
40. COVID-19 impact on vegetable and fruit marketing. Unlike the experience of wheat farmers, large proportions of vegetable and fruit farmers in Punjab reported difficulties with marketing their produce. About 39% of the vegetable and fruit growers found offered prices too low, 36% could not visit
16 Although the support price offered by both provincial governments was the same at PRs1,400 per 40 kg bag, 60% of farmers in Punjab and 95% of those in Sindh had to sell wheat at markets because of procurement issues. The average prices received by those who sold at markets were PRs1,378 in Punjab and PRs1,247 in Sindh.
17 A small proportion of respondents from the rice–wheat zone reported that they would harvest in the near future; only two respondents stated they would not be able to harvest largely or completely because of rain damage. Almost half of the harvesting was completed by the second week of April, with another surge in the second week of May. Most of those who had yet to complete their harvests and the majority of respondents who were yet to start harvesting stated that they would be able to do so after the fourth week of May.
18 Only two respondents stated they would not be able to harvest largely or completely because of damage to the crops from rain and locusts. Much of the harvesting was completed after the fourth week of March (56.7%), with about one-quarter of respondents (26.9%) having completed their harvest by the fourth week of March. Most of those who had not completed or started harvesting said that they would be able to do so by the fourth week of June (68.2%), with the remaining 31.8% stating that they would be able to complete it after the fourth week of June.

12 ADB Central and West Asia Working Paper Series No. 10
markets, and 16% could not find traders to sell their produce (Figure 4). In the rice–wheat zone, slightly less than one-quarter of the vegetable and fruit growers found offered prices too low, and another quarter could not visit markets. In the mixed cropping zone, all respondents who did not sell their produce found offered prices were too low, and most of them stated the COVID-19 pandemic as the main reason for the problems they faced.
Figure 4: Reasons for Not Selling or Being Unable to Sell Fruits and Vegetables (% of respondents who did not sell or had difficulty selling)
9.7
3.0
16.1
28.3
35.5
53.5
38.7
15.2
0
10
20
30
40
50
60
Punjab Sindh
Kept for self-consump�on Traders not available
Unable to visit markets and/or ci�es Offered price was very low
Source: Authors’ calculations based on data gathered under Asian Development Bank phone surveys with farmers in Punjab (May 2020) and Sindh (June 2020).
41. In Sindh, 67.5% of farmers were able to market their produce but with difficulty; only 21.4% were able to market without difficulty. The inability to visit markets and cities was cited by 58.6% of farmers from upper Sindh and 41.4% of farmers from lower Sindh as the primary obstacle, while the unavailability of traders was cited by 24.3% of farmers from upper Sindh and 37.9% of farmers from lower Sindh as the secondary obstacle. Almost all respondents (97.9%) stated the COVID-19 pandemic as a main reason for their difficulties with marketing.
42. Comparatively, 21.1 percentage points more farmers in Sindh than in Punjab reported that they faced difficulties with marketing fruits and vegetables or were unable to sell them. In Sindh, the two primary reasons reported by respondents who did not sell or sold with difficulty were that (i) traders were not available on time, or (ii) they could not visit markets and/or cities. In Punjab, the two primary reasons reported were that (i) they could not visit markets and/or cities, or (ii) they were offered very low prices for the produce.
43. Reasons such as traders not being available and the inability to visit markets and/or cities are consistent with the mobility restrictions in the provinces. In terms of low prices in Punjab resulting from the restrictions imposed because of the COVID-19 pandemic, a differential in demand and supply has been created across the country: a food surplus in one region lowers the prices for the harvest while another region simultaneously faces excess demand and increased prices, which has caused a looming crisis of unequal distribution (Jamal 2020). The COVID-19 Pakistan: Socio-Economic Framework revealed short-term fluctuations in the prices of major food items in different parts of the country (United Nations Development Programme 2020). While the price of most food items has increased by

The Impact of COVID-19 and Locust Invasion on Farm Households in Punjab and Sindh 13
about 10%, the price of vegetables has been lower since the outbreak. Further analysis of data from the PBS Sensitive Price Indicator for the week of 7 May 2020 indicated an increase of 0.4% over the previous week. Among food items, the significant increases were for poultry (23.7%) and bananas (7.4%), while significant decreases were for onions (9.2%), tomatoes (3.1%), garlic (1.2%), wheat flour (0.5%), and sugar (0.1%) (PBS 2020b). These facts and figures agree with the initial predictions that food prices across the country would be volatile because of the COVID-19 pandemic, with perishable items such as tomatoes and onions at a higher risk of decreased prices. The decreases have impacted the farm households negatively.
44. The FAO noted that the increasing prices of wheat and other crops since the second half of March 2020 have resulted from an upsurge of on-demand and transport disruptions related to the COVID19 pandemic. Harvest delays because of above-average rains provided further upward pressure on prices (FAO 2020e). Overall, prices in March remained well above levels a year earlier and were at near record highs in some markets. Evidently, the COVID-19 pandemic has had a negative impact associated with reduced economic activities and the adverse effects on the food supply chain, thus heightening concern for food security in the country.
45. The case of tomato production in Sindh. The impact of tomato production is different in Punjab and Sindh. As of 2018, in Punjab, tomato production accounted for only 7.8% of the province’s total vegetable production, but in Sindh, the figure was 59.6% (MNFSR 2019). Looking at the percentage of tomatoes in the total production of vegetables per district in Punjab, the figures remain negligible.19 However, in Sindh, tomato is an important crop. During 2015–2018, farmers grew tomatoes on an average of 27,600 hectares yearly, the largest area among Pakistan’s provinces, and they produced an average of 204,400 tons annually during the same period, making Sindh the country’s largest tomato producer (MNFSR 2019). As tomatoes are an important source of livelihood for farmers in Sindh, the Sindh respondents were asked separately about their tomato harvest.
46. Most respondents (61.0%) were unable to complete their tomato harvest, and 6.7% were unable to harvest at all. The proportion of respondents who had completed their harvest was higher in upper Sindh (40.5%) than in lower Sindh (27.0%). Most respondents (65.3%) who had completed the harvest said they had done so after the fourth week of March, with a further 22.4% noting they had finished harvesting by the fourth week of March.
47. Most respondents who had not completed their harvest or were unable to harvest at all stated that they instead plowed their produce under as green manure. The majority of farmers (76.5%) who did so cited their reason as the low price because of decreased demand, while the rest said they had difficulty accessing the market. Farmers who had plowed their produce under cited the COVID-19 pandemic as the reason for their decision.
48. Of the 98 respondents who were able to harvest their tomatoes, only 6.1% were able to market their produce without difficulty. Most respondents were able to market but with difficulty (61.2%) and the remaining 32.7% were unable to market at all.
49. Those who were not able to market their tomatoes or faced difficulties marketing them stated the following reasons: almost half were unable to visit markets and cities, nearly one-third stated traders were not available, and 17% cited low market prices. Almost all respondents (97.8%) cited the COVID-19 pandemic as a reason for not being able to sell their produce or their difficulty selling it (Figure 5).
19 In Gujranwala district, tomatoes comprise 0.300% of the total vegetable production. This figure is reported to be 0.001% for Gujrat, 0.020% for Mandi Bahuddin, 0.200% for Nankana Sahib, 0.008% for Narrowal, 0.030% for Sialkot, 0.030% for Hafizabad, 1.200% for Shiekhpura, 0.090% for Okara, and 0.130% for Pakpattan.

14 ADB Central and West Asia Working Paper Series No. 10
Figure 5: Reasons for Not Selling or Being Unable to Sell Tomatoes (% of respondents who did not sell or had difficulty selling)
1.1 1.1
31.5
48.9
17.4
0
10
20
30
40
50
60
SindhKept for self-consump�on Stored as seed Traders not available
Unable to visit markets and/or ci�es Low market prices
Source: Authors’ calculations based on data gathered under Asian Development Bank phone surveys with farmers in Punjab (May 2020) and Sindh (June 2020).
50. COVID-19 impact on dairy marketing. Respondents in Punjab and Sindh who raise livestock and sell milk cited difficulties with selling their milk (Figure 6). Of the 145 respondents who reported having livestock for milk production and selling milk in the market in Punjab, about two-thirds reported that they had been unable to market or faced difficulty marketing their milk daily in the previous few months. Of those who reported difficulties in marketing milk or were unable to market it, about three-quarters cited unavailability of traders as the reason, followed by one-fifth who reported they could not visit markets. When asked whether the COVID-19 pandemic was a contributing factor, nearly all answered affirmatively. Furthermore, three-quarters of all respondents reported that the price of milk had decreased because of the COVID-19 pandemic.
51. In Sindh, of the 137 respondents raising livestock for milk and selling it in the market, 81% reported difficulty marketing their milk daily in the past few months, and a further 12% were unable to market their milk at all. Of those who reported difficulties with marketing milk or who were unable to market it, about two-thirds said it was because they could not visit the market, followed by one-third who cited unavailability of traders as the reason. When asked whether the COVID-19 pandemic was a contributing factor, 99.2% of respondents who were unable to market their milk answered affirmatively. Furthermore, 89.1% of respondents reported that the price of milk had decreased because of the COVID-19 pandemic.
52. In both provinces, the majority of the farm households either did not have livestock or, if they had livestock, did not sell milk. However, among farmers who did sell milk, it was more difficult to do so in Sindh than in Punjab. About 14 percentage points more farmers in Sindh than in Punjab reported a drop in the price of milk. While in Punjab, 34.5% farmers were able to sell milk without difficulty, this figure was only 7.3% in Sindh. In Sindh, the primary reason farmers gave for not being able to sell milk was their inability to visit markets and/or cities; in Punjab, the dominant reason was that traders were not available. Again, the reasons remain a by-product of the COVID-19 lockdown’s restriction on mobility, with 99.2% of farmers in Sindh and 98.9% in Punjab agreeing that the difficulty of selling milk was because of COVID-19.

The Impact of COVID-19 and Locust Invasion on Farm Households in Punjab and Sindh 15
Figure 6: Reasons for Not Selling or Being Unable to Sell Milk (% of respondents who did not sell or had difficulty selling)
72.6
33.1
20
62.2
7.4 4.7
0
10
20
30
40
50
60
70
80
Punjab Sindh
Traders not available Unable to visit markets and/or ci�es Other reason
Source: Authors’ calculations based on data gathered under Asian Development Bank phone surveys with farmers in Punjab (May 2020) and Sindh (June 2020).
53. COVID-19 impact on farm inputs. The respondents to the phone surveys were asked a series of questions about the impact of the COVID-19 pandemic on their farm inputs and the availability of labor and machines for the next sowing. They were also asked to assess their personal financial capacity after the onset of the pandemic and its subsequent economic impact.
54. In Punjab, more than 27% of respondents reported facing disruptions related to the COVID-19 pandemic when purchasing or receiving farm inputs for the next cycle of sowing; 45% said they faced no disruption; and the rest (28%) were unsure. Farmers indicated that seed purchases were most affected by the COVID-19 pandemic, followed by fertilizers, pesticides, and diesel fuel. Respondents in the mixed cropping zone faced considerably more disruptions to the input of pesticides and diesel fuel, whereas rice–wheat zone farmers had difficulty securing seed. This raises concern for future crop production.
55. In Sindh, 78.9% of respondents reported facing COVID-19-related disruptions when purchasing or receiving farm inputs for the next cycle of sowing; only 19.9% said they encountered no disruption. Farmers indicated that seed purchases were most affected by the COVID-19 pandemic, followed by fertilizers, pesticides, diesel fuel, and machinery. Respondents in lower Sindh faced considerably more disruptions to the inputs of fertilizer, pesticides, diesel fuel, and machinery than those in upper Sindh. Figure 7 shows the inputs for which farmers in the two provinces noted price increases.
56. Overall, more than half of respondents from Punjab reported an increase in the cost of their farm inputs because of COVID-19, nearly 30% reported no increase, and about 15% were unsure. Among those who observed input price increases, most said that the cost of seed had increased, and roughly one-third noted increases in the costs of pesticides and fertilizer (Figure 7). A few respondents reported an increase in the cost of diesel fuel, machinery, and miscellaneous inputs. More than three-quarters of the respondents reported not having difficulty finding machines for land preparation or sowing of their crop. Similarly, almost three-quarters of respondents stated they did not have problems finding workers for the next crop cycle.

16 ADB Central and West Asia Working Paper Series No. 10
57. In Sindh, 87.5% of respondents reported an increase in the cost of their farm inputs because of COVID-19. Among them, 99% said that the cost of seed had increased, 43% noted an increase in fertilizer cost, and 41% noted a rise in the cost of pesticides (Figure 7). Some respondents also reported an increase in the cost of diesel fuel and machinery. Regarding the availability of machines and their parts, 20.1% stated that they had trouble finding them.20 About half of respondents (49.6%) also stated they faced problems finding workers for the next crop cycle.
Figure 7: Farm Input Price Increases Attributed to COVID-19
90.798.6
31.2
42.735.9
41.3
3.8
18.0
2.19.8
0102030405060708090
100
Punjab(55.2% reported increase)
Sindh(87.5% reported increase)
Seed Fer�lizer Pes�cides Diesel fuel Machinery
COVID-19 = coronavirus disease.
Source: Authors’ calculations based on data gathered under Asian Development Bank phone surveys with farmers in Punjab (May 2020) and Sindh (June 2020).
58. While the pattern is the same in Punjab and Sindh, Sindh was found to be worse off than Punjab in terms of reduced market linkages and a reduced transport network because of restricted mobility: 51.6 percentage points more respondents in Sindh reported they had faced COVID-19-related disruptions to the purchase or delivery of farm inputs for the next planting. The main input disruptions were, in order of most to least, seed, fertilizers, pesticides, diesel fuel, and machinery. These results are consistent with the predictions of FAO (FAO 2020a), which determined that lack of community mobility would hinder farmers from accessing farm inputs, supplies, and equipment. The disruption was more evident in Sindh, which experienced more mobility restrictions than was the case in Punjab.
59. In addition, more respondents in Sindh than in Punjab stated that the cost of their farm inputs increased because of the COVID-19 pandemic. The main inputs with increased price were, in order of most to least, seed, fertilizers, pesticides, diesel fuel, and machinery.
60. In Punjab, 12.1% of the respondents experienced problems finding machines or spare parts for land preparation or sowing as a result of the COVID-19 pandemic, while in Sindh, 20.1% of respondents reported experiencing these same problems. Similarly, 49.6% of the farmers in Sindh experienced problems finding workers for the next crop, compared to only 8.6% in Punjab.
20 Field researchers conducting the survey commented that combine harvesters are not commonly available in Sindh. Some farmers normally rent them from the nearby districts of Punjab, but they were unable to obtain them in 2020 for the wheat harvest.

The Impact of COVID-19 and Locust Invasion on Farm Households in Punjab and Sindh 17
61. There is a chance that farmers who reported increased input prices and limited availability of machine services may have experienced a decline in their production during the 2020 kharif season, while the farmers who had applied the usual amount of inputs might have fallen into debt before the harvest, leaving them highly vulnerable and dependent on the weather and output prices. However, this needs to be investigated.
62. Farmers’ financial needs to maintain farm operations. All respondents to the phone survey were asked a series of questions pertaining to their personal financial capacity after the onset of the pandemic and its subsequent economic impact. Figure 8 compares the responses of farmers in the two provinces regarding their financial concerns.
63. About 62% of total respondents in Punjab reported financial difficulties in recent months. When asked whether this was because of the COVID-19 pandemic, more than half of those who reported financial difficulties agreed that it was. Furthermore, among respondents who faced financial difficulties, 88.7% pointed to the purchase of inputs as their primary concern, while 18.5% cited liabilities and loans from banks, and 11.3% cited liabilities and loans from nonbank lenders.
64. In Sindh, three-quarters of respondents reported having financial difficulties in recent months. When asked whether this was because of the COVID-19 pandemic, most of them said that it was. Furthermore, among respondents who faced financial difficulties, 97.3% pointed to the purchase of inputs as their primary concern, 12.3% cited liabilities and loans from nonbank lenders, and 25.0% cited liabilities and loans from banks.
Figure 8: Farmers’ Financial Concerns
88.797.3
18.512.311.3
25.0
5.30.0
0102030405060708090
100
Punjab(62.0% experienced immediate financial need;35.2% associated it with COVID-19 pandemic)
Sindh(74.7% experienced immediate financial need;66.0% associated it with COVID-19 pandemic)
For input purchase To pay agriculture loans from banks
To pay agriculture loans from others (nonbanks) Other
COVID-19 = coronavirus disease.
Source: Authors’ calculations based on data gathered under Asian Development Bank phone surveys with farmers in Punjab (May 2020) and Sindh (June 2020).
65. Many respondents in both provinces experienced immediate financial needs to maintain farm operations, but this figure was 13 percentage points higher in Sindh (74.7%) than in Punjab (62.0%). Of those who experienced financial need, 28.7 percentage points more respondents in Sindh attributed it to the COVID-19 pandemic (85.5%) than in Punjab (56.8%). In both provinces, the main financial need was to purchase inputs. However, 8.6 percentage points more respondents in Sindh needed the money

18 ADB Central and West Asia Working Paper Series No. 10
to purchase inputs than in Punjab. The second source of financial need was to repay agricultural loans. In Punjab, more respondents needed to repay loans to an agricultural bank than in Sindh, while more farmers needed to return the loan to a nonbank source in Sindh than in Punjab.
C. Impacts of Locust Swarms
66. Knowledge of locust swarms. According to the Punjab Agriculture Extension Services, about 300,000 km2 of farmland was vulnerable to the locust outbreak in 2020; 25% of that area was in Sindh and only 15% was in Punjab (FAO 2020c). Limited locust swarm cases were reported in Punjab, while locust attacks were reported in upper, central, and lower Sindh in 2019 and early 2020 (FAO 2020f). The ADB surveys showed that 73.7% of the respondents in Sindh reported locust swarms, while only 10.7% reported them in Punjab. Thus, Sindh remains the focal point of investigation regarding locust swarms.
67. With regard to early warning and other sources of information about the locust swarms, a minority of respondents in Punjab (34.3%) received an early warning from the government or alternative sources. Among respondents who were aware of the locust swarms in Punjab, the main sources of information include the provincial agriculture department (45.1%), media (33.3%), and local community sources (29.3%). Only a few respondents cited local government and the district administration as sources.
68. In Sindh, a minority of respondents (42.9%) received early warning about the locusts from the government or another source. Among respondents who were aware of the locust swarms, their main sources of information included media (88.1%), local community sources (55.7%), and the provincial agriculture department (3.4%), with a few respondents citing local government and the district administration as well.
69. A majority of the respondents in both provinces did not receive early warning about the desert locusts, but 8.6 percentage points more farmers in Sindh received early warning than in Punjab. The provincial agriculture department was the main source of information in Punjab but not in Sindh. Local people and media were a vital source of early warning for both provinces. More respondents in Sindh reported local people to be their source of information about the locusts than in Punjab, and about 55 percentage points more respondents in Sindh reported media to be a source of information on the desert locust than in Punjab.
70. Impacts of locust swarms on crops and precautions taken. In Sindh, where a higher rate of locust invasion was reported than in Punjab, respondents were asked an additional set of questions regarding the locusts’ impact on crops and what measures were taken to prevent crop damage because of locusts. More than 70% of the people who had observed locusts had experienced partial or complete damage in their fields.
71. Almost all respondents stated that their area had not been surveyed to assess the locust presence (Table 3). Similarly, 91% stated that their area had not been sprayed. Across both upper and lower Sindh, 21 respondents (7%) stated they had sprayed their area themselves, and 5 respondents stated that their area had been sprayed by government teams. Handheld sprayers were the most commonly used equipment (71%), followed by vehicle-mounted sprayers (21%).21 More than 91% of respondents stated that their area had been attacked by locusts at least once before spraying. Three-quarters of respondents reported that locusts still attacked their area at least once even after spraying, although the frequency of the attacks had been significantly reduced (with 73.8% reporting at least two or more attacks before spraying, compared with 35.7% after spraying). Nearly half of the respondents stated that their fields had been partly damaged by locusts, and an additional 23% reported that their fields had been largely or completely destroyed.
21 More than 90% of farmers who sprayed their areas themselves used handheld sprayers; where the government did the spraying, 80% of farmers reported that vehicle-mounted sprayers were used.
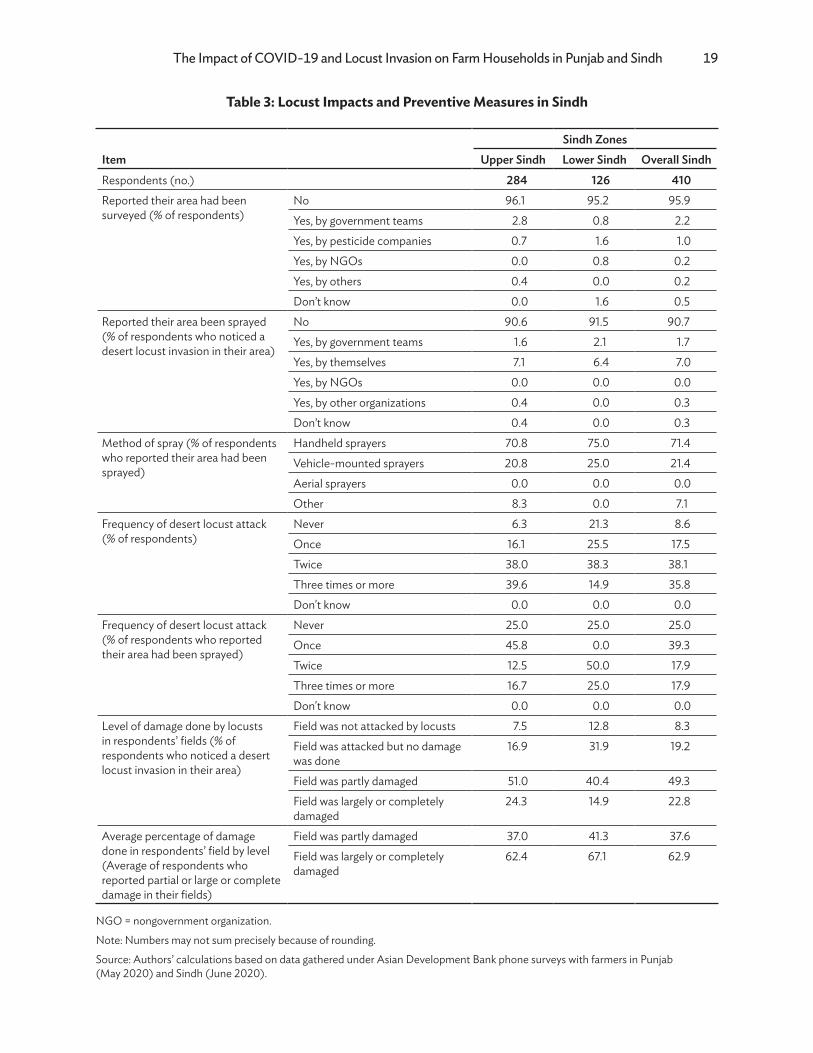
The Impact of COVID-19 and Locust Invasion on Farm Households in Punjab and Sindh 19
Table 3: Locust Impacts and Preventive Measures in Sindh
ItemSindh Zones
Upper Sindh Lower Sindh Overall SindhRespondents (no.) 284 126 410Reported their area had been surveyed (% of respondents)
No 96.1 95.2 95.9Yes, by government teams 2.8 0.8 2.2Yes, by pesticide companies 0.7 1.6 1.0Yes, by NGOs 0.0 0.8 0.2Yes, by others 0.4 0.0 0.2Don’t know 0.0 1.6 0.5
Reported their area been sprayed (% of respondents who noticed a desert locust invasion in their area)
No 90.6 91.5 90.7Yes, by government teams 1.6 2.1 1.7Yes, by themselves 7.1 6.4 7.0Yes, by NGOs 0.0 0.0 0.0Yes, by other organizations 0.4 0.0 0.3Don’t know 0.4 0.0 0.3
Method of spray (% of respondents who reported their area had been sprayed)
Handheld sprayers 70.8 75.0 71.4Vehicle-mounted sprayers 20.8 25.0 21.4Aerial sprayers 0.0 0.0 0.0Other 8.3 0.0 7.1
Frequency of desert locust attack (% of respondents)
Never 6.3 21.3 8.6Once 16.1 25.5 17.5Twice 38.0 38.3 38.1Three times or more 39.6 14.9 35.8Don't know 0.0 0.0 0.0
Frequency of desert locust attack (% of respondents who reported their area had been sprayed)
Never 25.0 25.0 25.0Once 45.8 0.0 39.3Twice 12.5 50.0 17.9Three times or more 16.7 25.0 17.9Don't know 0.0 0.0 0.0
Level of damage done by locusts in respondents’ fields (% of respondents who noticed a desert locust invasion in their area)
Field was not attacked by locusts 7.5 12.8 8.3Field was attacked but no damage was done
16.9 31.9 19.2
Field was partly damaged 51.0 40.4 49.3Field was largely or completely damaged
24.3 14.9 22.8
Average percentage of damage done in respondents’ field by level (Average of respondents who reported partial or large or complete damage in their fields)
Field was partly damaged 37.0 41.3 37.6Field was largely or completely damaged
62.4 67.1 62.9
NGO = nongovernment organization.
Note: Numbers may not sum precisely because of rounding.
Source: Authors’ calculations based on data gathered under Asian Development Bank phone surveys with farmers in Punjab (May 2020) and Sindh (June 2020).

20 ADB Central and West Asia Working Paper Series No. 10
D. Farmers’ Preferred Policy Measures
72. Respondents were asked to suggest and rank in order of preference a series of policy measures that the government should take (Figure 9). A priority index was developed to identify the policy measures that farmers preferred the government to take (Appendix 3). The index is based on the proportion of total respondents who identified a policy measure for government action and the priority rank respondents assigned to the suggested policy measure.
Figure 9: Farmers’ Preferred Policy Measures
0.01.02.03.04.0
Ensure �mely supply ofagricultural inputs
Ensure price stability foragriculture produce
Ease loan repaymentcondi�ons or waive
loans
Remove restric�ons onmarke�ng produce
outside home district
Other
Punjab Sindh
Source: Authors’ calculations based on data gathered under Asian Development Bank phone surveys with farmers in Punjab (May 2020) and Sindh (June 2020).
73. Respondents from Punjab selected the following policy measures, in order of preference, that the government should take:
(i) ensure price stability for agricultural produce,(ii) ease loan repayment conditions or waive loans,(iii) remove restrictions on marketing in districts beyond where the produce was raised,22 (iv) ensure timely supply of agricultural inputs, and(v) other policy measures.
74. The largest number of respondents (75.3%) selected ensuring price stability for agriculture produce, followed by 66.9% who selected easing of loan repayment conditions or waiving loans.
22 Every year during wheat harvesting season, the government imposes a ban on the sale of wheat in districts other than where it is grown. The purpose of the ban is for the government to procure wheat and control the price and smuggling of wheat. In 2020, the ban was imposed on 19 March (Government of Pakistan, Press Information Department 2020b; and Dawn 2020a) and lifted on 10 June (Government of Pakistan, Finance Division 2020; Government of Pakistan, Press Information Department 2020a; and The Nation 2020). The government does not restrict the mobility of other agriculture produce. The suggested policy measure to remove restrictions on marketing in districts beyond where the produce is raised should be interpreted in the context of wheat, as more than 90% of survey respondents had grown wheat during the previous rabi season.

The Impact of COVID-19 and Locust Invasion on Farm Households in Punjab and Sindh 21
The needs to remove restrictions on the supply of agricultural inputs and the marketing of agricultural produce in districts other than the farmers’ home district were each identified by 54.3% of respondents.
75. Respondents from Sindh selected the following policy measures, in order of preference, that the government should take:
(i) ensure timely supply of agricultural inputs,(ii) ensure price stability for agricultural produce,(iii) ease loan repayment conditions or waive loans,(iv) remove restrictions on marketing in districts beyond where the produce was raised, and(v) other policy measures.
76. Among respondents in Sindh, the largest number (97.1%) selected the need to ensure timely supply of agricultural inputs, followed by the need to ensure price stability for agricultural produce (96.8%), and the need to either ease loan repayment conditions or waive loans (80.7%). Among respondents, 68.8% identified the need to remove restrictions on the supply of agricultural inputs and allow the marketing of agricultural produce in districts other than the farmers’ home district. About half of the respondents (50.7%) suggested other policy measures.
VII. GOVERNMENT ACTION
77. The Government of Pakistan has introduced several policies to assist farm households since the onset of the COVID-19 pandemic in the country. The Economic Coordination Committee approved a PRs100 billion ($600 million as of 20 September 2020) coronavirus relief package for small and medium-sized enterprises and the agriculture sector. PRs17.1 billion ($10.3 million as of 20 September 2020) has been allocated to provide some benefits to farmers. This includes a subsidy on fertilizers, reduced bank markups on agriculture loans, a subsidy on cottonseed and whitefly pesticides, and a sales tax subsidy on locally manufactured tractors. On a similar note, the Government of Pakistan has provided employment opportunities to daily wage workers for planting trees as part of the government initiative to plant billions of trees to combat climate change (World Economic Forum 2020). All restrictions on the interprovincial movement of wheat and wheat flour were removed with effect from 8 June 2020 (The Nation 2020).
78. To tackle locust swarms, several measures were taken. As of 13 January 2021, the Government of Pakistan had surveyed about 61.4 million km2 and treated almost 1.1 million km2 across the country in an ongoing control operation using 5 aircraft, 156 vehicle-mounted sprayers, 1,697 power sprayers, and 2,484 manual sprayers (Government of Pakistan, National Locust Control Centre—accessed 3 January 2021). International aid has been readily available to tackle locust invasion in affected areas, the FAO has given the MNFSR 20 ultra-low volume pesticide micro sprayers for vehicles, 1,303 personal protective equipment kits, and 100 Global Positioning System satellite communicator devices (FAO 2020d). Similarly, the Department for International Development of the United Kingdom (UK) has offered £1.0 million ($1.29 million as of 29 April 2020) for control operations through the FAO. Pakistan has received 20 micro sprayers from the UK. The FAO will oversee and monitor the delivery of 50 sprayers and 1,300 personal protective equipment kits from UK funding to Pakistan for locust surveillance and control operations to assist 18,000 vulnerable farmers (Government of the UK, British High Commission Islamabad 2020). Additionally, the People’s Republic of China has provided 50 vehicle-mounted sprayers and 300,000 liters of pesticide to Pakistan (Government of Pakistan, National Disaster Management Authority 2020).
22 ADB Central and West Asia Working Paper Series No. 10
79. The FAO (FAO 2020d) indicated that the government’s measures are aligned to ensure enough domestic availability of needed supplies and to preempt disruptions because of COVID-19 and the locust attack. Similarly, the government’s measures and the policy measures suggested by the ADB survey respondents are in harmony. The government has acted on all fronts, but the policy measures will only be effective if they are not impeded by bureaucratic red tape and are adequately implemented.
VIII. CONCLUSION
80. Based on surveys conducted in Pakistan’s Punjab and Sindh provinces in May and June 2020, this working paper found that the COVID-19 pandemic and the economic and transport disruptions negatively affected the marketing of vegetables, fruits, and milk in both Punjab and Sindh, and tomatoes specifically in Sindh. The negative impact on the marketing of wheat was less than that on the marketing of other products. Unlike cereals, fresh produce is highly perishable. Supply chain disruptions directly resulted in economic losses for farmers and increased food prices for consumers. Despite the government’s efforts to minimize the disruptions in the food supply chain, the survey results indicate that farmers still suffered economic losses.
81. The rising input prices and limited availability of machine services gave rise to grave concerns over rice production in the 2020 kharif season. Rice production may decline because of the increased cost of rice production inputs, which has limited their use. Moreover, the ADB surveys indicate that farmers’ cash income has decreased and, in some cases, has been nonexistent during the COVID-19 pandemic. Coupled with higher input prices, some rice farmers may fall into deep debt before the harvest, leaving them highly vulnerable and dependent on the weather and output prices.
82. Almost all respondents from upper Sindh reported locust swarms, with more than one-third of lower Sindh respondents stating they had also been affected. In Punjab, locust swarms were reported in two southern districts in the surveyed areas, resulting in production losses for farmers who have been suffering from the COVID-19 pandemic. Farmers from both Punjab and Sindh reported almost complete government unresponsiveness in providing information about the swarms, information through surveys, or relief from spraying.
83. The market disruptions caused by the response to the COVID-19 pandemic in its early stages have stabilized. The locust swarms had subsided by the summer of 2020, although they may return to Pakistan in the future.23 As the COVID-19 pandemic continues, more farmers and low-income consumers become highly vulnerable because of agricultural income losses and declining cash income. The government needs to continue closely monitoring agricultural production, storage, and domestic and international market conditions, and to be prepared to assist farmers and protect food security in the country.
23 The National Disaster Management Authority noted that the locust swarms were no longer severe by June and July 2020, as expected (Dawn 2020d), and that they were gone by early October (Al Jazeera 2020).

APPENDIX 1: SURVEY RESULTS TABLES
Table A1.1: COVID-19 Impacts on Households in Punjab and Sindh
Item
Punjab Zones Sindh ZonesRice–
WheatMixed
CroppingOverall Punjab
Upper Sindh
Lower Sindh
Overall Sindh
Respondents (no.) 381 48 429 284 126 410No difficulty (%) 49.9 50.0 49.9 20.4 29.4 23.2Lost wage and nonfarm income (%) 33.6 31.3 33.3 38.0 35.7 37.3Family members returned from urban and other areas (%)
22.0 27.1 22.6 38.4 42.1 39.5
Reduced food consumption (%) 10.5 4.2 9.8 59.5 55.6 58.3Reduced nonfood expenditure (%) 11.5 8.3 11.2 49.3 36.5 45.4Other (%) 2.6 4.2 2.8 2.5 1.6 2.2
COVID-19 = coronavirus disease.
Source: Authors’ calculations based on data gathered under Asian Development Bank phone surveys with farmers in Punjab (May 2020) and Sindh (June 2020).
Table A1.2: Respondents’ Crops during the 2019 Rabi Season in Punjaba
ItemPunjab Zones
Rice–Wheat Mixed Cropping Overall Punjab Respondents (No.) 381 48 429Wheat (%) 96.9 95.8 96.7Maize (%) 7.3 56.3 12.8Berseem (%) 51.7 35.4 49.9Oil seed (%) 0.5 2.1 0.7Vegetables (%) 11.5 12.5 11.7Fruits (%) 5.5 2.1 5.1Other crops (%) 6.3 4.2 6.1
a The rabi season lasts from about November to April.
Source: Authors’ calculations based on data gathered under Asian Development Bank phone surveys with farmers in Punjab (May 2020).
Table A1.3: Respondents’ Crops during the 2019 Rabi Season in Sindha
ItemSindh Zones
Upper Sindh Lower Sindh Overall SindhRespondents (No.) 284 126 410Wheat (%) 98.2 83.3 93.7Berseem (%) 15.8 27.0 19.3Lucerne (%) 23.2 12.7 20.0Sugarcane (%) 0.7 11.1 3.9
continued on next page

24 Appendixes
ItemSindh Zones
Upper Sindh Lower Sindh Overall SindhOilseed (%) 23.9 34.9 27.3Tomato (%) 14.8 50.0 25.6Onion (%) 10.9 5.6 9.3Other vegetables (%) 19.7 21.4 20.2Mango (%) 0.4 0.0 0.2Banana (%) 0.0 4.0 1.2Melon (%) 6.7 1.6 5.1Other fruits (%) 3.2 0.0 2.2Any other crop (%) 6.3 11.1 7.8
a The rabi season lasts from about November to April.
Source: Authors’ calculations based on data gathered under Asian Development Bank phone surveys with farmers in Sindh (June 2020).
Table A1.4: Impacts of COVID-19 on the 2020 Wheat Harvest in Punjab
Item
Punjab ZonesRice–
WheatMixed
CroppingOverall Punjab
Respondents who grew wheat in the 2019 rabi seasona (No.)b 369 46 415Status of harvest at survey time (% of respondents)
Completed 97.3 97.8 97.3In progress 1.1 2.2 1.2Will harvest in near future 0.0 0.0 0.0No harvest because of crop damage
1.6 0.0 1.4
Week harvest was completed (% of respondents who had completed their harvest)
By the second week of April 1.1 11.1 2.2By the third week of April 3.9 8.9 4.5By the last week of April 27.0 37.8 28.2By the first week of May 42.9 31.1 41.6By the second week of May 25.1 11.1 23.5
When the farmer anticipated completing the harvest (% of respondents who were in the process of harvesting)
By the third week of May 25.0 0.0 20.0
By the fourth week of May 75.0 100.0 80.0After the fourth week of May 0.0 0.0 0.0
Is your harvest delayed compared with previous years? (% of respondents who had completed or were in the process of harvesting)
Yes 82.4 95.7 83.9No 17.6 4.3 16.1
Reasons for the delayed harvest (% of respondents noting the 2020 harvest was delayed compared with previous years)a
Crop not ready for harvest 1.7 2.3 1.7Labor not available on time 0.3 0.0 0.3Machines not available on time 4.7 0.0 4.1Because of rain 96.7 97.7 96.8Other 2.3 0.0 2.0
continued on next page
Table A1.3 continued

Appendixes 25
Item
Punjab ZonesRice–
WheatMixed
CroppingOverall Punjab
Was the delay related to COVID-19? (% of respondents reporting delayed harvest other than "crop not ready for harvest” or “because of rain")
Yes 59.1 0.0 59.1
No 40.9 0.0 40.9Don't know 0.0 0.0 0.0
Reasons for crop damage (% of respondents who did not harvest because of crop damage)
Lodging because of excessive rain 83.3 0.0 83.3Locust invasion 0.0 0.0 0.0Other insect and/or disease infestation
0.0 0.0 0.0
Other 16.7 0.0 16.7
COVID-19 = coronavirus disease.a The rabi season lasts from about November to April.b Multiple response question; numbers may not sum precisely because of rounding.
Source: Authors’ calculations based on data gathered under Asian Development Bank phone surveys with farmers in Punjab (May 2020).
Table A1.5: Impacts of COVID-19 on the 2020 Wheat Harvest in Sindh
Item
Sindh ZonesUpper Sindh
Lower Sindh
Overall Sindh
Respondents who grew wheat in the 2019 rabi seasona (No.)b 279 105 384Status of harvest at survey time (% of respondents)
Completed 99.6 100.0 99.7In progress 0.0 0.0 0.0Will harvest in near future 0.0 0.0 0.0No harvest because of crop damage
0.4 0.0 0.3
Week harvest was completed (% of respondents who had completed their harvest)
By the last week of February 0.7 1.9 1.0By the first week of March 1.1 1.9 1.3By the second week of March 1.8 19.0 6.5By the third week of March 3.6 5.7 4.2By the fourth week of March 11.2 14.3 12.0
Is your harvest delayed compared with previous years? (% of respondents who had completed or were in the process of harvesting)
Yes 35.3 27.6 33.2No 64.7 72.4 66.8
Reasons for the delayed harvest (% of respondents noting the 2020 harvest was delayed compared with previous years)a
Crop not ready for harvest 34.7 34.5 34.6Labor not available on time 14.3 34.5 18.9Machines not available on time 26.5 27.6 26.8Because of rain 40.8 31.0 38.6Other 8.2 6.9 7.9
Was the delay related to COVID-19? (% of respondents reporting delayed harvest other than "crop not ready for harvest” or “because of rain")
Yes 83.3 86.7 84.3No 11.1 6.7 9.8Don't know 5.6 6.7 5.9
continued on next page
Table A1.4 continued

26 Appendixes
Item
Sindh ZonesUpper Sindh
Lower Sindh
Overall Sindh
Reasons for crop damage (% of respondents who did not harvest because of crop damage)
Lodging because of excessive rain 0.0 0.0 0.0Locust invasion 0.0 0.0 0.0Other insect and/or disease infestation
100.0 0.0 100.0
Other 0.0 0.0 0.0
COVID-19 = coronavirus disease.a The rabi season lasts from about November to April.b Multiple response question; numbers may not sum precisely because of rounding.
Source: Authors’ calculations based on data gathered under Asian Development Bank phone surveys with farmers in Sindh (June 2020).
Table A1.6: Impacts of COVID-19 on Marketing of Wheat Crop in Punjab and Sindh
Item
Punjab Zones Sindh ZonesRice–
WheatMixed
CroppingOverall Punjab
Upper Sindh
Lower Sindh
Overall Sindh
Respondents who had completed harvesting (No.)
359 45 404 280 103 383
Were you able to market the wheat? (% of respondents)
Yes, without difficulty
77.1 54.3 74.6 18.2 25.2 20.1
Yes, with difficulty 2.5 0.0 2.2 67.5 59.2 65.3No 20.4 45.7 23.2 14.3 15.5 14.6
Reasons for not selling or difficulty selling (% of respondents who did not sell or had difficulty selling)
Kept for self-consumption
81.9 95.2 84.6 13.6 20.5 15.4
Traders not available
3.6 0.0 2.9 24.6 29.5 25.8
Unable to visit markets and/or cities
3.6 4.8 3.8 33.8 33.3 33.7
Other 10.8 0.0 8.7 28.1 16.7 25.2Were the difficulties related to COVID-19? (% of respondents who reported a reason other than "kept for self-consumption")
Yes 40.0 100.0 43.8 80.2 87.1 81.9No 60.0 0.0 56.3 15.2 12.9 14.7
Don't know 0.0 0.0 0.0 4.6 0.0 3.5
Farmers’ crop buyers (% of those who sold produce with or without difficulty)
Government 38.8 56.0 40.1 4.2 5.6 4.6
Open market 61.2 44.0 59.9 95.8 94.4 95.4
Average price respondents received on the open market (PRs)
Price per 40 kilograms
1,366 1,381 1,367 1,278 1,278 1,278
COVID-19 = coronavirus disease.
Source: Authors’ calculation based on data gathered under Asian Development Bank phone surveys with farmers in Punjab (May 2020) and Sindh (June 2020).
Table A1.5 continued
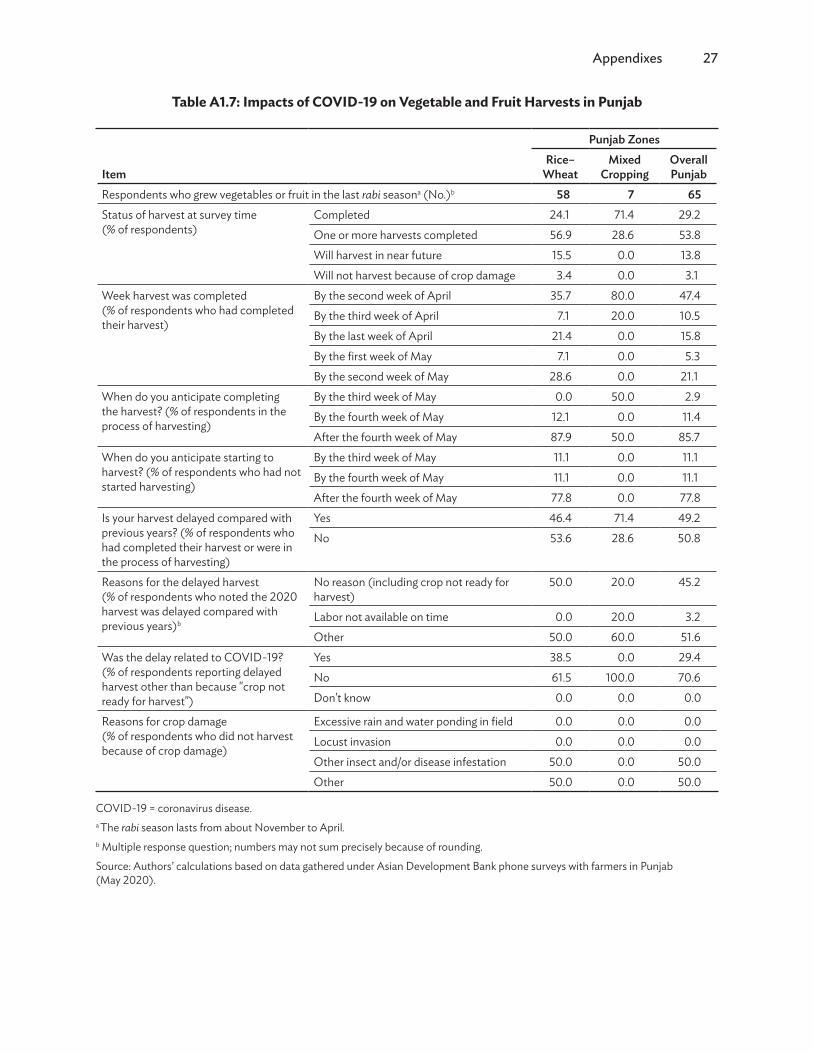
Appendixes 27
Table A1.7: Impacts of COVID-19 on Vegetable and Fruit Harvests in Punjab
Item
Punjab ZonesRice–
WheatMixed
CroppingOverall Punjab
Respondents who grew vegetables or fruit in the last rabi seasona (No.)b 58 7 65Status of harvest at survey time (% of respondents)
Completed 24.1 71.4 29.2One or more harvests completed 56.9 28.6 53.8Will harvest in near future 15.5 0.0 13.8Will not harvest because of crop damage 3.4 0.0 3.1
Week harvest was completed (% of respondents who had completed their harvest)
By the second week of April 35.7 80.0 47.4By the third week of April 7.1 20.0 10.5By the last week of April 21.4 0.0 15.8By the first week of May 7.1 0.0 5.3By the second week of May 28.6 0.0 21.1
When do you anticipate completing the harvest? (% of respondents in the process of harvesting)
By the third week of May 0.0 50.0 2.9By the fourth week of May 12.1 0.0 11.4After the fourth week of May 87.9 50.0 85.7
When do you anticipate starting to harvest? (% of respondents who had not started harvesting)
By the third week of May 11.1 0.0 11.1By the fourth week of May 11.1 0.0 11.1After the fourth week of May 77.8 0.0 77.8
Is your harvest delayed compared with previous years? (% of respondents who had completed their harvest or were in the process of harvesting)
Yes 46.4 71.4 49.2No 53.6 28.6 50.8
Reasons for the delayed harvest (% of respondents who noted the 2020 harvest was delayed compared with previous years)b
No reason (including crop not ready for harvest)
50.0 20.0 45.2
Labor not available on time 0.0 20.0 3.2Other 50.0 60.0 51.6
Was the delay related to COVID-19? (% of respondents reporting delayed harvest other than because "crop not ready for harvest")
Yes 38.5 0.0 29.4No 61.5 100.0 70.6Don't know 0.0 0.0 0.0
Reasons for crop damage (% of respondents who did not harvest because of crop damage)
Excessive rain and water ponding in field 0.0 0.0 0.0Locust invasion 0.0 0.0 0.0Other insect and/or disease infestation 50.0 0.0 50.0Other 50.0 0.0 50.0
COVID-19 = coronavirus disease.a The rabi season lasts from about November to April.b Multiple response question; numbers may not sum precisely because of rounding.
Source: Authors’ calculations based on data gathered under Asian Development Bank phone surveys with farmers in Punjab (May 2020).
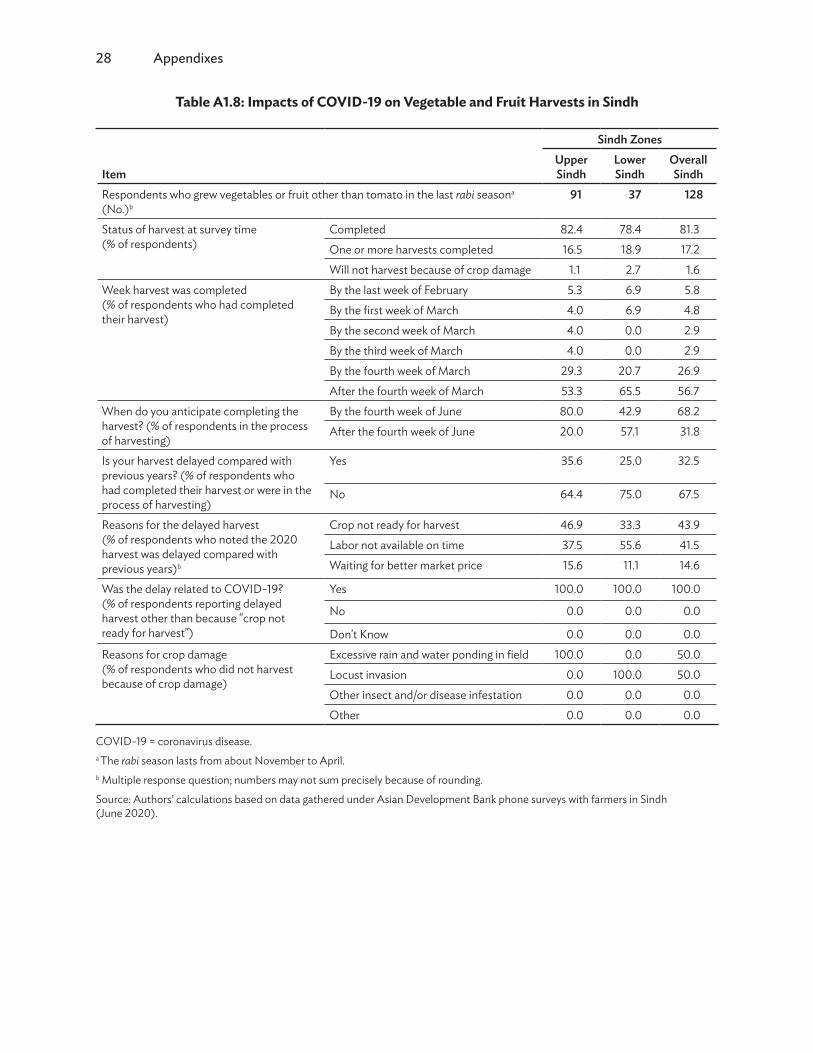
28 Appendixes
Table A1.8: Impacts of COVID-19 on Vegetable and Fruit Harvests in Sindh
Item
Sindh ZonesUpper Sindh
Lower Sindh
Overall Sindh
Respondents who grew vegetables or fruit other than tomato in the last rabi seasona (No.)b
91 37 128
Status of harvest at survey time (% of respondents)
Completed 82.4 78.4 81.3One or more harvests completed 16.5 18.9 17.2Will not harvest because of crop damage 1.1 2.7 1.6
Week harvest was completed (% of respondents who had completed their harvest)
By the last week of February 5.3 6.9 5.8By the first week of March 4.0 6.9 4.8By the second week of March 4.0 0.0 2.9By the third week of March 4.0 0.0 2.9By the fourth week of March 29.3 20.7 26.9After the fourth week of March 53.3 65.5 56.7
When do you anticipate completing the harvest? (% of respondents in the process of harvesting)
By the fourth week of June 80.0 42.9 68.2After the fourth week of June 20.0 57.1 31.8
Is your harvest delayed compared with previous years? (% of respondents who had completed their harvest or were in the process of harvesting)
Yes 35.6 25.0 32.5
No 64.4 75.0 67.5
Reasons for the delayed harvest (% of respondents who noted the 2020 harvest was delayed compared with previous years)b
Crop not ready for harvest 46.9 33.3 43.9Labor not available on time 37.5 55.6 41.5Waiting for better market price 15.6 11.1 14.6
Was the delay related to COVID-19? (% of respondents reporting delayed harvest other than because "crop not ready for harvest")
Yes 100.0 100.0 100.0
No 0.0 0.0 0.0
Don't Know 0.0 0.0 0.0Reasons for crop damage (% of respondents who did not harvest because of crop damage)
Excessive rain and water ponding in field 100.0 0.0 50.0Locust invasion 0.0 100.0 50.0Other insect and/or disease infestation 0.0 0.0 0.0Other 0.0 0.0 0.0
COVID-19 = coronavirus disease.a The rabi season lasts from about November to April.b Multiple response question; numbers may not sum precisely because of rounding.
Source: Authors’ calculations based on data gathered under Asian Development Bank phone surveys with farmers in Sindh (June 2020).
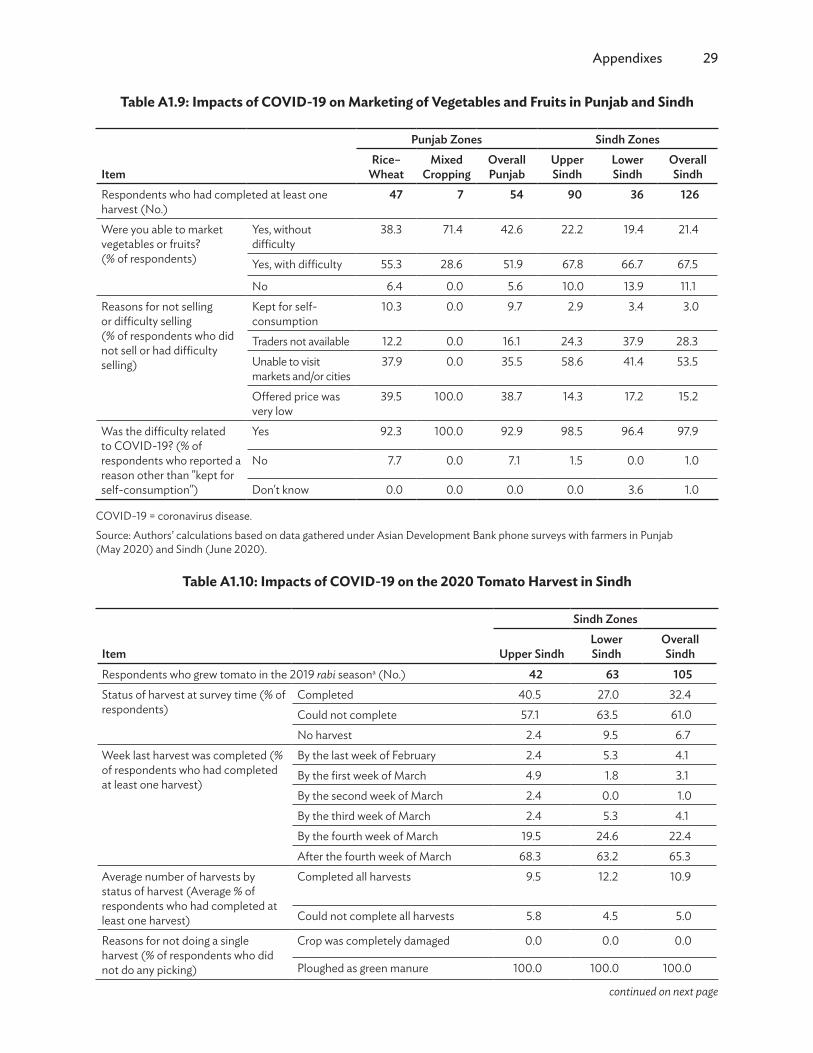
Appendixes 29
Table A1.9: Impacts of COVID-19 on Marketing of Vegetables and Fruits in Punjab and Sindh
Item
Punjab Zones Sindh ZonesRice–
WheatMixed
Cropping Overall Punjab
Upper Sindh
Lower Sindh
Overall Sindh
Respondents who had completed at least one harvest (No.)
47 7 54 90 36 126
Were you able to market vegetables or fruits? (% of respondents)
Yes, without difficulty
38.3 71.4 42.6 22.2 19.4 21.4
Yes, with difficulty 55.3 28.6 51.9 67.8 66.7 67.5
No 6.4 0.0 5.6 10.0 13.9 11.1Reasons for not selling or difficulty selling (% of respondents who did not sell or had difficulty selling)
Kept for self- consumption
10.3 0.0 9.7 2.9 3.4 3.0
Traders not available 12.2 0.0 16.1 24.3 37.9 28.3Unable to visit markets and/or cities
37.9 0.0 35.5 58.6 41.4 53.5
Offered price was very low
39.5 100.0 38.7 14.3 17.2 15.2
Was the difficulty related to COVID-19? (% of respondents who reported a reason other than "kept for self-consumption")
Yes 92.3 100.0 92.9 98.5 96.4 97.9
No 7.7 0.0 7.1 1.5 0.0 1.0
Don't know 0.0 0.0 0.0 0.0 3.6 1.0
COVID-19 = coronavirus disease.
Source: Authors’ calculations based on data gathered under Asian Development Bank phone surveys with farmers in Punjab (May 2020) and Sindh (June 2020).
Table A1.10: Impacts of COVID-19 on the 2020 Tomato Harvest in Sindh
Item
Sindh Zones
Upper SindhLower Sindh
Overall Sindh
Respondents who grew tomato in the 2019 rabi seasona (No.) 42 63 105Status of harvest at survey time (% of respondents)
Completed 40.5 27.0 32.4Could not complete 57.1 63.5 61.0No harvest 2.4 9.5 6.7
Week last harvest was completed (% of respondents who had completed at least one harvest)
By the last week of February 2.4 5.3 4.1By the first week of March 4.9 1.8 3.1By the second week of March 2.4 0.0 1.0By the third week of March 2.4 5.3 4.1By the fourth week of March 19.5 24.6 22.4After the fourth week of March 68.3 63.2 65.3
Average number of harvests by status of harvest (Average % of respondents who had completed at least one harvest)
Completed all harvests 9.5 12.2 10.9
Could not complete all harvests 5.8 4.5 5.0
Reasons for not doing a single harvest (% of respondents who did not do any picking)
Crop was completely damaged 0.0 0.0 0.0
Ploughed as green manure 100.0 100.0 100.0
continued on next page

30 Appendixes
Item
Sindh Zones
Upper SindhLower Sindh
Overall Sindh
Reasons for not completing all pickings (% of respondents who could not complete all harvests)
Crop was partly damaged after few harvests
4.2 5.0 4.7
Ploughed as green manure 95.8 95.0 95.3Reasons for damage of tomato crop (% of respondents whose crop is completely or partially damaged)
Excessive rain and water ponding in field
0.0 100.0 66.7
Locust invasion 0.0 0.0 0.0Insect and/or disease infestation (other than locust)
100.0 0.0 33.3
Other 0.0 0.0 0.0Reasons for ploughing tomato crop as green manure (% of respondents who ploughed the crop as green manure)
Difficulty accessing market 33.3 18.2 23.5
Low price because of decreased demand
66.7 81.8 76.5
Were the reasons for ploughing tomato crop as green manure related to COVID-19 (% of respondents who ploughed the crop as green manure)
Yes 100.0 97.7 98.5
No 0.0 2.3 1.5Don't know 0.0 0.0 0.0
COVID-19 = coronavirus disease.a The rabi season lasts from about November to April.
Source: Authors’ calculations based on data gathered under Asian Development Bank phone surveys with farmers in Sindh (June 2020).
Table A1.11: Impacts of COVID-19 on Marketing of Tomato Crop in Sindh
Item
Sindh ZonesUpper Sindh
Lower Sindh
Overall Sindh
Respondents who had completed at least one harvest (No.) 41 57 98Were you able to market the tomato? (% of respondents)
Yes, without difficulty 2.4 8.8 6.1Yes, with difficulty 63.4 59.6 61.2No 34.1 31.6 32.7
Reasons for not selling or difficulty in selling (% of respondents who did not sell or had difficulty selling)
Kept for self-consumption 2.5 0.0 1.1Stored as seed 0.0 1.9 1.1Traders not available 27.5 34.6 31.5Unable to visit markets and/or cities 55.0 44.2 48.9Other 15.0 19.2 17.4
Were the difficulties related to COVID-19? (% of respondents who reported a reason other than "kept for self-consumption")
Yes 100.0 96.2 97.8No 0.0 3.8 2.2Don't know 0.0 0.0 0.0
COVID-19 = coronavirus disease.
Source: Authors’ calculations based on data gathered under Asian Development Bank phone surveys with farmers in Sindh (June 2020).
Table A1.10 continued

Appendixes 31
Table A1.12: Impacts of COVID-19 on Sale of Milk in Punjab and Sindh
Item
Punjab Zones Sindh ZonesRice–
WheatMixed
CroppingOverall Punjab
Upper Sindh
Lower Sindh
Overall Sindh
Respondents (No.) 381 48 429 284 126 410Do you have livestock, do you sell milk? (% of respondents)
No 16.5 10.4 15.9 32.7 34.9 33.4I have livestock but do not sell milk
49.6 56.3 50.3 47.5 46.0 47.1
Yes 33.9 33.3 33.8 19.7 19.0 19.5Has the price of milk changed because of COVID-19? (% of respondents who sell milk)
Yes, the price decreased
72.9 93.8 75.2 86.0 95.5 89.1
Yes, the price increased
2.3 0.0 2.1 3.2 0.0 2.2
No 24.8 6.3 22.8 10.8 4.5 8.8Have you been able to market milk every day in the last few months? (% of respondents who sell milk)
Yes, without difficulty 36.4 18.8 34.5 7.5 6.8 7.3
Yes, with difficulty 62.0 81.3 64.1 83.9 75.0 81.0
No 1.6 0.0 1.4 8.6 18.2 11.7Reasons for not being able to sell or difficulty selling (% of respondents with difficulty selling milk)
Traders not available 73.2 69.2 72.6 27.9 43.9 33.1Unable to visit markets and/or cities
19.5 23.1 20 66.3 53.7 62.2
Other 7.3 7.7 7.4 5.8 2.4 4.7Was the difficulty related to COVID-19? (% of respondents who could not sell milk or had difficulty selling milk)
Yes 98.8 100.0 98.9 98.8 100.0 99.2
No 1.2 0.0 1.1 1.2 0.0 0.8
Don't know 0.0 0.0 0.0 0.0 0.0 0.0
COVID-19 = coronavirus disease.
Source: Authors’ calculations based on data gathered under Asian Development Bank phone surveys with farmers in Punjab (May 2020) and Sindh (June 2020).
Table A1.13: COVID-19-Related Disruptions to the Purchase or Delivery of Farm Inputs in Punjab and Sindh
Item
Punjab Zones Sindh ZonesRice–
WheatMixed
CroppingOverall Punjab
Upper Sindh
Lower Sindh
Overall Sindh
Respondents (No.) 381 48 429 282 125 407Have you experienced COVID-19-related disruptions to the purchase or delivery of farm inputs for the next planting? (% of respondents)
Yes 28.1 20.8 27.3 77.3 82.4 78.9
No 46.7 35.4 45.5 21.6 16.0 19.9
Don't know 25.2 43.8 27.3 1.1 1.6 1.2Inputs disrupted (% of respondents who experienced disruption)a
Seed 83.2 60.0 81.2 97.2 97.1 97.2Fertilizer 23.4 30.0 23.9 38.5 54.4 43.6Pesticides 16.8 50.0 19.7 27.5 54.4 36.1Diesel fuel 15.9 30.0 17.1 17.0 33.0 22.1Machinery 3.7 0.0 3.4 11.0 21.4 14.3Other 0.9 0.0 0.9 0.0 2.9 0.9
continued on next page

32 Appendixes
Item
Punjab Zones Sindh ZonesRice–
WheatMixed
CroppingOverall Punjab
Upper Sindh
Lower Sindh
Overall Sindh
Did the cost of your farm inputs increase as a result of COVID-19? (% of respondents)
Yes 56.4 45.8 55.2 84.4 94.4 87.5No 29.1 31.3 29.4 11.3 5.6 9.6Don't know 14.4 22.9 15.4 4.3 0.0 2.9
Inputs with increased cost (% of respondents who experienced a cost increase for farm inputs)a
Seed 92.1 77.3 90.7 98.3 99.2 98.6Fertilizer 32.6 18.2 31.2 41.6 44.9 42.7Pesticides 35.8 36.4 35.9 36.6 50.8 41.3Diesel fuel 4.2 0.0 3.8 13.4 27.1 18.0Machinery 2.3 0.0 2.1 7.1 15.3 9.8Other 5.1 9.1 5.5 0.0 0.0 0.0
Did you experience problems finding workers for the next crop because of COVID-19? (% of respondents)
Yes 9.4 2.1 8.6 45.0 60.0 49.6No 74.0 77.1 74.4 41.8 24.0 36.4Don't know 16.5 20.8 17.0 13.1 16.0 14.0
Did you experience problems finding machines for land preparation or sowing as a result of COVID-19 for the next crop? (% of respondents)
Yes 13.1 4.2 12.1 22.0 16.0 20.1
No 76.4 77.1 76.5 69.9 75.2 71.5
Don't know 10.5 18.8 11.4 8.2 8.8 8.4
COVID-19 = coronavirus disease.
Note: Percentages may not total 100% because of rounding.a Multiple response question.
Source: Authors’ calculations based on data gathered under Asian Development Bank phone surveys with farmers in Punjab (May 2020) and Sindh (June 2020).
Table A1.14: COVID-19 Impacts on Farmers’ Financing of Farm Operations in Punjab and Sindh
Item
Punjab Zones Sindh ZonesRice–
WheatMixed
CroppingOverall Punjab
Upper Sindh
Lower Sindh
Overall Sindh
Respondents who had grown or were planning to grow crops in kharifa (No.)
381 48 429 282 125 407
Did you experience any immediate financial needs to maintain your farm operations? (% of respondents)
Yes 61.9 62.5 62.0 75.2 73.6 74.7
No 38.1 37.5 38.0 24.8 26.4 25.3
Did the need arise because of COVID-19? (% of respondents who experienced immediate financial needs to maintain farm operations)
Yes 56.4 60.0 56.8 87.7 80.4 85.5
No 43.6 40.0 43.2 12.3 19.6 14.5
Table A1.13 continued
continued on next page
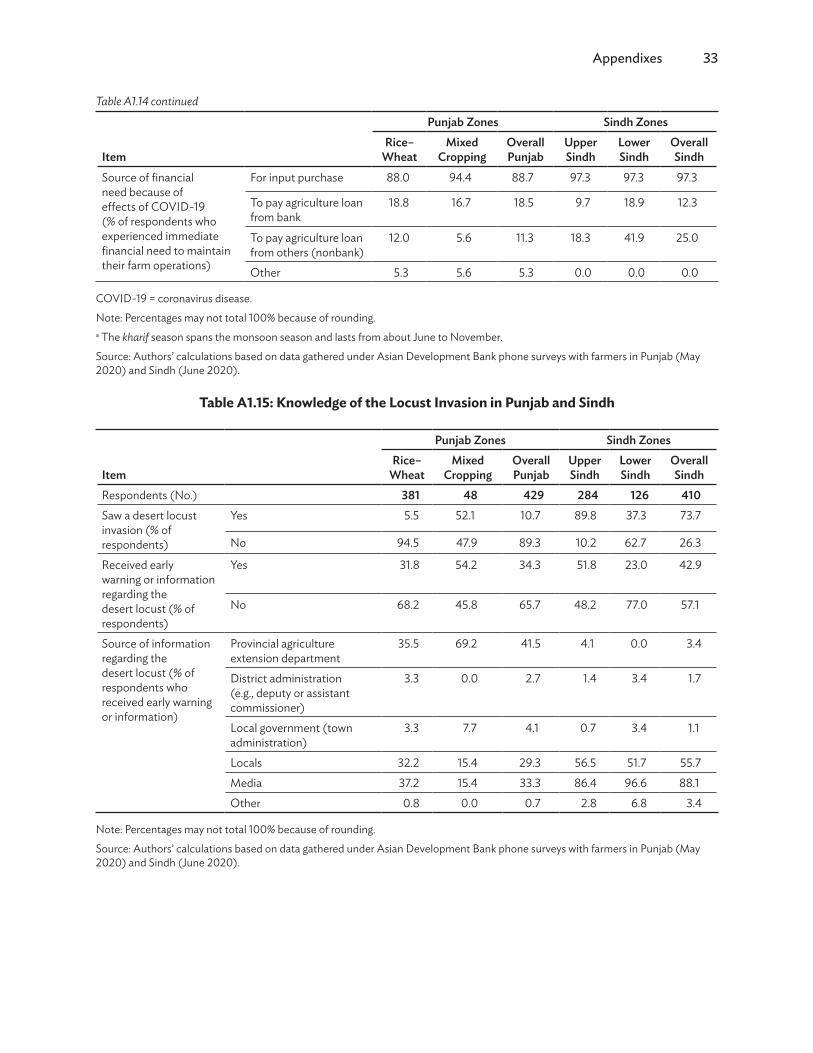
Appendixes 33
Item
Punjab Zones Sindh ZonesRice–
WheatMixed
CroppingOverall Punjab
Upper Sindh
Lower Sindh
Overall Sindh
Source of financial need because of effects of COVID-19 (% of respondents who experienced immediate financial need to maintain their farm operations)
For input purchase 88.0 94.4 88.7 97.3 97.3 97.3
To pay agriculture loan from bank
18.8 16.7 18.5 9.7 18.9 12.3
To pay agriculture loan from others (nonbank)
12.0 5.6 11.3 18.3 41.9 25.0
Other 5.3 5.6 5.3 0.0 0.0 0.0
COVID-19 = coronavirus disease.
Note: Percentages may not total 100% because of rounding.a The kharif season spans the monsoon season and lasts from about June to November.
Source: Authors’ calculations based on data gathered under Asian Development Bank phone surveys with farmers in Punjab (May 2020) and Sindh (June 2020).
Table A1.15: Knowledge of the Locust Invasion in Punjab and Sindh
Item
Punjab Zones Sindh ZonesRice–
WheatMixed
CroppingOverall Punjab
Upper Sindh
Lower Sindh
Overall Sindh
Respondents (No.) 381 48 429 284 126 410Saw a desert locust invasion (% of respondents)
Yes 5.5 52.1 10.7 89.8 37.3 73.7
No 94.5 47.9 89.3 10.2 62.7 26.3
Received early warning or information regarding the desert locust (% of respondents)
Yes 31.8 54.2 34.3 51.8 23.0 42.9
No 68.2 45.8 65.7 48.2 77.0 57.1
Source of information regarding the desert locust (% of respondents who received early warning or information)
Provincial agriculture extension department
35.5 69.2 41.5 4.1 0.0 3.4
District administration (e.g., deputy or assistant commissioner)
3.3 0.0 2.7 1.4 3.4 1.7
Local government (town administration)
3.3 7.7 4.1 0.7 3.4 1.1
Locals 32.2 15.4 29.3 56.5 51.7 55.7Media 37.2 15.4 33.3 86.4 96.6 88.1Other 0.8 0.0 0.7 2.8 6.8 3.4
Note: Percentages may not total 100% because of rounding.
Source: Authors’ calculations based on data gathered under Asian Development Bank phone surveys with farmers in Punjab (May 2020) and Sindh (June 2020).
Table A1.14 continued
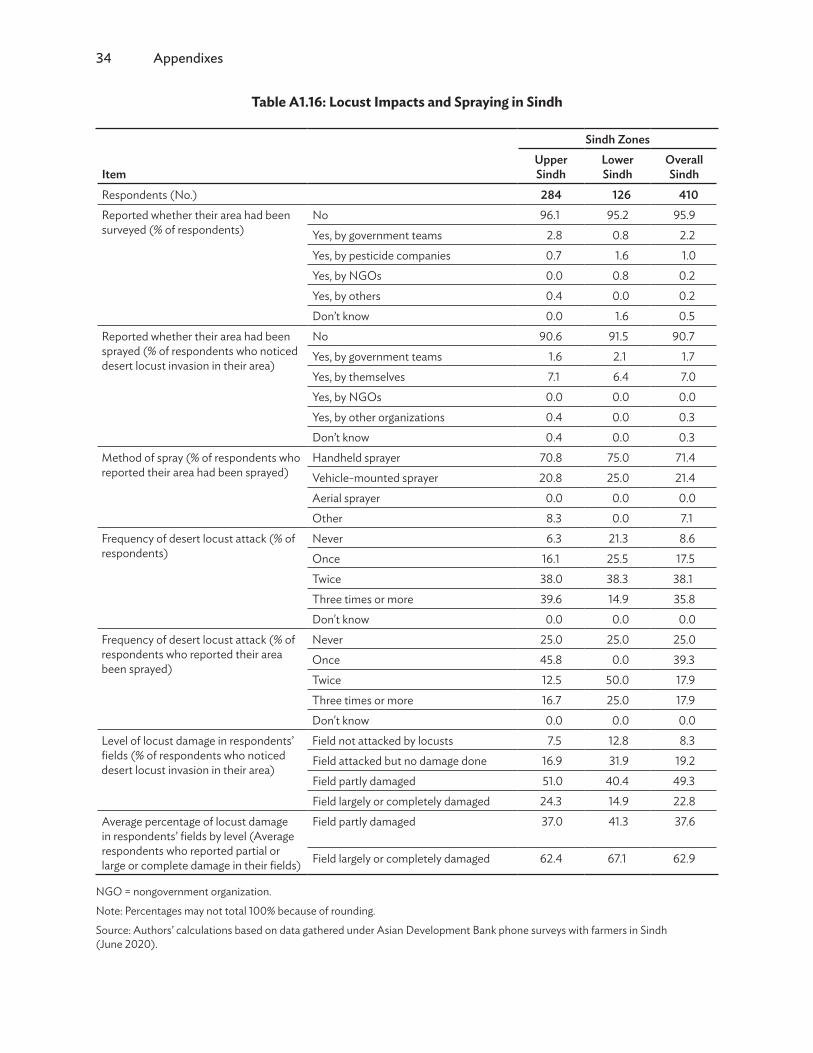
34 Appendixes
Table A1.16: Locust Impacts and Spraying in Sindh
Item
Sindh ZonesUpper Sindh
Lower Sindh
Overall Sindh
Respondents (No.) 284 126 410Reported whether their area had been surveyed (% of respondents)
No 96.1 95.2 95.9Yes, by government teams 2.8 0.8 2.2Yes, by pesticide companies 0.7 1.6 1.0Yes, by NGOs 0.0 0.8 0.2Yes, by others 0.4 0.0 0.2Don’t know 0.0 1.6 0.5
Reported whether their area had been sprayed (% of respondents who noticed desert locust invasion in their area)
No 90.6 91.5 90.7Yes, by government teams 1.6 2.1 1.7Yes, by themselves 7.1 6.4 7.0Yes, by NGOs 0.0 0.0 0.0Yes, by other organizations 0.4 0.0 0.3Don’t know 0.4 0.0 0.3
Method of spray (% of respondents who reported their area had been sprayed)
Handheld sprayer 70.8 75.0 71.4Vehicle-mounted sprayer 20.8 25.0 21.4Aerial sprayer 0.0 0.0 0.0Other 8.3 0.0 7.1
Frequency of desert locust attack (% of respondents)
Never 6.3 21.3 8.6Once 16.1 25.5 17.5Twice 38.0 38.3 38.1Three times or more 39.6 14.9 35.8Don't know 0.0 0.0 0.0
Frequency of desert locust attack (% of respondents who reported their area been sprayed)
Never 25.0 25.0 25.0Once 45.8 0.0 39.3Twice 12.5 50.0 17.9Three times or more 16.7 25.0 17.9Don't know 0.0 0.0 0.0
Level of locust damage in respondents’ fields (% of respondents who noticed desert locust invasion in their area)
Field not attacked by locusts 7.5 12.8 8.3Field attacked but no damage done 16.9 31.9 19.2Field partly damaged 51.0 40.4 49.3Field largely or completely damaged 24.3 14.9 22.8
Average percentage of locust damage in respondents’ fields by level (Average respondents who reported partial or large or complete damage in their fields)
Field partly damaged 37.0 41.3 37.6
Field largely or completely damaged 62.4 67.1 62.9
NGO = nongovernment organization.
Note: Percentages may not total 100% because of rounding.
Source: Authors’ calculations based on data gathered under Asian Development Bank phone surveys with farmers in Sindh (June 2020).

Appendixes 35
Table A1.17: Farmers’ Preferences for Policy Measures in Punjab
Punjab Zone
Suggested Policy Measure
Policy Measure Identified by Rank (No. of respondents)
Identification Rate(%)
Priority Index
Priority Rank1st 2nd 3rd 4th 5th Total
Rice–wheat
Remove restrictions on marketing agricultural produce in other districts
107 47 28 19 0 201 52.8 2.2 3
Ensure timely supply of agricultural inputs
45 92 63 11 0 211 55.4 2.1 4
Ensure price stability for agriculture produce
92 96 74 22 0 284 74.5 2.9 1
Ease loan repayment conditions or waive loans
105 67 44 41 0 257 67.5 2.6 2
Othersa 1 1 1 0 6 9 2.4 0.0 5Mixed cropping
Remove restrictions on marketing agricultural produce in other districts
26 6 0 0 0 32 66.7 3.2 1
Ensure timely supply of agricultural inputs
2 11 7 2 0 22 45.8 1.6 4
Ensure price stability for agriculture produce
10 13 12 4 0 39 81.3 3.0 2
Ease loan repayment conditions or waive loans
8 10 8 4 0 30 62.5 2.3 3
Othersa 0 0 0 0 0 0 0.0 0.0 5Overall Punjab
Remove restrictions to market agricultural produce in other districts
133 53 28 19 0 233 54.3 2.3 3
Ensure timely supply of agricultural inputs
47 103 70 13 0 233 54.3 2.1 4
Ensure price stability for agriculture produce
102 109 86 26 0 323 75.3 2.9 1
Ease loan repayment conditions or waive loans
113 77 52 45 0 287 66.9 2.6 2
Othersa 1 1 1 0 6 9 2.1 0.0 5
a “Others” refers to additional policy measures suggested by respondents.
Source: Authors’ calculations based on data gathered under Asian Development Bank phone surveys with farmers in Punjab (May 2020).

36 Appendixes
Table A1.18: Farmers’ Preferences for Policy Measures in Sindh
Sindh Zone Suggested Policy Measure
Policy Measure Identified by Rank (No. of respondents)
Identifi-cation
Rate (%)Priority Index
Priority Rank1st 2nd 3rd 4th 5th Total
Upper Sindh
Remove restrictions on marketing agricultural produce in other districts
18 26 65 70 0 179 63.0 1.86 4
Ensure timely supply of agricultural inputs
118 87 45 24 0 274 96.5 3.95 1
Ensure price stability for agriculture produce
76 119 56 21 2 274 96.5 3.76 2
Ease loan repayment conditions or waive loans
52 45 70 53 0 220 77.5 2.66 3
Othersa 19 3 27 8 79 136 47.9 1.00 5Lower Sindh
Remove restrictions on marketing agricultural produce in other districts
7 14 37 45 0 103 81.7 2.32 4
Ensure timely supply of agricultural inputs
33 48 25 18 0 124 98.4 3.71 2
Ensure price stability for agriculture produce
47 41 27 8 0 123 97.6 3.94 1
Ease loan repayment conditions or waive loans
38 22 22 29 0 111 88.1 3.19 3
Othersa 1 0 9 5 57 72 57.1 0.79 5Overall Sindh
Remove restrictions on marketing agricultural produce in other districts
25 40 102 115 0 282 68.8 2.00 4
Ensure timely supply of agricultural inputs
151 135 70 42 0 398 97.1 3.88 1
Ensure price stability for agriculture produce
123 160 83 29 2 397 96.8 3.81 2
Ease loan repayment conditions or waive loans
90 67 92 82 0 331 80.7 2.82 3
Othersa 20 3 36 13 136 208 50.7 0.93 5
a “Others” refers to additional policy measures suggested by respondents.
Source: Authors’ calculations based on data gathered under Asian Development Bank phone surveys with farmers in Sindh (June 2020).

Appendixes 37
APPENDIX 2: PAKISTAN’S POLICIES ON CROP PROCUREMENT AND PRICE CONTROL
1. Procurement and price control polices for crops. The only major crop for which the Government of Pakistan is directly involved in procurement is wheat. Every year before the sowing season starts, the government announces a support price for farmers in consultation with federal and provincial food departments. After harvesting the wheat, the Pakistan Agricultural Storage and Services Corporation at the federal level and food departments at the provincial level procure wheat from farmers. Farmers in Pakistan retain about 60% of local wheat produce to meet their seed and household consumption needs. The rest is marketed and is termed a “marketable surplus.” During 2017–2019, the government procured about two-thirds of the marketable surplus. The price support and procurement policy’s intent is to ensure sufficient returns to farmers and to maintain adequate stocks with procurement agencies so that they can intervene to stabilize prices when needed.
2. For sugarcane, national or provincial government involvement is limited to announcing a minimum price that sugar mills are legally bound to pay farmers for the cane. Government agencies are not involved in crop procurement. For both wheat and sugarcane, the decision to allow export and/or import rests with the Economic Coordination Committee on the advice of the Ministry of National Food Security and Research. If market conditions allow, the government authorizes the Trading Corporation of Pakistan to import these commodities. Private traders and/or mills are authorized to export wheat and sugar on their own after approval from the Economic Coordination Committee.
3. In contrast to wheat and sugarcane, no direct or indirect measures are in place to control the supplies and prices of rice and maize; the markets for these crops run purely on a commercial basis. For minor food crops, such as pulses, vegetables, and fruits, the government does not announce support prices or indicative prices, or become directly involved in procurement or trading. Commercial traders usually import and export these items based on the demand and supply in the domestic market (Khalid and Sabahat 2020).
4. The government wheat procurement policy and its outcomes. Based on the importance of wheat to Pakistan’s economy and food security, the government has been deeply involved in the wheat subsector since the 1950s. The procurement prices paid to farmers, the prices at which mills sell flour, and the interprovincial movement of wheat are all controlled by the government at the federal, provincial, and district levels.
5. To promote the domestic production of wheat, every year before the wheat sowing season starts, the federal government announces a procurement price for wheat (which is normally set higher than the international price of wheat) along with procurement targets for the provincial and federal governments. Wheat stocks are procured and maintained by provincial food departments and the Pakistan Agricultural Storage and Services Corporation on behalf of the federal government. During the wheat harvesting season, the government bans the interprovincial movement of wheat to help each province meet its procurement target. As the ban is executed by district administrations within each province, it ultimately results in a ban on the interdistrict movement of wheat during the harvesting season. Laws also prevent most private enterprises from carrying out large-scale wheat procurement and storage until government agencies have completed their purchases. Exceptions are made for wheat procurement, such as by flour millers and local middlemen who provide farmers with credit and accept wheat in payment of farmers’ outstanding debts.

38 Appendixes
6. Wheat purchased by the government is transported by the private sector, with the government providing financing to offset the costs of transporting the wheat to deficit areas. As the moisture content of wheat at the time of harvest is about 10%, procurement and transport of wheat can start immediately after the harvest without delays for grain drying. Following the procurement in April and May, the government stores the wheat in its own or rented private godowns (horizontal or flat shed storage facilities) or open-air ganjies (open-air storage facilities that use tarpaulins or other covers to protect the wheat). The government usually releases the wheat to millers from early October to the following year’s harvest in April and May. When the government sets the procurement prices, it also sets release prices, which can be adjusted later during the marketing year.
7. The wheat procurement policy is not helping the country meet any of the policy objectives for the following reasons: (i) it has not helped to increase wheat productivity, which remains lower than that in countries with similar climatic conditions; (ii) the policy benefits banks, large farmers, millers, and intermediaries but penalizes the urban consumers and rural poor who are net purchasers of wheat or wheat flour; (iii) the government rationale of taking the responsibility for supplying wheat to flour mills is flawed and costly; (iv) the system imposes a huge financial burden on the government on a recurring basis; (v) the system crowds out the private sector; (vi) the system poses serious governance challenges in terms of inefficiencies, adulteration, misappropriation, and rent-seeking; and (vii) the opportunity cost of tying resources up in wheat procurement is far too high—it not only captures federal and provincial governments’ fiscal space, but also compromises development expenditures (International Food Policy Research Institute 2020).
APPENDIX 3: INDEX USED TO IDENTIFY PREFERENCES FOR SUGGESTED POLICY MEASURES
1. Authors developed a priority index to identify the farmers’ preferences for policy measures that they believed the government should take. The index values range from 0 to 5, with the higher value denoting a greater preference for the policy measure. Based on the index value, policy measures were ranked from the most preferred to the least preferred. The index is based on (i) the percent of total farmer respondents who suggested a policy measure for government action, and (ii) the priority rank (from 1 as top priority to 5 as the lowest priority) that farmers assigned to the suggested policy measure.
2. The priority index is a product of the identification rate (IR) and the aggregate ranking score (ARS). The IR is the simple percentage of farmers who suggested a policy measure for government action regardless of priority rank. Assume that a total of N farmers were interviewed, and that Nij denotes the number of farmers who suggested policy measure j at priority-rank i where i =1,2,3,4,5. It is important to mention here that N Niji
1
5, as some farmers may not identify policy measure j among their top five
suggested policy measures. The IR for policy measure j is calculated as follows:
IRN
Njiji 1
5
3. The ARS of policy measure j is calculated by taking the average of scores assigned to ranks 1–5, weighted by the number of farmers who identified a policy measure j at rank 1–5. To give more mass to a policy measure identified as the most preferred, a score of 5 is assigned to rank 1, 4 to rank 2, 3 to rank

Appendixes 39
3, 2 to rank 4, and 1 to rank 5. Assume that Nij denotes the number of farmers who identified policy measure j at priority rank i, and Si is the score assigned to rank i. Then the ARS of policy measure j is calculated as follows:
ARSN S
Nj
ij ii
iji
1
5
1
5
4. As ARSs are based only on the results of the farmers who identified a specific policy measure j (i.e., Niji 1
5), these scores cannot be used to rank policy measures for all N farmers. ARSs have to be
corrected for those who did not identify a specific policy measure. Therefore, the priority index (PI) for each policy measure is calculated by multiplying its ARS with its IR, as follows:
PI ARS IRj j j
5. Based on values of the priority index, each policy measure is ranked in priority order.
Action Against Hunger. 2020. COVID-19 Could Cause the Collapse of Pakistan’s Food System. 7 May. https://www.actionagainsthunger.org/story/covid-19-could-cause-collapse-pakistans-food-system.
Al Jazeera. 2020. Pakistan Claims Devastating Locust Attack Brought under Control. 9 October. https://www.aljazeera.com/news/2020/10/9/pakistan-claims-devastating-locust-swarm-brought-under-control.
Asian Development Bank (ADB). 2013. Technical Assistance to the Islamic Republic of Pakistan for Punjab Basmati Rice Value Chain. Manila. https://www.adb.org/sites/default/files/project-document/79619/47166-001-tar.pdf.
———. 2019. Technical Assistance to the Islamic Republic of Pakistan for Enhancing Technology-Based Agriculture and Marketing in Rural Punjab. Manila. https://www.adb.org/sites/default/files/project-documents/52232/52232-001-tar-en_0.pdf.
———. 2020a. COVID-19 Impact on Farm Households in Punjab, Pakistan: Analysis of Data from a Cross-Sectional Survey. ADB Briefs. No. 149. Manila. https://www.adb.org/sites/default/files/publication/624751/covid-19-farm-households-punjab-pakistan.pdf.
———. 2020b. Impact of COVID-19 and Locust Swarms on Farm Households in Sindh, Pakistan: Analysis of Data from a Cross-Sectional Survey. ADB Briefs. No. 153. Manila. https://www.adb.org/sites/default/files/publication/643406/covid-19-locust-swarms-farm-households-pakistans.pdf
G. Castex, E. Dechter, and M. Lorca. 2020. COVID-19: The Impact of Social Distancing Policies, Cross-Country Analysis. Economics of Disasters and Climate Change. 2020. https://link.springer.com/article/10.1007/s41885-020-00076-x.
Dawn. 2020a. Ban on Wheat Movement to Help Achieve Procurement Targets. 20 March. https://www.dawn.com/news/1542292.
———. 2020b. Sindh Stops Transportation of Its Wheat to Punjab. 5 April. https://www.dawn.com/news/1546516.
———. 2020c. Punjab Imposes Wheat Restriction to Tackle Crisis. 8 April. https://www.dawn.com/news/1547356.
———. 2020d. Major Locust Swarms May Reach Pakistan Later This Month. 10 July. https://www.dawn.com/news/1568081.
FAO, IFAD, UNICEF, WFP and WHO. 2019. The State of Food Security and Nutrition in the World 2019: Safeguarding against Economic Slowdowns and Downturns. Rome. http://www.fao.org/3/ca5162en/ca5162en.pdf.
FAO. 2019. Agro-Ecological Zones of Punjab, Pakistan 2019. Rome: Food and Agriculture Organization of the United Nations (FAO). http://www.fao.org/3/ca6938en/CA6938EN.pdf.
REFERENCES

References 41
———. 2020a. Rapid Assessment: Possible Impact of COVID-19 on Livelihoods, Food Security, Nutrition, and Agriculture Supply Chains in Pakistan. https://reliefweb.int/sites/reliefweb.int/files/resources/WFP-0000118586.pdf.
———. 2020b. Desert Locust Bulletin. No. 503. 2 September. http://www.fao.org/ag/locusts/common/ecg/562/en/DL503e.pdf.
———. 2020c. Locust Watch. Desert Locust Upsurge in 2019–2020. http://www.fao.org/ag/locusts/en/info/2094/web18/index.html (accessed 8 September 2020).
———. 2020d. FAO Steps up Efforts to Revive Livelihoods and Food Security in Pakistan’s Sindh Province amid COVID-19 Outbreak. News release. 22 April. http://www.fao.org/asiapacific/news/detail-events/en/c/1272254.
———. 2020e. Food Price Monitoring and Analysis (FPMA) Bulletin. No. 3. 10 April. http://www.fao.org/3/ca8611en/ca8611en.pdf.
———. 2020f. Desert Locust Situation in Pakistan. Islamabad: FAO in Pakistan. http://www.fao.org/pakistan/resources/in-depth/desert-locust-situation-in-pakistan/en/.
C. Goodhart and M. Pradhan. 2020. Future Imperfect after Coronavirus. VoxEU and Centre for Economic Policy Research (CEPR) Policy Portal. 27 March. https://voxeu.org/article/future-imperfect-after-coronavirus.
Google. COVID-19 Community Mobility Reports. https://www.google.com/covid19/mobility/ (accessed 11 October 2020).
Gallup Pakistan. 2020. Pakistani Labor Force at Risk. 1 June.
Government of Pakistan, Finance Division. 2020. Adviser to PM on Finance and Revenue Chaired a Meeting of ECC. News release. 10 June. http://www.finance.gov.pk/pr_apr_jun_2020.html.
Government of Pakistan, Ministry of Finance, Economic Adviser’s Wing. 2020. Monthly Economic Update: March 2020. Islamabad. http://www.finance.gov.pk/economic/economic_updates_march_2020.pdf.
Government of Pakistan, Ministry of National Food Security & Research (MNFSR). 2019. Agricultural Statistics of Pakistan 2017–2018. http://www.mnfsr.gov.pk/userfiles1/file/Agricultural-Statistics%20of%20Pakistan%202017-18%20for%20web.xls
Government of Pakistan, National Disaster Management Authority. 2020. Situation Report on Anti-Locust Operations: No. 109 (up to 3 June 2020). Islamabad. http://web.ndma.gov.pk/SITREPPIA/june/Sitrep%20No%20109%20Locust%2003-6-20.pdf.
Government of Pakistan, National Locust Control Centre. 2020. Situation Report up to 1 November 2020. Islamabad. https://www.nlcc.gov.pk/storage/files/iHXqVird1eOEOjPun5uQ19r7RJbS2tFqxPPAXk5x.pdf.
———. Survey & Control. https://www.nlcc.gov.pk/provincial-survey (accessed 3 January 2021).

42 References
Government of Pakistan, Pakistan Bureau of Statistics (PBS). 2017. Population Census, 2017. Islamabad. https://www.pbs.gov.pk/content/block-wise-provisional-summary-results-6th-population-housing-census-2017-january-03-2018.
———. 2018. Labour Force Survey of Pakistan 2017–18. Islamabad. https://www.pbs.gov.pk/sites/default/files//Labour%20Force/publications/lfs2017_18/Annual%20Report%20of%20LFS%202017-18.pdf.
———. 2020a. Table 1. Macro Economic Indicators. Islamabad. https://www.pbs.gov.pk/sites/default/files/tables/national-accounts/Table-1.pdf
———. 2020b. Sensitive Price Indicator for the Week Ended on 7 May 2020. Islamabad. https://www.pbs.gov.pk/sites/default/files//price_statistics/weekly_spi_nb/SPI_report_07052020.pdf
Government of Pakistan, Press Information Department. 2020a. PR No. 79. News release. 11 June. http://pid.gov.pk/site/press_detail/13893.
———. 2020b. PR No. 147: There is Sufficient Supply of Wheat in Market: Khusro Bakhtyar Wheat Procurement Target Fixed at 8.25 Million Tons. News release. 19 March. http://pid.gov.pk/site/press_detail/13352.
Government of the Punjab. 2018. Punjab Agriculture Policy 2018. Lahore. http://www.agripunjab.gov.pk/system/files/Punjab%20Agriculture%20Policy.pdf.
Government of Sindh, Agriculture Department. Message from Secretary.
Government of the United Kingdom (UK), British High Commission Islamabad. 2020. UK Locust Sprayers Arrive in Pakistan To Help Tackle Crises. News release. 22 June. https://www.gov.uk/government/news/uk-locust-sprayers-arrive-in-pakistan-to-help-tackle-crises.
N. Imai et al. 2020. Adoption and Impact of Non-pharmaceutical Interventions for COVID-19. Wellcome Open Research. 5. p. 59. https://europepmc.org/article/pmc/pmc7255913.
International Food Policy Research Institute. 2020. Rationalization of Wheat Markets in Pakistan: Policy Options. Pakistan Agricultural Capacity Enhancement Program Policy Paper. March 2020. http://ebrary.ifpri.org/utils/getfile/collection/p15738coll2/id/133728/filename/133939.pdf.
International Labour Organization. 2018. World Employment Social Outlook. https://www.ilo.org/wcmsp5/groups/public/---dgreports/---dcomm/---publ/documents/publication/wcms_615594.pdf.
International Rescue Committee. 2020. COVID-19 Rapid Need Assessment. 13 April. https://reliefweb.int/sites/reliefweb.int/files/resources/COVID-19%20Rapid%20Need%20Assessment%20-%20IRC%20Pakistan%20_0.pdf.
S. Jamal. 2020. How Will COVID-19 Affect Pakistan Farmers, Food System? Gulf News. 1 May. https://gulfnews.com/world/asia/pakistan/how-will-covid-19-affect-pakistan-farmers-food-system-1.71196910.
S. Khalid and Sabahat. 2020. Price Stabilization Mechanism in Pakistan’s Food Markets: Exploring Issues and Potential Challenges. SBP Staff Notes. Islamabad: State Bank of Pakistan. April. https://www.sbp.org.pk/publications/staff-notes/Price%20Stabilization%20Mechanism%20in%20Pakistan's%20Food%20Market%20Exploring%20Issues%20and%20Potential%20Challenges.pdf.
References 43
A. Latif and S. Niazi. 2020. COVID-19 Lockdown Sparks Harvest Crises in Pakistan, India. Anadolu Agency. 10 April. https://www.aa.com.tr/en/asia-pacific/covid-19-lockdown-sparks-harvest-crises-in-pakistan-india/1799536.
J. Liu et al. 2020. Agricultural Productivity Growth and Its Determinants in South and Southeast Asian Countries. Sustainability. 12(12). p. 4981. https://www.mdpi.com/2071-1050/12/12/4981.
S. Mendolia, O. Stavrunova, and O. Yerokhin. 2020. Determinants of the Community Mobility during the COVID-19 Epidemic: The Role of Government Regulations and Information. IZA Discussion Papers. No. 13778. October. http://ftp.iza.org/dp13778.pdf.
The Express Tribune. 2020a. Implementing the New Wheat Policy. 17 July. https://tribune.com.pk/story/2255208/implementing-the-new-wheat-policy.
———. 2020b. Punjab Government to Achieve Wheat Procurement Target. 19 April. https://tribune.com.pk/story/2201501/1-punjab-govt-achieve-wheat-procurement-target.
The Nation. 2020. Government Decides to Lift Ban on Interprovincial Movement of Wheat with Immediate Effect. 8 June. https://nation.com.pk/08-Jun-2020/govt-decides-to-lift-ban-on-interprovincial-movement-of-wheat-with-immediate-effect.
The Statesman. 2020. Nepal Government Decides to Ease Lockdown as It Reports 4,364 Coronavirus Cases. 11 June. https://www.thestatesman.com/world/nepal-govt-decides-ease-lockdown-reports-4364-coronavirus-cases-1502898673.html.
Organisation for Economic Co-operation and Development. 2020. COVID-19 and the Food and Agriculture Sector: Issues and Policy Responses. https://read.oecd-ilibrary.org/view/?ref=130_130816-9uut45lj4q&title=Covid-19-and-the-food-and-agriculture-sector-Issues-and-policy-responses.
Pakistan Institute of Development Economics. 2020. Labour Market and COVID-19: Provincial-Level Analysis of Vulnerable Employment across Sectors. PIDE COVID-19 Bulletin. Islamabad. http://www.pide.org.pk/pdf/PIDE-COVID-Bulletin-13.pdf.
A. Siddiq and M. Basher. 2019. Dysfunctional Horticulture Value Chains and the Need for Modern Marketing Infrastructure: The Case of Pakistan. ADB Sustainable Development and Climate Change Department Brief. Manila: ADB. https://www.adb.org/sites/default/files/publication/534716/dysfunctional-horticulture-value-chains-pakistan.pdf.
United Nations Development Programme. 2020. COVID-19 Pakistan: Socio-Economic Framework. https://www.pk.undp.org/content/pakistan/en/home/library/development_policy/covid-19-pakistan--socio-economic-framework.html.
United Nations Economic and Social Commission for Asia and the Pacific (ESCAP). 2018. Achieving the Sustainable Development Goals in Central and West Asia: Key Policy Priorities and Implementation Challenges. New Delhi.https://www.unescap.org/sites/default/files/publications/UNESCAP%20-%20SRO-SSWA%20SDG%20Report_Sep2018.pdf.
———. 2020. COVID-19 and Central and West Asia: National Strategies and Subregional Cooperation for Accelerating Inclusive, Sustainable and Resilient Recovery. https://www.unescap.org/sites/default/files/South%20Asia%20Covid-19%20Paper_5.pdf.

44 References
United Nations Office for the Coordination of Humanitarian Affairs. 2020. Pakistan: Further Desert Locust Damage Forecast in Coming Agricultural Seasons. News release. 15 June. https://www.unocha.org/story/pakistan-further-desert-locust-damage-forecast-coming-agricultural-seasons.
University of Oxford, Blavatnik School of Government. COVID-19 Government Response Tracker. https://www.bsg.ox.ac.uk/research/research-projects/coronavirus-government-response-tracker#data (accessed 12 October 2020).
World Bank. Food Security and COVID-19. https://www.worldbank.org/en/topic/agriculture/brief/food-security-and-covid-19.
———. World Bank Open Data. Prevalence of Undernourishment. https://data.worldbank.org/indicator/SN.ITK.DEFC.ZS (accessed 15 October 2020).
———. 2020a. Hunger amid Plenty: How to Reduce the Impact Of COVID-19 on the World’s Most Vulnerable People. Voices: Perspectives on Development blog. 1 May.https://blogs.worldbank.org/voices/hunger-amid-plenty-how-reduce-impact-covid-19-worlds-most-vulnerable-people.
———. 2020b. Factsheet—The Locust Crisis: The World Bank's Response. 1 July. https://www.worldbank.org/en/news/factsheet/2020/04/27/the-locust-crisis-the-world-banks-response.
———. 2020c. Central and West Asia Must Ramp Up COVID-19 Action to Protect People, Revive Economies. News release. 12 April. https://www.worldbank.org/en/news/press-release/2020/04/12/south-asia-must-act-now-to-lessen-covid-19-health-impacts.
———. 2020d. Beaten or Broken? Informality and Covid-19. Central and West Asia Economic Focus. https://openknowledge.worldbank.org/bitstream/handle/10986/34517/9781464816406.pdf? sequence=8&isAllowed=y.
———. 2021. Global Economic Prospects, January 2021. Washington, DC. https://openknowledge.worldbank.org/bitstream/handle/10986/34710/9781464816123.pdf.
World Economic Forum. 2020. COVID-19: Pakistan's “Green Stimulus” Scheme Is a Win-Win for the Environment and the Unemployed. 30 April. https://www.weforum.org/agenda/2020/04/green-stimulus-pakistan-trees-coronavirus-covid10-enviroment-climate-change.
World Food Programme. 2020. COVID-19 Will Double Number of People Facing Food Crises Unless Swift Action Is Taken. News release. 21 April. https://www.wfp.org/news/covid-19-will-double-number-people-facing-food-crises-unless-swift-action-taken.

ASIAN DEVELOPMENT BANK6 ADB Avenue, Mandaluyong City1550 Metro Manila, Philippineswww.adb.org
The Impact of COVID-19 and Locust Invasion on Farm Households in Punjab and Sindh Analysis from Cross-Sectional Surveys in Pakistan
This paper presents the results of two mobile phone surveys conducted by the Asian Development Bank among farmers in Punjab and Sindh provinces in Pakistan in mid-2020 during the coronavirus disease (COVID-19) pandemic. The surveys collected information about how COVID-19-related measures and economic and transport disruptions affected farmers’ harvests, marketing efforts, input prices, and financial needs. The surveys found that the COVID-19 pandemic had significant negative impacts on farm households in both provinces. The paper provides additional context on COVID-19-related effects on local and regional economies and food supply chains. It also covers a simultaneous locust invasion along the India–Pakistan border, which has created “crisis within a crisis” in the surveyed provinces and exacerbated conditions that could lead to famine, disease, and increased poverty.
About the Asian Development Bank
ADB is committed to achieving a prosperous, inclusive, resilient, and sustainable Asia and the Pacific, while sustaining its efforts to eradicate extreme poverty. Established in 1966, it is owned by 68 members —49 from the region. Its main instruments for helping its developing member countries are policy dialogue,loans, equity investments, guarantees, grants, and technical assistance.