the impact of contraceptive failure on unintended ... · the impact of contraceptive failure on...
TRANSCRIPT
The Impact of Contraceptive Failure on Unintended Births and Induced Abortions: Estimates and Strategies for Reduction
Sarah E.K. Bradley
Trevor N. Croft
Shea O. Rutstein
Corresponding author: Sarah E.K. Bradley. Demographic and Health Research Division, ICF Macro, 11785 Beltsville Drive, Calverton, Maryland 20705, USA; [email protected]
Acknowledgements: Parts of an earlier version of this paper were presented at the Population Association of America conference. We thank discussant Jane Menken and other conference participants for their feedback and suggestions. Thanks also to Tom Pullum, Bryant Robey, and Kathryn Kost for helpful suggestions.

Abstract
This study investigates the impact of contraceptive failure on unintended births and induced abortions. The study analyzes contraceptive failure rates and simulates levels of unintended births and induced abortions that could be achieved if current family planning users adopted more effective contraceptive methods. This report analyzes data from 20 recent Demographic and Health Surveys (DHS) conducted since 2002 that collected data on contraceptive failure in the DHS calendar and wantedness status of each resulting live birth: Armenia 2005, Azerbaijan 2006, Bangladesh 2004, Colombia 2010, Dominican Republic 2002, Egypt 2008, India 2005-06, Indonesia 2007, Jordan 2007, Kenya 2003, Malawi 2004, Moldova 2005, Morocco 2003-04, Peru 2004-08, Philippines 2003, Tanzania 2004-05, Turkey 2003, Ukraine 2007, Vietnam 2002, and Zimbabwe 2005-06. In six surveys (Armenia, Azerbaijan, Moldova, Turkey, Ukraine, and Vietnam), data were additionally collected on whether each conception resulted in an induced abortion. Multiple-decrement life tables were used to calculate failure rates and simulate the impact of altering the contraceptive method mix in each country.
On average across the 20 countries studied, 34 percent of all pregnancies in the four-year period of observation ended in either an unintended live birth or an induced abortion. These results from a wide range of low- and middle-income countries are similar to levels in high-income countries: half of pregnancies in the US, and one third of pregnancies in the UK and France, are unintended. Higher percentages of pregnancies ended in induced abortion in the six countries with induced abortion data (32 percent on average) than in the United States (20 percent).
The contribution of contraceptive failure to unintended births and induced abortions is substantial. On average, one of every three unintended births resulted from contraceptive failure. In four countries, more than half of unintended births were conceived while the women were using contraception. The impact of contraceptive failure on levels of induced abortion is even greater. More than half of all induced abortions in the six countries studied result from contraceptive failure.
First-year contraceptive failure rates are lowest for permanent methods at almost zero. Long-acting methods (IUD and implant) are also highly effective, with failure rates ranging from zero to 1.8 percent. Short-term modern methods (pills, injectables, condoms, lactational amenorrhea, diaphragms, and spermicides) are next in terms of effectiveness, with an average failure rate of 4.6 percent across countries. Traditional methods are much less effective, with failure rates up to 22 percent, showing that as many as 2 in every 10 women using traditional methods became pregnant within the first year of use.
If all contraceptive failures were eliminated, unintended births would be reduced by nearly a third on average across countries. Induced abortion rates would be reduced by between one- and two-thirds. Though contraceptive failure would be difficult to eliminate entirely, we show that similar results could be achieved by the use of more effective contraceptive methods, without increasing total contraceptive prevalence rates, using 4 hypothetical scenarios:
1. All traditional method users switch to a short-term modern method.
2. Women using contraception for birth spacing switch to a short-term modern method, and women using contraception for limiting births switch to a long-acting modern method.

3. All non-long-acting and permanent method users switch to a reversible long-acting method of contraception.
4. All spacers switch to a long-acting method, while all limiters switch to a permanent method.
Scenario 1, in which all traditional method users switch to modern methods, would decrease unintended births by an average of 10 percent. Seventeen percent of unintended births could be prevented under Scenario 2, and more than a quarter of unintended births could be prevented under Scenario 3, in which all contraceptive users switch to long-acting methods. If all women who currently use contraceptives began using the most effective (long-acting or permanent) method to meet their fertility intentions, the level of unintended births would decrease by an average of 27 percent, varying from 4 to 54 percent across the countries analyzed. This scenario could prevent half a million unintended births each year in India, and between 4,000 and 241,000 unintended births per year in other countries.
The simulations also show that moving less-effective contraceptive method users to more-effective methods would substantially decrease induced abortions. Scenario 1 would prevent 22 percent of induced abortions on average; Scenario 2 would prevent 33 percent; Scenario 3 could prevent 44 percent, and under Scenario 4 almost half of all abortions would be prevented. The numbers of abortions prevented are also substantial: between 5,000 and 316,000 induced abortions per country could be prevented every year.
Using contraception clearly indicates that a woman does not want to become pregnant. Yet every year millions of women become pregnant while using contraception. This paper provides evidence that long-acting and permanent methods, if used in place of less-effective methods, can substantially reduce the number of unintended births and induced abortions, and can help families and countries achieve their health goals.
1
Introduction
An estimated 80 million unintended pregnancies occur each year worldwide, resulting in 42 million induced abortions and 34 million unintended births (Speidel, Harper, and Shields 2008). These unintended pregnancies have grave consequences for the health and well-being of women and families, particularly in low- and middle-income countries where maternal mortality is high and abortions are often unsafe. Three hundred and fifty-eight thousand women die of pregnancy-related causes every year (WHO 2010), many resulting from unintended pregnancies that were unsafely aborted (WHO 2007). Women who carry unintended pregnancies to term may be less likely to seek antenatal care and delivery assistance (Gipson, Koenig, and Hindin 2008; Marston and Cleland 2003), resulting in additional maternal deaths, and contributing to more than one million preventable stillbirths (Bhutta et al. 2011) and the 3.6 million neonatal deaths annually (R. Black et al. 2010) that may have been prevented with proper care. If they survive the neonatal period, evidence suggests that children born as a result of unintended pregnancies are less likely to be breastfed and more likely to be stunted than wanted children, and are at higher risk for child mortality (Gipson, Koenig, and Hindin 2008). At the national level, unintended pregnancies slow progress toward achieving the Millennium Development Goals and other health and socioeconomic objectives, contribute substantially to population growth that in many cases is unwanted, make it more difficult for countries to provide education for all and to eradicate extreme poverty and hunger, and inhibit progress toward improving maternal health and child survival.
Unintended pregnancy can result from non-use of contraception, or from contraceptive failure–that is, becoming pregnant while using a family planning method. Many studies have examined the reasons why some women do not use contraception even though they do not want to become pregnant, referred to as unmet need for family planning (e.g., Sedgh et al. 2007b; Khan et al. 2008; Westoff 2006; Westoff and Bankole 1995). Fewer studies have focused on women who actively try to prevent pregnancy by using contraception, but became pregnant despite their efforts.
Contraceptive failure contributes substantially to raising levels of unintended births and induced abortion, as the vast majority of contraceptive failures result in either one or the other outcome (Cleland and Ali 2004; Trussell, Vaughn, and Stanford 1999). Although rates vary by country, large proportions of unintended pregnancies result from contraceptive failure. In the United States 48 percent of all unintended pregnancies and 54 percent of induced abortions were the result of contraceptive failure (Finer and Henshaw 2006). In France, 65 percent of unintended pregnancies result from contraceptive failure (Moreau et al. 2007), while in Egypt and Jordan approximately one-third of births result from unintended pregnancies (Roudi-Fahmi and Monem 2010). Proportions are higher in countries with higher levels of contraceptive use, as the proportion of unintended pregnancies that are due to contraceptive failure is directly linked to the proportion of the population using contraception: in a theoretical population with a 100 percent contraceptive prevalence rate, 100 percent of unintended pregnancies would be due to contraceptive failure.
From a programmatic perspective, decreasing the incidence of unintended pregnancies among women who are already using contraception is arguably an easier goal to achieve than increasing uptake of family planning among non-users. Jain has suggested that “family planning programs may be more effective if they emphasize eliminating unintended pregnancies among women who are already practicing contraception than if they focus on persuading nonusers to become users” (Jain 1999: S39). Contraceptive users have already clearly demonstrated their desire to avoid pregnancy and to take steps to prevent it. Most barriers to contraceptive use are not issues for women currently using contraception–for example, a woman’s belief that she is not at risk of becoming pregnant, which is a

2
reason commonly given for non-use (Sedgh et al. 2007b). This belief is unlikely to be held by women who use family planning, particularly those who have experienced contraceptive failure. Users are also unlikely to oppose contraception, a barrier cited by Collumbien, Gerressu, and Cleland (2004), although specific methods may be prohibited based on women’s beliefs, those of their partner, or religious guidance. Additionally, contraceptive users, depending on their method, may already be in contact with a healthcare infrastructure that could provide counseling and other services for more effective contraceptive use and/or more effective contraceptive methods.
The impact of contraceptive failure on unintended pregnancy and abortion is related to overall levels of unintended pregnancy and termination; levels of contraceptive use and method mix, and how well contraceptive methods are being used, all of which can be examined through studying contraceptive failure rates. In this paper, we examine these issues using recent (2002-2010) nationally-representative Demographic and Health Surveys (DHS) data from 20 low- and middle-income countries. We use an underutilized portion of DHS data, the contraceptive calendar, which collects a detailed retrospective reproductive history from each woman surveyed, including whether each conception in the last five years was the result of contraceptive failure. These details can be linked to women’s histories of recent births, which provide data on the wantedness of each birth. Calendar data also are used to calculate contraceptive failure rates, both as occurred, and as would occur if larger proportions of women switched to more effective contraceptive methods, while taking into account their reproductive intentions.
A growing body of literature has suggested that using more reliable contraception–particularly long-acting and permanent methods that are highly effective and require little action on the part of users–can be an effective way of helping women and couples to meet their reproductive intentions (e.g., ACOG 2009; K. Black et al. 2010; Hubacher, Mavranezouli, and McGinn 2008; Jacobstein 2007; Speidel, Harper, and Shields 2008; Ruddik 2009; Neukom et al. 2011). Nearly all of these papers focus on providing a wide array of contraceptive methods to give women many contraceptive choices. Long-acting reversible methods have not been promoted widely, predominantly due to providers’ misconceptions about the appropriateness of use, particularly for adolescent, nulliparous, or unmarried women (WHO 2009; Lyus, Lohr, and Prager 2010; Jacobstein 2007). Studies from a range of settings have found that, when women are correctly counseled about long-acting reversible methods, the majority select these highly-effective methods, particularly when cost barriers are reduced or removed (Secura et al. 2010; Rose, Lawton, and Brown 2010; Neukom et al. 2011).
Although long-acting reversible methods (implants and IUDs), and permanent methods (male and female sterilization), are initially more costly than a pack of pills or package of condoms, several studies have found long-acting and permanent methods to be much more cost-effective than short-acting hormonal or barrier methods (Mavranezouli 2009; Blumenthal, Voedisch, and Gemzell-Danielsson 2011; Lakha and Glasier 2006). Even when used for less than a year, and particularly when used for longer periods, long-acting methods have been found to be more cost-effective than short-term modern methods (Lipetz, Philipps and Fleming 2009a and 2009b). Depending on the brand, some IUDs and implants1 can be used for up to 10 years (and perhaps longer) and can be removed at any point, with a rapid return to fertility (Espey and Ogburn 2011; Sivin 2007; McDonald-Mosley and Burke 2010; Fisher
1 Different formulations of implants and IUDs (for example, the copper IUD or Copper-T vs. the levonorgestrel-
containing IUD or LNG-IUS) have varying efficacy rates and durations of use, but the data do not allow us to determine the brand name or precise type of implant or IUD used. We therefore treat all IUDs as one contraceptive method, and do the same for implants.

3
2008). Long-acting and permanent methods require very little action on the part of the user beyond the initial insertion/operation and are easy to use, resulting in few failures from user error. They also do not require the level of partner agreement and involvement needed for methods like periodic abstinence, withdrawal, and condoms, nor the repeated restocking necessary for pill and condom use. Beyond the initial visit and follow-up, long-acting and permanent method users do not need to return to the clinic repeatedly, unlike injectable users who must return every three months. Several studies have found that these qualities, in addition to the relatively few side effects of long-acting methods, and particularly with permanent methods, lead to high levels of user satisfaction and low levels of discontinuation, although it must be noted that discontinuation requires action on the part of the user–sometimes considerable action, in the case of sterilization–and so lower levels of discontinuation are to be expected compared to other methods that are discontinued simply by taking no action (Mestad, Kenerson, and Peipert 2009; Ladipo and Akinso 2005).
Based on the evidence that long-acting and permanent methods are highly desired by women and couples to plan their families, widely used when made accessible and presented with updated information, easier to use correctly than other methods, highly effective at preventing unintended pregnancy, and cost-effective, we will investigate the levels and numbers of live births resulting from unintended pregnancies and induced abortions that could be averted if women switched to more effective methods of contraception, with a focus on long-acting and permanent methods. We will examine:
1. The proportion of births that were unintended and, in a subset of countries, the proportion of pregnancies that ended in induced abortion;
2. The proportion of births from unintended pregnancies and induced abortions that resulted from contraceptive failure;
3. Contraceptive prevalence rates and method mix in each country;
4. Contraceptive failure rates, by method and by method group (traditional methods, short-acting modern methods, long-acting methods, and permanent methods);
5. The proportions of births from unintended pregnancies and induced abortions that could be prevented in the absence of failure; and
6. More realistic scenarios than eliminating failure completely: reductions in births from unintended pregnancies and induced abortions that could be achieved if women used more effective methods of contraception.
Keeping in mind Jain’s programmatic recommendation, and the rationale that unintended pregnancies may be easier to avert among women using contraception than among non-users, we keep the focus on contraceptive failures, and only estimate the proportions of births from unintended pregnancies and induced abortions that could be averted if women and couples switched from their current contraception to the most effective method to meet their family planning desires. In all scenarios, the proportion of births from unintended pregnancies resulting from non-use is kept constant. Even with this restriction, we will demonstrate that effective contraception can go a long way toward averting unintended births and induced abortions, and toward helping women, families, and countries achieve their health goals.
4
Data We use nationally representative DHS data from the most recent survey since 2002 in each country that collected calendar data on contraceptive failure. These data are available for 20 surveys:2 Armenia 2005, Azerbaijan 2006, Bangladesh 2004, Colombia 2010, Dominican Republic 2002, Egypt 2008, India 2005-06, Indonesia 2007, Jordan 2007, Kenya 2003, Malawi 2004, Moldova 2005, Morocco 2003-04, Peru 2004-08,3 Philippines 2003, Tanzania 2004-05, Turkey 2003, Ukraine 2007, Vietnam 2002, and Zimbabwe 2005-06. These countries combined account for 36 percent of all births worldwide (UNPD 2011). Calendar data are complete month-by-month retrospective histories of every birth, pregnancy, termination, and episode of contraceptive use (or non-use) that occurred in the five years prior to the survey. In several surveys, additional columns were added to the calendar, including the collection of the primary reason for discontinuation; in any month when a woman reported discontinuing a contraceptive method, she was asked what the primary reason was for discontinuation. One reason commonly given is method failure, or “became pregnant while using,” which allows us to directly calculate failure rates. This “expanded” calendar was included in early phases of the DHS core questionnaire, but in 2003 the use of a one-column calendar that did not include reasons for discontinuation became the standard. Only countries that were interested in reasons for discontinuation or other questions related to contraceptive use dynamics continued to implement the expanded calendar, leading to over-representation of Eastern European and former Soviet countries in the sample of countries that collected this information. Many of these countries used the calendar to collect detailed information on induced abortion, which also allows us to examine the proportion of abortions that resulted from contraceptive failure.
As Table 1 shows, all surveys collected information from women age 15-49, except Colombia (age 13-49) and Bangladesh (age 10-49). For purposes of comparability, our analyses are all limited to women age 15-49. Five surveys in this analysis (Bangladesh, Indonesia, Egypt, Jordan, and Turkey) included only ever-married women. In these five countries, host-country implementers generally thought that it would be culturally inappropriate to ask never-married women questions about sexual activity, contraceptive use, and childbearing; and also thought that premarital sexual activity was sufficiently rare so that excluding never-married women would not bias calculations based on pregnancies. Assuming that the latter is generally true, we also can assume that the ever-married and all women samples are generally comparable.
The numbers of women of reproductive age (15-49) in 2005 and the annual number of births in 2005-2010 in each country come from the World Population Prospects 2010 revision (UNPD 2011). Data on the number of induced abortions per year were harder to come by and are likely to be less reliable. The TransMONEE database collects information on public-sector abortions reported by the government of many former Soviet countries, and is used when available (TransMONEE 2011). Estimates for Vietnam are also based on government public-sector reports, as reported by the Guttmacher Institute (Teerawichitchainan and Amin 2010). The number of abortions in Turkey is based on survey data,
2 Ethiopia 2005 collected the expanded calendar, but was excluded due to issues with converting from Ethiopia’s
13-month calendar to a 12-month Gregorian calendar. More recent surveys have been conducted in Bangladesh, the Dominican Republic, Kenya, the Philippines, and Tanzania, but these surveys did not include the expanded calendar. Although we acknowledge that contraceptive failure and unintended pregnancy may have changed since these surveys were conducted, we discuss all results in the present tense for simplicity. 3 Data from cycles 1-5 of the Peru Continuous Survey.
5
estimated by Sedgh and colleagues (2007a). Issues with abortion data are noted below and in the limitations section.
<Table 1 about here>
Methods
We link information from the calendar on whether each pregnancy was the result of failure with information on the wantedness of each resulting live birth, which is taken from the question “At the time that you became pregnant with [NAME OF CHILD], did you want to become pregnant then, did you want to wait until later, or did you not want to have any (more) children at all?” Questions were asked separately for each child born in the five years4 preceding the survey. Births that were wanted later at time of conception are described as mistimed, and those not wanted at all are considered unwanted. In the tables below, these two groups, mistimed and unwanted, are grouped together under the heading “unintended.” Although it is more accurate to refer to these as “births resulting from unintended pregnancies,” because the wantedness question is asked retrospectively about the time of conception, we use the term “unintended births” for the sake of brevity. Births for which wantedness status was missing (well under one percent of the sample in all surveys) are excluded from analyses.
Abortions are analyzed separately. In countries where abortion is legal and widely available (and thus induced abortions are more likely to be reported), complete pregnancy histories were collected, with detailed questions asking whether each pregnancy ended in an induced abortion, miscarriage, stillbirth, or live birth. Information obtained during this section of the interview is then transferred to the calendar.5 Countries that collected information on abortion are marked in Table 1. In countries with abortion data, calendar data are used to determine whether each pregnancy that ended in abortion resulted from contraceptive failure. In the rest of the surveys, data were not collected to determine whether non-live births were the result of induced abortions, stillbirths, or miscarriages. Because we are unable to determine whether non-live births represent induced abortions vs. stillbirths or miscarriages, we do not analyze pregnancy outcomes other than live births in surveys without induced abortion data. Throughout this paper, the term “abortion” is used only to refer to induced abortions.
In analyzing abortions, we recognize that even in countries where abortion is legal and data were collected, abortions still are likely to be underreported (Sedgh et al. 2007c). While this is a clear limitation to our analysis (discussed further in the limitations section), we could find no evidence to suggest that abortions that resulted from contraceptive failure are more likely– or less likely–to be reported than abortions resulting from non-use of contraception. If both types of abortions are equally likely to be under-reported, our estimates of the percentages of abortions resulting from contraceptive failure are unlikely to be affected.
Full details on the period of observation and life table calculations are included in the Methodological Appendix. Briefly, the period of observation is 9-56 months prior to the survey: four years of data, moved back 9 months in order to exclude current pregnancies. Reporting on the wantedness status of
4 For Vietnam, the data and analysis are limited to children born in the three years preceding the survey.
5 Turkey used a different data collection procedure: a birth history rather than a pregnancy history was used, and
information about pregnancies that did not result in a live birth was collected only when filling in the calendar (Hacettepe University Institute of Population Studies 2003).

6
current pregnancies and live births are not comparable, as shown elsewhere (see Joyce et al. 2002 and Appendix Tables 1 and 2). Women are more likely to report that a current pregnancy, rather than a birth that occurred in the past, is unintended. To ensure that we are making the most accurate comparisons possible (i.e., not showing higher rates of unintended pregnancy because women in higher-fertility countries are more likely to be pregnant at the time of survey than women in lower-fertility countries) we have eliminated current pregnancies from our analysis. All analyses use this four-year period of observation unless otherwise noted.
Contraceptive failure rates are calculated using a life table approach for competing risks or multiple decrements. Thus, it is taken into account that the observed failure rates are affected by rates of discontinuation for other reasons, such as side effects, or in order to become pregnant. Twelve-month failure rates, or the probability of a woman becoming pregnant during the first year of contraceptive use, are shown for each method, as well as by the following method groups:
Traditional methods: periodic abstinence, withdrawal, and folk methods;
Short-term modern methods: pills, injectables, condoms (male or female), lactational amenorrhea method (LAM), and vaginal barrier methods and spermicides;
Long-acting reversible methods: IUDs and implants; and
Permanent methods: female and male sterilization.
The distribution of contraceptive methods within each method group is country-specific. For example, within the traditional method group, the failure rate is mostly made up of episodes of withdrawal in Turkey, in which withdrawal makes up 95 percent of traditional method use. In Peru, however, the traditional method failure rate more strongly reflects periodic abstinence, which makes up 73 percent of traditional method use.
To estimate the potential impact that shifting women to more effective methods of contraception in line with their fertility goals would have on levels of unintended births and abortions, more complex multiple-decrement life tables were used. All episodes of contraceptive use during the period of observation were categorized according to whether or not the episode was reported to end in contraceptive failure. Contraceptive failures were then further categorized according to the outcome of the resulting pregnancy–whether it resulted in a live birth that was wanted, mistimed, or resulted in a non-live birth (miscarriage, abortion, or stillbirth). Failures that ended in mistimed births were assumed to represent spacing failures, and births that were not wanted at all were treated as limiting failures. In countries with abortion data, additional categories were added to include failures ending in a mistimed or unwanted abortion. Because women were not asked about the wantedness of induced abortions, a more complex algorithm (described in the Methodological Appendix) was used to determine whether abortions represented spacing or limiting failures.
These outcomes were then used as competing risks in multiple-decrement life tables to estimate the probability of each type of failure, taking into account that many episodes of contraceptive use were ongoing at the point of censoring (9 months prior to the survey). Life tables were calculated for each of the above method groups, using the country-specific method mix within each method group to estimate the probability that use of each method type would end in an unintended birth or, in a subset of countries, an induced abortion. These probabilities were then used to hypothetically “switch” all episodes of less effective methods to progressively more effective methods, and to estimate the numbers of unintended births and induced abortions that would occur under alternative method mix

7
scenarios over a one-year period. Because failure rates, particularly for less-effective contraceptive methods, are highest in the first few months of use, we were concerned that using 12-month failure rates would overestimate the potential reductions in failure that could be achieved in a one-year time frame. Instead, we used averaged 12-month failure rates over a 3-year horizon (36-month rates÷3). In some countries, there were not enough episodes of each type of contraceptive method use/failure to provide reliable life table estimates, and country data were pooled together according to the procedure described in the Methodological Appendix. In all scenarios, the proportion of women who are not using contraception and the resulting rate of unintended births (and abortions, where applicable) in each country are held constant. That is, no non-users are assumed to begin using a contraceptive method.
Although we simulate four different scenarios under which women hypothetically switch methods, we emphasize that in real programs, all contraceptive methods should be presented as options. No woman should ever be put in a position where a contraceptive method is chosen for her. Far from proscribing which methods women should use, this paper aims to provide estimates of what could occur if more effective methods were made available, and women chose to use them—as research has suggested is likely with improved provision of effective methods.
Results
Table 2 gives an overview of the wantedness status of births and levels of pregnancy termination. Among all live births that occurred in the four-year period of observation, between 14 and 56 percent either were unintended—that is, not wanted at all or not wanted at the time they were conceived. In Kenya, Malawi, Zimbabwe, the Philippines, Turkey, Colombia, the Dominican Republic, and Peru, one-third or more of all births were unintended. In Colombia and Peru, less than half of all live births were wanted at the time they were conceived. In the majority of countries, slightly larger percentages of births were mistimed than unwanted at all.
<Table 2 about here>
In Table 2, the pregnancy termination column shows the percentage of all completed pregnancies (pregnancies that resulted in a live birth, or were terminated by induced abortion, miscarriage, or stillbirth, excluding ongoing pregnancies). In most countries, data are not available to determine which terminations represent induced abortions, but the data show a clear pattern of higher levels of termination in countries with legal and widely available abortion (Vietnam and most European and Eurasian countries) compared with countries where induced abortion is highly restricted, as in Kenya and Malawi, where abortion is legal only to save the life of the mother (Biddlecom 2008; Munthali, Chimbiri, and Zulu 2004). The percentage of pregnancies that were terminated varies from 8 percent or less in the sub-Saharan African countries to more than 50 percent in Armenia and Azerbaijan. In countries with abortion data, the vast majority of terminations are the result of induced abortion.
<Figure 1 about here>
Figure 1 demonstrates the percentage of live births that were unintended compared with the percentage of pregnancies that were terminated. In countries with low levels of pregnancy termination, the percentage of unintended live births is generally higher, a pattern particularly pronounced in the sub-Saharan African and Latin American and Caribbean countries. In countries with high levels of pregnancy terminations–particularly Armenia, Azerbaijan, Moldova, and Ukraine–the level of

8
unintended births is much lower, a finding highlighting that in these countries unintended pregnancies are more likely to result in an abortion than in a live birth.
Table 3 examines the percentage of births that were the result of contraceptive failure, across the different categories of wantedness. Between 1 and 7 percent of reportedly wanted births resulted from contraceptive failure. This finding is consistent with previous studies that have found substantial proportions of contraceptive failures to end in reportedly wanted births (Trussell, Vaughn, and Stanford 1999; Cleland and Ali 2004). The percentage of unintended births resulting from contraceptive failure varies widely across countries, from 5 percent in Malawi to 58 percent in Morocco. Between 7 and 59 percent of births that were mistimed, and 3 to 59 percent of births that were unwanted, were the result of contraceptive failure. While there are considerable differences across countries, the percentages of mistimed and unwanted births that resulted from contraceptive failure are generally quite similar within a country.
<Table 3 about here>
Similar to the pattern seen in Table 2, the percentages of pregnancy terminations that result from contraceptive failure also vary dramatically between countries where abortion is restricted (2-10 percent in the sub-Saharan African countries) and where abortion is widely available (34-53 percent in Vietnam and the European and Eurasian countries). In countries with abortion data, the percentages of induced abortions that resulted from contraceptive failure are even higher, at 36-65 percent. That is, between one and two out of every three induced abortions result from failed contraceptive use.
The proportion of unintended births and abortions in a country that are due to contraceptive failure is related both to the total level of contraceptive use in that country and to the contraceptive method mix–whether women are using methods with high or low failure rates. To put in context the levels of unintended births and abortions resulting from failure, Table 4 shows contraceptive prevalence rates (CPR), Figure 2 shows method mix; and Table 5 and Table 6 show contraceptive failure rates.
<Table 4 about here>
Countries in which many women are not using contraception have low levels of unintended births due to contraceptive failure. This can be seen clearly comparing Table 3 with Table 4, which shows the contraceptive prevalence rate (CPR), total and by method. The proportion of unintended births due to failure is lowest in Kenya, Malawi, and Tanzania (5 to 13 percent, Table 3). These three countries also have the lowest levels of contraceptive use, with less than 30 percent of women currently using a contraceptive method (Table 4). It is therefore no surprise that in these countries the majority of unintended births–up to 95 percent–result from non-use rather than from contraceptive failure.
The proportion of unintended births resulting from contraceptive failure is also a result of the proportion of women who are using each type of method. Figure 2 shows the distribution of methods among current contraceptive users. This distribution explains why, for example, despite India’s relatively high CPR of 44 percent, only 11 percent of unintended births result from contraceptive failure. As Figure 2 shows, more than two-thirds of contraceptive use in India is sterilization, which has a failure rate of almost zero. Conversely, most of the European and Eurasian countries have very high levels of unintended births and abortions resulting from failure, despite contraceptive prevalence of 32 to 68 percent. This is because in every one of these countries more than half of the CPR is made up of either

9
traditional contraceptive methods or less-effective short-term methods such as condoms and spermicides, all of which have relatively high failure rates.
<Figure 2 about here>
Table 5 shows 12-month failure rates, or the percentage of women using a method who discontinued due to contraceptive failure within the first year of use, by method. Failure rates are fairly low for short-term hormonal methods (2.2 to 8.4 percent for pills, 0.3 to 5.1 percent for injectables) and very low for long-acting and permanent methods (0 to 2.3 percent for IUDs, 0.1 percent for implant use6, 0 to 0.1 percent for sterilization). Condom failure rates are higher, at 1.8 to 9.8 percent, as are rates for other modern methods (diaphragm, spermicides, and female condoms), from 3.5 percent in Peru to 17.2 percent in Turkey. Traditional method failure rates are highest, up to 19 percent for periodic abstinence and 22 percent for withdrawal.
<Tables 5 and 6 about here>
Table 6 shows failure rates by method type. Permanent methods are clearly most effective, at almost zero, followed by long-acting methods (IUD and implant), from zero to 1.8 percent. Short-term modern methods, which include methods not shown separately in the prior table because there were not enough episodes to calculate failure rates by specific method (e.g., injectables in Vietnam, Armenia, Azerbaijan, Moldova and Turkey, and condoms in Egypt), are next in terms of effectiveness, with an average 12-month failure rate of 4.6 percent across countries. Traditional methods are much less effective, with failure rates up to 22 percent, showing that as many as 2 in every 10 women using traditional methods became pregnant within the first year of use.
The all-method failure rate is heavily influenced by the method mix in each country. The failure rate for all methods combined is over 14 percent in Armenia and Azerbaijan, where withdrawal is used by over half of contraceptive users; and less than 3 percent in Egypt, Indonesia, and Zimbabwe, where over 90 percent of contraceptives used are modern methods.
Twelve-month failure rates are the most common measure of contraceptive failure, but with several years of calendar data it is possible to calculate the cumulative failure rate for up to four years. The proportion of women whose contraception failed, by each month of contraceptive use, is shown in Figure 3 and Figure 4.
<Figures 3 and 4 about here>
Contraceptive failure is most common in the first several months, as noted by Curtis and Blanc (1997), representing either high fecundity or contraceptive users making mistakes as they begin to use a new method. In both Figure 3 and Figure 4, the slope becomes less steep over time, as these initial failures become less common. Because failure rates are higher in the first year of use than in the second or third year, we average failure rates across three years of use (data not shown; please see Methodological Appendix) to more realistically estimate levels of failure that could be achieved under the different method mix scenarios that are shown in Tables 9 through 12.
<Table 7 about here>
6 Only two countries, Indonesia and Egypt, had enough episodes of implant use to produce estimates.
10
Table 7 compares the percentage of all births that were mistimed, unwanted, or unintended, and the percentage that were due to contraceptive failure. The percentage due to failure can also be interpreted as the percentage-point reduction in mistimed, unwanted, or unintended births that would be found in the absence of failure (assuming that all other factors remained the same–an assumption that we note has some limitations).
If contraceptive failure were eliminated, we estimate that unintended births would drop by between 2 and 24 percentage points. The difference is largest in Peru, which has the highest level of unintended births, at 56 percent. In the absence of failure, mistimed births would decrease by between 1 and 13 percentage points, and unwanted births would decrease by up to 11 percentage points. This translates into unwanted births being cut in half in Morocco, Armenia, Turkey and Ukraine, and cut by more than one-third in Bangladesh, Vietnam, Jordan, Moldova, Colombia, and Peru.
<Table 8 about here>
In Table 8 we apply the same methodology from Table 7 to abortion, using the surveys that collected the necessary data. The percentage of abortions that resulted from contraceptive failure ranges from 7 to 23 percent. In every one of these countries, more than one-third of abortions could be avoided if contraceptive failure were eliminated. In the absence of failure, in Vietnam and Ukraine the abortion rate would be cut by more than half, and in Turkey the abortion rate would be cut by two-thirds.
As mentioned above, the proportions of unintended births and abortions that are due to failure are influenced by the proportion of women who are using contraception and what methods they are using. Figures 5 shows which method women were using (if any) when they became pregnant with what became an unintended birth. The majority of women in most countries were not using any method when they became pregnant, despite stating in the survey they did not want to become pregnant at the time that they conceived. In Morocco, Armenia, Turkey, and Ukraine, more than 50 percent of women were using contraception when they became pregnant. In most countries with high levels of unintended births resulting from failure, the bulk of failures–up to 83 percent in Armenia (data not shown)–were from traditional methods. Short-term modern methods account for the majority of failures in Morocco, where the contraceptive pill is the dominant contraceptive method, representing 64 percent of the CPR. Very few failures resulted from long-acting or permanent methods of contraception, both because these methods have such low failure rates, and because they are not widely used in most countries compared with traditional and short-term methods. Small exceptions are seen in Vietnam and Egypt, where IUDs are widely used.
<Figures 5 and 6 about here>
In all countries with abortion data, the vast majority of abortions that are due to contraceptive failure resulted from traditional methods (Figure 6). In Vietnam, where the IUD is the most common method, a small proportion of failures that ended in abortion were from long-acting methods. Less than 10 percent of abortions in Armenia and Azerbaijan resulted from the use of a non-traditional method. The majority of abortions in every country except Azerbaijan resulted from contraceptive failure, rather than from non-use.
Results thus far have shown that a large proportion of unintended births and induced abortions could be averted if contraceptive failure were eliminated. In reality, it is nearly impossible to eliminate failures

11
completely, but contraceptive failure could be substantially reduced if women used more effective methods of contraception.
In Tables 9 through 12, we present four hypothetical scenarios that shift the contraceptive method mix in each country to more effective methods of contraception in order for women and couples to effectively meet their fertility intentions:
1. All traditional method users switch to a short-term modern method, according to the short-term modern method mix in each country as described above.
2. Women using contraception for birth spacing switch to a short-term modern method,7 and women using contraception for limiting births switch to a long-acting modern method, according to the short-term modern and long-acting method mix in the country or region.
3. All non-long-acting and permanent method users switch to a reversible long-acting method of contraception.
4. All spacers switch to a long-acting method, while all limiters switch to a permanent method.
In all four scenarios, the proportion of unintended births and abortions due to non-use is held constant. We use these scenarios to estimate the percentages and numbers of unintended births and abortions that could be avoided if women used more effective methods of contraception appropriate for their fertility intentions.
<Tables 9 and 10 about here>
As Table 9 shows, Scenario 1 could prevent up to one quarter of unintended births. The potential impact is largest in countries where traditional methods make up more than 25 percent of all contraceptive use and traditional method failure rates are high: the Philippines, Vietnam, Jordan, the European and Eurasian countries, and Peru. Because traditional method use is limited, fewer than 3 percent of unintended births in Malawi, Zimbabwe, Indonesia, and Egypt would be averted under this scenario. Scenario 2 could prevent more than one third of unintended births in Armenia, Turkey, Ukraine and Peru, along with more than one quarter of unintended births in Morocco and Moldova. Scenario 3 could decrease unintended births by more than 25 percent in half of the countries analyzed, and avert more than one third of unintended births in Morocco, Armenia, Moldova, Turkey, Ukraine, and Peru. Scenario 4 would prevent more than 40 percent of unintended births in six of the countries studied, and more than half of unintended births in Morocco, Turkey, and Ukraine. The impact of these scenarios is limited in countries with very low levels of contraceptive use and high levels of unintended births resulting from non-use, including Malawi and Tanzania, and to a lesser extent, Kenya.
Table 10 converts these percentages into estimated numbers of unintended births that could be prevented per year if the method mix were altered according to the four scenarios described above, rounded to the nearest thousand. Table 10 is calculated by multiplying the annual number of births in each country (UNPD 2011) by the percentage of births that are unintended, shown earlier in this paper.
Using this methodology, we estimate that approximately 5.5 million unintended births occur in India each year, along with roughly one million unintended births each in the Philippines, Bangladesh, and
7 Women who are already using a modern method for spacing, and women who are already using a long-acting
method for limiting do not switch methods.
12
Indonesia, while roughly half a million occur in Kenya, Turkey, and Colombia. Fewer than 10,000 births resulting from unintended pregnancy occur in Armenia and Moldova–although more than 10,000 abortions occur each year in these countries, as shown below.
The potential number of unintended births that could be averted by switching methods depends on the total number of unintended births, the proportion due to failure, and the current contraceptive method mix. In India, where the vast majority of contraceptives used are already highly effective, only a small proportion of failures could be averted by switching methods. But because of the very large annual number of unintended births, up to 302,000 unintended births could be prevented by switching from traditional to modern methods (Scenario 1). This scenario could also prevent approximately 100,000 unintended births per year per country in the Philippines, Turkey, and Peru. Compared to Scenario 1, Scenario 2 could prevent roughly five times more unintended births in Zimbabwe and Egypt, and more than double the number of unintended births in Bangladesh, Indonesia, Morocco, and Colombia, every year. Shifting from Scenario 2 to Scenario 3 again doubles the number of unintended births averted in Indonesia and the Dominican Republic, and triples the number in Zimbabwe.
If all women used the most effective contraceptive method for their fertility intentions (Scenario 4), the number of unintended births prevented would range from 4,000 to 500,000. In India alone, half a million unintended births could be averted every year. These numbers represent a decrease of over 20 percent in the total annual number of births in Peru, and decreases of more than 15 percent in Morocco, Turkey, and Colombia. Clearly, alterations in the method mix among women already using contraception could result not only in significant decreases in the numbers of unintended births, but also could substantially reduce fertility rates.
<Tables 11 and 12 about here>
Table 11 applies these same scenarios to reported abortions. Scenario 1 could reduce abortions by up to one-third. The smallest decrease would be in Azerbaijan, which could still experience a 16 percent decrease in abortions if all women used modern contraceptive methods. As almost 60 percent of Azerbaijan’s abortions are due to non-use of contraception, we expect that the impact of altering Azerbaijan’s method mix would be less than in countries where the majority of abortions are due to contraceptive failure.
More than one-quarter of abortions in every country studied could be prevented under Scenario 2. If all contraceptive users switched to long-acting reversible methods (Scenario 3), half of all abortions in Vietnam and Turkey would be prevented, along with more than 40 percent of abortions in Armenia, Moldova, and Ukraine. If all women already using contraception switched to the most effective method to meet their fertility desires (Scenario 4), this would prevent more than one-third of abortions in Armenia, Azerbaijan, and Moldova, and more than half of all abortions in Vietnam, Turkey, and Ukraine from ever taking place.
Although there is some uncertainty around estimates of the annual number of induced abortions, Table 12 demonstrates that substantial numbers could be prevented with the use of more effective contraception. Under Scenario 1, 178,000 abortions per year could be prevented in Vietnam, along with 38,000 abortions in Turkey, and 40,000 in Ukraine. Under Scenario 2, 200,000 abortions could be prevented each year in Vietnam, roughly 50,000 in Turkey and Ukraine, and 5,000 in Armenia, Azerbaijan, and Moldova. And if all women switched to the most effective method appropriate for their
13
fertility intentions, more than 300,000 abortions per year could be averted in Vietnam, along with more than 100,000 in Ukraine, and 80,000 in Turkey.
Limitations
There are several limitations that should be considered when interpreting results from this study. The first involves the underreporting of abortions. Levels of abortion reported in surveys generally are lower than the government’s official figures from clinic data (TransMONEE 2011). As noted by Sedgh et al. (2007a), official government statistics are likely to vastly underestimate abortions, particularly in countries where a growing number of abortions are taking place in the private sector and so are not included in government figures, as in Vietnam. Underreporting may particularly be an issue in Turkey, for several reasons. First, the use of abortion as a method of fertility regulation was widely accepted in the former Soviet countries, but there is likely to be greater stigma surrounding abortion in Turkey. Second, in all countries in this study with abortion data except Turkey, the data on abortions were collected using a pregnancy history in the DHS that was specifically designed to minimize the omission of abortions. In Turkey, instead of a pregnancy history, data on abortions were only collected in the DHS calendar (Hacettepe University Institute of Population Studies 2003). Finally, the number of abortions in Turkey shown in Table 12 is estimated from survey data (Sedgh et al. 2007a) based only on ever-married women age 15-44, and may also be an underestimate.
In Vietnam, which also only interviewed ever-married women in the DHS, the survey report contains a cautionary note that abortions are likely to be highly underreported, in part because 10 percent of abortions are estimated to occur among never-married women, who were not included in the survey (Committee for Population, Family and Children [Vietnam] and ORC Macro 2003). Although we use the highest quality data available, it is clear that the quality of abortion data is not very high. There is every indication, however, that to the extent that the data are biased, they are underestimates of induced abortions. It is therefore likely that our estimates of the impact of improved contraceptive method mix scenarios underestimate their potential to reduce the numbers of induced abortions.
In terms of unintended live births, even though the DHS questions are intended to ascertain the wantedness of the pregnancy at the time the woman became pregnant, women may find it difficult to recall whether a pregnancy that happened up to five years ago was wanted at that time, especially when that pregnancy resulted in a living child. Indeed, we analyzed the reporting of wantedness of current pregnancies compared to live births and found that, in the majority of countries analyzed, women were substantially more likely to say a current pregnancy was unwanted than to say a living child was unwanted at the time they became pregnant (analyses shown in Appendix Tables 1 and 2). As noted by Cleland and Ali (2004), it is likely that some rationalization occurs after the birth, and an unknown proportion of births that are now reported as having been wanted were actually unwanted at the time of conception. Several researchers have found that live births are more likely to be reported as wanted as time passes (Marston and Cleland 2003; Koenig et al. 2006). Due to the rationalization of the wantedness of live births, along with underreporting of non-live births, this analysis likely underestimates levels of unintended pregnancy.
Many researchers have remarked on the limitations of a retrospective three-category survey question to fully assess women’s feelings about the wantedness of pregnancies (see, for example, Trussell, Vaughn, and Stanford 1999; Joyce et al. 2002; Marston and Cleland 2003; and Gipson, Koenig, and Hindin 2008). The data used in our study do not allow measurement of complex concepts such as ambivalence or the intensity with which a pregnancy was unintended. Although the categorization of births as wanted,

14
mistimed, or unwanted is imprecise, these measures have been demonstrated elsewhere to be generally well understood by women (Marston and Cleland 2003), and useful analytically (Singh, Sedgh, and Hussain 2010). If imprecision in the measurement of wantedness biases our analyses, it is not clear whether the bias would result in underestimation of unintended births or in overestimation. While we note that the determination of the wantedness of births in DHS data may oversimplify a complex concept, the measure is widely used and, we believe, is useful despite its limitations.
We examined the possibility that contraceptive failure may be underreported, as this could substantially bias our analysis. Particularly if women are embarrassed about having become pregnant while using contraception, women may report in the DHS calendar a different reason for discontinuation of contraceptive use, other than “became pregnant while using.” To assess potential levels of underreporting of contraceptive failure, we examined the distribution of unintended births and induced abortions by the method used (or non-use) in the month prior to pregnancy (results summarized in Figures 5 and 6). If a contraceptive method was used, we examined the reason given for discontinuation (detailed analyses not shown). The vast majority of episodes of contraceptive use that ended in an unintended pregnancy were reported to have been failures. Only about 4 percent (the average across all surveys) of episodes of contraception that ended in the month preceding an unintended pregnancy were reported to have been discontinued for reasons other than failure. The other reasons given were primarily “wanted to become pregnant” and “side effects,” both of which seem plausible. We therefore believe that, if failure is indeed underreported, it has little effect on the results in this analysis.
In this paper we have estimated the reductions in unintended births that could occur if more effective contraceptive methods were made available and women and couples choose to use them. Although there is evidence to suggest that women choose more effective methods when they are readily available (Secura et al. 2010; Rose, Lawton and Brown 2010; Neukom et al. 2011), we recognize that these scenarios may not be easily achieved in every setting. For example, in our analysis the impact of all women switching to modern methods is largest as a percentage in Peru, a predominantly Catholic country with a long, complicated relationship with modern contraception (Caceres, Cueto, and Palomino 2008). Due in part to the complex history of entanglement between the Church, political institutions, and contraception, modern methods–particularly sterilization, which was promoted with prevalence targets in the mid-1990s–may not be acceptable to all women. If large proportions of traditional method users do not want to use modern methods for religious and other cultural reasons, we acknowledge that the simulated reductions in unintended births estimated in this paper would be difficult to achieve.
At the same time, we also note that in Peru the consequences of unintended births are particularly grave. In a study of five developing countries, including Peru, Marston and Cleland (2003) found that unintended pregnancies carried to term were significantly less likely to have received adequate antenatal care, been delivered by trained personnel, or received complete basic vaccinations by 12 months, and were significantly more likely to be stunted compared with wanted births, and controlling for parity and other maternal and household characteristics. Peru was the only one of the five countries studied in which unintended births were consistently disadvantaged on every outcome after controlling for other factors. The authors hypothesize that the consistency and magnitude of the relationship between unintended pregnancy and negative health outcomes for children may be related to Peru’s high levels of contraceptive failure. Other research has also linked issues with modern contraceptive use in Peru to periods of low family planning program effort and/or poorly implemented policies, and recommending how to improve contraceptive access and the quality of family planning services (Kost 1993; Mensch et al. 1997; Gribble, Sharma, and Menotti 2007). So while we acknowledge that decreasing contraceptive failure may not be easy, we also highlight that steps could be taken to make

15
more effective methods available while respecting women’s autonomy and freedom of choice, and that failing to do so may have serious health consequences today and for future generations.
Discussion and Conclusions
Unintended pregnancy is a common problem for women and families in low- and middle-income countries. On average across the 20 countries studied, 34 percent of all pregnancies in the four-year period of observation ended in either an unintended live birth or an induced abortion8. In the six countries with induced abortion data, an average of 32 percent of all pregnancies ended in induced abortion. These results from countries representing sub-Saharan Africa, Asia, the Middle East, Europe and Eurasia, and Latin America and the Caribbean are generally similar to levels in high-income countries. Half of pregnancies in the US, and one third of pregnancies in the UK and France, are unintended (K. Black et al. 2010), percentages that are in line with the findings of our study. Twenty percent of all pregnancies in the US are estimated to end in abortion (Finer and Henshaw 2006), which is lower than the figures in our study, although the countries in our study with abortion data represent a slightly skewed sample, with higher-than-average abortion rates (Sedgh et al. 2007a).
Using contraception clearly indicates that a woman does not want to become pregnant. Yet every year millions of women become pregnant while using contraception. On average across the countries in our study, we found that one of every three unintended births resulted from contraceptive failure. In four countries, more than half of unintended births were conceived while the women were using contraception. The impact of contraceptive failure on levels of induced abortion is even greater. In the six countries with available data, an average of 53 percent of abortions were the result of contraceptive failure. The contribution of contraceptive failure to unintended pregnancies is lower than that in the US and France (50 and 65 percent, respectively; K. Black et al. 2010), but the contribution of contraceptive failure to abortion is almost identical to the 54 percent in the US (Finer and Henshaw 2006).
In most countries studied, the majority of contraceptive failures resulting in an unintended birth or induced abortion occurred while women were using traditional methods. We estimate that, if traditional method users switched to short-term modern methods, an average of 10 percent of unintended births and 22 percent of induced abortions could be prevented. Even a greater percentage of unplanned pregnancies could be prevented by using more effective, longer-acting reversible methods. If all women were using these methods, one-quarter of unintended births and nearly half of induced abortions could be prevented. In addition, making permanent methods available for women who want no more children could avert up to 54 percent of unintended births and 59 percent of induced abortions, according to our estimates.
Beyond demonstrating the benefits of providing more effective contraceptive methods, data from our study also point to an alternative strategy for reducing the impact of contraceptive failure: reducing failure rates for the methods that women already are using. In most countries, traditional methods have one-year failure rates in the double digits, resulting in many thousands of unintended births and induced abortions every year in every country. However, in some countries, including Indonesia and Zimbabwe, traditional methods are only slightly less effective than short-acting modern methods, with 4 and 5 percent of users becoming pregnant in the first year, respectively. This range demonstrates that these methods could be used more effectively, perhaps if women received better information and counseling
8 Unweighted average across all countries. Calculated as the number of unintended live births+induced abortions
(where data are available)÷total number of pregnancies.

16
about how to use their method correctly and consistently. Improvements in the use of traditional methods, for example using the Standard Days Method for periodic abstinence, can dramatically decrease failures of these contraceptive methods (Arevalo, Jennings, and Sinai 2002).
Several studies suggest that, when up-to-date information is presented and long-acting and permanent methods are made available with reduced up-front costs, many women prefer them to other methods of contraception (Secura et al. 2010; Rose, Lawton, and Brown 2010; Neukom et al. 2011). Long-acting and permanent methods are also more cost-effective to provide than short-term modern methods (Mavranezouli 2009; Blumenthal, Voedisch, and Gemzell-Danielsson 2011; Lakha and Glasier 2006), an advantage that should be a convincing argument for governments and donors that subsidize contraception.
This paper provides evidence from 20 countries that long-acting and permanent methods, if widely used, can substantially reduce the number of unintended births and induced abortions, and can decrease levels of unwanted population growth. Acting on this evidence will require investments in improving the quality and extending the coverage of family planning programs. As noted by Singh and colleagues (2010), strategies to reduce the numbers of unintended pregnancies are likely to require increased allocation of resources to family planning programs. Despite the financial costs of investment in family planning, the financial and physical consequences of unintended pregnancy make program efforts to decrease unintended pregnancy quite cost effective.
More than a decade ago, Jain (1999) argued that family planning programs should emphasize reducing unintended pregnancies among women who are already using contraception, rather than focusing exclusively on fulfilling unmet need among women who are not using contraception. Our research validates his argument, demonstrating that the impact of contraceptive failure on unintended pregnancy is far from minimal, and that hundreds of thousands of unintended births could be averted annually with the provision of more effective contraception. By decreasing contraceptive failure, concomitant reductions could also be achieved in maternal mortality, child malnutrition, and infant and child mortality (Gipson, Koenig, and Hindin 2008; WHO 2006, 2007, and 2010). Effective contraception can go a long way toward averting unintended births and induced abortions, and can help families and countries achieve their health goals.
17
Methodological Appendix
Period of observation
The calendar, in which data on failure and other types of contraceptive discontinuation are collected, is designed to cover a complete five-year period, beginning in January five or six years prior to the survey. On average, about five and a half years of data are collected, and the precise length is longer for some women, depending on their month of interview. Failure rates and rates for other types of contraceptive discontinuation are usually censored at 3 months prior to interview, in order to give women whose pregnancies are in the first trimester time to recognize that they are pregnant, making the period of observation 3-62 months prior to interview (ICF International 2011). However, in this analysis we wish to exclude pregnancies that were ongoing at the date of interview, and so censor the data earlier, at 9 months prior to interview.
Pregnancies that are ongoing at the date of interview are excluded because women’s reporting on the wantedness of current pregnancies is not comparable to their reporting on the wantedness of live births. For example, Joyce and colleagues (2002) examined data from women who were interviewed about the wantedness of pregnancies during their pregnancy and again after the child was born. Twenty-nine percent of women who reported the pregnancy to be unintended during gestation reported that the child was intended after delivery (a much smaller percentage of women reported that the pregnancy was intended but changed their reporting to unintended after delivery; the rest gave consistent reporting). We analyzed the reporting of wantedness of current pregnancies compared to live births with our cross-sectional data and found similar results: in the majority of countries analyzed, women were substantially more likely to report that a current pregnancy was unwanted than to say that a living child was unwanted at the time they became pregnant (analyses shown in Appendix Tables 1 and 2). Additionally, if we treated current pregnancies as equivalent to live births in terms of wantedness status, we would run the risk of overestimating unintended pregnancies and underestimating abortions, because ongoing pregnancies are still at risk of being terminated. To avoid confusing the issues of fertility and unintendedness–that is, avoiding higher reports of unintendedness in higher-fertility countries where women are more likely to be pregnant at the time of interview, compared to lower-fertility countries where fewer women will be currently pregnant–we have eliminated current pregnancies from our analysis.
Information about the wantedness status of live births at the time of conception was collected for births that occurred in the five years prior to the survey (0-59 months, where month 0 is the month of interview). As a consequence of censoring the most recent 9 months, however, the reference period is reduced. We cannot move the period of observation back in time to include a full five years, because data on wantedness was only collected for births in the last 59 months. We therefore use a four-year period of observation for all analyses (except where noted), extending from 9 to 56 months preceding the survey. All pregnancies therefore end in a live birth or a termination during the period of observation,9 and we can determine whether or not each pregnancy resulted from contraceptive failure. We refer to this period as the four-year period of observation. Results shown in this paper will vary slightly from failure rates shown in DHS final reports, which use a 3-62 month reference period, and will differ from birth-based tables, which generally use a five-year (0-59 months) reference period.
9 Very few pregnancies were reported to last more than 9 months. The following unweighted numbers of ongoing
pregnancies that were reported to last 10 months were excluded from analysis: 1 in Kenya, 3 in Malawi, 1 in Tanzania, 2 in Bangladesh, 56 in India, 2 in Armenia, and 1 in Azerbaijan.
18
Failure rate calculation
Contraceptive failure rates are calculated using a life table approach for competing risks or multiple decrements. These observed failure rates are affected by rates of discontinuation for other reasons, such as side effects, or in order to become pregnant. Unobserved, or associated single decrement, rates are sometimes used for multi-country comparisons because they are unaffected by, or independent of, discontinuations for other reasons (Farley, Ali, and Slaymaker 2001; Curtis and Hammerslough 1995). We use multiple decrement estimates instead, because these failure rates are most reflective of women’s actual experiences of contraceptive use, during which women are simultaneously at risk of experiencing failure, discontinuing due to side effects, discontinuing in order to become pregnant, etc. We choose to sacrifice some comparability across countries due to cross-country differences in the proportion of women who discontinued for reasons other than failure, in order to provide estimates of failure rates as they actually occurred in each country.
Episodes of contraceptive use that were ongoing at the end of the period of observation (9 months prior to interview), or right-censored, are included in analysis. Episodes that are left-censored, or were ongoing when the period of observation began (56 months prior to interview), are included in analysis, as long as the start of the episode was recorded within the calendar. Such episodes are included as late entries into the life table. That is, if the episode of use began 6 months prior to the beginning of the period of observation, the episode enters into the life table at month 7. Episodes of use that started and ended before the period of observation began are excluded. Episodes that were ongoing when the calendar began are also excluded from analysis, as we do not have a start date for these episodes and so cannot determine duration. These exclusions are most likely to occur with methods that are used continuously for long periods of time, and so might be expected to bias failure rates, particularly for long-acting or permanent methods of contraception. However, the failure rates estimated from our data for long-acting and permanent methods are in line with those established in contraceptive effectiveness literature (WHO and CCP 2007).
Life-table calculations for alternative method-mix scenarios
To estimate the potential impact that shifting women to more effective methods of contraception in line with their fertility goals would have on levels of unintended birth and abortion, we use the same life table methodology as for failure rates, with several added complexities.
First, we categorized all episodes of contraceptive use according to whether or not they ended in contraceptive failure. Discontinuations for all reasons other than failure, along with censored episodes, were treated as a competing risk to failure. Second, failures were further categorized according to the resulting pregnancy outcome: live births, abortions, and miscarriages or stillbirths. Third, live births and abortions resulting from failure were additionally categorized according to whether they represented spacing or limiting failures, as described below. Miscarriages and stillbirths resulting from failure, along with all non-live birth outcomes in surveys that did not collect abortion data, were treated as an additional competing risk, without assignment to a spacing or limiting category.
Live births were coded according to whether they were reported to be wanted, mistimed, or unwanted. Live births resulting from mistimed pregnancies were assumed to represent spacing failures, and births that were not wanted at all were treated as limiting failures. Because women were not asked about the

19
wantedness of induced abortions–whether they had wanted to become pregnant later, or had not wanted that pregnancy at all–failures that resulted in abortions required a more complex algorithm to determine whether they represented spacing or limiting failures. For each abortion, we used calendar data to determine whether the abortion was followed by a live birth or another pregnancy. If the subsequent birth or pregnancy was unwanted, we classified the abortion as the result of a limiting failure. If the subsequent birth or pregnancy was mistimed or wanted, we classified the abortion as a spacing failure. If there were no subsequent births or pregnancies, we looked at the woman’s reported desire for future births, taken from the question, “Would you like to have (a/another) child [in the future], or would you prefer not to have any (more) children?” If she reported that she wanted no more children, or had been sterilized since the abortion, the abortion was considered a limiting failure. Any other abortions were considered spacing failures.10
All of these possible outcomes were then used as competing risks in multiple-decrement life tables. For each method type (traditional, short-term modern, long-acting, permanent) we estimated the rates at which use of each method type resulted in mistimed births or unwanted births for each country, and mistimed abortions or unwanted abortions in countries with available data, accounting for other pregnancy outcomes and reasons for discontinuation. Because of the length and complexity of these tables, they are not included in this report. The tables can be obtained by request from the authors.
To convert these rates into estimates of what would occur if women used more effective methods of contraception appropriate for their fertility intentions, we apply rates calculated for more effective method types to the number of episodes of less effective contraceptive use during the period of observation, under the scenarios described in the text. We use these rates to calculate the numbers of unintended births and induced abortions that would result from these episodes of contraceptive use. By comparing the number of unintended births and abortions that would occur under different contraceptive scenarios with the number that actually resulted from the current method mix, we can calculate the decrease that would be seen if episodes of less-effective method use were replaced by more-effective method use. Note that by using competing-risks estimates, these results account for the fact that other reasons for discontinuation are higher or lower with different methods. For example, even though failure rates are lower for short-term modern methods than traditional methods, rates of discontinuation due to side effects and health concerns are generally much higher, particularly for hormonal methods (Bradley, Schwandt and Khan 2009).
We do not estimate unintended births that occur after a period of non-use following a discontinuation for reasons other than failure. Although other research has found the impact on fertility of contraceptive discontinuation for such reasons as side effects and health concerns to be non-negligible (Blanc, Curtis, and Croft 2002), estimating this impact is beyond the scope of this paper.
Although these scenarios are shown over a one-year time horizon, we did not want to use 12-month failure rates, to avoid overestimating the impact of alternative method mixes. As shown in Figure 4, failure rates, particularly for traditional methods, increase most steeply in the first few months of use. By comparison, failure rates for long-acting and permanent methods increase much more slowly and increase consistently over time. If we used 12-month failure rates for our simulations, we would show a larger impact of changing methods, because 12-month failure rates are extremely high for less-effective methods, and much lower for more-effective methods. Instead, we use averaged three-year failure
10
It is possible that an abortion resulting from contraceptive failure was wanted at the time of conception but was later aborted, but we assume that this proportion is negligible.
20
rates (36-month rates), which make the estimated impact of changing methods smaller, because one-third of the gap between the failure rates at 36 months is considerably smaller than the complete gap at 12 months. We feel this approach provides more realistic estimates of the impact over a one-year period, given that not all women would necessarily begin a new method in that year.
Whenever possible, we use failure rates from one country to estimate the impact of alternative scenarios for that country. However, in some countries there were not enough episodes of each type of contraceptive method use/failure to provide reliable life table estimates. If there were fewer than 125 unweighted episodes11 of contraceptive use in the denominator for a particular method group (following DHS standards, see ICF International 2011), or fewer than 15 unweighted episodes of failure in the numerator of a failure category (such as unwanted live births), data were pooled by region. When data were pooled, in addition to the individual sampling weights used throughout this paper, the data for each country were also weighted by a constant equivalent to the number of women surveyed divided by the estimated number of women of reproductive age (UNPD 2010), to adjust for variations in sample size and population size. This pooling thus reflects the population size of each country, rather than the sample size. For example, data from Colombia are weighted more heavily than data from Peru in the pooled Latin American and the Caribbean estimates, although the surveys interviewed similar numbers of women, because the population of Colombia is much larger than that of Peru. In the rare instance where pooled regional data do not provide a large enough sample (as with long-acting reversible methods in sub-Saharan Africa), data from all surveys, not just those in a region, are pooled together.
<Appendix tables about here>
11
Equivalent to person-months in the first month of exposure, excluding late entries into the life table.
References
American College of Obstetricians and Gynecologists Committee on Gynecologic Practice; Long-Acting Reversible Contraception Working Group. 2009. ACOG Committee Opinion no. 450: Increasing use of contraceptive implants and intrauterine devices to reduce unintended pregnancy. Obstetrics and Gynecology Dec; 114(6):1434-8.
Arevalo, M., V. Jennings, and I. Sinai. 2002. Efficacy of a new method of family planning: The Standard Days Method. Contraception May; 65(5):333-8.
Bhutta, Z.A., M.Y. Yakoob, J.E. Lawn, A. Rizvi, I.K. Friberg, E. Weissman, E. Buchmann, and R.L. Goldenberg. 2011. Stillbirths: What difference can we make and at what cost? Lancet April; 377(9776): 1523-1538.
Biddlecom, A. 2008. Abortion in Kenya, In Brief: No.4. New York: Guttmacher Institute.
Black K.I., S. Gupta, A. Rassi, and A. Kubba. 2010. Why do women experience untimed pregnancies? A review of contraceptive failure rates. Best Pract Res Clin Obstetrics Gynaecology Aug; 24(4):443-55.
Black, R.E., S. Cousens, H.L. Johnson, J.E. Lawn, I. Rudan, D.G. Bassani, P. Jha, H. Campbell, C.F. Walker, R. Cibulskis, T. Eisele, L. Liu, and C. Mathers. 2010. Global, regional, and national causes of child mortality in 2008: A systematic analysis. Lancet June; 375(9730): 1969-1987.
Blanc, A.K., S.L. Curtis, and T.N. Croft. 2002. Monitoring contraceptive continuation: Links to fertility outcomes and quality of care. Studies in Family Planning 33(2):127-140.
Blumenthal, P.D., A. Voedisch, and K. Gemzell-Danielsson. 2011. Strategies to prevent unintended pregnancy: Increasing use of long-acting reversible contraception. Hum Reprod Update Jan-Feb; 17(1):121-37.
Bradley, S.E.K., H.M. Schwandt, and S. Khan. 2009. Levels, Trends, and Reasons for Contraceptive Discontinuation. DHS Analytical Studies No. 20. Calverton, Maryland, USA: ICF Macro.
Caceres, C.F., M. Cueto, and N. Palomino. 2008. Policies around sexual and reproductive health and rights in Peru: Unveiling false paradoxes. Global Public Health 3(S2):39-57.
Cleland, J. and M.M. Ali. 2004. Reproductive consequences of contraceptive failure in 19 developing countries. Obstetrics and Gynecology Aug; 104(2):314-320.
Collumbien, M., M. Gerressu, and J. Cleland. 2004. Non-use and use of ineffective methods of contraception. In Comparative Quantification of Health Risks: Global and Regional Burden of Disease Attributable to Selected Major Risk Factors, Volume 1., edited by Ezzati M., Lopez A.D., Rodgers A. and Murray C.J.L., Geneva: World Health Organization.
Committee for Population, Family and Children [Vietnam], and ORC Macro. 2003. Vietnam Demographic and Health Survey 2002. Calverton, Maryland, USA: Committee for Population, Family and Children and ORC Macro.

Curtis S.L. and C.R. Hammerslough. 1995. Model Further Analysis Plan: Contraceptive Use Dynamics. Calverton, Maryland: Macro International Inc.
Curtis, S.L. and A.K. Blanc. 1997. Determinants of contraceptive failure, switching, and discontinuation: An analysis of DHS contraceptive histories. DHS Analytical reports No. 6. Calverton, Maryland: Macro International Inc.
Espey, E. and T. Ogburn. 2011. Long-acting reversible contraceptives: Intrauterine devices and the contraceptive implant. Obstetrics and Gynecology Mar; 117(3):705-19.
Farley, T.M.M., M.M. Ali, and E. Slaymaker. 2001. Competing approaches to analysis of failure times with competing risks. Statistics in Medicine 20:3601-3610.
Finer, L.B. and S.K. Henshaw. 2006. Disparities in rates of unintended pregnancy in the United States, 1994 and 2001. Perspectives on Sexual and Reproductive Health 38(2): 90-96.
Fischer, M.A. 2008. Implanon: A new contraceptive implant. J Obstetrics Gynecology Neonatal Nurs May-Jun; 37(3):361-8.
Gipson, J.D., M.A. Koenig, and M.J. Hindin. 2008. The effects of unintended pregnancy on infant, child, parental health: A review of the literature. Studies in Family Planning 39(1):18-38.
Gribble, J.N., S. Sharma, and E.P. Menotti. 2007. Family planning policies and their impacts on the poor: Peru's experience. International Family Planning Perspectives December; 33(4).
Hacettepe University Institute of Population Studies. 2004. Turkey Demographic and Health Survey, 2003. Ankara, Turkey: Hacettepe University Institute of Population Studies, Ministry of Health General Directorate of Mother and Child Health and Family Planning, State Planning Organization and European Union.
Hubacher, D., I. Mavranezouli, E. McGinn. 2008. Unintended pregnancy in sub-Saharan Africa: Magnitude of the problem and potential role of contraceptive implants to alleviate it. Contraception 78(1):73-8.
ICF Macro. 2011. Guidelines for the MEASURE DHS Phase III Main Survey Report. Calverton, Maryland, USA: ICF Macro.
Jacobstein, R. 2007. Long-acting and permanent contraception: An international development, service delivery perspective. J Midwifery Womens Health Jul-Aug; 52(4):361-7.
Jain, A. 1999. Should eliminating unmet need for contraception continue to be a program priority? International Family Planning Perspectives 25(Supplement):S39–S43 & S49.
Joyce, T., R. Kaestner, and S. Korenman. 2002. On the validity of retrospective assessments of pregnancy intention. Demography Feb; 39(1):199-213.
Khan, S., S.E.K. Bradley, J. Fishel, and V. Mishra. 2008. Unmet Need and the Demand for Family Planning in Uganda: Further Analysis of the Uganda Demographic and Health Surveys, 1995-2006. Calverton, Maryland, USA: Macro International Inc.
Koenig, M.A., R. Acharya, S. Singh, and T.K. Roy. 2006. Do current measurement approaches underestimate levels of unwanted childbearing? Evidence from rural India. Population Studies 60(3): 243–256.
Kost, K. 1993. The dynamics of contraceptive use in Peru. Stud Fam Plann Mar-Apr; 24(2):109-19.
Ladipo, O.A. and S.A Akinso. 2005. Contraceptive implants. Afr J Reprod Health Apr; 9(1):16-23.
Lakha, F. and A.F. Glasier. 2006. Continuation rates of Implanon in the UK: Data from an observational study in a clinical setting. Contraception Oct; 74(4):287-9.
Lipetz, C., C.J. Phillips, and C.F. Fleming. 2009a. Actual cost of providing long-acting reversible contraception: A study of Implanon cost. J Fam Plann Reprod Health Care Apr; 35(2):75-9.
Lipetz, C., C.J. Phillips, and C.F. Fleming. 2009b. The cost-effectiveness of a long-acting reversible contraceptive (Implanon) relative to oral contraception in a community setting. Contraception Apr; 79(4):304-9.
Lyus, R., P. Lohr, and S. Prager. 2010. Use of the Mirena LNG-IUS and Paragard CuT380A intrauterine devices in nulliparous women. Contraception May; 81(5):367-71.
Marston, C. and J. Cleland, 2003. Do unintended pregnancies carried to term lead to adverse outcomes for mother and child? An assessment in five developing countries. Population Studies 57(1): 77-93.
Mavranezouli, I. 2009. Health economics of contraception. Best Pract Res Clin Obstetrics Gynaecology Apr; 23(2):187-98.
McDonald-Mosley, R. and A.E. Burke. 2010. Contraceptive implants. Semin Reprod Med Mar; 28(2):110-7.
Mensch, B.S., M. Arends-Kuenning, A. Jain, and M.R. Garate. 1997. Avoiding unintended pregnancy in Peru: Does the quality of family planning services matter? International Family Planning Perspectives 23(1):21-27.
Mestad, R.E., J. Kenerson, and J.F. Peipert. 2009. Reversible contraception update: The importance of long-acting reversible contraception. Postgrad Med Jul; 121(4):18-25.
Moreau, C., J. Trussell, G. Rodriguez, N. Bajos, and J. Bouyer. 2007. Contraceptive failure rates in France: Results from a population-based survey. Human Reproduction 22(9):2422-2427.
Munthali, A.C., A. Chimbiri, and E. Zulu. 2004. Adolescent Sexual and Reproductive Health in Malawi: A Synthesis of Research Evidence, Occasional Report No. 15. New York: The Alan Guttmacher Institute.
Neukom, J., J. Chilambwe, J. Mkandawire, R.K. Mbewe, and D. Hubacher. 2011. Dedicated providers of long-acting reversible contraception: New approach in Zambia. Contraception May; 83(5):447-52.

Rose, S.B., B.A. Lawton, and S.A. Brown. 2010. Uptake and adherence to long-acting reversible contraception post-abortion. Contraception Oct; 82(4):345-53.
Roudi-Fahimi, F. and A.A. Monem. 2010. Unintended pregnancies in the Middle East and North Africa. PRB Policy Brief. Washington DC: Population Reference Bureau.
Ruddick, C. 2009. Long-acting reversible contraception: Reducing unintended pregnancies. Community Pract Sep; 82(9):24-7.
Secura, G.M., J.E. Allsworth, T. Madden, J.L. Mullersman, and J.F. Peipert. 2010. The contraceptive CHOICE project: Reducing barriers to long-acting reversible contraception. Am J Obstetrics Gynecology Aug; 203(2):115.e1-7.
Sedgh, G., S.K. Henshaw, S. Singh, A. Bankole, and J. Drescher. 2007a. Legal abortion worldwide: Incidence and recent trends. International Family Planning Perspectives 33(3):106–116.
Sedgh, G., R. Hussain, A. Bankole, and S. Singh. 2007b. Women with an Unmet Need for Contraception in Developing Countries and Their Reasons for Not Using a Method. Occasional Report No. 37. New York: Guttmacher Institute.
Sedgh, G., S. Henshaw, S. Singh, E. Åhman, and I.H. Shah. 2007c. Induced abortion: Estimated rates and trends worldwide. Lancet October; 370(9595):1338-1345.
Singh, S., G. Sedgh, and R. Hussain. 2010. Unintended pregnancy: Worldwide levels, trends, and outcomes. Studies in Family Planning 41(4):241–250.
Sivin, I. 2007. Utility and drawbacks of continuous use of a copper T IUD for 20 years. Contraception Jun; 75(6 Suppl):S70-5.
Speidel, J.J., C.C. Harper, and W.C. Shields. 2008. The potential of long-acting reversible contraception to decrease unintended pregnancy. Contraception 78:197-200.
Teerawichitchainan, B. and S. Amin. 2010. The role of abortion in the last stage of fertility decline in Vietnam. International Perspectives on Sexual and Reproductive Health 36(2):80–89.
TransMONEE Database. 2005. Estimates, accessed 22 June 2011 (http://www.transmonee.org)
Trussell, J., B.Vaughan, and J. Stanford. 1999. Are all contraceptive failures unintended pregnancies? Evidence from the 1995 National Survey of Family Growth. Family Planning Perspectives 31(5):246–247 & 260.
United Nations, Department of Economic and Social Affairs, Population Division. 2011. World Population Prospects: The 2010 Revision. Detailed indicators from online database accessed at http://esa.un.org/unpd/wpp/unpp/panel_indicators.htm on June 22, 2011.
Westoff, C.F. and A. Bankole. 1995. Unmet Need: 1990-1994. Comparative Studies No.16. Calverton, Maryland: Macro International Inc.
Westoff, C.F. 2006. New Estimates of Unmet Need and the Demand for Family Planning. DHS Comparative Reports No. 14. Calverton, Maryland: Macro International Inc.

World Health Organization (WHO). 2006. Neonatal and Perinatal Mortality: Country, Regional and Global Estimates. Geneva: World Health Organization.
World Health Organization (WHO). 2007. Unsafe Abortion: Global and Regional Estimates of the Incidence of Unsafe Abortion and Associated Mortality in 2003. Fifth edition. Geneva: World Health Organization.
World Health Organization (WHO). 2009. Medical Eligibility Criteria for Contraceptive Use. Fourth edition. Geneva: Department of Reproductive Health, World Health Organization.
World Health Organization, UNICEF, UNFPA and The World Bank. 2010. Trends in Maternal Mortality: 1990 to 2008. Estimates developed by WHO, UNICEF, UNFPA and the World Bank. Geneva: World Health Organization.
World Health Organization Department of Reproductive Health and Research (WHO/RHR) and Johns Hopkins Bloomberg School of Public Health/Center for Communication Programs (CCP), INFO Project. 2007. Family Planning: A Global Handbook for Providers. Baltimore and Geneva: CCP and WHO.

Number of women
15-49 (weighted)
Eligibility for women's
interview
Estimated population of
women of reproductive
age in 2005 (in
thousands) (1)
Estimated annual
number of births
(in thousands) (2)
Survey
collected
induced
abortion data
Sub-Saharan Africa
Kenya 2003 8,195 All women 15-49 8,661 1,447
Malawi 2004 11,698 All women 15-49 2,846 610
Tanzania 2004-05 10,329 All women 15-49 8,891 1,741
Zimbabwe 2005-06 8,907 All women 15-49 3,098 370
Asia
Bangladesh 2004 11,300 Ever-married women 10-49 37,054 3,107
India 2005-06 124,385 All women 15-49 289,196 27,271
Indonesia 2007 32,895 Ever-married women 15-49 63,858 4,464
Philippines 2003 13,633 All women 15-49 21,688 2,318
Vietnam 2002 5,665 Ever-married women 15-49 24,094 1,472 X
Middle East
Egypt 2008 16,527 Ever-married women 15-49 19,229 1,856
Jordan 2007 10,109 Ever-married women 15-49 1,357 152
Morocco 2003-04 16,798 All women 15-49 8,603 629
Europe & Eurasia
Armenia 2005 6,566 All women 15-49 885 47 X
Azerbaijan 2006 8,444 All women 15-49 2,600 173 X
Moldova 2005 7,440 All women 15-49 1,032 45 X
Turkey 2003 8,075 Ever-married women 15-49 18,853 1,316 X
Ukraine 2007 6,841 All women 15-49 12,381 482 X
Latin America and the Caribbean
Colombia 2010 49,562 All women 13-49 11,778 920
Dominican Republic 2002 23,384 All women 15-49 2,413 218
Peru 2004-08 41,648 All women 15-49 7,257 602
(1) UNPD World Population Prospects, 2005 estimate, 2010 revision. Accessed June 22, 2011.
(2) UNPD World Population Prospects, 2005-2010 estimate, 2010 revision. Accessed June 22, 2011.
Table 1: Characteristics of sample and population, DHS surveys 2002-2010
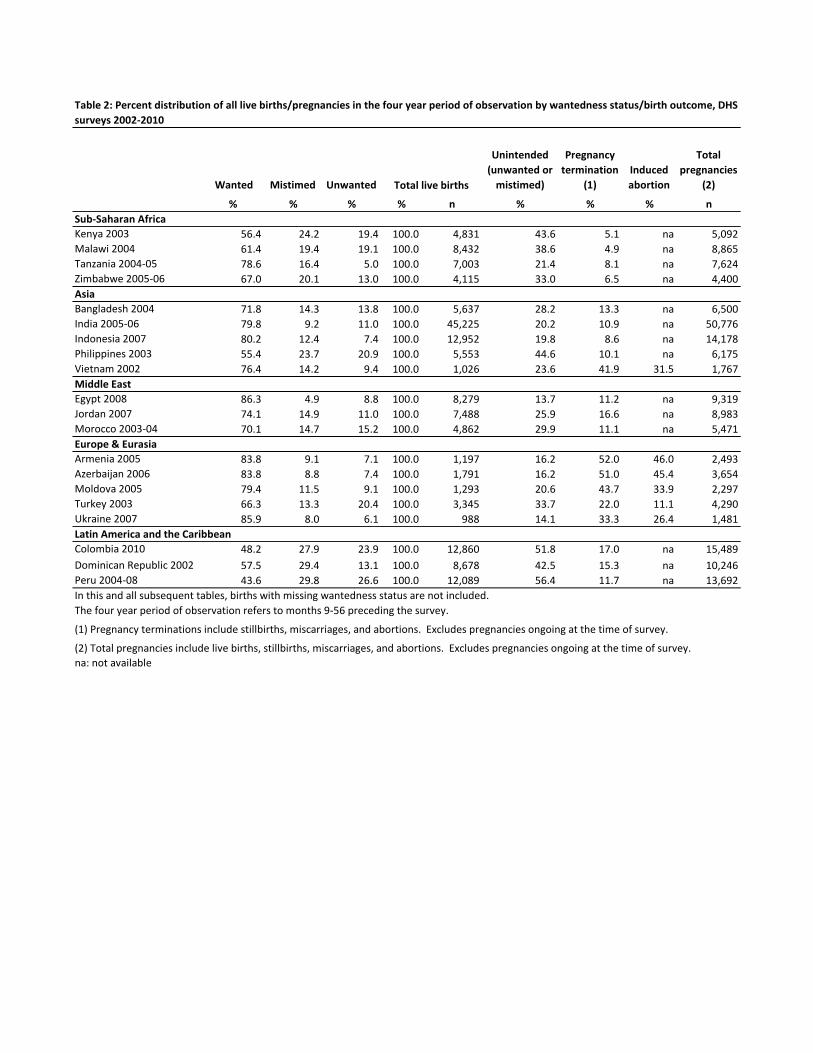
Wanted Mistimed Unwanted
Unintended
(unwanted or
mistimed)
Pregnancy
termination
(1)
Induced
abortion
Total
pregnancies
(2)
% % % % n % % % n
Sub-Saharan Africa
Kenya 2003 56.4 24.2 19.4 100.0 4,831 43.6 5.1 na 5,092
Malawi 2004 61.4 19.4 19.1 100.0 8,432 38.6 4.9 na 8,865
Tanzania 2004-05 78.6 16.4 5.0 100.0 7,003 21.4 8.1 na 7,624
Zimbabwe 2005-06 67.0 20.1 13.0 100.0 4,115 33.0 6.5 na 4,400
Asia
Bangladesh 2004 71.8 14.3 13.8 100.0 5,637 28.2 13.3 na 6,500
India 2005-06 79.8 9.2 11.0 100.0 45,225 20.2 10.9 na 50,776
Indonesia 2007 80.2 12.4 7.4 100.0 12,952 19.8 8.6 na 14,178
Philippines 2003 55.4 23.7 20.9 100.0 5,553 44.6 10.1 na 6,175
Vietnam 2002 76.4 14.2 9.4 100.0 1,026 23.6 41.9 31.5 1,767
Middle East
Egypt 2008 86.3 4.9 8.8 100.0 8,279 13.7 11.2 na 9,319
Jordan 2007 74.1 14.9 11.0 100.0 7,488 25.9 16.6 na 8,983
Morocco 2003-04 70.1 14.7 15.2 100.0 4,862 29.9 11.1 na 5,471
Europe & Eurasia
Armenia 2005 83.8 9.1 7.1 100.0 1,197 16.2 52.0 46.0 2,493
Azerbaijan 2006 83.8 8.8 7.4 100.0 1,791 16.2 51.0 45.4 3,654
Moldova 2005 79.4 11.5 9.1 100.0 1,293 20.6 43.7 33.9 2,297
Turkey 2003 66.3 13.3 20.4 100.0 3,345 33.7 22.0 11.1 4,290
Ukraine 2007 85.9 8.0 6.1 100.0 988 14.1 33.3 26.4 1,481
Latin America and the Caribbean
Colombia 2010 48.2 27.9 23.9 100.0 12,860 51.8 17.0 na 15,489
Dominican Republic 2002 57.5 29.4 13.1 100.0 8,678 42.5 15.3 na 10,246
Peru 2004-08 43.6 29.8 26.6 100.0 12,089 56.4 11.7 na 13,692
In this and all subsequent tables, births with missing wantedness status are not included.
The four year period of observation refers to months 9-56 preceding the survey.
na: not available
Table 2: Percent distribution of all live births/pregnancies in the four year period of observation by wantedness status/birth outcome, DHS
surveys 2002-2010
Total live births
(1) Pregnancy terminations include stillbirths, miscarriages, and abortions. Excludes pregnancies ongoing at the time of survey.
(2) Total pregnancies include live births, stillbirths, miscarriages, and abortions. Excludes pregnancies ongoing at the time of survey.
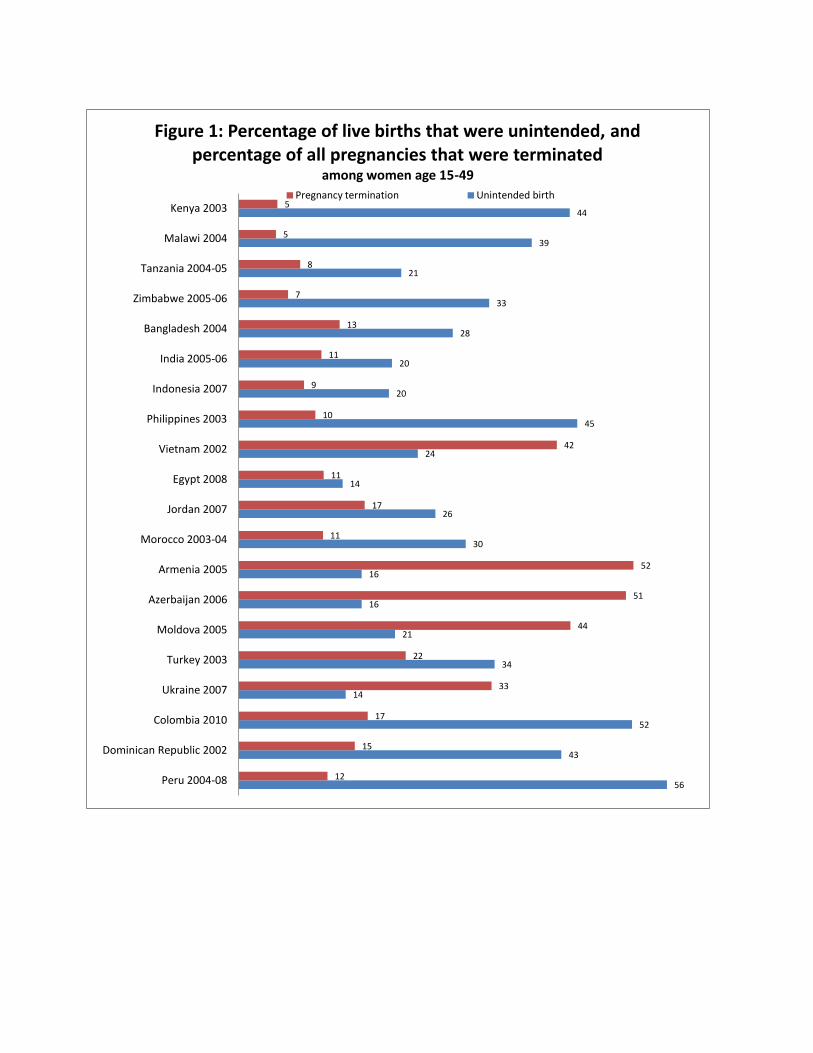
56
43
52
14
34
21
16
16
30
26
14
24
45
20
20
28
33
21
39
44
12
15
17
33
22
44
51
52
11
17
11
42
10
9
11
13
7
8
5
5
Peru 2004-08
Dominican Republic 2002
Colombia 2010
Ukraine 2007
Turkey 2003
Moldova 2005
Azerbaijan 2006
Armenia 2005
Morocco 2003-04
Jordan 2007
Egypt 2008
Vietnam 2002
Philippines 2003
Indonesia 2007
India 2005-06
Bangladesh 2004
Zimbabwe 2005-06
Tanzania 2004-05
Malawi 2004
Kenya 2003
Figure 1: Percentage of live births that were unintended, and percentage of all pregnancies that were terminated
among women age 15-49
Pregnancy termination Unintended birth
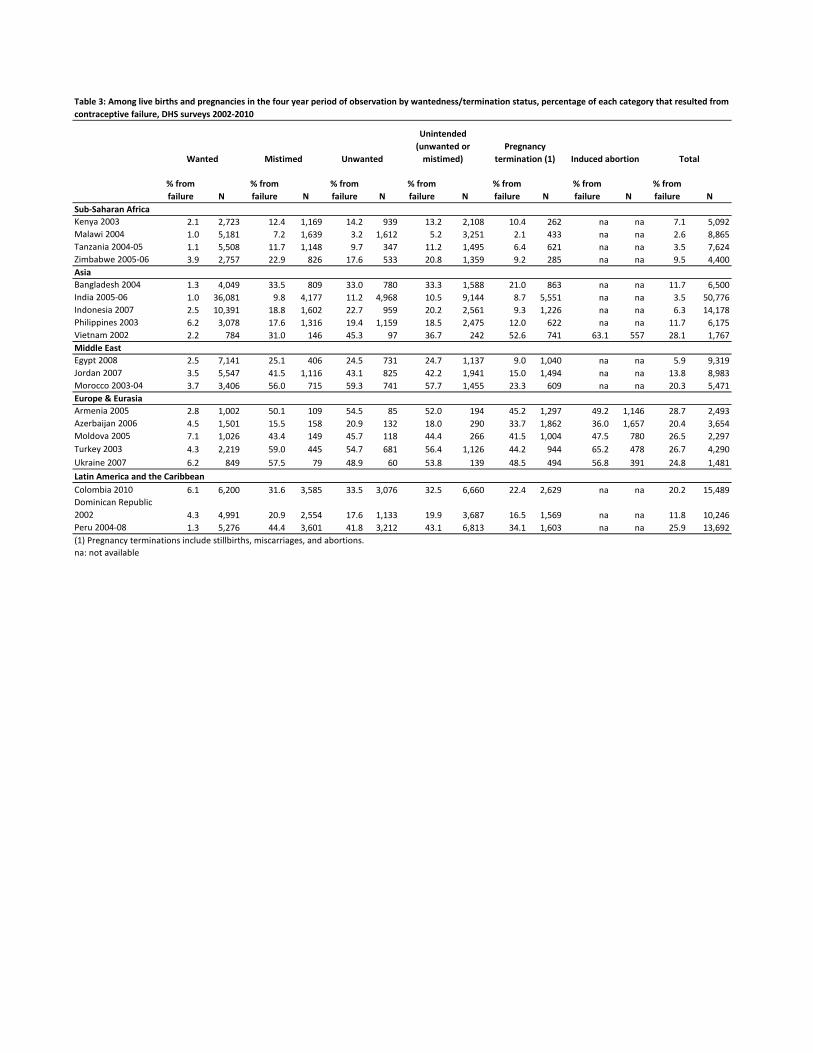
% from
failure N
% from
failure N
% from
failure N
% from
failure N
% from
failure N
% from
failure N
% from
failure N
Sub-Saharan Africa
Kenya 2003 2.1 2,723 12.4 1,169 14.2 939 13.2 2,108 10.4 262 na na 7.1 5,092
Malawi 2004 1.0 5,181 7.2 1,639 3.2 1,612 5.2 3,251 2.1 433 na na 2.6 8,865
Tanzania 2004-05 1.1 5,508 11.7 1,148 9.7 347 11.2 1,495 6.4 621 na na 3.5 7,624
Zimbabwe 2005-06 3.9 2,757 22.9 826 17.6 533 20.8 1,359 9.2 285 na na 9.5 4,400
Asia
Bangladesh 2004 1.3 4,049 33.5 809 33.0 780 33.3 1,588 21.0 863 na na 11.7 6,500
India 2005-06 1.0 36,081 9.8 4,177 11.2 4,968 10.5 9,144 8.7 5,551 na na 3.5 50,776
Indonesia 2007 2.5 10,391 18.8 1,602 22.7 959 20.2 2,561 9.3 1,226 na na 6.3 14,178
Philippines 2003 6.2 3,078 17.6 1,316 19.4 1,159 18.5 2,475 12.0 622 na na 11.7 6,175
Vietnam 2002 2.2 784 31.0 146 45.3 97 36.7 242 52.6 741 63.1 557 28.1 1,767
Middle East
Egypt 2008 2.5 7,141 25.1 406 24.5 731 24.7 1,137 9.0 1,040 na na 5.9 9,319
Jordan 2007 3.5 5,547 41.5 1,116 43.1 825 42.2 1,941 15.0 1,494 na na 13.8 8,983
Morocco 2003-04 3.7 3,406 56.0 715 59.3 741 57.7 1,455 23.3 609 na na 20.3 5,471
Europe & Eurasia
Armenia 2005 2.8 1,002 50.1 109 54.5 85 52.0 194 45.2 1,297 49.2 1,146 28.7 2,493
Azerbaijan 2006 4.5 1,501 15.5 158 20.9 132 18.0 290 33.7 1,862 36.0 1,657 20.4 3,654
Moldova 2005 7.1 1,026 43.4 149 45.7 118 44.4 266 41.5 1,004 47.5 780 26.5 2,297
Turkey 2003 4.3 2,219 59.0 445 54.7 681 56.4 1,126 44.2 944 65.2 478 26.7 4,290
Ukraine 2007 6.2 849 57.5 79 48.9 60 53.8 139 48.5 494 56.8 391 24.8 1,481
Latin America and the Caribbean
Colombia 2010 6.1 6,200 31.6 3,585 33.5 3,076 32.5 6,660 22.4 2,629 na na 20.2 15,489
Dominican Republic
2002 4.3 4,991 20.9 2,554 17.6 1,133 19.9 3,687 16.5 1,569 na na 11.8 10,246
Peru 2004-08 1.3 5,276 44.4 3,601 41.8 3,212 43.1 6,813 34.1 1,603 na na 25.9 13,692
(1) Pregnancy terminations include stillbirths, miscarriages, and abortions.
na: not available
Table 3: Among live births and pregnancies in the four year period of observation by wantedness/termination status, percentage of each category that resulted from
contraceptive failure, DHS surveys 2002-2010
Wanted Mistimed Unwanted
Pregnancy
termination (1) Total
Unintended
(unwanted or
mistimed) Induced abortion

Modern Female Male Pill IUD Injectable Implants
Male
Condom LAM
Other
modern
(1)
Periodic
abstinence
Withdr -
awal
Other
traditional
(2)
Sub-Saharan Africa
Kenya 2003 28.4 22.7 2.9 0.0 4.9 1.6 10.5 1.2 1.7 0.0 0.0 5.6 4.7 0.4 0.5 8,195
Malawi 2004 25.7 22.4 4.8 0.0 1.5 0.1 13.9 0.4 1.7 0.0 0.0 3.3 0.4 1.5 1.3 11,698
Tanzania 2004-05 22.5 17.6 2.1 0.0 4.6 0.1 6.9 0.4 3.0 0.4 0.0 4.9 1.8 2.1 1.0 10,329
Zimbabwe 2005-06 40.1 39.1 1.5 0.0 26.9 0.2 7.2 0.8 2.0 0.4 0.1 1.1 0.1 0.7 0.3 8,907
Asia
Bangladesh 2004 54.5 44.5 5.3 0.6 24.4 0.6 9.0 0.7 3.8 0.0 0.0 10.0 6.1 3.3 0.6 11,290
India 2005-06 43.8 38.0 29.6 0.8 2.3 1.3 0.1 0.0 3.9 0.0 0.0 5.8 3.7 1.9 0.3 124,385
Indonesia 2007 57.9 54.2 3.0 0.2 12.5 4.7 30.0 2.6 1.2 0.0 0.0 3.8 1.4 2.0 0.4 32,895
Philippines 2003 31.6 21.6 6.9 0.1 8.4 2.6 2.0 0.0 1.2 0.2 0.1 9.9 4.3 5.2 0.4 13,633
Vietnam 2002 74.0 53.4 5.6 0.4 6.0 35.6 0.4 0.0 5.5 0.0 0.0 20.6 7.0 13.5 0.1 5,665
Middle East
Egypt 2008 56.2 53.7 1.0 0.0 11.1 33.6 6.9 0.4 0.7 0.0 0.0 2.5 0.4 0.2 1.9 16,527
Jordan 2007 56.8 40.4 2.8 0.0 7.8 21.6 0.7 0.1 6.0 1.4 0.1 16.5 3.8 12.2 0.4 10,109
Morocco 2003-04 33.3 29.0 1.5 0.0 21.2 2.8 1.1 0.0 0.8 1.5 0.1 4.3 2.0 2.3 0.0 16,798
Europe & Eurasia
Armenia 2005 33.1 12.3 0.4 0.0 0.5 5.9 0.0 0.0 5.1 0.2 0.1 20.8 2.4 17.1 1.3 6,566
Azerbaijan 2006 32.0 9.0 0.3 0.0 0.7 5.8 0.0 0.0 1.4 0.7 0.1 23.0 2.5 20.3 0.2 8,444
Moldova 2005 49.8 32.8 3.4 0.0 2.8 17.7 0.1 0.0 6.7 0.8 1.1 17.0 2.5 13.9 0.6 7,440
Turkey 2003 67.6 41.1 5.6 0.1 4.5 19.2 0.4 0.0 10.2 0.6 0.6 26.5 1.1 25.1 0.4 8,075
Ukraine 2007 50.9 38.3 0.5 0.0 3.7 12.1 0.0 0.0 21.2 0.0 0.6 12.6 4.8 6.8 1.0 6,841
Latin America and the Caribbean
Colombia 2010 61.2 56.9 24.2 1.9 6.5 5.6 7.9 2.9 7.6 0.1 0.1 4.3 1.6 2.5 0.2 49,818
Dominican Republic
2002 51.2 48.2 33.2 0.1 9.3 1.8 1.5 0.4 1.7 0.3 0.0 3.0 1.1 1.3 0.6 23,384
Peru 2004-08 47.1 32.1 6.4 0.2 4.9 3.0 9.6 0.1 7.3 0.2 0.3 15.0 11.0 3.2 0.7 40,552
(1) Other modern methods include the diaphragm, spermicides, and female condoms
(2) Other traditional methods include prolonged breastfeeding (Egypt only), massage, herbs, douche, and other folk methods
Table 4: Contraceptive prevalence among all/ever married women age 15-49 by method and country, DHS surveys 2002-2010
Traditional methods
Number
of
women
Sterilization
Modern methodsTotal
CPR
Total
Modern
Total
Traditional
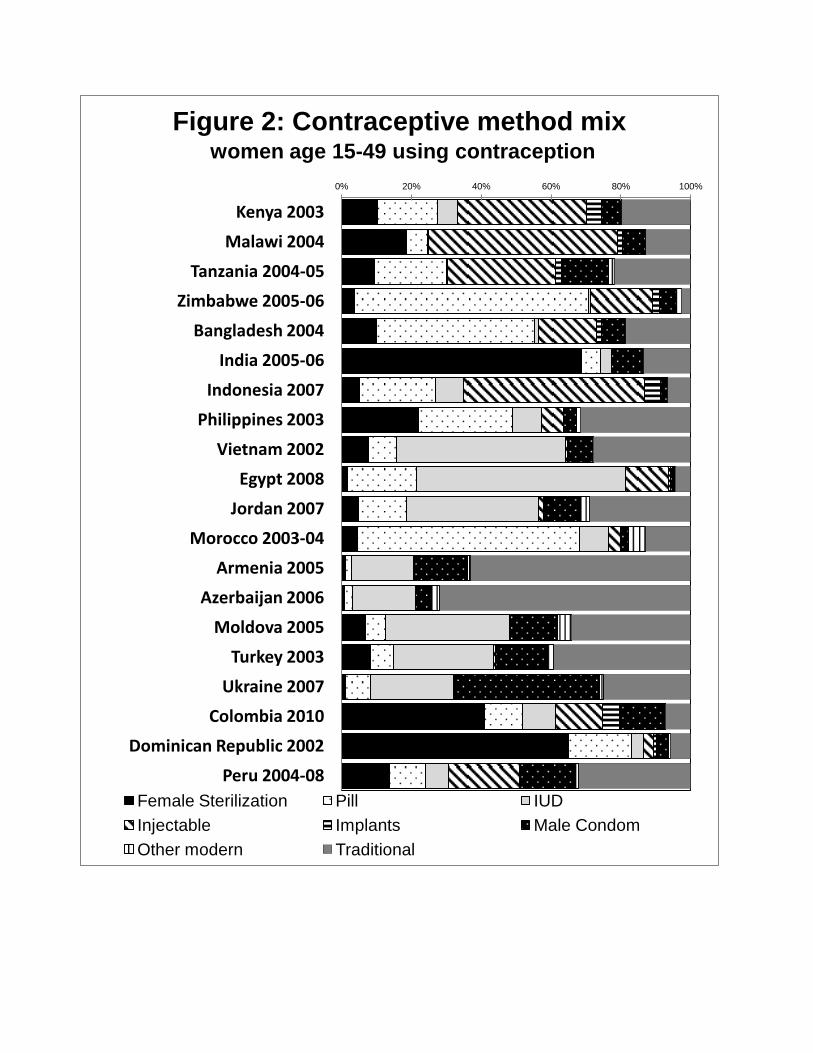
0% 20% 40% 60% 80% 100%
Kenya 2003
Malawi 2004
Tanzania 2004-05
Zimbabwe 2005-06
Bangladesh 2004
India 2005-06
Indonesia 2007
Philippines 2003
Vietnam 2002
Egypt 2008
Jordan 2007
Morocco 2003-04
Armenia 2005
Azerbaijan 2006
Moldova 2005
Turkey 2003
Ukraine 2007
Colombia 2010
Dominican Republic 2002
Peru 2004-08
Figure 2: Contraceptive method mix women age 15-49 using contraception
Female Sterilization Pill IUD
Injectable Implants Male Condom
Other modern Traditional
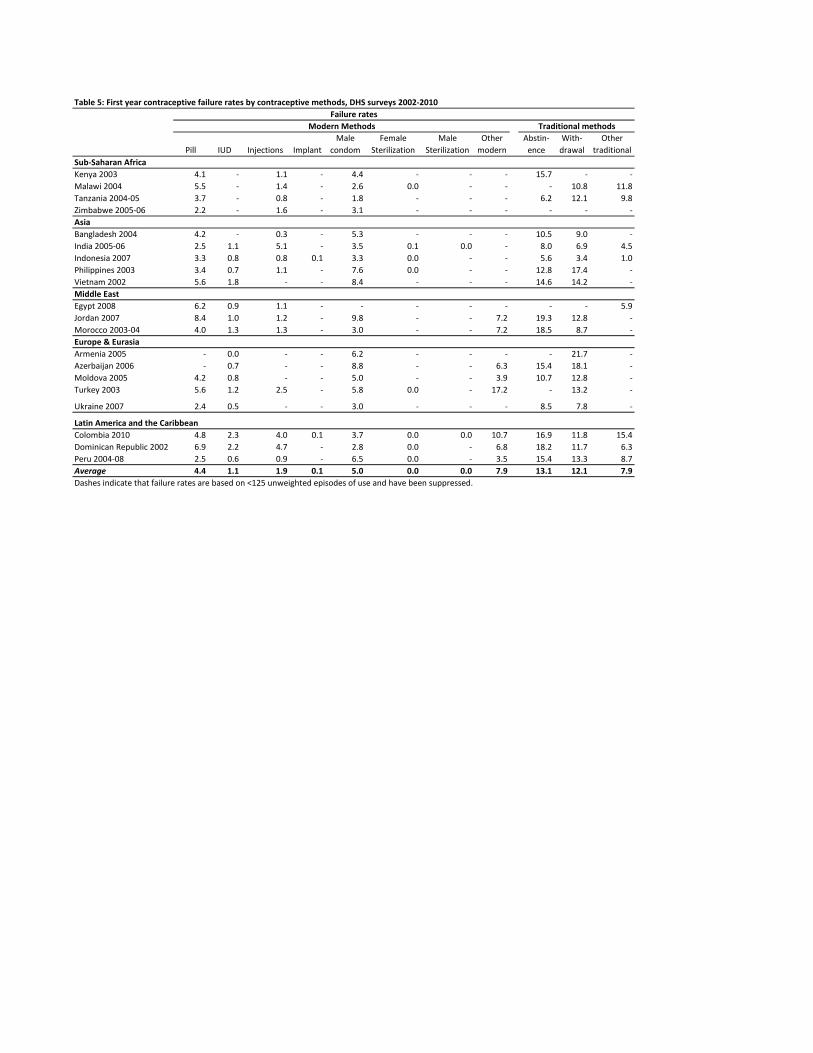
Table 5: First year contraceptive failure rates by contraceptive methods, DHS surveys 2002-2010
Failure rates
Pill IUD Injections Implant
Male
condom
Female
Sterilization
Male
Sterilization
Other
modern
Periodic
Abstin-
ence
With-
drawal
Other
traditional
Sub-Saharan Africa
Kenya 2003 4.1 - 1.1 - 4.4 - - - 15.7 - -
Malawi 2004 5.5 - 1.4 - 2.6 0.0 - - - 10.8 11.8
Tanzania 2004-05 3.7 - 0.8 - 1.8 - - - 6.2 12.1 9.8
Zimbabwe 2005-06 2.2 - 1.6 - 3.1 - - - - - -
Asia
Bangladesh 2004 4.2 - 0.3 - 5.3 - - - 10.5 9.0 -
India 2005-06 2.5 1.1 5.1 - 3.5 0.1 0.0 - 8.0 6.9 4.5
Indonesia 2007 3.3 0.8 0.8 0.1 3.3 0.0 - - 5.6 3.4 1.0
Philippines 2003 3.4 0.7 1.1 - 7.6 0.0 - - 12.8 17.4 -
Vietnam 2002 5.6 1.8 - - 8.4 - - - 14.6 14.2 -
Middle East
Egypt 2008 6.2 0.9 1.1 - - - - - - - 5.9
Jordan 2007 8.4 1.0 1.2 - 9.8 - - 7.2 19.3 12.8 -
Morocco 2003-04 4.0 1.3 1.3 - 3.0 - - 7.2 18.5 8.7 -
Europe & Eurasia
Armenia 2005 - 0.0 - - 6.2 - - - - 21.7 -
Azerbaijan 2006 - 0.7 - - 8.8 - - 6.3 15.4 18.1 -
Moldova 2005 4.2 0.8 - - 5.0 - - 3.9 10.7 12.8 -
Turkey 2003 5.6 1.2 2.5 - 5.8 0.0 - 17.2 - 13.2 -
Ukraine 2007 2.4 0.5 - - 3.0 - - - 8.5 7.8 -
Latin America and the Caribbean
Colombia 2010 4.8 2.3 4.0 0.1 3.7 0.0 0.0 10.7 16.9 11.8 15.4
Dominican Republic 2002 6.9 2.2 4.7 - 2.8 0.0 - 6.8 18.2 11.7 6.3
Peru 2004-08 2.5 0.6 0.9 - 6.5 0.0 - 3.5 15.4 13.3 8.7
Average 4.4 1.1 1.9 0.1 5.0 0.0 0.0 7.9 13.1 12.1 7.9
Dashes indicate that failure rates are based on <125 unweighted episodes of use and have been suppressed.
Modern Methods Traditional methods
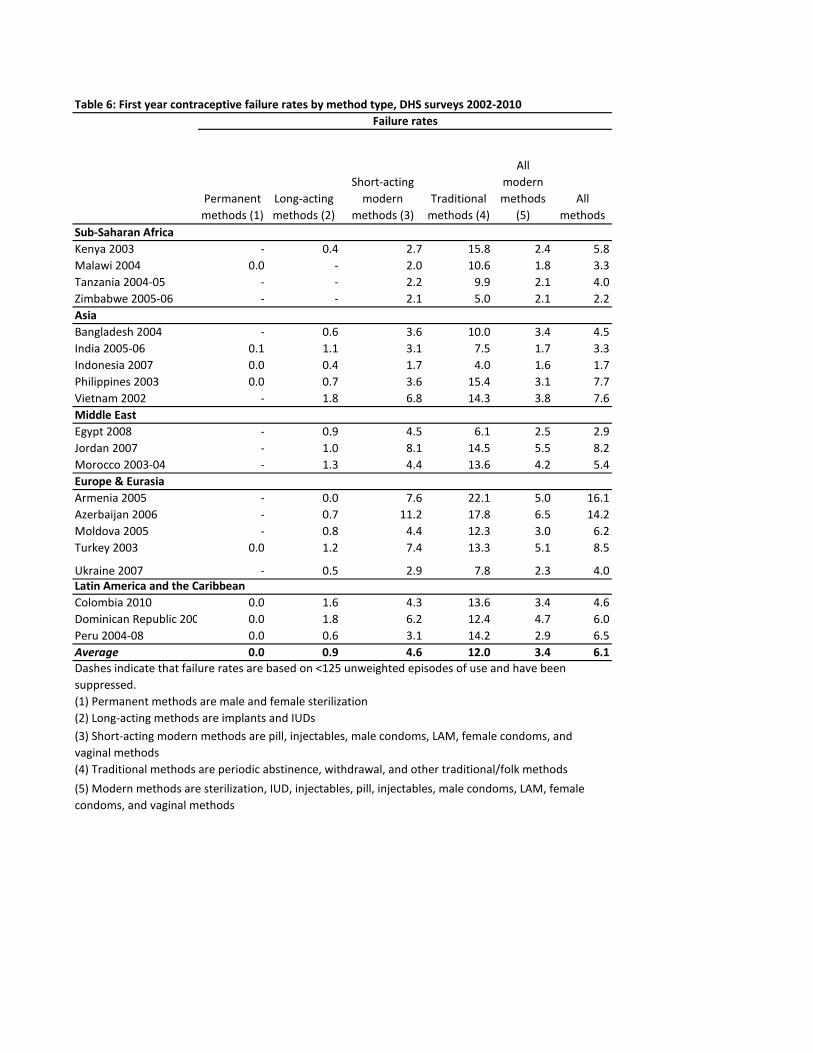
Table 6: First year contraceptive failure rates by method type, DHS surveys 2002-2010
Failure rates
Permanent
methods (1)
Long-acting
methods (2)
Short-acting
modern
methods (3)
Traditional
methods (4)
All
modern
methods
(5)
All
methods
Sub-Saharan Africa
Kenya 2003 - 0.4 2.7 15.8 2.4 5.8
Malawi 2004 0.0 - 2.0 10.6 1.8 3.3
Tanzania 2004-05 - - 2.2 9.9 2.1 4.0
Zimbabwe 2005-06 - - 2.1 5.0 2.1 2.2
Asia
Bangladesh 2004 - 0.6 3.6 10.0 3.4 4.5
India 2005-06 0.1 1.1 3.1 7.5 1.7 3.3
Indonesia 2007 0.0 0.4 1.7 4.0 1.6 1.7
Philippines 2003 0.0 0.7 3.6 15.4 3.1 7.7
Vietnam 2002 - 1.8 6.8 14.3 3.8 7.6
Middle East
Egypt 2008 - 0.9 4.5 6.1 2.5 2.9
Jordan 2007 - 1.0 8.1 14.5 5.5 8.2
Morocco 2003-04 - 1.3 4.4 13.6 4.2 5.4
Europe & Eurasia
Armenia 2005 - 0.0 7.6 22.1 5.0 16.1
Azerbaijan 2006 - 0.7 11.2 17.8 6.5 14.2
Moldova 2005 - 0.8 4.4 12.3 3.0 6.2
Turkey 2003 0.0 1.2 7.4 13.3 5.1 8.5
Ukraine 2007 - 0.5 2.9 7.8 2.3 4.0Latin America and the Caribbean
Colombia 2010 0.0 1.6 4.3 13.6 3.4 4.6
Dominican Republic 2002 0.0 1.8 6.2 12.4 4.7 6.0
Peru 2004-08 0.0 0.6 3.1 14.2 2.9 6.5
Average 0.0 0.9 4.6 12.0 3.4 6.1
(1) Permanent methods are male and female sterilization
(2) Long-acting methods are implants and IUDs
(4) Traditional methods are periodic abstinence, withdrawal, and other traditional/folk methods
(3) Short-acting modern methods are pill, injectables, male condoms, LAM, female condoms, and
vaginal methods
(5) Modern methods are sterilization, IUD, injectables, pill, injectables, male condoms, LAM, female
condoms, and vaginal methods
Dashes indicate that failure rates are based on <125 unweighted episodes of use and have been
suppressed.
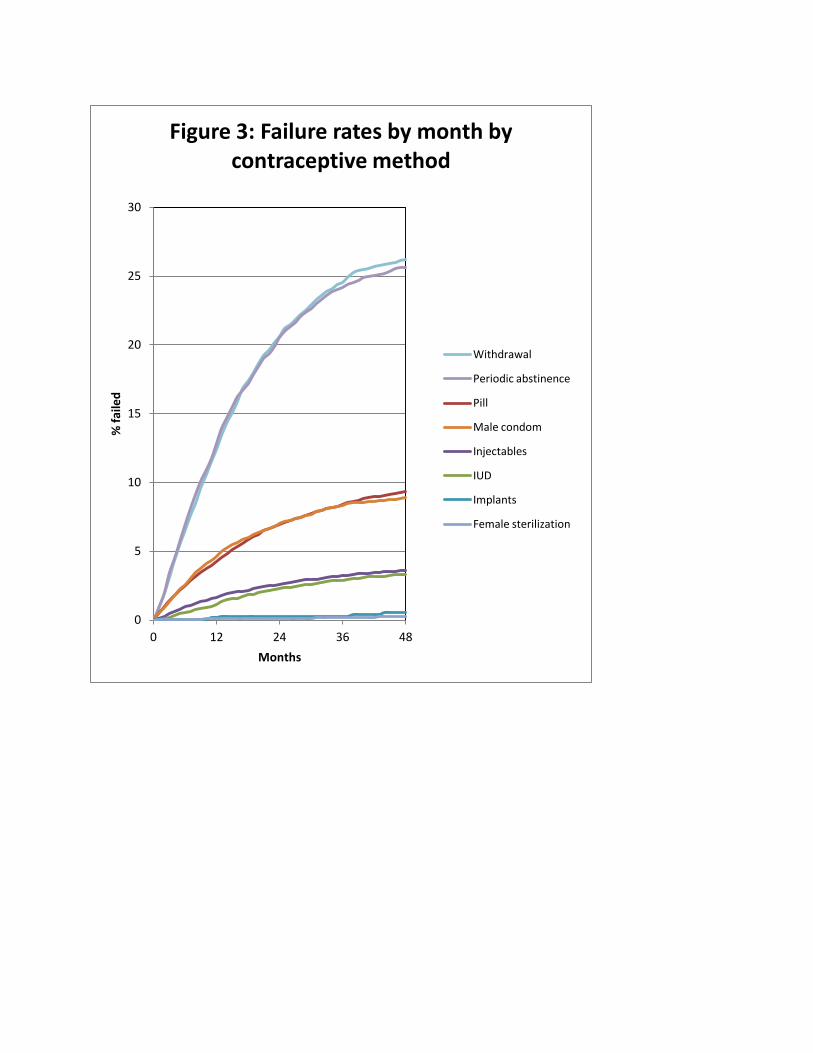
0
5
10
15
20
25
30
0 12 24 36 48
% f
aile
d
Months
Figure 3: Failure rates by month by contraceptive method
Withdrawal
Periodic abstinence
Pill
Male condom
Injectables
IUD
Implants
Female sterilization

0
5
10
15
20
25
30
0 12 24 36 48
% f
aile
d
Months
Figure 4: Failure rates by month by contraceptive method type
Traditional methods
Short acting modern method
Long-acting method
Permanent method
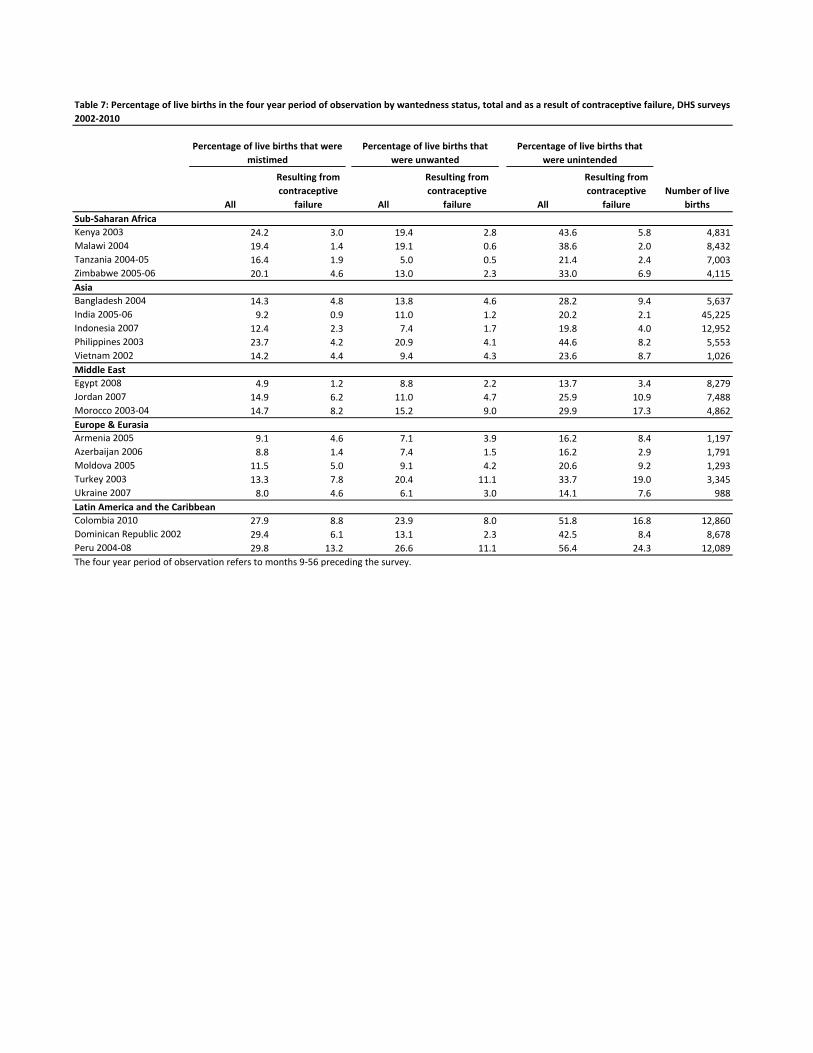
All
Resulting from
contraceptive
failure All
Resulting from
contraceptive
failure All
Resulting from
contraceptive
failure
Number of live
births
Sub-Saharan Africa
Kenya 2003 24.2 3.0 19.4 2.8 43.6 5.8 4,831
Malawi 2004 19.4 1.4 19.1 0.6 38.6 2.0 8,432
Tanzania 2004-05 16.4 1.9 5.0 0.5 21.4 2.4 7,003
Zimbabwe 2005-06 20.1 4.6 13.0 2.3 33.0 6.9 4,115
Asia
Bangladesh 2004 14.3 4.8 13.8 4.6 28.2 9.4 5,637
India 2005-06 9.2 0.9 11.0 1.2 20.2 2.1 45,225
Indonesia 2007 12.4 2.3 7.4 1.7 19.8 4.0 12,952
Philippines 2003 23.7 4.2 20.9 4.1 44.6 8.2 5,553
Vietnam 2002 14.2 4.4 9.4 4.3 23.6 8.7 1,026
Middle East
Egypt 2008 4.9 1.2 8.8 2.2 13.7 3.4 8,279
Jordan 2007 14.9 6.2 11.0 4.7 25.9 10.9 7,488
Morocco 2003-04 14.7 8.2 15.2 9.0 29.9 17.3 4,862
Europe & Eurasia
Armenia 2005 9.1 4.6 7.1 3.9 16.2 8.4 1,197
Azerbaijan 2006 8.8 1.4 7.4 1.5 16.2 2.9 1,791
Moldova 2005 11.5 5.0 9.1 4.2 20.6 9.2 1,293
Turkey 2003 13.3 7.8 20.4 11.1 33.7 19.0 3,345
Ukraine 2007 8.0 4.6 6.1 3.0 14.1 7.6 988
Latin America and the Caribbean
Colombia 2010 27.9 8.8 23.9 8.0 51.8 16.8 12,860
Dominican Republic 2002 29.4 6.1 13.1 2.3 42.5 8.4 8,678
Peru 2004-08 29.8 13.2 26.6 11.1 56.4 24.3 12,089
The four year period of observation refers to months 9-56 preceding the survey.
Table 7: Percentage of live births in the four year period of observation by wantedness status, total and as a result of contraceptive failure, DHS surveys
2002-2010
Percentage of live births that
were unwanted
Percentage of live births that were
mistimed
Percentage of live births that
were unintended
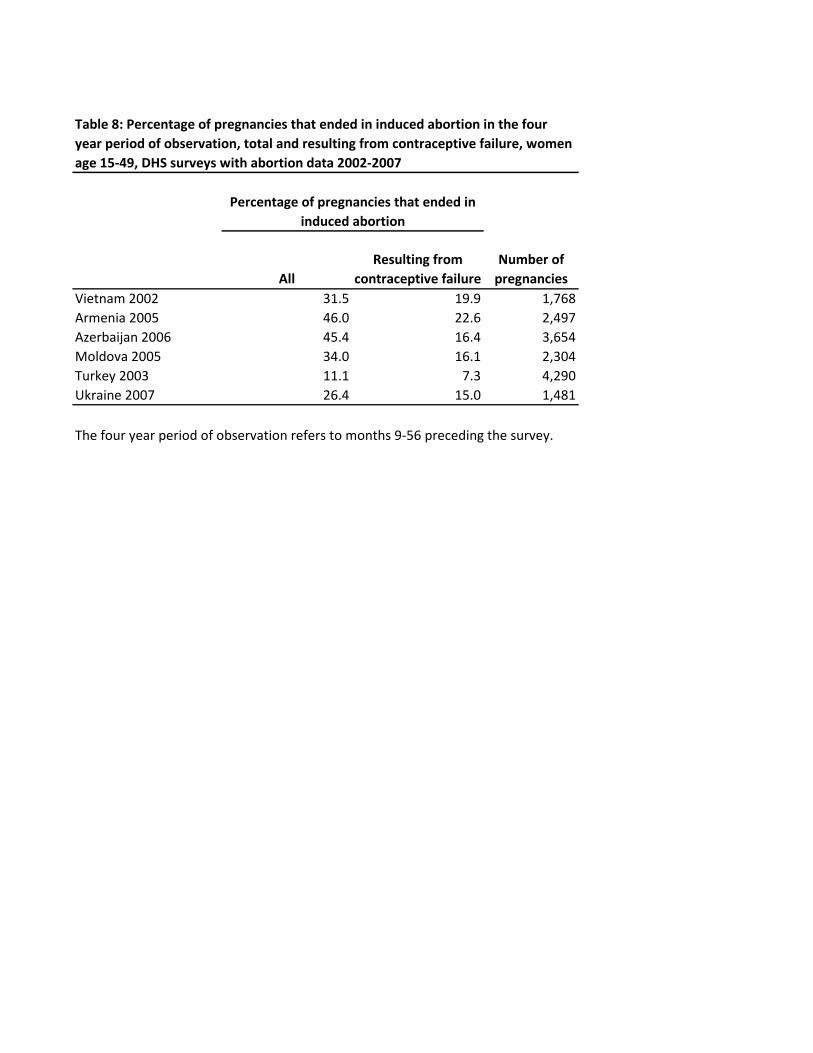
All
Resulting from
contraceptive failure
Number of
pregnancies
Vietnam 2002 31.5 19.9 1,768
Armenia 2005 46.0 22.6 2,497
Azerbaijan 2006 45.4 16.4 3,654
Moldova 2005 34.0 16.1 2,304
Turkey 2003 11.1 7.3 4,290
Ukraine 2007 26.4 15.0 1,481
Table 8: Percentage of pregnancies that ended in induced abortion in the four
year period of observation, total and resulting from contraceptive failure, women
age 15-49, DHS surveys with abortion data 2002-2007
Percentage of pregnancies that ended in
induced abortion
The four year period of observation refers to months 9-56 preceding the survey.

0% 20% 40% 60% 80% 100%
Kenya 2003
Malawi 2004
Tanzania 2004-05
Zimbabwe 2005-06
Bangladesh 2004
India 2005-06
Indonesia 2007
Philippines 2003
Vietnam 2002
Egypt 2008
Jordan 2007
Morocco 2003-04
Armenia 2005
Azerbaijan 2006
Moldova 2005
Turkey 2003
Ukraine 2007
Colombia 2010
Dominican Republic 2002
Peru 2004-08
Figure 5: Method being used at time of conception of unintended births
No method Long-acting or permanent method Short-acting modern method Traditional method
Figure shows the contraceptive method (or no method) being used in the month prior to the first month of a pregnancy that the woman reported to be unintended. Figure excludes the approximately 4% of unintended pregnancies in which the woman was using contraception in the month prior, but discontinued for reasons other than failure -- most commonly "to become pregnant".

0% 20% 40% 60% 80% 100%
Vietnam 2002
Armenia 2005
Azerbaijan 2006
Moldova 2005
Turkey 2003
Ukraine 2007
Figure 6: Method used at time of conception of pregnancy leading to abortion
No method Long-acting or permanent method Short-acting modern method Traditional method
Figure shows the contraceptive method (or no method) being used in the month prior to the first month of a pregnancy that ended in an indu ced abortion. Figure excludes the approximately 6% of unintended pregnancies ending in abortion in which the woman was using contraception in the month prior, but discontinued for reasons other than failure -- most

Scenario 1: convert all
traditional to short-
term modern use
Scenario 2: convert
spacers to short-term
modern use and
limiters to LA use
Scenario 3: convert all
to LA use
Scenario 4: convert
spacers to LA use and
limiters to PM use
Sub-Saharan Africa
Kenya 2003 6.5 8.4 11.0 11.8
Malawi 2004 2.5 2.9 3.9 4.4
Tanzania 2004-05 5.8 6.3 8.3 9.4
Zimbabwe 2005-06 1.2 4.4 15.3 17.4
Asia
Bangladesh 2004 7.8 16.3 28.4 30.0
India 2005-06 5.5 7.1 8.4 9.1
Indonesia 2007 2.1 5.4 13.7 15.8
Philippines 2003 9.9 13.0 16.9 17.4
Vietnam 2002 9.5 16.2 26.1 29.6
Middle East
Egypt 2008 2.2 10.6 13.7 17.5
Jordan 2007 14.5 18.0 29.0 34.9
Morocco 2003-04 9.9 26.3 44.6 49.9
Europe & Eurasia
Armenia 2005 25.1 35.6 46.5 49.1
Azerbaijan 2006 9.0 12.5 16.1 17.0
Moldova 2005 15.9 26.7 38.0 41.0
Turkey 2003 20.8 38.9 52.5 54.3
Ukraine 2007 16.6 30.9 46.0 49.7
Latin America and the Caribbean
Colombia 2010 7.5 17.1 27.6 29.2
Dominican Republic
2002 4.2 8.0 17.7 18.4
Peru 2004-08 25.1 30.4 39.5 40.5
Table 9: Percentage of unintended births that could be avoided by using more effective contraception, among women
15-49, DHS surveys 2002-2010
Percentage of unintended births that could be avoided under:
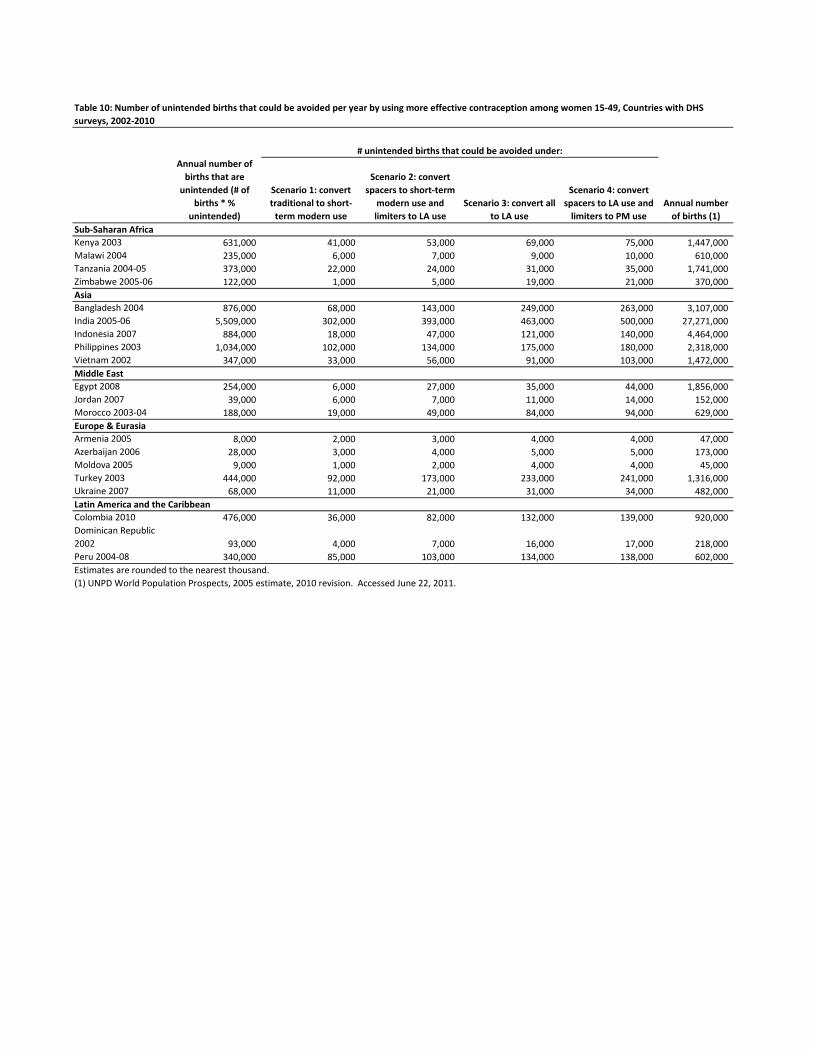
Annual number of
births that are
unintended (# of
births * %
unintended)
Scenario 1: convert
traditional to short-
term modern use
Scenario 2: convert
spacers to short-term
modern use and
limiters to LA use
Scenario 3: convert all
to LA use
Scenario 4: convert
spacers to LA use and
limiters to PM use
Annual number
of births (1)
Sub-Saharan Africa
Kenya 2003 631,000 41,000 53,000 69,000 75,000 1,447,000
Malawi 2004 235,000 6,000 7,000 9,000 10,000 610,000
Tanzania 2004-05 373,000 22,000 24,000 31,000 35,000 1,741,000
Zimbabwe 2005-06 122,000 1,000 5,000 19,000 21,000 370,000
Asia
Bangladesh 2004 876,000 68,000 143,000 249,000 263,000 3,107,000
India 2005-06 5,509,000 302,000 393,000 463,000 500,000 27,271,000
Indonesia 2007 884,000 18,000 47,000 121,000 140,000 4,464,000
Philippines 2003 1,034,000 102,000 134,000 175,000 180,000 2,318,000
Vietnam 2002 347,000 33,000 56,000 91,000 103,000 1,472,000
Middle East
Egypt 2008 254,000 6,000 27,000 35,000 44,000 1,856,000
Jordan 2007 39,000 6,000 7,000 11,000 14,000 152,000
Morocco 2003-04 188,000 19,000 49,000 84,000 94,000 629,000
Europe & Eurasia
Armenia 2005 8,000 2,000 3,000 4,000 4,000 47,000
Azerbaijan 2006 28,000 3,000 4,000 5,000 5,000 173,000
Moldova 2005 9,000 1,000 2,000 4,000 4,000 45,000
Turkey 2003 444,000 92,000 173,000 233,000 241,000 1,316,000
Ukraine 2007 68,000 11,000 21,000 31,000 34,000 482,000
Latin America and the Caribbean
Colombia 2010 476,000 36,000 82,000 132,000 139,000 920,000
Dominican Republic
2002 93,000 4,000 7,000 16,000 17,000 218,000
Peru 2004-08 340,000 85,000 103,000 134,000 138,000 602,000
Estimates are rounded to the nearest thousand.
(1) UNPD World Population Prospects, 2005 estimate, 2010 revision. Accessed June 22, 2011.
Table 10: Number of unintended births that could be avoided per year by using more effective contraception among women 15-49, Countries with DHS
surveys, 2002-2010
# unintended births that could be avoided under:
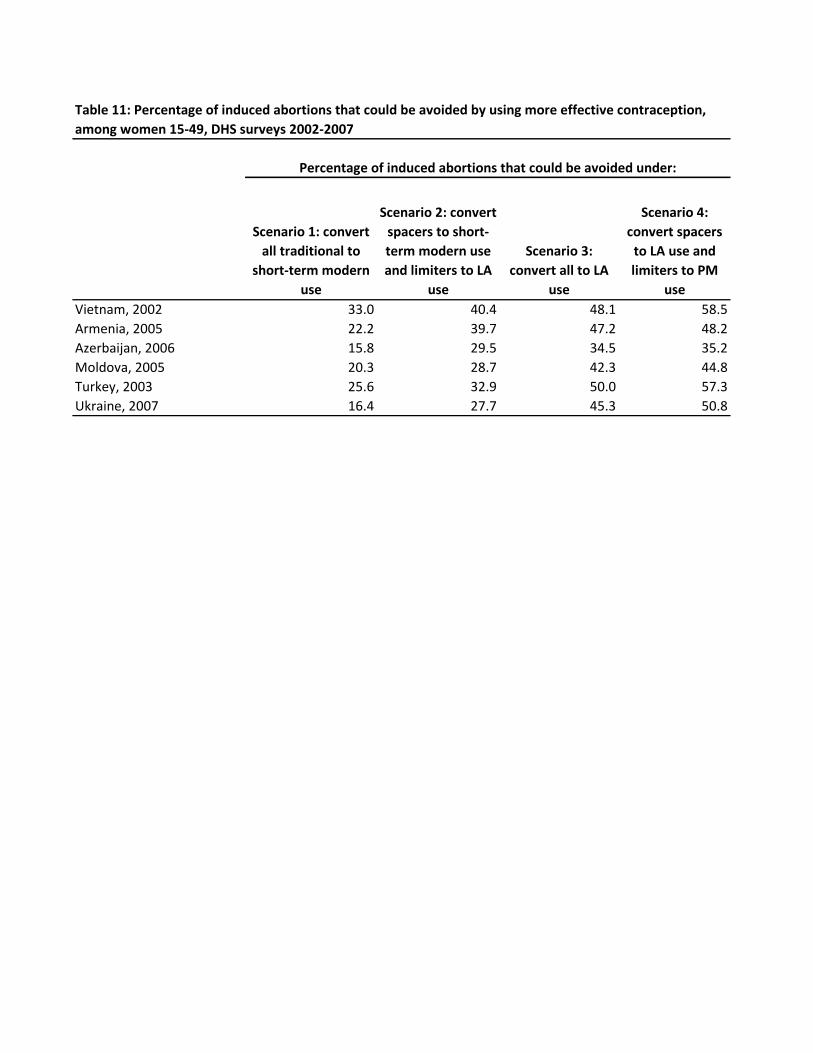
Scenario 1: convert
all traditional to
short-term modern
use
Scenario 2: convert
spacers to short-
term modern use
and limiters to LA
use
Scenario 3:
convert all to LA
use
Scenario 4:
convert spacers
to LA use and
limiters to PM
use
Vietnam, 2002 33.0 40.4 48.1 58.5
Armenia, 2005 22.2 39.7 47.2 48.2
Azerbaijan, 2006 15.8 29.5 34.5 35.2
Moldova, 2005 20.3 28.7 42.3 44.8
Turkey, 2003 25.6 32.9 50.0 57.3
Ukraine, 2007 16.4 27.7 45.3 50.8
Table 11: Percentage of induced abortions that could be avoided by using more effective contraception,
among women 15-49, DHS surveys 2002-2007
Percentage of induced abortions that could be avoided under:

Scenario 1: convert
traditional to short-
term modern use
Scenario 2: convert
spacers to short-term
modern use and limiters
to LA use
Scenario 3: convert all
to LA use
Scenario 2: convert
spacers to LA use and
limiters to PM use
Vietnam 2002 178,000 218,000 260,000 316,000 540,000
Armenia 2005 2,000 4,000 5,000 5,000 11,000
Azerbaijan 2006 2,000 5,000 5,000 6,000 16,000
Moldova 2005 3,000 4,000 5,000 6,000 13,000
Turkey 2003 38,000 48,000 73,000 84,000 147,000
Ukraine 2007 40,000 67,000 110,000 123,000 242,000
Estimates are rounded to the nearest thousand.
(1) Vietnam number of abortions from Teerawichitchainan and Amin 2010, citing 2003 data
(2) Turkey number of abortions from Sedgh et al. 2007a, citing 2003 data
(3) All other abortion data from TransMONEE database, 2005 estimates, accessed June 22, 2011
Table 12: Number of induced abortions that could be avoided per year by using more effective contraception among women 15-49,
Countries with abortion data from DHS surveys, 2002-2007
# induced abortions that could be avoided under:
Annual
number of
abortions
(1,2,3)

Survey
Live birth/ current
pregnancy Wanted Mistimed Unwanted Total
Number of
live births/
current
pregnancies Unintended
Kenya 2003 Current pregnancy 51.5 30.4 18.1 100.0 638 48.5
Births 55.8 24.4 19.8 100.0 6,082 44.2
Malawi 2004 Current pregnancy 52.9 25.5 21.6 100.0 1,406 47.1
Births 60.4 19.9 19.7 100.0 10,761 39.6
Tanzania 2004-05 Current pregnancy 66.5 26.7 6.8 100.0 1,083 33.5
Births 77.7 17.2 5.0 100.0 8,716 22.3
Zimbabwe 2005-06 Current pregnancy 61.6 23.6 14.8 100.0 586 38.4
Births 67.2 20.0 12.8 100.0 5,220 32.8
Bangladesh 2004 Current pregnancy 60.3 24.0 15.6 100.0 691 39.7
Births 71.5 14.9 13.6 100.0 6,993 28.5
India 2005-06 Current pregnancy 75.2 15.3 9.5 100.0 6,327 24.8
Births 79.6 9.4 11.0 100.0 56,377 20.4
Indonesia 2007 Current pregnancy 80.5 12.8 6.7 100.0 1,636 19.5
Births 80.1 12.3 7.5 100.0 16,405 19.9
Philippines 2003 Current pregnancy 59.9 25.0 15.1 100.0 744 40.1
Births 54.8 24.1 21.1 100.0 6,914 45.2
Vietnam 2002 Current pregnancy 79.8 11.9 8.3 100.0 248 20.2
Births 76.2 14.2 9.7 100.0 1,320 23.8
Egypt 2008 Current pregnancy 86.3 7.4 6.3 100.0 1,500 13.7
Births 86.2 4.8 9.1 100.0 10,583 13.8
Jordan 2007 Current pregnancy 71.1 18.7 10.2 100.0 1,136 28.9
Births 73.9 15.2 10.9 100.0 9,168 26.1
Morocco 2003-04 Current pregnancy 68.7 19.5 11.8 100.0 660 31.3
Births 70.1 14.7 15.2 100.0 6,024 29.9
Armenia 2005 Current pregnancy 79.1 11.2 9.8 100.0 187 20.9
Births 84.1 9.5 6.4 100.0 1,491 15.9
Azerbaijan 2006 Current pregnancy 84.7 10.2 5.1 100.0 294 15.3
Births 82.9 9.2 7.9 100.0 2,280 17.1
Moldova 2005 Current pregnancy 74.7 22.4 2.9 100.0 177 25.3
Births 79.7 11.2 9.1 100.0 1,589 20.3
Turkey 2003 Current pregnancy 57.5 22.9 19.6 100.0 464 42.5
Births 66.8 12.9 20.3 100.0 4,122 33.2
Ukraine 2007 Current pregnancy 85.1 9.6 5.3 100.0 181 14.9
Births 86.2 7.5 6.3 100.0 1,168 13.8
Colombia 2010 Current pregnancy 42.6 39.6 17.8 100.0 1,762 57.4
Births 48.4 28.0 23.6 100.0 15,844 51.6
Dominican Republic 2002 Current pregnancy 46.7 38.0 15.3 100.0 1,130 53.3
Births 57.2 29.6 13.2 100.0 10,772 42.8
Peru 2004-08 Current pregnancy 39.1 39.6 21.4 100.0 1,599 60.9
Births 43.5 30.3 26.2 100.0 14,974 56.5
Table A.1: Percent distribution of all live births/current pregnancies in the five years preceding the survey by wantedness status/birth
outcome, DHS surveys 2002-2010

Wanted Mistimed Unwanted
Unwanted or
mistimed Total
Survey
Births/ Current
pregnancy
Contra-
ceptive
failure
Number of
births/
current
pregnancy
Contra-
ceptive
failure
Number of
births/
current
pregnancy
Contra-
ceptive
failure
Number of
births/
current
pregnancy
Contra-
ceptive
failure
Number of
births/
current
pregnancy
Contra-
ceptive
failure
Number of
births/
current
pregnancy
Kenya 2003 Current pregnancy 3.2 328 15.9 194 17.2 115 16.4 310 9.6 638
Births 2.2 3,392 12.3 1,487 13.4 1,204 12.8 2,690 6.9 6,082
Malawi 2004 Current pregnancy 1.6 744 10.4 359 10.1 303 10.2 662 5.7 1,406
Births 0.9 6,502 7.7 2,141 3.6 2,118 5.6 4,259 2.8 10,761
Tanzania 2004-05 Current pregnancy 0.8 720 15.3 289 16.7 74 15.6 363 5.8 1,083
Births 1.1 6,775 12.1 1,503 10.1 438 11.7 1,941 3.4 8,716
Zimbabwe 2005-06 Current pregnancy 3.4 361 21.1 138 18.3 87 20.0 225 9.8 586
Births 3.9 3,509 22.0 1,043 17.9 668 20.4 1,711 9.3 5,220
Bangladesh 2004 Current pregnancy 1.3 417 33.3 166 31.8 108 32.7 274 13.8 691
Births 1.2 5,000 33.5 1,043 33.2 951 33.4 1,993 10.4 6,993
India 2005-06 Current pregnancy 1.5 4,759 10.2 966 11.0 603 10.5 1,569 3.8 6,327
Births 1.1 44,880 9.7 5,302 11.2 6,195 10.5 11,497 3.0 56,377
Indonesia 2007 Current pregnancy 2.2 1,317 24.5 209 28.7 110 25.9 319 6.8 1,636
Births 2.2 13,148 19.2 2,022 23.2 1,236 20.7 3,257 5.9 16,405
Philippines 2003 Current pregnancy 11.0 445 23.6 186 33.2 112 27.2 298 17.5 744
Births 6.1 3,791 17.5 1,666 18.4 1,458 17.9 3,123 11.4 6,914
Vietnam 2002 Current pregnancy 1.3 198 48.6 30 60.5 21 53.5 50 11.8 248
Births 1.8 1,006 29.0 187 45.0 127 35.5 314 9.8 1,320
Egypt 2008 Current pregnancy 2.9 1,294 23.1 111 33.3 95 27.8 206 6.3 1,500
Births 2.4 9,121 25.8 504 24.8 959 25.1 1,462 5.6 10,583
Jordan 2007 Current pregnancy 3.3 808 51.2 212 38.2 116 46.6 329 15.8 1,136
Births 3.5 6,774 41.6 1,393 42.6 1,002 42.0 2,395 13.6 9,168
Morocco 2003-04 Current pregnancy 3.6 454 53.2 129 65.3 78 57.8 207 20.6 660
Births 3.7 4,223 53.8 885 60.1 917 57.0 1,801 19.6 6,024
Armenia 2005 Current pregnancy 0.8 148 28.1 21 21.6 18 25.1 39 5.9 187
Births 2.7 1,253 44.7 142 51.7 96 47.5 238 9.9 1,491
Azerbaijan 2006 Current pregnancy 5.3 249 18.4 30 40.3 15 25.7 45 8.5 294
Births 4.6 1,890 18.2 211 21.3 179 19.6 390 7.2 2,280
Moldova 2005 Current pregnancy 8.0 132 38.3 40 56.9 5 40.4 45 16.2 177
Births 6.9 1,267 43.8 178 44.0 145 43.9 323 14.4 1,589
Turkey 2003 Current pregnancy 2.9 267 48.6 106 50.8 91 49.6 197 22.8 464
Births 4.0 2,753 58.5 532 54.2 836 55.9 1,369 21.3 4,122
Ukraine 2007 Current pregnancy 3.1 154 21.0 17 29.0 10 23.9 27 6.2 181
Births 6.3 1,007 57.5 88 49.3 73 53.7 161 12.8 1,168
Colombia 2010 Current pregnancy 7.7 751 33.1 697 39.7 314 35.1 1,011 23.5 1,762
Births 5.8 7,664 31.1 4,435 33.4 3,745 32.1 8,180 19.4 15,844
Dominican Republic 2002 Current pregnancy 4.6 528 20.9 430 31.2 173 23.9 603 14.9 1,130
Births 4.1 6,167 21.4 3,186 18.4 1,420 20.5 4,605 11.1 10,772
Peru 2004-08 Current pregnancy 6.7 625 54.7 633 52.4 342 53.9 974 35.5 1,599
Births 1.2 6,517 43.5 4,530 40.3 3,927 42.0 8,457 24.2 14,974
Table A.2: Among current pregnancies and live births by wantedness status, percentage of each category that resulted from contraceptive failure, DHS surveys 2002-
2010