the impact of competency- based world language credits on
TRANSCRIPT

The Impact of Competency-Based World Language Credits on Graduation A Case Study from the Washington Road Map Districts June 2015


The Impact of Competency-Based World Language Credits on Graduation A Case Study from the Washington Road Map Districts Jason Greenberg Motamedi, Ph.D. Zafreen Jaffery, Ed.D. June 2015

About Education Northwest Founded as a nonprofit corporation in 1966, Education Northwest builds capacity in schools, families, and communities through applied research and development. Education Northwest evaluated the Road Map World Language Credit Program, a project that aims to recognize the asset of bilingualism by awarding students high school credit for their ability to speak, understand, read, and write a language other than English. The report, which summarizes data on the effect of the program on graduation rates, is submitted at the request of the Washington Office of Superintendent of Public Instruction.
Contact
Education Northwest 101 SW Main Street, Suite 500 Portland, OR 97204 educationnorthwest.org 503.275.9500
Authors
Jason Greenberg Motamedi, Ph.D. Zafreen Jaffery, Ed.D.
Suggested citation
Greenberg Motamedi, J., & Jaffery, Z. (2015). The impact of competency-based world language credits on graduation: A case study from the Washington Road Map districts. Portland, OR: Education Northwest.
Cover Image
Photograph by Amelia Stier; Copyright Education Northwest.
The impact of competency-based credits i
The World Language Competency Credit Program offered language proficiency assessments free of charge to students in the seven school districts participating in the Road Map Project. The Road Map English Language Learner Work Group proposed this project; it was funded by a grant from the Bill & Melinda Gates Foundation in 2012/13 and 2013/14, and administered by the Washington State Office of Superintendent of Public Instruction.
Executive Summary
The Road Map World Language Credit Program seeks to honor bilingualism by awarding up to four high school credits—the equivalent of four years of classroom language study—to students who demonstrate, in a standardized test, their ability to speak, understand, read, and write a language other than English. A previous study found that the program increased students’ pride in their proficiency in a language other than English, and encouraged them to view their language skills as a source of strength. Some students also reported that the credits they received helped them graduate on time or made them eligible to attend a four-year college; but at the time, no data were available to determine how widespread this benefit was (Greenberg Motamedi & Jaffery, 2014). For this study we reviewed the records of a sample of students who participated in the Road Map World Language Credit Program to determine whether credits earned through proficiency testing affected students’ ability to meet the districts’ requirements for graduation and become college eligible. These data were collected and provided by the Washington Office of Superintendent of Public Instruction (OSPI) and the participating districts; our role was to analyze data across the districts. We also interviewed district administrators regarding the future of the program, and examined the demographics of students who took the tests. We found that: World language credits helped some students graduate on time and become college eligible. One in five (21%) students who participated in the program needed their competency-based world language credits to graduate, and one in ten (10%) students who participated in the program needed the competency-based credits to be eligible to attend a four-year college. More Spanish-speaking students needed world language credits to graduate than did speakers of other languages. A third (34%) of Spanish-speaking participants needed the world language credits to graduate compared to far fewer (12%) speakers of other languages. Unexpectedly, the study also found that fewer current English language learners (ELL) needed the world language credits to graduate and be college eligible than other participants. Road Map district administrators said they planned to sustain the World Language Credit Program for the foreseeable future and will pay for student assessments using basic education funds. However, districts struggle to pay for less commonly assessed languages, and they are concerned that OSPI and Washington Association for Language Teachers (WAFLT) may not continue to provide support.
ii Education Northwest
Contents Evaluating the World Language Credit Program ................................................................................. 1
Who Participated in the World Language Credit Program? ............................................................... 3
Did the World Language Credit Program Help Students Graduate? ................................................ 5
Will Districts Sustain the World Language Credit Program? ............................................................ 13
Competency-Based Credits and Graduation ....................................................................................... 16
References ................................................................................................................................................. 17
Appendix: Participant Demographics .................................................................................................. 18
The impact of competency-based credits iii
Figures Figure 1 Most students qualified for three or more credits ............................................................... 3
Figure 2 Students in higher grades qualified for more credits than students in lower grades ......................................................................................................................................... 4
Figure 3 Most students graduated or were on track to graduate .................................................... 5
Figure 4 Fewer than half of the participants were college eligible .................................................. 6
Figure 5 One in five students needed the competency credits to graduate, and one in ten needed the credits to be college eligible ........................................................................ 7
Figure 6 A third of Spanish speakers needed competency-based credits to graduate .................. 9
Figure 7 Current ELLs needed the world language credits to graduate less often than former and never ELLs .......................................................................................................... 11
Figure 8 Current ELLs needed the proficiency credits to be college eligible less often than former and never ELLs ................................................................................................. 11
Tables
Table 1 Students took the assessments in 47 languages ................................................................... 4
Table 2 82 students needed world language competency credits to graduate on time, and 40 needed the credits to be college eligible ................................................................... 7
Table 3 Grade level and the percentage of students needing world language credits to graduate were not related ....................................................................................................... 8
Table 4 A higher percentage of Spanish speakers needed world language credits to graduate and be college eligible compared to speakers of other languages ................. 10
Table 5 Current ELLs appeared to benefit the least from the World Language Credit Program ................................................................................................................................... 12
Table 6 Most students needed social studies or English credits to graduate .............................. 12
Table A1 Most participants qualified for three or more credits ....................................................... 18
Table A2 On average, students qualified for three credits from the World Language Credit Program ....................................................................................................................... 18
Table A3 Students in higher grades participated in the program in greater numbers and qualified for more credits, on average, than those in lower grades................................ 19
Table A4 Students took the assessments in 47 languages ................................................................. 19
Table A5 There were differences between the average number of credits earned for each language .................................................................................................................................. 21
1 Education Northwest
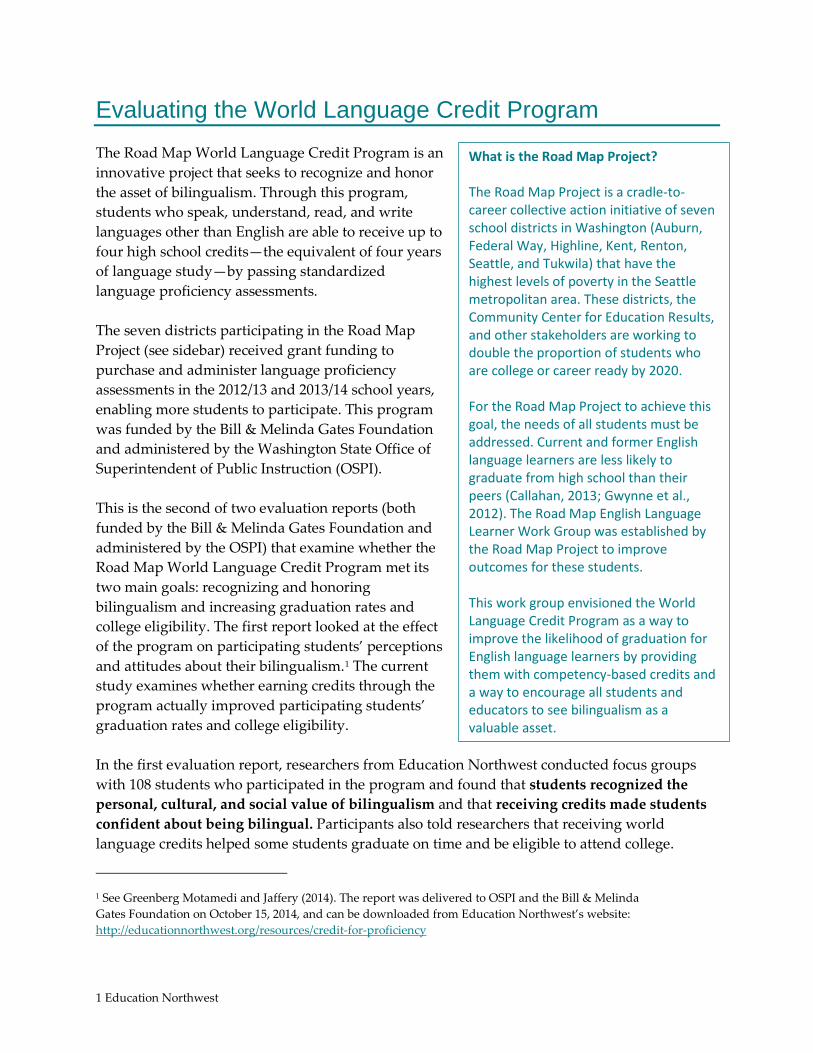
What is the Road Map Project? The Road Map Project is a cradle-to-career collective action initiative of seven school districts in Washington (Auburn, Federal Way, Highline, Kent, Renton, Seattle, and Tukwila) that have the highest levels of poverty in the Seattle metropolitan area. These districts, the Community Center for Education Results, and other stakeholders are working to double the proportion of students who are college or career ready by 2020. For the Road Map Project to achieve this goal, the needs of all students must be addressed. Current and former English language learners are less likely to graduate from high school than their peers (Callahan, 2013; Gwynne et al., 2012). The Road Map English Language Learner Work Group was established by the Road Map Project to improve outcomes for these students. This work group envisioned the World Language Credit Program as a way to improve the likelihood of graduation for English language learners by providing them with competency-based credits and a way to encourage all students and educators to see bilingualism as a valuable asset.
Evaluating the World Language Credit Program The Road Map World Language Credit Program is an innovative project that seeks to recognize and honor the asset of bilingualism. Through this program, students who speak, understand, read, and write languages other than English are able to receive up to four high school credits—the equivalent of four years of language study—by passing standardized language proficiency assessments. The seven districts participating in the Road Map Project (see sidebar) received grant funding to purchase and administer language proficiency assessments in the 2012/13 and 2013/14 school years, enabling more students to participate. This program was funded by the Bill & Melinda Gates Foundation and administered by the Washington State Office of Superintendent of Public Instruction (OSPI). This is the second of two evaluation reports (both funded by the Bill & Melinda Gates Foundation and administered by the OSPI) that examine whether the Road Map World Language Credit Program met its two main goals: recognizing and honoring bilingualism and increasing graduation rates and college eligibility. The first report looked at the effect of the program on participating students’ perceptions and attitudes about their bilingualism.1 The current study examines whether earning credits through the program actually improved participating students’ graduation rates and college eligibility. In the first evaluation report, researchers from Education Northwest conducted focus groups with 108 students who participated in the program and found that students recognized the personal, cultural, and social value of bilingualism and that receiving credits made students confident about being bilingual. Participants also told researchers that receiving world language credits helped some students graduate on time and be eligible to attend college.
1 See Greenberg Motamedi and Jaffery (2014). The report was delivered to OSPI and the Bill & Melinda Gates Foundation on October 15, 2014, and can be downloaded from Education Northwest’s website: http://educationnorthwest.org/resources/credit-for-proficiency

The impact of competency-based credits 2
Were students’ perceptions accurate? Did the Road Map World Language Credit Program provide students the opportunity to earn the necessary credits for graduation and college eligibility? Supported by a supplementary grant from the Bill & Melinda Gates Foundation, administrators from OSPI, data analysts from Road Map districts, and researchers from Education Northwest worked together to determine if the Road Map World Language Credit Program improved graduation rates and college eligibility among participants. Education Northwest researchers also examined demographic data for students who participated in the program in 2012/13 and 2013/14 (see the Appendix) and conducted interviews with administrators from each Road Map district about the future and sustainability of the World Language Credit Program at their districts and OSPI.

3 Education Northwest
How do we know who participated in the program? To understand who participated in the Road Map World Language Credit Program, Education Northwest collected student-level data from OSPI. These data include the district, grade level, tested language, and number of credits earned of every student who participated in the program from the Road Map districts in 2012/13 and 2013/14. Based on these data, researchers disaggregated (separated) the data by grade and language to calculate the number of students who participated in the program, and how many credits they received, on average.
Who Participated in the World Language Credit Program? A total of 2,364 students from the seven Road Map districts participated in the World Language Credit Program in the 2012/13 and 2013/14 school years. On average, students qualified for 3.1 credits, and almost three-quarters of the students (72%) qualified for three or four out of a total of four possible credits (Figure 1). Figure 1 Most students qualified for three or more credits
Source: OSPI World Language Credit Program data 2012/13 and 2013/14.
As a group, the students qualified for a total of 7,271 credits (Table A1 in the Appendix). High school students in higher grades participated in the Road Map World Language Credit Program in greater numbers and qualified for more credits, on average, than those in lower grades. For example, students who took the assessments in grade 11 and 12 qualified, on average, for 3.3 credits, while those in lower grades qualified for fewer credits (Figure 2, Table A3 in the Appendix).
1%
6%
21%
28%
44%
0 Credits(n=30)
1 Credit(n=131)
2 Credits(n=504)
3 Credits(n=664)
4 Credits(n=1,036)

The impact of competency-based credits 4
Figure 2 Students in higher grades qualified for more credits than students in lower grades
Source: OSPI World Language Credit Program data 2012/13 and 2013/14.
Students took assessments in 47 languages (Table 1). Of these, 14 languages represented most (93%) of the participants (Table A4 in the Appendix has full results). Table 1 Students took the assessments in 47 languages Number
of Students Percent
of Students Average Credits
Spanish 1,397 59.1% 2.9 Vietnamese 153 6.5% 3.8 Somali 88 3.7% 3.0 Chinese 85 3.6% 3.3 Arabic 68 2.9% 3.3 Russian 68 2.9% 3.0 Ukrainian 55 2.3% 3.4 Punjabi 52 2.2% 3.4 Amharic 50 2.1% 3.9 Tagalog 47 2.0% 3.9 Nepali 39 1.6% 3.4 French 35 1.5% 2.1 Japanese 29 1.2% 2.3 Korean 28 1.2% 3.8 Other languages (33) 170 7.2% 3.3 All languages 2,364 3.1
Source: OSPI World Language Credit Program data 2012/13 and 2013/14.
2.6
2.9
3.2 3.3 3.3
Grade 8(n=220)
Grade 9(n=372)
Grade 10(n=476)
Grade 11(n=555)
Grade 12(n=486)

5 Education Northwest
What does it mean to be on track? We did not have graduation or college eligibility data for the grade 11 students who took the assessments in 2013/14. Instead, we asked Road Map district data analysts to examine students’ records and determine if students had met their district’s expectations for adequate progress and credit accrual toward graduation requirements and being eligible for a four-year college in Washington state.
Did the World Language Credit Program Help Students Graduate On Time and Become Eligible for College?
This study uses a sample of 392 students in grades 11 and 12 who participated in the World Language Credit Program in 2012/13 and 2013/14 to determine if the program improved students’ graduation rate and college eligibility. There are five key findings related to participants’ graduation rates and college eligibility.
Most participants graduated or were on track to graduate from high school, but fewer than half were eligible for college admission.
Of the 392 students in the sample, Road Map district data analysts determined that 82 percent (322 students) graduated on time or were on track to graduate (Figure 3). This is higher than the average for either the Road Map districts as a whole (72%) or Washington state (76%).2 Figure 3 Most students graduated or were on track to graduate (N=392)
Source: Highline, Kent, Renton, and Seattle district data from 2012/13 and 2013/14. Fewer than half (45%) of the students who participated in the World Language Credit Program met the course requirements for admission to a four-year college or university (Figure 4).3
2 These are the adjusted four-year cohort graduation rates for 2012/13 (OSPI data and reports).
3 Washington Higher Education Coordinating Board’s minimum college admission standards for a four year college or university can be accessed: http://www.wsac.wa.gov/sites/default/files/RevisedMCASOverviewParents-April2011_1.pdf
Graduated, 63%
On track to graduate,
19%
Did not graduate,
18%

The impact of competency-based credits 6
Figure 4 Fewer than half of the participants were college eligible (N=392)
Source: Highline, Kent, Renton, and Seattle district data from 2012/13 and 2013/14.
Graduated college eligible,
45%
Graduated not college eligible,
37%
Did not graduate,
18%
How do we know that the Road Map World Language Credit Program helped students graduate? OSPI and Road Map district staff members created a sample and dataset. Supported by a grant from the Bill & Melinda Gates Foundation, OSPI identified 698 grade 11 and grade 12 students that participated in the program in 2012/13 and 2013/14 and earned at least one credit. These grades were chosen because Road Map district data analysts would be able to examine and analyze student records to answer a series of questions:
• Did the student graduate on time, or were they on track to graduate based on your district’s requirements?
• Did the student need competency-based language credits to graduate or be on track to graduate based on your district’s requirements?
• Is the student a current or former English language learner (ELL)? • Has the student completed course requirements for college admission based on the Washington
Higher Education Coordinating Board’s standards? Districts submitted student data to OSPI, which then removed student names, identification numbers, and schools from the dataset and securely uploaded it to Education Northwest. Education Northwest cleaned, compiled, and analyzed the data. Of the 698 individual student records in the sample, more than half (56%) were complete and included in the final dataset. Three of the seven districts (Auburn, Federal Way, and Tukwila) were not able to determine if credits were necessary for graduation or being on track to graduation, and were therefore excluded from the study. We have no reason to believe that students from the excluded districts would have performed differently than those in the study. The final dataset included 392 students, who comprise 38 percent of the 1,041 Road Map students who took the assessments in grade 11 and 12 in 2012/13 and 2013/14. Education Northwest researchers disaggregated the data by grade level, home language, and ELL status, and examined differences between groups (using the Chi-Square statistical test) to determine whether differences between groups were likely due to population differences (such as between current ELLs and other students) or the result of chance and normal variation. The results of these tests are reported only when the difference is significant.
7 Education Northwest
World language credits helped some students graduate on time and become college eligible.
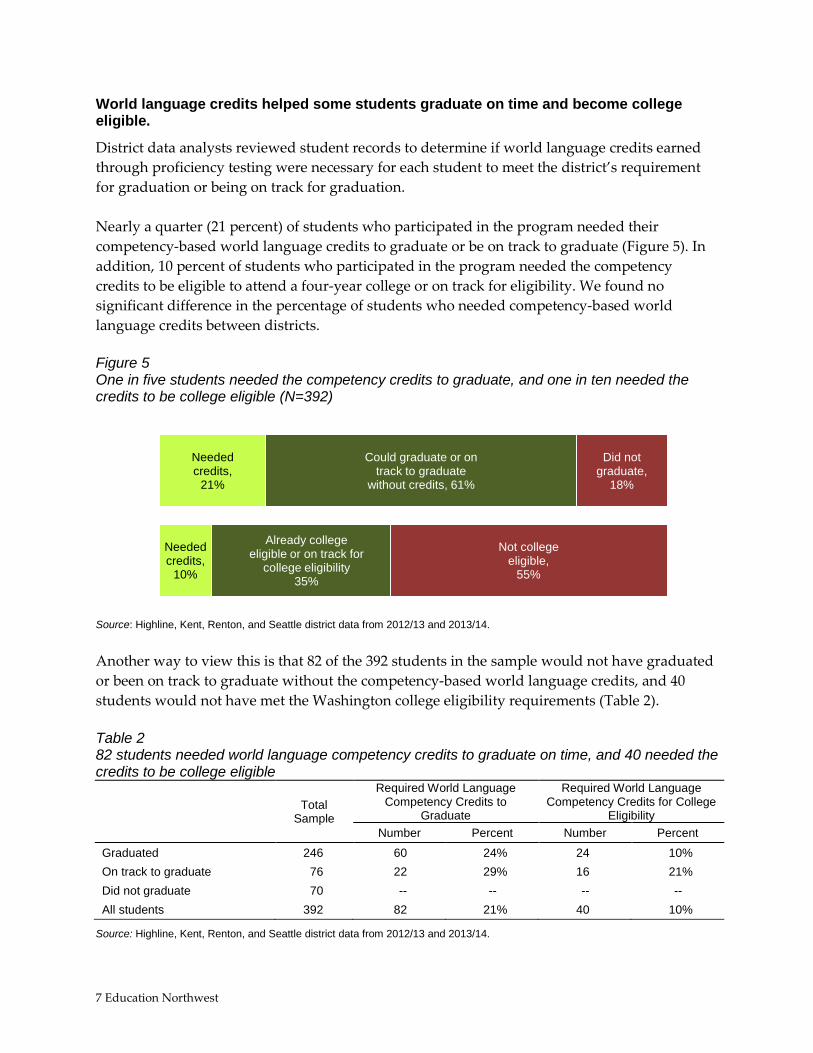
District data analysts reviewed student records to determine if world language credits earned through proficiency testing were necessary for each student to meet the district’s requirement for graduation or being on track for graduation. Nearly a quarter (21 percent) of students who participated in the program needed their competency-based world language credits to graduate or be on track to graduate (Figure 5). In addition, 10 percent of students who participated in the program needed the competency credits to be eligible to attend a four-year college or on track for eligibility. We found no significant difference in the percentage of students who needed competency-based world language credits between districts. Figure 5 One in five students needed the competency credits to graduate, and one in ten needed the credits to be college eligible (N=392)
Source: Highline, Kent, Renton, and Seattle district data from 2012/13 and 2013/14.
Another way to view this is that 82 of the 392 students in the sample would not have graduated or been on track to graduate without the competency-based world language credits, and 40 students would not have met the Washington college eligibility requirements (Table 2). Table 2 82 students needed world language competency credits to graduate on time, and 40 needed the credits to be college eligible
Total Sample
Required World Language Competency Credits to
Graduate
Required World Language Competency Credits for College
Eligibility Number Percent Number Percent
Graduated 246 60 24% 24 10% On track to graduate 76 22 29% 16 21% Did not graduate 70 -- -- -- -- All students 392 82 21% 40 10%
Source: Highline, Kent, Renton, and Seattle district data from 2012/13 and 2013/14.
Needed credits,
10%
Needed credits,
21%
Already college eligible or on track for
college eligibility 35%
Could graduate or on track to graduate
without credits, 61%
Not college eligible,
55%
Did not graduate,
18%

The impact of competency-based credits 8
Students who graduated or were on track to graduate are combined in all subsequent analyses in this report as “graduated.” Similarly, students who were college eligible or were on track to be college eligible are combined as “college eligible.” We found that there were only minor differences between grade levels. A slightly higher percentage of students who tested in grade 11 than grade 12 needed the world language credits to graduate (22% compared to 20%) or to be college eligible (13% compared to 8%, see Table 3). However, these differences were not statistically significant and may represent chance rather than real differences between the students. Table 3 Grade level and the percentage of students needing world language credits to graduate were not related
Tested in Grade Total Sample
Number Graduated
Required World Language Competency Credits to
Graduate
Required World Language Competency Credits for
College Eligibility Number Percent Number Percent
Grade 11 181 147 39 22% 24 13%
Grade 12 211 175 43 20% 16 8%
All grades 392 322 82 21% 40 10%
Source: Highline, Kent, Renton, and Seattle district data from 2012/13 and 2013/14. More Spanish-speaking students needed world language credits to graduate than speakers of other languages.
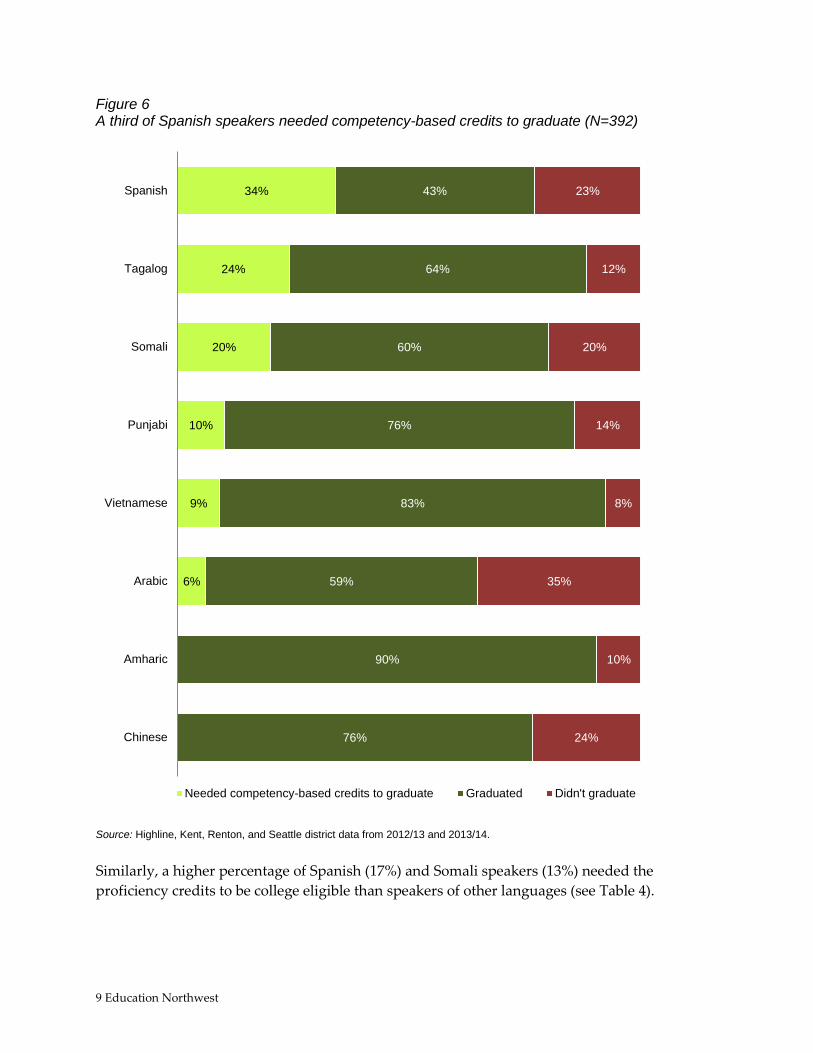
There were large differences between language groups based on the percentage of students who needed the world language credits to graduate.4 According to district analysis, a higher percentage of Spanish-speaking students (34%) needed the world language credits to graduate compared to speakers of other languages (12% combined, see Figure 6).
4 Significance testing between languages was not possible because small cell counts made results invalid.
9 Education Northwest
Figure 6 A third of Spanish speakers needed competency-based credits to graduate (N=392)
Source: Highline, Kent, Renton, and Seattle district data from 2012/13 and 2013/14. Similarly, a higher percentage of Spanish (17%) and Somali speakers (13%) needed the proficiency credits to be college eligible than speakers of other languages (see Table 4).
34%
24%
20%
10%
9%
6%
43%
64%
60%
76%
83%
59%
90%
76%
23%
12%
20%
14%
8%
35%
10%
24%
Spanish
Tagalog
Somali
Punjabi
Vietnamese
Arabic
Amharic
Chinese
Needed competency-based credits to graduate Graduated Didn't graduate

The impact of competency-based credits 10
Table 4 A higher percentage of Spanish speakers needed world language credits to graduate and be college eligible compared to speakers of other languages
Total sample
Number graduated
Required world language proficiency credits to graduate
Required world language proficiency credits for college
eligibility Number Percent Number Percent
Spanish 161 124 55 34% 28 17%
Vietnamese 66 61 6 9% 3 5%
Amharic 21 19 0 0% 0 0% Punjabi 21 18 2 10% 0 0% Arabic 17 11 1 6% 0 0% Chinese† 17 13 0 0% 0 0% Tagalog 17 15 4 24% 1 6% Somali 15 12 3 20% 2 13% Other languages 57 49 11 19% 6 11% All languages 392 322 82 21% 40 10%
† Combined Cantonese, Mandarin, Mandarin with traditional characters, and Mandarin with simplified characters. Note: To ensure anonymity, we combined results from languages with fewer than 10 participants into “other languages.” Source: Highline, Kent, Renton, and Seattle district data from 2012/13 and 2013/14.
Current ELLs needed the world language credits to graduate and be college eligible less often than other students.
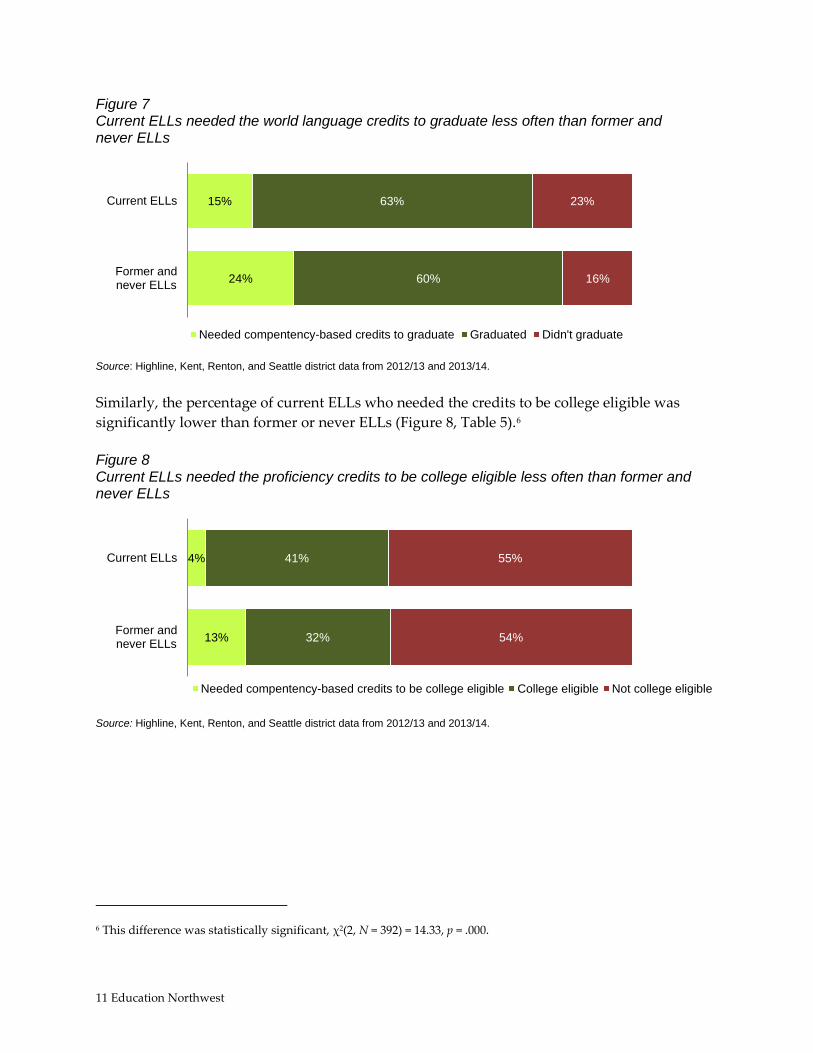
The World Language Credit Program was originally intended to help ELLs and students with a home language other than English feel proud of their language and to help them graduate and be college eligible. Unexpectedly, current ELLs (students receiving or eligible to receive ELL services) who participated in the program needed the world language credits to graduate and be college eligible less often than did other students. Nearly a quarter (24%) of former ELLs (students who had previously been eligible for ELL services but were reclassified) and never ELLs (students who never received ELL services) needed the competency-based credits to graduate, compared to 15 percent of current ELLs who needed these credit (Figure 7).5
5 This difference was statistically significant, χ2(2, N = 392) = 12.43, p = .000.
11 Education Northwest
Figure 7 Current ELLs needed the world language credits to graduate less often than former and never ELLs
Source: Highline, Kent, Renton, and Seattle district data from 2012/13 and 2013/14.
Similarly, the percentage of current ELLs who needed the credits to be college eligible was significantly lower than former or never ELLs (Figure 8, Table 5).6 Figure 8 Current ELLs needed the proficiency credits to be college eligible less often than former and never ELLs
Source: Highline, Kent, Renton, and Seattle district data from 2012/13 and 2013/14.
6 This difference was statistically significant, χ2(2, N = 392) = 14.33, p = .000.
15%
24%
63%
60%
23%
16%
Current ELLs
Former andnever ELLs
Needed compentency-based credits to graduate Graduated Didn't graduate
4%
13%
41%
32%
55%
54%
Current ELLs
Former andnever ELLs
Needed compentency-based credits to be college eligible College eligible Not college eligible

The impact of competency-based credits 12
Table 5 Current ELLs appeared to benefit the least from the World Language Credit Program
Total sample
Number graduated
Required world language competency credits to
graduate
Required world language competency credits for
college eligibility Number Percent Number Percent
Current ELLs 124 96 18 15% 5 4%
Former and never ELLs 268 226 64 24% 35 13%
All students 392 322 82 21% 40 10%
Source: Highline, Kent, Renton, and Seattle district data from 2012/13 and 2013/14.
Students who did not graduate needed social studies and English credits.
Of the 70 students in the sample who did not graduate, approximately three-quarters lacked the required number of social studies (76%) or English (73%) credits. A smaller percentage (20%) of the students lacked elective credits (Table 6). Presumably some of these elective requirements were filled by competency-based world language credits. Table 6 Most students needed social studies or English credits to graduate (N=70)
N Percent
Social studies 53 76% English 51 73% Math 46 66% Science 36 51% Health and fitness 35 50% Arts 25 36% Occupational education 19 27% Electives 14 20%
Source: Highline, Kent, Renton, and Seattle district data from 2012/13 and 2013/14.

13 Education Northwest
How do we know about the sustainability of the program? To understand more about how the Road Map districts were continuing to support students earning competency-based world language credits, Education Northwest interviewed an administrator or staff member in each district. We asked them how they used the grant money to support the program, that is, whether they used the grant money solely to pay for assessments or if it was also used to pay for staff time. We then asked whether they were continuing to offer district-subsidized competency-based world language credit testing for their students and, if so, where the money came from to do so.
The World Language Credit Program is wildly popular and successful, so I don’t really worry about it losing local funding. There is a lot of support across different stakeholders, and it is a low-cost way to generate a lot of school credits. It acknowledges and recognizes students’ strengths, and it is a huge benefit.
—District administrator
Will Districts Sustain the World Language Credit Program? In 2012/13 and 2013/14, Road Map districts used the Bill & Melinda Gates Foundation grant to pay for most of the language assessments for Road Map high school students who participated in the program. While this funding is no longer available, all seven Road Map districts plan to sustain the World Language Credit Program for the foreseeable future by purchasing student assessments with basic education funds. However, even with the grant, not all districts paid for all assessments. For example, in the first year of the program (2012/13) Federal Way School District purchased assessments only for those students who were eligible for free or reduced-price lunch. In addition, both Federal Way and Seattle Public Schools used grant and district funds to purchase language assessments for grade 8 students, while other districts only paid for assessments for students in high school. Grant money was also used to pay for classroom teachers, lab assistants, or other staff members to proctor assessments outside of their regular hours. Other administrative staff, such as the World Language Credit Program coordinator of each district, worked on the grant as a part of their regular responsibilities.
Districts plan to use basic education funds to sustain the World Language Credit Program.
District administrators were optimistic they could find ways to continue funding the World Language Credit Program, which they felt was a great benefit to their students and communities. All districts plan to sustain the program and to continue paying for student assessments for the foreseeable future. In 2014/15, the year after the grant completed, Road Map districts used basic education funds to pay for most student assessments. Six of the seven Road Map districts plan to continue to pay for assessments for all high school participants. Seattle, however, has prioritized assessment funding for grade 11 and 12 students. Seattle also pays for language testing for grade 8 students

The impact of competency-based credits 14
Who created the language assessments? Three commercial testing companies offer assessments for approximately 80 languages. Although the companies have adapted their tests to measure the proficiency and literacy of bilingual students, some languages still lack assessments. To support the districts and serve the students of these languages, the Supervisor of World Languages at the OSPI partnered with the Washington Association for Language Teachers (WAFLT) to provide a temporary on-demand solution. However, district administrators said that this support was inconsistent in 2014/15, and that both OSPI and WAFLT will need to increase capacity if they are to expand the program to reach more of Washington’s biliterate students.
completing dual immersion programs in Seattle’s International Schools. Road Map district administrators will continue to support the World Language Credit Program as a part of their regular responsibilities. Other staff members, such as paraprofessionals and classroom or ELL teachers who proctor language assessments outside of their regular hours will be paid through basic education funds.
Districts struggle to provide assessments to students who speak less commonly assessed languages, and they are concerned about OSPI’s continuing support for these assessments.
While districts have strong support from their local leadership, school boards, and communities to continue the program, district administrators identified two potential challenges that threaten the sustainability of the program: paying for tests in less commonly assessed languages and continuing to receive state support to provide testing for all languages spoken by Washington state students. District administrators expressed concern about the cost and availability of proficiency tests for less commonly assessed languages.7 District administrators pointed out that a language can be less common in general, but still prevalent within a given district. The cost of assessments for such languages is often high, and it is not likely that families would be willing or able to afford them. Individual districts are often not able to arrange testing in these less commonly assessed languages. A few administrators said that their districts may work directly with the testing companies in the future rather than having OSPI and Washington Association for Language Teachers (WAFLT) set up the tests for them; but others said that the cost for this additional administrative task would be prohibitive, especially for smaller districts. All administrators stressed that they needed some level of continued support from OSPI, especially in regard to setting up the test and increasing awareness of the program within the broader community.
7 Examples of less commonly assessed languages in the Road Map districts include Chamorro, Hakka-Chin, Marshallese, Oromo, and Samoan. OSPI maintains a spreadsheet of languages and assessment costs at http://www.k12.wa.us/WorldLanguages/pubdocs/CompetencyAssessmentOptions2015-01-21.xlsx

15 Education Northwest
Having OSPI set the testing up is crucial for us, and we will not be able to sustain the World Language Credit Program if that piece does not stay in place. With OSPI’s support, this has been the easiest project to implement and it has been so positive for students and families. If OSPI continues to support it I do not know why we could not continue it indefinitely.
—District administrator
The Supervisor of World Languages at OSPI said that they have experienced bottle-necks and delays because of the success of this program and increasing number of students testing. In response, OSPI has redesigned the system to decrease the time between testing and receiving the results. Also, in response to requests by OSPI, the testing companies have improved their data interfaces, allowing student results to be accessed in a timely fashion. Finally, OSPI is working to establish assessments for underserved languages that meet the requirements of student data security.
The impact of competency-based credits 16
What are the study limitations? The students who participated in the World Language Credit Program were self-selected, that is they chose to participate. Similarly, the seven districts that participated in this study were not selected randomly. Therefore, student outcomes and experiences with the program are likely to be different from students who did not choose to participate in the program, and from districts who did not participate in the study.
Competency-Based Credits and Graduation The number of students who speak a language other than English at home has grown substantially in Washington. In just nine years (2004/05–2012/13), their number has more than doubled (105% growth). Currently, nearly one in five students (17%) in the Road Map districts speaks a language other than English at home (OSPI, 2012/13 Data and Reports). Some of these students struggle to earn enough credits to graduate. For example, fewer than half (46%) of current ELLs in the Road Map districts graduated on time, compared to 76 percent of all Washington students and 72 percent of all students in the Road Map districts (Came & Ireland, 2013; Community Center for Education Results, 2013). Beginning 2019, the graduation requirement for Washington students will increase from 20 to 24 credits, including two credits of World Language. As graduation requirements increase, programs that award competency-based credits may become instrumental in helping students graduate. The Road Map World Language Credit Program was designed to provide students with support to graduate from high school and be prepared for college. This evaluation shows that the program clearly helped a group of students to graduation, providing them with the opportunity to use their language skills to their advantage and earn the credits they needed to graduate from high school and be college eligible. Unexpectedly, however, current ELLs benefited less from the program than other students. The reasons for this are unknown, but one explanation, suggested by a district administrator, is that most students who qualified for ELL services in high school were recent arrivals to the United States, some of whom may have been awarded credits for high school courses completed in their home countries. This should be explored in the future so we can understand how to help students benefit from a testing program that is specifically designed to help them. Yet, despite the fact that current ELLs benefited less than their peers, the Road Map World Language Credit Program was clearly successful. The program promoted students’ pride in their proficiency in a language other than English, and most participants recognized the value of bilingualism and said that they had increased confidence about being bilingual (Greenberg Motamedi & Jaffery 2014). The Road Map World Language Credit Program also improved graduation rates and college eligibility among some participants. The program has proven to be a popular and innovative model for delivering competency-based credits and honoring the rich cultural heritage that students bring with them from their families and communities.
17 Education Northwest
References Callahan, R. M. (2013). The English learner dropout dilemma: Multiple risks and multiple resources
(Report No. 19). Retrieved from University of California Santa Barbara, Gevirtz Graduate School of Education, California Dropout Research Project website: http://www.cdrp.ucsb.edu/download.php?file=researchreport19.pdf
Came, D., & Ireland, L. (2013). Report to the Legislature: Graduation and dropout statistics annual
report 2012–13. Retrieved from Office of Superintendent of Public Instruction website: http://www.k12.wa.us/dataadmin/pubdocs/GradDropout/12-13/2012-13GraduationAndDropoutStatisticsAnnualReport.pdf
Community Center for Education Results, Road Map Project. (2013). The Road Map Project 2013
results report. Retrieved from http://www.nxtbook.com/nxtbooks/cced/2013annualreport/ Greenberg Motamedi, J., & Jaffery, Z. (2014). Credit for proficiency: The impact of the Road Map
World Language Credit Program on student attitudes toward bilingualism and school. Portland, OR: Education Northwest. Retrieved from Education Northwest website: http://educationnorthwest.org/resources/credit-for-proficiency
Gwynne, J., Pareja, A. S., Ehrlich, S. B., & Allensworth, E. (2012). What matters for staying on-track
and graduating in Chicago Public Schools: A focus on English language learners. Chicago, IL: University of Chicago, Consortium on Chicago School Research.
Office of Superintendent of Public Instruction. “K–12 Data and Reports: English Language
Learners: Enrollment, 2005–06 through 2012–13.” Retrieved from Office of Superintendent of Public Instruction website: http://data.k12.wa.us/PublicDWP/web/Washingtonweb/ReportBuilder/AnalysisServices/ReportBuilder.aspx

The impact of competency-based credits 18
Appendix: Participant Demographics A combined total of 2,364 students from the seven Road Map districts participated in the program in the 2012/13 and 2013/14 school years. Students’ reading, writing, speaking, and comprehension were assessed for each language. On average, students who participated in the program qualified for 3.1 credits, and most qualified for three or more credits (Table A1). Table A1 Most participants qualified for three or more credits (N=2,364)
Percent of Students Total Credits
0 Credits 1% 0 1 Credit 6% 131 2 Credits 21% 1,008 3 Credits 28% 1,992 4 Credits 44% 4,140
Total 7,271
Source: OSPI World Language Credit Program data 2012/13 and 2013/14. There were differences in average credits by district, but these were not statistically significant, which means that they may have occurred by chance and do not necessarily reflect a difference between groups of students (Table A2). Table A2 On average, students qualified for three credits from the World Language Credit Program (N=2,364)
Percent
of Students Total
Credits Average Credits
Auburn School District 17% 1,120 2.8 Federal Way Public Schools 10% 671 2.9 Highline Public Schools 19% 1,477 3.2 Kent School District 14% 1,100 3.2 Renton School District 15% 1,129 3.2 Seattle Public Schools 18% 1,243 3.0 Tukwila School District 7% 531 3.1
Total 7,271 3.1
Source: OSPI World Language Credit Program data 2012/13 and 2013/14.
Students in higher grades participated in the program in greater numbers and qualified for more credits, on average, than those in lower grades. This difference is statistically significant, suggesting that the difference is not due to chance and that there is a relationship between grade level and performance on the assessments (Table A3).

19 Education Northwest
Table A3 Students in higher grades participated in the program in greater numbers and qualified for more credits, on average, than those in lower grades
Number
of Students Percent
of Students Average Credits*
Grade 6 98 4% 2.2† Grade 7 42 2% 2.6† Grade 8 220 10% 2.6 Grade 9 372 17% 2.9 Grade 10 476 21% 3.2 Grade 11 555 25% 3.3 Grade 12 486 22% 3.3
Total 2,249‡ 3.1
*Differences in average credits earned between grades were statistically significant, F(6, 2240) = 37.56. p = .000. †Sixth- and seventh-grade students were participants in a dual language program for heritage Spanish speakers. They did not earn high school credits from this program but were tested to help determine what additional support they might need for developing literacy skills in Spanish. ‡115 students (5% of total) were missing grade-level data and are not included in this table. Source: OSPI World Language Credit Program data 2012/13 and 2013/14.
Students who participated in the Road Map World Language Credit Program took assessments in 47 languages. Among participants, Spanish speakers were overrepresented, meaning a higher percentage of Spanish speakers took the assessment (59%) than live in the community (42%). Somali and Vietnamese speakers were underrepresented (Table A4). Table A4 Students took the assessments in 47 languages
All Program Participants Percent of Road Map Students
With a Home Language Other Than English
Number of Students
Percent of Students
Spanish 1,397 59.1% 41.8%
Vietnamese 153 6.5% 10.4%
Somali 88 3.7% 7.7%
Chinese† 85 3.6% 3.7%
Arabic 68 2.9% 1.5%
Russian 68 2.9% 3.2%
Ukrainian 55 2.3% 3.9%
Punjabi 52 2.2% 2.7%
Amharic 50 2.1% 1.8%
Tagalog 47 2.0% 3.3%
Nepali 39 1.6% 0.8%
French 35 1.5% 0.4%
Japanese 29 1.2% 0.4%
Korean 28 1.2% 1.7%
Swahili 21 0.9% 0.5%
Burmese 18 0.8% 0.4%
Marshallese 17 0.7% 0.8%

The impact of competency-based credits 20
All Program Participants Percent of Road Map Students
With a Home Language Other Than English
Number of Students
Percent of Students
Turkish 14 0.6% 0.5%
Tigrinya 12 0.5% 1.0%
German 12 0.5% 0.1%
Samoan 11 0.5% 1.3%
Bosnian 8 0.3% 0.3%
Hindi 6 0.3% 0.6%
Bengali 5 0.2% 0.1%
Oromo 5 0.2% 0.8%
Farsi 4 0.2% 0.3%
Romanian 4 0.2% 0.4%
Thai 3 0.1% 0.2%
Chin Tedim 3 0.1% 0.1%
Portuguese 3 0.1% 0.1%
Kinyarwanda 2 0.1% <0.1%
Armenian 2 0.1% <0.1%
Cambodian 2 0.1% 1.7%
Hakka Chin 2 0.1% 0.1%
Khmer 2 0.1% 0.1%
Tongan 2 0.1% 0.2%
Twi 2 0.1% <0.1%
Croatian 1 <0.1% <0.1%
Hmong 1 <0.1% 0.1%
Hungarian 1 <0.1% <0.1%
Italian 1 <0.1% <0.1%
Karen 1 <0.1% 0.1%
Karenni 1 <0.1% 0.1% Kirundi 1 <0.1% <0.1%
Kosraean 1 <0.1% 0.2%
Polish 1 <0.1% 0.1%
Urdu 1 <0.1% 0.3%
Total 2,364 †Combined Cantonese, Mandarin with traditional characters, and Mandarin with simplified characters. Sources: OSPI World Language Credit Program data 2012/13 and 2013/14, and OSPI K–12 Data and Reports.
Finally, there were significant differences between languages. For example, Amharic, Burmese, Tagalog, and Turkish biliterates received more credits, on average, than other languages (Table A5).

21 Education Northwest
Table A5 There were differences between the average number of credits earned for each language
Number of Students Percent of Students Average Credits Earned* Amharic 50 2% 3.9 Burmese 18 1% 3.9 Tagalog 47 2% 3.9 Turkish 14 1% 3.9 Vietnamese 153 7% 3.8 Korean 28 1% 3.8 Marshallese 17 1% 3.6 Ukrainian 55 2% 3.4 Punjabi 52 2% 3.4 Nepali 39 2% 3.4
Chinese† 85 4% 3.3 Russian 68 3% 3.3 Somali 88 4% 3.0 Arabic 68 3% 3.0 Spanish 1,397 59% 2.9 Tigrinya 12 1% 2.8 Samoan 11 1% 2.8 Swahili 20 1% 2.4 Japanese 29 1% 2.3 German 12 1% 2.3 French 35 2% 2.1 Other languages 66 3% 3.4
Total 2,364 3% 3.1
†Combined Cantonese, Mandarin with traditional characters, and Mandarin with simplified characters. *Differences in average credits earned between languages were statistically significant, F(21, 2340) = 19.68. p = .000. Note: To ensure anonymity, we combined results from languages with fewer than 10 participants into “other languages.” Source: OSPI World Language Credit Program data 2012/13 and 2013/14.