the impact of brand on consumer preferences of milk in
TRANSCRIPT
345
ACTA UNIVERSITATIS AGRICULTURAE ET SILVICULTURAE MENDELIANAE BRUNENSIS
Volume 69 32 Number 3, 2021
THE IMPACT OF BRAND ON CONSUMER PREFERENCES OF MILK IN ONLINE PURCHASES:
CONJOINT ANALYSIS APPROACH
Šárka Velčovská1, Fridrik Rafn Larsen2
1 Department of Marketing and Business, Faculty of Economics, VŠB-Technical University of Ostrava, 17. listopadu 2172/15, 708 00 Ostrava-Poruba, Czech Republic
2 Faculty of Business Administration, School of Social Sciences, University of Iceland, Sæmundargata 2, 102 Reykjavík, Iceland
Link to this article: https://doi.org/10.11118/actaun.2021.032Received: 13. 3. 2021, Accepted: 26. 4. 2021
To cite this article: VELČOVSKÁ ŠÁRKA, LARSEN FRIDRIK RAFN. 2021. The Impact of Brand on Consumer Preferences of Milk in Online Purchases: Conjoint Analysis Approach. Acta Universitatis Agriculturae et Silviculturae Mendelianae Brunensis, 69(3): 345–356.
Abstract
The aim of the paper is to determine preferences of Czech consumers in online shopping of long-life semi-skimmed milk and to identify the importance of milk attributes in their online buying process, with focus on brand. Specifically, the study is focusing on: 1) identification of the importance of a brand in comparison with packaging, price and quality label in online purchases, 2) finding milk with maximum utility for consumers, and 3) revealing the most preferred brand of milk when other attributes stay the same. Data were collected in September 2018 through an online survey, using full-profile conjoint analysis. A total of 185 respondents 18+ living in the Czech Republic, selected by quota sampling method concerning the role of men and women in household food purchases, completed a questionnaire. Research results reveal that brand is the most important extrinsic quality cue affecting milk choice in online purchases, with relative importance 50.3%. The importance of other surveyed attributes is balanced, with 18.6% for packaging, 17.6% for price and 13.5% for quality label. Comparison of consumer preferences for three different brands of milk with otherwise the same attributes revealed the highest preference for brand coming from the region. A familiar brand plays a key role in maintaining a competitive position in the online grocery market.
Keywords: brand, conjoint analysis, consumer behaviour, consumer preferences, milk market, online grocery shopping, product profile, quality cues, survey
INTRODUCTIONIt was only a few years ago when online food
shopping seemed to be a relatively novel concept. Nowadays, online shopping for groceries is becoming more and more popular (International Food Information Council Foundation, 2019). According to data from Euromonitor International, e-commerce is the fastest-growing channel for global packaged food sales, increasing by 21% during the period 2014–2019 (Euromonitor International, 2020). In Europe alone, the online grocery market is expected to grow 66% by 2023. And globally, the
study of Nielsen company forecasts that 70% of consumers will do their grocery shopping online by 2024 (Ecommerce News, 2020).
The significant point is that online grocery shopping is becoming more accessible by the day, the amount of food products sold online is increasing (Dominici et al., 2021) and more consumers are willing to use it (Saunders, 2018). The importance of online purchases is underlined by the facts that the population grows older, communication technologies develop, and consumers become more familiar with it (Anesbury

346 Šárka Velčovská, Fridrik Rafn Larsen
et al., 2016). Grocery producers therefore cannot ignore that their brands operate in a digital world. In such a fast-paced sector of online grocery, it can be difficult to keep the brand on top. Producers need to understand not only the influencing factors in consumer food choice and identify their impact on a purchase decision, but they also need to understand the motivations, preferences and factors affecting the choice of digital consumers so that they can evolve their brand strategies accordingly and remain competitive. The positive customer experience with the brand builds not only brand loyalty and brand image but also increases the degree of recommendation to other potential customers. The favourable brand experience is closely linked with brand competitiveness, because the more positive impact it has on the customer, the better the brand is perceived in comparison with the competition (Gavurová et al., 2018).
The COVID-19 pandemic has brought a new perspective to online food shopping. In the first days of the pandemic, online grocery stores were overloaded and often failed to meet the sudden demand. Some retailers moved quickly, identified the issues, and adapted their strategy. According to new Euromonitor whitepaper ‘COVID-19's Effect on Packaged Food’, the packaged food industry is one of the few areas to experience a surge in demand as a direct result of the pandemic. In addition, the government's recommendation to buy online and home seclusion has pressured consumers to adopt online channels, and the response from producers quickly translated into optimizing online services to reach a larger customer base – encompassing generations who may not have considered e-commerce as an option before. Data from Euromonitor's lifestyle survey in February 2020 shows that groceries were the most purchased category online, from consumers buying regularly online (around four to seven activities per week) to less active digital consumers (Euromonitor International, 2020). A significant increase of online grocery shopping is also evident in the Czech Republic. While in 2016 only two percent of Czech consumers regularly bought groceries online, in 2020 it was every sixth Czech (KPMG, 2016; KPMG, 2020). In cities with more than 100,000 inhabitants, at least half of consumers have already tried online grocery shopping (KPMG, 2020).
Empirical evidence on consumer behaviour and preferences in the grocery market is rather abundant. However, it is difficult to generalize the results of these studies. They have been carried out in different countries where consumer behaviour can be culturally specific and most of them do not concern online purchases (Meyerding et al., 2019; Sadílek, 2019; Rondoni et al., 2021).
Studies on the identification of factors influencing consumer buying intention in the online grocery market (Heng et al., 2018; Loketkrawee and
Bhatiasevi, 2018; Bauerová and Braciníková, 2021; Dominici et al., 2021) are focused on food products, regardless of the differences between product categories. However, these factors vary depending on the product category and should not be generalized. Other studies of online grocery market deal with consumer adoption of online food shopping (Wang and Somogyi, 2018; Piroth et al., 2020), changes in food purchasing during the COVID-19 pandemic (Lai et al., 2021), individuals' motivations for shopping for groceries online (Pitts et al., 2018), psychological pricing in online food retailing (Hillen, 2021), the impact of services offered and delivery conditions on consumers’ decision making in online grocery shopping (Bauerová, 2018), and web content analysis in terms of grocery online shopping (Banerjee and Banerjee, 2018). According to the best knowledge of the authors, the study examining the way how consumers select milk in online grocery shopping and what quality cues are important in their choice, is missing. Therefore, the paper deals with milk as the mainstream purchased grocery product and is focused on the Czech Republic as the country that ranks above the European Union average in online grocery shopping (ČTK: České noviny, 2021). In 2020, food products were purchased online by 15% of Czech consumers on regular basis, compared to 12% in 2018 (KPMG, 2020). Milk is purchased by 93% of Czechs (Semerádová, 2018). In the study, the main attention is paid to examining the role of brand in online consumer choice of milk.
First, the theoretical background of the topic is presented, followed by the research methodology and the results analysis and discussion. Marketing implications and limitations of the research are presented at the end of paper.
Theoretical Background
Food Quality Characteristics and Their Influence on Online Grocery Shopping
Consumer perception of food quality is influenced by different product attributes and consumer decision to buy food product is based on a multi-attribute scheme. Some authors distinguish two main sets of food quality attributes, intrinsic attributes involving colour, flavour, smell, appearance, and extrinsic attributes such as brand, packaging or place of origin (Espejel et al., 2007; Symmank, 2019). In more detailed taxonomy, four categories of product quality characteristics are considered: intrinsic quality cues, extrinsic quality cues, experience quality attributes, and credence quality attributes (Oude Ophuis and Van Trijp, 1995; Caswell, 1998; Grebitus, 2008).
The difference between quality cues and quality attributes lies in whether these characteristics are perceivable for consumers or not. Quality cues can be observed by a consumer without actual

The Impact of Brand on Consumer Preferences of Milk in Online Purchases: Conjoint Analysis Approach 347
consumption or usage of the product, whereas quality attributes are abstract product benefits that can only be experienced as a consequence of consumption or usage of the product (Oude Ophuis and Van Trijp, 1995). It follows that only quality cues can be used to communicate food quality as they are the only characteristics to be perceived and evaluated by consumers before purchase (Grebitus, 2008).
Intrinsic quality cues are closely related to the physical product and they cannot be changed without also changing the product itself, i.e. size, shape, colour or texture of a product (Olson and Jacoby, 1972; Oude Ophuis and Van Trijp, 1995). On the contrary, extrinsic quality cues are related to the product, but are not physically part of it (Olson and Jacoby, 1972; Symmank, 2019). They can be manipulated without the need to modify the physical product (Oude Ophuis and Van Trijp, 1995). When products are very similar in their appearance, extrinsic quality cues (e.g. brand name, packaging, place of product origin, quality label, nutrition information) will become more important. Experience quality attributes are perceived by consumer as a consequence of consumption or usage of the product (e.g. taste, freshness, softness, convenience), whereas credence quality attributes (e.g. calories, healthfulness, food safety, way of production, product not tested on animals) include desirable product benefits that cannot be experienced directly (Oude Ophuis and Van Trijp, 1995).
As it was said above, only quality cues can be perceived and evaluated by consumers before purchase. They work as indicators of food quality in the decision-making process. When comparing online and in-store grocery shopping, limited scope of quality cues can be used in online environment as digital consumers do not have the possibility to check intrinsic quality cues and some of extrinsic quality cues. This implies that only several extrinsic quality cues such as brand, price, packaging, or country of origin affect consumer choice in online purchases and help consumers to infer the product quality. Grocery brand managers need to understand which of these factors work as the main driver of digital purchase decision-making.
Consumer's Behaviour on the Online Grocery Market
Previous research studies of the online grocery market have brought some findings on digital consumers purchase behaviour and habits. Research of the International Food Information Council Foundation from 2018 revealed that women are more likely to shop for groceries online than men (International Food Information Council Foundation, 2019). Online grocery shopping seems to work best in large cities, where the population is dense, incomes are high, and lots of people work
long hours (Zarling, 2018). Dominici et al. (2021) revealed that a typical online consumer buying food online is likely to be a young, educated woman living in a family with a very good or adequate overall economic situation.
Considering the growth of online grocery, it is also important to understand how people shop online for groceries and what product attributes affect their purchase behaviour. Results of GlobalData consumer survey from February 2018 show that online consumers tend to be more habitual and less adventurous than consumers buying food in stores are. They are more likely to migrate to well-known brands or to brands that they regularly purchase. Packaging design is less of a driver of purchase online than it is in the store (Saunders, 2018). Andrews and Currim (2004) identified online consumers have higher loyalty to brands than in-store purchasers have and they are less price sensitive. The same results, i.e. higher brand loyalty and lower price sensitivity were seen in the study of Chu et al. (2010). Neeraj et al. (2019) found that impact of customer satisfaction, trust, loyalty, and perceived value on price tolerance varied according to nature of products.
Anesbury et al. (2016) reported that digital consumers usually choose the brands they have bought before and usually have only few brands with which they are familiar. Their research showed the importance of brand familiarity and first-page position for brands on an online grocery store site. It facilitates for shoppers to discern their preferred brand. Consumers also do not hunt for the best buy and they do not usually engage in extensive search, they do not look at many of the options. They select one of a repertoire of known and acceptable brands. Thus, without brand familiarity, a brand is unlikely to be bought. Brand familiarity, brand perception and brand loyalty in the online environment therefore have a significant impact (Anesbury et al., 2016; Bauerová and Braciníková, 2021) and building strong brand equity leading to good customer experience should be one of the crucial goals for an online grocery business (Šontaitė-Petkevičienė, 2020).
However, during pandemic consumers changed the perception of product attributes and the importance of some of them. They put importance to freshness and costs. Consumers are also worried about the unavailability of some food categories, that is why they tend to purchase packed and long-life food in addition to fresh products (Lai et al., 2021).
In the context of online shopping, Anesbury et al. (2016) also examined average time online shoppers take to select an item in twelve product categories, including milk. Online shopping selection times for grocery items are quick, with a mean of 19 seconds and a median of 13 seconds. For milk, a mean of selection time is 15 seconds, a median of

348 Šárka Velčovská, Fridrik Rafn Larsen
12 seconds, minimum selection time is 2 seconds, and maximum time is 70 seconds. Mentioned facts are important for food and grocery brands as they mean that strategies need to be built differently for the online and store channels.
MATERIALS AND METHODSThe aim of the study was to examine the
preferences of Czech consumers in online shopping of long-life semi-skimmed milk and to identify the importance of milk attributes in their online buying process, with focus on brand. Consumers living in the Moravian-Silesian region constituted the population for the research in order to determine the influence of the brand coming from this region on their decision-making. Data were collected in online survey in September 2018, full-profile conjoint analysis was used as part of the survey. The online questionnaire contained three parts. In the first part, consumer behaviour and habits in the milk market were examined. The second part consisted of ten choice sets of milk for a full-profile conjoint analysis. In the third part, socio-demographic data of respondents were gathered. Before the survey started, selection questions were used to ensure that each participant is relevant for the research, i.e. purchasing milk at least once per month and experienced with online grocery shopping. The respondents were selected by quota sampling method with the quotas allocated with respect to the age and to the role of women and men in household food purchases. According to study of KPMG from February 2018, women dominate household food shopping. Food products for family are regularly purchased by 70% of women, but only by 30% of men (KPMG, 2018). The same structure of men and women participated in the study. A total of 185 respondents (18+) completed the questionnaire. The snowball sampling technique was used to expand the questionnaire among the respondents, the age and gender criteria were continuously checked. The sample structure is presented in Tab. I.
Full-profile Conjoint AnalysisCustomers making choices between products
are faced with trade-offs. For some customers, the brand can be more important than a low price and type of packaging for instance, other customers can prioritize the price over the brand or other product attributes. Understanding how customers value different attributes of the product makes it possible to optimize product development to give the best balance of features for prices the customers are willing to pay, or to maximise the value the customers get from the products. The method that attempts to determine how people make decisions and what they really value in products is conjoint analysis (The Dobney Corporation Limited, 2020). This method belongs to the most sophisticated forms of market research because this calculates the utilities that customers base their decisions on and so can provide estimates of demand which depend on specific product features (Malhotra, 2019; The Dobney Corporation Limited, 2020). This helps companies better understand consumer preferences, uncover more information about how individual product attributes affect consumer behaviour and reveal what are the drivers for consumer choices (IBM, 2019).
Full-profile approach is the original form of conjoint analysis. A limited number of attributes (3–4) are selected to describe the product and sufficient product cards (profiles) as a combination of product attributes and their levels are shown to respondents to enable individual level utilities to be calculated. A special class of fractional factorial design, called orthogonal array, is used to specify a reduced fixed set of profiles that need to be shown for analysis (Rao, 2014; Malhotra, 2019; The Dobney Corporation Limited, 2020). The profiles are chosen in such a way, that the contribution of all the attributes and their levels is balanced (each attribute level occurs in combination with every level of some other factor). Respondents are shown product cards (profiles) in the form of a verbal description, an image or their combination and they are simply asked which one they would choose. They can express their preferences as the probability of purchasing each profile in percent from 1 to 100 or they can rank profiles from 1 to n in order of their preferences from the most to the least preferred profile.
The following conjoint analysis procedure in SPSS provides an estimate of the relative importance weights of attributes and the part-worth (utility) function. The relative importance weights indicate which attributes are important in influencing consumer choice. The part-worth (utility) function describes the utility consumer attaches to the levels of each attribute, i.e. contribution of the attribute level to the consumer's preference. Positive value increases the consumer's preference, negative value decreases the consumer's preference. Consequently,
I: Structure of respondents (in %)
GenderMen 29.7
Women 70.3
Age category
18–30 24.4
31–45 24.9
46–60 25,9
61 and older 24,9
Number of family members
1 13.0
2 31.4
3–4 50.8
5 and more 4.9

The Impact of Brand on Consumer Preferences of Milk in Online Purchases: Conjoint Analysis Approach 349
overall utility of each product profile and product profile with maximum utility are calculated. Pearson R and Kendall tau coefficients provide measures of the correlation between the observed and estimated preferences.
The importance of an attribute, Ii, is defined in terms of the range of the part-worths, αij, across the levels of that attribute (Malhotra, 2019):
Ii = {max. (αij) - min. (αij)}, for each I. (1)
The attribute's importance is normalized to ascertain its importance relative to other attributes. The relative importance weight of attribute, Wi , is calculated as follows (Malhotra, 2019):
=1
=1
=1 =1
=
=1
( ) = i
ii m
iim
ii
m kij iji j
IWI
W
U X x
(2)
so that
=1
=1
=1 =1
=
=1
( ) = i
ii m
iim
ii
m kij iji j
IWI
W
U X x
. (3)
Overall utility U(X) of a product profile in the basic conjoint analysis model is calculated by the following formula (Malhotra, 2019):
=1
=1
=1 =1
=
=1
( ) = i
ii m
iim
ii
m kij iji j
IWI
W
U X x , (4)
whereαij....the part-worth contribution or utility associated
with the jth level (j = 1, 2, …, ki) of the ith attribute (i = 1, 2, …, m),
xij ....1 if the jth level of the ith attribute is present, 0 otherwise,
ki ....number of levels of attribute i,m .... number of attributes.
The real power of conjoint analysis is the ability to predict preference for product profiles that were not rated by respondents. These are referred to as simulation cases. Three different probability-of-choice models can be used, the maximum utility model, the Bradley-Terry-Luce (BTL) model and the Logit model. The maximum utility model determines the probability as the number of respondents predicted to choose the profile divided by the total number of respondents. The BTL model determines the probability as the ratio of a profile's utility to that for all simulation profiles, averaged across all respondents. The logit model is similar to BTL model but uses the natural log of the utilities instead of the utilities (Rao, 2014; IBM, 2019).
Full-profile Conjoint Analysis Design for MilkThe consumption of milk and dairy products in
their natural form consists of 42% of household food consumption (Hazuchová et al., 2020), so milk can be considered a significant commodity in household food purchases. The study was focused on long-life semi-skimmed milk as the most
often purchased type of milk in the Czech market (Kopáček, 2018). In the first step, the milk attributes and their levels were designed (Tab. II).
Milk is a homogeneous commodity differing only by the amount of fat, way of processing and marketing factors (extrinsic quality cues) such as brand, country of origin, price etc. Before purchase of milk in online environment, consumers can perceive and compare only several extrinsic quality cues. From this category of quality cues, brand, type of packaging, price and certification of milk with quality label were selected for this study as the most common characteristics of milk perceivable before purchase. These also are the attributes that practitioners can adjust most easily.
The milk brands used in the study represent the brands of four largest milk processors in the Czech Republic with a volume of 37.7% of milk supplies in 2017 (Kopáček, 2018). The significant position of these brands on the Czech milk market is confirmed also by the research of Nielsen Admosphere, STEM/Mark and NMS Market Research agencies, carried out in the Czech Republic in 2018 on the sample of 513 respondents from internet population aged 15+. Tatra, Madeta and Kunín are the most often purchased milk brands (Semerádová, 2018).
For a given type of product, only two different packaging are available on the Czech market - beverage carton box with or without screw cap. Due to the different size of milk packaging, 1 l size was chosen as it is the most common one. The selected price range was from 17.90 CZK to 20.90 CZK per 1 l box, which corresponds to actual retail prices in main Czech supermarkets and hypermarkets. Certification of products with quality labels is becoming increasingly popular. Best known and most widely used quality label on the Czech food products market is the national quality label Klasa. By April 15, 2021, it has been awarded a total of 914 products from 238 food producers in the Czech Republic, 27% of certified products come from the category of milk and dairy products (SZIF, 2021).
II: Milk attributes and their levels for conjoint analysis
Attribute Levels of the attribute
Brand
Tatra
Kunín
Madeta
Pragolaktos
Packagingbeverage carton box
beverage carton box with screw cap
Price (1 l milk)17.90 CZK
20.90 CZK
Quality labelnational quality label Klasa
without quality label
350 Šárka Velčovská, Fridrik Rafn Larsen
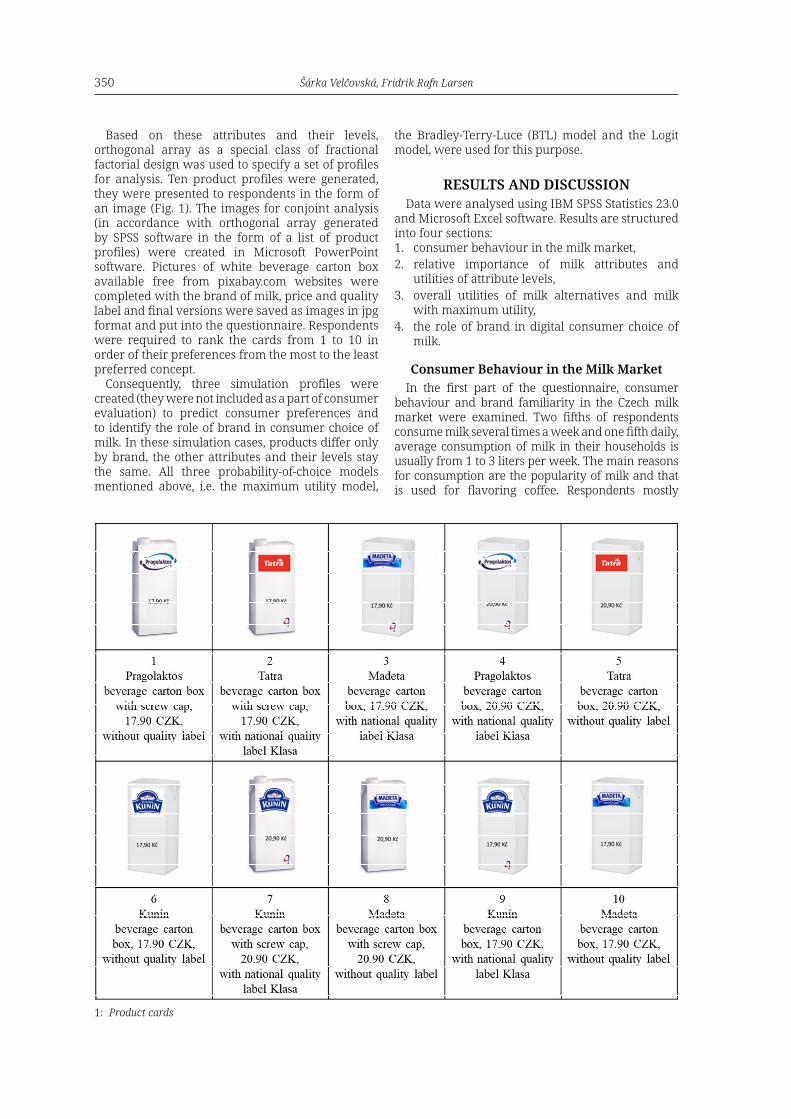
Based on these attributes and their levels, orthogonal array as a special class of fractional factorial design was used to specify a set of profiles for analysis. Ten product profiles were generated, they were presented to respondents in the form of an image (Fig. 1). The images for conjoint analysis (in accordance with orthogonal array generated by SPSS software in the form of a list of product profiles) were created in Microsoft PowerPoint software. Pictures of white beverage carton box available free from pixabay.com websites were completed with the brand of milk, price and quality label and final versions were saved as images in jpg format and put into the questionnaire. Respondents were required to rank the cards from 1 to 10 in order of their preferences from the most to the least preferred concept.
Consequently, three simulation profiles were created (they were not included as a part of consumer evaluation) to predict consumer preferences and to identify the role of brand in consumer choice of milk. In these simulation cases, products differ only by brand, the other attributes and their levels stay the same. All three probability-of-choice models mentioned above, i.e. the maximum utility model,
the Bradley-Terry-Luce (BTL) model and the Logit model, were used for this purpose.
RESULTS AND DISCUSSIONData were analysed using IBM SPSS Statistics 23.0
and Microsoft Excel software. Results are structured into four sections: 1. consumer behaviour in the milk market, 2. relative importance of milk attributes and
utilities of attribute levels, 3. overall utilities of milk alternatives and milk
with maximum utility, 4. the role of brand in digital consumer choice of
milk.
Consumer Behaviour in the Milk MarketIn the first part of the questionnaire, consumer
behaviour and brand familiarity in the Czech milk market were examined. Two fifths of respondents consume milk several times a week and one fifth daily, average consumption of milk in their households is usually from 1 to 3 liters per week. The main reasons for consumption are the popularity of milk and that is used for flavoring coffee. Respondents mostly
1: Product cards

The Impact of Brand on Consumer Preferences of Milk in Online Purchases: Conjoint Analysis Approach 351
purchase milk in supermarkets or hypermarkets. More than half of respondents prefer milk packaged in beverage carton box with screw cap (Tab. III).
The highest spontaneous brand awareness reached the Kunín brand (66.5%), followed by the Tatra brand (50.3%) and Madeta brand (44.9%). These three brands have also high prompted awareness, with 96.2% for the Kunín brand, 90.3% for the Tatra brand and 87.0% for the Madeta brand. Among four surveyed milk brands, the weakest results were achieved by the brand Pragolaktos, spontaneous awareness is 15.1%, and prompted awareness is 45.9% only. Almost half of respondents (45.9%) named their favourite milk brand, the most preferred is the Kunín brand (17.8%) and the Madeta brand (11.4%), see Tab. III.
Relative Importance of Milk Attributes and Utilities of Attribute Levels
The estimation of the part-worth functions and the relative importance weights of attributes provides the basis for interpreting the results of conjoint analysis. Tab. IV, last column, expresses the relative importance of the four milk attributes as percentages. The third column provide a representation of the utilities of attribute levels. The constant value tells about perceived value of a product regardless of its attributes.
As can be seen, the brand is the most important attribute when buying milk online, with relative importance value 50.3%. In comparison with
other attributes, packaging has achieved relative importance value 18.6%, price 17.6% and quality label 13.5%. According to part-worth utilities values, milk has a higher utility and increased consumer preferences when packaged in user-friendly packaging with screw cap and certified with national quality label Klasa. If consumers are exposed to a choice between two alternatives of milk at a higher and lower price, they prefer the cheaper milk. Focusing on milk brand as the most important attribute, a higher utility for brand coming from the region, i.e. the Kunín brand, was confirmed.
In the third column of Tab. IV we can see, that the brand has the largest range for utilities. The utility assigned to the Kunín brand is 0.701 and to the Pragolaktos brand -1.270, the overall span is 1.971. Thus, the brand is the most important attribute influencing preferences of milk.
Validity of conjoint analysis model was confirmed by the values of Pearson R and Kendall tau coefficients (Sig. = 0.000). There is correlation between the observed and estimated preferences.
Overall Utilities of Milk Alternatives and the Milk With Maximum Utility
In conjoint measurement, a consumer's total utility for a product is a function of part-worth utilities. It is calculated as the sum of constant and part-worth utilities of attribute levels (see Tab. IV) represented in the given product profile. The product with maximum utility is identified as a sum of constant and the
III: Consumer behaviour in the Czech milk market
Question Answers % Question Answers %
Frequency of milk consumption
daily 21.1
Preferred type of packaging
carton box 14.6
several times a week 38.9 carton box with screw cap 56.2
once a week 4.9 plastic bottle 24.3
two to three times a month 11.4 glass bottle 3.2
at least once a month 23.7 other 1.6
Main reason for milk consumption
I like it 40.1
Spontaneous brand awareness
Kunín 66.5
for flavouring coffee 35.9 Tatra 50.3
it is healthy 10.8 Madeta 44.9
because of children 5.4 Pragolaktos 15.1
for digestion 3.6
Prompted brand awareness
Kunín 96.2
other 4.2 Tatra 90.3
Average week consumption of milk in household
less than 1 l 36.2 Madeta 87.0
1-3 l 47.6 Pragolaktos 45.9
4-5 l 11.4
Preferred brand of milk
Kunín 17.8
more than 5 l 4.9 Tatra 1.6
Main place of milk purchase
supermarket/hypermarket 90.3 Madeta 11.4
convenience store 8.1 other brands 15.1
speciality store 1.6 any 54.1

352 Šárka Velčovská, Fridrik Rafn Larsen
highest value of attribute level for each attribute. Fig. 2 provides comparison of overall utilities of all product profiles evaluated by consumers.
Of the ten tested profiles, consumers most preferred the product profile No. 2, i.e. milk of the Tatra brand, in beverage carton box with screw cap, for the price 17.90 CZK, certified with national quality label Klasa. The second position belongs to milk of the Kunín brand, again in beverage carton box with screw cap and certified with national quality label Klasa, but at a higher price 20.90 CZK (profile No. 7). The following three positions belong to lower-priced products. Milk under the Pragolaktos brand, which is the least known brand in the Czech market (Tab. III), has been placed at the
end of the ranking. It can be seen that consumers are willing to pay a higher price for a known brand and more convenient packaging.
The milk with maximum utility for consumer (counted on the basis of data in Tab. IV) would be under the Kunín brand, in beverage carton box with screw cap, for the price 17.90 CZK and certified with national quality label Klasa, the overall utility of this alternative is 6.452.
The Role of Brand in Digital Consumer Choice of Milk
The three simulation product profiles were created to predict consumer preferences and to identify the role of brand in digital consumer choice
IV: Estimation of the relative importance weights and the part-worth functions
Attribute Levels of the attribute Part-worth utilities Relative importance of attribute
Brand
Tatra 0.152
50.307Kunín 0.701
Madeta 0.417
Pragolaktos -1.270
Packagingbeverage carton box -0.611
18.585beverage carton box with screw cap 0.611
Price (1 l milk)17.90 CZK -1.177
17.56720.90 CZK -2.354
Quality labelnational quality label Klasa 0.490
13.540without quality label -0.490
Constant 6.268Note: The constant express perceived value of a product regardless of its attributes
2: Overall utility of product profiles evaluated by consumers

The Impact of Brand on Consumer Preferences of Milk in Online Purchases: Conjoint Analysis Approach 353
of milk. In these simulation cases, products differ only by brand, the other attributes and their levels stay the same. Simulation case 1 is milk of the Tatra brand, in beverage carton box with screw cap, for the price 17.90 CZK, certified with national quality label Klasa. Simulation case 2 is milk of the Kunín brand, in beverage carton box with screw cap, for the price 17.90 CZK, certified with national quality label Klasa. Finally, simulation case 3 is milk of the Madeta brand, in beverage carton box with screw cap, for the price 17.90 CZK, certified with national quality label Klasa.
All three probability-of-choice models mentioned and explained in the chapter 3.1, i.e. the maximum
utility model, the Bradley-Terry-Luce (BTL) model and the Logit model were used to predict consumer preferences. In Tab. V are shown the predicted probabilities of choosing each of the simulation cases as the most preferred one.
As we can see, all three models indicated that simulation case 2 would be preferred. The Kunín brand has a strong position among consumers. In a situation where all other extrinsic quality cues will be the same and the consumers will make their decisions based on the brand only, they will give priority to the Kunín brand. The probability of choosing two other brands Madeta and Tatra is balanced.
V: Preference probabilities of simulations
Simulation case Maximum Utility model Bradley-Terry-Luce model Logit model
1 (Tatra) 31.1% 31.9% 30.4%
2 (Kunín) 38.1% 34.6% 38.6%
3 (Madeta) 30.8% 33.5% 31.1%
CONCLUSIONThe aim of the paper was to determine the impact of brand on consumer preferences in online purchases of milk. The results of the study revealed the key role of brand within extrinsic quality cues in online consumer choice of milk as well as an importance of brand awareness. Among respondents from the Moravian-Silesian region, the highest level of awareness was achieved by the Kunín brand originating in this region. In conjoint analysis, this brand reached the highest level of utility and product profiles under this brand was placed in the first half of the ranking according to consumer preferences. On the contrary, the least known Pragolaktos brand has the lowest level of utility for consumers and product profiles involving this brand were placed at the end of the ranking. It is also clear that consumers are willing to pay extra for the brand they prefer. Price as well as packaging and quality label are less important attributes of milk in digital consumer choice.These findings are in line with above mentioned earlier research studies, confirming the importance of the brand, higher brand loyalty and lower price sensitivity of online customers (Andrews and Currim, 2004; Chu et al., 2010), the preference for familiar brand (Anesbury et al., 2016), and lower importance of packaging in online purchases (Saunders; 2018).Brand managers in the milk market can use the findings of this research to adapt their brand strategy for online channels. The brand of milk works as the main driver in digital purchase decision-making and brand familiarity plays a significant role in consumer preferences. According to earlier research of Anesbury et al. (2016), average time online shoppers take to select a milk is 15 seconds (minimum selection time is two seconds only). It follows that the brand should be at one of the first positions in the search engine on the website of the online grocery store. The results of the study are applicable also for regional brand strategy as the brand originating in a particular region has a higher preference in that region than other brands.Full-profile conjoint analysis brings advantages in terms of relatively low requirements from the respondents, possibility to simulate purchase decision-making of customers, using the realistic choice or shopping task, identifying the composition of the most preferred product profiles with maximum utility for consumers, and estimating psychological trade-offs that consumers make when evaluating several attributes together. There are also some limitations of the method, such as limits given by the experiment and the impact of the researcher on product attributes and attribute levels definition. Further, respondents are exposed to limited choice. On the other hand, with too many options, respondents tend to simplification strategies, and preference does not mean real purchase. Despite these facts, the benefits of the method are obvious.The study was carried out in the Moravian-Silesian region of the Czech Republic and was focused on one product category only. The findings are therefore specific and applicable mainly to that region. However, the research results indicate the importance of the brand in the decision-making of the digital consumer and this may be usable in a wider context. Further, the research was carried out

354 Šárka Velčovská, Fridrik Rafn Larsen
before the Covid-19 pandemic. Thus, it reflects the situation when there was much less experience with online shopping for groceries among population and respondents were not experienced with it. Therefore, it is necessary to consider the possible impact of pandemic on consumer behaviour in the meantime. During the Covid-19 pandemic, changes in the way how people buy food and groceries occurred. Many consumers have switched to online channels and their online purchases for groceries significantly increased. These new experiences could affect their assessment of the importance of milk attributes and their preferences when making purchasing decisions. In the future, the study should be repeated, involving respondents experienced in online shopping for groceries. It would be interesting to compare the results of the new study with the conclusions presented in this article. But there is a question. Once the crisis abates, to what extent will consumers return to their pre-pandemic grocery shopping behaviors? Further, a more extensive study covering more regions or countries and more product categories could be carried out. It would be also interesting to perform a cluster analysis to create a consumer typology based on consumer preferences.
AcknowledgementsThe paper was supported by the European Social Fund [CZ.1.07/2.3.00/20.0296].
REFERENCESANDREWS, R. and CURRIM, I. 2004. Behavioural differences between consumers attracted to shopping
online versus traditional supermarkets: implications for enterprise design and marketing strategy. International Journal of Internet Marketing and Advertising, 1(1): 38–61.
ANESBURY, Z., NENYCZ-THIEL, M., DAWES, J. and KENNEDY, R. 2016. How do shoppers behave online? An observational study of online grocery shopping. Journal of Consumer Behaviour. An International Research Review, 15(3): 261–270.
BANERJEE, T. and BANERJEE, A. 2018. Web content analysis of online grocery shopping web sites in India. International Journal of Business Analytics, 5(4): 61–73.
BAUEROVÁ, R. 2018. Consumers' decisionmaking in online grocery shopping: the impact of services offered and delivery conditions. Acta Universitatis Agriculturae et Silviculturae Mendelianae Brunensis, 66(5): 1239–1247.
BAUEROVÁ, R. and BRACINÍKOVÁ, V. 2021. Customer's choice of purchasing channel: Do channel characteristic, brand, and loyalty matter when shopping in hybrid retailers? Sustainability, 13: 2453.
CASWELL, J. A. 1998. Valuing the benefits and costs of improved food safety and nutrition. Australian Journal of Agriculture and Resource Economics, 42(4): 409–474.
CHU, J., ARCE-URRIZA, M., CEBOLLADA-CALVO, J. J. and CHINTAGUNTA, P. 2010. An empirical analysis of shopping behavior across online and offline channels for grocery products: the moderating effects of household and product characteristics. Journal of Interactive Marketing, 24(4): 251–268.
ČTK: ČESKÉ NOVINY. 2021. Internet shopping has jumped due to the pandemic [in Czech: Nakupování přes internet kvůli pandemii skokově vzrostlo]. ČTK: České noviny. [Online]. Available at: https://www.ceskenoviny.cz/zpravy/csu-nakupovani-pres-internet-kvuli-pandemii-skokove-vzrostlo/2012878 [Accessed: 2021, April 16].
DOMINICI, A., BONCINELLI, F., GERINI, F. and MARONE, E. 2021. Determinants of online food purchasing: The impact of socio-demographic and situational factors. Journal of Retailing and Consumer Services, 60: 102473.
ECOMMERCE NEWS. 2020. UK leads Europe in embracing online grocery shopping. Ecommerce News. [Online]. Available at: https://ecommercenews.eu/uk-leads-europe-in-embracing-online-grocery-shopping/ [Accessed: 2021, April 20].
ESPEJEL, J., HERRERA, C. F. and FLAVIÁN, C. 2007. The role of intrinsic and extrinsic quality attributes on consumer behaviour for traditional food products. Managing Service Quality: An International Journal, 17(6): 681–701.
EUROMONITOR INTERNATIONAL. 2020. COVID-19 Effect on packaged food. Euromonitor International. [Online]. Available at: https://go.euromonitor.com/white-paper-packaged-food-2020-COVID-19-Effect-On-Packaged-Food.html?utm_source=PressRelease&utm_medium=Email&utm_campaign=CT_WP_20_04_30_COVID-19%20Effect%20on%20Packaged%20Food [Accessed: 2020, November 21].
GAVUROVÁ, B., BACIK, R., FEDORKO, R. and NASTIŠIN, L. 2018. The customer's brand experience in the light of selected performance indicators in the social media environment. Journal of Competitiveness, 10(2): 72–84.

The Impact of Brand on Consumer Preferences of Milk in Online Purchases: Conjoint Analysis Approach 355
GREBITUS, C. 2008. Food quality from the consumer's perspective: An empirical analysis of perceived pork quality. Göttingen: Cuvillier Verlag.
HAZUCHOVÁ, N., ANTOŠOVÁ, I. and STÁVKOVÁ, J. 2020. Food wastage as a display of consumer behaviour. Journal of Competitiveness, 12(2): 51–66.
HENG, Y., GAO, Z., JIANG, Y. and CHEN, X. 2018. Exploring hidden factors behind online food shopping from Amazon reviews: A topic mining approach. Journal of Retailing and Consumer Services, 42: 161–168.
IBM. 2019. IBM SPSS Conjoint. IBM. [Online]. Available at: https://www.ibm.com/cz-en/marketplace/spss-conjoint [Accessed: 2020, January 19].
HILLEN, J. 2021. Psychological pricing in online food retail. British Food Journal, ahead of print. INTERNATIONAL FOOD INFORMATION COUNCIL FOUNDATION. 2019. New research: Evaluating
online grocery shopping trends. Food Insight. [Online]. Available at: https://foodinsight.org/new-research-evaluating-online-grocery-shopping-trends/ [Accessed: 2020, October 12].
KOPÁČEK, J. 2018. Current situation on the milk market. Czech-Moravian Dairy Association [in Czech: Současná situace na trhu s mlékem. Českomoravský svaz mlékárenský]. [Presentation]. Available at: http://www.milcom-as.cz/upload/soubory/obrazky/cicvarek/praha/2018/den_vum/2018_-_01_-_soucasna_situace_na_trhu_s_mlekem_(kop%C3%A1%C4%8Dek_-_%C4%8Dmsm).pdf [Accessed: 2018, July 21].
KPMG. 2016. Shopping habits 2016 – Two thirds of people buy more than they planned [in Czech: Nákupní zvyklosti 2016 – Dvě třetiny lidí nakoupí více, než plánovaly]. Gastro & Hotel. [Online]. Available at: http://gastroahotel.cz/rubriky/novinky-z-gastronomie/nakupni-zvyklosti-2016-dve-tretiny-lidi-nakoupi-vice-nez-planovaly/ [Accessed: 2018, July 16].
KPMG. 2018. Shopping habits 2018 [in Czech: Nákupní zvyklosti 2018]. KPMG. [Online]. Available at: https://home.kpmg/cz/cs/home/pro-media/tiskove-zpravy/2018/11/nakupni-zvyklosti-2018-obaly-a-trideni.html [Accessed: 2018, July 16].
KPMG. 2020. Every sixth Czech buys groceries online [in Czech: Každý šestý Čech nakupuje potraviny online]. KPMG. [Online]. Available at: https://home.kpmg/cz/cs/home/pro-media/tiskove-zpravy/2020/02/kazdy-sesty-kupuje-potraviny-online.html [Accessed: 2021, April 12].
LAI, J., MORGAN, S., KASSAS, B., KROPP, J. and GAO, Z. 2021. Spending of economic stimulus payments and changes in food purchasing during the COVID-19 pandemic. Choices, 25(3): 756.
LOKETKRAWEE, P. and BHATIASEVI, V. 2018. Elucidating the behavior of consumers toward online grocery shopping: The role of shopping orientation. Journal of Internet Commerce, 17(4): 418–445.
MALHOTRA, N. K. 2019. Marketing Research. An applied orientation. Harlow: Pearson Education Limited.
MEYERDING, S. G. H., BAUCHROWITZ, A. and LEHBERGER, M. 2019. Consumer preferences for beer attributes in Germany: A conjoint and latent class approach. Journal of Retailing and Consumer Services, 47: 229–240.
NEERAJ, P., AVINASH, T., DEVENDRA, J. and SAPTRSHI R. 2019. Does price tolerance depend upon the type of product in e-retailing? Role of customer satisfaction, trust, loyalty, and perceived value. Journal of Strategic Marketing, 28(6): 522–541.
OLSON, J. C. and JACOBY, J. 1972. Cue utilization in the quality perception process. In: Proceedings of the Third Annual Conference of the Association for Consumer Research. Association for Consumer Research, 3–5 November. Chicago, IL: Association for Consumer Research, pp. 167–179.
OUDE OPHUIS, P. A. M. and VAN TRIJP, H. C. M. 1995. Perceived quality: A market driven and consumer-oriented approach. Food Quality and Preference, 6(3): 177–183.
PIROTH, P., RITTER, M. S. and RUEGER-MUCK, E. 2020. Online grocery shopping adoption: do personality traits matter? British Food Journal, 122(3): 957–975.
PITTS, J. S. B., NG, S. W., BLITSTEIN, J. L., GUSTAFSON, A. and NICULESCU, M. 2018. Online grocery shopping: promise and pitfalls for healthier food and beverage purchases. Public Heath Nutrition, 21(18): 3360–3376.
RAO, V. R. 2014. Applied Conjonit Analysis. Berlin: Springer.RONDONI, A., MILLAN, E. and ASIOLI, D. 2021. Consumers' preferences for intrinsic and extrinsic
product attributes of plant-based eggs: an exploratory study in the United Kingdom and Italy. British Food Journal, ahead-of-print.
SADÍLEK, T. 2019. Consumer Preferences Regarding food quality labels: The case of Czechia. British Food Journal, 121(10): 2508–2523.
SAUNDERS, N. 2018. Online grocery & food shopping statistics. OneSpace. [Online]. Available at: https://www.onespace.com/blog/2018/08/online-grocery-food-shopping-statistics/ [Accessed: 2020, November 14].

356 Šárka Velčovská, Fridrik Rafn Larsen
This work is licensed under a Creative Commons Attribution-NonCommercial-NoDerivatives 4.0 (CC BY-NC-ND 4.0) International License
SEMERÁDOVÁ, Z. 2018. Czechs and dairy products [in Czech: Češi a mléčné výrobky]. Mediář. [Online]. Available at: https://www.mediar.cz/cesi-a-mlecne-vyrobky-u-mleka-vede-tatra-u-dalsich-produktu-madeta/ [Accessed: 2018, August 13].
SYMMANK, C. 2019. Extrinsic and intrinsic food product attributes in consumer and sensory research: literature review and quantification of the findings. Management Review Quarterly, 69: 39–74.
SZIF. 2021. Klasa products [in Czech: Výrobky Klasa]. Klasa. [Online]. Available at: https://www.eklasa.cz/ [Accessed: 2021, April 15].
ŠONTAITĖ-PETKEVIČIENĖ, M. 2020. Customer-based brand equity creation for online grocery stores. Research for Rural Development, 35: 199–206.
THE DOBNEY CORPORATION LIMITED. 2020. Conjoint analysis. Dobney.com. [Online]. Available at: http://www.dobney.com/Conjoint/Conjoint_analysis.htm [Accessed: 2020, July 21].
WANG, O. and SOMOGYI, S. 2018. Consumer adoption of online food shopping in China. British Food Journal, 120(12): 2868–2884.
ZARLING, P. 2018. Consumers are slow to adapt to online grocery shopping. Grocery Dive. [Online]. Available at: https://www.grocerydive.com/news/grocery--consumers-are-slow-to-adapt-to-online-grocery-shopping/534067/ [Accessed: 2020, February 2].
Contact informationŠárka Velčovská: [email protected] (corresponding author)Fridrik Rafn Larsen: [email protected]