the impact of banning mobile phones in swedish secondary
TRANSCRIPT

Research Institute of Industrial Economics
P.O. Box 55665
SE-102 15 Stockholm, Sweden
www.ifn.se
IFN Working Paper No. 1288, 2019
The Impact of Banning Mobile Phones in Swedish Secondary Schools Dany Kessel, Hulda Lif Hardardottir and Björn Tyrefors

1
The impact of banning mobile phones in Swedish secondary schools
Dany Kessel1, Hulda Lif Hardardottir2 and Björn Tyrefors3
This version: 2020-02-11
Recently, policy makers worldwide have suggested and passed legislation to ban mobile phone use
in schools. The influential (and only quantitative) evaluation by Beland and Murphy (2016),
suggests that this is a very low-cost but effective policy to improve student performance. In
particular, it suggests that the lowest-achieving students have the most to gain. Using a similar
empirical setup but with data from Sweden, we partly replicate their study and thereby add external
validity to this policy question. Furthermore, we increase the survey response rate of schools to
approximately 75 %, although at the expense of the amount of information collected in the survey.
In Sweden, we find no impact of mobile phone bans on student performance and can reject even
small-sized gains.
Keywords: Mobile phone ban; Student performance
JEL codes: I21; I28; 033; J24
1 Södertörn University and Research Institute of Industrial Economics (IFN). Email: [email protected] 2 Stockholm University, master’s program. Email: [email protected]. 3 Corresponding author: Research Institute of Industrial Economics (IFN), Box 55665, 102 15 Stockholm E-mail: [email protected] Tel.: +46(0)8-665 4500) and Stockholm University. We are grateful for generous funding from Jan Wallanders and Hedelius stiftelse, Marianne and Marcus Wallenberg Foundation, Sciences. We thank Torbjorn Ott for helpful comments.

2
1. Introduction
Technical innovation has changed the education landscape. The cost of information and
communication technology (ICT) is no longer trivial, and it holds the promise to deliver significant
enhancements to education and learning. However, the rapid increase in the use of ICT also has a
backside as it may distract students and hamper learning. Furthermore, there is no consensus among
researchers on what type of technology works and in what context, as discussed in Escueta et al.,
(2017). Therefore, it is of little surprise that some countries are now taking steps to hinder and
control ICT use in schools. For example, since 2018, French students in secondary school are no
longer allowed to use their phones during the school day. This prohibition was a result of new
mobile phone legislation. A similar policy discussion is occurring in Denmark and Britain, based
on the assumption that mobile phones distract students and hinder learning.4 The same rationale is
behind the Swedish prime and education ministers’ recent proposals to implement the same type
of ban. In all cases, advocates of the ban refer to the influential study of mobile phone bans in Great
Britain by Beland and Murphy (2016), henceforth B&M. Their study suggests that a ban is a very
low-cost but effective policy to improve student performance. In particular, it suggests that the
lowest-achieving students have the most to gain. Given the low-cost nature of the policy, it is not
surprising that both left- and right-wing governments have been eager to suggest and implement
mobile phone bans.
Although there are few other studies that causally evaluate mobile phone bans, there are some well-
designed experimental studies on the consequences of access to, as well as the flip side of banning,
4 See for example New York Times Sept. 20, 2018. https://www.nytimes.com/2018/09/20/world/europe/france-smartphones-schools.html.

3
ICT at the K-12 level, as surveyed in Escueta et al. (2017).5 The provision of one computer per
student (so called 1 to 1) is found not to be sufficient for learning gains, and the overall conclusion
from the K-12 level suggests that giving a child a computer may have limited impacts on learning
outcomes (e.g. Fairlie and Robinson 2013, Fairlie and Kalil 2017) but could improve computer
proficiency and other cognitive outcomes. Malamud and Pop‐Eleches, (2011).6
However, when specifically evaluating mobile phones bans, the only large-scale quantitative
evaluation of mobile phone bans known to us is B&M.7 Although their study is novel, innovative
and well-executed, before it can be taken as general policy advice, scientific evidence must be
accumulated by replication both in similar settings and in other countries with different contexts.
Given that B&M has also received significant attention from policy makers outside Great Britain
and particularly in the Scandinavian countries, we are inspired to provide a replication based on
Swedish data. As we also want to improve on the response rate in the B&M survey, we focus on
the main analysis in their work, namely, whether a ban on mobile use at the school level improves
learning outcomes. Thus, we cannot fully do justice to B&M because they provide much more in-
depth surveys by, for example, analyzing the compliance rate and other major factors. They also
elaborate on the strength of the ban and are able to define bans as being effective if use is restricted
5 Regression discontinuity studies are also surveyed. 6 This conclusion also seems hold in Sweden. See the recent evaluation of the introduction of 1 to 1, Hall et al. (2019). 7 There are, of course, case and small-sample studies on the use of mobile phones and/or other digital devices in classes and /or schools. Evidence that mobile phone use may hamper learning are, for example, Berry & Westfall (2015), Campbell, (2006), Thomas et al. (2014), Thomas & Muñoz (2016), Lenhart et al. (2010) and Gao et al. (2014). At the same time, there is little consensus on this topic, as discussed at length in Ott (2017). Studies suggesting that mobile phones support rather than hinder learning are, for example, Peck et al. (2015) and Sharples (2013). There is also a related large literature on the adoption of new technologies, which is typically viewed as productivity-enhancing. E.g. see Ding et al. (2009), Malamud and Pop-Eleches (2011), Machin et al. (2007) and Barrow et al. (2009).

4
on school premises. Consequences of such restrictions may well vary from strict bans, as in our
definition. This is a difference, but we choose to focus on increasing the response rate on behalf of
details, although we do acknowledge that this may explain the difference across studies. By keeping
the survey simple, we achieve a response rate of approximately 75 % compared to 21 % in B&M.
Another large difference between the studies is that the data used in B&M cover the years 2001-
2013. The development of both types of digital technology is rapid, and since 2013, both mobile
phones and computers have become more advanced and more widespread.
We find that mobile phone bans have no impact on student performance, and we can reject even
very small effects of banning mobile phones in the Swedish setting. Based on the evidence in this
study, our policy advice is that while introducing a mobile phone ban is tempting due to its low-
cost nature, such a ban should not be expected to produce substantial gains in student performance.
Thus, this study nicely complements B&M and provides policy guidance to politicians outside
Britain. We argue that there are at least two reasons why the results may differ other than the
methodological differences discussed above. First, teachers may in fact already have mobile phone
bans in practice in the classroom regardless of school policy.8 On the other hand, as been
documented by Ott (2017), although teachers in upper secondary schools may not consider mobile
phones in general to be particularly useful during lessons, they may still permit specific
schoolwork-related usage. Moreover, Swedish schools have a long history of making large
investments in digital technologies and devices, such as laptops and tablets. In fact, Sweden was
among the first countries in the world to use computers in schools, a practice that began
approximately 45 years ago (Riis, 2000). On both the national and local levels, there have been
8 Similarly, mobile bans may be less enforced. We have not find evidence of bans not being enforced, but at least in theory, if enforcement is lower in Sweden this could also explain the difference across the two studies.

5
plenty of initiatives to integrate such devices into classroom practice (Tallvid, 2015). Sweden is
the most computer-dense country in Europe, with 70 percent of all students in grade 8 having their
own computers (Utbildningsdepartementet, 2017). The other Scandinavian countries are similar
with respect to computer density. Therefore, the use of digital technology is quite intertwined with
practice in Swedish schools. To implement a ban in such a setting may well be ineffectual.
The rest of the paper is structured as follows. In section two, we present institutional detail, data
and empirical design. In section three, the results are presented, and section four concludes.
2. Institutional details, data and empirical design
2.1 Institutional details
The use of mobile phones in Sweden, especially among young adolescents and children, has been
increasing in recent years. Ownership rates in the age group under study (15-16) are rather similar
when comparing the UK with Sweden. According to The Internet Foundation in Sweden IIS
(2016), 98 % of all young people aged 16-25 had their own smartphone in 2016 (in 2018 this
reached 100 % according to IIS, 2018). In 2018, 95 % of 16-24-year-olds had their own smartphone
in the UK (Ofcom, 2018). In line with UK data, ownership rates in Sweden do not vary
considerably across income groups or gender.9 The use of digital tools and methods is also
increasing in schools. In 2016, the Swedish National Agency for Education suggested that each
student should have their own computer, and the implementation of this policy began soon after
(Swedish National Agency for Education, 2016). In 2017, the Swedish Ministry of Education and
Research released a strategy for the digitalization of school (Utbildningsdepartementet, 2017). In
9 However, even if ownership is universal, productive use may be correlated with socioeconomic status as discussed in Selwyn, N (2004).

6
2018, several Swedish schools revised their course plans in order to implement and focus on the
use of digital technologies as tools learning and work. Since 2006, Swedish teachers have had the
authority, under a regulation in the school law, to confiscate objects that disturb or threaten the
security of education. That law was designed and implemented specifically to target mobile phones
(Ott, 2014). According to a web-based survey panel with teachers from all over Sweden, 35 % of
Swedish schools only allow the use of mobile phones during specific projects, 28 % have a mobile
phone ban during recess, 14 % have no mobile phone ban at all, and 8 % reported that they have a
complete mobile phone ban in schools (Telenor, 2018). In schools, the use of mobile phones for
schoolwork is decreasing; nevertheless, two out of three teachers in secondary and upper secondary
school believe that mobile phones distract from daily work in the classroom (IIS, 2018). Recently,
Sweden’s prime and education ministers have declared that a mobile phone ban will be
implemented, and the prime minister explicitly referred to the findings in B&M as justification for
the ban.10
Schooling in Sweden is compulsory for children aged 7-16 years. Schools are either municipal
schools or voucher schools, and in the case of the latter, the provider can be a company, foundation,
or an association. Education is free of charge. Three times during their compulsory education, in
grades 3, 6 and 9, pupils complete a national test, the goal of which is to ensure equivalent and fair
grading and to analyze levels of proficiency in Swedish schools. The final grades on the school-
leaving certificate in grade 9 are based on a scale from A-F, where F indicates failure.11 In addition
10 See, for example, the interview with the Prime minister on public radio at https://sverigesradio.se/sida/artikel.aspx?programid=83&artikel=6183805 11 Before 2012, grading was done on a four-level scale: excellently approved (MVG), well approved (VG), approved
(G), and not approved (IG), also enumerated from 0 to 20. The final grades are used to calculate GPA, which is used for admission to high schools.

7
to these national tests, pupils receive grades in courses from sixth grade onwards, and at the end of
ninth grade, which also marks the end of secondary school, they receive a final grade in each
course. The teachers determine the final grade based on grades from the national tests and other
activities in school courses, that is, they use all available material on the pupil's educational
performance. These grades should reflect the pupil's knowledge of the course material; they are
then summed into a final school-leaving certificate of merit or grade points, where the maximum
is 340 based on 17 subjects. The grade points are the selection mechanism for studies in upper
secondary school.
2.2 Data
The data on educational results were obtained from the Swedish National Agency for Education.
The data are school-level panel data on the educational performance of 9th grade pupils over the
period 1997-2017, where 1997 indicates school year 1997/1998 and 2017 indicates school year
2017/2018, etc. The data cover the universe of all schools with at least 15 pupils. We sample from
schools that operated in the school year 2016/2017 (N=1423). Similar to the sample used in B&M,
the students in our sample were aged 15-16 years when the grades were received. Although we can
observe school performance outcomes for the full population, there is no national policy on mobile
phone use in schools, and there are no existing data available on mobile phone policies. To obtain
this information, we sent a survey to schools across Sweden during 2018-19 in which we asked if
there was a ban on mobile phones at the school level and, if so, when it had been implemented. If,
after reminders via email, a school had still not responded, we tried to connect with the respective
school principal by phone until the survey was completed. As presented in table 1, we successfully
obtained necessary information on the mobile phone ban for 1,086 out of 1,423 schools, which is
approximately 76 %. We differ from B&M because we sample from the full population of grade 9
schools in Sweden instead of using schools from four cities. Second, we received a 76 % response

8
rate from our population instead of a 21 % response rate. When we pool all the years, we have
16,724 observations out of a potential 22,832, or a response rate of 73 %.
Figure 1 shows the increase in the number of schools with a mobile phone ban over time. In 1997,
there were only three schools with a ban. By 2014, there is an increase in the implementation rate,
from 73 schools with a ban to 119 within one year, and in 2017, 631 schools have a mobile phone
ban, which is approximately 60 % of our sample schools.

9
Figure 1. Increase in the number of schools with phone bans from 1997-2017
Notes: Figure 1 depicts the number of schools with mobile phone bans in our sample each year. School administrators were first asked by email if the school had a ban on mobile phone use. If no responses were received, telephone contact was made, with the ultimate goal of reaching the principals of the schools. Source: Author-conducted survey.
Our main outcome of student performance is the school’s average merit or total grade points when
students are leaving grade 9. Importantly, Statistics Sweden collects these statistics, and school
participation is mandatory. Thus, there should be no attrition bias due to missing individual data
on final grades. There is, however, one drawback to using the final grades: they have been found
to be inflated in Swedish schools, as they are set by the student teacher (see, for example, Vlachos,
2018 and Berg et al., 2019). For this reason, we also use two other complementary measures of
student performance. The two other outcomes are based on the national standardized test for

10
mathematics, the average test score and the share of students (measured as percentages) failing the
test. Mathematics test results are often used to approximate an objective measure of ability, and the
grading of high school mathematics tests based on the syllabus has been found to have high
reliability, such that those test scores have been used as a reference point for ability when
comparing final grades (Vlachos, 2018). However, for the national test score data, there is more
missing data, as discussed in detail below. Thus, we acknowledge that none of the performance
measures are single-handedly perfect measures of student performance. However, as they suffer
from different pros and cons (no attrition but lower reliability vs. higher attrition but high
reliability), we argue that if the results are qualitatively the same regardless of outcome measure,
then this lends credibility to our study.
With national tests measures, some students are absent on the test day, so we would expect the
school averages to be somewhat affected by positive sorting.12 Moreover, there is no consistent test
score metric over the period, although the share of students who fail is reported as long as a school
has more than 10 students receiving a fail over the sample period. If fewer than 10 students receive
a fail, then the share is coded as missing. In our baseline results, we assign the share to be zero in
this case. However, we show in appendix table A1 that the results are similar when changing
definitions by imputing the potential theoretical maximum, or when dropping these observations.
In addition, we have little reason to believe that the nature of the attrition changes over time, and
hence, a DID-design should be suitable. Last, for the years 1998-2002, the statistics for national
tests are based on a random sample of 150 schools. Starting in 2003, the universe is drawn similarly
to our other measure, grade points, but with the exception that the results from the national test in
12 In our sample, the participation rate was 91 % on average.

11
mathematics in 2017 are not published. When calculating the average school test score in
mathematics, we also lose about 20 % more of the observations in total, as the grade intervals more
often contain fewer than 10 students as they are finer intervals than the percentage of fails for the
years 1997-2012. For the years 2013-2016, this is not a problem as the raw average test score and
not the intervals are reported.
Starting with the grade points in Panel A in table 1, for the school year 2016/17, the merit points
on average for the full school population (N=1423) is 226. For our sample, namely schools that
responded to the survey (N=1086), the merit points are statistically indistinguishable at
approximately 225.4 points. Turning to the pooled sample, the grade points are 214.6 for the
population and 214.7 for our sample of responders. Again, there is no meaningful difference when
comparing the population figures with the sample. Similar arguments can be made regarding the
test scores on the national test in mathematics in Panel B and the percentage failing the national
test in mathematics in Panel C. In the following econometric analysis, we follow the same
procedure as in B&M and standardize the grade and the test score points nationally each year, so
that it we have a mean of 0 and a standard deviation of 1.13
13 B&M use a student achievement measure similar to final grades in terms of measurement. The GCSE test scores used are graded from A* to G, with an A* being worth 58 points and decreasing in increments of six down to G grade. Students take GCSEs in different subjects, and B&M use the individual's sum of these GCSE points, standardized in the same manner. Thus, the aggregation of the outcome is similar.

12
Table 1 Descriptive statistics on the outcome variables for responding vs. nonresponding schools
(1) (2) (3) (4)
All schools
2016/17
Sample with
response
2016/17
All schools
1997-2018
Sample with
response
1997-2018
Panel A: Grade points
Grade points 226.0 225.4 214.6 214.7
(28.46) (28.62) (22.88) (23.04)
Observations 1,423 1,086 22,832 16,724
Panel B: Mathematics national test score
Test score 10.81 10.81 11.18 11.22
(2.275) (2.283) (1.961) (1.961)
Observations 1,401 1,070 12,599 9,371
Panel C: Percent failing mathematics national test
Percent fail math 15.97 16.18 10.83 10.84
(13.60) (2.283) (12.12) (12.03)
Observations 1,386 1,059 17,436 12,760 Notes: Table 1 presents descriptive statistics for key variables for all schools and schools responding to the survey. Standard deviations are shown in square parentheses. Sources: Swedish National Agency for Education and author-conducted survey.
Table 2 provides more descriptive statistics on the pooled population and the sample for school
characteristics. The variable percentage boys is the school average of the percentage boys.
Percentage foreigners is measured in the following way: before 2011, percentage foreigners was
the share born outside Sweden. After changes to this definition, it became the share of newly
immigrated individuals. The education level of parents is a school average based on individual
measures from 1 to 3, where a parent has education level 1 if s/he has completed secondary school,
2 if high school and 3 if higher education. The socioeconomic index is a combination of the three

13
variables mentioned and is produced from a regression of merit points on these variables. Then,
the predicted values serve as the socioeconomic index. Again, we conclude that our sample of
responding schools is very similar to the population and hence representative.
Table 2 Descriptive statistics on characteristics for responding vs. nonresponding schools
(1) (2)
All schools
1997-2018
Sample with
response
1997-2018
51.21 51.23
Percentage boys (7.934) (7.782)
Percentage foreigners 6.615 6.687
(8.054) (8.218)
Education level parents 2.207 2.209
(0.230) (0.231)
Socioeconomic index 214.0 214.1
(19.00) (19.10)
Observations 22,832 16,724 Notes: Table 2 presents descriptive statistics for variables for all schools and schools responding to the survey. Standard deviations are shown in square parentheses. Sources: Swedish National Agency for Education and author-conducted survey.
2.3 Empirical strategy
We estimate the effect of a mobile phone ban on student outcomes in a staggered difference-in-
difference setting following B&M. However, our approach differs in that we are using school-level
data, but this should come at no cost because treatment is at the school level in both studies and
grade data are complete. As the treatment is staggered in time, schools that have not yet or never
introduced a ban will serve as control groups. The standard errors are clustered at the level of
treatment, the school level. In addition to additivity, the major identification assumption is parallel

14
trends across treatment and control units in the absence of a mobile phone ban. We follow – as
closely as our data allow – the same empirical design as B&M, which can be consulted for more
details.
Our baseline specification becomes
𝑌𝑠𝑡 = 𝛽0 + 𝛽1𝐵𝑎𝑛𝑠𝑡 + 𝜇𝑠 + 𝛾𝑡 + 𝜀𝑠𝑡
where 𝑌𝑠𝑡 is student performance in school s in year t. Our measures of student performance are
school average grade points, average test score on the national test in mathematics, and percentage
failing the national test in mathematics. 𝐵𝑎𝑛 is the indicator variable of interest for whether schools
ban mobile phones at time t, and its coefficient, 𝛽1, is the parameter of interest and captures the
impact of the introduction of the mobile phone ban on student test scores, 𝜇𝑠 is the school fixed
effects, 𝛾𝑡are the year fixed effects and 𝜀𝑠𝑡 is the error term. Note that we could also – in line with
B&M – include controls (Xst) such as gender. However, again, this will be aggregated to schools,
and thus, those types of variables will be in the school-level share, as presented in table 2. We do
not have pretreatment test scores, and thus we cannot replicate the value-added estimate in column
2 table 4 in B&M. Fortunately, they conclude that the main effect is not affected by including prior
performance. This conclusion is not surprising under the assumption of common trends. With
respect to parallel trends, we follow B&M and check for potential trends in student achievement
before the introduction by expanding equation (1) to include a sequence of lags and leads of the
treatment indicator. This is typically referred to as an event study in the literature. If there are no

15
effects in the pretreatment period, this is consistent with the parallel trends assumption being
fulfilled.
3 Results
3.1 Main Results
Starting with an examination of the common trends assumption, we plot the annual “treatment”
effect both before and after the year of mobile phone ban in Figure 2 for the grade points. We show
the results for up to 5 periods before and after, and the year before treatment is used of as the
baseline. Year 6 before and after the baseline year contains all years before and after year 5,
respectively. For a causal interpretation, one should put more weight on the years just before and
after the introduction of the ban, as these years will have fewer potential changes in the composition
of students. Focusing on the pretreatment periods, we see no violations of the parallel trends
assumption. Interestingly, there are no signs of a treatment effect either. The small upward trend in
year 5 seems to be consistent with positive student sorting, as shown in appendix figure A1.14
Moreover, we have performed another standard validation exercise, which is presented Table A2.
We have added schools’ specific linear time trends (Angrist and Pischke, 2009). The point
estimates are again small and insignificant.
14 Sorting is more prevalent in the Swedish school system due to free school choice and the voucher
system (Malmberg et al. 2013). However, the positive sorting explanation must be taken with a
grain of salt as the pooled effect is not significant with an estimate of 0.031 and a standard error of
0.033.

16
Figure 2. Impact of the phone ban by years of exposure on merit points
Notes: Estimated impact of mobile phone ban on age 16 standardized grade point by years of exposure. The baseline year is the year prior to introduction. Error bars represent the 95 % confidence intervals with robust standard errors clustered at the school level. Sources: Swedish National Agency for Education and author-conducted survey.
Turning to our second outcome, the average test score on the national test in mathematics, we again
see no signs of violation of common trends before the school ban. Corresponding to our main
outcome, we see no impact after the ban in Figure 3.

17
Figure 3. Impact of phone ban by years of exposure on national test scores in mathematics
Notes: Estimated impact of mobile phone ban on age 16 standardized test scores in national test in mathematics by years of exposure. The baseline year is the year prior to introduction. Error bars represent the 95 % confidence intervals with robust standard errors clustered at the school level. Sources: Swedish National Agency for Education and author-conducted survey.
Turning to our third outcome in Figure 4, the percentage failing the national test in mathematics,
we again see no signs of violation of common trends before the school ban. Corresponding to our
main outcome, we see no impact after the ban either.

18
Figure 4. Impact of phone ban by years of exposure on percentage failing the national test in
mathematics
Notes: Estimated impact of mobile phone ban on age 16 percentage failing standardized national test in mathematics by years of exposure. The baseline year is the year prior to introduction. Error bars represent the 95 % confidence intervals with robust standard errors clustered at the school level. Sources: Swedish National Agency for Education and author-conducted survey.
Now turning to the estimation, it comes as no surprise that no significant effects are detected.
Column 1 in table 3 presents the equivalent of column 1 table 4 in B&M. Focusing on the 95 %
confidence interval in brackets, we find that effects larger than 0.024 can be rejected. Thus, we can
reject effect sizes of the magnitude presented in B&M. In columns 2-5, we continuously add school
characteristics. Given the pattern observed in Figure 2, we should not expect a large difference in

19
the point estimate. However, residual variance could be affected, and estimates could be more
precisely estimated. Indeed, this pattern can be observed, and in column 5, when finally adding the
socioeconomic index, we can reject positive effect sizes larger than 1 percent of a standard
deviation. The treatment effect is never significantly different from zero at a 5 percent significance
level.
Table 3: Effect of mobile bans on merit points
Merit points (1) (2) (3) (4) (5)
Ban -0.034 -0.042 -0.038 -0.042 -0.042*
(0.029) (0.029) (0.028) (0.026) (0.025)
[-0.092 [-0.100 [-0.094 [-0.092 [-0.092
0.024] 0.015] 0.017] 0.008] 0.008]
Observations 16,724 16,724 16,724 16,724 16,724
R-squared 0.743 0.748 0.757 0.781 0.786
Share boys no yes yes yes no
Share
immigrants
no no yes yes no
Parents
education
no no no yes no
Socioindex no no no no yes Notes: Table 3 presents regression estimates for standardized merit points. All specifications include school effects and year effects. We use robust clustered standard errors at the school level. Robust standard errors are in parentheses. *** p<0.01, ** p<0.05, * p<0.1 and a 95 % CI in brackets. Sources: Swedish National Agency for Education and author-conducted survey.
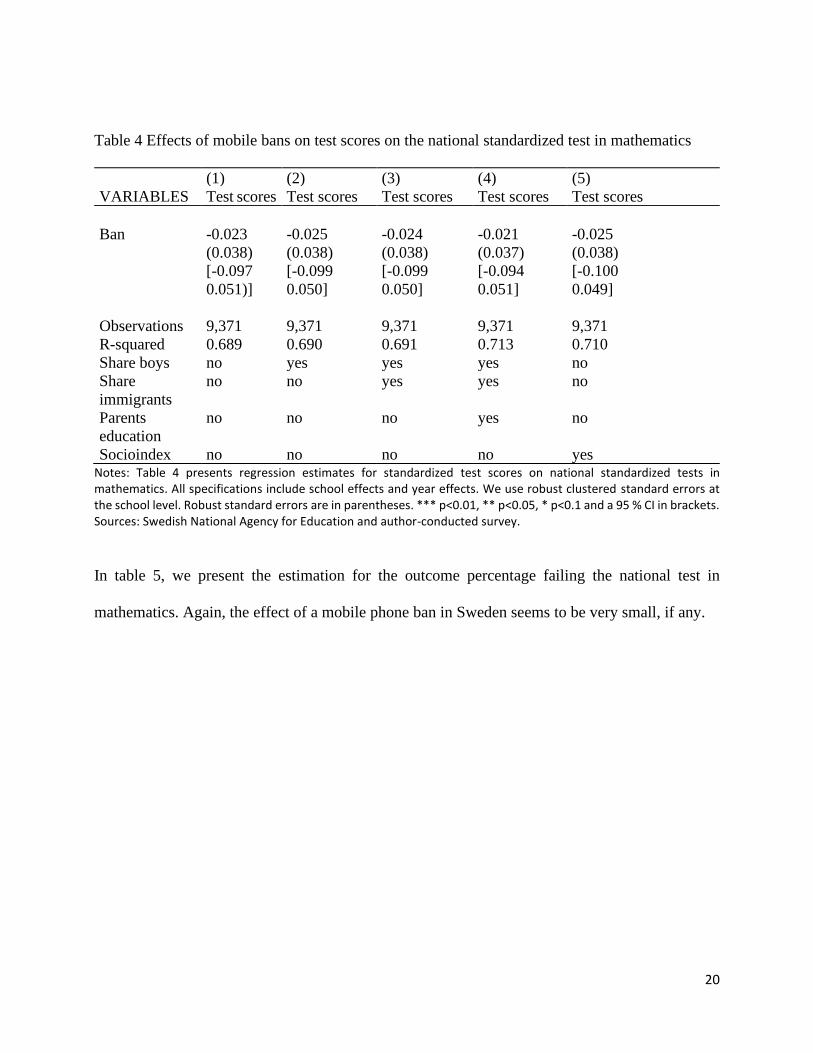
In table 4, we present the estimation results using the same setup as in table 3 but for test scores on
the national test in mathematics. Again, the effect of a mobile phone ban in Sweden seems to be
very small and negative, if any. None of the estimates are significantly different from zero at the 5
% significance level.
20
Table 4 Effects of mobile bans on test scores on the national standardized test in mathematics
(1) (2) (3) (4) (5)
VARIABLES Test scores Test scores Test scores Test scores Test scores
Ban -0.023 -0.025 -0.024 -0.021 -0.025
(0.038) (0.038) (0.038) (0.037) (0.038)
[-0.097 [-0.099 [-0.099 [-0.094 [-0.100
0.051)] 0.050] 0.050] 0.051] 0.049]
Observations 9,371 9,371 9,371 9,371 9,371
R-squared 0.689 0.690 0.691 0.713 0.710
Share boys no yes yes yes no
Share
immigrants
no no yes yes no
Parents
education
no no no yes no
Socioindex no no no no yes Notes: Table 4 presents regression estimates for standardized test scores on national standardized tests in mathematics. All specifications include school effects and year effects. We use robust clustered standard errors at the school level. Robust standard errors are in parentheses. *** p<0.01, ** p<0.05, * p<0.1 and a 95 % CI in brackets. Sources: Swedish National Agency for Education and author-conducted survey.
In table 5, we present the estimation for the outcome percentage failing the national test in
mathematics. Again, the effect of a mobile phone ban in Sweden seems to be very small, if any.

21
Table 5 Effects of mobile bans on the percentage failing the national standardized test in
mathematics.
% fail math test (1) (2) (3) (4) (5)
Ban 0.003 0.008 -0.000 0.008 0.027
(0.542) (0.543) (0.546) (0.536) (0.542)
[-1.061 [-1.057 [-1.071 [-1.044 [-1.036
1.067] 1.073] 1.071] 1.060] 1.090]
Observations 12,760 12,760 12,760 12,760 12,760
R-squared 0.501 0.501 0.503 0.511 0.509
Share boys no yes yes yes no
Share
immigrants
no no yes yes no
Parents
education
no no no yes no
Socioindex no no no no yes Notes: Table 5 presents regression estimates for percentage failing the national test in mathematics. All specifications include school effects and year effects. We use robust clustered standard errors at the school level. Robust standard errors are in parentheses. *** p<0.01, ** p<0.05, * p<0.1 and a 95 % CI in brackets. Sources: Swedish National Agency for Education and author-conducted survey.
In table 6 we perform validity checks by following Pei et al. (2019), i.e., relating the introduction
of a ban to other school-level policy variables. For example, one could be worried that the
introduction of bans is related to other policy changes and thereby invalidate a ceteris paribus
evaluation. In columns 1 to 6, school inputs such as the student teacher ratio are used as outcomes.
Reassuringly, none of the policy variables are related to the introduction of bans.
We argued that Swedish schools have a long history of making large investments in digital
technologies and devices and that that history might help mitigate some of the potential negative
impacts of mobile phones (Tallvid 2015). Unfortunately, we have not been able to find data on
historical use in Sweden. However, we identified one large-scale ICT reform that occurred during
the studied period, and that is the introduction of the one student-one computer program, the so

22
called “1 to 1” program. Hall et al. (2019) find no relation of the 1-to-1 reform on performance,
but for completeness we still want to investigate whether the introduction of mobile phone ban is
related to the introduction of a 1-to-1. We use the year of the municipal introduction of 1-to-1 as
the starting year.15 We code a dummy taking the value one for the year of introduction and onwards
and zero before. Using the dummy as outcome, we report in column 7 a non-statistically significant
relation. Thus, the late 1-to-1 reform seems to be unrelated to the bans on mobile phones.
Combined with the findings of Hall et al. (2019) it seems that the two interventions are not affecting
student performance and they are not related in time. Again, one explanation for the results could
be that Swedish schools have long made large investments in digital technologies, that 70 percent
of all students in grade 8 already had their own computer, and that Sweden has one of the highest
computer densities in Europe, a feature shared by other Scandinavian countries. This may limit the
scope of ICT-investments or bans in Sweden and similar countries in Scandinavia due decreasing
returns to scale.
Table 6. The effect of the ban on other school policies
(1) (2) (3) (4) (5) (6) (7)
Outcome No. of
Head-
masters
No. of
teachers
Share(%)
female
teachers
Share(%)
teacher:
pedagogical
education
Share(%)
teacher:
special
pedagog.
Student
teacher
ratio
1to1
computer
education
Ban 0.022 -0.242 -0.415 0.299 0.193 0.005 -0.022
(0.043) (0.493) (0.462) (0.487) (0.191) (0.143) (0.023)
Observations 15,148 15,498 15,496 15,317 12,088 15,486 16,724
R-squared 0.602 0.789 0.659 0.682 0.547 0.147 0.619 Notes: Table 6 presents regression estimates for other school level policy variables. All specifications include school effects and year effects and the control for the socioeconomic index. We use robust clustered standard errors at the
15 The survey can be found on https://skoldator.wordpress.com/lista-over-en-till-en-skolor-i-sverige/

23
school level. Robust standard errors are in parentheses. *** p<0.01, ** p<0.05, * p<0.1. Sources: Swedish National Agency for Education and author-conducted survey.
The overall picture for Sweden is that there were no significant gains from introducing bans.
However, maybe the difference with B&M is still not country-specific but rather due to different
sampling. For example, we acknowledge that we are comparing the universe of schools and not
only urban schools, as was done in B&M. Another feature of B&M is that the effects are driven by
groups in the lower tail of the achievement distribution. The next section deals further with
comparability or external validity.
3.2 Comparability
In table 7, column 1, we show the results when estimating our model using only the four largest
cities: Stockholm, Gothenburg, Malmö, and Uppsala. In the second column, we instead exclude
those same cities. We repeat the same procedure for all three outcomes. Comparing the estimate in
column 1 with the estimate in 2, we find no statistical differences. Taken at face value, introducing
a ban would decrease the merit points for schools in both urban and rural municipalities. When
instead evaluating the test-score-based outcomes, we instead see the effects, taken at face value,
that are more in line with B&M, as a ban would increase test scores in urban schools (Column 3)
and would decrease the share failing in math in urban schools (Column 5). However, none of the
point estimates are significantly different from zero, and importantly, none are statistically different
from each other when comparing the urban rural municipalities across outcomes.16 Thus, we find
no evidence that our results would be different in urbans schools in Sweden.
16 We used the suest command in Stata to test for the difference in coefficients after estimating the models separately.

24
Table 7. The effect of the ban on student outcomes for urban and rural schools
(1) (2) (3) (4) (5) (6)
Outcome Merit
points
Merit
points
Test
scores
Test
scores
% fail
math test
% fail
math test
Ban -0.078 -0.038 0.097 -0.049 -1.192 0.305
(0.064) (0.028) (0.097) (0.041) (1.143) (0.616)
Observations 2,475 14,249 1,487 7,884 2,000 10,760
R-squared 0.884 0.740 0.792 0.679 0.606 0.490
Urban yes no yes no yes no Notes: Table 7 presents regression estimates for student outcomes for urban and rural municipalities separately. All specifications include school effects and year effects and the control for the socioeconomic index. We use robust clustered standard errors at the school level. Robust standard errors are in parentheses. *** p<0.01, ** p<0.05, * p<0.1. Sources: Swedish National Agency for Education and author-conducted survey.
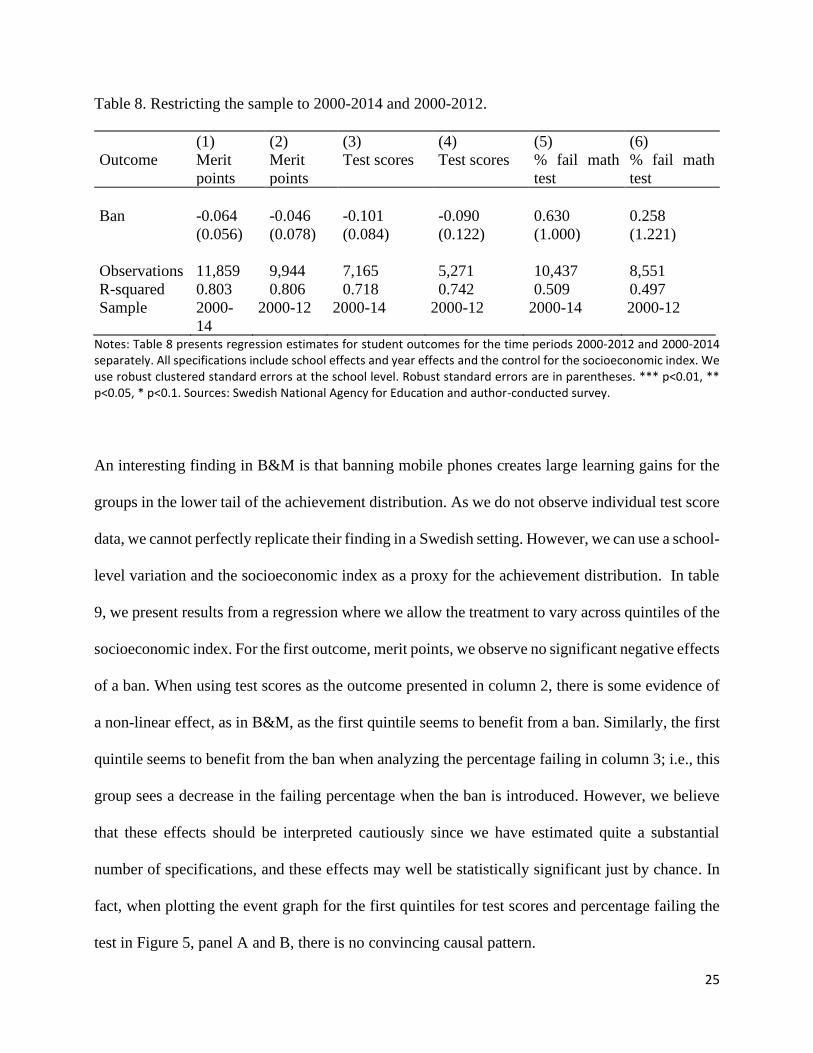
In table 8, we instead mimic B&M by restricting our sample in time. We acknowledge two
differences from B&M. They study the period until 2012. Most of increases in bans in their sample
took place between 2005-2010, and by 2010, all but 6 schools in their sample had some type of ban
in place. One potential difference between our result and B&M could be due to the time profile.
The first iPhone was introduced in 2007 and it could be the case that the UK setting schools were
choosing phone bans as a pro-active reaction to a new technology. As most of our bans come later,
our results could be driven by a reaction and not pro-actively, particularly because B&M’s first
working paper is from 2014 and attracted media attention. Hence, the result may be driven by that.
For this reason, we first re-estimate our models for the same year as B&M (2000-2012) but also
2000-2014. Table 8 shows the results when imposing these restrictions.
Again, the results point to no learning gains from banning mobile phones.
25
Table 8. Restricting the sample to 2000-2014 and 2000-2012.
(1) (2) (3) (4) (5) (6)
Outcome Merit
points
Merit
points
Test scores Test scores % fail math
test
% fail math
test
Ban -0.064 -0.046 -0.101 -0.090 0.630 0.258
(0.056) (0.078) (0.084) (0.122) (1.000) (1.221)
Observations 11,859 9,944 7,165 5,271 10,437 8,551
R-squared 0.803 0.806 0.718 0.742 0.509 0.497
Sample 2000-
14
2000-12 2000-14 2000-12 2000-14 2000-12
Notes: Table 8 presents regression estimates for student outcomes for the time periods 2000-2012 and 2000-2014 separately. All specifications include school effects and year effects and the control for the socioeconomic index. We use robust clustered standard errors at the school level. Robust standard errors are in parentheses. *** p<0.01, ** p<0.05, * p<0.1. Sources: Swedish National Agency for Education and author-conducted survey.
An interesting finding in B&M is that banning mobile phones creates large learning gains for the
groups in the lower tail of the achievement distribution. As we do not observe individual test score
data, we cannot perfectly replicate their finding in a Swedish setting. However, we can use a school-
level variation and the socioeconomic index as a proxy for the achievement distribution. In table
9, we present results from a regression where we allow the treatment to vary across quintiles of the
socioeconomic index. For the first outcome, merit points, we observe no significant negative effects
of a ban. When using test scores as the outcome presented in column 2, there is some evidence of
a non-linear effect, as in B&M, as the first quintile seems to benefit from a ban. Similarly, the first
quintile seems to benefit from the ban when analyzing the percentage failing in column 3; i.e., this
group sees a decrease in the failing percentage when the ban is introduced. However, we believe
that these effects should be interpreted cautiously since we have estimated quite a substantial
number of specifications, and these effects may well be statistically significant just by chance. In
fact, when plotting the event graph for the first quintiles for test scores and percentage failing the
test in Figure 5, panel A and B, there is no convincing causal pattern.

26
Table 9. The effect of mobile phone bans on student performance for different quintiles of
the socioeconomic index distribution
(1) (3) (3)
VARIABLES Merit points Test scores % fail math test
ban_index1 -0.063 0.251** -3.328**
(0.057) (0.101) (1.555)
ban_index2 -0.023 -0.119 0.620
(0.056) (0.095) (1.338)
ban_index3 0.008 -0.045 0.202
(0.060) (0.080) (1.318)
ban_index4 0.009 -0.102 0.748
(0.059) (0.078) (1.058)
ban_index5 -0.076 -0.062 1.211
(0.051) (0.062) (0.911)
Observations 15,877 8,945 12,055
R-squared 0.790 0.709 0.507
Socioeconomic index yes yes yes Notes: Table 9 presents regression estimates for student outcomes based on the impact of the ban for different quintiles of the socioeconomic index. All specifications include school effects and year effects and quintiles indicators. We use robust clustered standard errors at the school level. Robust standard errors are in parentheses. *** p<0.01, ** p<0.05, * p<0.1. Sources: Swedish National Agency for Education and author-conducted survey.

27
Figure 5. Impact of the phone ban for the first quintile of the socioeconomic index
Panel A: Impact of the phone ban by years of
exposure on test scores.
Panel B: Impact of phone ban by years of
exposure on percentage failing the national test
4 Discussion and concluding remarks
This paper adds to the almost nonexistent body of studies that use quasi experimental designs to
investigate the consequences of banning mobile phones. Using a new country, Sweden, as our
testing ground and the universe of Swedish secondary schools, we exploit differences in
implementation dates and find no improvement in student performance in schools that have
introduced a mobile phone ban. We cannot confirm the results of B&M. There are many potential
reasons for why our results differ from B&M. We study a different country and school system as
well as a somewhat different period. As noted by Ott (2017), Swedish schools have long made
large investments in digital technology (e.g. tablets and laptops), and ICT is intertwined in the
Swedish educational system. Schools are also encouraged to develop pedagogical uses for digital
technology as tools for learning in school practice. Mobile phones have typically not been included.
Nevertheless, students have brought their mobile phones to school and used them for schoolwork.

28
For example, the case study by Olin-Scheller & Tanner (2015) finds that mobile phones are mostly
used between assignments and that such use does not generally disturb teaching. Taken all together,
this indicates a structured use of digital technology. This may well be one important distinguishing
feature explaining the difference in results with B&M, as they focus more on unstructured use. Our
main conclusion is that the result in B&M is not transferable to Sweden and potentially not
transferrable to similar countries such as Denmark and Norway. The policy guidance is therefore
as follows: although a national ban is a low-cost policy, small or no learning gains are to be
expected in Sweden and in countries with similar school systems and similar investments in
information and communication technology.
5 References
Barrow, Markman, L.L., Rouse, C.E., 2009. “Technology's edge: the educational benefits of
computer aided instruction.” American Economic Journal: Economic Policy, Vol. 1, No. 1 pp. 52-
74.
Beland, L. & Murphy, R. (2016) “Ill Communication: Technology, distraction student
performance.” Labour Economics 41. p. 61-76.
Berg, P., Palmgren, O., & Tyrefors, B. (2019). Gender Grading Bias in Secondary Schools
Mathematics. IFN Working Paper No. 1263, 2019
Berry, M., & Westfall, A. (2015). “Dial D for distraction: the making and breaking of cell phone
policies in the college classroom.” College Teaching, 63(2), 62–71.

29
Cameron, A.C., Gelbach, J.B., Miller, D.L., 2008. Bootstrap-based improvements for inference
with clustered errors. Rev. Econ. Stat. 90 (3), 414–427.
Campbell, S. W. (2006). “Perceptions of mobile phones in college classrooms: Ringing, cheating,
and classroom policies.” Communication Education, 55(3), 280–294.
Ding,W.W., Levin, S.G., Stephan, P.E.,Winkler, A.E., (2009). “The Impact of Information
Technology on scientists' Productivity, Quality and Collaboration Patterns.” NBER Working Paper.
No. 15285
Escueta, M., Quan,V., Nickow, A., & Oreopoulos, P. "Education Technology: An Evidence-Based
Review", NBER Working Paper No. 23744, 2017.
Fairlie, R. W., and Kalil, A., (2017). “The Effects of Computers on Children’s Social Development
and School Participation: Evidence from a Randomized Control Experiment.” Economics of
Education Review. 57: 10-19.
Fairlie, R. W., & Robinson, J. (2013). “Experimental Evidence on the Effects of Home Computers
on Academic Achievement among Schoolchildren.” American Economic Journal: Applied
Economics 5(3): 211-240.
Gao, Q., Yan, Z., Zhao, C., Pan, Y., & Mo, L. (2014) “To ban or not to ban: Differences in mobile
phone policies at elementary, middle, and high schools.” Computers in Human Behavior, 38: 25-
32.

30
Hall, C., Lundin, M., & Sibbmar, K. “A laptop for every child? The impact of ICT on educational
outcomes”. IFAU working paper 2019:26.
Hinnerich, B. T., & Vlachos J. (2017) The impact of upper-secondary voucher school attendance
on student achievment. Swedish evidence using external and internal evaluations. Labour
Economics, Volume 47, August 2017, Pages 1-14.
IIS, The Internet Foundation in Sweden: (2016) The Internet Foundation in Sweden
https://internetstiftelsen.se/docs/Svenskarna_och_internet_2016.pdf
IIS, The Internet Foundation in Sweden: (2018) “Skolbarnen och Internet”:
https://internetstiftelsen.se/docs/Skolbarnen-och-internet-2018-4.pdf
Lane, D. (2003). The Maine Learning Technology Initiative impact on students and learning.
Center for Education Policy, Applied Research, and Evaluation, Portland, ME: University of
Southern Maine.
Lenhart, A., Ling, R., Campbell, S., & Purcell, K. (2010). “Teens and mobile phones.” Washington,
DC: Pew Internet American Life Project.
Malamud, O., Pop-Eleches, C., 2011. “Home computer use and the development of human
Capital. The Quarterly Journal of Economics, 2011, vol. 126, issue 2, 987-1027

31
Machin, S., McNally, S., Silva, O., 2007. “New technology in schools: is there a payoff?”
Economic Journal 117 (522), 1145–1167.
Malmberg, B., Andersson, E., Bergsten, Z., och Östh, J. 2013. ”Det fria skolvalet ökar klyftor
mellan skolor, Den svenska skolans nya geografi.” Resultatdialog 2013. Stockholm:
Vetenskapsrådet.
Ofcom (2018), https://www.ofcom.org.uk/about-ofcom/latest/media/media-releases/2018/decade-
of-digital-dependency, 02 August 2018.
Olin-Scheller, C., & Tanner, M. (2015). “Street smart i klassrummet?: Högstadieelevers
användning av smarta telefoner i undervisningens”. Karlstads Universitets Pedagogiska Tidskrift.
1, 23-24.
Ott, T. (2014). “A historical materialist analysis of the debate in Swedish print media on mobile
phones in school settings”. International Journal of Mobile and Blended Learning., 6(2), 1–14.
Ott, T. (2017). Mobile phones in school: from disturbing objects to infrastructure for learning.
Dissertation thesis Göteborg: Department of Applied Information Technology, University of
Gothenburg.
32
Peck, C., Hewitt, K. K., Mullen, C. A., Lashley, C. A., Eldridge, J. A., & Douglas, T.-R. M. (2015).
“Digital youth in brick and mortar schools: Examining the complex interplay of students,
technology, education, and change.” Teachers College Record. 117(5):1-40
Pei, Z., Pischke, J. & Schwandt, H. (2019). “Poorly Measured Confounders are More Useful on the Left
than on the Right”. Journal of Business & Economic Statistics, 37:2, 205-216,
Riis, U. (2000). IT in schools between vision and practice: a research overview. Stockholm: The
National Agency for Education
Sharples, M. (2013). “Mobile learning: Research, practice and challenges.” Distance Education in
China, 3(5), 5–11.
Skolverket (2016) “Redovisning av uppdraget om att föreslå nationella IT-strategier för
skolväsendet, Dnr U2015/04666/S.
Selwyn, N (2004). ”Reconsidering political and popular understandings of the digital divide”. New
media & Society 6 (3) 341-362
Tallvid, M. (2015). ”1:1 i klassrummet—analyser av en pedagogisk praktik i förändring.”
Gothenburg Sweden: University of Gothenburg.

33
Thomas, K. M., O’Bannon, B. W., & Britt, V. G. (2014). “Standing in the schoolhouse door:
Teacher perceptions of mobile phones in the classroom.” Journal of Research on Technology in
Education, 46(4), 373– 395.
Thomas, K., & Muñoz, M. A. (2016). “Hold the phone! High school students’ perceptions of
mobile phone integration in the classroom.” American Secondary Education, 44(3), 19-37.
Telenor (2018) Mobilförbud mer regel än undantag i Sveriges klassrum, available online at:
https://www.mynewsdesk.com/se/telenor\_ab/pressreleases/mobilfoerbud-mer-regel-
aenundantag-i-sveriges-klassrum-2389829, retrieved on 2018-05-06.
Utbildningsdepartementet (2017). Nationell digitaliseringsstrategi för skolväsendet Retrieved 20
June 2019 from:
https://www.regeringen.se/4a9d9a/contentassets/00b3d9118b0144f6bb95302f3e08d11c/nationell
-digitaliseringsstrategi-for-skolvasendet.pdf
Vlachos, J., 2018. ”Trust-Based Evaluation in a Market-Oriented School System”, IFN Working
Paper No 1217.

34
Appendix
Figures
Figure A1. School choice and posttreatment composition
Notes: Estimated impact on age and socioeconomic index of mobile phone ban by years of exposure. Baseline year is the year prior to introduction. Error bars represent the 95 % confidence intervals with robust standard errors clustered at the school level. Sources: Swedish National Agency for Education and author-conducted survey.

35
Tables
Table A1: Robustness checks: percentage failing national test in mathematics
(1) (2)
VARIABLES Removing missing Impute share using max. no.
Ban 0.232 0.027
(1.676) (0.542)
[-3.056 [-1.036
3.521) 1.090]
Observations 7,514 12,760
R-squared 0.490 0.509
Socioindex yes yes
Table A2: Including linear time trends
(1) (2) (3)
VARIABLES Merit points Test scores % fail
math test
Ban -0.016 -0.009 -0.194
(0.025) (0.043) (0.675)
Observations 16,686 9,267 12,669
R-squared 0.835 0.776 0.584
Share boys no no no
Share immigrants no no no
Parents’ education no no no
Socioindex yes yes yes