the impact of authentic leadership development on safety
TRANSCRIPT

Walden UniversityScholarWorks
Walden Dissertations and Doctoral Studies Walden Dissertations and Doctoral StudiesCollection
2018
The Impact of Authentic Leadership Developmenton Safety Climate ChangeVictoria HoytWalden University
Follow this and additional works at: https://scholarworks.waldenu.edu/dissertations
Part of the Industrial Engineering Commons, Industrial Technology Commons, OrganizationalBehavior and Theory Commons, and the Quantitative Psychology Commons
This Dissertation is brought to you for free and open access by the Walden Dissertations and Doctoral Studies Collection at ScholarWorks. It has beenaccepted for inclusion in Walden Dissertations and Doctoral Studies by an authorized administrator of ScholarWorks. For more information, pleasecontact [email protected].

Walden University
College of Social and Behavioral Sciences
This is to certify that the doctoral dissertation by
Victoria Hoyt
has been found to be complete and satisfactory in all respects, and that any and all revisions required by the review committee have been made.
Review Committee
Dr. Marlon Sukal, Committee Chairperson, Psychology Faculty Dr. Karla Phlypo, Committee Member, Psychology Faculty
Dr. Frederica Hendricks-Noble, University Reviewer, Psychology Faculty
Chief Academic Officer Eric Riedel, Ph.D.
Walden University 2018

Abstract
The Impact of Authentic Leadership Development on Safety Climate Change
by
Victoria Hoyt
MS, Walden University, 2010
BS, California State University, 2004
Dissertation Submitted in Partial Fulfillment
of the Requirements for the Degree of
Doctor of Philosophy
Organizational Psychology
Walden University
May 2018

Abstract
Tragic, life-changing, and fatal incidents are a reality on large-scale, civil construction
projects. Despite a decline following the enforcement of the 1971 Occupational Safety
and Health Act, serious and fatal incidents on heavy construction projects remain higher
than that of the active military and have not declined in any notable way in the past
decade. Industrial-organizational literature suggested a lack of applied testing for the
well-developed theory of authentic leadership (AL) to impact safety outcomes. This
quasi-experiment combined the constructs of authentic leadership with safety climate
perception as quantifiable measurement of potential safety outcomes in the workplace.
The research question focused on whether AL would impact safety climate, thus,
reducing injury and fatalities on the job. The researcher examined 1 of the 4 segments
that comprised a $1 billion freeway improvement project. Perceptions of 108 field craft
personnel were collected on a Likert-type instrument before and after their supervisors
attended a brief AL workshop. Utilizing an ordinal scale, statistical significance was
calculated pre- and postintervention by computing a Mann-Whitney U for independent
samples. Significant improvement was found following the supervisor AL workshop
and incidents decreased sharply in the 4 weeks following intervention. The reduction in
incidents, when compared to the jobsite’s history and the other 3 jobsite segments
associated with the highway improvement project, suggests a potential for this framework
to support positive social change, that is, to reduce the human cost and suffering
associated with industrial accidents.

The Impact of Authentic Leadership Development on Safety Climate by
Victoria Hoyt
MS, Walden University, 2010
BS, California State University, 2004
Dissertation Submitted in Partial Fulfillment
of the Requirements for the Degree of
Doctor of Philosophy
Organizational Psychology
Walden University
May 2018

Dedication
This study is dedicated to a handful of close friends that I have known and
worked with who have lost their lives and limbs as well as to the massive number of
people I never met who have suffered from preventable incidents building America’s
infrastructure.

Acknowledgments
A research study of this magnitude would not be possible without the generous
support and encouragement of my dissertation committee. To Dr. Marlon Sukal, I
appreciate your unwavering confidence in this important endeavor. To my committee
members, Dr. Karla Phlypo and Dr. Frederica Hendricks-Noble, I appreciate all your
feedback and advice for making this journey an enlightening experience.

i
Table of Contents
List of Tables .......................................................................................................................v
List of Figures .................................................................................................................... vi
Chapter 1: Introduction to the Study ....................................................................................1
Introduction ....................................................................................................................1
Background ....................................................................................................................1
Problem Statement .........................................................................................................5
Purpose of the Study ......................................................................................................7
Research Questions and Hypotheses .............................................................................8
Research Question 1 ............................................................................................... 8
Research Question 2 ............................................................................................... 8
Research Question 3 ............................................................................................... 9
Theoretical and Conceptual Framework for the Study ................................................10
Theoretical Foundation ......................................................................................... 10
Conceptual Framework ......................................................................................... 11
Nature of the Study ......................................................................................................12
Independent Variables .......................................................................................... 12
Dependent Variables ............................................................................................. 12
Definition of Terms......................................................................................................15
Assumptions .................................................................................................................17
Scope and Delimitations ..............................................................................................17

ii
Limitations ...................................................................................................................18
Significance..................................................................................................................19
Summary ......................................................................................................................20
Chapter 2: Literature Review .............................................................................................22
Introduction ..................................................................................................................22
Literature Search Strategy............................................................................................23
Authentic Leadership ...................................................................................................24
Authentic Leadership Development ............................................................................26
Small Group Coaching to Facilitate AL Development ................................................28
Safety Coaching .................................................................................................... 30
Safety Climate ....................................................................................................... 31
Summary and Conclusions ..........................................................................................32
Chapter 3: Research Method ..............................................................................................34
Introduction ..................................................................................................................34
Research Design Rational ............................................................................................34
Methodology ................................................................................................................35
Population ............................................................................................................. 35
Study Sample ........................................................................................................ 36
Procedures for Recruitment, Participation, and Data Collection .......................... 36
Debriefing ............................................................................................................. 37
Additional Information ......................................................................................... 37

iii
Archival Data ........................................................................................................ 38
Instrumentation and Operationalization of Constructs ......................................... 38
Data Analysis Plan ................................................................................................ 41
Research Question 1 ............................................................................................. 42
Research Question 2 ............................................................................................. 42
Research Question 3 ............................................................................................. 43
Threats to Validity .......................................................................................................44
External Threats to Validity .................................................................................. 44
Internal Threats to Validity ................................................................................... 45
Ethical Procedures .......................................................................................................46
Summary ......................................................................................................................47
Chapter 4: Results ..............................................................................................................49
Introduction ..................................................................................................................49
Data Collection ............................................................................................................49
Characteristics of the Survey Participants ............................................................ 51
Treatment and/or Intervention Fidelity ................................................................. 55
Study Results ...............................................................................................................57
Comparative/Relative Percentages of Authentic Leadership in Pretest and
Posttest-Surveys ........................................................................................ 57
Perceptions of Leadership Authenticity ................................................................ 58
Safety Climate Perceptions T1 and T0 ................................................................. 62

iv
Total Score for Study Survey ................................................................................ 75
Project Incident Records ....................................................................................... 75
Summary ......................................................................................................................77
Chapter 5: Discussion, Conclusions, and Recommendations ............................................80
Introduction ..................................................................................................................80
Interpretation of Findings ............................................................................................81
Limitations of the Study...............................................................................................85
Recommendations for Research ..................................................................................86
Recommendations for Practice ....................................................................................87
Implications for Social Change ....................................................................................89
Conclusion ...................................................................................................................91
References ..........................................................................................................................93

v
List of Tables
Table 1. Position Held by Survey Respondents ................................................................51
Table 2. Crafts Represented in Survey Responses.............................................................52
Table 3. Age Range of Participants ...................................................................................53
Table 4. Race/Ethnicity of Study Participants ...................................................................54
Table 5. Authentic Leadership Questions ..........................................................................58
Table 6. Authentic Leadership Composite Score ..............................................................62
Table 7. Composite Subscale Score for Individual Motivation .........................................67
Table 8. Composite Subscale Score for Management’s Prioritization of Safety ...............71
Table 9. Composite Subscale Score for Perception of Safety Routines Established by
Management ...........................................................................................................74
Table 10. Total Score Comparison for Study Survey ........................................................75
Table 11. Injuries, Equipment Damage, and Public Utility Hit Summary ........................77

vi
List of Figures
Figure 1. Survey Question 1: My Leader says exactly what he or she means ...................59
Figure 2. Survey Question 2: My Leader listens carefully to different points of view
before coming to conclusions ................................................................................60
Figure 3. Survey Question 3: My Leader shows he or she understands how specific
actions impact others..............................................................................................61
Figure 4. Survey Question 4: I report any dangerous situations I see ...............................63
Figure 5. Survey Question 5: Safety is my Number 1 priority when I work .....................64
Figure 6. Survey Question 6: I ask my colleagues to stop work which I believe is
performed in an unsafe manner..............................................................................65
Figure 7. Survey Question 7: I stop work if I believe it may be dangerous for me or others
to continue ..............................................................................................................66
Figure 8. Survey Question 8: In practice, production takes priority over health,
environment and safety ..........................................................................................67
Figure 9. Survey Question 9: Reports about accidents or dangerous situations are often
‘‘embellished’’ .......................................................................................................68
Figure 10. Survey Question 10: There are often concurrent work operations which lead to
dangerous situations ...............................................................................................69
Figure 11. Survey Question 11: Deficient maintenance has caused poorer safety ............70
Figure 12. Survey Question 12: I have the necessary competence to perform my job in a
safe manner ............................................................................................................71

vii
Figure 13. Survey Question 13: I have easy access to personal protective equipment .....72
Figure 14. Survey Question 14: The management takes input from the safety delegates
seriously .................................................................................................................73
Figure 15. Survey Question 15: I feel safe reporting events that could have caused
damage or injury but did not ..................................................................................74

1
Chapter 1: Introduction to the Study
Introduction
There is currently no evidence of an empirical field study that measures the
impact of authentic leadership (AL) on safety climate in the construction industry,
although both constructs have proven to have improved safety outcomes. Because of this
study, positive social change may be reflected in the improvement in injury statistics and
other benefits associated with perceptions of positive safety climate. Furthermore, the
success of field supervisors who participated in the AL workshop may provide an
evidence-based implementation model that is currently missing in the industrial-
organizational psychology literature.
Background
In more than 30 years of empirical studies, leadership experts agree that the
positive qualities that define excellence in business leadership (e.g., integrity,
transparency, communication, continual feedback) are the same qualities that make a
leader skilled at managing safety (Bass & Steidlmeier, 1999; Cooper, 2015). However,
scientific implementation of the current knowledge, that is, connecting leadership,
training, and safety climate, is notably lacking (Borgersen, Hystad, Larsson, & Eid, 2014;
Christian, Wallace, Bradley, & Burk, 2009; Zohar & Polachek, 2014), particularly in
safety-critical, or high safety- risk, organizations (Bass, Jung, Avolio, & Berson, 2003;
Borgersen et al., 2014). Only in the past 10 years a genuine effort been made in the

2
business leadership and safety literature to integrate safety performance and to consider
its connectedness to business operations (Veltri et al., 2013).
Following advances in the organizational psychology literature throughout the
1980s and 1990s, new safety improvements were implemented in most large construction
companies (Esmaeili & Hallowell, 2012). During this time, safety professionals began
using an antecedent-behavior-consequence framework (ABC) to understand and manage
unsafe behaviors (Zohar, 2002). The philosophy that became widely accepted during this
period was called behavior-based safety (BBS). Safety managers and other management
professionals were developed into “trained observers” who made note of “observed acts”
(Mathis, 2009, p. 32). The observation feedback was disseminated from varied sources
(e.g., safety-specific managers, outside consultants). The OSHA-based compliance
training and goal setting gained attention from data and development experts involved in
BBS (Zohar, 2002).
Between 1981 and 1991, safety innovation in the construction industry reached its
apex. In a study of 58 construction companies, Esmaeili and Hallowell (2012) determined
that safety compliance training, safety orientation, and frequent worksite inspections the
top three safety-specific activities implemented during that period were cited as the safety
management practices commonly utilized by 91% of companies in their field operations.
Throughout the 1990s, practitioners in construction safety continued to advance
implementation of site-specific safety management practices (e.g., hiring safety managers
to observe and train field workers) and stimulate employee involvement in safety

3
processes (e.g., joint safety committees, job hazard analysis). Since 2000, nothing new
has been disseminated or applied in construction safety that demonstrated the
implementation of empirical knowledge (Esmaeili & Hallowell, 2012). This lack of
innovation, combined with the relative plateau in injury decline (U.S. Department of
Labor, 2014), suggests that the effectiveness of current safety practices has reached
saturation in the construction field (Esmaeili & Hallowell, 2012; Wilkins 2011).
Despite the lack of recent safety innovation, studies on the impact of leadership
on safety have proliferated since 2000 (Clarke, 2013). Zohar (1980) tested an instrument
designed to capture the perceptions of safety in a manufacturing environment. This field
study was based on the widely accepted organizational climate literature defined by
Litwin and Stringer (1968) as the phenomenon of organizational climate. After finding a
direct relationship between positive perceptions of safety and safety outcomes, they
outlined a construct that has become the most often-cited framework used to measure
safety perceptions and consequent positive safety outcomes: the safety climate (Zohar
2000, 2010).
Throughout the 2000s, the safety climate framework provided a quantifiable
variable used to study the effects of a variety of leadership types on safety outcomes in
the organizational literature (Barling, Loughlin, & Kelloway, 2002; Luria, 2008; Yule,
Flin, & Murdy, 2007; Zohar, 2014; Zohar & Luria, 2005). The literature clearly defined
the actions of leaders that influenced positive safety outcomes through meta-analysis,
safety perception surveys, and emerging theories correlating leadership with safety

4
outcomes. As an example, Clarke (2013) tested the theoretical models of transformational
leadership and active transactional leadership on safety outcomes, including all the
notable literature on safety leadership that began to emerge in 2002. Safety compliance
(e.g., following rules) and safety participation (e.g., making safety suggestions, watching
out for fellow workers’ safety) were coded for correlation with the two leadership
models. Safety climate, as defined by Zohar (2000), was also measured by survey.
When examining transformational leadership, meta-analytic correlates to
perceived safety climate (ρ = .48, p < .05) and safety participation (ρ = .44, p < .05)
demonstrated moderate effect size. Slightly stronger relationships were seen when
correlating active transactional leadership with perceived safety climate (ρ = .57, p < .05)
and compliance (ρ = .41, p < .05). Clarke (2013) discussed the notion of qualities
inherent in transformational leadership that could inspire positive results (e.g., charisma,
influence) that could also undermine safety efforts when the transformational leader
prioritized production over safety, thereby undermining the safety climate results. Despite
the perception of being controlling, transactional leaders were viewed as being more
consistent in their efforts to operationalize safety.
Clarke’s (2013) study further affirmed the value of positive leadership on safety
outcomes along with other scholars who found that transformational leadership with a
safety focus affected followers’ perceptions of a positive safety climate (Yule et al.,
2007). In addition to safety-specific transformational leadership qualities, Luria (2008)
demonstrated the importance of the direct crew leader as the primary influence on the

5
climate of a work crew, further building on the earlier efforts of Zohar (2002), Zohar and
Luria (2005) found safety climates varied from crew to crew in the same organizations.
Moreover, local leadership has been shown to influence safety climate more than external
regulation and even company policy (Barling et al., 2002; Høivik, Tharaldesen, Baste, &
Moen, 2009; Mearns, Flin, Gordon, & Fleming, 2001).
Problem Statement
The problem is the paucity of empirical research on whether AL development
training can change the perceptions of workers, as well as the safety climate, using a cost
effective, meaningful, and organically sustainable approach. This issue is particularly
problematic on large-scale, heavy, civil, and public works projects in the construction
industry.
Since the passing of the OSHA in 1972, there have been dramatic reductions in
work-related fatality and injury rates across all industry types; however, more work needs
to be done because these rates have reached a plateau (U.S. Department of Labor, 2014).
Specifically, research suggested that the tracking of incident type and implementation of
training contributed to sharp reductions in work-related fatalities and injuries (Wilkins,
Chen, & Jenkins, 2014). Despite major reductions in fatalities and serious injuries, 4,585
work-related fatalities and 3,007,300 non-fatal but serious injuries, recorded in the United
States in 2013, incident rates were no better than the previous 5 years. This called into
question whether the tracking, structure, and awareness benefits of OSHA reached their
maximum effectiveness (Esmaeili & Hallowell, 2012).

6
The costs to organizations and society following a fatality or serious are great and
often hidden (Leigh, 2011). For example, the government is obligated to cover long-term
and permanent disability beyond the statutory requirements of mandated worker’s
compensation insurance through their employers (Leigh, 2011; Freeman, 2000),
specifically Social Security disability. In addition, indirect costs include lost workdays,
loss of morale, posttraumatic stress disorder developing in the injured worker or fellow
workers, loss of employees’ trust in the company, and an organization’s reputation in the
marketplace (Crites, 1995; Freeman, 2000). An estimated 80% of recorded incidents
occurring in the workplace could be linked to preventable behaviors (Fleming & Lardner,
2002). Nonetheless, training in many high-hazard industries did not target authentic and
personalized behavior change at the field level (Wilkins, 2011).
The construction field remains in the top five high-hazard industries with
opportunities to improve preventable incidents (U.S. Department of Labor, 2014).
Notwithstanding technological advancements in safety equipment and safety policy
development, 20% of work-related fatalities continue to occur on construction jobsites
(U.S. Department of Labor, 2014; Zohar & Polachek, 2014). The fatality rate in
construction remains greater than 10 times that of the military, as recorded on OSHA
public records of workplace fatalities, in recent combat years (U.S. Department of Labor,
2014).
A plethora of studies provided evidence-based theories to guide leadership and
communication development (Borgersen et al., 2014; Gardner, Avolio, Luthans, May, &

7
Walumbwa, 2005; Griffin, & Neal, 2000; Nahrgang, Morgeson, & Hofmann, 2011;
Probst & Estrada, 2010; Zohar 2002; Zohar & Polachek., 2014). Yet, on the majority of
construction jobsites, contractors continue to use outdated observation and training
methods based on science dating back 25 years. For example, project management or
safety professionals conduct safety audits and provide training focused on OSHA
compliance alone (Esmaeili & Hallowell, 2012). Implementation of the current research
theories on safety leadership and safety climate improvement is a logical next step in
advancing the literature (Borgersen et al., 2014; Christian et al., 2009; Eid, Mearns,
Larsson, Laberg, & Johnsen, 2012; Zohar, 2014).
Purpose of the Study
The purpose of this quantitative quasi-experiment was to determine whether AL
development training could improve workers perceptions of the safety climate that was
cost-effective, meaningful, and organically sustainable in heavy, civil and public works
projects in the construction industry. Additionally, this study examined whether the AL
training as an independent variable influenced a change in the safety climate. With
significantly positive results, the basic framework could be replicated in a variety of
industries and organizations with similar hierarchies or work groups in offsite or virtual
team settings. The primary intent of this field-tested implementation was to contribute to
the safety leadership and safety climate literature to benefit both practitioners and
researchers in the field of organizational psychology.

8
Research Questions and Hypotheses
This quantitative study was guided by the following three research questions.
Research Question 1
Do supervisors who complete safety training emphasizing integration of AL and
communication skills during leader-member exchanges have significantly higher worker
safety climate perceptions?
Null Hypothesis. There will be no difference in the safety climate perceptions of
the workers between employees reporting to supervisors who have completed
safety training and employees reporting to supervisors who have not
completed safety training emphasizing integration of AL and communication
skills.
Alternative Hypothesis. There will be a significant difference in safety climate
perceptions of the workers whose supervisors have completed safety training
compared to workers whose supervisors have not completed safety training
emphasizing integration of AL and communication skills.
Research Question 2
Do workers’ perception of their supervisor’s AL improve significantly after their
supervisors are trained to integrate AL and communication skills during leader-member
interactions?
Null Hypotheses. There will be no significant difference in the workers’
perception of their supervisor’s AL after they are trained when compared to

9
workers’ perception measured before their supervisors were trained to
integrate AL and communication skills.
Alternative Hypothesis. There will be a significant change in the workers’
perception of the supervisor’s AL after training when compared to workers’
perception measured before their supervisors were trained to integrate AL and
communication skills.
Given that choosing safety behavior often competes with the perception of being
productive, minor injuries and near-miss incidents often go unreported in crews with poor
safety climates (Probst & Estrada, 2010). This study measured the likelihood of reporting
near-miss or minor incidents that occurred following the training intervention. Part of the
AL training addressed the importance of trust and transparency in leadership skills as
well as highlighted empirical leadership. One of the primary antecedents to crews with
positive safety outcomes has been high levels of support to report minor incidents and
mistakes that create near-miss situations (Tharaldsen, Olsen, & Rundmo, 2008).
Research Question 3
Does workers’ willingness to report safety concerns increase following the
supervisor training?
Null Hypothesis. Workers’ willingness to report safety concerns will be the same
when measure before and after supervisor training.

10
Alternate Hypothesis. Workers’ willingness to report safety concerns will
increase significantly following the supervisor training when compared to
surveys taken before supervisor training.
Theoretical and Conceptual Framework for the Study
Theoretical Foundation
The training applied in this study was grounded in the emerging leadership
construct of AL (Avolio, Gardner, Walumbwa, Luthans, & May, 2004). The model’s
cornerstone has been awareness of personal values and it is often cited as the first step in
developing the trustworthy leader (Granerud & Rocha, 2011). Trust is a primary
leadership quality required to forge strong and lasting perceptions of a positive safety
climate (Avolio et al., 2004; Gardner, Cogliser, Davis, & Dickens, 2011; Liu, Liao, &
Wei, 2015). It follows that a measurable improvement in AL would improve the climate.
Although some qualities of authentic leaders are shared with other leadership
types, authentic leaders demonstrate consistent moral behaviors, such as integrity,
transparency, and balanced processing of decision making (Cavazotte, Duarte, & Gobbo,
2013). Furthermore, leaders rating low in AL qualities can undermine safety (Liu et al.,
2015), although leaders may also be described as transformational or transactional (Bass
et al., 2003; Conchie, Taylor, & Donald, 2012; Onorato & Zhu, 2014; Schilling &
Schyns, 2014). Without authenticity, leaders who score as strong transformational types
exhibit a darker, self-serving side that can undermine the strongest safety program or
organizational culture (Bass & Steidlmeier, 1999).

11
Conceptual Framework
Safety climate has become a standard indicator of an organization’s safety
performance and likelihood of injury, surpassing other leading indicators (Borgersen et
al., 2014; Christian et al., 2009; Gardner et al., 2005; Zohar, 1980; 2000; 2002; 2010;
Zohar & Polachek, 2014). Encouraged by Zohar (2010) and others (Borgersen et al.,
2014; Christian et al., 2009) and utilizing safety climate as a framework to measure safety
outcomes, the effects of the AL (Avolio, Gardner, & Walumbwa, 2007) and
communication training (Zohar, 2014) were measured using the Safety Climate Inventory
(Nielsen, Eid, Hystad, Sætrevik, & Saus, 2013a).
Safety culture and safety climates are often used interchangeably in the literature
(Borgersen et al., 2014; Denison, 1996; Mearns & Flin, 1999; Zohar, 2014); however,
they represent different constructs. Culture is defined in broader terms and represents the
beliefs, assumptions, and attitudes of top management (Mearns & Flin, 1999); it is often
associated with a company’s image and reputation. On the other hand, safety climate is
described as a snapshot of the current state of safety, the picture of employees’
perceptions, attitudes, and beliefs about safety. It has been measured and its essential
constructs have been used consistently in an array of studies (Christian et al., 2009;
Zohar, 2014). Additional information on the theoretical and conceptual framework can be
found in Chapter 2.

12
Nature of the Study
The overarching questions addressed in this study were answered through a
quantitative, quasi-experimental design; safety climate perceptions, AL, and any incident
reports that occurred within 4–6 weeks of the training intervention (Campbell, Stanley, &
Gage, 1963; Cook, & Campbell, 1979) were used to measure change. The scores of the
supervisors pre-training were compared to their scores after training had been completed.
Independent Variables
The Authentic Safety Leader Training Program
Dependent Variables
Safety Climate as assessed by the Safety Climate Inventory (Nielsen et al., 2013a)
AL as assessed by the Authentic Leadership Questionnaire (Avolio et al., 2007)
Willingness to Report Incident only (near miss) as assessed by an additional
survey question added to pre- and post-training surveys.
Incidents reported both before and after the training intervention were obtained
from company records.
A confidential instrument measured safety climate (Brief Norwegian Offshore
Risk and Safety Climate Inventory [NORSCI]; Nielsen et al., 2013b) and AL (Authentic
Leadership Questionnaire [ALQ]; Avolio et al., 2007) in participant followers. Questions
from both instruments and questions relating to willingness to report incidents were
combined on a single electronic survey. Pre and posttraining intervention, study
participants were asked to complete a survey combining the NORSCI, ALQ, and one

13
researcher-initiated question regarding the willingness to report a near-miss incident.
Both instruments in this study utilized Likert-type scales; the scoring of subscales and
total scores were performed in accordance to the published literature. Due to an
anticipated large sample, this study was based on the assumption that the results would
display elements essential to parametric testing (e.g., normal distribution). A Mann-
Whitney U was used to test for any significant difference between individual, pre- and
postintervention survey questions as these data were collected in ordinal scales. If the
sum of the Safety Climate Inventory and the total score for all ordinal questions met the
characteristics of a normal distribution, then t tests were conducted to detect significant
differences between pre- and postintervention survey responses.
The intervention took place on a mega-construction site; a civil, design-build
project representative of the emerging business model for heavy highway projects (i.e.,
public-private-partnership). Projects of this magnitude are often performed as joint
ventures, meaning that several companies merge crews and resources to form a
temporary corporation for the duration of the project and are then disbanded upon project
completion. The workers and their supervisors who participated in this study were
assigned to the work group known as Segment D. The environment was dynamic and
competitive, categorized by OSHA as high-hazard work. The effects of an AL training
program were measured in relationship to changing the safety climate, increasing safety
communication, and the resultant change in likelihood to report near-miss incidents

14
(Borgersen et al., 2014; Gardner et al., 2005; Griffin & Neal, 2000; Nahrgang et al.,
2011; Probst & Estrada, 2010; Zohar 2002; Zohar & Polachek., 2014).
The training intervention was aimed at a sample of superintendents selected by
the company, a mixture of midlevel leaders representing Segment D, and at least one
leader from each joint venture company. As midlevel field supervision, the supervisors
selected were the primary interface with field workers all superintendents from Segment
D were included. They were in a pivotal position to relay the ideal corporate safety
culture and were privy to information that influenced production schedules and other
priorities passed down from the corporate office. In large, corporate-structured, heavy
highway companies, midlevel management must translate safety cultures into actionable
behaviors that contribute to creating a positive (or negative) environment and have been
shown to have a major effect on safety performance and outcomes (Zohar 2014).
The group of supervisors selected by the company for the AL training were
assigned to one of the four jobsites comprising the entire project. This group was
described as Segment D on company data incident reports. Workers assigned to
supervisors received an identical pretest and posttest measure of safety climate
perception, the AL indicators, and willingness to report near-miss incidents 4 weeks after
the interventional training. The supervisors from Segments A, B, and C were informed
that all supervisors would eventually receive training to minimize resentful
demoralization or other social interaction threats to validity (Trochim, 2006). Supervisors
were educated on the value of reporting near-miss and minor incidents as well as

15
transitioning from an OSHA-prescribed, albeit lagging, incident tracking system to a
more proactive approach based on leading indicators and increased safety
communications associated with improvements in both safety incident severity and
worker perception of safety climate (Griffin & Neal, 2000; Zohar, 2014). Measurements
that indicated an increased positive safety climate on the worksite where the experimental
training took place would suggest a positive social change.
Definition of Terms
Authentic leadership (AL). In this study, Development of AL was the independent
variable. Defined using the four cornerstones of the AL construct developed, validated,
and used in the Authentic Leadership Questionnaire (ALQ; Avolio et al., 2007). Leaders
who scored high on the ALQ possessed high levels of (a) self-awareness, (b) relational
transparency, (c) internalized moral perspective, and (d) balanced processing.
Construction foreman: In this study, foremen were identified by company
leadership as a crew leader responsible for both production and safety of a work group of
three or more field workers.
Construction superintendent: Superintendents were identified by company
leadership as a crew leader of construction foremen within a specialty area.
Superintendents were responsible for both the production and safety of a work group
specialty (e.g., carpenters, laborers, ironworkers, electricians).
Incidence rate: A standardized formula to measure injuries within an
organization for recordkeeping and comparison. Defined by the OSHA, an incidence rate

16
was the number of injuries, illnesses, or lost workdays per 100 full-time workers. Rates
were calculated as N × 200,000 ÷ EH where:
N = number of injuries and illnesses, or number of lost workdays.
EH = total hours worked by all employees during a month, a quarter, or fiscal
year.
200,000 = base for 100 full-time equivalent workers employed 40 hours per week,
50 weeks per year (U.S. Department of Labor, 2014).
Journeyman: A tradesperson who has completed the appropriate number of hours
of on-the-job training, formal coursework, and trade apprenticeship to be considered a
competent professional in his/her trade. A journeyman worked on a construction crew
under the direction of a company foreman.
Near-miss incident: “A Near-miss is an unplanned event that did not result in
injury, illness, or damage – but had the potential to do so. Only a fortunate break in the
chain of events prevented an injury, fatality or damage; in other words, a miss that was
nonetheless very near.” (National Safety Council, 2013, p. 1).
Project manager: Individual with ultimate responsibility for the construction
project under study. The project manager might hold a middle management position
within the overall organization.
Safety culture: In broad organizational terms, safety culture represented the
beliefs, assumptions, and attitudes of top management (Mearns & Flin, 1999); it was
often associated with a company’s image and reputation.

17
Safety climate: A snapshot of the current state of safety; the picture of
employees’ perceptions, attitudes, and beliefs about safety; it has been measured and its
essential constructs have been used consistently in an array of studies (Christian et al.,
2009; Zohar, 2014).
Assumptions
The company selected for this study had a top-level leadership team that was
committed to safety as a core value of the organization. However, due to the transient
nature of the field craft population, participants could be reluctant to share honest
opinions about safety, especially if the crew leader did not reflect the same commitment
to safety as top leadership. Based on this assumption, the delivery of information about
the study was carefully planned to clearly communicate top leadership’s commitment to
obtaining true information about the actual safety climate on each crew.
Scope and Delimitations
The scope of the study included tradespeople working in the field as construction
workers on one of the four jobsites, Segment D. All craft workers in the field were
invited and encouraged to participate in pre- and post-perception surveys. The company
selected the superintendents to receive the AL development training following the
presurvey. Superintendents from segment A, B, and C were excluded from the AL
training conducted during the study.
The communication and scheduling of the training were driven by company
management. The AL training was arranged according to the regular scheduling system

18
utilized by the company for safety compliance training to minimize disruption of the
normal routine. All participants were asked to complete two confidential safety climate
surveys before work began at the construction yard designated by the company as a
meeting spot on Monday mornings. A common practice of large construction companies
is to allow for Monday meetings for the entire segment of the project to communicate
essential information about safety or other issues. On two separate occasions, the Monday
meeting spot was where the data were collected using personal smartphones to submit
responses. Using the Monday morning meeting routine proved to be an efficient time and
place to disseminate the survey and collect data and could be easily replicated on other
projects.
Limitations
There were several minor limitations to completing this study: (a) project
management buy-in when it came time to collect survey data, due to time pressure to get
to work (b) ability of hourly workers to complete the surveys and training, due to lack of
reading ability and vocabulary used on the instruments(c) assurance of confidentiality,
and (d) consistency in the training delivery. The support of the CEO and the procedures
used to communicate and assist in completion helped to mitigate the limitations.
Several steps were taken to mitigate the limitations. Following permissions from
top management, specific project managers were informed of the time commitment,
procedure for confidentiality, and potential benefits to the project in a preintervention
meeting at the jobsite. Any concerns and questions were resolved before the study began.

19
Step-by step instructions were given by the researcher at the meetings; time was allotted
for technical help and survey completion. Employees were afforded privacy and assured
about confidentiality. Participants were informed by the researcher about the parameters
and requirements of voluntary participation to complete the surveys (Appendix A).
Further discussion of limitations encountered are discussed in Chapter 5.
Significance
Over the past 30 years, safety has become a genuine priority for many
organizations (Zohar, 2010), especially in large companies with tasks that routinely
expose the workforce to high-risk hazards (Shorrock, Mearns, Laing, & Kirwan, 2011;
Simon & Cistaro, 2009; van der Graaf, Bryden, Zijlker, & Hudson, 2004). Leadership,
with its influence on both organizational culture and safety outcomes, has been studied
extensively in high-hazard industries (Barling et al., 2002; Schein, 1985; 2010;
Zacharatos, Barling, & Kelloway, 2000; Zohar, 2002). However, only two field
interventions were found in use within the past 15 years that applied evidence-based
knowledge to high-hazard industries at the management level. This included Zohar’s
(2000) seminal field research on safety perception change and Zohar and Polachek’s
(2014) comprehensive field experiment that tested several antecedent variables associated
with positive safety climate perceptions in a before and after, mixed-effects statistical
design following a brief communication intervention. Several safety-specific variables
were measured, including safety climate, safety behavior, and externally conducted
jobsite inspections by safety professionals who were unaware of the experiment’s details.

20
When the scores were compared to each groups’ pretreatment scores, the inspection audit
scores improved in the work areas of the experimental group but not in the control group.
If a single- session training designed to build AL skill and effective feedback
techniques proved successful, it would affirm a model that could be used to implement
and measure a wide range of organizational change endeavors (Zohar & Polachek, 2014).
It could also provide a new training innovation specific to the construction safety field
where there is a critical need (Esmaeili & Hallowell, 2012). The implications of positive
social change would be reflected in the improvement in injury statistics and other
benefits, such as increased motivation, productivity and job satisfaction that are
associated with positive safety climate perceptions (Christian et al., 2009). Furthermore,
success of the proposed intervention would provide an evidence-based implementation
model for AL that is currently missing in the organizational literature.
Information provided in Chapter 2 will further expand on the development of AL
and the potential influence on safety climate.
Summary
Safety programs and improvements to safe working conditions in dangerous
environments have improved since government intervention in 1972. Communication
advances and the crew-level safety climate have been empirically tested and confirmed as
antecedent to positive safety behaviors and performance. This study tested the ability to
improve the construction crew member’s safety climate perceptions by training
superintendents and crew leaders in a high-hazard environment to develop AL skills, a

21
training that had not been conducted to date in heavy highway construction at the
frontline-level. A significant increase in positive safety climate perceptions following the
AL training could improve working conditions for a large segment of workers in high-
hazard environments and add to both the construction safety literature and the growing
body of AL literature.
In the following chapters a review of AL and safety climate literature was
explored, valid measurement tools defined, and the current study was tested in the field
with positive results.

22
Chapter 2: Literature Review
Introduction
The purpose of this quantitative, quasi-experiment was to measure a change in
perception of safety climate following a brief AL development and safety communication
training with field supervision. Despite the growing body of evidence that AL is
associated with positive outcomes, there was little empirical guidance on AL
development except in the coaching literature.
AL training programs that were discovered in the literature search were primarily
long -term organizational programs (Glowacki-Dudka & Griswold, 2016; Granerud &
Rocha, 2011). An additional search on effective authentic leadership and training
effectiveness led to a body of literature that included organizational coaching (Fusco,
Palmer, & O’Roirdan, 2011; Grant, Curtayne, & Burton, 2009; Grant, Passmore,
Cavanagh, & Parker, 2010; Kinsler, 2014) and training content (Baron, 2012, 2016;
Baron & Parent, 2015) that corresponded neatly with the literature derived from the both
the AL arena and the industrial safety literature. These articles were obtained using the
key words safety coaching, group coaching, and authentic leadership coaching. The
results provided a training framework (Cherniss, Grimm, & Liautaud, 2010), general
coaching approaches (Adams, 2016), and safety-specific coaching methods (Cavazotte et
al., 2013) in group settings (Treff & Earnest, 2016) that were included in the training
design of the current study.
23
Literature Search Strategy
Several key words were searched in EBSCO database, using a broad search across
all available peer reviewed journals: leadership, authentic leadership development
process, authentic leadership development, authentic leadership training, training
practices, leadership, and training effectiveness. Safety literature was reviewed as it
related to the above: AL development, effective training methods, organizational
coaching, and organizational change. Evidence-supported methods from organizational
training, safety coaching (Geller & Veazie, 2004; Passmore, Krauesslar & Avery, 2015),
and safety climate communication (Zohar, 2014) were merged to create the unique
training framework that was used in the present study to test the significance of AL
development on safety climate improvement.
The leadership types that surfaced in the literature when searching for appropriate
change leaders include transformational (Bass, 1985; Tichy & Devanna, 1986),
charismatic (Conger, 1989), as well as a positive five level leadership type (Collins,
2001). However, the large number of corporate scandals and subsequent loss of trust in
some organizations and industries over the past decade have caused a growing interest in
the ethical and authentic leadership styles. Following a 2004 Gallup Leadership Institute
Summit, which focused on developing scholar-practitioner research interest in developing
a foundational conceptualization of AL, many leadership scholars directed their attention
to exploring this construct. Twenty-four scholarly articles were published as a direct
result of the Gallup Leadership Institute Summit in 2005 (Avolio & Gardner, 2005).

24
Subsequently, an abundance of theory-expanding literature was published and, by 2010,
empirical work outnumbered the theory-defining work for the first time (Gardner et al.,
2011)
The definition of AL has been debated but, as the construct has matured, more
common overlaps in scholarly works began to emerge (Gardener et al., 2011); it has
become a behavior construct that has been well measured over the past 10 years since the
development of the 16-item Authentic Leadership Questionnaire (ALQ; Avolio et. al,
2007). Further validation of the four elements that serve as the theory foundations were
validated by Walumbwa, Avolio, Gardner, Wernsing, & Peterson (2008). The construct is
currently well defined, and the literature saturated with empirical evidence listing positive
outcomes associated with AL, indicating that the next step would be field testing the
theory (Gardner et. al., 2011).
An abundance of literature was obtained using the key words mentioned at the
beginning of this chapter. The review of AL literature was narrowed by excluding any
papers published prior to 2003 that were not peer-reviewed, or evidence based.
Additionally, peer-reviewed literature was filtered for works that included the use of the
ALQ instrument or publications that empirically linked AL with training, group
coaching, and safety outcomes to inform the current study.
Authentic Leadership
A robust meta-analysis on the state of AL knowledge by Gardner et al. (2011)
traced the scholarly interest in AL from ancient Greece philosophy and Socrates’ self-
25
inquiry through an analysis of 91 AL publications produced since 2005. Gardner and
colleagues categorized peer-reviewed literature by content, contributors, research design,
and analytical procedures with the intent of establishing a research agenda.
Per the literature, leaders deemed to fit the description of AL, regardless of
personality or leadership type (Wang, 2016), had positive effects in several areas of
leadership influence such as goal alignment and understanding the impact of beliefs and
communication style on both individual behavior and follower perceptions (Gardner et
al., 2011; Grant & O’Connor, 2010). Other areas of positive outcomes have been
associated with AL such as trust in leadership and job performance (Clapp-Smith,
Vogelgesang, & Avery, 2009; Wong & Cummings, 2009), follower citizenship and work
engagement (Giallonardo, Wong, & Iwasiw, 2010; Wong, Lascher & Cummings, 2010),
team productivity (Hannah, Walumbwa, & Fry, 2011), psychological well-being (Toor &
Ofori, 2009), and overall company performance (Hmieleski, Cole & Baron, 2012).
Additionally, positive safety climate outcomes have been linked to AL (Christian et al.,
2009).
Several studies concurred with the early findings of AL (Avolio et al., 2004);
most agreed that authentic leaders acted with transparency, both on a personal level and
in the social context through mindful communication, balanced processing, and
decisional balance (Miller & Rollnick, 2002; Passmore, 2011). AL was not a type of
leadership as much as it was the execution of honesty and an ability to bring the unique

26
leader’s self-awareness to leadership in all personal tasks and organizational endeavors
(Baron, 2016).
Authentic Leadership Development
Given the maturity of AL theory and the positive outcomes associated with AL,
obtaining an empirical-supported training framework specifically designed to facilitate
AL development was uncharacteristically difficult. A study by Cherniss et al. (2010) re-
visited a compilation of evidence-based trainings gathered by Burke and Day (1986) that
measured effectiveness of training programs specifically created to encourage self-
reflection and personal growth during the 1970s. Per Cherniss et al., the literature
compared the subjective outcome ratings following traditional corporate-style trainings –
lecture/discussion with role playing and practice – in contrast with assessment, feedback,
and coaching that was commonly used in sensitivity trainings at the time (Burke & Day,
1986). The traditional lecture and discussion with role playing demonstrated the least
effective results (effect size d =.30; Cherniss et al., 2010). However, results from groups
that participated in the assessment, feedback, and coaching group process utilizing
“Behavior modeling” (Burke & Day, 1986, p. 233) averaged an effect size that was more
than twice that amount (d = .67).
Behavior modeling was defined as a group process that progressed without an
agenda, where the facilitator kept the group focused in the moment, on the dynamic of
the group as the group explored personal values, feelings, and received feedback from
peers; similar to Yalom and Leszcy’s (2005) model for group psychotherapy. However,

27
Burke and Day (1986) and Cherniss et al. (2010) drew attention to a major limitation of
the open-ended nature of the group process and coaching; that results seemed to rely
heavily on the personal qualities of the group members and the facilitator making it
difficult to replicate with consistency and quality to multiple groups in an organization.
Cherniss et al. (2010) designed a study to overcome the issue of inconsistency
revealed in the earlier studies and replicated the successes found in Burke and Day
(1986). The researchers aim was to test the effectiveness and consistency of the
behavioral modeling training/coaching method to help participants develop emotional
and social competencies associated with effective leadership. The Emotional Competence
Inventory (ECI) was used as a pre/posttest to measure specific outcomes. Leaders who
rated high on the ECI shared similarities with AL such as self-awareness (Boyatzis &
Sala, 2004) and leadership behaviors such as social awareness (Al Sahi AL Zaabi,
Ahmad, & Hossan, 2016). The randomized experiment used a training structure common
to quality management, known as the International Organization for Standardization
(ISO), to provide a framework that could be replicated at a variety of test sites (Cherniss
et al., 2010).
Within the manualized training session, the reflective, humanistic, behavior-
modeling group techniques were used systematically with a solution focus (Cherniss et
al., 2010). The consistency demanded in ISO training merged with self- awareness
growth techniques found in group-based psychotherapy (Yalom & Lesczy, 2005) and
resulted in an effective model called Process Designed Training (PdT) that could be used

28
to facilitate humanistic, participatory-driven change (Prochaska, Norcross, &
DiClemente, 1994; Passmore, 2013). In all nine groups with nine distinct PdT-trained
facilitators, the intervention group improved on every variable of the ECI as compared to
the control group measured after the study. Although the study was implemented over a
2-year period, the researchers encouraged experimenting with using the PdT in shorter
durations when the outcome objective was to improve social climate, culture, or self-
awareness competencies associated with effective leadership (Cherniss et al., 2010).
The development of AL required the same self-reflective growth work as the
collection of Burke and Day (1986) studies and the ECI development work of Cherniss et
al. (2010); however, using the PdT model to frame the AL program could help to
operationalize the construct in a group format and replacing the EIC with the ALQ could
create a secondary benefit of the present study by creating the opportunity to further
validate the structured group coaching model (i.e., PdT) developed by Cherniss et al.
(2010).
Small Group Coaching to Facilitate AL Development
The most current research discounted traditional training approaches to facilitate
AL development (Baron, 2016). The development of AL is not a set of skills that can be
taught; rather, AL is fostered by increasing self-awareness of individual values as well as
a developed ability to reflect and correct assumptions and beliefs within a social context
(Fusco, O’Riordan, & Palmer, 2015). Groups such as the International Society of
Psychological Coaches (ISPC) have been conducting research focused on the results of

29
coaching efforts utilizing evidence-based approaches to refine and legitimize the
organizational psychology coaching tactic as a method to operationalize AL (Spence &
Deci, 2016). Reports emanating primarily from psychologists affiliated with the ISPC
who currently utilize the coaching approach have called for additional experiments that
include measuring training development (Grant & Cavanagh, 2011). Coaching relies
heavily on building self-awareness, goals, accountability, and freeing up the human
potential in the participant (Schaubroek, Carmeli, Bhatia, & Paz, 2016).
Until recent efforts, there has been little empirical evidence supporting executive
coaching; however, evidence exists that companies have been willing to allocate large
budgets for use in coaching to help executives develop in existing positions or grow into
new roles within organizations. As of 2007, 85% of organizations in the United States
were using some type of coaching program to facilitate change, increase competence, or
improve performance. The costs to coach a single executive can range from $1,500 per
day to over $100,000 for a multi-year contract (Cherniss et al., 2010). Considering the
popularity of executive coaching with mere anecdotal evidence of support, the efficiency
and ability to tailor developmental efforts to the current objective of this short-term AL
development study could provide vital evidence to organizational literature (Fusco,
O’Riordan, & Palmer, 2016; Theeboom, Beersma, & van Vianen, 2014). Per Baron and
Parent (2015), once leadership authenticity is learned, defined, and activated through
experiential activities and executed in small group environments, consciousness related to
authentic action reportedly continued to increase on its own.

30
Safety Coaching
The term safety coaching can be traced to Geller, Perdue, and French’s (2004)
behavior-based safety coaching that demonstrated significantly increased workplace
collaboration, positive safety behaviors, and reduced injuries. Safety coaching was
further clarified by Passmore et al. (2015) as offering a path to practical implementation
of safety coaching in a new area of training for leadership development. The following
excerpt from Passmore et al. (2015) combined Gellar et al. (2004) ideas of behavior-
based safety training and current evidence-based practices of coaching psychologists and
were used to guide the AL training development program used in the present research
project:
A Socratic based, future focused dialog between one individual (safety coach) and
another individual (worker) where the lead individual uses open questions,
affirmations, summaries and reflections, informed with evidence, aimed at
stimulating the self-awareness and personal responsibility of the second
individual, with the specific goal of improving safety. (p. 196)
Both Gellar et al. (2004) and Passmore et al. (2015) used the same open Socratic
style to coach individuals with a focus on safe behaviors. When combined with PdT in
the participatory coaching group process, a consistent framework for AL development
was available for replication as well as testing the impact of AL on safety climate change.

31
Safety Climate
In addition to increasing AL behaviors, this study proposed to affect the safety
climate perceptions of workers under the leadership of AL trained supervisors. The
influence of positive safety climates (PSCs) on reducing safety incidents has been
validated by rigorous meta-analysis (Christian et al., 2009). Safety climate led to further
understanding of the variation in safety outcomes among work crews within the same
organization (Luria, 2008). Safety climate has become a standard indicator of an
organization’s safety performance and likelihood of injury, surpassing other leading
indicator measures (Borgersen et al., 2014; Christian et al., 2009; Gardner et al., 2005;
Zohar, 1980, 2000, 2002, 2010; Zohar & Polachek, 2014).
Zohar (2000) first observed the importance of the direct safety feedback as a
highly reliable antecedent to a positive safety perception change in work crews involved
in the shop floor level of a manufacturing plant. Subsequently, Zohar and Polachek
(2014) conducted a two-group randomized experiment to improve both the safety
perceptions (climate) and safety performance of manufacturing crews. The experimental
group of 13 supervisors was taught to focus leader-member exchanges on the importance
of intertwining production and safety in daily conversation with their direct reports. A
total of 313 work crew members participated, including 13 supervisor control-group work
crews, to measure the effects both before and after the intervention. Zohar and Polachek
(2014) demonstrated measurable results in the experimental group after just two 30-

32
minute training/feedback sessions conducted in the supervisor’s office and spaced 6
weeks apart.
Although Zohar (2002, 2014) tested interventions in a manufacturing plant and
found a relationship among leadership, communication improvement, and positive
change in safety climate, it was conducted in an environment unlike the dynamic and
frontier-like setting of heavy highway or civil construction. Zohar’s (2014) work on
safety climate provided a theoretical, organizational foundation for this study, but the
focus of the present study was distinct in three areas. First was the extreme and ever-
changing landscape of an active construction site. Secondly, the field hierarchy affiliated
closer to those outlined in the qualitative investigation of Borgersen et al. (2014), as
much of the dangerous work activity was conducted beyond the corporate stakeholders’
view or control. The third and most significant divergence from Zohar (2014) and the
independent variable in the proposed study was the AL training intervention provided at a
single point in time. Although sharing Zohar’s (2014) communication loop was one
feature of the training, the session also focused on developing self-awareness pivotal to
AL, an element that has often been reserved for coaching at the executive level of
organizations.
Summary and Conclusions
The literature review affirmed the validity of the variables of AL and safety
climate and a new gap in the literature emerged regarding AL development. Safety
climate has been established as a trustworthy, measurable standard in predicting safety

33
outcomes and AL is well established as a positive leadership construct; however, these
two elements have yet to be combined in a quantitative field study in construction safety.
Despite well-defined and validated measurement instruments for AL, there are no AL
development or training frameworks found in the literature outside of the emerging
coaching literature (Fusco, Palmer, & O’Riordan, 2011; Grant et al., 2009; Grant,
Passmore et al., 2010; Kinsler, 2014). The present study tested a model designed by
fusing coaching methods used to developed AL skills in executives with standardized
training procedures studied for their effectiveness in developing self-awareness, the
cornerstone of AL, in small group sessions (Cherniss et al., 2010). It was discovered that,
in addition to the original intent of testing the effects of AL development on safety
climate improvement, a unique training session model for developing AL qualities in
leaders could also be tested, adding further to the growing body of AL development
literature. In addition to increasing positive safety climates in construction crews, a
standardized training and coaching program using quantitative measures of success,
could be easily replicated in a variety of organizational climates to develop AL.
In Chapter 3, the methodology supporting the study will be described in detail.
34
Chapter 3: Research Method
Introduction
The purpose of the study was to measure a change in perception of safety climate
following a brief AL development and safety communication training. Positive safety
climates have been previously established as antecedent to positive safety results
including injury and incident reduction. This chapter will outline the research design,
rationale, and methodology that informed this study, which contributed to the growing
body of scientific interest in and investigation of AL and its positive effects in
organizations.
Research Design Rational
The primary independent variable was the workers’ perception of AL and safety
climate. The design for training supervisors in AL was derived from empirical literature
about the malleable traits of authentic leaders as delineated in Chapter 2. Perception of
AL as well as worker’s perception of safety climate was measured before and after the
training utilizing the published instruments listed below. A single additional question was
added to the perception survey asking participants to respond using a Likert-type scale
about how likely they were to report a minor incident or near-miss incident that did not
cause any injury or damage.
Company records of incidents were collected pre-and posttraining as a potential
data source. Data collection began 2 weeks after the 4-week training period.

35
The training schedule and duration emulated compliance training that companies
have become conditioned to according to OSHA regulations (Esmaeili & Hallowell,
2012). Following a standardized model helped to increase the fidelity of the study as well
as to ease access and be less intrusive for participants and management (Bellg et al.,
2004; Cook & Campbell, 1979). In addition, the training activities were clearly separated
from the survey collection activities.
Methodology
Population
Personnel attending AL training were selected by the company from a population
of leaders in high-hazard construction crews, both superintendents and foremen, who
oversaw production and safety at the field or craft level. Each leader had a minimum of
two direct reports and a maximum of 10 direct reports. Field-level construction crew
members who completed the survey represented a variety of craft types: carpenters, pile
drivers, equipment operators, and electricians. Each crew member varied in experience
from apprentice to journeyman, their ages ranged from 18–60 years, their ethnicity
(primarily White and Hispanic, some Black, some in the Other category). Although most
crews were all male, there were also some female craftworkers. All participants were
union members; their income was at a comfortable, middle-class economic level, ranging
from $36,000 to $75,000 per year, and their level of experience was certified as an
apprentice, journeyman, or foreman. Craft type and demographic data were collected as
dimensional covariates and grouped as much as possible.

36
Study Sample
The work crews gathered every Monday at a designated outdoor meeting place,
also utilized for tools, lumber, and equipment storage and mechanical repairs. The
company gave permission to the researcher to meet the workers at the project location
before the crews dispersed to their individual work areas throughout the jobsite,
described by the management as Segment D. The researcher used that location to collect
surveys before the supervisors’ AL training (pre-intervention surveys) and approximately
4 weeks later to gather identical post intervention surveys. The times of collection were
described as follows:
• Before intervention (T0)
• Four to six weeks after intervention (T1)
Procedures for Recruitment, Participation, and Data Collection
With full endorsement of the company CEO and safety director, utilization of the
company’s training system was already in place; there were no other known recruitment
issues. Communications about the study were sent to the employees by the company
safety director. Written and verbal informed consent information was described by the
researcher to the participants according to a prepared script.
In addition to the information collected on the primary survey instrument,
participants were to check off their level in the field hierarchy (e.g., Superintendent,
Foreman, Journeyman, Apprentice), trade (e.g., carpenter, electrician, laborer, pile-driver,
operator, concrete specialist, pipe-fitter). Age and gender were also asked on the survey.

37
Participants accessed the survey by following a link to SurveyMonkey provided by the
researcher utilizing their own personal smartphone
Debriefing
Study results were shared throughout the jobsite at the same location where the
survey collection was done. The project management and corporate safety department
was given a formal report to share with other segments and determine future training
needs.
Additional Information
To provide the equivalent training experiences to all participants, the researcher
conducted interventional training using standardized training materials, role-play
activities, and a computerized presentation. An abbreviated pilot training was conducted
at a training site with demographics similar to the study site. The pilot used the same
training materials, presentation, and trainer as in the proposed study. The purpose of the
pilot was to test the reception of the content and gather qualitative feedback regarding its
usefulness to the attendees and the company safety department.
Training sessions were held in the corporate training facility jobsite trailer of a
consistent duration to increase treatment fidelity, as recommended by Cook and
Campbell (1979). The study design, training, delivery, and enactment of the skills were
monitored throughout the study period as recommended by Bellg et al. (2004) for
interventions that involve behavioral change research.

38
Archival Data
Archival records were provided by the company safety director as part of the
study agreement. Pre-intervention safety records included the prior year’s incidents,
including equipment damage, near-miss reports, severe injuries, and minor first aid
injuries. The report was inclusive of all four segments for the entire project (i.e.,
Segments A-D).
Historical OSHA logs were reviewed prior to AL training. Incident patterns were
also included in the training sessions to personalize and add value to the leadership
training. OSHA logs are legal documents recording both injury type and severity using a
standardized set of criteria for categorization. The corporate office provided an incident
record for all 4 segments of the project from January 2017 to December 2017, including
all incidents, equipment accidents, first aid, OSHA recordable/reportable occurrences,
and near miss records for 8 months prior and 2 months post intervention.
Instrumentation and Operationalization of Constructs
A confidential instrument combined questions from The Brief Norwegian
Offshore Risk and Safety Climate Inventory (NORSCI; Nielsen et al., 2013b) and the
Authentic Leadership Questionnaire (ALQ; Avolio et al., 2007) to measure safety climate
and level of AL respectively.
Operationalization. The NORSCI measured the following aspects of safety
climate: (a) individual motivation and intention for safety, (b) managements’
prioritization of safety, and (c) safety routines of the crew. Respondents rated statements

39
concerning the safety climate using a five-point Likert-type scale, ranging from 1 (fully
agree) to 5 (fully disagree). Positive and negative statements were scored with selected
reverse scoring for certain items to counteract response-style bias. For positive statements
(e.g., My supervisor is committed to health and safety on our jobsite), a score of 5
indicated a positive response; however, a negative statement (e.g., The equipment is often
not maintained properly) represented a poor evaluation of the safety climate and was
reversed scored. A score of 1 indicated a poor evaluation of the safety climate, whereas a
score of 5 represented a good evaluation.
The original instrument was modified by Nielsen et al. (2013b) following a
principal component factor analysis where three factors were highlighted (i.e., individual
intention and motivation, management prioritization, safety routines) in 12 items. Nielson
reduced the items to 11 after one statement computed a low factor loading. The final 11-
item scale resulted in an acceptable internal consistency for the overall scale using
Cronbach’s alpha (α = .78). The three safety climate factors represented the group level
safety climate (α = .73), motivation and personal safety for management prioritization of
safety (α = .73), and safety routine among the crew (α = .74). Validity indicators also
demonstrated correlations between the safety climate scales and AL. The NORSCI
(Nielsen et al., 2013b) was used because of its brief but valid construction. The
researcher was interested in the targeted facets of safety climate as well as providing
continuity and alignment with recent safety-climate measurement instruments that had
strong correlations between safety climate and AL (Gardner et al., 2011). Measuring a

40
common set of constructs, albeit direct application of quasi-experimental design, was
what had been suggested by the noteworthy researchers in the field of organizational
safety climate (Christian et al., 2009; Clarke, 2006, 2013; Zohar, 2014).
The authentic model of leadership, previously validated by Avolio et al. (2007),
was also linked directly and positively with improving safety climate in high hazard
industries as demonstrated through qualitative data that emerged in a study encompassing
450 interviews conducted by Borgersen et al. (2014).
The ALQ is reliable and currently the only instrument with construct validity
measuring AL (Avolio et al., 2007). This survey comprised 16 questions, also utilizing a
Likert-like scale of 1 (strongly disagree) to 5 (strongly agree). The ALQ comprised four
subscales (i.e., self-awareness, relational transparency, internalized moral perspective,
balanced processing) and a total score for AL. In a recent empirical study conducted by
Onorato and Zhu (2014) utilizing the ALQ to measure the relationship between AL and
follower perceptions of organizational trust, a Cronbach’s alpha calculation for the four
subscales listed above indicated good reliability results (0.81, 0.77, 0.77, and 0.86
respectively).
The questions from both the NORSCI and the ALQ instruments, along with one
question added by the researcher (i.e., willingness to report near-miss information), were
combined on a single electronic survey for the convenience of the study participants
(Appendix C). Instrument permissions letters are included in the Appendix C.

41
A single question added to the instrument by the researcher asked the likelihood
of reporting a minor or near-miss incident as defined by the National Safety Council
(2013). Choosing a safety behavior often competes with the perception of being
productive; therefore, the reporting of minor injuries and near-miss incidents often goes
unreported in crews with poor safety climates (Probst & Estrada, 2010). The present
study measured the likelihood of reporting near-miss or minor incidents that occurred
pre- and post-training intervention. Part of the AL training addressed the importance of
trust and transparency as leadership skills and highlight empirical leadership. One of the
primary antecedents to crews with positive safety outcomes has been high levels of
support to report minor incidents and mistakes that create near-miss situations
(Tharaldsen et al., 2008).
Data Analysis Plan
For the pre- and post-training measurement, study participants were asked to
complete a survey combining the NORSCI, ALQ, and one researcher-developed question
regarding the willingness to report a near-miss incident. Electronic surveys were made
available through SurveyMonkey with results downloaded into both Excel and SPSS
formats. SPSS was programed to calculate the subscale and total scores for the ALQ and
NORSCI. Collected demographic information included gender, ethnicity, age, skill level,
and trade as part of the completed survey. Missing or erroneous data were examined for
patterns and, based on that analysis, an appropriate method of handling missing data was
selected and maintained throughout the data collection process. The two valid and

42
reliable instruments employed in this study utilized Likert-type scales; the scoring of
subscales and total scores was performed per the published literature. The large sample
size was to allow for the assumption that the results could display elements essential to
parametric testing (e.g., normal distribution).
Research Question 1
Do supervisors who complete safety training emphasizing integration of AL and
communication skills during leader-member exchanges have significantly higher worker
safety climate perceptions?
Null Hypothesis. There will be no difference in the safety climate perceptions of
the workers between employees reporting to supervisors who have completed safety
training and employees reporting to supervisors who have not completed safety training
emphasizing integration of AL and communication skills.
Alternative Hypothesis. There will be a significant difference in safety climate
perceptions of the workers whose supervisors have completed safety training compared
to workers whose supervisors have not completed safety training emphasizing integration
of AL and communication skills.
Research Question 2
Do workers’ perception of their supervisor’s AL improve significantly after their
supervisors are trained to integrate AL and communication skills during leader-member
interactions?
43
Null Hypotheses. There will be no significant difference in the workers’
perception of their supervisor’s AL after they are trained when compared to workers’
perception measured before their supervisors were trained to integrate AL and
communication skills.
Alternative Hypothesis. There will be a significant change in the workers’
perception of the supervisor’s AL after training when compared to workers’ perception
measured before their supervisors were trained to integrate AL and communication skills.
Given that choosing safety behavior often competes with the perception of being
productive, minor injuries and near-miss incidents often go unreported in crews with poor
safety climates (Probst & Estrada, 2010). The proposed study attempted to measure the
likelihood of reporting near-miss or minor incidents that occurred following the training
intervention. Part of the AL training addressed the importance of trust and transparency
as leadership skills as well as highlight empirical leadership. One of the primary
antecedents to crews with positive safety outcomes has been high levels of support to
report minor incidents and mistakes that create near-miss situations (Tharaldsen et al.,
2008).
Research Question 3
Do workers’ willingness to report safety concerns increase following the
supervisor training?
Null Hypothesis. Workers’ willingness to report safety concerns will be the same
when measure before and after supervisor training.

44
Alternate Hypothesis. Workers’ willingness to report safety concerns will
increase significantly following the supervisor training when compared to surveys taken
before supervisor training.
Threats to Validity
Despite the quasi-experimental design and plans for consistency taken when
conducting the study, there remained several possible threats to validity from both
external and internal determinants.
External Threats to Validity
Communication among supervisors and between the supervisors and workers
could not be controlled. The researcher was aware that external validity could be
threatened if those participating in the training discussed the workshop contents with
those members who were not exposed and that information could change their behavior
accordingly. To mitigate this effect, the researcher informed training participants of the
possibility of the threat and request confidentiality of the training material until the end of
the study (Jones, 1992).
Additionally, all participants were informed of the research study taking place at
their jobsite; information that has historically given rise to concerns about the Hawthorne
Effect (HE) or other “research participation effects caused by participant knowledge of
the research” (McCambridge, Witton, & Elbourne, 2014, p. 276), specifically with
participant willingness to conduct near-miss reporting. If the training participants were
made aware that the behavior of near-miss reporting was being closely monitored, there

45
was a possibility of behavior change due to that knowledge alone. In attempt to
discourage participant knowledge bias, participants were informed that the study would
not report specific details about who or which crew improved the near-miss reporting.
Generalized results were reported after the study as long as the withholding of reporting
did not cause harm to any of the participants or create risks or concerns that were not
already part of the environment.
As previously mentioned, the training was scheduled in the natural environment
and relied on scheduling practices that were familiar to participants; this reduced the
cognitive threat that has been documented in experimental studies conducted in
laboratories or simulated environments (Jones, 1992). Secondly, the participants who
completed the safety climate perception surveys were not observed or given individual
attention from the researcher. There was little empirical evidence that guided reduction of
the HE in quasi-experimental design and self-report surveys (O’Sullivan, Orbell, Rakow,
& Parker, 2004). Finally, the threat from resentful demoralization or other social
interaction threats to validity (Trochim, 2006) were given consideration as the random
sampling was developed to include training all participants, including the control group
leaders, after the final data collection for the study.
Internal Threats to Validity
Statistically significant results could suggest an association between the training
and a safer work environment. Nevertheless, the process of data analysis might confound
variables that had not yet been identified and could also influence the results. Historical,

46
events, such as a catastrophic occurrence on the jobsite during the study, might change
perception and actions related to safety. Furthermore, threats could include maturation
and regression to the mean. Sufficient intervening time, in this case 4 weeks, separated
the survey collection at T0 and T1, helping to reduce the threat of maturation (Cook &
Campbell, 1979).
Although the researcher was aware of the possibility that participants might
display targeted behavior shortly after safety training then regress to pre-intervention
behavior, the follow up survey was timed to capture habitual behavior in place several
weeks after the training; that was when the final perception of safety climate was
measured. Finally, there was a possibility that those who volunteered for a safety study
might already be safety conscious or afraid to express genuine critique of safety on the
jobsite. Assurance from management and the researcher that identities would not be
shared with the company under any circumstance helped to alleviate fear of negative
consequences or job loss for honest participation in the study.
Ethical Procedures
Formal agreements were secured prior to any training sessions or data collection
at the pilot and study sites, as guided by the University Institutional Review Board (IRB)
at Walden University. The IRB approval number for this study is: 09-08-17-0107839. The
Program Initiative/Oversite and Data Use Agreement outlined the ethical procedures,
oversite responsibilities, researcher role and responsibly, timeline of the data collection,
storage, and reporting (Appendix D).

47
Participants did not face any ethical concerns that were not already part of a safety
training environment. Although the small group coaching techniques included some
techniques that were similar to those used in therapeutic behavior change endeavors, such
as motivational interviewing (MI) techniques, guidelines established by Passmore (2013)
were followed to protect all participants if topics were brought up that might cause
psychological harm, effect liability, or damage the organizations reputation, such as
disclosing details about serious incidents under investigation at the time of the training
session.
Confidentiality of perception surveys, OSHA reports, and/or near-miss reports
were protected by the researcher on a secure server for the duration of the study. The
company’s oversite executive removed names from reports and OSHA logs before
sharing archival data.
The decision to refuse to participate or withdrawal for any reason was treated with
confidentially and respect. Participants were removed from study confidentially to avoid
any form of retaliation, perception of unfair treatment, or other negative consequences
from the employer.
Summary
The study adhered to all ethical guidelines and oversite provided by Walden
University as well as federal, state, and local laws where the training and data collection
took place. Naturalistic, respectful, and open communication with the company oversite
and all participants were built into all aspects of the study and data collection procedures.

48
The study created minimal disruption to operations, utilized validated instruments to
measure perceptions, and was scheduled and conducted in small groups similar to the
standard OSHA-based training already familiar to company field personnel to minimize
disruption of operations and threats to validity. All data including participant perceptions
and participation throughout the study were carefully guarded by the researcher; reports
to the company were made in general terms, protecting the confidentiality of the
participants.
In Chapter 4, the results of this quasi-experimental design will be described.

49
Chapter 4: Results
Introduction
A quantitative, quasi-experiment design was implemented to determine whether
AL development training could improve workforce perceptions of safety climate in a
cost-effective and meaningful way, particularly on large, heavy, civil and public works
projects in the construction industry. As detailed in Chapter 3, the approach was similar
to Zohar’s (2014) successful safety climate improvement interventions in the
manufacturing industry: It was a brief intervention that sought improvements in
communication and safety climate. Furthermore, application of PdT and coaching
methods were used as the intervention framework to discuss AL development in a small
group setting. The basic framework has the potential for replication in various industries
and organizations with similar hierarchies or work groups to improve safety climate.
Research in AL and safety climate benefits both practitioners and researchers in the field
of organizational psychology, and it may further reduce severe injury or possibly lower
fatality rates in high-risk work environments. The study was conducted as planned, using
the instrumentation and framework as designed, which led to a significant change in one
important measure of safety climate regarding the perception of equipment maintenance
having an impact on safety climate.
Data Collection
The actual data collection was conducted as described in Chapter 3. Some pretest
surveys where collected from individuals who may have traveled to other work areas of
50
the project by the second data collection. Posttest data were collected solely from the
work crews that were stationed at jobsite Segment D and working for the trained
supervisors.
The number of field employees estimated at the time of the original proposal
included the projections for a 4-year, $1 billion, 22-mile urban freeway expansion
project. It was anticipated that the project population would have been 220 workers and
30 supervisors. During the initial data collection points of September 19, 2017 to October
9, 2017, there were 108 field craft employees on the project and 18 supervisors; a low
point due to environmental permit delays and negotiations with Native Americans over
sacred land. Skeleton crews were employed for portions of work that could be completed
during the wait time. The number of employees increased slightly on the final collection
date and went to full capacity in the weeks that followed the final collection date of
November 17, 2017. The researcher was advised during the final collection date that the
core leaders from the study would be distributed throughout the four segments; therefore,
the timing of the leadership training had been excellent in terms of training impact for the
other segments, but the scattering of survey participants would halt data collection as
there would be no means of identifying employees of trained supervisors after the week
of November 13-17, 2017, when the final data collection took place.
Managers and superintendents who requested to take the survey were given
access to the link. Because the survey asked the participant to identify a position in the

51
company, survey responses for managers and superintendents were removed from the
data before the detailed analysis.
Characteristics of the Survey Participants
Table 1
Position Held by Survey Respondents
Position Pretest Posttest Superintendents Total
Apprentice 15 7 0 22
Journeyman 54 18 0 72
Foreman 10 3 2 15
Superintendent 1 1 4 6
Management 7 3 0 10
Total 87 32 6 125
Once the superintendents and management staff were removed from the data, the
study participants comprised the crafts shown below.

52
Table 2
Crafts Represented in Survey Responses
Craft Pretest Posttest Total %
Carpenter 32 18 50 46.3
Ironworker 7 0 7 6.5
Laborer 10 7 17 15.7
Operator 29 2 31 28.7
Missing data 2 1 3 2.8
Total 80 28 108 100
The age of survey participants was fairly distributed. Participants were asked to
identify their age within a range of numbers so as to minimize potential identification.

53
Table 3
Age Range of Participants
Age Range Pretest Posttest Total %
18-25 10 5 15 13.9%
26-30 14 3 17 15.7%
31-40 19 8 27 25.0%
41-50 19 8 27 25.0%
51-60 13 3 16 14.8%
Over 60 5 1 6 5.6%
80 28 108 100%
Participants were also asked to identify their race and/or ethnicity. Table 4 reports
these results.

54
Table 4
Race/Ethnicity of Study Participants
Race/ethnicity Pretest Posttest Total Percent
Caucasian 28 6 34 31.5%
Hispanic 41 17 58 53.7%
African American 1 0 1 0.9%
Other 9 5 14 13.0%
Prefer not to answer 1 0 1 0.9%
Total 80 28 108 100%
The entire project employed 18 to 20 superintendents at the time of the surveys
and through mid-November 2017; nine of those superintendents worked consistently on
the segment where the training took place (i.e., Segment D), then could possibly be
spread throughout the other segments (i.e., Segments A, B, & C). Given the changing
conditions of the field project, the researcher focused the training and second data
collection (T1) on a single segment chosen by project management (i.e., Segment D) as a
means to isolate the study group and create a snapshot of the safety climate post
intervention. The reduction of comparative surveys will be discussed further in the
limitation section.

55
Treatment and/or Intervention Fidelity
The AL development program was implemented as described in Chapter 3 with
minor adjustments for participant size, grouping, and training emphasis. Best practices
recommended by the NIH Behavior Change Consortium were used throughout the design
and implementation, including the development and use of a workbook to aid in
participant enactment of the communication skills learned (Bellg et al., 2004).
Of note, the survey and training framework were highly structured but could be
implemented by a company instructor or safety professional to maximize the benefits.
The survey developed for this study was constructed from two separate instruments. The
NORSCI survey was in the public domain and did not need permission to use it in the
research setting. The ALQ did require permission; however, that permission was limited
to a maximum of three questions. The training intervention created for this study was
heavily grounded in the safety coaching literature (Gellar, 2004), standardized
organizational training (Cherniss et al., 2012), and emerging organizational coaching
literature (Fusco et al., 2011; Grant et al., 2010; Kinsler, 2014).
One-half of the 18 superintendents on the project at the time of the study were
assigned to training; all of the superintendents in training were dedicated to the segment
where the majority of craft workers were assigned at the data collection time T1 in
Segment D. Only one supervisor did not show up as scheduled; all participating
superintendents were allocated by the segment project manager.

56
The emphasis of the training was adapted in response to the initial data collection
(Bellg et al, 2004). The superintendents selected by the company were rated very high by
participants in the perception of authenticity leaving little room for improvement,
specifically in the areas of integrity, listening, and self- awareness. Although the training
included reflection and discussion of the developmental areas listed above, the emphasis
in the training shifted to focus on the actionable areas of safety climate that were not as
highly rated by the survey participants in the T0 surveys (e.g., communicate near-miss
reporting, creating an empowered climate of communication among the crew members
and foreman). In addition, superintendents discussed incidents that concerned them.
Supervisors assigned to jobsite Segment D were the only supervisors trained at
the time of this writing. The consequence was increased fidelity in the implementation by
providing a single group in training before the post survey results were obtained, thereby
removing any question of consistency of the training within groups.
The diversity of the superintendent group selected by project management was
worth noting for future studies because it appeared to create an ideal training situation for
a joint-venture project. This project was staffed by employees from three parent
companies that traditionally compete with each other. The project was bid and awarded
under a new corporate structure and name, blending a mix of employees from each
construction company; a frequent practice of shared resources on mega project joint
ventures. What was unusual about this group was the similar assortment of field
leadership from two of the parent companies dedicated to this project; typically, one

57
contractor provides the field craft in joint ventures. The training session included a mix of
superintendents from each of the parent companies. The cultural differences were striking
and conspicuous in the group discussions and communication exercises.
Study Results
The confidential instrument used to measure the safety climate on the project
(Appendix B) was assembled from three sources. The first three questions were from the
Authentic Leadership Questionnaire (ALQ; Avolio et al., 2007). Questions 4 to 11 were
from the Brief Norwegian Offshore Risk and Safety Climate Inventory (NORSCI;
Nielsen et al., 2013b) and the near-miss question was designed by the researcher. Further
statistical detail follows for each of the questions included on the electronic survey.
Comparative/Relative Percentages of Authentic Leadership in Pretest and Posttest-
Surveys
Many workers appeared to agree that leadership throughout all segments of the
project demonstrated the core characteristics associated with authentic leaders from the
outset. Although there was a slight improvement in AL perceptions at T1, it was not
statistically significant.

58
Table 5
Authentic Leadership Questions
Survey Questions Pre/
Post
Strongly
Disagree Disagree Neither Agree
Strongly
Agree Total
Percent
(N)
N
Q.1 My Leader says exactly
what he or she means.
T0: 4.65%
(4)
5.81%
(5)
12.79%
(11)
47.67 %
(41)
29.07%
(25)
86
T1: 9.38 %
(2)
3.31%
(1)
6.25%
(2)
65.63%
(21)
15.63%
(5)
32
Q.2 My Leader listens carefully
to different points of view
before coming to conclusions.
T0: 2.33%
(2)
8.14%
(7)
11.63
(10)
54.65%
(47)
23.26%
(20)
86
T1: 3.13%
(1)
9.38%
(3)
12.50
(4)
68.75%
(22)
6.25%
(2)
32
Q.3 My Leader shows he or she
understands how specific
actions impact others.
T0: 4.65%
(4)
3.59%
(3)
18.6%
(16)
51.16%
(44)
22.09%
(19)
86
T1: 3.13%
(1)
3.13%
(1)
12.50
(4)
71.88
(23)
9.38%
(3)
32
Note. Questions based on Authentic Leadership Questionnaire by B. J. Avolio, W. L. Gardner, & F. O. Walumbwa (2007). Used with permission.
Perceptions of Leadership Authenticity
The first three questions on the survey measured authentic leader perceptions of
workers on the project pre- (T0) and post- (T1) authentic leader development training. As
80 preintervention surveys and 28 postintervention surveys comprised the study, the
comparison is displayed by the relative proportion of responses for each survey question.
The selection of responses for the three questions extracted from the ALQ denoted a 5-
point Likert-type scale from 1(strongly disagree) to 5 (strongly agree). Utilizing this
ordinal scale, statistical significance was calculated pre- and postintervention by

59
computing a Mann-Whitney U for independent samples. The U distribution for all
questions was approximately normal, therefore z values are reported.
Figure 1. Survey Question 1: My leader says exactly what he or she means.
Pre-intervention, leaders were already ranked positively by their workers for
honest communication. The proportion of positive responses grew from 73.8% to 82.1%,
but that increase did not achieve statistical significance (z = 0.354, p = .726).
3
3
1
5
1
13
18
36
5
23
0% 20% 40% 60% 80% 100%
Post
Pre
Strongly Disagree Disagree Neither Agree Strongly Agree

60
Figure 2. Survey Question 2: My leader listens carefully to different points of view before
coming to conclusions.
Both pre- and postintervention responses were primarily positive for this listening
question (76.3% vs. 75.0%). However, no statistical difference was seen between the two
survey collection points (z = 0.002, p = 1.0).
1
2
2
7
4
10
19
42
2
19
0% 20% 40% 60% 80% 100%
Post
Pre
Strongly Disagree Disagree Neither Agree Strongly Agree

61
Figure 3. Survey Question 3: My Leader shows he or she understands how specific actions
impact others.
Similar to Question 1, the leader’s understanding of how actions might affect
others was largely positive pre-intervention. On the postintervention survey, a larger
proportion of respondents agreed with the statement (71.3% vs. 82.1%); however, this
result was not statistically significant (z = -0.046, p = .960).
Composite Score for Authentic Leadership. The first three AL questions were
combined to represent an AL subscale score. Collectively, there was no statistical
difference in these elements of AL measurement.
1
4
1
3
3
16
20
40
3
17
0% 20% 40% 60% 80% 100%
Post
Pre
Strongly Disagree Disagree Neither Agree Strongly Agree

62
Table 6
Authentic Leadership Composite Score
Time N M SD t p
Pre 80 11.54 2.360 0.548 .585
Post 28 11.25 2.474
Safety Climate Perceptions T1 and T0
Questions 4 through 14 represented all of the questions in the NORSCI. Subscale
scores of this inventory included (a) motivation and intention to work safely, (b)
management prioritization of safety, and (c) safety routines established by management.
The selection of responses was designated on a 5-point Likert-type scale from Not at all
(1) to Frequently if not always (5). Utilizing this ordinal scale, statistical significance was
calculated pre- and postintervention by computing a Mann-Whitney U for independent
samples. The U distribution for all questions was approximately normal, therefore z
values are reported.
Individual motivation and intention to work safely. Questions 4 to 7 on the
survey represented an individual’s motivation and intention to work safely. These
questions queried the respondents in what they as workers would do to promote safety in
the workplace.

63
Figure 4. Survey Question 4: I report any dangerous situations I see.
Reporting dangerous situations was seemingly habitual in nearly all respondents.
The differences pre- and post- were seen in the Frequently category (51.3% vs. 64.3%),
but this was not a statistically significant shift in responses (z = -1.052, p = .294).
11
3
10
7
27
18
41
0% 20% 40% 60% 80% 100%
Post
Pre
Not at all Once in a while Sometimes Fairly Often Frequently

64
Figure 5. Survey Question 5: Safety is my Number 1 priority when I work.
In this question, a noticeable shift downward was seen in the responses
postintervention, particularly for the Frequently if not Always category (83.8% vs.
64.3%) These changes in proportions were not statistically significant (z = 0.489, p =
.624).
1
3
3
7
9
18
67
0% 20% 40% 60% 80% 100%
Post
Pre
Not at all Once in a while Sometimes Fairly Often Frequently

65
.
Figure 6. Survey Question 6: I ask my colleagues to stop work which I believe is performed in an unsafe manner
Responses to Question 6 appeared to improve in the top rating (50.6% vs. 65.4%)
and no postintervention responses were in either of the two lower categories. This
change, however, was not statistically significant (z = -1.615, p = .107).
2 9
2
10
7
18
17
40
0% 20% 40% 60% 80% 100%
Post
Pre
Not at all Once in a while Sometimes Fairly Often Frequently

66
Figure 7. Survey Question 7: I stop work if I believe it may be dangerous for me or others to continue.
The noticeable difference pre- and postintervention was the shift up in self-
reporting the need to stop work. No postintervention responses were in the Not at all or
Once in a while categories; however, this was not statistically significant (z = -0.053, p =
.960).
Composite subscale score for individual motivation and intention to work
safely. Summing the scale scores for individual motivation and intention yielded slightly
higher scores postintervention. This difference was not statistically significant (Table 7).
1 4
2
8
9
17
15
48
0% 20% 40% 60% 80% 100%
Post
Pre
Not at all Once in a while Sometimes Fairly Often Frequently
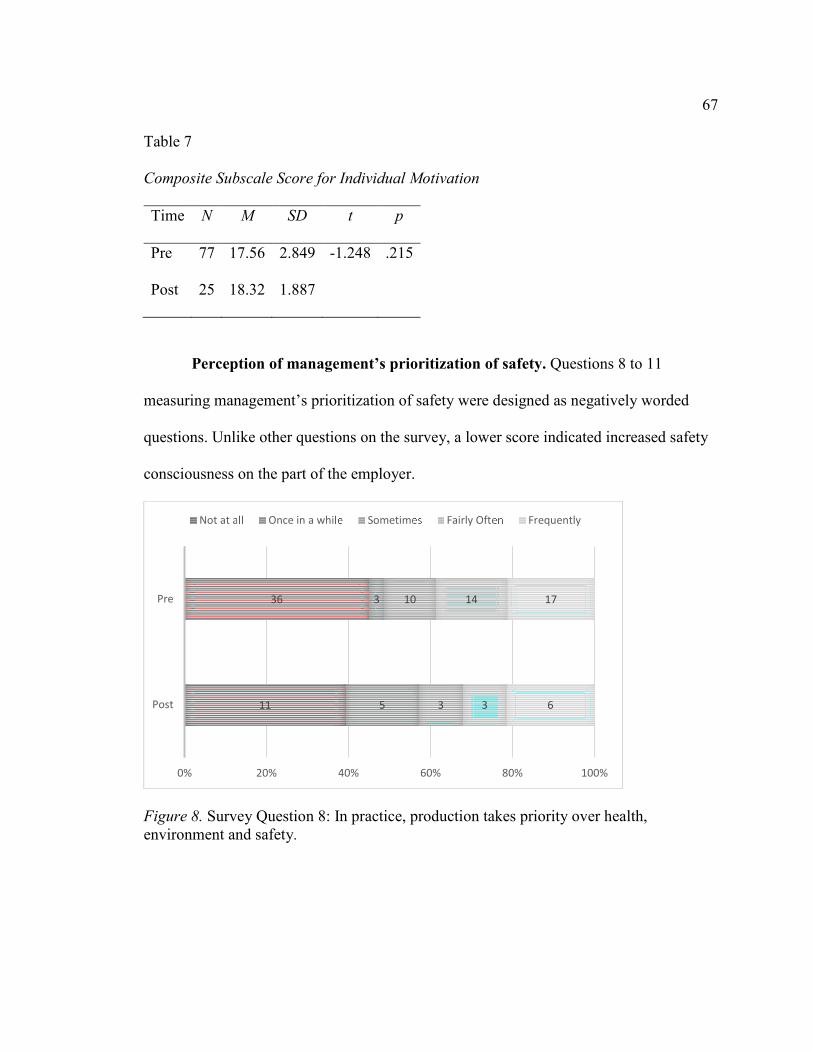
67
Table 7
Composite Subscale Score for Individual Motivation
Time N M SD t p
Pre 77 17.56 2.849 -1.248 .215
Post 25 18.32 1.887
Perception of management’s prioritization of safety. Questions 8 to 11
measuring management’s prioritization of safety were designed as negatively worded
questions. Unlike other questions on the survey, a lower score indicated increased safety
consciousness on the part of the employer.
Figure 8. Survey Question 8: In practice, production takes priority over health, environment and safety.
11
36
5
3
3
10
3
14
6
17
0% 20% 40% 60% 80% 100%
Post
Pre
Not at all Once in a while Sometimes Fairly Often Frequently

68
Question 8 appeared to have proportionally fewer responses in the top three
ratings (51.3% vs. 42.9%) but the preferred, safety-conscious response of Not at all was
also proportionally less. This difference was not statistically significant (z = 0.035, p =
.968).
Figure 9. Survey Question 9: Reports about accidents or dangerous situations are often ‘‘embellished.’’
For Question 9, there appeared to be a broadening of the middle responses (i.e.,
Sometimes, Fairly Often; 36.8% vs 57.1%). This shift in proportions was not statistically
significant (z = 0.154, p = .881).
5
19
2
7
6
14
10
14
5
22
0% 20% 40% 60% 80% 100%
Post
Pre
Not at all Once in a while Sometimes Fairly Often Frequently

69
Figure 10. Survey Question 10: There are often concurrent work operations which lead to dangerous situations.
Question 10 also appeared to have a widening of the middle responses, this time
for Once in a while and Sometimes (41.6% vs. 75.0%). This shift was not statistically
significant (z = 0.511, p = .610).
3
17
10
17
11
15
1
16
3
12
0% 20% 40% 60% 80% 100%
Post
Pre
Not at all Once in a while Sometimes Fairly Often Frequently

70
Figure 11. Survey Question 11: Deficient maintenance has caused poorer safety.
The question about deficient maintenance illustrated a dramatic, positive shift
with 60.7% postintervention respondents reporting Not at all (vs. pre-intervention of
32.1%). These results were statistically significant (z = 1.989, p = .047).
Composite subscale score for perception of management’s prioritization of
safety. Combining all of the negatively worded questions examining workers’
perceptions of how management prioritizes safety with other competing needs, a subscale
score was calculated. To compare all of the subscale scores, responses were recoded to
account for the negative statements (e.g., Not at all = 5, Frequently = 1) so that a higher
number would represent a more safety-conscious environment. The resulting statistics for
this subscale are displayed in Table 8.
17
25
4
24
3
15
2
7
2
7
0% 20% 40% 60% 80% 100%
Post
Pre
Not at all Once in a while Sometimes Fairly Often Frequently

71
Table 8
Composite Subscale Score for Management’s Prioritization of Safety
Time N M SD t p
Pre 75 13.01 4.326 -0.647 .519
Post 28 13.61 3.604
Perception of safety routines established by management. Questions 12–14
asked respondents to gage safety routines that have been established by management.
After discussing each question, the subscale scores will be displayed.
Figure 12. Survey Question 12: I have the necessary competence to perform my job in a safe manner.
In the postintervention, all but one respondent indicated competence to work
safely Fairly Often or Frequently if not always; however, the proportion of Frequently if
1
2 3
10
13
17
60
0% 20% 40% 60% 80% 100%
Post
Pre
Not at all Once in a while Sometimes Fairly Often Frequently

72
not always was lower than on the pre-intervention survey (76.9% vs. 60.7%). This
difference was not statistically significant (z = 1.150, p = .250).
Figure 13. Survey Question 13: I have easy access to personal protective equipment.
As seen in Question 12, all but one employee indicated simple access to personal
safety equipment and the proportion of Frequently if not always was greater in the
postintervention group (67.5% vs. 82.1%). This difference was not statistically significant
(z = -1.181, p = .238).
1
1 8
4
17
23
54
0% 20% 40% 60% 80% 100%
Post
Pre
Not at all Once in a while Sometimes Fairly Often Frequently

73
Figure 14. Survey Question 14: The management takes input from the safety delegates seriously.
Again, all but one worker felt that management took safety-delegate feedback
seriously in the postintervention survey and the proportion of Frequently if not always
was larger postintervention (57.5% vs. 67.9%). This difference was not statistically
significant (z = -1.146, p = .250).
Composite score for perception of safety routines established by
management. The third subscale for the NORSCI indicated relatively high scores pre-
intervention that tended to increase postintervention, but not at a level to be statistically
significant. Table 9 outlines the data for this subscale.
1
2 1 13
8
18
19
46
0% 20% 40% 60% 80% 100%
Post
Pre
Not at all Once in a while Sometimes Fairly Often Frequently

74
Table 9
Composite Subscale Score for Perception of Safety Routines Established by Management
Time N M SD t p
Pre 78 13.51 1.807 -0.689 .492
Post 28 13.79 1.771
Worker’s ability to be heard. The last survey question was designed to capture
the perception of the workers’ personal safety to risk speaking up when otherwise
unreported near miss incidents occurred. The following measured the likelihood of
reporting near-miss or minor incidents that occurred pre- and post-training intervention.
Figure 15. Survey Question 15: I feel safe reporting events that could have caused damage or injury but did not.
1
9 3
2
10
9
17
15
41
0% 20% 40% 60% 80% 100%
Post
Pre
Not at all Once in a while Sometimes Fairly Often Frequently

75
Pre-intervention, more than one-quarter of employees (27.5%) reported feeling
less than safe reporting near-miss incidences; postintervention, this proportion was only
10.7%. This broadening of feeling safe in reporting near-misses nonetheless was not
statistically significant (z = -0.897, p = .368).
Total Score for Study Survey
A total score for all survey questions was computed and tested for homogeneity of
variance to ensure appropriate statistical testing. As four of the questions (i.e., Questions
8-11) were negatively worded, they were reverse-scored to be on par with the 11
positively-worded statement. The results of that comparison between the pre- and
postintervention surveys is displayed in Table 10.
Table 10
Total Score Comparison for Study Survey
Time N M SD t p
Pre 74 59.45 7.454 -1.080 .283
Post 24 61.33 7.400
Project Incident Records
The safety administrator for the project provided comprehensive records of all
incidents that had occurred in Calendar Year 2017 through December, a time when the
project slowed down for the holidays. All four segments (i.e., A, B, C, D) are
summarized below. The first column displays Segments A, B, and C for the year. Column

76
2 lists the incidents that occurred only in Segment D prior to the study. The last two
columns provide a snapshot of incidents that occurred 2 months prior and 2 months post
supervisor intervention.
Incidents were categorized into types representing property loss, bodily injury,
regulatory reporting, or the potential of financial loss. These categories were:
• Equipment damage – an incident that resulted in the need to repair or replace
personal property owned by the company: heavy equipment roll-overs,
company truck accidents on the job site, and any other incidents that involved
company owned property with damage valued at $1,000 or more.
• OSHA recordable –worker injury requiring medical (physician) intervention
and/or work restrictions; reported to state and/or federal authorities according
to regulatory requirements
• First aid – minor workplace injury, generally treatable on the job site
• Utility damage or hit - utility conduits of any type that are damaged or struck
during construction operations (e.g., electric, gas, cable, water)
• Formal near miss report – formal reports of incidents that had a potential for
damage or injury but did not incur physical or monetary loss.
Situations and potential for negative outcome are described on a company incident form.

77
Table 11
Injuries, Equipment Damage, and Public Utility Hit Summary
Incident Type
Jan - Dec Seg. A, B,
and C
Jan – Dec Seg. D Only
Jan-Aug Seg. D Only
2 Months Pre-
Training Seg D
2 Months Post-
Training Seg D
Equipment
Damage
17 14 10 4 0
OSHA Recordable 6 4 4 0 0
First Aid (On-site) 4 8 6 1 1
Utility Damage/Hit 0 8 5 3 0
Formal Near Miss
Report
3 1 0 0 1
Total 27 34 24 8 2
As the study was underway, the company requested AL intervention in Segment
D for reasons that were clear after reviewing the company incident records.
Summary
Research Question 1 is as follows: Do supervisors who complete safety training
emphasizing integration of AL and communication skills during leader-member
exchanges have significantly higher worker safety climate perceptions? Although the
total score of the survey did not show any significant change in the safety climate
perceptions overall, there was a significantly higher safety-climate perception in regard to
maintenance of equipment post intervention (p < .047). This finding was supported by the
sharp reduction in equipment damage reports. The overall reduction of incidents across

78
all categories in the segment that participated in the AL training at Segment D was
significant (Fisher’s Exact, p = .007) and supports rejecting the null hypothesis.
Research Question 2 is as follows: Do workers’ perception of their supervisor’s
AL improve significantly after their supervisors are trained to integrate AL and
communication skills during leader-member interactions? With no significant change in
the perception of supervisors AL in the workers following the training, Research
Question 2 must fail to reject the null hypothesis. Further interpretation of the
proportional/percentage shift from strongly agree to agree in the workers perceptions of
supervisors AL improvements will be articulated in Chapter 5
Research Question 3 is as follows: Does worker willingness to report safety
concerns increase significantly following the supervisor training? This question was
tested by combining the responses of Questions 4, 6, and 15; however, it was not
statistically significant and must therefore fail to reject the null hypothesis. Nevertheless,
based on the incident reports and anecdotal information from the safety department
regarding an upsurge in informal near-miss reporting, there is a need for further
investigation in this area as detailed in Chapter 5.
In summary, the initial research questions remained valid and withstood the
testing process suggesting implications for the influence of a focused approach to AL at
one jobsite. Although only one question measured a significant change in the safety
climate perception of the workers, the project incident reports post survey augmented the

79
significance of that change. Further exploration of the results and possible conclusions
will be discussed in the next chapter.
Chapter 5 will discuss the findings of this study as well as the limitations for
generalization of the results. Additionally, implications for social change and suggestions
for future research will be presented.

80
Chapter 5: Discussion, Conclusions, and Recommendations
Introduction
This study builds on the evidence that positive safety climates influence the work
environment by increasing positive safety outcomes, reducing incidents, and improving
preventive communication (Zohar, 2014). The overarching purpose of this study was to
test the ability of AL and communication development to make a positive change in
safety climate. From the outset, the design of this study was to effect immediate behavior
change and improve communication at the staff level of high-risk, heavy highway
construction sites following a brief, low-cost, and inconspicuous AL and safety
communication intervention. The total scores from the survey did not measure significant
change in safety climate as designed. However, the significance of one key facet of the
safety climate, the incident trends postsurvey and an informal increase in near-miss safety
reporting, suggest that the model warrants further implementation and study in the
construction safety field.
The significant change in the perception of improved equipment maintenance on
Segment D may have the greatest immediate impact on continuous improvement of
safety climate, performance, and reducing the frequency, severity, and probability of
fatalities on the jobsite. Despite the lack of statistical evidence, there were several
relevant, positive shifts in perceptions and a few moves downward, suggesting
perceptible changes had been ignited in other areas of communication and worker
empowerment to express their experiences and concerns.

81
The survey and implementation model designed for this study could be used for
further inquiry into AL and communication improvements on large construction projects
and a myriad of other complex organizational structures and high-hazard workplaces
such as the military, police organizations and hospitals.
Interpretation of Findings
The one area of statistical significance in the safety climate survey was measured
in Question 11, Deficient maintenance has caused poorer safety. The initial response
flagged maintenance as a concern that colored the safety climate in the preintervention
phase (T0). Postintervention (T1), 60.7% of respondents did not see maintenance related
to poorer safety (p < .047). Although the supervisors in training broached equipment
maintenance and the large number of incidents in Segment D, in the group roundtable
discussion during the intervention, project management was reporting focused
improvements in the maintenance area.
For this study, the supervisors were heavily encouraged by upper management to
improve their leadership skills. The commitment on the part of project management to
support the supervisors in this change endeavor, especially at Segment D, was
impressive. This was evident by the investment in training time and opportunity cost of
taking top-pay leadership out of the field to attend the AL training. The researcher
observed corporate and segment safety personnel as a major source of support for the
supervisors and the crews. Managers were observed actively and habitually implementing
all of the standard practices noted by Esmaeili et al. (2012) found in organizations that

82
are considered world class. Each segment was staffed with a safety manager and spent
the majority of the workday in the field with the workforce; a safety administrator and
regional safety manager coordinated recordkeeping and insurance issues, allowing the
safety managers to interact with the craft workers on a daily basis.
Although there was an increase in the frequency of reporting dangerous situations
(Questions 4 and 6), the perception of workers to feel secure in reporting near-miss
incidents also increased (Question 15). Unfortunately, these changes did not achieve
statistical significance. The increased proportion of positive perception post training, as
evidenced by the first formal near-miss reported at Segment D and antidotal reports of
informal near miss discussions that began to occur, would be indicative of positive
actions and increased communication on the project in the weeks and months following
the training event. Similar effects were discovered following Zohar and Polocheck’s
(2014) brief communication intervention in the manufacturing field in which inspection
scores improved in the areas of the plant where the experimental supervisors’
intervention took place. An interesting shift surrounding Question 3 (i.e., My leader
shows he or she understands how specific actions impact others) warrants further
discussion and perhaps future investigation. A large portion of the workers’ perception
shifted from strongly agree to agree and a higher percentage moved from a neutral
response to agree, although the resulting shift was not statistically significant. Without
further testing or follow up interviews, it is difficult to determine the reasons for the
mixed changes. Based on the large number of workers who started informally revealing
83
safety issues and acting with a sense of empowerment to verbally report near-miss
incidents on Segment D following the intervention, there is concern that perhaps the lack
of follow-up actions or policy supporting a feedback loop led to the slight change in
perception for some workers. Other workers may have experienced swift follow up from
the supervisor or safety officer and that shifted their perception more favorably.
Another area of incident reporting should be noted to avoid the misrepresentation
of the data in Table 11. The reduction of utility damage and hits cannot be attributed to
the training intervention, although these incidents were discussed in the group session
among the supervisors at the training. The excavation work around the heavily congested
utilities of Segment D was essentially completed when the report data for the 2-month
postintervention were collected.
The measured safety climate had an interesting negative shift following the
training, albeit not significant, in the responses to Question 5 (the individual prioritization
of safety) dropped in frequency and is worth further inspection. A heightened awareness
of safety descriptors could serve as a potential explanation of the downward shift in
perception following the first survey collection (McCambridge, Butor-Bhavsar, Witton,
& Elbourne, 2011). In their meta-analysis of the Hawthorne effect on quasi-experimental
studies, McCambridge, Kalaitzaki et al. (2011) found evidence of bias in either direction
when participants were introduced to information on surveys that could influence their
thinking or provide information about the behaviors under assessment. Another possible
explanation is that the change was precipitated by the project manager’s announcement

84
just prior to the T1 collection at the safety meeting that work would be accelerating.
Several studies have suggested that the priority of the frontline management and attitudes
are greatly influenced by local leadership (Barling et al., 2002; Høivik, Tharaldesen,
Baste, & Moen, 2009; Mearns, Flin, Gordon, & Fleming, 2001). Announcements that
production would be a priority have historically undermined safety perceptions;
therefore, the workers may have lowered their own prioritizing of safety in response.
The present study expanded on Zohars (2000) and Zohar and Polochek (2014)
safety climate research demonstrating again that safety climate is heavily influenced by
direct safety feedback from supervisors. Direct and authentic communication about safety
was a key part of the AL workshop and stated goals of the majority of the supervisors
before leaving the training.
A measured approach for developing authentic leadership did not exist in the
literature before the current study, as the majority of existing programs are long and
drawn out with no empirical support of effectiveness (Glowacki-Dudka & Griswold,
2016; Granerud & Rocha, 2011). The training model, AL and safety climate
measurement framework that were fused together in the current study would fit a wide
variety of high risk organizations that would benefit from AL (Bass, Jung, Avolio, &
Berson, 2003; Borgersen et al., 2014). Industries such as hospitals, police, fire
departments, and the military would benefit from any intervention that would help
improve safety climate for crews on the front lines as it did in this study (Cherniss et. al,
2010; Zohar and Polocheck, 2014).

85
Limitations of the Study
There were several limitations to this study in both data collection and measuring
the change in near-miss reporting. These limitations included the transient nature of the
crews; the method used to collect, code, and match pre-and post-survey data; and the
readability level of language used in the survey.
The researcher invited a variety of small and large groups to complete the surveys
on smart phones. Although most were eager to have their voices heard, many participants
asked for word meanings or technical help to get the survey opened on their phones. This
made the collection process more time consuming than originally anticipated. The ethnic
background of the participants included 53.7% Hispanic, but the survey was available
only in English and may have been a barrier for some participants. Another barrier might
have been the absence of paper-and-pencil as an option. As 70.4% of participants were
over 30 years of age, many participants needed help using cell phones to open and access
the survey. Including a Spanish version on paper and online may have elicited a higher
response. Construction projects are generally dynamic workplaces.
According to O’Sullivan, Orbell, Rakow, and Parker (2004), little empirical
evidence exists that the Hawthorne effect could be controlled in quasi-experimental
studies. It is impossible to discern if the workers in this study were biased regarding any
of the questions asked in the second survey, especially when the ability to isolate the
crews into a 4-way test was not possible for this project (Campbell, 1957; Solomon,
1947). Further study would be needed with controlled groups and an increased number of

86
participants to detect this potential confounder. However, if there was any bias introduced
by the survey content, it clearly had a positive effect on the overall safety outcomes based
on both the frequency and the severity of the incidents post study.
Finally, although it is undeniable that the jobsite under study was the only project
that had a major shift in incident number and severity, without the ability to match
participants, there was no way to isolate the precise effect of this group from other crews
that would not have been under the influence AL trained supervisors.
Recommendations for Research
Future research could easily replicate the model used in this study but should
allow for more time and control to maximize the use of the mixed-effects statistical
designs originally planned. Using raffle tickets might increase the survey participants’
motivation and created a mechanism to link the pre-and post-groups allowing for
matched-pairs testing instead of independent samples. The creation of a four-way
analysis with control and experimental groups has been recommended as the best method
for eliminating bias (Cook, et al, 1979; Solomon, 1949). Other “research participation
effects caused by participant knowledge of the research” (McCambridge, Witton, &
Elbourne, 2014, p. 276) may have limited the results of this study when it was reduced to
one jobsite with one measure before and one measure after supervisor training. As
infrastructure projects of this scale with delimitation of segmented projects could
accommodate a mixed design, further value could be added by linking supervisors to the
specific crew members. This type of research would need to be conducted under the

87
control of the company’s management as a leadership development endeavor and could
allow linking workers to their supervisors to identify needs for further individualized AL
development.
Recommendations for Practice
For practical reasons, further research in organizations with highly evolved safety
programs should implement the survey as an organization-wide endeavor and include
additional recognition or small incentives for participation. Additionally, providing
surveys in Spanish as well as paper-and-pencil options would also increase participation;
many participants mentioned these elements during the T1 collection. This could also aid
in studying any influences of culture on the worker’s perception of AL and safety
climate.
Future training interventions should include a between-group analysis to isolate
the effects of training on safety climate perceptions (McCambridge et al., 2014). The
training should remain grounded in AL as outlined in Chapter 2 (Avolio et al, 2004)
although the supervisors who participated in this study had high AL scores prior to the
intervention. The basis of AL training outlines the cornerstones of the concept – trust,
actionable values (e.g., moral behavior, integrity), balanced processing, and transparency
– then leads participants to reflect on their own values and to examine leadership models
that resonate with them personally. Following the AL session, connections between AL
and crew empowerment to report were used as an example to start a group discussion
among participants about goals to improve the workplace based on current production

88
and issues brought from the field; in this case, equipment damage. The final segment was
a hands-on communication exercise that was followed by information and reflective
discussions about improving communication. Throughout the intervention, the training
facilitator allowed time for participants to update personal workbooks and make notes.
The session ended with supervisors committing to communication goals of their own
design based on their individual values, communication style, and development needs.
The supervisors who participated in this study were perceived to possess the key skills
associated with AL before the development intervention, leaving little room for measured
improvement in the rating that specifically targeted AL; however, based on the
qualitative feedback of the training participants and the participants’ immediate
application of self-defined goals with their respective crews (Zohar, 2014), the focus on
AL for leadership improvement appeared to be a basic, repeatable PdT framework that
provided a consistent foundation for training as recommended by Cherniss et. al. (2010)
and the NIH Behavior Change Consortium (Bellig et. al., 2004). Operationalizing the
values and goals developed by the group was aided by following the original training
design, AL foundation, methods of safety coaching (Gellar, 2004; Passmore et. al, 2015),
and organizational psychology group methods borrowed from Yalom (2005) and further
refined by Spence and Deci (2016).
The AL development model designed for this study did make a difference in one
area of safety climate and appeared to influence the incident rate on Segment D where the
training was implemented. It is conceivable that a larger sample size at T1 might have

89
added significance in other areas of safety climate where the proportional shifts suggested
change. Also, designing a system to link supervisors and crew members could allow for
identifying members of the control group and the experimental group without revealing
individual identity, as mentioned earlier, and could add further evidence that this training
could be associated with a shift in the safety climate.
Finally, according to the site safety manager, workers began openly approaching
him about near-miss events and situations on the job following the training date,
indicating that supervisors were talking to the crews and encouraging this behavior.
Moreover, one crew member approached the researcher at T1 collection asking about
follow up to a safety issue that was informally reported. After discussing the situation
with the safety manager, it was learned that there was no formal process in place for
investigating near-miss reports unless the foreman completed a regular incident report.
Creating efficient investigations or forming simple follow-up feedback loops to address
any near miss could be another line of research to improve safety climate over time.
Implications for Social Change
The present study tested a field-based model for developing AL leadership and
effecting safety climate change that has been missing in the organizational literature. It is
the first model of its kind to fuse the well-established construct of AL (Avilio, et. al,
2004), safety climate, and communication improvement methods (Zohar, 2014) to
improve safety climate. Similar to Zohar and Polocheck’s (2014) study, this research
study adds credibility to brief field leadership interventions to improve safety climate that

90
goes beyond the typical leadership training offered at most major construction
companies, such as learning OSHA standards, company policies and procedures, and
other common practices cited by Esmaeili et.al. (2012). Offering the opportunity to
reflect on personal values, to set personal leadership and safety goals, and to discuss their
experiences in small groups appeared to benefit field leaders in tangible ways that
effected the perception of safety climate in their followers. Although this study
demonstrated statistical significance in one aspect of the safety climate, the training
framework has potential to facilitate participatory change efforts. The change in the
number of incidents and increase in near miss discussions has potential for long-range
influences and positive social change directly effecting people in the work environment
by reducing the number and severity of incidents that occur.
Per the literature previously discussed, apparent AL qualities have positive
influences in several areas of leadership (Wong, 2016). An unplanned result of the
training workshop was what appeared to be the bonding of these leaders during the group
work. Although no quantitative measure was included in the study designed to capture
this improvement, comments were observed and qualitatively noted about the benefits of
working together in the workshop environment during the closing session of training. The
high level of engagement could have resulted from the majority of the group participants
already deemed to be ALs (Giallonardo, Wong, et al., 2010; Wong, 2010). Another area
of research could test the AL development model to improve joint venture collaboration
and partnerships measured in terms of safety climate improvement in joint venture,

91
public-private partnerships, and other projects that depend on interorganizational
cooperation.
The company studied in this project was the epitome of safety modeling making
any AL improvement challenging. Nevertheless, strong safety support from top
management also allowed quick action on the part of the trained supervisors in
implementing the communication goals they set for themselves in their workbooks.
Results might vary in other organizations; therefore, the trainer must adapt the training
focus to align with the needs of the organization.
This framework is adaptable to many facets of safety climate improvement
without losing the fidelity of the intervention. Topics for improvement are participant
driven (Yalom, 2005). The use of structured-flexibility in group coaching is encouraged
and will likely be easier to implement in organizations with highly evolved safety
cultures and supervisors embodying AL characteristics from the onset. Further testing on
smaller projects, supervisors who initially rank low in AL, or organizations that are still
developing a positive safety culture could test the model at different levels of the
organization to potentially speed the development of both safety culture and safety
climates throughout the organization.
Conclusion
In spite of the adjustments that were required to complete the study, the original
objective was met; AL did have an impact on the safety climate of a high-risk, heavy
highway construction project. In addition, incidents and accident reduction were isolated

92
to the project that participated in the AL development program created for this study.
Positive change in all aspects of the safety climate on a construction project can have
long-term positive effects on the project’s financial and commercial success as well as
the health and livelihood of people who work in high-risk occupations. Developing
leaders using an AL framework provides new opportunities in research and improved
safety climate has rapidly become a reliable measure of an organization’s safety
performance and risk of injury, surpassing other leading indicator measures (Borgereson
et al, 2014; Christian et al 2009; Gardener et al, 2005; Zohar 1980, 2000, 2002, 2010;
Zohar & Polacheck, 2014). The primary intent of this field-tested implementation was to
contribute to the safety leadership and safety climate literature to benefit both
practitioners and researchers in the field of organizational psychology. Those goals were
met and there is now a field test for safety climate that expands the lifelong work of
Zohar (1980; 2000; 2002; 2010; Zohar & Polachek, 2014). In addition, a model for
developing AL now exists as defined, utilizing the four cornerstones of the AL construct
as developed, validated, and used in the ALQ) Avolio et al., 2007) for frontline
leadership in the building trades.
The combination of two theories proven to influence positive social change have
now been combined in a new way. This new process may lead to positive safety climate
and improved working conditions by improving communication between crews and
leadership and reducing the incidence of accidents and injuries on a major public-works
construction project.

93
References
Adams, M. (2016). ENABLE: A solution-focused coaching model for individual and
team coaching. The Coaching Psychologist, 12(1), 17-23.
https://shop.bps.org.uk/publications/publication-by-series/the-coaching-
psychologist/the-coaching-psychologist-vol-12-no-1-june-2016.html
Al Sahi AL Zaabi, M. S., Ahmad, K. Z., & Hossan, C. (2016). Authentic leadership,
work engagement and organizational citizenship behaviors in petroleum
company. International Journal of Productivity and Performance Management,
65(6). doi:10.1108/IJPPM-01-2016-0023
Avolio, B. J., & Gardner, W. L. (2005). Authentic leadership development: Getting to the
root of positive forms of leadership. The Leadership Quarterly, 16, 315-338.
doi:10.1016/j.leaqua.2005.03.001
Avolio, B. J., Gardner, W. L., & Walumbwa, F. O. (2007). Authentic leadership
questionnaire. Mind Garden. Retrieved from
http://www.mindgarden.com/authentic-leadership-questionnaire/595-alq-research-
permission.html
Avolio, B. J., Gardner, W. L., Walumbwa, F. O., Luthans, F., & May, D. R. (2004).
Unlocking the mask: A look at the process by which authentic leaders impact
follower attitudes and behaviors. The Leadership Quarterly, 15, 801-823.
doi:10.1016/j.leaqua.2004.09.003

94
Barling, J., Loughlin, C., & Kelloway, E. K. (2002). Development and test of a model
linking safety-specific transformational leadership and occupational safety.
Journal of Applied Psychology, 87, 488-496. doi:10.1037/0021-9010.87.3.488
Baron, L. (2012, January). Developing authentic leadership through experiential training:
An empirical study. Academy of Management Annual Meeting Proceedings, 1, 1-
1. doi:10.5465/AMBPP.2012.2
Baron, L. (2016). Authentic leadership and mindfulness development through action
learning. Journal of Managerial Psychology, 31(1), 296-311.
doi:org/10.1108/JMP-04-2014-0135
Baron, L., & Parent, E. (2015). Developing authentic leadership within a training context:
Three phenomena supporting the individual development process. Journal of
Leadership & Organizational Studies, 22(1), 37-53.
doi:10.1177/1548051813519501
Bass, B. M. (1985). Leadership performance and beyond expectations. New York, NY:
Free Press
Bass, B. M., Jung, D. I., Avolio, B. J., & Berson, Y. (2003). Predicting unit performance
by assessing transformational and transactional leadership. Journal of Applied
Psychology, 88, 207-21. doi:10.1037/0021-9010.88.2.207
Bass, B. M., & Steidlmeier, P. (1999). Ethics, character, and authentic transformational
leadership behavior. The Leadership Quarterly, 10, 181-217. doi:10.1016/S1048-
9843(99)00016-8

95
Barling, J., Loughlin, C., & Kelloway, E. K. (2002). Development and test of a model
linking safety-specific transformational leadership and occupational safety.
Journal of Applied Psychology, 87, 488-496. doi:10.1037/0021-9010.87.3.488
Bellg, A. J., Borrelli, B., Resnick, B., Hecht, J., Minicucci, D. S., Ory, M., . . .
Czajkowski, S. (2004). Enhancing treatment fidelity in health behavior change
studies: Best practices and recommendations from the NIH Behavior Change
Consortium. Health Psychology, 23(5), 443-451. doi:10.1037/0278-6133.23.5.443
Borgersen, H. C., Hystad, S. W., Larsson, G., & Eid, J. (2014). Authentic leadership and
safety climate among seafarers. Journal of Leadership & Organizational Studies,
21, 394-402. doi:10.1177/1548051813499612
Boyatzis, R. E., & Sala, F. (2004). The Emotional Competence Inventory (ECI). In G.
Geher (Ed.), Measuring emotional intelligence: Common ground and controversy
(pp. 147-180). Hauppauge, NY: Nova Science Publishers.
Burke, M. J., & Day, R. R. (1986). A cumulative study of the effectiveness of managerial
training. Journal of Applied Psychology, 71, 232-245. doi:10.1037/0021-
9010.71.2.232
Campbell, D. T., Stanley, J. C., & Gage, N. L. (1963). Experimental and quasi-
experimental designs for research. Boston, MA: Houghton Mifflin.
Cavazotte, F. S. C. N., Duarte, C. J. P., & Gobbo, A. M. C. (2013). Authentic leader, safe
work: The influence of leadership on safety performance. Brazilian Business
Review (English ed.), 10, 95-119.

96
Cherniss, C., Grimm, L. G., & Liautaud, J. P. (2010). Process-designed training. Journal
of Management Development, 29, 413-431. doi:10.1108/02621711011039196
Christian, M. S., Wallace, J. C., Bradley, J. C., & Burke, M. J. (2009). Workplace safety:
A meta-analysis of the roles of person and situation factors. Journal of Applied
Psychology, 94, 1103-1127. doi:10.1037/a0016172
Clapp-Smith, R., Vogelgesang, G. R., & Avery, J. B. (2009). Authentic leadership and
positive psychological capital: The mediating role of trust at the group level of
analysis. Journal of Leadership and Organizational Studies, 15, 277–240. doi
10.1177/1548051808326596
Clarke, S. (2006). The relationship between safety climate and safety performance: A
meta-analytic review. Journal of Occupational Health Psychology, 11, 315-327.
doi:10.1037/1076-8998.11.4.315
Clarke, S. (2013). Safety leadership: A meta-analytic review of transformational and
transactional leadership styles as antecedents of safety behaviors. Journal of
Occupational and Organizational Psychology, 86, 22-49. doi:10.1111/j.2044-
8325.2012.02064.x
Collins, J. C. (2001). Good to great: Why some companies make the leap . . . and others
don’t. New York, NY: HarperCollins.
Conchie, S. M., Taylor, P. J., & Donald, I. J. (2012). Promoting safety voice with safety-
specific transformational leadership: The mediating role of two dimensions of

97
trust. Journal of Occupational Health Psychology, 17, 105-115.
doi:10.1037/a0025101
Conger, J. A. (1989). The charismatic leader: Behind the mystique of exceptional
leadership. San Francisco, CA: Jossey-Bass.
Cook, T. D., & Campbell, D. T. (1979). Quasi-experimentation: Design and analysis
issues for field settings. Boston, MA: Houghton Mifflin.
Cooper, D. (2015). Effective safety leadership: Understanding types & styles that
improve safety performance. Professional Safety, 60, 49-53.
Crites, T. R. (1995). Reconsidering the cost and benefits of a formal safety program.
Professional Safety, 40(12), 28- 32. Retrieved from
http://www.asse.org/professional-safety/indexes/1995/
Denison, D. R. (1996). What is the difference between organizational culture and
organizational climate? A native's point of view on a decade of paradigm wars.
Academy of Management Review, 21, 619-654.
doi:10.5465/AMR.1996.9702100310
Eid, J., Mearns, K., Larsson, G., Laberg, J. C., & Johnsen, B. H. (2012). Leadership,
psychological capital and safety research: Conceptual issues and future research
questions. Safety Science, 50, 55-61. doi:10.1016/j.ssci.2011.07.001
Esmaeili, B., & Hallowell, M. R. (2012). Diffusion of safety innovations in the
construction industry. Journal of Construction Engineering & Management, 138,
955-963. doi:10.1061/(ASCE)CO.1943-7862.0000499

98
Fleming, M., & Lardner, R. (2002). Strategies to promote safe behaviors as part of a
health and safety management system (Report No. 430). Sudbury, UK: Health
Safety and Environment (HSE) Books.
Freeman, D. (2000). Posttraumatic stress disorder and the injured worker, Part I. The
Case Manager, 11(3), 49-53. doi:10.1016/S1061-9259(00)80065-X
Fusco, T., O'Riordan, S., & Palmer, S. (2015). Authentic leaders are . . . conscious,
competent, confident, and congruent: A grounded theory of group coaching
authentic leadership development. International Coaching Psychology Review,
10(2), 131-148. https://shop.bps.org.uk/publications/publication-by-
series/international-coaching-psychology-review/international-coaching-
psychology-review-vol-10-no-2-september-2015.html
Fusco, T., O'Riordan, S., & Palmer, S. (2016). Increasing leaders' self-concept-clarity in
the authentic leadership coaching group. The Coaching Psychologist, 12, 25.
Fusco, T., Palmer, S., & O’Riordan, S. (2011). Can coaching psychology help develop
authentic leaders? Part Two. The Coaching Psychologist, 7(2), 127-131.
Retrieved from
ttp://vbn.aau.dk/files/58698528/oms_coach_psy_2011.pdf#page=45
Gardner, W. L., Avolio, B. J., Luthans, F., May, D. R., & Walumbwa, F. (2005). Can you
see the real me? A self-based model of authentic leader and follower
development. The Leadership Quarterly, 16, 343-372.
doi:10.1016/j.leaqua.2005.03.003

99
Gardner, W. L., Cogliser, C. C., Davis, K. M., & Dickens, M. P. (2011). Authentic
leadership: A review of the literature and research agenda. The Leadership
Quarterly, 22, 1120-1145. doi:10.1016/j.leaqua.2011.09.007
Geller, E. S., Perdue, S. R., French, A. (2004). Behavior-based safety coaching: 10
guidelines for successful application. Professional Safety, 49(7), 42-49.
Geller, E. S., & Veazie, R. A. (2014) Behavior-based safety versus actively caring: From
other-directed compliance to self-directed commitment. Professional Safety,
59(10), 44-50. Retrieved from http://www.asse.org/professional-safety/archive/
Giallonardo, L. M., Wong, C. A., & Iwasiw, C. L. (2010). Authentic leadership of
preceptors: Predictor of new graduate nurses' work engagement and job
satisfaction. Journal of Nursing Management, 18, 993-1003. doi:10.1111/j.1365-
2834.2010.01126.x
Glowacki-Dudka, M., & Griswold, W. (2016). Embodying authentic leadership through
popular education at Highlander Research and Education Center: A qualitative
case study. Adult Learning, 27(3), 105-112. doi:10.177/1045159516651610
Granerud, L., & Rocha, R. S. (2011) Organizational learning and continuous
improvement of health and safety in certified manufacturers. Safety Science, 49,
1030-1039. doi:10.1016/j.ssci.2011.01.009
Grant, A. M., & Cavanagh, M. J. (2011). Coaching and positive psychology. In K. M.
Sheldon, T. B. Kashden, & M. F. Steger (Eds.), Designing positive psychology:

100
Taking stock and moving forward (pp. 293-309). New York, NY: Oxford
University Press.
Grant, A. M., Curtayne, L., & Burton, G. (2009). Executive coaching enhances goal
attainment, resilience and workplace well-being: A randomized controlled study.
The Journal of Positive Psychology, 4, 396–407.
doi:10.1080/17439760902992456
Grant, A. M., Green, S. L., & Rynsaardt, J. (2010). Developmental coaching for high
school teachers: Executive coaching goes to school. Consulting Psychology
Journal: Practice and Research, 62, 151–168. doi:10.1037/a0019212
Grant, A. M., & O'Connor, S. A. (2010). The differential effects of solution-focused and
problem-focused coaching questions: A pilot study with implications for practice.
Industrial and Commercial Training, 42, 102-111.
doi:10.1108/00197851011026090
Grant, A. M., Passmore, J., Cavanagh, M. J., & Parker, H. M. (2010). Chapter 4. The
state of play in coaching today: A comprehensive review of the field. In G. P.
Hodgkinson, & J. K. Ford (Eds.), International Review of Industrial and
Organizational Psychology 2010, Volume 25 (pp. 125–167). West Sussex, UK:
John Wiley & Sons.
Gray, D. (2014). Trends in safety leadership coaching. Professional Safety, 59(5), 35.
Retrieved from http://www.asse.org/professional-safety/archive/

101
Griffin, M. A., & Neal, A. (2000). Perceptions of safety at work: A framework for linking
safety climate to safety performance, knowledge, and motivation. Journal of
Occupational Health Psychology, 5, 347-358. doi:10.1037/1076-8998.5.3.347
Hannah, S. T., Walumbwa, F. O., & Fry, L. W. (2011). Leadership in action teams: Team
leader and member’ authenticity, authenticity strength, and team outcomes.
Personnel Psychology, 64, 771-802. doi:10.1111/j.1744-6570.2011.01225.x
Hmieleski, K. M., Cole, M. S., & Baron, R. A. (2012). Shared authentic leadership and
new venture performance. Journal of Management, 38, 1476-1499.
doi:10.1177/0149206311415419
Høivik, D., Tharaldsen, J. E., Baste, V., & Moen, B. E. (2009). What is most important
for safety climate: The company belonging or the local working environment? –
A study from the Norwegian offshore industry. Safety Science, 47, 1324-1331.
doi:10.1016/j.ssci.2009.04.001 04.001
Jones, S. R. G. (1992). Was there a Hawthorne effect? American Journal of Sociology,
98, 451-468. doi:10.1086/230046
Kinsler, L. (2014). Born to be me . . . who am I again? The development of Authentic
Leadership using evidence-based leadership coaching and mindfulness.
International Coaching Psychology Review, 9(1), 92-105.
https://shop.bps.org.uk/publications/publication-by-series/international-coaching-
psychology-review/international-coaching-psychology-review-vol-9-no-1-
december-2014.html

102
Leigh, J. (2011). Economic burden of occupational injury and illness in the United States.
Milbank Quarterly, 89, 728-772. doi:10.1111/j.1468-0009.2011.00648.x
Litwin, G., & Stringer, R. (1968). Motivation and organizational climate: Continued
empirical evidence. Boston, MA: Harvard University.
Liu, S., Liao, J., & Wei, H. (2015). Authentic leadership and whistleblowing: Mediating
roles of psychological safety and personal identification. Journal of Business
Ethics, 131, 107-119. doi:10.1007/s10551-014-2271-z
Luria, G. (2008). Climate strength – How leaders form consensus. The Leadership
Quarterly, 19(1), 42-53. doi:10.1016/j.leaqua.2007.12.004
Luthans, F., & Avolio, B. (2003). Authentic leadership developmental. In K. S. Cameron,
J. E. Dutton, R. E. Quinn (Eds.), Positive organizational scholarship:
Foundations of a new discipline (pp. 241–261). San Francisco, CA: Berrett-
Koehler.
Mathis, T. L. (2009). Hard measurements for soft science: Behavior-based safety has
evolved. Industrial Engineer, 41(5), 32-35. Retrieved from
https://proactsafety.com/uploads/file/articles/hardmeasurementsforsoftscience_be
haviorbasedsafetyhasevolved.pdf
McCambridge, J., Witton, J., & Elbourne, D. R. (2014). Systematic review of the
Hawthorne effect: New concepts are needed to study research participation
effects. Journal of Clinical Epidemiology, 67, 267-277.
doi:10.1016/j.jclinepi.2013.08.015

103
Mearns, K., Flin, R., Gordon, R., & Fleming, M. (2001). Human and organizational
factors in offshore safety. Work & Stress, 15, 144-160.
doi:10.1080/026783701102678370110066616
Mearns, K., Whitaker, S. M., & Flin, R. (2001). Benchmarking safety climate in
hazardous environments: A longitudinal, interorganizational approach. Risk
Analysis, 21, 771-786. doi:10.1111/0272-4332.214149
Mearns, K. J., & Flin, R. (1999). Assessing the state of organizational safety – Culture or
climate? Current Psychology, 18, 5-17. doi:10.1007/s12144-999-1013-3
Miller, W. R., & Rollnick, S. (2002). Motivational interviewing: Preparing people for
change. New York, NY: Guilford Press.
Nahrgang, J. D., Morgeson, F. P., & Hofmann, D. A. (2011). Safety at work: A meta-
analytic investigation of the link between job demands, job resources, burnout,
engagement, and safety outcomes. Journal of Applied Psychology, 96, 71- 94.
doi.10.1037/a0021484
National Safety Council. (2013). Near miss reporting systems. Retrieved from
http://www.nsc.org/WorkplaceTrainingDocuments/Near-Miss-Reporting-
Systems.pdf
Neuman, W. L., (2011) Social research methods: Qualitative and quantitative
approaches (7th ed.). Boston, MA: Allyn & Bacon.

104
Nielsen, M. B., Eid, J., Hystad, S. W., Sætrevik, B., & Saus, E. R. (2013a). A brief safety
climate inventory for petro-maritime organizations. Safety Science, 58, 81-88.
doi:10.1016/j.ssci.2013.04.002
Nielsen, M. B., Eid, J., Hystad, S. W., Sætrevik, B., & Saus, E. (2013b). Brief Norwegian
Offshore Risk and Safety Climate Inventory. Psyctests. Retrieved from
http://corporate.psychtests.com/
Onorato, M., & Zhu, J. (2014). An empirical study on the relationships between authentic
leadership and organizational trust by industry segment. SAM Advanced
Management Journal, 79, 26-39. Retrieved from http://samnational.org/wp-
content/uploads/2013/05/Journal_2014Winter.pdf
O’Sullivan, I., Orbell, S., Rakow, T., & Parker, R. (2004). Prospective research in health
service settings: Health psychology, science and the 'Hawthorne' effect. Journal
of Health Psychology, 9, 355-359. doi:10.1177/1359105304042345
Passmore, J. (2011). Motivational Interviewing -- a model for coaching psychology
practice. Coaching Psychologist, 7(1), 36-40. Retrieved from
https://shop.bps.org.uk/publications/publication-by-series/the-coaching-
psychologist/the-coaching-psychologist-vol-7-no-1-june-2011.html
Passmore, J. (2013). Motivational Interviewing: Reflecting on ethical decisions in MI.
Coaching Psychologist, 9(2), 112-116.
https://shop.bps.org.uk/publications/publication-by-series/the-coaching-
psychologist/the-coaching-psychologist-vol-9-no-2-december-2013.html

105
Passmore, J., Krauesslar, V., & Avery, R. (2015). Safety coaching: A literature review of
coaching in high hazard industries. Industrial and Commercial Training, 47, 195-
200. doi:10.1080/10803548.2015.1017941
Probst, T. M., & Estrada, A. X. (2010). Accident under-reporting among employees:
Testing the moderating influence of psychological safety climate and supervisor
enforcement of safety practices. Accident Analysis & Prevention, 42, 1438-1444.
doi:10.1016/j.aap.2009.06.027
Prochaska, J., Norcross, J. & DiClemente, C. (1994). Changing for good: A revolutionary
six-stage program for overcoming bad habits and moving your life positively
forward. New York, NY: HarperCollins.
Schaubroeck, J., Carmeli, A., Bhatia, S., & Paz, E. (2016). Enabling team learning when
members are prone to contentious communication: The role of team leader
coaching. Human Relations, 69, 1709-1727. doi:10.1177/0018726715622673
Schein, E. H. (1985). Organizational culture and leadership. Rochester, NY: University
of Illinois at Urbana-Champaign.
Schein, E. H. (2010). Organizational culture and leadership (4th ed.). San Francisco,
CA: Jossey Bass.
Schilling, J., & Schyns, B. (2014). The causes and consequences of bad leadership.
Zeitschrift Fur Psychologie [English version], 222, 187-189. doi:10.1027/2151-
2604/a000185

106
Shorrock, S. T., Mearns, K. J., Laing, C., & Kirwan, B. (2011). Developing a safety
culture questionnaire for European Air Traffic Management: Learning from
experience. In M. Anderson (Ed.), Contemporary ergonomics and human factors
2011: Proceedings of the International Conference on Contemporary Ergonomics
and Human Factors 2011. Boca Raton, FL: Taylor & Francis.
Simon, S. I., & Cistaro, P. A. (2009). Transforming safety culture grassroots-
led/management-supported change at a major utility. Professional Safety, 54(4),
23–33. Retrieved from http://www.asse.org/professional-safety/indexes/2009/
Spence, G. B., & Deci, E. L. (2016). Self-determination theory within coaching contexts:
Supporting motives and goals that promote optimal functioning and well-being. In
S. David, D. Clutterbuck, & D. Megginson (Eds), Beyond goals: Effective
strategies for coaching and mentoring (pp. 85-108). New York, NY: Routledge.
Tharaldsen, J. E., Olsen, E. & Rundmo, T. (2008). A longitudinal study of safety climate
on the Norwegian continental shelf. Safety Science, 46, 427-439.
doi:10.1016/j.ssci.2007.05.006
Theeboom, T., Beersma, B., & van Vianen, A. E. (2014). Does coaching work? A meta-
analysis on the effects of coaching on individual level outcomes in an
organizational context. The Journal of Positive Psychology, 9, 1–18.
doi:10.1080/17439760.2013.837499
Tichy, N. M. & Devanna, M. A. (1986). The transformational leader. New York, NY:
Wiley.

107
Toor, S. U. R., & Ofori, G. (2009). Authenticity and its influence on psychological well‐
being and contingent self‐esteem of leaders in Singapore construction sector.
Construction Management and Economics, 27, 299-313.
doi:10.1080/01446190902729721
Treff, M. E., & Earnest, S. (2016). Facilitation in action: The reflective practice of two
facilitators using a participation training model. Adult Learning, 27, 113-119.
doi:10.1177/1045159516651612
Trochim, W. M. K. (2006). Research methods knowledge base (2nd ed.). San Francisco,
CA: Jossey-Bass.
U.S. Department of Labor. (2014). Occupational outlook handbook, OOH FAQs.
Retrieved from http://www.bls.gov/ooh/about/ooh-faqs.htm.
van der Graaf, G. O., Bryden, R., Zijlker, V. A., & Hudson, P. (2004). Hearts and minds
change programmers make a difference. Proceedings of the SPE International
Conference on Health, Safety and Environment in Oil and Gas Exploration and
Production (pp. 77–82). Calgary, CA: Society of Petroleum Engineers.
Veltri, A., Pagell, M., Johnston, D., Tompa, E., Robson, L., Amick III, B. C., . . .
Macdonald, S. (2013). Understanding safety in the context of business operations:
An exploratory study using case studies. Safety Science, 55, 119-134.
doi:10.1016/j.ssci.2012.12.008
Walumbwa, F. O., Avolio, B. J., Gardner, W. L., Wernsing, T. S., & Peterson, S. J.
(2008). Authentic leadership: Development and validation of a theory-based

108
measure†. Journal of Management, 34(1), 89-126.
doi:10.1177/0149206307308913
Wang, Y. N. (2016). Balanced authenticity predicts optimal well-being: Theoretical
conceptualization and empirical development of the authenticity in relationships
scale. Personality and Individual Differences, 94, 316-323.
doi:10.1016/j.paid.2016.02.001
Wilkins, J. R. (2011). Construction workers’ perceptions of health and safety training
programmes. Construction Management & Economics, 29, 1017-1026.
doi:10.1080/01446193.2011.633538
Wilkins, J. R., Chen, J. C., & Jenkins, J. L. (2014). Rethinking workplace health & safety
training: Utilizing the translanguaging instructional method to reach foreign-born
construction workers of Hispanic origin. Journal of Safety, Health &
Environmental Research, 10, 135-144. Retrieved from
http://www.asse.org/assets/1/7/JSHER_V10N21.pdf
Wong, C. A., Laschinger, H. S., & Cummings, G. G. (2010). Authentic leadership and
nurses' voice behaviour and perceptions of care quality. Journal of Nursing
Management, 18(8), 889-900. doi:10.1111/j.1365-2834.2010.01113.
Yalom, I. D., & Leszcz, M. (2005). The theory and practice of group psychotherapy (5th
ed.). New York, NY: Basic Books.

109
Yule, S., Flin, R., & Murdy, A. (2007). The role of management and safety climate in
preventing risk-taking at work. International Journal of Risk Assessment &
Management, 7, 137-151. doi:10.1504/IJRAM.2007.011727
Zacharatos, A., Barling, J., & Kelloway, E. K. (2000). Development and effects of
transformational leadership in adolescents. The Leadership Quarterly, 11, 211-
226. doi:10.1016/S1048-9843(00)00041-2
Zohar, D. (1980). Safety climate in industrial organizations: Theoretical and applied
implications. Journal of Applied Psychology, 65, 96-106. doi:10.1037/0021-
9010.65.1.96
Zohar, D. (2000). A group-level model of safety climate: Testing the effect of group
climate on microaccidents in manufacturing jobs. Journal of Applied Psychology,
85, 587-596. doi:10.1037/0021-9010.85.4.587
Zohar, D. (2002). Modifying supervisory practices to improve subunit safety: A
leadership-based intervention model. Journal of Applied Psychology, 87, 156-163.
doi:10.1037/0021-9010.87.1.156
Zohar, D. (2010). Thirty years of safety climate research: Reflections and future
directions. Accident Analysis & Prevention, 42, 1517-1522.
doi:10.1016/j.aap.2009.12.019
Zohar, D. (2014). Safety climate: Conceptualization, measurement, and improvement. In
B. Schneider & K. M. Barbera (Eds.), The Oxford handbook of organizational
climate and culture (pp. 317-334). Oxford, UK: Oxford University Press.

110
Zohar, D., & Luria, G. (2005). A multilevel model of safety climate: Cross-level
relationships between organization and group-level climates. Journal of Applied
Psychology, 90, 616-628. doi:10.1037/0021-9010.90.4.616
Zohar, D., & Polachek, T. (2014). Discourse-based intervention for modifying
supervisory communication as leverage for safety climate and performance
improvement: A randomized field study. Journal of Applied Psychology, 99, 113-
124. doi:10.1037/a0034096