the immune system - rutgers universitycasegroup.rutgers.edu/lnotes/immuneb.pdf · the immune system...
TRANSCRIPT

The immune systemBiophysical Chemistry 1, Fall 2010
B-cells and T-cellsCatalytic antibodies
Reading assignment: Chap. 14

B-cell or humoral immunity uses a protein G fold438 � A Textbook of Structural Biology
FA
phagocytosis or activation of the complement system. Phagocytosis is the ingestionof the foreign material into white blood cells. The complement system consists of asequence of serine proteases that activate one another. This finally leads to thekilling of the foreign cell by lysis of its membranes.
To be able to specifically recognize the vast number of molecules, the anti-bodies or immunoglobulins produced by B cells need to have an enormous vari-ability. How is this achieved? To explain this, we first need to describe theorganization of the antibodies. Antibodies are built of repeats of the same type ofdomain, a β sandwich with two layers of antiparallel β strands (Fig. 14.1).
14.1.1 The IgG Molecule
Antibodies are built of two types of polypeptide chains, heavy and light. Thelight chains are always composed of two domains, each of which contains about110 amino acid residues. There are two main types of light chains, κ and λ. Theheavy chains have at least four domains. In mammals, there are five different anti-body classes with different functional properties and locations in the organism:IgA, IgD, IgE, IgG, and IgM. Other vertebrates have a more limited setup of anti-bodies. They all have different types of heavy chains and can form differentoligomers. In plasma, the IgG molecule is the most common type of immunoglob-ulin. It has two heavy and two light chains with a total of 12 Ig-domains(Fig. 14.2). The amino terminal domains of a heavy chain and a light chain pair toform the antigen-binding domains. An IgG molecule has two identical sites atwhich it can bind antigens.
FIGURE 14.1 � The immunoglobulin (Ig) fold. Many proteins in the immune system have thisfold, as well as proteins involved in cell adhesion and the nervous system. Left: ribbon represen-tations of the fold of a constant domain and a variable domain (PDB: 1AQK, heavy chain).Right: a simplified representation of the β sandwich that constitutes the Ig fold. The constantdomain has a four-stranded and a three-stranded antiparallel sheet, but in the variable domainthere are two extra β strands C’ and C’’ (darker blue). The red connections between some strandsin the variable domain are the complementary-determining regions, CDR1, CDR2 and CDR3,consecutively along the polypeptide chain. These regions form the antigen-binding surface.
AB
C
D
E
FG
ABD
E
CF
GC’
C’’
N
C C
N
Constant domain Variable domain
b541_Chapter-14.qxd 12/29/2008 2:44 PM Page 438

IgG’s have a characteristic Y-shape
The Ig-domains normally interact in a pairwise manner. They can be hetero-pairs as in the pairs of domains between the heavy and light chains in the Fabfragments or homo-pairs as in the Fc fragment (Figs. 14.2 and 14.3). There are alsohomodimers of light chains called Bence–Jones proteins produced in large quan-tities by certain types of cancer cells.
The Immune System � 439
FA
FIGURE 14.2 � The IgG molecule is built of four multidomain chains, two heavy (blue domains)and two light chains (red domains). The heavy chains are composed of four domains while thelight chains have two domains. The light blue and red domains are the variable domains wherethe antigen binding occurs. The darker domains are the constant domains. The heavy chainsare linked to each other and the light chains are each linked to one of the heavy chains by disul-fide bonds (yellow). If IgG is treated by a proteolytic enzyme such as papain, the heavy chainsare cleaved between the first and second constant domains such that three fragments aregenerated. The fragment composed only of heavy chain constant domains is called Fc (as in“fragment crystalline”). When it was first produced, it crystallized spontaneously in the dialysistube! The two identical fragments are called Fabs (fragment antigen-binding). The antigen(purple) binds between the two variable domains of each Fab fragment.
N
N NN
C
C C
C papain
Fab Fab
Fc
FIGURE 14.3 � A detailed structure of IgG in two orientations. The heavy chain consists of theVH, CH1, CH2, and CH3 domains and the light chain of the VL and the CL domains. The Fab unitsare seen above and have very flexible links to the Fc unit below. The chains are connected bydisulfide bonds. All cysteines that form disulfide bonds are shown and the ones that connect thechains are indicated by arrows. The Fc unit has carbohydrate modifications at the CH2 domain,drawn as ball-and-stick models (PDB: 1IGT).
b541_Chapter-14.qxd 12/29/2008 2:44 PM Page 439

IgG’s can be rather flexible
The Ig-domains normally interact in a pairwise manner. They can be hetero-pairs as in the pairs of domains between the heavy and light chains in the Fabfragments or homo-pairs as in the Fc fragment (Figs. 14.2 and 14.3). There are alsohomodimers of light chains called Bence–Jones proteins produced in large quan-tities by certain types of cancer cells.
The Immune System � 439
FA
FIGURE 14.2 � The IgG molecule is built of four multidomain chains, two heavy (blue domains)and two light chains (red domains). The heavy chains are composed of four domains while thelight chains have two domains. The light blue and red domains are the variable domains wherethe antigen binding occurs. The darker domains are the constant domains. The heavy chainsare linked to each other and the light chains are each linked to one of the heavy chains by disul-fide bonds (yellow). If IgG is treated by a proteolytic enzyme such as papain, the heavy chainsare cleaved between the first and second constant domains such that three fragments aregenerated. The fragment composed only of heavy chain constant domains is called Fc (as in“fragment crystalline”). When it was first produced, it crystallized spontaneously in the dialysistube! The two identical fragments are called Fabs (fragment antigen-binding). The antigen(purple) binds between the two variable domains of each Fab fragment.
N
N NN
C
C C
C papain
Fab Fab
Fc
FIGURE 14.3 � A detailed structure of IgG in two orientations. The heavy chain consists of theVH, CH1, CH2, and CH3 domains and the light chain of the VL and the CL domains. The Fab unitsare seen above and have very flexible links to the Fc unit below. The chains are connected bydisulfide bonds. All cysteines that form disulfide bonds are shown and the ones that connect thechains are indicated by arrows. The Fc unit has carbohydrate modifications at the CH2 domain,drawn as ball-and-stick models (PDB: 1IGT).
b541_Chapter-14.qxd 12/29/2008 2:44 PM Page 439
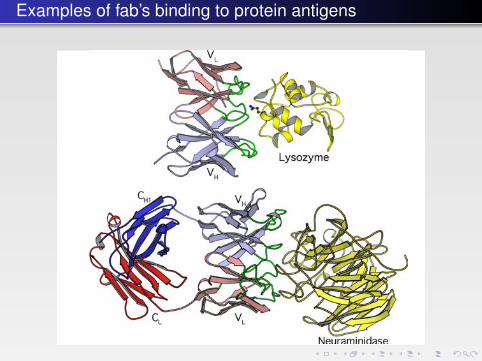
Examples of fab’s binding to protein antigens The Immune System � 441
FA
FIGURE 14.4 � The binding of monoclonal antibodies to their antigens. Top: the variable domainsof the Fab fragment bind a lysozyme molecule (PDB: 1VFB). Bottom: an Fab fragment binds theprotein neuraminidase from the influenza virus (PDB: 1NCA). The hypervariable loops (CDRs) areshown in green.
FIGURE 14.5 � Light-chain genetic rearrangement and expression. The different genetic segmentscan be combined in very many different ways. The undifferentiated cell has the complete set ofantibody genes. During differentiation, a V gene becomes linked to a J gene in a random way.In the subsequent transcription of the DNA to a pre-mRNA, a further elimination is made. ThemRNA is subsequently spliced into a mature mRNA that is translated into a specific light chain.
V1 V2 Vn-1 Vn J1 J2 J3 J4 J5 C
V3 V4 J2 J3 J4 C
V4 J2 J3 J4 C
V4 J2 C
Gene elements for the light chain
Recombination
Transcription
Splicing
Translation
b541_Chapter-14.qxd 12/29/2008 2:44 PM Page 441

Genetic selection processes are key
The Immune System � 441
FA
FIGURE 14.4 � The binding of monoclonal antibodies to their antigens. Top: the variable domainsof the Fab fragment bind a lysozyme molecule (PDB: 1VFB). Bottom: an Fab fragment binds theprotein neuraminidase from the influenza virus (PDB: 1NCA). The hypervariable loops (CDRs) areshown in green.
FIGURE 14.5 � Light-chain genetic rearrangement and expression. The different genetic segmentscan be combined in very many different ways. The undifferentiated cell has the complete set ofantibody genes. During differentiation, a V gene becomes linked to a J gene in a random way.In the subsequent transcription of the DNA to a pre-mRNA, a further elimination is made. ThemRNA is subsequently spliced into a mature mRNA that is translated into a specific light chain.
V1 V2 Vn-1 Vn J1 J2 J3 J4 J5 C
V3 V4 J2 J3 J4 C
V4 J2 J3 J4 C
V4 J2 C
Gene elements for the light chain
Recombination
Transcription
Splicing
Translation
b541_Chapter-14.qxd 12/29/2008 2:44 PM Page 441

B-cell or humoral immunity
The light chain, the β2-microglobulin subunit, is mainly associated with theα3 domain of the heavy chain. In class II, two chains both contribute elementsto the peptide-binding site (Fig. 14.7). Nevertheless, the binding site for thepeptide is designed in the same way in both types of MHC. The base is builtfrom an eight-stranded β sheet with a helix on each side of the peptide. Themolecular organization resembles a hot dog.
MHC class I present peptides derived from intracellular degradation of proteinsin the cytosol whereas class II present peptides from degradation of extracellularantigens in endosomal compartments.
The class I MHC molecules usually bind peptides 8–10 residues in length. Theconformation of the peptide is extended with anchor residues bound in speci-ficity pockets that differ in the alleles of MHC molecules. Since the ends of thebinding site are closed, longer peptides will bulge when bound. In the class IIbinding site, the bound peptide adopts the conformation of a left-handed poly-proline helix. The binding site is open at both ends allowing larger peptides toprotrude at either end. Thus, MHC class II can bind longer peptides than class I.
The Immune System � 443
FA
FIGURE 14.6 � The structure of major histocompatibility complex (MHC) proteins of class I (left)and class II (right). MHC class I has a light chain, β 2-microglobulin (β 2m, light green), and aheavy chain with three domains, α1 (yellow) α2 (orange) and α3 (brown), where the two firsttwo domains form the binding site for the peptide. The third domain and β 2-microglobulinboth have the immunoglobulin constant region fold (PDB: 1A1M). MHC class II has a similararrangement of four domains in two chains, but the connections between the domains aredifferent from those of class I (PDB: 1DLH).
b541_Chapter-14.qxd 12/29/2008 2:44 PM Page 443

Basic ideas of catalysis (again)

Catalytic antibodies
Binding Energy and Catalysis: The Implications for Transition-State Analogsand Catalytic Antibodies
Mary M. Mader and Paul A. Bartlett*
Department of Chemistry, Grinnell College, Grinnell, Iowa 50112-0806, and Department of Chemistry, University of California,Berkeley, California 94720-1460
Received November 21, 1996 (Revised Manuscript Received February 19, 1997)
ContentsI. Introduction 1281II. Transition-State Theory and Catalysis 1281III. Protein−Ligand Interactions: Forces Available for
Binding and Catalysis1284
IV. Transition-State Analog Inhibitors: Qualitativeand Quantitative Analysis
1285
V. Transition-State Analogs and Catalytic Antibodies 1289A. Kinetic Issues 1290B. Structural Issues 1292
1. Shortcomings in Hapten Design 12922. Fidelity of the Replica 12943. Antibody Diversity 1296
C. Thermodynamic Issues 1296D. Limitations from the Immune Process Itself 1297
1. Binding Energy Available 12972. Time Scale of Antibody Generation 1297
E. Intervention 12971. Alternative Immunization Strategies 12982. Alternative Selection Strategies 12983. Site-Directed Mutagenesis and Chemical
Modification1299
VI. Conclusion 1299VII. Acknowledgments 1299VIII. References 1299
I. Introduction
Transition-state analogs, originally synthesized asenzyme inhibitors, now play an important role ashaptens for the generation of catalytic antibodies, andindeed have been critical for the development of thistechnology. Transition-state theory itself, and theapplication of transition-state analogs as enzymeinhibitors, have both been reviewed, and a criticalanalysis of their relevance to catalytic antibodies isnow appropriate. Important issues to examine arethe disparities between the binding affinities typi-cally observed for transition-state analogs and theirtheoretical values, and the rate accelerations ob-served for enzymatic processes and what can beexpected for catalytic antibodies. It is also useful toreview the criteria that have emerged for designatingspecific enzyme inhibitors as transition-state analogs.At the heart of these issues are the forces respon-
sible for stabilizing the transition-state form of theprotein-substrate complex in preference to theground-state complex. While the interactions be-tween the protein and its ligand are likely to be
similar for enzymes and antibodies, both the mech-anism and the goal of the selection processes bywhich these proteins are tailored differ significantly.
II. Transition-State Theory and Catalysis
Explanations for the extraordinary power of en-zymes to accelerate chemical reactions have beensought ever since this behavior was observed. Mod-ern explanations of the catalytic process date fromHaldane’s classic treatise on enzymatic activity,1through comments made by Pauling in the 1940s,2,3and have culminated in the currently accepted viewthat catalysis of a reaction rests on the enzyme’sability to stabilize the transition-state structure ofthe substrate relative to that of the ground state.4-7
Catalysis of a transformation often involves alterna-tive reaction pathways from that of the noncatalyzedtransformation, usually taking advantage of anenyme’s ability to reduce the molecularity of multi-step sequences.Transition-state theory itself can be traced to the
1930s and the work of Eyring.8 The theory rests ontwo basic assumptions: (1) that an “activated com-plex” in a chemical reaction is formed from thereactant(s) as if in equilibrium with them, and (2)that the rate of the chemical reaction is governed bythe decomposition of this activated complex to prod-ucts. In a typical chemical reaction, the potentialenergy surface consists of two distinct regions, cor-responding to reactant(s) and product(s), separatedby an energy barrier at a saddle point on the surface.The term “transition state” is applied to the structurerepresented by this saddle point, although the “ac-tivated complex” more realistically corresponds toany of the vibrational states in the vicinity of thissaddle point that cross over from reactant to product.The Eyring equation, eq 1, describes the rate constantk of a chemical reaction in terms of a transmissioncoefficient κ, the frequency of the normal modeoscillation ν, and a pseudoequilibrium constant Kq forformation of the activated complex from reactants.Except for reactions in which tunneling is involved,κ is close to unity. The value of ν depends on thespecific reaction; it is the product of translational,rotational, vibrational, and electronic partition func-tions, and it reflects the rate at which the activatedcomplex itself decomposes. As a pseudoequilibriumconstant, Kq indicates that the population of theactivated complex, and hence the reaction rate, bearsa relationship to temperature and to the activation
1281Chem. Rev. 1997, 97, 1281−1301
S0009-2665(96)00435-9 CCC: $28.00 © 1997 American Chemical Society
pending on the concentration of substrate,11,12 as-suming the association and dissociation steps are notrate-limiting. At low substrate concentration, [S] <Km, any alteration in enzyme structure that increasesthe binding interaction between enzyme and sub-strate will increase the rate of reaction (lowering Kmincreases kcat/Km). However, when [S] > Km, theenzyme is saturated with substrate and furtherenhancement in affinity for the ground-state form ofthe substrate would be without effect. This relation-ship is readily appreciated by recognizing that thereaction rate at high [S] (eq 7) is independent of Km.As long as the chemical step (kcat) is rate limiting,any change that leads to an increase in the affinityof the transition-state relative to the ground state willlead to a faster reaction: this difference in bindingaffinity is directly related to kcat, which appears inboth rate expressions eqs 6 and 7. Indeed, prefer-ential binding of the transition-state form of thesubstrate in comparison with the ground-state formis the central concept in catalysis.The relationship between transition-state stabili-
zation and enzymatic catalysis is effectively illus-trated by the thermodynamic cycle depicted in Figure1. This formalism originated with Kurz13 and waslater elaborated by Wolfenden14,15 and Lienhard16,17in their reviews of transition-state analogs. Thedesignations E, S, and P refer to enzyme, substratein the ground-state form, and product, respectively;the transition-state structure is represented by Sq.This thermodynamic box relates the dissociationconstant KS and the hypothetical dissociation con-stant KTS to the pseudoequilibrium constants Kun
q
and Kcatq for the noncatalyzed and the enzyme-
catalyzed reactions, respectively (eq 8). With theassumption that the values of κ and ν are comparablefor the catalyzed and uncatalyzed processes, thisequation can be combined with eq 1 to relate thehypothetical dissociation constant for the transitionstate structure, KTS, to that of the substrate, KS, bythe ratio of the uncatalyzed and catalyzed rateconstants, kun and kcat, as reflected in eq 9. Theimplication of this expression is significant: thetransition-state structure is bound to an enzyme withan enhancement in affinity over the ground-stateproportional to the increase in the rate constant forthe catalyzed over the uncatalyzed reaction.
Extrapolation of this analysis to a two-substratereaction requires introduction of an additional term,
Kbi, the hypothetical dissociation constant of a bimo-lecular complex of the two substrates (Figure 2, eq10). This term is required in order to correct for thedifference in molecularity between the noncatalyzedand catalyzed reactions. The expressions 1/Kbi (M-1)and k1 (s-1) in this case correspond to a dissection ofthe “observed”, bimolecular rate constant for thenoncatalyzed process, kun (M-1 s-1), into terms thatreflect juxtaposition of the two substrate moleculesin their ground states and their promotion to thetransition state. Enzymatic rate enhancement in thissituation results from the entropic advantage ofbringing the two molecules together in the active site,in addition to the stabilization of transition state overground state once they are bound. As eq 11 reveals,this entropic component is also reflected in an ad-ditional factor for binding the transition state inpreference to the separate substrates; the factor of1/Kbi has been estimated by Page and Jencks to beas significant as 10-8 M-1.11 This factor contributesin a similar way to the relationship between the rateconstants for the uncatalyzed and catalyzed processes(kun and kcat) and to that between the dissociationconstants for the transition state and the individualsubstrates (KTS and KS1KS2, respectively). This analy-sis (Figure 2) also emphasizes the difference betweena transition-state analog and a “multisubstrate”analog. The latter is intended to mimic the combinedsubstrates in their ground state form, and thereforeattains a binding advantage over KS1KS2 correspond-ing only to the factor 1/Kbi (eq 13).
The quantitative relationships embodied in theseexpressions require that a number of conditions besatisfied. First and foremost is that the noncatalyzedreaction take place by the same mechanism via thesame transition state as the enzyme-catalyzed trans-formation. In reality, this requirement is rarelyfulfilled, since most enzymatic mechanisms involve
Figure 1. Thermodynamic box illustrating relationshipbetween ground-state and transition-state binding for anenzyme with a single substrate.
KTS
Kunq
)KS
Kcatq
(8)
KTS )kunkcat
KS (9)
Figure 2. Thermodynamic box illustrating relationshipbetween ground-state, “multisubstrate”, and transition-state binding for an enzyme with two substrates.
KbiKTS
K1q
)KS1KS2
Kcatq
KbiKTS
k1)KS1KS2
kcat(10)
kun )k1Kbi
(11)
KTS )k1Kbi
KS1KS2
kcat)kunkcat
KS1KS2 (12)
KMS ) 1Kbi
KS1KS2 (13)
Binding Energy and Catalysis Chemical Reviews, 1997, Vol. 97, No. 5 1283

Testing the transition state stabilization idea
proportionality constant d and the noncatalyzed rateconstant kun gives eq 16.Wolfenden63 and Thompson64 were the first to
recognize the utility of this expression for evaluatingtransition-state analogs. If matching structural al-terations in a series of inhibitors and substrates aremade, such that the alteration does not affect the rateof the noncatalyzed reaction, then a linear relation-ship with slope of one will be obtained from plottinglog Ki against log Km/kcat, if the inhibitors are transi-tion-state analogs. This relationship holds regardlessof the magnitude of the inhibition constants, sincethe proportionality d from eq 15, along with theunmeasurable kun, become part of the invariant logdkun. For this analysis to be valid, of course, it mustalso be the case that there is no change in rate-limiting step in the enzyme-catalyzed transformationamong the various substrates.The most extensive applications of this approach
have involved the peptidases, because it is for theseenzymes that regular variation in substrate structureis most permissible, especially at substrate sites thatdo not significantly affect the rate of the noncatalyzedreaction. Correlations between inhibitor Ki andsubstrate Km/kcat have been demonstrated for thephosphorus-containing peptide inhibitors of thermol-ysin,23,65 carboxypeptidase A,66 and pepsin.44 Thecorrelations observed for the thermolysin inhibitorsalready described, the phosphonamidates 1nn, thephosphinates 1cn, the phosphonates 1on, and theesters 1no, demonstrate many of the points madeabove. Thermolysin catalyzes the direct addition ofa water molecule to the peptide bond, generating ahigh energy, tetrahedral intermediate 2 (Figure 3).In geometry and in some electronic aspects,50 thetetrahedral PO2
- moiety mimics this geminal diol.Each series among these inhibitors shows a slopeclose to one in the graph of log Ki against log Km/kcatfor the related peptide substrates (Figure 3). Withina given series, the structural variations are at theP2′ residue and should not affect kun significantly,which is an important consideration.It is important to recognize the meaning of the
slope of the line through these data points. It doesnot represent a measure of how well the inhibitorapproximates the transition state; as indicated by eq16, that metric, d, along with kun, only contributesto the intercept of line. Since the logarithm of anequilibrium constant is directly proportional to thefree energy of binding, a slope of 1 in the correlationof eq 16 means that a structural alteration leadingto a given incremental change in the binding energyof the transition state produces the same effect in theinhibitors, which is a reasonably intuitive definitionof transition-state analogy.This approach can only gauge the degree to which
the varied part of the inhibitor structure mimics thecorresponding region of the transition state, and itlogically depends on the substrates and inhibitorsbinding in the same fashion across the series. Thetightness of the correlation may in fact provide anindication of the degree to which these bindinggeometries remain constant. The conclusion that canbe drawn from each of these correlations is that theP2′ residues interact with the protein active site in
the same manner that they do in the transition state.Except for the geometry of the phosphorus moiety,which presumably allows the P2′ residues to adoptthe transition-state orientation, these results do notreveal anything about the transition-state mimicryof any other part of the molecule, since those interac-tions are a constant feature across each series.Although the correlations of Figure 3 only probe
the geometric similarity of the phosphorus moietyto the tetrahedral carbon, i.e., that characteristicwhich affects the orientation of the P2′ side chain in
Figure 3. Comparison of Ki values for phosphonateinhibitors of thermolysin with Km/kcat values for the cor-responding substrates.23,65 The diagonal lines correspondto slopes of 1.
Binding Energy and Catalysis Chemical Reviews, 1997, Vol. 97, No. 5 1287
Proto-typical transition-state analogues
tion as an equilibrium effect) has been suggested fora hydrolytic enzyme,107 but it does not appear to bea general explanation for the slow turnover of Ab‚Scomplexes. Product inhibition may be a more com-mon limitation for ligase-type catalysts, for which theproduct is likely to bind more tightly than the sub-strates,108,109 but it is not responsible when slow turn-over is observed at the outset of the reaction. Morecritical reasons for the poor performance of TSanalog-based catalytic antibodies may be (1) our in-ability to design haptens that can induce the requiredactive-site geometry and functionality; (2) a break-down in the relationship between substrate bindingand catalysis; and (3) fundamental limitations in thebiological process that produces the antibodies. Weaddress each of these possibilities in turn.
B. Structural Issues
1. Shortcomings in Hapten DesignOur imperfect ability to devise a stable mimic for
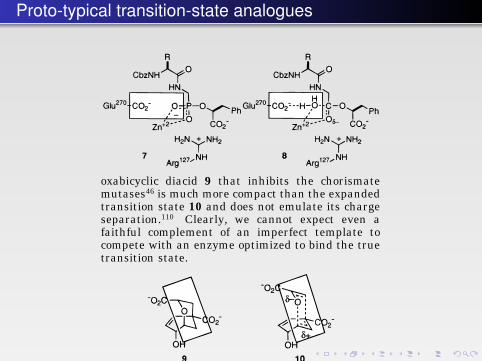
the fleeting structure of a transition state will alwaysbe a limitation. The fractional bond orders, extendedbond lengths, expanded valences, distorted bondangles, and high degrees of charge separation intransition state structures cannot be reproduced inany stable organic molecule. Even the “best” transi-tion-state analog enzyme inhibitors fall short of thisgoal. Phosphonate peptide analogs are potent inhibi-tors of zinc and aspartic peptidases, and as discussedabove, they have been shown to mimic the relevanttransition states in some geometric respects,23,66 and,for one enzyme, in the electronic character of one ofthe oxyanions.50 However, there are obvious short-comings; for example, the unprotonated, anionicnature of the other oxyanion in the phosphonate isthe reverse of the proton-donating, partially cationicwater molecule in the transition state (7 vs 8). The
oxabicyclic diacid 9 that inhibits the chorismatemutases46 is much more compact than the expandedtransition state 10 and does not emulate its chargeseparation.110 Clearly, we cannot expect even afaithful complement of an imperfect template tocompete with an enzyme optimized to bind the truetransition state.
Although the general structural features of immu-noglobulins are well known, detailed structures are
available for relatively few transition state analog-antibody complexes.101,108,111-114 Selective recognitionof antigens is achieved through interactions similarto those involved in enzyme-substrate binding, andinclude van der Waals interactions, hydrogen bond-ing, and other electrostatic and hydrophobic effects.However, enzymes are often distinguished fromantibodies by covalent bonding to substrates, by thepresence of exogenous functional groups such asmetals and cofactors, and by the concentration ofhighly polar side chains near the reacting center ofthe substrate. Indeed, while an antibody can use anensemble of weak interactions to bind its antigenwith adequate affinity, only enzymes appear to becapable of marshalling the strong forces, with highgradients over short distances, that are necessary todistinguish the subtle differences between groundstates and transition states.The structures of hydrolytic antibodies elicited by
three different phosphonate aryl ester haptens arerevealing both for their similarities and differences,and in comparison with the enzymes that theyimitate. All three antibodies: 17E8, from 11;111CNJ206, from 12 (n ) 1);113 and 48G7, from 12 (n )2),108 bind the aryl ester moieties of their haptens indeep pockets that are lined with aromatic andhydrophobic residues (Figure 8). Moreover, in each
case the anionic phosphonate is found near theentrance of the combining site, interacting withbackbone NH groups and different polar side chains.For each antibody, the cluster of polar groups in thevicinity of the phosphonate explains why the anionic,tetrahedral hapten binds with higher affinity thanthe neutral, planar substrate, and in turn why thetransition state is stabilized. One of the key func-tional groups that may be involved in the catalyticmechanism is His-35 on the heavy chain, one of theresidues that is found in all three antibodies. Al-though its precise role is still not defined, His-35Hmust be fairly accommodating, since the 17E8-catalyzed reaction proceeds via an acyl-antibodyintermediate while the others involve direct attackby water or hydroxide. In antibody 29G11, whichwas raised from 11 by the same immune responseas 17E8, the nucleophilic amino acid (serine-99 in theheavy chain) is replaced with a glycine, yet theantibody retains almost 20% of the activity (mea-sured as kcat/Km).112One of the obvious differences between the anti-
body combining sites and the active sites of hydrolyticenzymes is the extent to which the reactive center isexposed to the exterior. While the phosphonatemoieties of the bound haptens are near the entrancesof the antibody combining sites, in the peptidases thecatalytic machinery and the tetrahedral center areburied. By sequestering the reacting groups from thehigh dielectric environment of the solvent, the en-zyme is able to enhance the effect of polar interac-
1292 Chemical Reviews, 1997, Vol. 97, No. 5 Mader and Bartlett

T-cell immunity relies on peptide presentations
There are also non-classical MHC molecules which bind glycolipids and lipopep-tides to be presented to T cells. The variation in the binding sites on the differentMHC molecules accommodates the wide range of peptides that needs to be pre-sented (Fig. 14.8). The side chains of some of the residues in the bound peptideare exposed and are accessible for interaction with T-cell receptors.
444 � A Textbook of Structural Biology
FA
FIGURE 14.7 � The binding of peptides to MHC class I (left) and class II (right) molecules. Thepeptide-binding site is a groove with a base of eight β strands and two α helices surroundingthe peptide. The peptide is shown as a ball-and-stick figure. In MHC class I, some residues blockthe ends of the groove, while the ends of the groove are open in MHC class II.
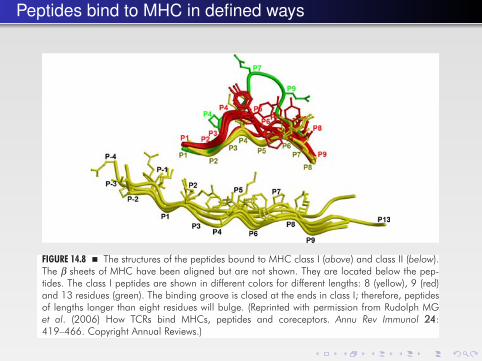
FIGURE 14.8 � The structures of the peptides bound to MHC class I (above) and class II (below).The β sheets of MHC have been aligned but are not shown. They are located below the pep-tides. The class I peptides are shown in different colors for different lengths: 8 (yellow), 9 (red)and 13 residues (green). The binding groove is closed at the ends in class I; therefore, peptidesof lengths longer than eight residues will bulge. (Reprinted with permission from Rudolph MGet al. (2006) How TCRs bind MHCs, peptides and coreceptors. Annu Rev Immunol 24:419–466. Copyright Annual Reviews.)
b541_Chapter-14.qxd 12/29/2008 2:44 PM Page 444
Peptides bind to MHC in defined ways
There are also non-classical MHC molecules which bind glycolipids and lipopep-tides to be presented to T cells. The variation in the binding sites on the differentMHC molecules accommodates the wide range of peptides that needs to be pre-sented (Fig. 14.8). The side chains of some of the residues in the bound peptideare exposed and are accessible for interaction with T-cell receptors.
444 � A Textbook of Structural Biology
FA
FIGURE 14.7 � The binding of peptides to MHC class I (left) and class II (right) molecules. Thepeptide-binding site is a groove with a base of eight β strands and two α helices surroundingthe peptide. The peptide is shown as a ball-and-stick figure. In MHC class I, some residues blockthe ends of the groove, while the ends of the groove are open in MHC class II.
FIGURE 14.8 � The structures of the peptides bound to MHC class I (above) and class II (below).The β sheets of MHC have been aligned but are not shown. They are located below the pep-tides. The class I peptides are shown in different colors for different lengths: 8 (yellow), 9 (red)and 13 residues (green). The binding groove is closed at the ends in class I; therefore, peptidesof lengths longer than eight residues will bulge. (Reprinted with permission from Rudolph MGet al. (2006) How TCRs bind MHCs, peptides and coreceptors. Annu Rev Immunol 24:419–466. Copyright Annual Reviews.)
b541_Chapter-14.qxd 12/29/2008 2:44 PM Page 444

T-cell immunity involves a complex of many proteins
14.2.2 T-cell ReceptorsT-cell receptors (TCRs) are located on the T-cell surfaces. Apart from a transmem-brane region and a short cytoplasmic tail, they have the same general domainstructure as antibody Fab fragments. They have constant and variable Ig-likedomains and they are composed of α and β, or γ and δ chains. Both types arelinked by disulfide bridges in a manner similar to the Ig molecules. While theαβ TCRs interact with antigenic peptides bound to MHCs, the γδ TCRs binddirectly to pathogen-derived glycoproteins or non-classical MHC molecules. As in
The Immune System � 445
FA
FIGURE 14.9 � The interactions between MHC molecules and T-cell receptors. Left: orthogonalviews of the extracellular V and C domains of the T-cell receptor α and β chains bound toHLA-A201 (class I). A viral peptide is bound to the MHC molecule. Right: Variable domains ofT-cell receptors D10 α and β chains bound to MHC I-Ak (class II). The MHC molecule is shownbelow and the bound peptide is seen in the groove (PDB: 1BD2 and 1D9K). A schematic viewof the interactions are shown below.
TCR
β α
T-cell
Antigen-producing cell
MHC
Class I
Peptide
TCR
β α
T-cell
Antigen-producing cell
MHC
Class II
Peptide
b541_Chapter-14.qxd 12/29/2008 2:44 PM Page 445

T-cell immunity, again
antibody Fabs, the regions of the TCRs that interact with MHC plus bound pep-tide are called complementarity-determining regions (CDRs).
The CDRs interact with exposed sidechains of the bound peptide but alsowith the MHC α helices that embed the peptide (Fig. 14.9). The variable domainof the α chain (Vα) is in contact with the N-terminal part of the antigen peptidewhereas Vβ contacts the C-terminal region. This binding frequently leads to adiagonal orientation of the peptide relative to the receptor, but the variation issignificant. The relative orientation of the receptor and the MHC complex couldbe important for T-cell signaling, but there is no full understanding of how thisis transmitted into the cell.
446 � A Textbook of Structural Biology
FA
FIGURE 14.10 � The interaction between the D1 domain of CD4 (cyan) and the MHC class IIcomplex. The bound peptide is shown as a ball-and-stick model (PDB: 1JL4). Below: schematicview of the interactions between the TCR co-receptors CD8 and CD4 with MHC class I and II,respectively. The co-receptors interact with the underside of the MHC molecules, opposite thepeptide-binding site.
TCR
β α
T-cell
Antigen-producing cell
MHC
Class I
CD8
αβ
Peptide
TCR
β α
T-cell
Antigen-producing cell
MHC
Class II
CD4
Peptide
b541_Chapter-14.qxd 12/29/2008 2:44 PM Page 446

T-cell immunity
14.2.2.1 CD8 or CD4 assist the TCR in its interaction with MHC
TCRs are assisted in their interactions with MHC molecules by the co-receptorsCD4 and CD8. TCR, CD4, and CD8 are all anchored in the T-cell membrane.A number of crystallographic structures describe these molecules and their inter-actions. CD8 is a heterodimer (the subunits are called α and β) where eachmonomer is composed of an Ig domain, a long linker and a transmembrane helix.CD4 is a monomeric protein composed of four Ig domains (D1–D4) of which D1contacts MHC class II.
CD4 and CD8 interact with almost the same conserved regions, oppositethe peptide binding side, on the underside of MHC class II and class I molecules,respectively (Fig. 14.10). CD4 is also the primary cellular contact at infectionswith HIV1. CD4 interacts with the viral spike protein gp120. This interactioninvolves the same surface of CD4 but is much stronger than the interaction withMHC class II.
14.2.2.2 CD3 accessory molecules signal the state of the TCR molecules
TCRs have a very small intracellular domain, insufficient for transfer of signals tothe cellular machinery. Instead, TCRs are associated with three types of CD3accessory molecules that contain domains involved in intracellular signaling.There are two types of heterodimers (γε and δε) of CD3, and these associate withthe two chains of the TCR and a type of homodimer molecule (ζζ ) into a complexof eight chains, each traversing the membrane. The extracellular domains ofthe CD3γε and CD3δε heterodimers consist of side-by-side interacting Ig folds
The Immune System � 447
FA
FIGURE 14.11 � Left: a schematic illustration of the interactions between TCRs and CD3s inthe T cells. The CD3γε and CD3δε are heterodimers that interact with TCR. Their location inthe membrane defines their interactions and the intracellular signals transmitted. Right: the extra-cellular domains of the CD3-ε/δ dimer associate with an approximate twofold axis that isvertical in this view. The ε/γ dimer is formed in the same way. The N-termini leads to the trans-membrane region (PDB: 1XIW).
TCR
β α
CD3
δ εCD3
γ ε
T-cell
b541_Chapter-14.qxd 12/29/2008 2:44 PM Page 447