the ieee intelligent informaticscib/2015/dec/iib_vol16no1.pdf · ieee intelligent informatics...
TRANSCRIPT

THE IEEE
Intelligent Informatics BULLETIN
IEEE Computer Society Technical Committee
December 2015 Vol. 16 No. 1 (ISSN 1727-5997) on Intelligent Informatics
—————————————————————————————————————— Conference Report
Recommender Systems in Tourism. . . . . . . . . . . . . . . . . . . . . . . . . . . . . . . . . . . . A.Moreno, L.Sebastiá and P.Vansteenwegen 1
—————————————————————————————————————— Feature Articles
A Multidisciplinary Survey of Social Network Diffusion Models . . . .. . . . . . . . . . . . . . . . . . . . . . . . . . . … Paulo Shakarian 3 High-Speed Idea Filtering with the Bag of Lemons . . . . . . . . . . . . . . . . . . . . .Mark Klein and Ana Cristina Bicharra Garcia 8 Visual Analytics of Time Evolving Large-scale Graphs. .. . . . Raju N. Gottumukkala, Siva R. Venna and Vijay Raghavan 10 BRAINX3: A New Scientific Instrument for the Acceleration of Hypotheses on Mind and Brain. . .. Paul F.M.J. Verschure 17 Imprecision in Machine Learning and AI. . . . .. . . . . . . . . . . . . . . . . . . . . . .Cassio P. de Campos and Alessandro Antonucci 20 Multiplex Network Mining: A Brief Survey . . . . . . . . . . .. . . . . . . . . . . . . . . . . . . . . . . . . . . . . . . . . . . . . Rushed Kanawati 24
——————————————————————————————————————
Book Review Big Data Analytics. . . . . . . . . . . . . . . . . . . . . . . . . . . . . . . . . . . . . . . . . . . . . . . . . . . . . . . Pawan Lingras and Sugata Sanyal 28
—————————————————————————————————————— Announcements
Related Conferences, Call For Papers/Participants . . . . . . . . . . . . . . . . . . . . . . . . . . . . . . . . . . . . . . . . . . . . . . . . . . . . . . . . . . 30
——————————————————————————————————————
On-line version: http://www.comp.hkbu.edu.hk/~iib (ISSN 1727-6004)

IEEE Computer Society Technical Committee on Intelligent Informatics (TCII) Executive Committee of the TCII: Chair: Chengqi Zhang University of Technology, Sydney, Australia Email: [email protected] Vice Chair: Yiu-ming Cheung (membership, etc.) Hong Kong Baptist University, HK Email: [email protected] Jeffrey M. Bradshaw (early-career faculty/student mentoring) Institute for Human and Machine Cognition, USA Email: [email protected] Dominik Slezak (conference sponsorship) University of Warsaw, Poland. Email: [email protected] Gabriella Pasi (curriculum/training development) University of Milano Bicocca, Milan, Italy Email: [email protected] Takayuki Ito (university/industrial relations) Nagoya Institute of Technology, Japan Email: [email protected] Vijay Raghavan (TCII Bulletin) University of Louisiana- Lafayette, USA Email: [email protected] Past Chair: Jiming Liu Hong Kong Baptist University, HK Email: [email protected] The Technical Committee on Intelligent Informatics (TCII) of the IEEE Computer Society deals with tools and systems using biologically and linguistically motivated computational paradigms such as artificial neural networks, fuzzy logic, evolutionary optimization, rough sets, data mining, Web intelligence, intelligent agent technology, parallel and distributed information processing, and virtual reality. If you are a member of the IEEE Computer Society, you may join the TCII without cost at http://computer.org/tcsignup/.
The IEEE Intelligent Informatics Bulletin Aims and Scope The IEEE Intelligent Informatics Bulletin is the official publication of the Technical Committee on Intelligent Informatics (TCII) of the IEEE Computer Society, which is published once a year in both hardcopies and electronic copies. The contents of the Bulletin include (but may not be limited to):
1) Letters and Communications of the TCII Executive Committee
2) Feature Articles
3) R&D Profiles (R&D organizations,
interview profile on individuals, and projects etc.)
4) Book Reviews
5) News, Reports, and Announcements
(TCII sponsored or important/related activities)
Materials suitable for publication at the
IEEE Intelligent Informatics Bulletin should be sent directly to the Associate Editors of respective sections. Technical or survey articles are subject to peer reviews, and their scope may include the theories, methods, tools, techniques, systems, and experiences for/in developing and applying biologically and linguistically motivated computational paradigms, such as artificial neural networks, fuzzy logic, evolutionary optimization, rough sets, and self-organization in the research and application domains, such as data mining, Web intelligence, intelligent agent technology, parallel and distributed information processing, and virtual reality. Editorial Board Editor-in-Chief: Vijay Raghavan University of Louisiana- Lafayette, USA Email: [email protected]
Managing Editor: William K. Cheung Hong Kong Baptist University, HK Email: [email protected] Assistant Managing Editor: Xin Li Beijing Institute of Technology, China Email: [email protected] Associate Editors: Mike Howard (R & D Profiles) Information Sciences Laboratory HRL Laboratories, USA Email: [email protected] Marius C. Silaghi (News & Reports on Activities) Florida Institute of Technology, USA Email: [email protected] Ruili Wang (Book Reviews) Inst. of Info. Sciences and Technology Massey University, New Zealand Email: [email protected] Sanjay Chawla (Feature Articles) School of Information Technologies Sydney University, NSW, Australia Email: [email protected] Ian Davidson (Feature Articles) Department of Computer Science University at Albany, SUNY, USA Email: [email protected] Michel Desmarais (Feature Articles) Ecole Polytechnique de Montreal, Canada Email: [email protected] Yuefeng Li (Feature Articles) Queensland University of Technology Australia Email: [email protected] Pang-Ning Tan (Feature Articles) Dept of Computer Science & Engineering Michigan State University, USA Email: [email protected] Shichao Zhang (Feature Articles) Guangxi Normal University, China Email: [email protected]
Publisher: The IEEE Computer Society Technical Committee on Intelligent Informatics Address: Department of Computer Science, Hong Kong Baptist University, Kowloon Tong, Hong Kong (Attention: Dr. William K. Cheung; Email:[email protected]) ISSN Number: 1727-5997(printed)1727-6004(on-line) Abstracting and Indexing: All the published articles will be submitted to the following on-line search engines and bibliographies databases for indexing—Google(www.google.com), The ResearchIndex(citeseer.nj.nec.com), The Collection of Computer Science Bibliographies (liinwww.ira.uka.de/bibliography/index.html), and DBLP Computer Science Bibliography (www.informatik.uni-trier.de/~ley/db/index.html). © 2015 IEEE. Personal use of this material is permitted. However, permission to reprint/republish this material for advertising or promotional purposes or for creating new collective works for resale or redistribution to servers or lists, or to reuse any copyrighted component of this work in other works must be obtained from the IEEE.

Conference Report: Tours at RecSys’15: Recommender Systems in Tourism
IEEE Intelligent Informatics Bulletin December 2015 Vol.16 No.1
1
I. INTRODUCTION The huge amount of information
about tourism and leisure activities available on the Web has turned the preparation of a trip into a very challenging task, ripe for the application of recommender systems. Travellers are very keen on using tools that may support their decision making processes when they are planning a travel, including the choice of destination, the selection of attractions to visit, the construction of a multi-day plan, the suggestion of appropriate accommodations and restaurants, etc. Complex problems such as automated planning, semantic knowledge management, group recommendation or context-awareness have by now been heavily studied in this area [2]. The studies reported at the RecSys-2015 workshop on Tourism Recommender Systems (TouRS), briefly commented in this report, provide a glimpse of the state of the art in the field and of its main current challenges.
II. MAIN LINES OF WORK Tourism Recommender Systems (TRS)
usually employ a combination of diverse types of recommendation techniques: content-based, knowledge-based, collaborative filtering, demographic, etc. However, the particular characteristics of this domain lead to continuous appearance of novel problems and the need of developing new techniques (which, in turn, could be later adopted in other domains). In the following subsections we comment on some of the most relevant areas of work in this field and on the proposals made in the TouRS workshop, which was held in Vienna in September 2015 within RecSys-2015 (9th ACM Conference on Recommender Systems), the premier international scientific venue for the study of
recommender methods, techniques and applications.
A. Group recommendation Classical recommender systems try to
filter the domain items that may be more relevant for a particular user, given her demographic data, her past ratings or purchasing history and her preferences. This approach can be very suitable to recommend specific items such as books, songs or films. However, travelling is an activity that is usually carried out in groups of people (couple, family, friends, colleagues); thus, it is necessary to take into account the preferences and tastes of all the travellers when providing recommendations [4].
There are two basic options to deal with group recommendations: to merge the lists of items recommended to each group member, or to start by fusing the individual preferences into a group profile and then compute a single list of group recommendations. The two works presented in the TouRS workshop that addressed this issue chose the first alternative.
In the system TravelWithFriends, the first step is to build a recommendation list for each user and to merge them (using the average without misery strategy) to obtain a destinations shortlist. Afterwards, each group member rates all these options and a Borda count is used to determine the best five destinations to be recommended. The second work dealing with group recommendation in the workshop presented the system CLG-REJA, which is an extension of the REJA restaurant recommender for the city of Jaén in Spain [8]. In this case the first step is also the construction of a list of recommendations for each group member, taking into account her ratings. In a second step, an automatic consensus-reaching process is applied [3]. This is an iterative process in which individual preferences are continuously updated until a high degree of
agreement between all the group members is reached.
B. Planning Planning the order in which
recommended tourist activities have to be visited is a complex problem that has received a great deal of attention in the last years [11]. Kurata et al. presented in the workshop CT-Planner5, which is the latest version of the well-known CT-Planner [6]. The system engages with the user in a collaborative process to construct a route. The user keeps refining her constraints iteratively, until the system can build a satisfying plan. The user may specify physical factors such as the duration of the visit, the moving speed or the difficulty to walk. It can also provide degrees of interest on nature, culture, art, shopping or entertainment activities. The user can also request more detailed requirements such as the addition of popular attractions or the inclusion of activities for children. Genetic algorithms are employed in the planning procedure.
C. Use of semantic information The use of semantic domain
knowledge in the recommendation process, usually represented in the form of an ontology, has heavily increased in recent years [12] as exemplified by three of the works presented in the workshop. Borràs et al. propose to improve the diversity of the results provided by the SigTur recommender [9] using a semantic clustering procedure. The semantic similarity between two concepts is defined as the ratio between the number of different ancestors and the total number of ancestors of both concepts [10]. The items to be recommended are clustered according to this semantic similarity and the recommendation procedure iteratively selects the best item from random clusters. It is shown that this procedure increases the diversity of the results while keeping their accuracy and an
A.Moreno, L.Sebastiá and P.Vansteenwegen
Recommender Systems in Tourism

Editor: Marius C. Silaghi
December 2015 Vol.16 No.1 IEEE Intelligent Informatics Bulletin
2
acceptable computational cost. The system Troovel also contains an ontology with information about the different kinds of tourist activities. The degree of relationship of each item with respect to each category has been automatically computed from TripAdvisor ratings. The user profile, which is continuously updated through the analysis of the interaction of the user with the recommended items, stores a preference degree with respect to each category, which is used by a hybrid recommender system to provide the appropriate suggestions to the users. Semantic information can also be used to determine the items to be recommended in a personalized visit to a museum [1]. More concretely, Lo Bue et al. presented a mobile guide in which both the user profile and the domain items are represented with bags of DBpedia topic categories [7]. A shortest-path semantic distance is used to determine the museum objects that should be recommended to the user.
D. Theoretical results Sánchez-Vilas et al. showed in their
contribution to the workshop a surprising result: the performance of recommender systems based on k-Nearest Neighbours improves when user profiles which are quite different to the current user are considered. This result is explained in terms of the diversity prediction theorem [5], which says that a higher diversity of the items considered in the recommendation leads to a smaller global error.
E. Demo session The TouRS workshop interactive
character was especially present in a practical session, in which all the attendants were briefly presented some recommender systems applied in the Tourism area and they had the opportunity to try them on-line and to comment and discuss them directly with their developers. Apart from the systems commented in the theoretical papers, three more systems were described in this hands-on section. Jazdarreh et al. used Canterbury Cathedral as the case study of a recommender system in which tourists may physically interact with NFC smart posters to obtain more information about a touristic site. Borràs et al. presented a Web-based
recommender and planner of tourist activities in the Mediterranean geographical area of Costa Daurada and Terres de l’Ebre. This application makes a complex dynamic management of the preferences of the user through the continuous analysis of her interaction with the system. Finally, Donohue et al. described the mobile application relEVENTcity, a personalized recommender of events that combines semantic information about activities, management of user preferences and collaborative filtering techniques.
III. CONCLUSIONS Tourism is a very exciting field of
application of recommender systems [2], which is currently attracting a very high level of attention. The TouRS workshop, held at the RecSys-2015 conference, had over 40 attendants both from academia and industry. They witnessed the presentation of both theoretical and practical results that highlighted some of the most relevant areas of current work in this field, including planning, group recommendation and the management of semantic knowledge. There was a strong interaction and lively discussions between the authors and the audience.
IV. ACKNOWLEDGEMENTS Antonio Moreno was supported by
the Spanish research project SHADE: Semantic Hierarchical Attributes for Decision Aid (TIN2012-34369). Laura Sebastiá acknowledges the support of the Spanish research project TIN-2014-55637-C2-2-R and the Valencian research project PROMETEOII/2013/019.
V. REFERENCES [1] Ardisono, L., Kuflik, T. and Petrelli, D.
2011. Personalization in cultural heritage: the road travelled and the one ahead. User Modeling and User-Adapted Interaction 22, 1-27.
[2] Borràs, J., Moreno, A. and Valls, A. 2014. Intelligent tourism recommender systems: A survey. Expert Systems with Applications 41(16), 7370-7389.
[3] Castro, J., Quesada, F.J., Palomares, I. and Martínez, L. 2015. A consensus-driven group recommender system. International Journal of Intelligent Systems 30 (8), 887-906.
[4] García, I., Sebastiá, L. and Onaindia, E. 2011. On the design of individual and group recommender systems for tourism. Expert systems with applications 38, 7683-7692.
[5] Hong, L. and Page, S.E. 2011. The foundations of Wisdom. In Collective Wisdom: Principles and Mechanisms, 1-22.
[6] Kurata, Y. and Hara, T. 2014. CT-Planner4: towards a more user-friendly interactive day-tour planner. In Proceedings of the 21st International Conference on Information Technology and Travel and Tourism. ENTER-2014, 73-86.
[7] Lehmann, J., Isele, R., Jakob, M., Jentzsch, A., Kontokostas, D., Mendes, P., Hellmann, S., Morsey, M., van Kleef, P., Auer, S. and Bizer, C. 2014. DBpedia-a large-scale, multilingual knowledge base extracted from Wikipedia. Semantic Web Journal 5, 1-29.
[8] Martínez, L., Rodríguez, R.M. and Espinilla, M. 2009. REJA: a geo-referenced hybrid recommender system for restaurants. In Proceedings of the IEEE/WIC/ACM International Joint Conference on Web Intelligence and Intelligent Agent Technology. WI-IAT’09, 187-190.
[9] Moreno, A., Valls, A., Isern, D., Marin, L. and Borràs, J. 2013. Sigtur/e-destination: ontology-based personalized recommendation of tourism and leisure activities. Engineering Applications of Artificial Intelligence 26 (1), 633-651.
[10] Moreno, A., Valls, A., Mata, F., Martínez, S., Marín, L., Vicient, C. 2013. A semantic similarity measure for objects described with multi-valued categorical attributes. In Artificial Intelligence Research and Development, Frontiers in Artificial Intelligence 256, IOS Press, 263-272.
[11] Souffriau, W. and Vansteenwegen, P. 2010. Tourist trip planning functionalities: state-of-the-art and future. In Current Trends in Web Engineering (Lecture Notes in Computer Science 6385), 474-485.
[12] Valls, A., Moreno, A. and Borràs, J. 2013. Preference representation with ontologies. In Multicriteria Decision Aid and Artificial Intelligence: Links, Theory and Applications. Eds: M. Doumpos, E. Grigoroudis. John Wiley and Sons, 77-100.
Contact Information
Dr. Antonio Moreno
Departament d’Enginyeria Informàtica i Matemàtiques – Universitat Rovira i
Virgili Phone: +34 (977) 559681 Fax: +34 (977) 559710
Website:
deim.urv.cat/~itaka/workshops/recsys2015

Feature Article: Paulo Shakarian 3
A Multidisciplinary Survey ofSocial Network Diffusion Models
Paulo Shakarian
Abstract—Various models for the diffusion of information andbehavior in a social network have been introduced in variousdisciplines. This paper (a companion to tutorials presented atIJCAI-2015 and AAAI-2016) provides an overview of severalmajor families of models. In particular, we describe deterministictipping, linear threshold/independent cascade, logic program-ming diffusion models, and evolutionary graph theory.
Index Terms—social network analysis, social network diffusion,social influence
I. INTRODUCTION
IN recent years, research on diffusion process in social net-works has grown in a variety of fields including computer
science, physics, and biology. Recently, we have reviewedsome of the major models in each of these disciplines ina tutorial we presented at IJCAI-2015 - which will also bepresented at AAAI-2016. This paper gives an overview ofthese paradigms. Please refer to our recent book [1] for moredetailed technical descriptions. 1 Specifically, we will reviewthe following:• Deterministic Models. The classic deterministic model
first introduced for social networks by Mark Granovet-ter [2] is sometimes referred to as “opinion dynamics.”Under this paradigm, each individual in a social networkadopts a new behavior once the number of influencingfriends previously adopting that behavior exceeds a cer-tain threshold.
• Independent Cascade and Linear Threshold Models. In-troduced in the seminal work of [3], these probabilisticmodels were designed to capture the intuition of variouspreviously-introduced paradigms such as the susceptible-infected-recovered (SIR) model. They have become es-tablished as the standard models to study informationdiffusion in computer science.
• Evolutionary Graph Theory. Originally introduced tomodel the spread of a mutant gene in a structured popu-lation in the classic work of [4], these models are much-studied in theoretical biology and statistical physics. Theyare also used in research on game theory - primarily tostudy the conditions that can lead to the emergence ofcooperation in a social network.
• Logic Programming Models. Leveraging years of estab-lished research from artificial intelligence, these frame-works allow for more fine-grain modeling of the con-ditions upon which influence among individuals occurs
Ariozna State University, Tempe, AZ, USA; e-mail [email protected] for the IJCAI and AAAI tutorials, along with a preprint of the book
can be found at http://lab.engineering.asu.edu/cysis/diffusion/.
by allowing for the consideration of attributes of bothindividuals and their relationships.
We believe that by understanding the various models froma variety of disciplines, researchers can better understand
which model is appropriate for a given application - orwhich model can be most easily modified to address a newresearch concern. For example, the traditional deterministictipping, linear threshold, and independent cascade modelsmake the “progressive assumption” - meaning that the numberof adopters of a new behavior is increasing with time while thisassumption is not made in evolutionary graph theory. Likewise,logic programming models allow for diffusion to also dependon the attributes of nodes and edges - which is generally notthe case for the other paradigms. We do not argue for onemodel over the rest as a “one size fits all” solution but ratherthat one must consider various aspects of the models involvedwhile considering them in a given application.
Throughout this paper, we will assume that there is anunderlying population of n individuals amongst which thereare m directed relationships - allowing us to represent thepopulation as a graph G = (V,E) where each (i, j) ∈ Ein interpreted as individual i having the ability to influenceindividual j. We use the notation η(in)
i and η(out)i to denote the
incoming and outgoing neighbors of individual i respectively.In some of the probabilistic models - such as independentcascade and evolutionary graph theory, we will use the nota-tion pij associated with edge (i, j) to denote the probabilityof j being infected by i conditioned on i being infectedpreviously. In other models (such as linear threshold andlogic programming approaches) there is a weight associatedwith the edges - denoted wij which specifies a strengthon the influence relationship but does not necessarily havea probabilistic interpretation. In many models, unweightedgraphs are considered – which can often be treated as a specialcase of a weighted or probabilistic version of the model.
II. DETERMINISTIC TIPPING MODELS
The deterministic tipping model sometimes referred to asopinion dynamics was initially studied in both sociology [2]and economics [5]. In this framework, individuals can bethought to be in one of two states - active (those who adoptedthe behavior) or inactive. In most work under this paradigm,individuals can only move from inactive to active. Eachindividual i in the population is associated with a threshold(κi). When κi individuals in the set η(in)
i are active, thenindividual i also becomes active (i.e. adopts that behavior).When an initial group if individuals adopts a new behavior(often called a seed set) they initiate a deterministic cascadingprocess that must terminate in n steps or fewer.
IEEE Intelligent Informatics Bulletin December 2015 Vol.16 No.1
4 Feature Article: A Multidisciplinary Survey of Social Network Diffusion Models
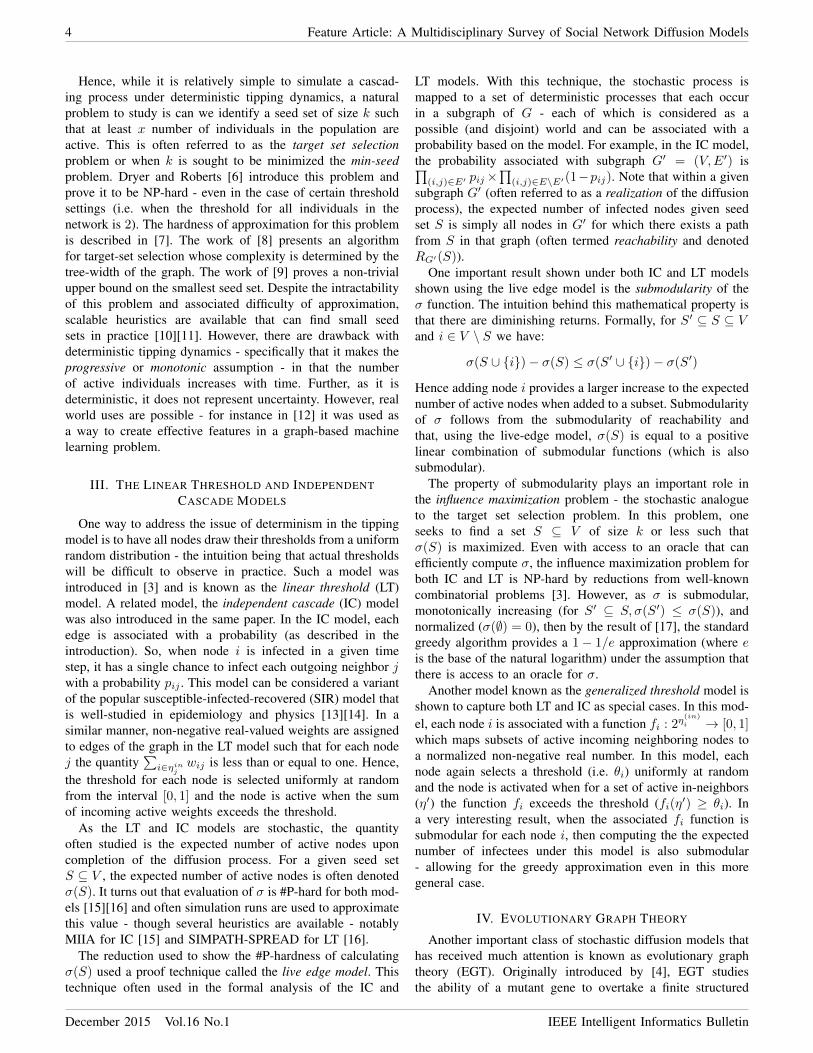
Hence, while it is relatively simple to simulate a cascad-ing process under deterministic tipping dynamics, a naturalproblem to study is can we identify a seed set of size k suchthat at least x number of individuals in the population areactive. This is often referred to as the target set selectionproblem or when k is sought to be minimized the min-seedproblem. Dryer and Roberts [6] introduce this problem andprove it to be NP-hard - even in the case of certain thresholdsettings (i.e. when the threshold for all individuals in thenetwork is 2). The hardness of approximation for this problemis described in [7]. The work of [8] presents an algorithmfor target-set selection whose complexity is determined by thetree-width of the graph. The work of [9] proves a non-trivialupper bound on the smallest seed set. Despite the intractabilityof this problem and associated difficulty of approximation,scalable heuristics are available that can find small seedsets in practice [10][11]. However, there are drawback withdeterministic tipping dynamics - specifically that it makes theprogressive or monotonic assumption - in that the numberof active individuals increases with time. Further, as it isdeterministic, it does not represent uncertainty. However, realworld uses are possible - for instance in [12] it was used asa way to create effective features in a graph-based machinelearning problem.
III. THE LINEAR THRESHOLD AND INDEPENDENTCASCADE MODELS
One way to address the issue of determinism in the tippingmodel is to have all nodes draw their thresholds from a uniformrandom distribution - the intuition being that actual thresholdswill be difficult to observe in practice. Such a model wasintroduced in [3] and is known as the linear threshold (LT)model. A related model, the independent cascade (IC) modelwas also introduced in the same paper. In the IC model, eachedge is associated with a probability (as described in theintroduction). So, when node i is infected in a given timestep, it has a single chance to infect each outgoing neighbor jwith a probability pij . This model can be considered a variantof the popular susceptible-infected-recovered (SIR) model thatis well-studied in epidemiology and physics [13][14]. In asimilar manner, non-negative real-valued weights are assignedto edges of the graph in the LT model such that for each nodej the quantity
∑i∈ηin
jwij is less than or equal to one. Hence,
the threshold for each node is selected uniformly at randomfrom the interval [0, 1] and the node is active when the sumof incoming active weights exceeds the threshold.
As the LT and IC models are stochastic, the quantityoften studied is the expected number of active nodes uponcompletion of the diffusion process. For a given seed setS ⊆ V , the expected number of active nodes is often denotedσ(S). It turns out that evaluation of σ is #P-hard for both mod-els [15][16] and often simulation runs are used to approximatethis value - though several heuristics are available - notablyMIIA for IC [15] and SIMPATH-SPREAD for LT [16].
The reduction used to show the #P-hardness of calculatingσ(S) used a proof technique called the live edge model. Thistechnique often used in the formal analysis of the IC and
LT models. With this technique, the stochastic process ismapped to a set of deterministic processes that each occurin a subgraph of G - each of which is considered as apossible (and disjoint) world and can be associated with aprobability based on the model. For example, in the IC model,the probability associated with subgraph G′ = (V,E′) is∏
(i,j)∈E′ pij×∏
(i,j)∈E\E′(1−pij). Note that within a givensubgraph G′ (often referred to as a realization of the diffusionprocess), the expected number of infected nodes given seedset S is simply all nodes in G′ for which there exists a pathfrom S in that graph (often termed reachability and denotedRG′(S)).
One important result shown under both IC and LT modelsshown using the live edge model is the submodularity of theσ function. The intuition behind this mathematical property isthat there are diminishing returns. Formally, for S′ ⊆ S ⊆ Vand i ∈ V \ S we have:
σ(S ∪ {i})− σ(S) ≤ σ(S′ ∪ {i})− σ(S′)
Hence adding node i provides a larger increase to the expectednumber of active nodes when added to a subset. Submodularityof σ follows from the submodularity of reachability andthat, using the live-edge model, σ(S) is equal to a positivelinear combination of submodular functions (which is alsosubmodular).
The property of submodularity plays an important role inthe influence maximization problem - the stochastic analogueto the target set selection problem. In this problem, oneseeks to find a set S ⊆ V of size k or less such thatσ(S) is maximized. Even with access to an oracle that canefficiently compute σ, the influence maximization problem forboth IC and LT is NP-hard by reductions from well-knowncombinatorial problems [3]. However, as σ is submodular,monotonically increasing (for S′ ⊆ S, σ(S′) ≤ σ(S)), andnormalized (σ(∅) = 0), then by the result of [17], the standardgreedy algorithm provides a 1− 1/e approximation (where eis the base of the natural logarithm) under the assumption thatthere is access to an oracle for σ.
Another model known as the generalized threshold model isshown to capture both LT and IC as special cases. In this mod-el, each node i is associated with a function fi : 2η
(in)i → [0, 1]
which maps subsets of active incoming neighboring nodes toa normalized non-negative real number. In this model, eachnode again selects a threshold (i.e. θi) uniformly at randomand the node is activated when for a set of active in-neighbors(η′) the function fi exceeds the threshold (fi(η′) ≥ θi). Ina very interesting result, when the associated fi function issubmodular for each node i, then computing the the expectednumber of infectees under this model is also submodular- allowing for the greedy approximation even in this moregeneral case.
IV. EVOLUTIONARY GRAPH THEORY
Another important class of stochastic diffusion models thathas received much attention is known as evolutionary graphtheory (EGT). Originally introduced by [4], EGT studiesthe ability of a mutant gene to overtake a finite structured
December 2015 Vol.16 No.1 IEEE Intelligent Informatics Bulletin

Feature Article: Paulo Shakarian 5
population. Here the population’s structure is a directed graphand the progression of the mutant gene through the populationis the diffusion process. Since its introduction, numerousresults on EGT, both analytical and experimental, have beenproduced - see the survey [18] for an overview. Additionally,several extensions to the model have been proposed, includinggame-theoretic ones. The application of EGT to game theoryhas provided researchers new insight about the evolution ofcooperation and other game-theoretic concepts in structuredpopulations.
The dynamics of EGT is an extension of an earlier model ofthe spread of a mutant gene in a population of n individualswhere there is no specified graph-structure relating them toeach other (this is known as a well-mixed population). TheMoran Process of [19] is a stochastic process used to modelevolution in such a population. It is defined as follows. Ateach time-step a randomly selected individual is chosen toreproduce. Then, a second individual is chosen at random todie – replaced by a duplicate of the first individual. Individualsare selected for reproduction based on fitness. Typically, eachindividual is assigned one of two labels - resident and mutant- and often residents are assigned a fitness of 1 and mutantsare assigned a fitness of r - a positive real value. The mutantis advantageous if r > 1 and disadvantageous when r < 1.The case where r = 1 is known as neutral drift. An often-studied problem is determining the probability that a singlemutant will eventually overtake the population. This is knownas the fixation probability (the opposite event - that all mutantsdie out - is called extinction and a population with a lowerfixation probability is deemed more evolutionarily stable asit is resistant to invasion by a mutant). This probability, ρ1,arising from this n original Moran Process, is often termedthe Moran probability and can be shown to be equal to thequantity 1−1/r
1−1/rn .In the original work that introduced EGT [4], Lieberman et
al. generalize the model of the Moran Process by specifyingrelationships between the n individuals of the population inthe form of a directed, weighted graph (again, we will usethe notation G = (V,E)). We also assume a probabilityassociated with each edge - just as with the IC model, excepthere ∀i,
∑j pij = 1. The dynamics proceed as follows. At
each step, first an individual is selected from the populationproportional to its fitness (just as with the standard Moranprocess, this is r/(nmutantr + n− nmutant) for mutants and1/(nmutantr + n − nmutant) for residents – where nmutantis the number of individuals in the population with a mutantlabel). This individual is selected for “birth.” Then, a singleoutgoing neighbor j of node i is chosen with a probability pij .Individual j then “dies” and is replaced with a clone of node i.In other words, j adopts i’s label for the next iteration. Again, akey problem explored in the literature on EGT is to determinethe fixation probability - the probability that all members inthe population adopt a mutant label given an initial invasionof mutants.
There has been much research on the computation offixation probability in EGT. To compute this value for aninitial, single, randomly-placed mutant, [4] shows that thenetwork structure plays a significant role in this computation as
this is only equal to the Moran probability for a special classof graphs referred to as isothermal that is for all nodes (i),the quantity
∑j pji is the same. This quantity is often called
the temperature as nodes will change label more often if it ishigher (hence in isothermal graphs the temperature is the samefor all nodes). Many researchers [20][21][24][22][23] havestudied the problem of computing the probability of fixationgiven that a certain subset of nodes are mutants. If the mutantsinhabit set C ⊆ V , then this probability is written PC . Hencethe fixation probability for a randomly selected mutant (ρ) issimply the average of the PC for all singleton sets. In [25] theauthors provide a set of linear constraints for solving for PC -though there are an intractable number of these constraints. Aswith LT and IC, simulation is often used to estimate fixationprobabilities. However, analytical results are available in manyspecial cases of graphs and algorithms such as that of [22] canprovide faster approximations for certain cases.
One of the most popular applications of EGT is game theory.In the game theoretic context, nodes of a graph representagents and edges represent potential for interaction betweenthem. Interactions between agents are games played that canbe described using a normal game theoretic payoff matrix.EGT thus provides a structural component for interactionsin populations of agents. Evolutionary game theory, whichis concerned with the population-dependent success of gametheoretic strategies, has initially mostly focused on well-mixed populations in which interactions between all agents areequally likely. Combining EGT with evolutionary game theorycan take into account the effect of population structure, whichhas the capacity to crucially impact evolutionary trajectories,outcomes, and strategy success. Thus EGT is a welcometool to explore how many of the results for well-mixedpopulations are affected by population structure. In game-theoretic applications of EGT, the evolutionary fitness (fi)of individual i is often related to their game theoretic payoff(p) (based on game-play with neighbors) with the followingrelationship: fi = 1−w+w ·p. Where the parameter w relatesthe payoff acquired from games played to fitness. If w = 1,the payoff acquired is equal to the fitness. If w = 0, the gameis irrelevant and we are at neutral drift. An often exploredspecial case is weak selection, where w << 1, which reflectsthe assumption that the game of interest plays only a partialrole in the overall fitness of individuals. Using this paradigm,researchers have reached a variety of important conclusions onthe effects of population structure on game-theoretic concepts.For instance, Santos et al. [26] investigate the effects of single-scale and scale-free networks on cooperation in the Prisoner’sDilemma, Snow-Drift, and Stag-Hunt games through simu-lations. The authors find that in degree-heterogeneous graphscooperation is easier to sustain than in well-mixed populationsand thus identify heterogeneity as a “powerful mechanism forthe emergence of cooperation.” Additionally, the authors findthat the sustainability of cooperation also depends on“detailedand intricate ties” between agents. As evidence of this, scalefree networks which exhibit properties like those that emergefrom models of growth from preferential attachment (Albert-Barbarasi topology) are shown to produce higher cooperationthan random scale-free networks.
IEEE Intelligent Informatics Bulletin December 2015 Vol.16 No.1
6 Feature Article: A Multidisciplinary Survey of Social Network Diffusion Models
V. LOGIC PROGRAMMING BASED FRAMEWORKS
Attributes about individuals within a social network, alongwith characteristics about the relationships among them, canplay a significant role in diffusion. For instance, a close friendmay have a stronger influence relationship than an office co-worker. Likewise, individuals of different ages, genders, andeducation levels may respond to various social contagion indifferent ways. While models such as deterministic tipping,IC, and LT can capture the structure of a population, they donot inherently capture attributes of the individuals, their rela-tionships, and the social contagion itself. Logic programmingbrings a natural representation of these additional factors -along with a suite of long-established results. The intuitionis that a graph with multiple labels on nodes and edges isembedded into a logic program - along with additional rulesthat specify complex diffusion relationships.
The logic-programming approach to social network dif-fusion first introduced in [27] and later extended in [28].Since its introduction, there have been other variants of thelogic-based approach that have leveraged formalisms such asprobabilistic soft logic (PSL) [29] and modal logic [30] inaddition to tackling problems such as non-monotonic diffusionreasoning [31] and informing the creation of diffusion-specificcentrality measures [32]. A key advantage is with these frame-works is that they do not specify a single diffusion model,but rather provide a language for reasoning about a wholeclass of diffusion models. These approaches even allow forthe composition of models - enabling reasoning about multiplediffusion processes that occur at the same time and potentiallyinteract.
The well-known annotated logic - Generalized AnnotatedPrograms (GAP) was the first to be adapted for social networkdiffusion [27][28]. In this case, a social network was defined asa 5-tuple: (V,E, `node, `edge, w) where V is the set of nodes,E is a multi-set of relationships, `node, `edge are functions thatlabel the nodes and edges respectively, and w is a weightingfunction that assigns weights to multi-edges. This structure canbe easily embedded into a logic program along with associateddiffusion rules.
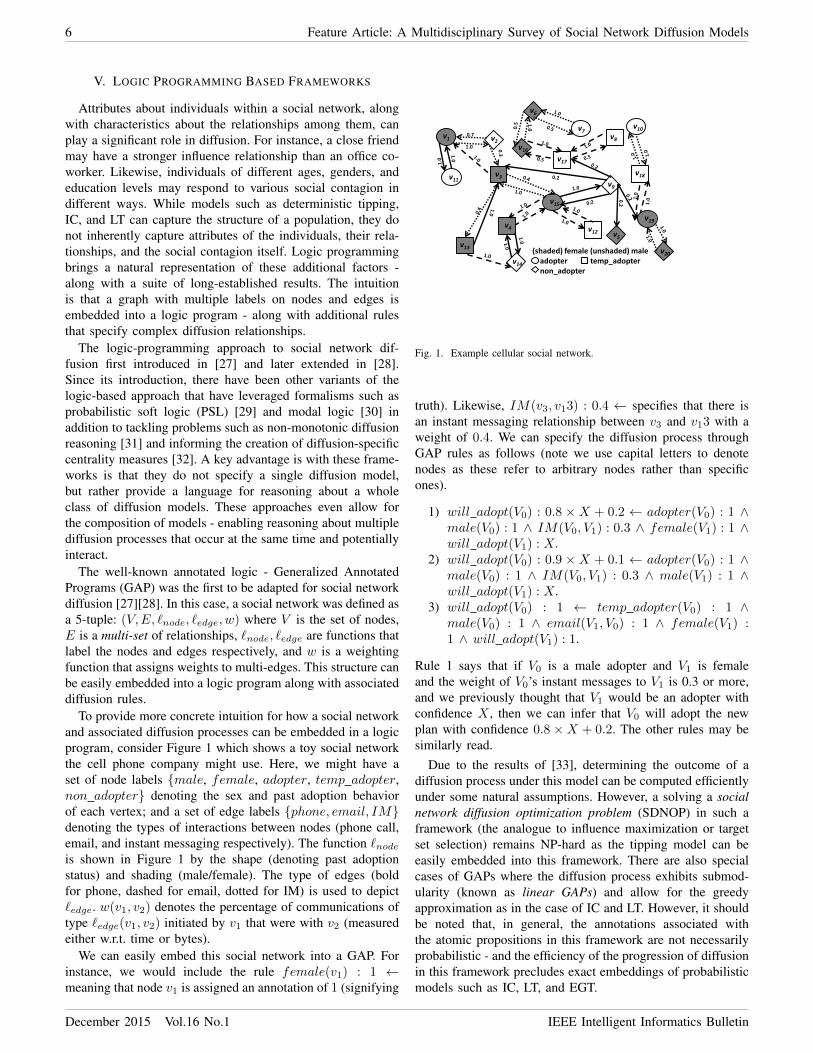
To provide more concrete intuition for how a social networkand associated diffusion processes can be embedded in a logicprogram, consider Figure 1 which shows a toy social networkthe cell phone company might use. Here, we might have aset of node labels {male, female, adopter, temp adopter,non adopter} denoting the sex and past adoption behaviorof each vertex; and a set of edge labels {phone, email, IM}denoting the types of interactions between nodes (phone call,email, and instant messaging respectively). The function `nodeis shown in Figure 1 by the shape (denoting past adoptionstatus) and shading (male/female). The type of edges (boldfor phone, dashed for email, dotted for IM) is used to depict`edge. w(v1, v2) denotes the percentage of communications oftype `edge(v1, v2) initiated by v1 that were with v2 (measuredeither w.r.t. time or bytes).
We can easily embed this social network into a GAP. Forinstance, we would include the rule female(v1) : 1 ←meaning that node v1 is assigned an annotation of 1 (signifying
v1
v4
v5
v11
v17
v9
v3
v6
v7 v8
v15
v14
v13
v16
v10
v12
v18
v20
1.0
0.7
1.0
v19
v2
(shaded) female (unshaded) male adopter temp_adopter non_adopter
Fig. 1. Example cellular social network.
truth). Likewise, IM(v3, v13) : 0.4 ← specifies that there isan instant messaging relationship between v3 and v13 with aweight of 0.4. We can specify the diffusion process throughGAP rules as follows (note we use capital letters to denotenodes as these refer to arbitrary nodes rather than specificones).
1) will adopt(V0) : 0.8 ×X + 0.2 ← adopter(V0) : 1 ∧male(V0) : 1 ∧ IM(V0, V1) : 0.3 ∧ female(V1) : 1 ∧will adopt(V1) : X.
2) will adopt(V0) : 0.9 ×X + 0.1 ← adopter(V0) : 1 ∧male(V0) : 1 ∧ IM(V0, V1) : 0.3 ∧ male(V1) : 1 ∧will adopt(V1) : X.
3) will adopt(V0) : 1 ← temp adopter(V0) : 1 ∧male(V0) : 1 ∧ email(V1, V0) : 1 ∧ female(V1) :1 ∧ will adopt(V1) : 1.
Rule 1 says that if V0 is a male adopter and V1 is femaleand the weight of V0’s instant messages to V1 is 0.3 or more,and we previously thought that V1 would be an adopter withconfidence X , then we can infer that V0 will adopt the newplan with confidence 0.8 ×X + 0.2. The other rules may besimilarly read.
Due to the results of [33], determining the outcome of adiffusion process under this model can be computed efficientlyunder some natural assumptions. However, a solving a socialnetwork diffusion optimization problem (SDNOP) in such aframework (the analogue to influence maximization or targetset selection) remains NP-hard as the tipping model can beeasily embedded into this framework. There are also specialcases of GAPs where the diffusion process exhibits submod-ularity (known as linear GAPs) and allow for the greedyapproximation as in the case of IC and LT. However, it shouldbe noted that, in general, the annotations associated withthe atomic propositions in this framework are not necessarilyprobabilistic - and the efficiency of the progression of diffusionin this framework precludes exact embeddings of probabilisticmodels such as IC, LT, and EGT.
December 2015 Vol.16 No.1 IEEE Intelligent Informatics Bulletin

Feature Article: Paulo Shakarian 7
VI. CONCLUSION
This paper surveyed some of the major social networkdiffusion models from a variety of disciplines and describedsome key results. However, this area of study will continueto evolve. Lately, network diffusion research where historicaltraces of diffusion processes are available are becoming moreprevalent – and empirical studies examining influence anddiffusion in such datasets will lead to further refinements ofthese models - and perhaps result in new paradigms.
ACKNOWLEDGMENT
The author is supported through the AFOSR Young Inves-tigator Program (YIP) grant FA9550-15-1-0159, ARO grantW911NF-15-1-0282, and the DoD Minerva program.
REFERENCES
[1] P. Shakarian, A. Aleali, A. Bhatnagar, R. Guo, and E. Shaabani, Diffusionin Social Networks, Springer, 2015.
[2] M. Granovetter, “Threshold models of collective behavior.” The AmericanJournal of Sociology (6), 1420-1443, 1978.
[3] D. Kempe, J. Kleinberg, and . Tardos, “Maximizing the spread ofinfluence through a social network.” Proceedings of the ninth ACMSIGKDD international conference on Knowledge discovery and datamining. ACM, 2003.
[4] Lieberman, E., Hauert, C., Nowak, M. A., “Evolutionary dynamics ongraphs.” Nature 433 (7023), 312-316, 2005.
[5] T. Schelling, Micromotives and Macrobehavior, W.W. Norton and Co.,1978.
[6] P. Dreyer, F. Roberts, “Irreversible threshold processes: Graph-theoreticalthreshold models of the spread of disease and of opinion,” DiscreteApplied Mathematics, 157 (7), 1615-1627, 2009.
[7] N. Chen, “On the approximability of influence in social networks,” SIAMJ. Discrete Math, 23, 1400-1415, 2009.
[8] O. Ben-Zwi, D. Hermelin, D. Lokshtanov, I. Newman, I., “Treewidthgoverns the complexity of target set selection,” Discrete Optimization, 8(1), 87-96, 2011.
[9] D. Reichman, “New bounds for contagious sets,” Journal, DiscreteMathematics, Volume 312 Issue 10, May, 2012.
[10] P. Shakarian, D. Paulo, “Large Social Networks can be Targeted for ViralMarketing with Small Seed Sets,” IEEE/ACM International Conferenceon Advances in Social Networks Analysis and Mining, 2012.
[11] P. Shakarian, S. Eyre, and D. Paulo, “A Scalable Heuristic for ViralMarketing Under the Tipping Model,” Social Network Analysis andMining, Springer 3(4), 2013.
[12] E. Shaabani, A. Aleali, P. Shakarian, and J. Bertetto, “Early Identificationof Violent Criminal Gang Members,” 21st ACM SIGKDD Conference onKnowledge, Discovery, and Data Mining, 2015.
[13] R. Anderson, R. May, “Population biology of infectious diseases: PartI,” Nature, 280 (5721), 361, 1979.
[14] M. Kitsak, L. Gallos, S. Havlin, F. Liljeros, L. Muchnik, E. Stanley,H. Eugene, and H. Makse, “Identification of influential spreaders incomplex networks,” Nat Phys, 6 (11), 888–893, 2010.
[15] W. Chen, C. Wang, and Y. Wang, “Scalable influence maximization forprevalent viral marketing in large-scale social networks,” Proceedings ofthe 16th ACM SIGKDD international conference on Knowledge discoveryand data mining, 1029–1038, 2010.
[16] A. Goyal, W. Lu, L.V. Lakshmanan, “SIMPATH: An efficient algorithmfor influence maximization under the linear threshold model,” 11thInternational Conference Data Mining (ICDM), IEEE, 211–220, 2011.
[17] G. Nemhauser, L. Wolsey, and M. Fisher, “An analysis of approximationsfor maximizing submodular set functions,” Mathematical Programming,14(1) 265–294, 1978.
[18] P. Shakarian, P. Roos, and A. Johnson, “A Review of Evolutionary GraphTheory with Applications to Game Theory,” BioSystems, 107(2), 2012.
[19] P. Moran, “Random processes in genetics,” Mathematical Proceedingsof the Cambridge Philosophical Society, 54 (01), 60-71, 1958.
[20] M. Broom, J. Rychtar, “An analysis of the fixation probability of amutant on special classes of non-directed graphs,” Proc. of the RoyalSociety A, 464, 2609-2627, 2008.
[21] N. Masuda, H. Ohtsuki, “Evolutionary dynamics and fixation probabil-ities in directed networks,” New Journal of Physics, 11, 033012, 2009.
[22] P. Shakarian, P. Roos, “Fast and deterministic computation of fixationprobability in evolutionary graphs,” The Sixth IASTED Conference onComputational Intelligence and Bioinformatics, 2011.
[23] P. Shakarian, P. Roos, and G. Moores. “A Novel Analytical Method forEvolutionary Graph Theory Problems,” BioSystems, 111(2), 2013.
[24] V. Barbosa, R. Donangelo, and S. Souza, “Early appraisal of the fixationprobability in directed networks,” Phys. Rev. E, 82 (4), 046114, 2010.
[25] J. Rychtar, B. Stadler, “Evolutionary dynamics on small-world net-works,” International Journal of Computational and Mathematical Sci-ences, 2 (1), 2008.
[26] E. Santos, J. Pacheco, and T. Lenaerts, “Evolutionary dynamics of socialdilemmas in structured heterogeneous populations,” PNAS 103 (9), 3490-3494, 2006.
[27] P. Shakarian, V.S. Subrahmanian, and M.L. Sapino, “Using GeneralizedAnnotated Programs to Solve Social Network Optimization Problems,”26th Intl. Conference on Logic Programming, 2010.
[28] P. Shakarian, M. Broecheler, V.S. Subrahmanian, and C. Molinaro,“Using generalized annotated programs to solve social network diffusionoptimization problems,” ACM Transactions on Computational Logic,14(2), 2013.
[29] M. Broecheler, P. Shakarian, and V. S. Subrahmanian. “A scalableframework for modeling competitive diffusion in social networks,” IEEEConference on Social Computing, IEEE, 2010.
[30] Z. Christoff, J. Hansen, “A logic for diffusion in social networks,”Journal of Applied Logic, 13(1), 2015.
[31] P. Shakarian, G.I. Simari, and D. Callahan, “Reasoning about ComplexNetworks: A Logic Programming Approach,” 29th Intl. Conference onLogic Programming, 2013.
[32] C. Kang, C. Molinaro, S. Kraus, Y. Shavitt, and V.S. Subrahmanian,“Diffusion Centrality in Social Networks,” IEEE ASONAM, 2012.
[33] M. Kifer, V.S. Subrahmanian, “Theory of generalized annotated logicprogramming and its applications,” The Journal of Logic Programming,12(4), 1992.
IEEE Intelligent Informatics Bulletin December 2015 Vol.16 No.1

Feature Article: High-Speed Idea Filtering with the Bag of Lemons
December 2015 Vol.16 No.1 IEEE Intelligent Informatics Bulletin
8
Abstract - Open innovation platforms (web sites where crowds post ideas in a shared space) enable us to elicit huge volumes of potentially valuable solutions for problems we care about, but identifying the best ideas in these collections can be prohibitively expensive and time-consuming. This paper presents an approach, called the "bag of lemons", which enables crowd to filter ideas with accuracy superior to conventional (Likert scale) rating approaches, but in only a fraction of the time. The key insight behind this approach is that crowds are much better at eliminating bad ideas than at identifying good ones.
Index terms − crowd-based, idea filtering, open innovation
I. INTRODUCTION
PEN innovation platforms (web sites where crowds post ideas in a shared space) enable us to elicit huge volumes
of potentially valuable solutions for problems we care about, but identifying the best ideas in these collections can be prohibitively expensive and time-consuming (Riedl et al., 2010) (Schulze et al., 2012) (Westerski et al., 2013) (Blohm et al., 2011) (Bjelland and Wood, 2008) (Di Gangi and Wasko, 2009).
In response to this, organizations have turned to crowds to not just generate ideas, but also filter them, so only the best ideas need be considered by the decision makers. It has in fact been shown that crowds, under the right circumstances, can solve such classification problems with accuracy equal to or even better than that of experts (Surowiecki, 2005). This has been no panacea, however. Existing filtering approaches, when faced with large idea corpuses, tend to fare poorly in terms of accuracy, and can make unrealistic demands on crowd participants in terms of time and cognitive complexity (see http://ssrn.com/abstract=2501787 for a critical review of existing idea-filtering techniques).
This paper presents an approach, called the "bag of lemons", which enables crowds to filter ideas with accuracy greater than conventional (Likert scale) rating approaches, but in only a fraction of the time. The key insight behind this approach is that crowds are better at eliminating bad ideas than at identifying good ones. In the remainder of this paper, we will describe the approach, our experimental evaluation, and the lessons learned from the evaluations.
Mark Klein is a Principal Research Scientist in the Center for Collective
Intelligence at the Massachusetts of Technology, as well as a visiting researcher at the University of Zurich and a visiting professor at the Nagoya Institute of Technology http://cci.mit.edu/klein/
Ana Cristina Bicharra Garcia is a full professor in the Computer Science Department at Fluminense Federal University (UFF) in Brazil. http://www.addlabs.uff.br/Novo_Site_ADDLabs/index.php/en/about
II. APPROACH: MULTI-VOTING WITH INCENTIVES Our approach is simple. Raters are provided with the list of
candidate ideas, as well as a clear description of the selection criteria. They are then given a limited number of "votes", and asked to allocate them to ideas based on whether or not they believe they represent top candidates for the decision makers. The more confident they feel about a judgment, the more votes they can allocate to that idea (within the limits of the overall vote budget). Raters are given financial incentives for allocating votes accurately. Ideas can then be filtered based on the number of votes each idea received. This approach is potentially attractive, we believe, because:
• incentive alignment: crowd participants are given incentives to make idea evaluations that align with those of the decision makers.
• time demands: rather than asking participants to rate all the ideas, they need only identify the small subset that they think are most (or least, see below) likely to be selected by the decision makers, rather than having to figure out the correct rating for all the ideas.
• cognitive complexity: participants are not required to deal with the cognitive overhead of trading and monitoring stock prices (as in idea prediction markets). In addition, as we will discuss below, the trick of asking users to assign votes to the worse ideas (rather than the best ones) further simplifies the evaluation process. Our hypothesis, therefore, was that our multi-voting
approach will allow crowds to achieve at least comparable levels of accuracy in filtering idea sets, while requiring less rater time, than conventional rating techniques.
III. EXPERIMENT DESIGN To evaluate this, we engaged past and current members of a
university R&D lab in identifying the most promising entries from a list of 48 ideas concerning how to increase productivity in the lab. The lab members were divided into three demographically matched groups of roughly 20 members each, each group using a different filtering approach:
• Likert: Participants were asked to rate each idea using a 5-point Likert scale, ranging from 1 (poor) to 5 (excellent) (Likert, 1932)
• Bag of stars (BOS): Participants were asked to distribute a budget of 10 "stars" to the ideas they felt were most likely to excellent.
• Bag of Lemons (BOL): Participants were asked distribute a budget of 10 "lemons" to the ideas they felt were least likely to be excellent. The ideas were evaluated, up-front, by an expert committee,
and participants were given financial incentives for accurately identifying the 19 ideas that were considered good or excellent
Mark Klein, Ana Cristina Bicharra Garcia
High-Speed Idea Filtering with the Bag of Lemons
O

Feature Article: Mark Klein, Ana Cristina Bicharra Garcia
IEEE Intelligent Informatics Bulletin December 2015 Vol.16 No.1
9
by at least three members of the expert committee. All the idea filtering engagements took place in parallel, participants could not see each other's ratings, and were asked to not discuss their evaluations with each other during the experiment, to help assure the rater independence that is required for accurate crowd classification (Ladha, 1992). All user interactions with the system were recorded and time-stamped.
IV. EVALUATION RESULTS We used a standard technique known as ROC curves
(Fawcett, 2004) to assess the accuracy of the idea filtering methods. ROC curves plot the true positive rate vs. the false positive rate for a filter. The area under the ROC curves is then a measure of accuracy: a perfectly accurate idea filter would have an area of 1.0, while a random selection filter would have an area of 0.5.
The accuracy scores for the three idea filtering conditions were as follows:
Condition Accuracy BOL 0.89 +/- 0.04 Likert 0.74 +/- 0.03 BOS 0.62 +/- 0.03
BOL had the highest accuracy, followed by Likert and then
BOS. All conditions performed better than a random filter (which would have an accuracy of 0.5), and all these differences were statistically significant at p<0.05.
The average amount of time the participants spent, in minutes, doing the ratings in each idea filtering condition were as follows:
Condition Per-Rater
Time/minutes BOL 24 +/- 12 Likert 75 +/- 20 BOS 25 +/- 28
BOS and BOL required roughly 1/3rd the rater time of the
Likert approach (p<0.05). The difference between BOS and BOL was not statistically significant.
Our data allows us to reach the following conclusions: • The bag of lemons (BOL) approach provided
substantially (about 33%) greater idea filtering accuracy than the conventional Likert approach, while requiring only about one third of the rater time. • Our crowds were much (about 60%) more accurate at
eliminating bad ideas (BOL) than selecting good ones (BOS). Our hypothesis (that our approach will achieve at least
comparable idea filtering accuracy as Likert rating, while requiring less rater time) was thus validated for the Bag of Lemons, but not for the Bag of Stars.
V. LESSONS LEARNED
How can we understand these results? We believe that the key insight is that identifying the best ideas requires finding ideas that are exceptional with respect to all relevant criteria (e.g. feasibility, value, and cost). This can be time-consuming
and, in addition, may force raters to make judgments that they are not well-qualified to make. A rater, for example, may have a good sense of the potential benefits of an idea, but not of how costly it would be to implement. The Bag of Lemons approach, by contrast, tries to find the worst ideas, and this only requires that people identify ideas that are clearly deficient with respect to one criterion, since that is all it takes to eliminate an idea from consideration. The incentives and limited vote budget, in addition, encourage raters to focus only on the ideas they feel they can evaluate quickly and well. As long as the rater community is diverse enough so that every criterion has at least some raters who can evaluate it, the bag of lemons can achieve greater idea filtering accuracy than any member could achieve on his/her own, while reducing rating time as compared to techniques that require raters to evaluate with respect to all the criteria.
This work represents, we believe, a novel and important contribution to the literature on idea filtering for open innovation systems. While other efforts have used multi-voting for idea filtering (Bao et al., 2011), or provided incentives for idea filtering accuracy (e.g. in prediction markets), we are aware of no previous work that combines these concepts, or that is based on identifying the worse, rather than the best, ideas.
VI. ACKNOWLEDGMENTS M. Klein's participation in this work was supported by grant
6611188 from the European Union Seventh Framework (FP7) Program - the CATALYST project. A.C.B. Garcia gratefully acknowledges funding support from the Brazilian government research agency (CAPES).
VII. REFERENCES
[1] Bao, J., Sakamoto, Y., & Nickerson, J. V. (2011). Evaluating design solutions using crowds. Proceedings of the Seventeenth Americas Conference on Information Systems,.
[2] Bjelland, O. M., & Wood, R. C. (2008). An Inside View of IBM’s ‘Innovation Jam’. Sloan Management Review, 50(1)(1).
[3] Blohm, I., Bretschneider, U., Leimeister, J. M., & Krcmar, H. (2011). Does collaboration among participants lead to better ideas in IT-based idea competitions? An empirical investigation. International Journal of Networking and Virtual Organisations, 9(2)(2), 106-122.
[4] Di Gangi, P. M., & Wasko, M. (2009). Steal my idea! Organizational adoption of user innovations from a user innovation community: A case study of Dell IdeaStorm. Decision Support Systems, 48(1)(1), 303-312.
[5] Fawcett, T. (2004). ROC graphs: Notes and practical considerations for researchers. Machine Learning, 31, 1-38.
[6] Ladha, K. K. (1992). The Condorcet jury theorem, free speech, and correlated votes. American Journal of Political Science, 617-634.
[7] Likert, R. (1932). A Technique for the Measurement of Attitudes. Archives of Psychology, 140, 1-55.
[8] Riedl, C., Blohm, I., Leimeister, J. M., & Krcmar, H. (2010). Rating scales for collective intelligence in innovation communities: Why quick and easy decision making does not get it right. Proceedings of the International Conference on Information Systems.
[9] Schulze, T., Indulska, M., Geiger, D., & Korthaus, A. (2012). Idea assessment in open innovation: A state of practice.
[10] Surowiecki, J. (2005). The Wisdom of Crowds. Anchor. [11] Westerski, A., Dalamagas, T., & Iglesias, C. A. (2013).
Classifying and comparing community innovation in Idea Management Systems. Decision Support Systems, 54(3)(3), 1316-1326.

Feature Article: Visual Analytics of Time Evolving Large-scale Graphs
December 2015 Vol.16 No.1 IEEE Intelligent Informatics Bulletin
10
Abstract—Several real-world observations from streaming data sources, such as sensors, click streams, and social media, can be modeled as time-evolving graphs. There is a lot of interest in domains such as cybersecurity, epidemiology networks, social community networks, and recommendation networks to both study and build systems to track the evolutionary properties of graphs. However, the size and complexity of these graphs present several challenges in terms of processing, analyzing, and visualizing this data. This paper provides a conceptual introduction to time evolving graphs and discusses state-of-the-art techniques and tools for analyzing and visualizing massive time evolving graphs. A visual analytics sandbox implementation architecture and some ongoing projects in this area are also discussed.
Index Terms— visual analytics, time evolving graphs, data streams, graph visualization
I. INTRODUCTION IG data technologies are radically transforming the pace at which knowledge is created from data. Organizations are
looking to leverage these technologies to collect and process real-world datasets to make decisions that reflect ground realities. Large scale graphs with billions of nodes and edges created from real world observations are emerging in multiple domains and disciplines – these include social community networks [1] infrastructure networks [2], epidemiology networks [3], IP traffic networks [4], etc. The dynamics and evolution of these graphs can be captured by introducing time dimension - this introduces additional complexity for organizations to track all the graph properties with respect to their evolution. In literature these graphs are frequently mentioned as Time Evolving Graphs (TEG), Time Varying Graphs, or Temporal Graphs. These graphs are also closely related to dynamic graphs. The key distinguishing feature of evolutionary graphs compared to dynamic graphs is that the graph topology also changes and these changes are significant.
The effects of time varying topologies on various dynamic processes in networks is an increasing subject of interest with big data [5][6][7]. Example applications are the spread of information, infectious diseases, and malware.
Raju Gottumukkala is Director of Research in Informatics Research Institute and Site Director of Center for Visual and Decision Informatics, Siva R. Venna is Ph.D. student, Vijay Raghavan is Professor in School of Computing and Informatics and Director of Center for Visual and Decision Informatics, from University of Louisiana at Lafayette. e-mail: [email protected],[email protected],[email protected]
The time dimension also introduces new properties to the graph to study how the node, edges, subgraphs, or particular graph properties evolve over time. As such, the data models of time-evolving graphs are much more complex to manage compared to key-value stores, column stores, relational SQL, or document stores. Also, the computational and visualization requirements to manage these tools far exceed the capabilities of commercially available tools. The evolutionary aspect of graph has been studied in many applications [5][13][14]. These include studying travel patterns, disease epidemics, and human interactions from human and animal proximity networks constructed from sensors, cell phone, RFID or GPS devices, understanding co-authorships and citation networks to predict future collaborations, predicting vehicle traffic from transportation networks, understanding evolution of events of interest from social media graphs, understanding malware and network traffic anomalies from internet traffic, understanding disease spread in cancer cells from gene networks contain information on protein and DNA information, etc. Existing tools provides for summarization or provide aggregate statistics on these time evolving graphs. Performing any analytics or visualizing evolutionary patterns beyond these basic operations is very labor intensive and time consuming
This paper presents some background on time evolving graphs, and how visual analytics processes can assist in managing these graphs. The paper also discusses the state of the art analytics, visualization and user interaction techniques and tools available for knowledge discovery in graphs. We also present our ongoing work in building a big data sandbox for visual analytics, and discuss ongoing big data projects that use time evolving graphs.
II. TIME EVOLVING GRAPHS
A. Definition A time-evolving graph is defined as a graph G= (V, E, T),
where V is the set of vertices (or nodes), E is the set of edges, and T is the set of time instants. Also, E ⊆ (V x T x V x T) is the set of edge. An edge e ∈ E is defined by e = (v1, ta, v2, tb), where v1, v2 ∈ V are the origin and destination nodes and ta, tb ∈ T are origin and destination time instants. e = (v1, ta, v2, tb) is basically a directed edge from node v1 at time ta to node v2 at time ta. An undirected edge can be represented when E has both (v1, ta, v2, tb) and (v1, tb, v2, ta). The usage of the definition was introduced in [11]. Evolution could represent the variation of availability of a node, edge, or a graph. Detailed definition of time evolving graphs and evolutionary properties of these graphs are discussed in [11][12].
Visual Analytics of Time Evolving Large-scale Graphs
Raju N. Gottumukkala, Siva R. Venna and Vijay Raghavan
B

Feature Article: Raju N. Gottumukkala, Siva R. Venna and Vijay Raghavan
IEEE Intelligent Informatics Bulletin December 2015 Vol.16 No.1
11
B. Data model: The most straightforward method to store a graph is in the form of an adjacency list, or an adjacency matrix. There are multiple ways to store a time evolving graph while preserving a temporal structure of the graph. Choosing the right data model depends on the nature of the data, the type of graph (strongly connected, vs. weakly connected, sparse, or dense graphs, etc.) and the targeted data processing and analytical tasks. The most straightforward approach is to store a snapshot of the graph for time instance (shown in Figure 1(a)) [15]. This model consumes a lot of memory, and works only when it is not necessary to capture relationships between nodes across time-stamps. Also, running certain queries across time-stamps is inefficient. Other ways include,
creating a single graph for all time stamps and storing the time information on the edge as an attribute. This can be accomplished in two different ways as shown in Figure 1(b) as a simple list of timestamps [6] or as in figure 1(c) by specifying limits when edges are persistent during sequences of timestamps [7]. For example, in Figure 1(b), the edge between node A and node B is available at time-stamps 6, 7 and 11. In Figure 1(c), the edge from node A to node B is available at time stamps 1, 2 and 3. One of the limitations of these models is that the relationship between the nodes across time-stamps cannot be stored. More complex TEGs where there is possibility of having edges across nodes from different timestamps, one way of storing such graphs is creating duplicates of nodes for each timestamp it is present in and adds edges between required nodes as shown in Figure 2 [12].
III. VISUAL ANALYTICS PROCESS FOR TIME EVOLVING GRAPHS
One of the key distinguishing features of visual analytics, as compared to emerging areas such as automated analysis, is the integration of visualization and human’s visual exploration components into analytics.
A. What is Visual Analytics? According to “Illuminating the Path” by Thomas and Cook [16], Visual analytics is an interdisciplinary field that integrates the following areas: analytical reasoning approaches that let users obtain deep insights that directly support assessment, planning and decision making, visual representations and interaction techniques that exploit the human eye’s broad bandwidth pathway into the mind to let users see, explore, and understand large amounts of information simultaneously, Data representations and transformations that convert all types of conflicting and dynamic data in ways that support visualization and analysis, techniques to support production, presentation, and dissemination of analytical results to communicate information in appropriate context to a variety of audiences. Figure 3 shows the visual analytics process as an integrated framework that has data, models, knowledge, and visualization interaction process interact with each other.
Visual analytics has become a buzz word in the business intelligence domain, and many companies including SASTM, IBM SPSSTM, considered leaders in statistical analysis for business are pursuing novel ways to improve their data presentation through new products such as SAS Visual AnalyticsTM, and IBM’s Many EyesTM. Moreover, several new BI tools such as TableauTM, BirstTM and Google Fusion TablesTM also provide various interactive visualization capabilities. While these tools provide some basic visualization and interaction capabilities for users to interact with the data, these tools are far from promoting analytics discourse with the visualization environment. The overarching vision of visual analytics is to provide technology that combines the strengths of human and electronic processing [16][17].
Most of the existing research has focused on graph
Figure 1(a)
Figure 1(b)
Figure 1(c) Figure 1. Three ways of storing a
time-evolving graph
Figure 2. Graph representation of TEG where edges are present across nodes from different time stamps
Figure 3. Visual analytics as an integrated framework [17]
Figure 4. Visual Analytics as an integration framework with various components

Feature Article: Visual Analytics of Time Evolving Large-scale Graphs
December 2015 Vol.16 No.1 IEEE Intelligent Informatics Bulletin
12
theoretical representation of time-evolving graphs, visualization of dynamic aspects of time-evolving graphs, and interaction techniques and tools to interact with these graphs. A recent comparative study on the landscape of various open-source and commercially available BI platforms [18], and state-of-current research in visual analytics capabilities of BI systems highlight the capabilities and limitations with respect to individual components, i.e. data management, automated analysis, visualization, and system architecture. Another survey paper on visual analytics [19] also highlights the state-of-the-art in visual analytics and the challenges in individual research areas. However, the visual analytics solutions actually lie in the integration of various research areas, and optimization of, data management, analytics, visualization, and human interaction modules. All these business intelligence tools have visual analytics capabilities added into the existing platform, hence offer limited flexibility to support visual analytics of complex, and real-time datasets. Bridging these disciplines into an integrated framework offers new opportunities for researchers to experiment with different visual analytics components to improve the overall end-user experience to manipulate the information.
Visual analytics framework is an integration of various components, (refer Figure 4) namely (1) An efficient data model and memory management to store, and run graph mining algorithms, (2) interaction techniques based on a touch interface to manipulate the graphs with respect to its dynamics, and (3) an integration framework that facilitates seamless interaction of graph datasets. Not all the graph operations can be performed on the visualization system; hence there should be seamless communication between the visualization system and the analytics server. The middleware serves as the key interface between the visualization system and the analytics server. The middleware takes care of management and prioritization of various jobs, and translation of users’ actions into analytical queries
IV. GRAPH ANALYTICS ENGINES Three is a great demand for close to real-time analysis of
massive graphs - given the demand in several real-time applications (online recommendations for click stream processing, fraud detection, analysis of cyber-attack graphs, etc.). The performance of a graph analytics engine is affected by three important factors, the graph data model, the memory management / caching scheme, and the graph analytics algorithms.
A. Data management: One of the most important elements of the graph database is
the data model (or the database model), which is basically the data structures for schema and instances modeled as graphs or generalizations of them – to support efficient way to store and query, index, or aggregate data. The data can be centralized and distributed that either store graphs in the memory, or store them on the disk and retrieve them on demand.
Graph access patterns have very poor spatial memory locality and this result in large amounts of random memory access. High throughput processing of massive graphs that may not fit in the main memory require efficient memory management that includes efficient caching strategies to write unused data to disk, indexing mechanisms for efficient retrieval of these graphs. Storing and managing graph data on disks suffers from very poor I/O latency, and it is not possible to store the entire graph in the memory. Solid State Drive (SSD)’s are also an efficient way to store or cache the data. Most of the graph databases provide some basic cache management and indexing schemes, which may not be optimal for all types of graphs, or graph operations. The strategies for storing the graph in a single or distributed nodes, the dynamic nature of the data (bursty, or highly dynamic), the topology of the graph, the type of processing that needs to be done, etc.
One of the most widely used graph database Neo4j [20] for example stores the graph on the disk, and retrieves them into the main memory for computation. FlockDB from Twitter, RDF based AllegroGraph [21], and Objectivity’s InfiniteGraph [22] are all well-known distributed databases than can support storing node or edge labels as temporal attributes. The choice of graph database depends on the requirements of the application and graph type. This includes storing features (main memory, external storage, indexing), the graph structures to store temporal attributes (either on nodes, edges, or graphs) for efficient retrieval.
B. Graph Analytics TEGs evolve over time as new edges or nodes are added
while some old ones vanish and it is important to understand and extract patterns following these evolutionary changes. The complexity of these algorithms depend on the speed of evolution of these graphs (1) slowly evolving graphs are those where the substantial changes occur on a large time scale of days or weeks e.g. web based networks, citation graphs etc. and (2) streaming or fast evolving graphs where overall graph structure changes very rapidly in matter of seconds e.g. social media graphs, transportation networks etc. [12][13][14][23]. Based on the domain and data at hand different analysis models can be built and a brief summary of some high level tasks are explained below:
Table 1. A summary of graph analysis operations
Type of Temporal Characteristic Graph Operations
Temporal network topology & structure Degree, connectivity, density
Reachability analysis Paths, walks, trails Predicting network topological
properties Link prediction & classification
Detecting outliers Node or edge clustering Node neighborhoods and
communities Persistent patterns & motifs

Feature Article: Raju N. Gottumukkala, Siva R. Venna and Vijay Raghavan
IEEE Intelligent Informatics Bulletin December 2015 Vol.16 No.1
13
V. VISUAL REPRESENTATION & USER INTERACTION The overall goal of visualization is to enable users to obtain
insights from data. Given the scalability and dynamic nature of time evolving graphs – visualization needs to take into account how much information can be perceived and understood, computed and displayed. These include the graph topology to be projected (graph representation) into 2D or 3D space using different layout schemes, understanding what interaction and human computer interface tools are best suitable, and how to render data efficiently on display screens. These factors are common for visualization of any large-scale multivariate graphs.
In the case of visualizing TEG’s, users need to understand changes in the graph (the temporal aspect) in terms of the nodes, edges or the subgraph, their topological structure, or graph characteristics The most common way to represent dynamic graphs are animated diagrams, or static graphs with a timeline.
A. Animation-based visualization:
When no interaction or manipulation of graphs
is desired, a simplest way to show temporal evolution is through animation. A graph is constructed by creating an animation from a series of graphs at different time stamps. An initial supergraph layout is created to have a consistent layout for graphs in multiple time-stamps. Generally a super graph is constructed using the graphs from considered time stamps and a single graph layout is computed as shown in Figure 5 [19]. There are several
variations of animation based approaches that represent the time transitions using color coding, shape, or layout techniques that were covered in [19].
B. Timeline-based visualization: Another way (and the most common way) to display temporal evolution is by projecting time into space dimension. This can be done multiple ways by juxtaposed node-link presentation over
time (refer Figure 6(a)), or superimposed nodes and links
where layers are used to represent time-stamps (refer Figure 6(b)). The temporal changes in graphs may also be represented by matrix-based approaches which are better suitable for more readability. The matrix notation provides the ability to encode dynamic changes in the cell and an edge using colors, and charts. For example, Figure 6(c) uses super-imposed node-link approach to show different forms of intracell timeline representation.
For visualizing TEGs it is important to choose a good visual representation to show them in a presentable and understandable format and these visual representations should reduce visual clutter and minimize temporal aliases for node positions across time, maximize readability and scalability. Selecting a visual representation for TEGs is restricted by the data at hand, the size of the graph, amount of data to visualize, purpose of the visualization etc. Some of the visual representations are limited by graph layouts as it is difficult to find automatic layouts for static graphs and to do that for every time stamp is an enormous task [18][20]. Other extensions to the animation-based and timeline-based visualization techniques include 3D visualization [24][25], hybrid representations combining animation and timeline drawings. Several application specific visualization techniques are available in literature – these include time line trees [26], tree maps [27], icicle plots [28], node link diagrams with time series [29], time arc trees [30], etc.
C. Human Computer Interaction The Human Computer Interaction (HCI) enables users to
browse the data set with set of interactions using a human computer interface to discover hidden insights on the data. An effective HCI is equally important as visual representation for a good VA framework. These HCIs should enable the user to have control over what and how they want to see and to define the flow and parameters of decision informatics. Recent studies [31][32][33] provided taxonomies for visual interactions techniques to help better understand and improve VA designs. Interactions with the visual representations are divided into three high level categories: Data and view specifications: HCI should allow the user to reconfigure the views based on attributes of interest, to filter portions of the graph, to derive simple analytics using statistical computations. View manipulations: User should be able to select, highlight and bookmark portions of the graph by either manual selection or through search criterion, to navigate and explore over graphs using zooming, magic and fish eyed lenses, panning etc., should allow the user to coordinate and organize multiple views for easy comparisons of results from different interactions. Process and Provenance: VA systems should record different interactions for fast recall or revisiting of past analyses, they should also support multi-user-collaboration, reporting, and sharing of views, interactions and results.
The other important aspect of visualization is rendering the graph to display large scale datasets. GPU based rendering is becoming increasingly common. Gephi provides a time-
Figure 5 (a). Constructing a super graph from 3 sequential dynamic graphs, (b) A simple
animation for a small TEG
Figure 6(a). Juxtaposed node-link based timeline presentation
Figure 6(b). Super-imposed node-link approach with layers representing time steps
Figure 6(c). Intra-cell timelines in a matrix representation

Feature Article: Visual Analytics of Time Evolving Large-scale Graphs
December 2015 Vol.16 No.1 IEEE Intelligent Informatics Bulletin
14
sliding based tool to navigate a time-varying graph. There are several other rendering techniques for multi-variate graphs that can be applied for time-varying graphs. There are several graph visualization libraries and tools available for use. There are several network visualization tools available for use. The choice of tools depends on the size, scale, the nature of the graphs, the type of analysis (flow-based, relationships, clusters, cliques), and the platform for visualization (desktop or web browser). Some of the widely used visualization desktop visualization tools are Gephi,[34] Cytoscape [35], Palantir [36], and Dato (GraphLab) [37]. There are also several web-based visualization libraries that include D3.js [38], Sigma.js [39], and Vivagraph.js [40]. A more detailed list of visualization tools are available in [41].
VI. A SANDBOX IMPLEMENTATION OF REAL-TIME VISUAL ANALYTICS PLATFORM
Table 2. Description of various tasks performed by different components of
the Visual Analytics Sandbox
The visual analytics sandbox environment is an experimental infrastructure for developing novel integrated data stream management, analytics and visualization algorithms for multiple application domains.
The big data system architecture (refer Figure 7) provides an end-to-end implementation of a system that consumes data streams, constructs graphs and updates the TEG stored in the graph database based on new incoming data streams. The dynamically updated TEG can be accessed by a browser, a 3D environment, or a multi-touch interface. The message broker receives data streams from multiple real-time sources, integrates these streams and sends them to a spark cluster. The spark cluster does initial pre-processing in terms of extracting relevant information, reducing the dimension of the graph. A graph is constructed for every time window. The transformed graph is loaded into an in-memory graph database. The temporal information about nodes and edges are updated in the new transformed graph. The graph can be queried from a visual interface. The queries include basic node and edge based statistics, to mining motifs, cliques, and other persistent graph patterns. The visual interface has various libraries for multiple devices.
VII. CASE STUDIES
A. Real-time Forecasting of Influenza Influenza is one of the major causes of deaths throughout the
world and is the top medical reason for Emergency Department (ED) visits. In this case study, we aim to forecast flu counts using historical data from heterogeneous data sources that includes electronic records Google Flu Trends (GFT) data and other environmental variables like Temperature, Precipitation, humidity etc. These datasets are integrated to create a graph-based model to forecast influenza across different geographical locations. The results of the flu prediction model are available for viewing both on a browser and multi-touch interface.
B. Link prediction Link prediction is a widely used social network analysis
tool. Link prediction has wide range of applications such as identifying missing information, identifying spurious interactions, and studying the evolution of a network. In ecommerce, link prediction is used for building recommendation systems; and in bio-informatics, it is used to predict protein-protein interactions.
A supervised method to predict unknown association of medical concepts, using bio-medical publication information from Medline [43], is proposed and evaluated. Medline is a National Institute of Health (NIH)’s citation database with more than 21 million publication citations. A temporal series of concept networks are generated using relevant medical concepts extracted from these publications, by segmenting the data over multiple time snapshots. In a concept network, each node represents a bio-medical concept and an edge between two nodes represents relationship that two medical concepts
Component Purpose Methods
Data broker
Integration and distribution of different data
streams
Social media streams, Internet traffic streams, Sensor network
streams etc.
Online data preparation
Collect data and prepare for pre-
processing
Data collection, integration, normalization, representation
(schema) etc.
Distributed pre-
processing
Improve quality of the data
Data cleaning, correction, transformation, dimensionality
reduction etc.
Batch processing
Generate and clean graphs
Graph generation, pruning, clustering, transformation etc.
Analytics Engine Graph processing
Graph querying – topology, paths, walks, persistent patterns,
motifs, link classification and prediction etc.
Visual processing
Prepare graphs for visualization
Layout computation, visual representation
Visual interface User interaction Web based, 3D exploration and
Multi touch interfaces
Figure 7. A Reference Visual Analytics Sandbox Implementation

Feature Article: Raju N. Gottumukkala, Siva R. Venna and Vijay Raghavan
IEEE Intelligent Informatics Bulletin December 2015 Vol.16 No.1
15
that co-occurred in at least in one publication. The document frequency of a given concept is the weight of the node and the co-occurrence frequency of two concepts is the weight of the edge connecting them. Now, the link prediction problem is formulated as a process of identifying whether a pair of concepts, which are not directly connected in the current duration concept network, will be connected directly in the future. A concept pair is labeled positive if a direct connection occurs in a future time snapshot; otherwise, the pair is negative. For each concept pair in the labeled data set, a set of topological features (random-walk based and neighborhood-based) is extracted from the current snapshot of the concept network. Supervised classification algorithms, such as SVM, and C4.5 decision tree are used to generate prediction models. The experimental evaluations show that the performance of our approach is in the range of 68 – 72%, in terms of classification accuracy, recall and precision.
C. Social Media: Detecting Emerging Events Many events happen every day across the world and people
often comment on events in real time, with thousands of tweets posted in real time. Prominent examples for this include the US Airways plane clash on Hudson and bombings at Boston marathon. There are also other types of user generated content, such as microblogs, catering to users communicating among each other or sharing information. The goal of new event detection (also referred to as event detection) is to identify the first story to detect a particular event. It is beneficial to identify these stories and report on them as soon as possible. This implies that we need to process the data in real-time, since these microblogs are faster and more up to date compared to traditional news stories. Prior works done on event detection on Twitter domain either perform a post-hoc analysis of tweets and detect events that have already happened or use domain-specific knowledge to identify events. Hence, most of these methods are unable to detect a broad range of events within near real time.
We developed a domain independent event detection model, which can detect an event, typically, within 4-8 minutes after the event is first mentioned and can track it in real time. A graph based approach is employed, where each node is an individual token that appeared in a tweet and edges represent the co-occurrence frequencies of the tokens. The detection task is accomplished by conducting the following four steps. First, a fast and efficient divergence model is used to identify unusual activity in the usage of words. Second, we build a co-occurrence graph around those words with unusual activity. Third, candidate events are extracted from the graph using a combination of fast and efficient graph pruning techniques and a graph clustering method. Fourth, spurious clusters (non-events) are eliminated via an event evolution model, which requires candidate events to be discussed for certain duration of time before being considered a real event. Evaluation of our approach, compared to similar work [44], shows that the proposed method detects a greater percentage of known true events and a greater number of true events. Moreover, events are detected earlier.
VIII. RESEARCH CHALLENGES Visual analytics of TEG is an emerging discipline. Given the
demand and challenges, there are several emerging paradigms in data management, analysis and visualization aspects of these graphs. Below are some of the research challenges.
Scalability: The growing dynamic data is pushing the size of these graphs, and this naturally introduces challenges in every stage of visual analytics, pre-processing, graph loading, mining, and visualization. The layout algorithms for visualizing the large scale graphs need to take the dynamic evolution of these graphs – which is a hard problem because it is hard to estimate the layout of the graphs in domains such as social media where topic and event evolution are so rapid and unpredictable. Better user controlled graph simplification approaches are needed for filtering, sampling, and aggregation of the graphs.
A. Graph processing and interaction: Most of the existing graph processing and visual analytics techniques employ black box techniques where the user has no knowledge or control over the analysis process. System should be designed to allow the user to guide and control the parameters during the analysis. B. Perception in visualization: Human perception plays a major role in visualization of TEGs as it supports the cognitive associated process. Visualizations should support exploration and stimulate the capabilities of human visual system. C. In situ analysis: Traditional approaches for storing the data into secondary storage and analyzing later are not feasible with large scale TEGs, especially for fast evolving graphs. Visual analytics system should explore the idea of in situ analysis and process the data as much as it can while still the data is in memory. Major challenge to address with in situ analysis is to effectively share computing resources and collaborate with overall process flow and other user interactions [42]. D. Parallel Algorithms: To be on pace with the ever increasing size of graphs and their evolution speed, parallel processing should be explored. As computing resources are getting cheaper and equipped with multiple cores it is necessary to redesign most of the graph processing and visualization algorithms to support parallel processing. E. Applications: Designing graph visual analytics frameworks that adapts fast across different application domains is necessary as each application has specific analysis focus and data type. Building such an integrated unified visual analytics framework for TEGs is a difficult task. F. Availability of APIs and other development libraries: Lack of resource libraries supporting integrated visual analytics for TEGs hinders the rapid application development in this scenario. Most of the graph algorithms are designed to support static graphs and some of these have limitations while adapting for TEGs and in most cases needs to developed from scratch which is time consuming and costly.

Feature Article: Visual Analytics of Time Evolving Large-scale Graphs
December 2015 Vol.16 No.1 IEEE Intelligent Informatics Bulletin
16
IX. CONCLUSION The work presented in this paper is the state-of-the-art in
visual analytics of time evolving graphs – which is a growing and active discipline given the explosion of datasets arriving from real-world sources. We first cover background definition of Time evolving graphs, how they are represented, stored and visualized, then we discuss visual analytics as a framework for time evolving graphs. Then we discuss sine ongoing research and tools available for building analytics engine component. Then various visualization techniques and tools for visualization and interaction are discussed. Reference visual analytics sandbox architecture is presented that is currently being developed by the authors. Various research case studies are presented that leverage this sandbox. Finally research challenges are presented.
X. ACKNOWLEDGEMENTS This material is based upon work supported by: NSF Grant
No.1429526 and NSF Grant No. 1160958
XI. REFERENCES [1] Greene, Derek, and Pádraig Cunningham. "Producing a unified graph
representation from multiple social network views." Proceedings of the 5th Annual ACM Web Science Conference. ACM, 2013.
[2] Scott, John. Social network analysis. Sage, 2012. [3] Danon, Leon, et al. "Networks and the epidemiology of infectious
disease." Interdisciplinary perspectives on infectious diseases (2011). [4] Iliofotou, Marios, et al. "Graption: Automated detection of P2P
applications using traffic dispersion graphs (TDGs)." University of California, Riverside Report, UCR-CS-2008096080 (2008).
[5] Holme, Petter. "Modern temporal network theory: a colloquium." The European Physical Journal B 88.9 (2015): 1-30.
[6] Holme, Petter, and Jari Saramäki. "Temporal networks." Physics reports 519.3 (2012): 97-125.
[7] Casteigts, Arnaud, et al. "Time-varying graphs and dynamic networks." International Journal of Parallel, Emergent and Distributed Systems 27.5 (2012): 387-408.
[8] Cardillo, Alessio, et al. "Evolutionary dynamics of time-resolved social interactions." Physical Review E 90.5 (2014): 052825.
[9] Tang, John, et al. "Exploiting temporal complex network metrics in mobile malware containment." World of Wireless, Mobile and Multimedia Networks (WoWMoM), 2011 IEEE International Symposium on a. IEEE, 2011.
[10] Dong, Yuxiao, et al. "Link prediction and recommendation across heterogeneous social networks." Data Mining (ICDM), 2012 IEEE 12th International Conference on. IEEE, 2012.
[11] Wehmuth, Klaus, Artur Ziviani, and Eric Fleury. "A unifying model for representing time-varying graphs." arXiv preprint arXiv:1402.3488 (2014).
[12] V. Kostakos, “Temporal graphs,” Physica A: Statistical Mechanics and its Applications, vol. 388, no. 6, pp. 1007–1023, Mar. 2009
[13] Aggarwal, Charu, and Karthik Subbian. "Evolutionary network analysis: A survey." ACM Computing Surveys (CSUR) 47.1 (2014): 10.
[14] Wehmuth, Klaus, Artur Ziviani, and Eric Fleury. "Model for Time-Varying Graphs." Workshop on Dynamic Networks. 2013
[15] Tang, John, et al. "Analysing information flows and key mediators through temporal centrality metrics." Proceedings of the 3rd Workshop on Social Network Systems. ACM, 2010.
[16] Cook, Kristin A., and James J. Thomas. Illuminating the path: The research and development agenda for visual analytics. No. PNNL-SA-45230. Pacific Northwest National Laboratory (PNNL), Richland, WA (US), 2005.
[17] Keim, Daniel A., et al., eds. Mastering the information age-solving problems with visual analytics. Florian Mansmann, 2010.
[18] Von Landesberger, Tatiana, et al. "Visual analysis of large graphs: state‐of‐the‐art and future research challenges." Computer graphics forum. Vol. 30. No. 6. Blackwell Publishing Ltd, 2011.
[19] Beck, Fabian, et al. "The state of the art in visualizing dynamic graphs." EuroVis STAR (2014).
[20] Miller, Justin J. "Graph Database Applications and Concepts with Neo4j." Proceedings of the Southern Association for Information Systems Conference, Atlanta, GA, USA March 23rd-24th. 2013.
[21] Aasman, Jans. Allegro graph: RDF triple database. Technical report. Franz Incorporated, 2006.url:http://www. franz. com/agraph/allegrograph/(visited on 10/14/2013)(cited on pp. 52, 54),
[22] InfiniteGraph: The Distributed Graph Database, a performance and distributed performance benchmark of InfiniteGraph and a Leading Open Source Graph Database using synthetic data, 32 Infinite Graph, white paper from Objectivity, http://www.objectivity.com/wpcontent/uploads/Objectivity_WP_IG_Distr_Benchmark.pdf, 2012.
[23] Pienta, Robert, et al. "Scalable graph exploration and visualization: Sensemaking challenges and opportunities." Big Data and Smart Computing (BigComp), 2015 International Conference on. IEEE, 2015.
[24] Archambault, D., T. Munzner, and D. Auber. "Visual exploration of complex time-varying graphs." Visualization and Computer Graphics, IEEE Transactions on 12.5 (2006): 805-812.
[25] Gaertler, Marco, and Dorothea Wagner. "A hybrid model for drawing dynamic and evolving graphs." Graph Drawing. Springer Berlin Heidelberg, 2006.
[26] Burch, Michael, Fabian Beck, and Stephan Diehl. "Timeline trees: visualizing sequences of transactions in information hierarchies." Proceedings of the working conference on Advanced visual interfaces. ACM, 2008.
[27] Hao, Ming C., et al. "Importance-driven visualization layouts for large time series data." Information Visualization, 2005. INFOVIS 2005. IEEE Symposium on. IEEE, 2005.
[28] Tekušová, Tatiana, and Tobias Schreck. "Visualizing time-dependent data in multivariate hierarchic plots-design and evaluation of an economic application." Information Visualisation, 2008. IV'08. 12th International Conference. IEEE, 2008.
[29] Saraiya, Purvi, Peter Lee, and Chris North. "Visualization of graphs with associated timeseries data." Information Visualization, 2005. INFOVIS 2005. IEEE Symposium on. IEEE, 2005.
[30] Greilich, Martin, Michael Burch, and Stephan Diehl. "Visualizing the evolution of compound digraphs with TimeArcTrees." Computer Graphics Forum. Vol. 28. No. 3. Blackwell Publishing Ltd, 2009.
[31] Kerren, Andreas, and Falk Schreiber. "Toward the role of interaction in visual analytics." Proceedings of the Winter Simulation Conference. Winter Simulation Conference, 2012.
[32] Heer, Jeffrey, and Ben Shneiderman. "Interactive dynamics for visual analysis." Queue 10.2 (2012): 30.
[33] Yi, J.S., Y. a. Kang, J. Stasko, and J. Jacko. “Toward a deeper understanding of the role of interaction in information visualization”. IEEE Transactions on Visualization and Computer Graphics 13(6) 1224-1231, 2007.
[34] Gephi: http://gephi.github.io/ (accessed - 17 November 2015) [35] Cytoscape: http://www.cytoscape.org/ (accessed - 17 November 2015) [36] Palantir: https://www.palantir.com/ (accessed - 17 November 2015) [37] Dato (GraphLab): https://dato.com (accessed - 17 November 2015) [38] D3.js: http://d3js.org/ (accessed - 17 November 2015) [39] Sigma.js: http://sigmajs.org/ (accessed - 17 November 2015) [40] VivaGraph.js: https://github.com/anvaka/VivaGraphJS (accessed - 17
November 2015) [41] http://www.kdnuggets.com/2015/06/top-30-social-network-analysis-
visualization-tools.html (accessed - 17 November 2015) [42] Wong, Pak Chung, et al. "The top 10 challenges in extreme-scale visual
analytics." IEEE computer graphics and applications 32.4 (2012): 63. [43] MEDLINE: http://www.ncbi.nlm.nih.gov/pubmed/ (accessed - 17
November 2015) [44] M. Cataldi, L. Di Caro, and C. Schifanella, “Emerging topic detection on
twitter based on temporal and socialterms evaluation,” in Proc. of the Tenth International Workshop on Multimedia Data Mining, 2010, p. 4.

Feature Article: Paul F.M.J. Verschure
IEEE Intelligent Informatics Bulletin December 2015 Vol.16 No.1
17
Abstract—“A mind which at a given instant should know all the forces acting in nature, as also the respective situation of the beings of which it consists—provided its powers were sufficiently vast to analyze all these data—could embrace in one formula the movements of the largest bodies in the universe as well as those of the smallest atom; nothing would be uncertain for such a mind, and the future, like the past, would be present to its eyes.” Laplace (1814).
I. INTRODUCTION HEN Galileo pointed the telescope, copied from a Flemish spectacle maker to the heavens, he was testing
the then heretic heliocentric model of Copernicus. At the time that ideas were hard to develop or even express publically, data was even harder to obtain due to a lack of instrumentation. Now 4 centuries later, in the age of big data the situation has reversed: we have the capacity to rapidly accumulate petabytes of data that now seek ideas in order to become meaningful. Hence, the traditional model of science, as exemplified by Galileo, where the inquisitive human mind is testing hypotheses by matching them to experience, is challenged by an approach where an ocean of data points awaits ideas. This is largely an artifact of the increasing dependence of science on technology, which can autonomously spew out data at an ever-increasing rate. The risk of this development is that we deteriorate from a barbarism of specialization [1] to a barbarism of agnosia, where we willingly sacrifice knowledge in favor of maintaining a costly data generation machine. This is by no means an argument for a data free science, but rather an argument in favor of restoring the relationship between hypotheses and data in order to conserve the scientific model, as we know it.
In the mid 1990ies the OECD Global Science Forum showed the foresight that neuroscience would be facing a big data challenge and initiated a working group on Neuroinformatics which released two reports sketching the challenges of neuroinformatics 1999 and 20021, requesting the formation of an International Neuroinformatics Coordination Facility, which in a competitive call was placed in Stockholm. In this process two main schools of thought were at loggerheads. The first we could call the Bottom Up or Laplacian School, which believes that all data is to be collected and stored and the problem of interpretation and
Paul F.M.J. Verschure is Research professor in Catalan Institute of Advanced Research (ICREA), Professor at the Technology Department, Universitat Pompeu Fabra, Director of the Center of Autonomous Systems and Neurorobotics (NRAS) and Scientific Director of the Master in Cognitive Systems and Interactive Media (CSIM).
These reports can be downloaded from specs.upf.edu/
relevance can be postponed to some future moment relying on to be invented machine solutions. More importantly, it assumes that nature is ruled by bottom up causality, is deterministic and that through the accumulation of data, knowledge will emerge without further human intellectual interference. It is also this, so called, bottom up modeling belief that defines the philosophy implicit in current large-scale brain research projects and already articulated by Laplace in the early 19th century quoted at the beginning of this article [2]. The second school, which we could call the Counter Stream School, advocated a perspective where data should be collected, preserved and curated relative to specific theoretical and experimental contexts. Where theories and carefully selected target systems would provide a framework for the future use and interpretation of specific data sets. Now 20 years later we see that the Laplacian School has won the battle for resources but lost the one of science. This cannot be seen as a coincidence, which I further analyze in [3]. For instance, a recent study to reconstruct a 1,500 cubic micron volume of mouse neocortex showed that rather then advancing understanding, this ‘‘omics’’ effort revealed practically insurmountable problems faced by bottom up neuroscience, or as the authors put it “some may therefore read this work as a cautionary tale that the task is impossible” [4]. Laplace’s determinism does not seem to translate well to the reality of empirical science as it is lived at the bench.
So if big data is the problem what is the solution? We do have to acknowledge that as the human mind is the prime instrument of science this also or especially holds for the study of the mind and its substrate the brain. Big data is not only a technical problem; it is also a psychological one. The human mind is not Laplace’s demon and as a product of biological evolution has finite memory, limited reasoning capacity and comes equipped with surprising biases [5]. In addition, also our machine learning algorithms have not been able to overcome the classic symbol grounding problem or it still falls to humans to give meaning to regularities identified by automated classification and/or reasoning. Hence, given these considerations I propose that we do need to develop a new class of scientific instruments that aim at linking the human mind to data in the service of discovery. This discovery should be structured in the induction, abduction and deduction cycle of empirical science and advance theories as models of reality that are empirically adequate [6], allowing us to explain, predict and control the sources behind the observations we make. We could call these new instruments Hypothesis Accelerators and we have constructed the very first one at SPECS lab in Barcelona called BRAINX3 (Figure 1; brainx3.com).
BRAINX3 capitalizes on advances in visualization, sonification and immersive virtual reality technologies, combining them with cutting edge technologies from data
BRAINX3: A New Scientific Instrument for the Acceleration of Hypotheses on Mind and Brain
Paul F.M.J. Verschure
W

Feature Article: BRAINX3: A New Scientific Instrument for the Acceleration of Hypotheses on Mind and Brain
December 2015 Vol.16 No.1 IEEE Intelligent Informatics Bulletin
18
analysis, statistics, data representation and Human Computer Interaction. It combines two fundamental components of the psychology of discovery. First, it follows a model of creativity. Since Poincare and Helmholtz the creative process is seen to comprise a number of stages [7]: preparation: the acquisition of domain knowledge; incubation: the rearrangement of knowledge by memory processes; insight/illumination: the conscious experience of a new idea; verification/evaluation: the assessment of the validity of the idea given the rules and conventions of the domain and upon acceptance elaboration to bring out all implications. The psychology of creativity directly pertains to the fundamental epistemological question of the logic of discovery or how can induction give rise to rules that can in turn be applied deductively? Charles Sanders Pearce called this stage: abduction. BRAINX3 defines a workflow that supports these four stages of the creative process. Secondly, BRAINX3 acknowledges that conscious awareness is only reflecting a sliver of mental states and experience is predated on subconscious operations [8-10]. Indeed, a relationship between states of (sub)consciousness and problem solving has been identified [11, 12] and it has been suggested that their computations are comparable [13]. Hence, using technology to either bring subconscious states to consciousness and/or to optimize conscious information processing relative to subconscious states can be considered beneficial in the exploration of large data sets because especially here humans are operating at the edge of their mental capacity.
Figure 1: The BRAINX3 Neuroscience Hypothesis Accelerator
[14] developed using the eXperience Induction Machine (XIM) [15] and the IQR large-scale neuronal simulator [16]. BRAINX3 divides the XIM space in four domains defined by each projection wall: Navigation overview (Left panel); Workspace (Middle); Knowledge display accessing the “semantomics” of the data derived from pertinent online databases [17](Right); User monitoring and experimental log (Back panel - not visible). The symbols at the bottom of the Workspace display represent – from left to right - “Reset”, “Lesion”, “Bookmark”, “Stimulate”, “Visualization mode”, and “Analysis mode”. At the right upper corner the icon for the, so-called, sentient agent is placed which provides user dependent guidance. User states are derived using a sensing glove for grasping movements and EDR, a wearable eye tracker, a sensing shirt measuring breathing and ECG [18]. The user can freely navigate through the space to control the zoom level while gestures are used to
rotate the data visualization captured by a multi-modal tracking system. See text for further explanation.
The design of BRAINX3 allows the user to interact with
complex neuroscience data sets through 4 distinct representations in XIM that support distinct actions of the user. XIM is an immersive and interactive 5x5 M equipped with 360 degrees projection, an interactive luminous floor, a marker-free tracking system, microphones, a spatialized sonification system and wearable sensors that has been constructed to conduct empirical human behavioral studies under ecologically valid conditions. We have used BRAINX3 for a number of studies of the human connectome most notably addressing the question of how lesions to the human brain affect its dynamics identifying a specific loss of coherence of neuronal activity and enhanced noise due to aging and or drugs [14]. We have placed emphasis on validating the approach we have taken by looking at the ability of novice users of BRAINX3 to extract causal structure from complex networks. In one study we compared the understanding of network structures between users of the state of the art connectomics tools against those using BRAINX3 and its immersive interactive big data exploration [19]. We observed that BRAINX3 users had a better understanding of complex causal structures than users of desktop tools. Subsequently we have evaluated the impact of the, so called, Sentient Agent (SA), which assesse in real time the mental state of the user by automatically evaluating their actions, ECG, EDR, breathing, eye movements and pupil dilation [20]. These measures are used to define a user model that includes their level of arousal, stress and cognitive load. The SA adjusts the complexity of the data presentation and the guiding cues in response to the state of the user. Reducing complexity at moments of high cognitive load and stress and increasing it when users signal to be under aroused. In a direct validation study of this closed loop data presentation system, we observed that users that were exploring an artificially generated network assisted by the SA made decisions more quickly. In addition the SA, on the basis of the cognitive load measures could predict their errors. This provides direct empirical support for the psychological model of data exploration that we have implemented in BRAINX3. Hence, BRAINX3 has shown to be scientifically relevant and empirically valid opening up new avenues for further applications.
II. CONCLUSION The argument behind the development of BRAINX3 is that
we need new scientific instruments that allow the human mind to be more efficiently connected to complex data. This is required in this case in order to re-establish the balance between data and theory in the study of the brain. BRAINX3 builds on the eXperience Induction Machine (XIM) and integrates a range of technologies from multi-modal HCI to real-time physiological sensing, large-scale neuronal simulation and omics scale data analysis. Our empirical validation studies have shown that BRAINX3 users have a better understanding of complex brain data than control

Feature Article: Paul F.M.J. Verschure
IEEE Intelligent Informatics Bulletin December 2015 Vol.16 No.1
19
groups using state of the art neuroinformatics tools. Giving further credence to the hypotheses that have driven the development of this new scientific instrument and encouraging its application to other big data domains.
The example of BRAINX3 also shows that it is of some relevance to not only develop neuroinformatics tools and use them but to also take the underlying human factors, interfaces, interaction and user models into account. In that sense the empirical validation of BRAINX3 might be relatively new for neuroinformatics tools, but should become part and parcel of the practice of developing these data accessibility instruments.
The question I have not addressed here is how data exploration is to be embedded in theory and what kinds of theories these should be, i.e. large scale brain networks can not be understood from the perspective of isolated microscopic scale theories. In our own work we have linked BRAINX3 to a multi-scale theory of mind and brain, called Distributed Adaptive Control (DAC) [21], which spans anatomy, physiology and behavior and is advanced at a range of levels from microscopic circuits [22] to integrated brain systems [23]. In addition, we have imposed an additional level of validation by linking BRAINX3 to diagnostics and prognostics in the treatment of stroke using patient specific structural and functional data [14], which we have combined with effective brain theory based (DAC) stroke interventions [24-26]. Hence, BRAINX3 foresees a future of neuroinformatics tools that will converge towards the confluence of system level brain theory, empirical observation and clinical impact as advocated all those years ago in the OECD-GSF working group. I predict that it will be a more cost effective way to make progress in understanding mind and brain and transforming this knowledge into societal relevance as opposed to churning wheel of the big data generator and waiting for the miracle of all the bits to fall in place. However, it does imply that one must have ideas that one is willing to submit to empirical scrutiny or, in other words, return to the core value of science.
III. ACKNOWLEDGEMENTS I thank my colleagues Pedro Omedas and Gregory Zegarek
for their feedback to an earlier version of this manuscript. The research leading to these results has received funding from the European Research Council under grant agreement n. 341196 [CDAC].
IV. REFERENCES [1] Ortega y Gasset, J., The revolt of the masses. 1930/1993: WW Norton. [2] Laplace, P.S., A Philosophical Essay on Probabilities / Essai
Philosophique sur les Probabilités, . 1814/1951, New York: Dover. [3] Verschure , P.F.M.J., From Big Data back to Big Ideas: The risks of a
theory free data rich science of mind and brain and a solution. Connection Science, 2015 (In Press).
[4] Kasthuri, N., et al., Saturated reconstruction of a volume of neocortex. Cell, 2015. 162(3): p. 648-661.
[5] Kahneman, D., Thinking, fast and slow. 2011: Farrar, Straus and Giroux. [6] Van Fraassen, B., The Scientific Image. 1980, Oxford: Oxford
University Press. [7] Sternberg, R.S., ed. Handbook of Creativity. 1999, Cambridge Univ.
Press: Cambridge. [8] Baars, B.J., A cognitive theory of consciousness. 1988, New York, NY:
Cambridge University Press.
[9] Wegner, D.M., The Illusion of Conscious Will. 2003, Cambridge, Ma.: MIT Press.
[10] Custers, R. and H. Aarts, The unconscious will: how the pursuit of goals operates outside of conscious awareness. Science, 2010. 329(5987): p. 47-50.
[11] Cai, D.J., et al., REM, not incubation, improves creativity by priming associative networks. Proceedings of the National Academy of Sciences USA, 2009. 106(25): p. 10130-4.
[12] Dijksterhuis, A. and T. Meurs, Where creativity resides: The generative power of unconscious thought. Consciousness and Cognition, 2006. 15(1): p. 135-146.
[13] Hassin, R.R., Yes it can on the functional abilities of the human unconscious. Perspectives on Psychological Science, 2013. 8(2): p. 195-207.
[14] Arsiwalla, X.D., et al., Network dynamics with BrainX3: a large-scale simulation of the human brain network with real-time interaction. Frontiers in Neuroinformatics, 2015. 9.
[15] Bernardet, U., et al., Quantifying human subjective experience and social interaction using the eXperience Induction Machine. Brain research bulletin, 2011. 85(5): p. 305-312.
[16] Bernardet, U. and P. Verschure, iqr: A Tool for the Construction of Multi-level Simulations of Brain and Behaviour. Neuroinformatics, 2010. 8: p. 113-134.
[17] Arsiwalla, X.D., et al., Connectomics to Semantomics: Addressing the Brain's Big Data Challenge. Procedia Computer Science, 2015. 53: p. 48-55.
[18] Betella, A., et al., Inference of human affective states from psychophysiological measurements extracted under ecologically valid conditions. Frontiers in neuroscience, 2014. 8.
[19] Betella, A., et al. Advanced Interfaces to Stem the Data Deluge in Mixed Reality: Placing Human (un)Consciousness in the Loop. in SIGGRAPH 20013. 2013. Los Angeles.
[20] Cetnarski, R., et al., Symbiotic Adaptive Interfaces: A Case Study Using BrainX3, in Symbiotic Interaction. 2015, Springer. p. 33-44.
[21] Verschure, P.F.M.J., The Distributed Adaptive Control Architecture of the Mind, Brain, Body Nexus. Biologically Inspired Cognitive Architecture - BICA, 2012. 1(1): p. 55–72.
[22] Herreros, I. and P.F. Verschure, Nucleo-olivary inhibition balances the interaction between the reactive and adaptive layers in motor control. Neural Networks, 2013. 47: p. 64-71.
[23] Maffei, G., et al., An embodied biologically constrained model of foraging: from classical and operant conditioning to adaptive real-world behavior in DAC-X. Neural Networks, 2015.
[24] Cameirão, M.S., et al., The Combined Impact of Virtual Reality Neurorehabilitation and Its Interfaces on Upper Extremity Functional Recovery in Patients With Chronic Stroke. Stroke, 2012. 43(10): p. 2720-28.
[25] Cameirao, M.S., et al., Virtual reality based rehabilitation speeds up functional recovery of the upper extremities after stroke: a randomized controlled pilot study in the acute phase of stroke using the Rehabilitation Gaming System. Restorative neurology and neuroscience, 2011. 29: p. 1-12.
[26] Ballester, B.R., et al., The visual amplification of goal-oriented movements counteracts acquired non-use in hemiparetic stroke patients. 2015. p. 1-11.

20 Feature Article: Imprecision in Machine Learning and AI
Imprecision in Machine Learning and AICassio P. de Campos and Alessandro Antonucci
I. MOTIVATING IMPRECISE PROBABILITIES
IN this note we consider five different relevant problemsin AI and machine learning. We argue that possible solu-
tions to such problems might be achieved by replacing theprobability distributions in the systems with sets of them.Such a robust approach is based on the so-called imprecise-probabilistic framework. The proposed solutions provide a per-suasive justification of the imprecise framework. The problemswe consider are:
• proper treatment of missing data,• reliable classification,• sensitivity analysis,• feature selection,• elicitation of qualitative expert knowledge.Before reporting a separate discussion for each problem,let us briefly resume the general ideas characterising
imprecise-probabilistic methods.
II. BEYOND CLASSICAL PROBABILITY
Standard approaches to uncertainty modelling assume thatthe lack of knowledge about the actual state of a quantityis described by probabilities over its possible states (or bydensities when coping with continuous variables). Followinga subjective (also called epistemic) interpretation, these num-bers can be regarded as relative strengths (e.g., measured inbehavioural terms) for the beliefs that the quantity is in aparticular state. Those probabilities might be elicited fromexpert knowledge or summarise the result of a statisticalprocessing of historical data. Sharp (or, say, precise) values aretypically used to quantify these probabilities. In many casesthere are not compelling reasons for that and a set-valuedspecification might offer a better, or at least more cautious,description. The seminal work of Peter Walley in line with de
Alessandro Antonucci is a Senior Researcher at Dalle Molle Institute forAI (IDSIA), Manno-Lugano, Switzerland. He also teaches at the Universityof Applied Sciences and Arts of Southern Switzerland (SUPSI).
e-mail: [email protected] website: www.idsia.chCassio P. de Campos is a Reader with the Knowledge and Data Engineering
Cluster of the Queens University Belfast, Belfast, Northern Ireland, UK.e-mail: [email protected] website:www.qub.ac.uk/eeecs
Finetti’s theory of subjective probability has formalised sucha possibility, which can be addressed by replacing standard,precise, distributions with sets of them (e.g., see the figurehere below).
win
loss
draw
Fig. 1. Geometric view of probabilities for ternary quantities. The possibleoutcomes of the result of football match is win, draw, or loss. The whitepoint is a precise probability distribution modelling the fact that win is sixtimes more probable than loss. The dark gray area contains all the probabilitydistributions consistent with the fact that win is more probable than draw.
III. TREATMENT OF MISSING DATA
Consider a simple medical example. A patient presentssymptoms that could be related to lung cancer. A physiciancan run tests for bronchitis and do X-rays, as well as checkfor dyspnea. However, (supposedly) he/she can only assesswhether the patient is a smoker by asking the patients them-selves. Some patients did not answer whether or not theyare smokers in the questionnare. As an additional (somehowhidden) information consider that patients have a discount intheir insurance because they declared not to be a smoker tothe insurance company. Should smoking be ignored? Should itbe marginalized out? Should it be treated with (greater) care?
Ignoring missing data is a common practice. Yet, it can beonly justified under specific assumptions about the processmaking the output of an observation/measurement missing.Those assumptions reflect the lack of a selective mechanismtaking into account the actual value of the observed quantity.This is clearly not the case in the above medical example:the answer about the smoking habits of the patient is morelikely to be missing for smokers (see the table here below). Onthe other hand, a statistical modelling of the process makingthe data missing can be hard to assess because the lack (bydefinition) of complete data about that. The most conservativeapproach consists therefore in considering all the possiblecompletions of the missing data and learning a different modelfrom each one. This corresponds to an imprecise probabilisticapproach, in which a vacuous set (i.e., the set of all the possibledistributions modelling a condition of near ignorance) is usedto describe the incompleteness process. Although possiblyleading to less informative results, this approach should beregarded as the most reliable approach to the conservativetreatment of missing data.
December 2015 Vol.16 No.1 IEEE Intelligent Informatics Bulletin

Feature Article: Cassio P. de Campos & Alessandro Antonucci 21
PATIENT ANSWER TRUTH
1 smoker smoker
2 smoker smoker
3 smoker smoker
4 smoker smoker
5 non-smoker non-smoker
6 non-smoker non-smoker
7 unanswered smoker
8 unanswered smoker
9 unanswered smoker
10 unanswered non-smoker
Fig. 2. Results of a questionnaire about the smoking habits of ten patients.The real ratio of smokers is 70%, ignoring the missing answers would give67%, while a conservative treatment considering all the completions gives a40-80% range.
Sepal.Length
2.0 2.5 3.0 3.5 4.0 0.5 1.0 1.5 2.0 2.5
4.5
5.5
6.5
7.5
2.02.53.03.54.0
Sepal.Width
Petal.Length
12
34
56
7
4.5 5.5 6.5 7.5
0.51.01.52.02.5
1 2 3 4 5 6 7
Petal.Width
Iris Data (red=setosa,green=versicolor,blue=virginica)
Fig. 3. Two dimensional representation of the Iris dataset with the fourfeatures and three classes.
IV. RELIABLE CLASSIFICATION
Consider a standard classification setup with a collectionof objects containing some defining features that can possiblybe used to identify them. The objects can be categorized intoclasses, while the class of an object might be unknwown to us.Given a collection of objects of known classes, the problemis to build a model that can guess the class of an object ofunknown class. To demonstrate this machine learning task weconsider the naive Bayes classifer on the Iris dataset, wherethe species of an iris flower (setosa, versicolor or virginica) isdescribed by four features: sepal and petal width and length.Can we improve classification accuracy by using a imprecise-probabilistic model, for instance by providing a subset ofthe classes that certainly contains the correct one? Can weidentify hard- and easy-to-classify instances? We have usedan imprecise-probabilistic naive Bayes classifier to process theIris dataset and compared the results with the standard naiveBayes classifier. In our separation of train and test instances,the standard classifier obtains 72% of accuracy in predictingthe flower class. The imprecise-probabilistic classifier mayreturn a set of classes for each test instance instead of asingle answer. Its set accuracy (whether the true class is
within the returned classes) reaches 100% and the accuracyof the standard classifier drops to 60% when only consideringthe instances where the imprecise-probabilistic classifier hasreturned more than a single class. Hence, the imprecise-probabilistic classifier is able to identify the hard-to-classifyinstances from the dataset.
V. SENSITIVITY ANALYSIS
Probabilistic graphical models such as Markov RandomFields are popular tools in AI. Suppose that using a MarkovRandom Field, we have reached a conclusion about the mostprobable explanation for the variables in a domain, that is, wehave computed the mode of the underlying joint probabilitydistribution. Is this conclusion sensitive to modifications ofthe model, that is, would the mode be different under somesmall change in the model’s parameters? The most commonprocedure is to apply local modifications to the model andto check whether the conclusion remains inaltered. Animprecise-probabilistic network, or simply credal network,can be efficiently used to verify whether the mode is uniquefor every joint distribution that is encoded by the network.The result is declared reliable if that is the case. By buildingan ε-box around the original MRF model (each parameter ofthe original model is allowed to vary inside such boxes), weobtain a credal network. We increase the value of ε until thelimiting moment where all distributions still yield the samemode. Such limiting value of ε is regarded as the robustnessof the decision.
Fig. 4. Examples of posed faces from the Cohn-Kanade dataset.
We have applied the robustness analysis to the problemof detecting facial action units in posed images using theCohn-Kanade dataset. For each test case, we have used 23binary variables corresponding to facial action units, whichneed to be explained (computation of the mode given imageobservations). The Hamming distance between predicted andtrue values gives the accuracy of our model for a given testcase, and ε is computed as well (as described above). Wehave found an association between ε and the accuracy of thepredictions, as shown in Figure 5 [1].
IEEE Intelligent Informatics Bulletin December 2015 Vol.16 No.1

22 Feature Article: Imprecision in Machine Learning and AI
0.000
0.005
0.010
0.015
0.020
0.025
0.030
0 1 2 3 4
Fig. 5. Relation of Hamming distance (x axis) and robustness ε (y axis) forthe test cases from the Cohn-Kanade dataset. Accuracy decreases with thelack of robustness.
VI. FEATURE SELECTION
We are given a (potentially large) number of covariates andwant to identify those which are useful to predict a binaryresponse. An usual procedure is to employ some statisticaltests. An example is the Mann-Whitney u-test (aka Wilcoxonrank-sum test) to test whether the probability of a quantityfrom individuals of one group being greater than that of theother group is greater than half.
Consider the Australian AIDS dataset, where analyses sug-gested that a difference in survival time existed when discrimi-nating individuals with AIDS by the use (or not) of drugs (forwhom a different survival was arguably expected), but alsosuggested that individuals with AIDS from the Queenslandregion in Australia have significantly worse survival time thanthose from the New South Wales region.
0 500 1000 1500 2000 2500
0.0
0.2
0.4
0.6
0.8
1.0
t
S(t
)
New South Wales (X')Queensland (X)
Fig. 6. Survival curves for individuals of two different Australian regions.Standard tests identify a significant difference in the curves, while theimprecise-probabilistic method correctly deems such result as unreliable. xaxis represents time in days and y is the survival curve.
Even if the latter conclusion has been questioned in the orig-inal studies because such difference was at first not expected,no formal analysis was used to assess the reliability of theresult. Using a robust version of the u-test tailored for survivalanalysis, we have identified such doubtful situation through theuse of the imprecise-probabilistic version of the test, whichresponds an indeterminate outcome in that case, suggestingthat further data should be collected for a better decision.Other comparisons which were deemed correct (regardingdrug usage, blood and haemophilia) are confirmed by theimprecise-probabilistic method as reliable [2].
VII. QUALITATIVE ASSESSMENTS
Let us go back to the medical example. Assume that youadopt a Bayesian network to implement a knowledge-basedexpert systems over the relevant quantities (see graph herebelow). The quantification of the network requires the assess-ment of the probability for conditional states of each quantitygiven any possible configuration of the direct predecessors.For lung cancer, we should decide the probability of beingsick for patients who are smokers and for those who are not.In a simulated scenario, assume the physician is only able toreport the following qualitative statement: smokers are morelikely (than non-smokers) to have lung cancer. How do wetranslate such a qualitative statement with sharp probabilisticvalues?
Cancer
Bronchitis
Smoker
Dyspnea
X-Rays
P (s)∈[.25, .50]
P (c|s)∈[.15, .40]P (c|¬s) ∈ [.05, .10]
P (x|c) ∈ [.90, .99]P (x|¬c) ∈ [.01, .05]
P (b|s) ∈ [.30, .55]P (b|¬s) ∈ [.20, .30]
P (d|c, b) ∈ [.90, .99]P (d|¬c, b) ∈ [.50, .70]P (d|c,¬b) ∈ [.40, .60]P (d|¬c,¬b) ∈ [.10, .20]
Fig. 7. A simplified version of the Asia diagnostic network (originallyproposed as a Bayesian network) quantified by intervals.
Linear constraints over probabilities offers a natural wayto express qualitative judgements. This is straightforwardfor the the above considered comparative judgement, beingP (c|s) ≥ P (c|¬s). Verbal-numerical scales can be used todescribe any qualitative expert judgements in a similar way.E.g., the judgement patients with lung cancer are very likelyto display positive X-rays with .90 ≤ P (x|c) ≤ .99. With sucha quantification the original Bayesian network becomes animprecise-probabilistic graphical model called credal network,for which a huge number of inference algorithms have beendevelopedv [3].
VIII. CONCLUSIONS
We advocated the use of imprecise probability in AI andmachine learning. Replacing single probability distributionswith sets of them increases realism in the modelling phase,thus leading to more cautious and reliable inferences. Theseapproaches appear especially suited to describe non-ignorablemissingness processes, evaluate classifiers reliability and ro-bustness of inferences in graphical models, evaluate relevanceof covariates, and properly elicit expert knowledge. Lots offurther developments are possible. E.g., a proper descriptionof non-stationarity in dynamic systems [4].
December 2015 Vol.16 No.1 IEEE Intelligent Informatics Bulletin

Feature Article: Cassio P. de Campos & Alessandro Antonucci 23
REFERENCES
[1] http://papers.nips.cc/paper/5472-global-sensitivity-analysis-for-map-inference-in-graphical-models
[2] http://dx.doi.org/10.1002/bimj.201500062[3] http://dx.doi.org/10.1002/9781118763117.ch9[4] http://dx.doi.org/10.1016/j.neucom.2015.08.095
IEEE Intelligent Informatics Bulletin December 2015 Vol.16 No.1

24 Feature Article: Multiplex Network Mining: A Brief Survey
Multiplex Network Mining: A Brief SurveyRushed Kanawati
Abstract—Multiplex network model has been recently pro-posed as a mean to capture high level complexity in real-worldinteraction networks. A multiplex network can roughly be definedas a multi-layer network. Each layer contains the same set ofnodes but a different type of links. In spite of its simplicity, themodel allows handling multi-relationnal, heterogeneous, dynamicand even attributed networks. However, working with multiplexnetworks requiers redefining and adapting almost all basic met-rics and algorithms generally used to analyse complex networks.In this paper we provide an overview of recent algorithmicadvances in mining and analyzing multiplex networks. We reviewalso some publicly available tools for multiplex network analysis.
Index Terms—Complex networks, Multiplex network, Multirelationnal networks, community detection, link prediction
I. INTRODUCTION
NETWORKS have proved to be a useful tool to modelstructural complexity of a variety of complex systems in
different domains including sociology, biology, ethology andcomputer science. Most studies until recently have focusedon analyzing simple static networks. However, real complexnetwork are heterogeneous (nodes and links may have differ-ent types) and/or dynamic. For example, in a social network,people are linked with different types of ties: friendship, familyrelationship, professional relationship,. . . , etc. Moreover theserelationships may evolve with time. The concept of multiplexnetworks has been introduced with the goal to provide anexpressive model for modeling real-world complex networks[1], [2], [3]. A multiplex network is roughly defined as a multi-layer graph where each layer contains the same set of nodesbut interconnected by different types of links.
Figure 1 illustrates an exemple of a multiplex network.This is a 3-layer social network where layers represent ad-vice, friendship and co-work relationships among partners andassociates of a corporate law firm [4].
Fig. 1. Lazega law-firm network - visualization performed using muxvizpackage [5]
This simple extension of the basic graph model is powerfulenough though to allow modeling different types of networksincluding:
R. Kanawati is an associate professor at LIPN CNRS UMR 7030, UniversityParis 13 e-mail: [email protected]
• multi-relational network: where each layer encodes onerelation type,
• dynamic network: where a layer corresponds to thenetwork state at a given time stamp,
• attributed network: where additional layers can be de-fined over the node set as a similarity graph induced by asimilarity measure applied to the set of node’s attributes.
However, analysis of multiplex networks requiers redefiningmost of the basic concepts and metrics usually used for com-plex network analysis including: node’s degree, neighborhood,paths and node’s centralities [6], [7], [3]. It requiers alsoproviding new algorithms to handle basic complex networksanalysis tasks such as community detection [8] and linkprediction [9]. In this paper, we provide a brief review ofrecent algorithmic advances for multiplex network analysisand mining. In section II a formal definition of multiplexnetworks is provided and basic used notations are introduced.Section III defines basic node characterization metrics inmultiplex networks. In the following section main algorithmsfor community detection in multiplex networks are reviewed.Section V gives brief informations about available multiplexnetwork analysis tools. Finally we conclude in section VI
II. DEFINITIONS AND NOTATIONS
A multiplex network is defined as a triplet G =< V,E, C >where V is a set of nodes, E = {E1, . . . , Eα} is a set of αtypes of edges between nodes in V . We have Ek = {(vi, vj) :i 6= j, vi, vj ∈ V }. C is the set of coupling links that representlinks between a node and itself across different layers. Wehave C = {(v, v, l, k) : v ∈ V, l, k ∈ [1, α], l 6= k}. Where(v, v, l, k) denotes a link from node v in layer l to node v inlayer k. Different coupling schemes can be applied. Figure 2illustrates the two most basic couplings :• Ordinal coupling: where a node in one layer is connected
to itself in adjacent layers. In other words (v, v, l, k) ∈C if |l − k| == 1. This is the default coupling whenusing multiplex networks to model dynamic networks.
• Categorical coupling: where a node in one layer inconnected to itself in each other layer. This is the defaultcoupling when representing multi-relationnal networks.
Fig. 2. Ordinal and categorical couplings
December 2015 Vol.16 No.1 IEEE Intelligent Informatics Bulletin
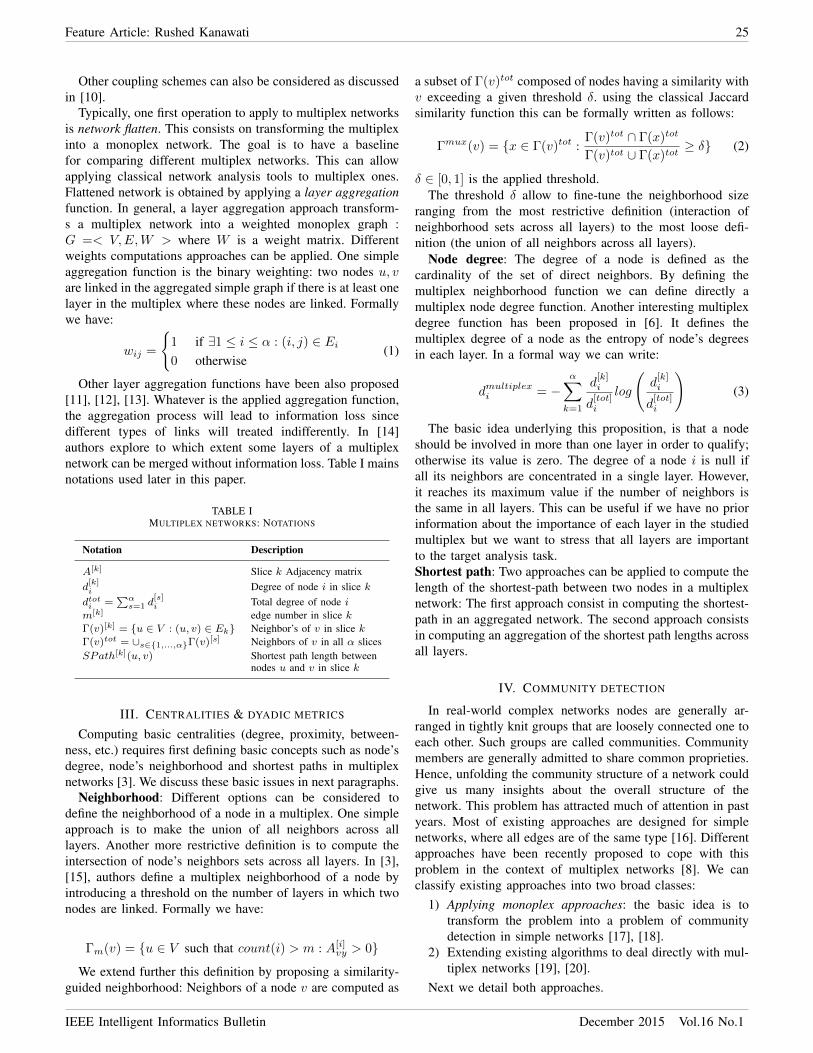
Feature Article: Rushed Kanawati 25
Other coupling schemes can also be considered as discussedin [10].
Typically, one first operation to apply to multiplex networksis network flatten. This consists on transforming the multiplexinto a monoplex network. The goal is to have a baselinefor comparing different multiplex networks. This can allowapplying classical network analysis tools to multiplex ones.Flattened network is obtained by applying a layer aggregationfunction. In general, a layer aggregation approach transform-s a multiplex network into a weighted monoplex graph :G =< V,E,W > where W is a weight matrix. Differentweights computations approaches can be applied. One simpleaggregation function is the binary weighting: two nodes u, vare linked in the aggregated simple graph if there is at least onelayer in the multiplex where these nodes are linked. Formallywe have:
wij =
{1 if ∃1 ≤ i ≤ α : (i, j) ∈ Ei0 otherwise
(1)
Other layer aggregation functions have been also proposed[11], [12], [13]. Whatever is the applied aggregation function,the aggregation process will lead to information loss sincedifferent types of links will treated indifferently. In [14]authors explore to which extent some layers of a multiplexnetwork can be merged without information loss. Table I mainsnotations used later in this paper.
TABLE IMULTIPLEX NETWORKS: NOTATIONS
Notation Description
A[k] Slice k Adjacency matrixd[k]i Degree of node i in slice kdtoti =
∑αs=1 d
[s]i Total degree of node i
m[k] edge number in slice kΓ(v)[k] = {u ∈ V : (u, v) ∈ Ek} Neighbor’s of v in slice kΓ(v)tot = ∪s∈{1,...,α}Γ(v)[s] Neighbors of v in all α slicesSPath[k](u, v) Shortest path length between
nodes u and v in slice k
III. CENTRALITIES & DYADIC METRICS
Computing basic centralities (degree, proximity, between-ness, etc.) requires first defining basic concepts such as node’sdegree, node’s neighborhood and shortest paths in multiplexnetworks [3]. We discuss these basic issues in next paragraphs.
Neighborhood: Different options can be considered todefine the neighborhood of a node in a multiplex. One simpleapproach is to make the union of all neighbors across alllayers. Another more restrictive definition is to compute theintersection of node’s neighbors sets across all layers. In [3],[15], authors define a multiplex neighborhood of a node byintroducing a threshold on the number of layers in which twonodes are linked. Formally we have:
Γm(v) = {u ∈ V such that count(i) > m : A[i]vy > 0}
We extend further this definition by proposing a similarity-guided neighborhood: Neighbors of a node v are computed as
a subset of Γ(v)tot composed of nodes having a similarity withv exceeding a given threshold δ. using the classical Jaccardsimilarity function this can be formally written as follows:
Γmux(v) = {x ∈ Γ(v)tot :Γ(v)tot ∩ Γ(x)tot
Γ(v)tot ∪ Γ(x)tot≥ δ} (2)
δ ∈ [0, 1] is the applied threshold.The threshold δ allow to fine-tune the neighborhood size
ranging from the most restrictive definition (interaction ofneighborhood sets across all layers) to the most loose defi-nition (the union of all neighbors across all layers).
Node degree: The degree of a node is defined as thecardinality of the set of direct neighbors. By defining themultiplex neighborhood function we can define directly amultiplex node degree function. Another interesting multiplexdegree function has been proposed in [6]. It defines themultiplex degree of a node as the entropy of node’s degreesin each layer. In a formal way we can write:
dmultiplexi = −α∑k=1
d[k]i
d[tot]i
log
(d
[k]i
d[tot]i
)(3)
The basic idea underlying this proposition, is that a nodeshould be involved in more than one layer in order to qualify;otherwise its value is zero. The degree of a node i is null ifall its neighbors are concentrated in a single layer. However,it reaches its maximum value if the number of neighbors isthe same in all layers. This can be useful if we have no priorinformation about the importance of each layer in the studiedmultiplex but we want to stress that all layers are importantto the target analysis task.Shortest path: Two approaches can be applied to compute thelength of the shortest-path between two nodes in a multiplexnetwork: The first approach consist in computing the shortest-path in an aggregated network. The second approach consistsin computing an aggregation of the shortest path lengths acrossall layers.
IV. COMMUNITY DETECTION
In real-world complex networks nodes are generally ar-ranged in tightly knit groups that are loosely connected one toeach other. Such groups are called communities. Communitymembers are generally admitted to share common proprieties.Hence, unfolding the community structure of a network couldgive us many insights about the overall structure of thenetwork. This problem has attracted much of attention in pastyears. Most of existing approaches are designed for simplenetworks, where all edges are of the same type [16]. Differentapproaches have been recently proposed to cope with thisproblem in the context of multiplex networks [8]. We canclassify existing approaches into two broad classes:
1) Applying monoplex approaches: the basic idea is totransform the problem into a problem of communitydetection in simple networks [17], [18].
2) Extending existing algorithms to deal directly with mul-tiplex networks [19], [20].
Next we detail both approaches.
IEEE Intelligent Informatics Bulletin December 2015 Vol.16 No.1

26 Feature Article: Multiplex Network Mining: A Brief Survey
A. Applying monoplex approaches
One first approach consists appling layer aggregation ap-proaches and then apply classical communjity detection onthe flatten network [12], [17]. In [21] an original multiplextransformation approach is proposed. It consists of mappinga multiplex to a 3-uniform hyper-graph H = (V ∗, E∗) suchthat the node set in the hyper-graph is V ∗ = V ∪ 1, ..., αand (u, v, i) ∈ E∗if∃l : Aluv 6= 0, u, v ∈ V, i ∈ 1, ..., α.Community detection algorithms in hyper-graphs can thenbe applied on the obtained graph. In [20] a multi-objectiveapproach is applied. The idea is to apply a classical communitydetection algorithm to a first layer. For all consecutive layers abi-objective optimization approach is applied in order to detectcommunities that maximize both the modularity in the currentlayer and the similarity to the community structure detected onthe previous layer. This approach can be applied to multiplexnetworks where ordinal coupling is applied.
Another way is to to apply a classical community detectionto each layer of a multiplex then merging obtained partitionsusing ensemble clustering approaches [22].
B. Extending monoplex approaches to the multiplex case
Few studies have addressed the problem of simultaneousexploration of all layers of a multiplex network for thedetection of communities. [11] is among the first studies thathave tried to extend existing approaches to multiplex setting.The leading role that modularity and its optimization haveplayed in the context of community detection in simple graphshas naturally motivated works to generalize the modularityto the case of multiplex networks. A generalized modularityfunction is proposed in [23]. This is given as:
Qmultiplex(P ) =1
2µ
∑c∈P
∑i,j∈c
k,l:1→α
((A
[k]ij − λk
d[k]i d
[k]j
2m[k]
))(4)
Where µ =∑
k:1→αm[k] is a normalization factor, and λk is
a resolution factor as introduced [24] in order to cope with themodularity resolution problem. Approaches based on optimiz-ing the multiplex modularity are likely to have the same draw-backs of those optimizing the original modularity functionfor monoplex approaches [25]. This motivates exploring otherapproaches for community detection. The Infomap algorithm[26] has also been extended to the multiplex case [27]. In [28]an adaptation of the Walktrap community detection algorithm[29] is proposed. A seed-centric approach is also proposed in[30].
C. Evaluation criteria
The problem of evaluating community detection algorithmstill to be an open problem despite the great amount of workconducted in this field [31]. Since few multiplex networkswith ground truth partitions are available, unsupervised evalu-ation metrics are generally used. These include the multiplexmodularity (Q) (see 4), the redundancy (ρ) criteria and thecomplementarity (γ) criteria introduced in [12].
Redundancy criteria (ρ) [12] : The redundancy ρ com-putes the average of the redundant link of each intra-community in all multiplex layers. The intuition is that thelink intra-community should be recurring in different layers.The computing of this indicator is as follows: We denote by:• P the set of couple (u, v) which are directly connected
to at least one layer.• ¯P the set of couple (u, v) which are directly connected
in at least two layers.• Pc ⊂ P represents all links in the community c• ¯Pc ⊂ ¯P the subset of ¯P and which are also in c.The redundancy of the community c is given by:
ρ(c) =∑
(u,v)∈ ¯Pc
‖ {k : ∃A[k]uv 6= 0} ‖
α× ‖ Pc ‖(5)
The quality of a given multiplex partition is defined asfollow:
ρ(P) =1
‖ P ‖∑c∈P
ρ(c) (6)
γ(P ) =1
‖P‖∑c∈P
γ(c) (7)
Complementarity criteria (γ) [12] : The complementarityγ is the conjunction of three measures :• Variety Vc : this is the proportion of occurrence of the
community c across layers of the multiplex.
Vc =
α∑s=1
‖∃(i, j) ∈ c/A[s]ij 6= 0‖
α− 1(8)
• Exclusivity εc : this is the number of pairs of nodes, incommunity c, that are connected exclusively in one layer.
εc =
α∑s=1
‖Pc,s‖‖Pc‖
(9)
with Pc : is the set of pairs (i, j) in community c that areconnected at least in one layer. Pc,s : is the set of pairs(i, j) in community c that are connected exclusively inlayer s.
• Homogeneity Hc : this captures how uniform is thedistribution of the number of edges, in the communityc, per layer. The idea is that intra-community links musthave a uniform distribution among all layers.
Hc =
{1 if σc = 01− σc
σmaxc
otherwise (10)
with
avgc =
α∑s=1
‖Pc,s‖α
σc =
√√√√ α∑s=1
(‖Pc,s‖ − avgc)2
α
σmaxc =
√(max(‖ Pc,d ‖)−min(‖ Pc,d ‖))2
2
December 2015 Vol.16 No.1 IEEE Intelligent Informatics Bulletin

Feature Article: Rushed Kanawati 27
The higher the complementarity the better is the partition.The complementarity is then given by the following formula:
γ(c) = Vc × εc ×Hc
V. MULTIPLEX ANALYSIS TOOLS
Recently, two different packages for multiplex network anal-ysis have been released: muxviz [5] and muna [32]. The firstis an R package that focuses mainly on multiplex network vi-sualisation (see figure 1). It provides also a support for imple-menting some layer-aggregation approaches and implementsgeneralized modularity–based community detection algorithm.The second package Muna, is provided as an extension of theigraph graph analysis API [33]. It is provided in two versionsR and Python as is provided under GPL licence and can bedownloaded from http://lipn.fr/∼kanawati/software. A specialattention in Muna is made to the problem of communitydetection and evaluation in multiplex networks. It actuallyprovides an extensive set of different community detection andevaluation approaches.
VI. CONCLUSION
The curent maturity of network science coupled with theavailability of huge amount of heterogeneous data in differentfields allow today a move to a more complex representationsof real-world interactions. The multiplex network model isone promising option. It is powerful enough to model multirelational, dynamic and attributed networks. Therefore thismodel is attracting an increasing attention form differentresearchers from different communities. In this paper we haveprovided a quick survey of recent advances in the field ofmultiplex network analysis and mining.
REFERENCES
[1] M. Kivela, A. Arenas, M. Barthelemy, J. P. Gleeson, Y. Moreno,and M. A. Porter, “Multilayer networks,” Journal of complexnetworks, vol. 2, pp. 203–271, 2014. [Online]. Available: http://arxiv.org/abs/1309.7233
[2] M. Berlingerio, M. Coscia, F. Giannotti, A. Monreale, and D. Pedreschi,“Multidimensional networks: foundations of structural analysis,” WorldWide Web, vol. 16, no. 5-6, pp. 567–593, 2013.
[3] P. Brodka and P. Kazienko, Encyclopedia of Social Network Analysis andMining. Springer, 2014, ch. Multi-layered social networks.
[4] E. Lazega, The Collegial Phenomenon: The Social Mechanisms of Coop-eration Among Peers in a Corporate Law Partnership. Oxford universityPress, 2001.
[5] M. D. Domenico, M. A. Porter, and A. Arenas, “Multilayer analysisand visualization of networks,” J. Complex Netw. (2014), vol. 10, 2014.[Online]. Available: http://arxiv.org/abs/1405.0843
[6] F. Battiston, V. Nicosia, and V. Latora, “Metrics for the analysis ofmultiplex networks,” CoRR, vol. abs/1308.3182, 2013.
[7] M. Magnani and M. Marzolla, “Path-based and whole-networkmeasures,” in Encyclopedia of Social Network Analysis and Mining,2014, pp. 1256–1269. [Online]. Available: http://dx.doi.org/10.1007/978-1-4614-6170-8 241
[8] C. W. Loe and H. Jeldtoft Jensen, “Comparison of communities detectionalgorithms for multiplex,” ArXiv e-prints, Jun. 2014.
[9] M. Pujari and R. Kanawati, “Link prediction in multiplex networks,”Networks and Heterogeneous Media, vol. 10, pp. 17–35, March 2015,special Issue on New trends, models and applications in Complex andMultiplex Networks.
[10] T. Murata, “Comparison of inter-layer couplings of multilayer networks,”in The 4th International Workshop on Complex Networks and theirApplications, Bangkok, Thailand, November 2015.
[11] L. Tang and H. Liu, Community Detection and Mining in SocialMedia, ser. Synthesis Lectures on Data Mining and Knowledge Discovery.Morgan & Claypool Publishers, 2010.
[12] M. Berlingerio, M. Coscia, and F. Giannotti, “Finding and character-izing communities in multidimensional networks,” in ASONAM. IEEEComputer Society, 2011, pp. 490–494.
[13] D. Cai, Z. Shao, X. He, X. Yan, and J. Han, “Mining hidden communityin heterogeneous social networks,” in ACM-SIGKDD Workshop on LinkDiscovery: Issues, Approaches and Applications (LinkKDD’05), Chicago,IL, Aug 2005.
[14] M. D. Domenico, V. Nicosia, A. Arenas, and V. Lator, “Structuralreducibility of multilayer networks,” Nature communications, vol. 6, p.6864, 2015.
[15] P. Kazienko, P. Brodkadka, and K. Musial, “Individual neighbourhoodexploration in complex multi-layered social network,” in Web Intelli-gence/IAT Workshops, 2010, pp. 5–8.
[16] S. Fortunato, “Community detection in graphs,” Physics Reports, vol.486, no. 3-5, pp. 75–174, 2010.
[17] D. D. Suthers, J. Fusco, P. K. Schank, K.-H. Chu, and M. S. Schlager,“Discovery of community structures in a heterogeneous professionalonline network,” in HICSS. IEEE, 2013, pp. 3262–3271.
[18] M. Berlingerio, F. Pinelli, and F. Calabrese, “Abacus: frequent patternmining-based community discovery in multidimensional networks,” DataMin. Knowl. Discov., vol. 27, no. 3, pp. 294–320, 2013.
[19] R. Lambiotte, “Multi-scale modularity in complex networks,” in WiOpt.IEEE, 2010, pp. 546–553.
[20] A. Amelio and C. Pizzuti, “Community detection in multidimensionalnetworks,” in IEEE 26th International Conference on Tools with ArtificialIntelligence, 2014, pp. 352–359.
[21] P. M. Comar, P.-N. Tan, and A. K. Jain, “Simultaneous classification andcommunity detection on heterogeneous network data,” Data Min. Knowl.Discov., vol. 25, no. 3, pp. 420–449, 2012.
[22] R. Kanawati, “Community detection in social networks: the powerof ensemble methods.” in ACM/IEEE International conference on datascience & advanced analytics. Shanghai: IEEE, November 2014.
[23] P. J. Mucha, T. Richardson, K. Macon, M. A. Porter, and J.-P. Onnela,“Community structure in time-dependent, multiscale, and multiplex net-works,” Science, vol. 328, no. 5980, pp. 876–878, 2010.
[24] J. Reichardt and S. Bornholdt, “Statistical mechanics of communitydetection.” Physical Review E, vol. 74, no. 1, 2006.
[25] B. H. Good, Y.-A. de Montjoye, and A. Clauset., “The performance ofmodularity maximization in practical contexts.” Physical Review, vol. E,no. 81, p. 046106, 2010.
[26] M. Rosvall, D. Axelsson, and C. T. Bergstrom, “The map equation,”Eur. Phys. J. Special Topics, vol. 13, p. 178, 2009.
[27] M. D. Domenico, A. Lancichinetti, A. Arenas, and M. Rosvall, “Iden-tifying modular flows on multilayer networks reveals highly overlappingorganization in social systems,” Phys. Rev, vol. 5, p. 011027, 2015.
[28] Z. Kuncheva and G. Montana, “Community detection in multiplexnetworks using locally adaptive random walks,” in MANEM 2workshop- Proceedings of ASONAM 2015, Paris, August 2015.
[29] P. Pons and M. Latapy, “Computing communities in large networks usingrandom walks,” J. Graph Algorithms Appl., vol. 10, no. 2, pp. 191–218,2006.
[30] M. Hmimida and R. Kanawati, “Community detection in multiplexnetworks: A seed-centric approach,” Networks and Heterogeneous Media,vol. 10, no. 1, pp. 71–85, March 2015, special Issue on New trends,models and applications in Complex and Multiplex Networks.
[31] Z. Yakoubi and R. Kanawati, “Licod: Leader-driven approaches forcommunity detection,” Vietnam Journal of Computer Science, vol. 1,no. 4, pp. 241–256, 2014.
[32] I. Falih and R. Kanawati, “Muna: A multiplex network analysis library,”in The 2015 IEEE/ACM International Conference on Advances in SocialNetworks Analysis and Mining, Paris, August 2015, pp. 757–760.
[33] G. Csardi and T. Nepusz, “The igraph software package for complexnetwork research,” InterJournal, vol. Complex Systems, p. 1695, 2006.[Online]. Available: http://igraph.sf.net
IEEE Intelligent Informatics Bulletin December 2015 Vol.16 No.1
Book review: Big Data Analytics
December 2015 Vol.16 No.1 IEEE Intelligent Informatics Bulletin
28
REVIEWED BY PAWAN LINGRAS
A BOOK THAT BALANCES THE NUMERIC, TEXT, AND CATEGORICAL DATA MINING WITH A TRUE BIG DATA PERSPECTIVE
The book is edited by leaders in both text mining/information retrieval and numeric data. It is a handbook meant for researchers and practitioners that are familiar with the basic concepts and techniques of data mining and statistics. Most people will go through the book perfunctorily to have a good understanding of broad range of topics covered in the book, and revisit the detailed treatment as needed. However, serious research students who want to have a comprehensive understanding of the world of Big Data may find it useful to spend a month going through most of the chapters in detail and also follow a long list of citations that provide specifics.
No one person can have a mastery of
the topics covered in the book. The editors have sought experts in various aspects. Despite the large array of
authors, the book has managed a consistent and smooth flowing writing style.
The general areas covered in the
book include text mining, web and social network analytics, images, biometrics, and health/epidemiology and customer relationship management. It is unlikely that a single book can contain all the areas which can use big data analysis. However, the breadth of techniques and application domains means that a person looking at a new area may find similarity with one of the chapters discussed in the book.
As mentioned before, the basic data
mining and statistical techniques are not part of this book. However, some of these techniques are revisited from the big data perspective. There is also more emphasis on graph theory, which has not received as much attention in the earlier data mining research. I also liked the chapter on simulation to generate additional data, since not all the possible future conditions will be captured by existing real-world datasets. For example, rare events are under-represented in a dataset. The big data analysis will also result in the prescription of new operating conditions that were not previously seen and hence not part of the existing datasets. Simulation helps enhance datasets overcome such deficiencies.
While the book is divided into
techniques and applications sections, even the techniques are presented with a firm sight of applicability in mind. Implementation aspects, including MapReduce and Hadoop, emphasize the big data aspect of data mining.
REVIEWED BY SUGATA SANYAL
TRACKING THE EVOLUTION OF BIG DATA, FOCUSING ON TIMELY TOPICS SUCH AS DATA MINING AND ANALYTICS
Big Data Analytics has become an often repeated name. I was curious as always about any new issues. But to learn a lot about a Big Subject, one needs to study a lot. When I got an invitation from Elsevier to review a, now famous, book titled, Big Data Analytics, I was thrilled for few techno-academic reasons:
This book is a compendium of
various chapters where it deals with theory of Big Data and its applications in real life issues.
Editors are all world famous academician and the standard of the book is very high.
I read the book thoroughly (for writing a critical review you need to) and learned a lot. Big Data Analytics is changing the way we handle various issues and it is yielding results which were not possible a few years back.
This subject is not a narrow one; it is a science of science. And it is ever expanding and some new applications are becoming tractable due to Big Data Analytics application.
The book was edited by Profs. Venu Givindaraju and C. R. Rao and is now available with Elsevier. A brief description below:
While the term Big Data is open to varying interpretation, it is quite clear that the Volume, Velocity, and Variety (3Vs) of data have impacted every aspect of computational science and its applications. The volume of data is increasing at a phenomenal rate and a majority of it is unstructured. With big data, the volume is so large that processing it using traditional database and software techniques is difficult, if not impossible. The drivers are the ubiquitous sensors, devices, social
Big Data Analytics
BY V. GOVINDRAJU, V.V. RAGHAVAN AND C.R. RAO (EDITORS) - ISBN: 9780444634924

Editor: Ruili Wang
IEEE Intelligent Informatics Bulletin December 2015 Vol.16 No.1
29
networks and the all-pervasive web. Scientists are increasingly looking to derive insights from the massive quantity of data to create new knowledge. In common usage, Big Data has come to refer simply to the use of predictive analytics or other certain advanced methods to extract value from data, without any required magnitude thereon. Challenges include analysis, capture, curation, search, sharing, storage, transfer, visualization, and information privacy. While there are challenges, there are huge opportunities emerging in the fields of Machine Learning, Data Mining, Statistics, Human-Computer Interfaces and Distributed Systems to address ways to analyze and reason with this data. The edited volume focuses on the challenges and opportunities posed by "Big Data" in a variety of domains and how statistical techniques and innovative algorithms can help glean insights and accelerate discovery. Big data has the potential to help companies improve operations and make faster, more intelligent decisions. My detailed review is available at: http://goo.gl/pzIBoH I wish and hope that you enjoy Big Data Analytics and its applications as much as I did. THE BOOK: V. GOVINDRAJU, V.V. RAGHAVAN, C.R. RAO (EDS) (2015), BIG DATA ANALYTICS, 390 P. ELSEVIER PRINT BOOK ISBN : 9780444634924 EBOOK ISBN : 9780444634979
ABOUT THE REVIEWER: PAWAN LINGRAS Professor and Director, Computing and Data Analytics, Saint Mary's University Halifax, Nova Scotia, B3H3C3, Canada. Contact him at: [email protected] SUGATA SANYAL Member, School of Computing and Informatics "Brain Trust", University of Louisiana at Lafayette, USA. Honorary Professor, IIT, Guwahati. Member, Senate, IIIT, Guwahati. Contact him at: [email protected]

30 Editor: Xin Li
December 2015 Vol.16 No.1 IEEE Intelligent Informatics Bulletin
RELATED CONFERENCES, CALL FOR
PAPERS/PARTICIPANTS
WI 2016 The 2015 IEEE/WIC/ACM International
Conference on Web Intelligence Omaha, USA
October 13-16, 2016 http://wibih.unomaha.edu/
Web Intelligence (WI) aims to achieve a multi-disciplinary balance between research advances in theories and methods usually associated with Collective Intelligence, Data Science, Human-Centric Computing, Knowledge Management, and Network Science. It is committed to addressing research that both deepen the understanding of computational, logical, cognitive, physical, and social foundations of the future Web, and enable the development and application of technologies based on Web intelligence. WI'16 provides a premier forum and features high-quality, original research papers and real-world applications in all theoretical and technology areas that make up the field of WI. In 2016, The University of Nebraska at Omaha College of Information Science & Technology will be the proud host to WI '16 and BIH '16. Combining these conferences provides a premier forum that will bring together researchers and practitioners, high-quality, original research papers and real-world applications in all theoretical and technology areas. Under the theme Connecting Network and Brain with Big Data, WI'16 and BIH'16 will provide a broad forum that academia, professionals and industry people can use to exchange their ideas, findings and strategies in utilizing the power of human brains and man-made networks to create a better world. Web Intelligence focuses on scientific research and applications by jointly using Artificial Intelligence (AI) (e.g., knowledge representation, planning, knowledge discovery and data mining,
intelligent agents, and social network intelligence) and advanced Information Technology (IT) (e.g., wireless networks, ubiquitous devices, social networks, semantic Web, wisdom Web, and data/knowledge grids) for the next generation of Web-empowered products, systems, services, and activities. WI'16 welcomes both research and application papers submissions. All submitted papers will be reviewed on the basis of technical quality, relevance, significance and clarity. Accepted full papers will be included in the proceedings published by IEEE Computer Society Press.
_____________________
BHI 2016
The International Conference on Brain Informatics & Health
Omaha, USA October 13-16, 2016
http://wibih.unomaha.edu/
The BIH series provides a premier forum that brings together researchers and practitioners from neuroscience, cognitive science, computer science, data science, artificial intelligence, information communication technologies, and neuroimaging technologies with the purpose of exploring the fundamental roles, interactions as well as practical impacts of Brain Informatics. BIH'16 addresses the computational, cognitive, physiological, biological, physical, ecological and social perspectives of brain informatics, with a strong emphasis on emerging trends of big data analysis and management technology for brain research, behaviour learning, and real-world applications of brain science in human health and well-being. BIH'16 welcomes paper submissions (full paper and abstract submissions). Both research and application papers are solicited. All submitted papers will be reviewed on the basis of technical quality, relevance, significance and clarity. Accepted full papers will be included in the proceedings by Springer LNCS/LNAI.
_____________________
ICDM 2016
The Twenty-Third IEEE International Conference on Data Mining
Barcelona, Spain December 12-15, 2016
The IEEE International Conference on Data Mining series (ICDM) has established itself as the world's premier research conference in data mining. It provides an international forum for presentation of original research results, as well as exchange and dissemination of innovative, practical development experiences. The conference covers all aspects of data mining, including algorithms, software and systems, and applications. ICDM draws researchers and application developers from a wide range of data mining related areas such as statistics, machine learning, pattern recognition, databases and data warehousing, data visualization, knowledge-based systems, and high performance computing. By promoting novel, high quality research findings, and innovative solutions to challenging data mining problems, the conference seeks to continuously advance the state-of-the-art in data mining. Besides the technical program, the conference features workshops, tutorials, panels and, since 2007, the ICDM data mining contest.
_____________________
ICHI 2016 The IEEE International Conference on
Healthcare Informatics Chicago, Illinois, USA
October, 2016 http://ieee-ichi.org/call_for_papers.html
ICHI 2016 is the premier community forum concerned with the application of computer science principles, information science principles, information technology, and communication technology to address problems in healthcare, public health, and everyday wellness. The conference highlights the most novel technical contributions in computing-oriented health informatics and the related social and ethical implications. ICHI 2016 will feature keynotes, a
TCII Sponsored Conferences

Announcements: Related Conferences, Call For Papers/Participants 31
IEEE Intelligent Informatics Bulletin December 2015 Vol.16 No.1
multi-track technical program including papers, demonstrations, panels, and doctoral consortium. ICHI 2016 serves as a venue for the discussion of innovative technical contributions highlighting end-to-end applications, systems, and technologies, even if available only in prototype form (e.g., a system is not deployed in production mode and/or evaluation may be performed by giving examples). We strongly encourage authors to submit their original contributions describing their algorithmic contributions, methodological contributions, and well-founded conjectures based on an application-oriented context. A paper does not have to be comprehensive and can focus on a single aspect of design, development, evaluation, or deployment. Contributions in the realm of social and behavioral issues might include empirical studies of health-related information use and needs, socio-technical studies on the implementation and use of health information technology, studies on health informatics in the context of community impact and implications, studies on public policies on leveraging health informatics infrastructure, among others
AAMAS 2015 The 15th International Conference on
Autonomous Agents and Multi-Agent Systems Istanbul, Turkey May 9-13, 2016
http://sis.smu.edu.sg/aamas2016
AAMAS is the leading scientific conference for research in autonomous agents and multiagent systems. The AAMAS conference series was initiated in 2002 by merging three highly respected meetings: the International Conference on Multi-Agent Systems (ICMAS); the International Workshop on Agent Theories, Architectures, and Languages (ATAL); and the International Conference on Autonomous Agents (AA). Subsequent AAMAS conferences have been held in Melbourne, Australia (July 2003), New York City, NY, USA (July 2004), Utrecht, The Netherlands (July 2005), Hakodate, Japan (May 2006), Honolulu, Hawaii, USA (May 2007), Estoril, Portugal (May 2008), Budapest, Hungary
(May 2009), Toronto, Canada (May 2010), Taipei, Taiwan (May 2011), Valencia, Spain (June 2012), Minnesota, USA (May 2013), Paris, France (May 2014) and Istanbul, Turkey (May 2015). AAMAS 2016 will be held in May in Singapore. AAMAS is the largest and most influential conference in the area of agents and multi-agent systems. The aim of the conference is to bring together researchers and practitioners in all areas of agent technology and to provide a single, high-profile, internationally renowned forum for research in the theory and practice of autonomous agents and multi-agent systems. AAMAS is the flagship conference of the non-profit International Foundation for Autonomous Agents and Multi-agent Systems (IFAAMAS).
___________________
AAAI 2016 The 30th AAAI Conference on Artificial
Intelligence Phoenix, Arizona, USA February 12-17, 2016
http://www.aaai.org/Conferences/AAAI/aaai16
The Thirtieth AAAI Conference on Artificial Intelligence (AAAI-16) will be held February 12–17 at the Phoenix Convention Center, Phoenix, Arizona, USA. Please note the alternate day pattern for AAAI-16. The workshop, tutorial, and doctoral consortium programs will be held Friday and Saturday, February 12 and 13, followed by the technical program, Sunday through Wednesday (at noon), February 14–17. The purpose of the AAAI conference is to promote research in artificial intelligence (AI) and scientific exchange among AI researchers, practitioners, scientists, and engineers in affiliated disciplines. AAAI-16 will have a diverse technical track, student abstracts, poster sessions, invited speakers, tutorials, workshops, and exhibit and competition programs, all selected according to the highest reviewing standards. AAAI-16 welcomes submissions on mainstream AI topics as well as novel crosscutting work in related areas. Phoenix is America's sixth largest city, yet still has real cowboys, rugged mountains, and the kind of cactus most people see only in cartoons. Phoenix is the gateway to the Grand Canyon, and its history is a testament to the spirit of puebloans, ranchers, miners, and visionaries.
Projected against this rich backdrop is a panorama of urban sophistication, with a host of museums (be sure to visit the Pueblo Grande Museum and Archaeological Park and the Heard Museum), sports stadiums, restaurants, and shopping. Nearby Tempe is the site of Arizona State University, home of a leading AI research community.
___________________
SDM 2016 The 2016 SIAM International Conference on
Data Mining Miami, Florida, USA
May 6 - 7, 2016 http://www.siam.org/meetings/sdm16/
Data mining is the computational process for discovering valuable knowledge from data. It has enormous application in numerous fields, including science, engineering, healthcare, business, and medicine. Typical datasets in these fields are large, complex, and often noisy. Extracting knowledge from these datasets requires the use of sophisticated, high-performance, and principled analysis techniques and algorithms, which are based on sound theoretical and statistical foundations. These techniques in turn require implementations on high performance computational infrastructure that are carefully tuned for performance. Powerful visualization technologies along with effective user interfaces are also essential to make data mining tools appealing to researchers, analysts, and application developers from different disciplines. The SDM conference provides a venue for researchers who are addressing these problems to present their work in a peer-reviewed forum. It also provides an ideal setting for graduate students and others new to the field to learn about cutting-edge research by hearing outstanding invited speakers and attending presentations and tutorials (included with conference registration). A set of focused workshops is also held on the last day of the conference. The proceedings of the conference are published in archival form, and are also made available on the SIAM web site.
_________________
IJCAI 2016
The 25th International Joint Conference on Artificial Intelligence
Related Conferences

32 Editor: Xin Li
December 2015 Vol.16 No.1 IEEE Intelligent Informatics Bulletin
New York City, USA July 9-15, 2016
http://ijcai-16.org/ IJCAI is the International Joint Conference on Artificial Intelligence, the main international gathering of researchers in AI. Held biennially in odd-numbered years since 1969, IJCAI is sponsored jointly by IJCAI and the national AI societie(s) of the host nation(s). IJCAI is a not-for-profit scientific and educational organization incorporated in California. Its major objective is dissemination of information and cutting-edge research on Artificial Intelligence through its Conferences, Proceedings and other educational materials. IJCAI Board of Trustees in its historical meeting held on Thursday, July 21, 2011 in Barcelona, Catalonia, Spain, decided that IJCAI conferences will be held annually in the future. Following the success of IJCAI-13 held in Beijing, China, IJCAI’15 held in Buenos Aires, Argentina. IJCAI’16 will be held in New York, USA and IJCAI’17 in Melbourne, Australia.

IEEE Computer Society 1730 Massachusetts Ave, NW Washington, D.C. 20036-1903
Non-profit Org. U.S. Postage
PAID Silver Spring, MD
Permit 1398