the identification of the mechanism of electrocatalytic ... · ozone and, whilst particulate...
TRANSCRIPT
1
The identification of the mechanism of electrocatalytic ozone generation on Ni/Sb-SnO2
P. A. Christensen1, P. S. Attidekou1, R. G. Egdell2, S. Maneelok1, D. A. C. Manning3 and R.
Palgrave4.
1 School of Chemical and Process Engineering, Bedson Building, Newcastle University, Newcastle
upon Tyne, NE1 7RU.
2. Department of Chemistry, University of Oxford, Inorganic Chemistry Laboratory, South Parks
Road, Oxford OX1 3QR.
3. School of Civil Engineering and Geosciences, Drummond Building, Newcastle University,
Newcastle upon Tyne, NE1 7RU.
4. Department of Chemistry, Christopher Ingold Building, UCL, London, WC1H 0AJ.
Abstract
This paper reports a systematic study of the co-doping of SnO2 with Sb and Ni in order to identify
the mechanism responsible for the electrocatalytic generation of ozone on Ni/Sb-SnO2. Based on
interpretation of a combination of X-ray diffraction, BET surface area measurements (N2) and
thermal analysis, the formation of ozone appears to take place on particle surfaces of composite Sb-
SnO2 grains, and is controlled by diffusion of OH along internal crystallite surfaces within the grain.
Sb-doped SnO2 is inactive with respect to ozone evolution in the absence of Ni, demonstrating a
synergic interaction between nickel and antimony. From XPS investigations, Sb(V) ions substitute
for Sn(IV) in the lattice, with a preference for centrosymmetric coordination sites whilst the Sb(III)
ions occur at grain surfaces or boundaries. Ni was not detected by XPS being located in the
subsurface region at concentrations below the detection limit of the instrument. In addition to
identifying a possible mechanism for ozone formation, the study resulted in the production of active
nanopowders which will allow the fabrication of high surface-area anodes with the potential to
exceed the space-time yields of -PbO2 anodes, permitting the application the Ni/Sb-SnO2 anodes
in the treatment of real waters.
Introduction
Ozone is generally regarded as an environmentally friendly oxidant that has been employed in water
treatment since the start of the 20th century.1 In recent years, the areas of application of ozone have
increased significantly to include domestic goods such as washing machines and icemakers, and to
the chemical-free cleaning and sterilization of surfaces in hospitals and fertility clinics. With
respect to the latter, there is increasing evidence that the volatile organic compounds released by
conventional cleaning agents can be harmful to embryos and have a detrimental effect upon
pregnancy rates.2 The most common method of generating ozone, particularly in industrial
quantities, is using cold corona discharge (CCD), first reported by Siemens in 1857.3 However,
such methods have a number of disadvantages including: (i) low concentration of O3 in the output,
in the range of 2% to 12% by volume4, (ii) CCD generators require cold, dry and pure O2 (if air is
employed the O3 concentration and production efficiency are significantly reduced and nitrous
oxides are produced5), (iii) CCD generates only gas phase O3, which is difficult to dissolve for
aqueous applications5 and (iv) CCD requires high voltage (kV range) power supplies.
In contrast, the electrochemical generation of ozone offers a number of advantages that include: the
possibility of generating high concentrations of ozone in the gas and liquid phases, no need for gas
feeds of any description, and robust, proven cell and system technology through the established
chlor-alkali industry.4 The major challenges to the general application of electrochemical ozone
generation, and the reasons why the technology is yet to see major commercial application, are: (1)
low ozone current efficiencies and/or current densities and (2) the poisoning of cationic polymer

2
electrolyte membranes (PEMs) by common ions found in real water, especially Na+, Ca2+ and Mg2+;
PEM operation is essential if the water to be treated is not to have significant quantities of ions
added to render it ionically conducting. -PbO2 is the most common anode employed to generate
ozone and, whilst particulate electrodes of this type can be employed to generate current densities of
ca. 1.0 – 1.5 A cm-2, they do so with current efficiencies only up to ca. 10%.6 There are two
materials capable of current efficiencies of ≥ 20%: boron doped diamond (BDD) and Ni and Sb-co-
doped SnO2.4
BDD anodes have been employed to generate O3 in PEM-based, electrolyte-free water at current
efficiencies up to 47% and current densities up to 530 mA cm-2.7-9 However, the cell voltages
required with such systems are high, and it is not at all clear that BDD anodes can be expected to
produce ozone routinely as they are more usually associated with the direct oxidation of organics.
The first report of the oxidation of water to ozone using an electrode comprising a ceramic Ni/Sb-
SnO2 coating on a Ti substrate in aqueous acidic electrolyte was by Cheng and Chan in 2004:
initially, the authors were unaware of Ni contamination and reported the ozone activity of Sb-
SnO210: this was corrected in a later paper11 where a current efficiency up to 36% was reported,
albeit at a low current densities (typically < 40 mA cm-2). Later, Christensen et al.12-13 achieved
current efficiencies up to 50% at current densities up to 100 mA cm-2. Chan has reported the
operation of Ni/Sb-SnO2 anodes in electrolyte-free water.14-15 Thus, Ni/Sb-SnO2 anodes are capable
of operating with high current efficiencies, but, to date, the yields of ozone have been low as it has
not yet proven possible to produce Ni/Sb-SnO2 as high surface area powders, unlike -PbO2 anodes,.
If it were possible incorporate high area powder into working electrodes, not only would such
anodes be able to exceed PbO2 anodes in space-time yield6, but the poisoning of PEMs such as
Nafion when using real waters could be avoided due to the high proton fluxes through the
membranes competing efficiently with Na+ etc.
We have recently obtained lifetimes of up to 600 hours when using Ni/Sb-SnO2 anodes to
electrolyse acid electrolyte with constant current efficiencies and current densities.13, 16 This
strongly suggests that the Ni responsible for the ozone activity is not exposed to electrolyte as it
would be expected to dissolve under such acidic and highly oxidising conditions. This also
highlights another problem with this material: despite its discovery over 10 years ago, the
mechanism of ozone generation at Ni/Sb-SnO2 remains unclear. Various authors have speculated
on this issue.17-19 For example, the involvement of Ni(III) has been suggested, but this speculation is
not based on specific evidence.
The fact that the addition of very small amounts of Ni to Sb-doped SnO2 changes the material from
being inactive to the electrochemical production of ozone to a highly active and highly selective
ozone anode is remarkable, and could not have been predicted. However, the mechanism by which
O3 evolution takes place at Ni/Sb-SnO2 anodes remains obscure, primarily as a result of the lack of
quantitative experimental data. Until there is definitive and quantitative analytical evidence on the
composition of Ni/Sb-SnO2 anodes to allow structure/activity correlations to be made, attempts to
understand the mechanism of ozone generation at these materials will remain speculative.
The aim of the work described in this paper was to elucidate the nature of the active site for ozone
generation at Ni/Sb-SnO2 anodes. In order to achieve this, it was decided to synthesize Ni/Sb-SnO2
powders using the same precursor solutions employed previously to make the ceramic anodes12-20
and to adopt a step-by-step approach by carrying out full characterization of these using surface

3
area determination by gas adsorption, powder X-ray diffraction (XRD) and thermogravimetric
analysis coupled with evolved gas analysis by mass spectrometry (TGA) to investigate the
structural and other changes induced by doping SnO2 first with Sb then with varying amounts of
nickel, and to correlate the latter with ozone activity and selectivity. The preliminary study on SnO2
has been reported in a previous paper.21 As well as identifying the active site for O3, it is believed
that producing active, high surface area Ni/Sb-SnO2 nanopowders will allow electrochemical cells
to be produced capable of high current densities, and hence remove the problem of the cation
fouling of PEMs. Importantly, interpretation of the experimental results recognises that crystallinity
determined by XRD and particle size calculated from BET data give different information about the
material, a fact usually overlooked in other reports.
Experimental
The SnO2 nanopowders were prepared via a hydrothermal route using a method adapted from that
of Fujihara and co-workers22, as shown in Scheme 1.21 The SnCl4.5H2O (98%, Sigma-Aldrich),
SbCl3 (99%, Sigma-Aldrich) and NiCl2.6H2O (99%, Sigma-Aldrich) were used as received. De-
ionised (DI) water was obtained from a Millipore Milli-Q system, 18 M cm. Two methods were
employed to produce Ni co-doped Sb-SnO2: the first involved mixing all the precursor solutions
together prior to refluxing, as in Scheme 1. The Ni content of these samples is referred below in
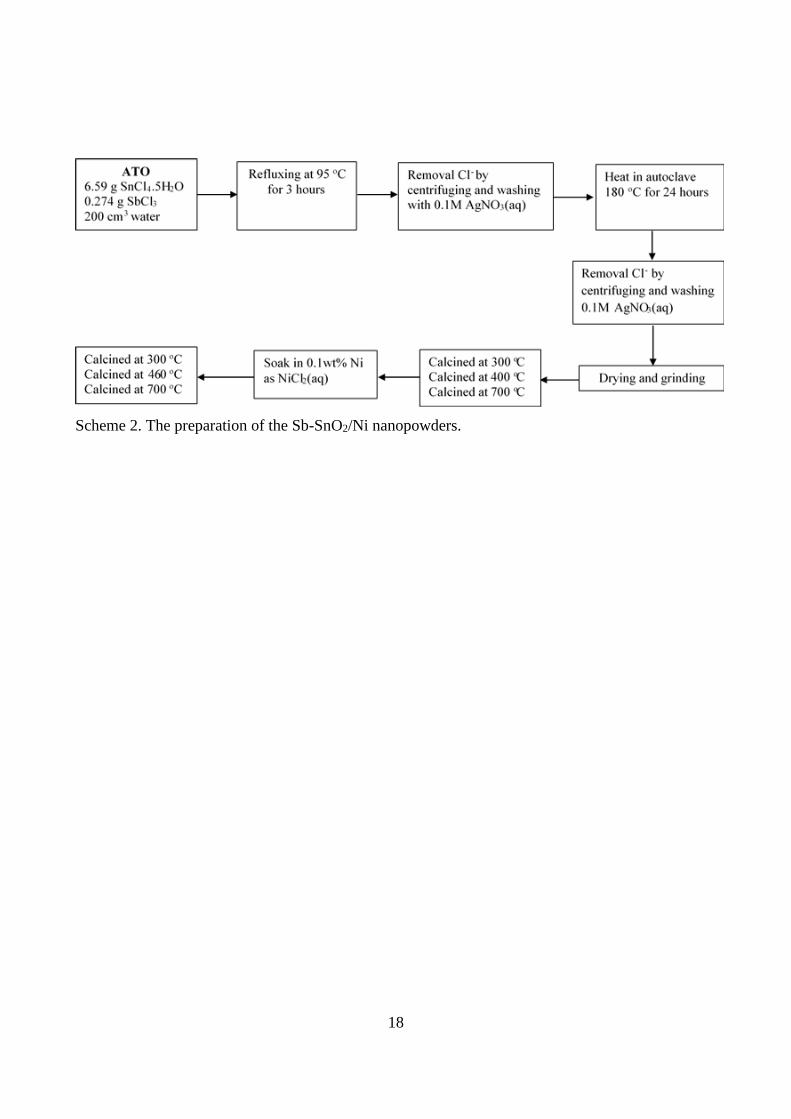
terms of the wt.% in the precursor solutions. The second method involved the production of Sb-
SnO2 nanopowders calcined at temperature T1, which were then doped with Ni by forming a slurry
of the appropriate wt.% in NiCl2 solution and calcining at temperature T2, as shown in Scheme 2.
The two forms of Ni and Sb-doped SnO2 are referred to as “x% Ni/Sb-SnO2 T” and “T1 Sb-
SnO2/x% Ni T2”, respectively.
Ti foil substrates of dimensions 0.8 cm × 0.8 cm were pressed in a Chauffante Elcometer press at
room temperature and 1000 N for 5 minutes to flatten them. 0.5 mm diameter Ti wires were cut to
ca. 10 cm, one end hammered flat and then spot-welded to the titanium foil along the middle of Ti
foil or mesh to the edge in order to ensure contact with the entire length of the substrate. The mesh
or foil substrates were degreased by immersion in a beaker containing acetone, followed by
thorough washing with DI water; this procedure was repeated twice. The Ti substrates were then
etched by boiling in 10 wt.% oxalic acid (10g in 100 cm3 DI water) for at least 30 minutes until the
solution changed to a brownish tinge. The solution was allowed to cool to room temperature after
which the substrates were washed with DI water. They were then placed in fresh DI water in a
beaker and sonicated for 15 minutes per time, repeating the procedure twice with fresh water until
no grease was observed on the surface of the water. The meshes or foils were then dried in air for 1
hour by placing in a beaker with the substrates uppermost. Each Ti substrate was weighed and the
mass recorded.
100 mg of the nanocrystalline powder was mixed with 10 cm3 of ethanol solution. The powder +
ethanol was stirred for ca. 4 hours until a homogeneous slurry was obtained. 0.1 cm3 of the slurry
was coated on the Ti foil and was allowed to dry in air. The electrodes were then placed in an oven
at 110 C for 5 min, removed and calcined at 460 or 700 C for 1 hour in a Carbolite 12F 12/25/700
furnace.
Powder diffraction patterns were measured on a PANalytical X'Pert Pro MPD diffractometer,
powered by a Philips PW3040/60 X-ray generator operated at 40 kV with 40 mA emission current
and incorporating an X'Celerator detector, using Cu Kα radiation (λ = 1.54180 Å). Diffraction peaks
were acquired between 2 = 10 to 60° and were assigned using the ICSD crystallographic data base.

4
The peaks at 2 = 26.43, 33.58 and 51.49° were employed to determine effective crystallite size
via the Scherrer equation.
X-ray photoelectron spectroscopy (XPS) was carried out using a Thermo K-alpha spectrometer. The
instrument used a 72 W monochromated Al K X-ray source (photon energy of 1486.6 eV) and a
dual beam flood gun, using both electrons and argon cations to compensate for sample charging.
The X-rays were microfocused at source to give a spot size on the sample of 400 μm. The analysis
chamber had a base pressure of 10-9 mbar. Photoelectrons were measured using a 125 mm radius
concentric hemispherical analyser and spectra were recorded in constant analyser energy mode.
Pass energies of 50 eV and a binding energy step size of 0.1 eV were used to record high resolution
spectra, whilst pass energy of 200 eV and a binding energy step size of 1.0 eV were used to record
survey spectra. Photoelectrons were detected using a 128 channel position sensitive detector. The
binding energy scale of the spectrometer is regularly calibrated using a three point calibration (Au,
Ag and Cu).
TGA analyses were carried out in an atmosphere of flowing (40 cm3 min-1) air, in a Netzsch STA
449C TG-DSC (thermogravimetry-differential scanning calorimetry, or TG-DSC) system,
connected to a Netzsch Aeolos 403C quadrupole mass spectrometer (QMS; m/z range 10-300).
Samples were loaded into alumina crucibles (approximately 30-40 mg sample mass). A heating
rate of 5 °C min-1 was used from 25 C – 900 °C, held at 900 °C for 10 minutes then cooled at 5 °C
min-1 to room temperature. The only evolved species detected on heating the samples was water.
The surface areas of the SnO2 powders were determined with a Thermo Scientific Surfer analyser
using multipoint Brunauer Emmett and Teller (BET) adsorption isotherms. The sample of mass 75
mg was prepared by degassing at 250 °C for 3 hours with a ramp rate of 5 °C min-1 to reach this
temperature prior to N2 adsorption.
The electrochemical cell employed in this work was a 1 cm pathlength quartz cuvette.10-11, 20 3 cm3
0.5M H2SO4 was employed as electrolyte. A 0.64 cm2 Pt-Ti mesh cathode was held vertically
against one of the opaque sides of the cuvette. The anode was held flat on the bottom of the cuvette
which was sealed with a PTFE cover and placed in the cuvette holder in Shimadzu 1240 mini
spectro-photometer. The anode was connected to the (+) terminal of a Thandar - TS30228 power
supply and the cathode to the (-) terminal. A reference spectrum was collected at open circuit after
which the potential was stepped to the working value (typically 2.7V) for 30s, after which the cell
was switched to open circuit and further spectra collected for 300s (to avoid interference from gas
bubbles). The steady state absorbance at 258 nm was used to calculate the ozone current efficiency,
assuming an extinction coefficient of 3000 M-1 cm-1.20
Results and discussion
Figures S1(a) - (c) show typical photographs of the powders prepared by the hydrothermal method.
In general, both the uncalcined Sb-SnO2 and Ni/Sb-SnO2 powders and the samples calcined at
300 °C were yellowish-white; those calcined at 400 °C were grey; and the samples calcined at
700 °C were blue. The blue colouration is directly linked to activation of the Sb(V) dopant, which
when incorporated into bulk Sn sites acts as a one electron donor. Carrier densities in the range
around 1020 cm-3 give rise to a plasmon in the near infrared region, typically around 0.5 eV. The
reflectivity drops from a high value below this energy to a very low value just above the plasmon
energy. The reflectivity then recovers across the visible region and is higher at the blue end of the
spectrum than at the red end. The blue colour produced in this way is similar to that found for
sodium tungsten bronzes NaxWO3 at low sodium doping levels.23 Sb(III) cannot be easily

5
accommodated in bulk sites as it has a propensity to occupy only sites lacking inversion symmetry . It can however occupy sites at free surfaces or grain boundary interfaces.
The SnO2, Sb-SnO2 and Ni/Sb-SnO2 samples
XRD
Typical X-ray diffraction patterns for the SnO2 samples are shown in Figure S2. The XRD patterns
showed all the samples to be tetragonal cassiterite which has the rutile structure (Cassiterite, syn; Q:
S; 00-041-1445). No other phases were observed suggesting that the Sb ions replace Sn(IV) in the
lattice, in agreement with the literature, where such replacement is observed even at high doping
levels.24-25
Table ST1 summarises the XRD data. As can be seen from the table, addition of Sb results in a
reduction in crystallite size and so inhibits crystal growth, in agreement with the work of
Rockenberger et al.25, whilst calcining, as would be expected, improves crystallinity and increases
the crystallite size. Thus, as-prepared SnO2 showed a crystallite size of 11 nm increasing to 22 nm
after calcining at 700 °C, whilst the as-prepared Sb-SnO2 crystals had an equivalent crystallite size
of ca. 4.3 nm, which did not increase appreciably on calcining at 300 or 400 °C, but increased to 9.5
nm after calcining at 700 °C.
From Table ST1 it is clear that calcination temperature, Sb content and Ni content had little or no
effect upon the unit cell dimensions. This is to be expected on the basis of Végards law in view of
of the low doping levels involved and the similarity of ionic sizes for Sn(IV), Ni(II) and Sb(V).
BET
Table ST2 shows the BET surface areas and the surface areas calculated from the crystallite sizes
obtained from the XRD line broadening, assuming spherical crystallites for simplicity. Figure 1
shows plots of the ratio of the grain volumes calculated from the BET data and the crystallite
volumes calculated from the XRD data. This is justified as cassiterite commonly has a bipyramidal
habit, which is roughly equidimensional. As may be seen from Figure 1, the addition of Sb to SnO2
causes a significant increase in the number of crystallites per particle. The first addition of Ni also
has a significant effect, but results in a decrease in the number of crystallites per particle (the
magnitude of this decrease being less than the initial increase observed on the addition of Sb),
whilst further addition of Ni has little or no effect. These data suggest that both Sb and Ni occupy
sites at or near grain boundary interfaces and are thus able to influence the agglomeration of
crystallites. It is generally accepted in the literature (see below) that the doping of SnO2 by Sb
results in Sb(V) ions on bulk Sn(IV) lattice sites with Sb(III) ions confined to surface grain
boundary interfaces.24, 26-33
XPS
Widescan XPS showed core lines due to Sn, Sb, O and adventitious C contamination. There was
pronounced Sb segregation, as is evident in Figure S3 which is typical of the XPS spectra obtained
using the various Sb-containing samples. As can be seen from the spectrum, the ratio of the
intensities of the Sb3d3/2 to Sn3d3/2 peaks (after correction for sensitivity factors) is 0.14 compared
with a nominal bulk doping ratio of 0.06. Moreover the Sb3d3/2 peak showed pronounced
asymmetry and was fitted to two components at 540.6 eV and 541.5 eV associated with Sb(III) and
Sb(V), respectively.
It was not possible to detect Ni in the Ni/Sb-SnO2 nanopowder samples presumably because the
concentration of Ni in the sampling depth, of ca. 10 nm, was less than the detection limit, the upper
6
bound of which was estimated to be about 0.02 at.%. The technique is not capable of probing the
internal crystallite surfaces within the grains. Table ST3 summarizes the XPS data obtained using
the various nanopowders including the total Sb content and the concentrations Sb(III) and Sb(V).
As can be seen from Table ST3, there was little or no variation in the total Sb content between the
Sb-SnO2 and the Ni/Sb-SnO2 samples, ruling out a role for Sb in explaining the data shown in
Figure 1. Further, as would be expected, the Ni content also did not appear to influence the
incorporation of Sb. However, it is clear from the table that the calcination temperature had a
significant effect on the concentration of Sb, and that this was due to Sb(III) enrichment, in
agreement with the literature, where it is generally accepted that24, 26-33: (i) Sb ions replace Sn ions
in the cassiterite lattice without strong modification of the lattice; (ii) both Sb(III) and Sb(V) ions
are produced following calcining, irrespective of whether SbCl3 or SbCl5 is employed as the
precursor; (iii) Sb(V) ions are accommodated in the bulk of the lattice due to their similar size to
Sn(IV) (ionic radius = 0.60 Å, cf. 0.69 Å for Sn(IV)) and preference for centrosymmetric
coordination sites whilst the Sb(III) ions (0.76 Å) are accommodated at the surface or at grain
boundaries. It has been suggested27, 33 that the Sb(III) ions replace the topmost layer of Sn(IV) ions,
with essentially the bulk composition of SnO2 immediately below, and that the Sb(III) ions do not
inject electrons into the conduction band. Instead Sb(III) ions trap a pair of electrons, giving rise to
a lone pair surface state where the electron density sits in a sp hybrid state projecting from the
surface. The lone pairs can act as two electron donors, allowing bonding to single oxygen atoms
which are two electron acceptors. The chemisoption of oxygen atoms on these surface sites is
analogous to the transformation between molecular P4O6 and P4O10, where in the latter each P atom
of the P4O6 tetrahedron accommodates an extra oxygen atom. Increasing the calcination
temperature favours this segregation of Sb(III) and (V) with an increasing fraction of Sb(III)31.
The data in Table ST3 support the latter assertion, with more Sb(III) segregating to the surface and
hence being detected by XPS when calcined at 700 ºC compared to 400 ºC.
Figure 2 shows plots of the rate of ozone evolution vs the Sb(III) content of the samples: as may be
seen from the figure and Table ST3, the Ni/Sb-SnO2 samples calcined at 400 °C were inactive with
respect to the electrochemical generation of O3, whereas the samples calcined at 700 °C were all
active. This, then, begs the question as to whether the content of Sb, and of Sb(III) in particular
given its location at the surface, influences ozone activity. Further, Sun and co-workers31postulate
that oxygen adsorbs at oxygen vacancies associated with Sb(III).
Given the key steps in the generally-accepted mechanism for ozone generation1, 4, 6, 20 are of the
form:
H2O → OHads + H+ + e− (1)
OHads → Oads + H+ + e− (2)
Oads + Oads → O2ads → O2 (3)
Oads + O2ads → O3ads → O3 (4)
clearly the ability to adsorb molecular oxygen, and for this to compete effectively with the
adsorption of water, is key to the production of ozone. However formation of ozone must clearly
compete with desorption of oxygen formed in step 3. Sun et al.31 state that the binding energy of
water to Sb-SnO2 is less than at SnO2 itself, and that lattice oxygen becomes more available. The
trend observed with the nanoparticulate samples supports the postulate that Sb(III) in some way
enhances or facilitates ozone activity.
7
It was possible to detect Ni in the ceramic anodes (c- 1.0% Ni/Sb-SnO2 460 °C, prepared by dip-
coating) by XPS. Typical spectra are shown in Figure 3 showing the Ni 2p region for an untested
ceramic anode, and an identical anode after being employed to electrolyze 0.5M H2SO4 for 30
seconds in three separate experiments in the cuvette cell at a cell voltage of 2.7V. In contrast to
Grosvenor and co-workers34, the observed peak shapes cannot be synthesised as a superposition of
Ni(II) and Ni(III) but the prevalence of spectral weight within the data towards higher binding
energy is suggestive of the dominance of Ni(III). As can be seen from the figure, most of the Ni
was lost from the surface following electrolysis (0.7% Ni in untested sample compared to 0.1%
after testing), whilst ca. 11.7 ± 0.5% Sb was lost, suggesting dissolution as well as physical loss of
Ni. The possibility that Ni(III) is the active site for ozone evolution at Ni/Sb-SnO2 anodes has been
postulated17-19, but not proven as this species has not, hitherto, been detected at anode surfaces.
Thus, for example, Wang et al.18 presented XPS data on Ni/Sb-SnO2 anodes and claimed that a peak
at 855.6 eV was due to the Ni 2p3/2 peak of Ni(III). However, no peak was apparent in the published
spectrum. Yang and co-workers19 postulated that a peak at 856.3 eV was due to Ni(OH)2 or NiO.
The fact that Ni could not be detected in the Ni/Sb-SnO2 anodes, yet those calcined at 700 °C were
all active for ozone generation, is interesting, as is the fact that the anodes are reasonably durable
when immersed in acid electrolytes under oxidising conditions. As an example of the durability of
the ceramic anodes, Figure 4 shows the results of an experiment in which a ceramic anode, prepared
by exactly the same method as those in Figure 3, was employed to electrolyze 0.5M H2SO4 for 30
seconds in three separate experiments at 9 am and 5 pm each day (apart from the weekend) for 11
days. Between each set of experiments, the electrode was left immersed in 0.5M H2SO4. As can be
seen from the figure, the current density remained at 137 ± 16 mA cm-2 and the current efficiency at
10.3 ± 0.7 % over the testing period. In fact, we have previously reported that anodes prepared
using an identical method except using NiO and Sb2O3 instead of the chloride salts13, 16 remained
highly active for up to 600 hours during the continuous electrolysis of 1M HClO4 at 100 mA cm-2.
In addition, when the anodes failed, they did so because of the catastrophic spallation of the Ni/Sb-
SnO2 coating from the Ti substrate. It is clear from the literature on the dissolution of Ni oxides in
acidic electrolytes35-36 and on the basis of the potentials of the various Ni species37-39 that Ni(III)
will dissolve at open circuit or low potentials during extended immersion in acid electrolytes, whilst
Ni(II) will dissolve under all conditions in such electrolyte. The fact that, during the test in Figure 4
and those reported in references13, 16, the anodes remained active strongly suggests that the nickel is
present below the surface, with its (strong) influence on ozone activity taking place via the ligand
effect40. Any nickel present on the surface simply dissolves away and is not responsible for ozone
activity
TGA
Figure 5(a) shows the thermogravimetric response of the nanopowders produced by the
hydrothermal method and calcined at 400 °C, and Figure 5(b) the corresponding differential plots.
The SnO2 data have been discussed previously21. In brief, based on the differential TGA response
and IR data, the differential plot for SnO2 calcined at 400 °C in Figure 5(a) can be considered in
terms of five temperature regions: (I) 0 – ca. 65 °C, (II) 65 – 150 °C, (III) 150 – 450 °C, (IV)
450 °C – 900 °C and (V) 900 – 25 °C, and these are employed to interpret the Sb-SnO2 and Ni/Sb-
SnO2 data. The samples calcined at 700 °C showed very similar behaviour (see Figures S4(a) and
(b)), except with smaller mass changes compared to those observed using the 400 °C samples.
It is clear from Figures 5(a) and S4(a) that doping with Sb has a significant effect upon the TGA
response. Thus, whilst the general structures of the various plots in the figures are very similar in
that all show the five regions discussed above, the total mass losses on heating to 900 °C were
8
higher for the Sb-containing samples than the undoped SnO2 nanopowders. Thus, for the samples
calcined at 400 °C, the total mass loss observed for SnO2 was ca. 1.5% compared to 3 – 3.8% for
the Sb-containing samples; it does not appear that the Ni content had any significant effect on this
mass loss. This is also seen clearly in the differential plots (Figures. 5(b) and S4(b)), with a large
increase in the first peak due to the loss of water and a shift of ca. 5 °C to higher temperatures,
along with the appearance of peaks near 266 °C, 333 °C and 515 °C in addition to the peak near
450 °C in the response of the undoped SnO2. Given the simplicity of the system and based on the
literature41 these peaks at temperatures > 150 °C must be associated with the dehydroxylation of the
surfaces of the samples (see below), with the additional features due to the presence of Sb.
Regions (I) and (II)
Mass spectroscopy showed only the evolution of water (m/z = 18) from SnO221 and Sb-SnO2
samples calcined at 400 °C and 700 °C with maxima corresponding to the minima in the
corresponding differential plots (eg. Figures 5(b) and S4(b)). Based on the model of Morishige and
co-workers42 and Morimoto et al.43-44, the mass loss in region (I) of the SnO2 response was
attributed to the loss of physisorbed water from Sn(100) facets, having little or no hydrogen
bonding to the OH groups thereon due to the H atoms of the latter occupying the hollows between
the O atoms, and mass loss in region (II) was due to the loss of water hydrogen-bonded to OH
groups on the (111) and (110) facets of the SnO2. Overall, assuming an area of ca. 15 x 10-20 m2 for
the water molecule41 the total mass loss in regions (I) and (II) corresponded to the loss of
0.3721monolayers of water. Table ST4 summarizes the coverage of the nanopowders by water at
25 °C using the same method and assumptions, and Figure 6 shows a plot of the mass of H2O
released from the nanopowder samples calcined at 400 °C as a function of their total surface areas
calculated from the crystallite sizes obtained from the XRD measurements; the corresponding data
for the samples calcined at 700 °C are shown in Figure S5. In both cases, the plots are fairly linear,
supporting the postulate that water has access to the internal surface area within the SnO2 particles.
As expected, the total surface areas of the samples calcined at 700 °C are lower than the 400 °C
samples, and the amount of adsorbed water released is correspondingly lower. It is clear from
Table ST4 that the addition of Sb significantly increases the coverage by water: the undoped
samples show a coverage of 0.1 and 0.03 for the powders calcined at 400 ºC and 700 ºC,
respectively: addition of Sb increases these to 0.21 and 0.13, respectively. Dusastre and Williams24,
following on from the work of Brown and Patterson45 postulate the surface enrichment of SnO2 by
Sb(III), and that water preferentially adsorbs at the substituted sites; the marked increase in
adsorbed water in Table ST4 on doping the SnO2 samples with Sb supports this theory. Further, the
authors suggest that oxygen adsorbs on oxygen vacancies: in the absence of Sb, the active sites are
Sn(II) ions associated with oxygen vacancies, whilst in the presence of Sb, the sites are Sb(III) ions
associated with the vacancies; the adsorption of oxygen competes with that of water, with the
binding energy of water on these vacancies being less on Sb(III) sites than Sn(II). Oxygen
adsorption is discussed in further detail below. Figure 7 shows a plot of the water coverage as a
function of the Ni content in the precursor solutions: clearly, addition of Ni has little effect upon
water coverage for samples calcined at 700 °C, but a marked effect upon those calcined at 400 °C,
with the coverage rising to a maximum at 1%. This suggests that one reason for the inactivity of
the samples calcined at 400 ºC is that the coverage of water is too high, and prevents the adsorption
of molecular oxygen: from the data in Table ST3 this links in to the lower amount of Sb(III) on the
400 °C samples. It does not seem unreasonable to postulate that a minimum surface coverage by
Sb(III) is required to ensure sufficient adsorbed molecular oxygen can compete with water for the
active sites. A plot of Sb(III) content vs water coverage (Figure 8) supports the postulate that too
high a water coverage is linked to low Sb(III) and zero ozone activity.

9
Regions (III) and (IV)
In our previous work, it was postulated21 that the process taking place in regions (III) and (IV) was
the dehydration of SnOH groups on the surface according to:
2SnOH Sn-O-Sn +H2O (5)
Table ST5 shows the ratio of the OH groups to surface Sn atoms for the SnO2, Sb-SnO2 and Ni/Sb-
SnO2 nanopowders assuming 9.1 x 10¹⁴ Sn atoms per cm2 46, calculated on the basis of equation (5),
crystallite surface areas calculated from the XRD data and the mass losses between 150 °C and
900 °C in the TGA experiments. If the value for the Sb-SnO2 calcined at 400 °C is taken as an
outlier, then the data suggest that the addition of Sb and Ni to SnO2 has very little effect upon the
hydroxylation of the surface: however, the calcination temperature does have a marked effect,
almost halving the number of OH species per Sn atom when increasing the calcination temperature
from 400 to 700 °C. This is interesting to note given that the Ni/Sb-SnO2 samples calcined at
700 °C are all active with respect to ozone generation and the corresponding samples calcined at
400 °C are inactive and, as reported in our previous paper, the presence of OH adsorbed on the (111)
and (110) facets of Sn encourages water adsorption due to hydrogen bonding. Further, Sb-SnO2
anodes tend to fail, sometimes after fairly short electrolysis times, failure being defined as the cell
voltage rising to eg. 5V during constant current electrolysis. This failure has been attributed to the
passivation of the electrode surface32, 47-49; for example, Montilla and co-workers32, 48-49 attribute the
inactivation of Sb-SnO2 electrodes to the formation of a passivating SnOH layer on the surface.
Region (V) and oxygen uptake
In our previous paper21 we attributed the mass increase in region (V), at least from 900 to 150 °C,
to the uptake of molecular oxygen via adsorption, simply on the basis of the chemical simplicity of
the system. Figure S6 shows plots of the mass gain in region (V) for the various samples. It is not
clear from the figure that there is any difference between the mass gain in region (V) that relates to
electrode composition.
Previously, we attributed the inflexion in the TGA response of SnO2 in Figure 5(a) marked with *,
and similarly marked on Figure 5(b), to the uptake of oxygen50 which was largely masked due to the
processes associated with the dehydration and dehydroxylation of the surface. In order to explore
this, we carried out sequential heating and cooling cycles, and Figure 9(a) shows the typical data so
obtained using the SnO2 sample calcined at 400 °C, whilst Figure 9(b) shows the 4th heating and
cooling cycle for the SnO2, Sb-SnO2 and Ni/Sb-SnO2 samples calcined at 400 °C. The analogous
spectra to those in Figure 9(b) for the samples calcined at 700 °C are shown in Figure S7. As can
be seen, all the responses are similar, and from cycle 2 onwards, all (eventually) return to 100% and
hence the processes responsible for the behaviour in Figure 9(b) and S7 are reversible. The
similarity between the Sb-containing samples is emphasised in Figures 10 and S8 which show the
differential plots of the data in Figure 9(b) and S7. We attribute the increase in mass to the
reversible uptake of oxygen at the crystallite boundaries50: it is generally accepted that oxygen
adsorbs on the surface of SnO2, and can then diffuse into the inner grain boundary (i.e. crystallite)
surfaces of porous SnO246, 51. The adsorbed O2 that was initially gained up to 350 – 500 °C is then
lost on heating to 900 °C, with additional loss of oxygen – possibly due to oxygen desorbing from
the crystallite surfaces within the grains. On cooling, the initial state is regained.
Table ST6 shows the number of oxygen molecules adsorbed per Sn atom during the initial stages of
heating in Figures 9(b) and S7, and the nett loss of O2 molecules per Sn atom on heating from 25 °C

10
to 900 °C, assuming 9.1 x 10¹⁴ Sn atoms cm-2 46 and using the XRD crystallite surface areas.
Clearly, the addition of Sb has a very significant effect upon O2 uptake, which drops by a factor of
ca. 6 for both the samples calcined at 400 °C and those calcined at 700 °C. Addition of Ni then
increases the uptake slightly in both cases. Considering only the Ni/Sb-SnO2 samples in Table ST6,
the ozone-active samples calcined at 700 °C show a higher uptake of oxygen than those calcined at
400 °C, in agreement with our postulate that molecularly adsorbed O2 is key to ozone activity.
Figure 11 shows a plot of the O2 uptake vs the Sb(III) content: as can be seen, it appears that there is,
again, a correlation. Interestingly, and in contrast to the data in Figures 9(b) and S7, the fully
hydrated samples do not show an initial increase in mass on heating, see Figures 5(a) and S4(a),
suggesting that water inhibits O2 adsorption, in agreement with the discussion above.
The Sb-SnO2/Ni samples
As can be seen from Figures S1(c) (i) and (ii), there is no change in the colour of the Sb-SnO2
700 °C sample on adding the Ni and heating again to 700 °C, as may be expected. The XRD data
are very similar to those of the other samples, showing only cassiterite. The VBET/VXRD of the 700
ºC Sb-SnO2/0.1% Ni 700 ºC powder was 5.5, ca. 3x lower than those of the Ni/Sb-SnO2 700 °C
samples. This implies that the elimination of internal grain boundaries is promoted by the second
calcination. As can be seen from Table ST3, all three Sb-SnO2/Ni samples were active for O3, with
the samples calcined at 700 °C after Ni addition both giving the same rate of O3 at ca. 15 – 16
nanomoles s-1, whilst the sample calcined at 460 ºC after Ni addition gives a rate ca. half those of
the other two samples. The Ni content at the surface is ca. 2 -3 times less for 700 °C Sb-
SnO2/0.01% Ni 700 °C compared to 700 ºC Sb-SnO2/0. 1% Ni 700 °C, and the latter is comparable
to that of the 700 ºC Sb-SnO2/0. 1% Ni 460 ºC sample. This is not surprising based on the model
developed above: addition of a Ni solution of higher concentration yields more surface Ni, but this
is not the species responsible for O3 activity, and simply dissolves away on immersion in acidic
electrolyte. The lower O3 activity of the 700 ºC Sb-SnO2/0. 1% Ni 460 ºC may be related to the
lower Sb(III) content. To our knowledge, this is the first report of ozone generation by Ni/Sb-SnO2
nanopowder anodes.
Figures 12(a) and (b) show plots of current efficiency and current density, respectively, vs Ni the
content of the 700 °C Sb-SnO2/Ni T2 samples with T2 = 460 °C and 700 °C. It is clear that the
initial temperature employed to calcine the Sb-SnO2 nanopowders (T1) essentially determines the
current efficiency, with the subsequent calcination temperature (T2) of the 700 °C Sb-SnO2/Ni T2
having little effect. In contrast, T2 had a marked effect upon the current density observed. These
data suggest that, in agreement with the discussions above, Sb is not simply important to induce
electronic conductivity, but also plays a significant role in the surface chemistry, and in particular,
with respect to ozone generation. In addition, it is clear from the figures that, despite a hundred-
fold difference in the amount of Ni actually added to the surface, there is a much smaller difference
in the observed current densities and efficiencies, supporting the postulate that the Ni at the surface
simply dissolves away and is unimportant with respect to ozone generation: it is the subsurface Ni,
which cannot be detected, that catalyses O3 evolution. The latter is supported by the data for the Ni-
Sb/SnO2 samples calcined at 700 °C in Figure 2, all of which show comparable activities for O3,
despite a fivefold difference in Ni concentration in the precursor solutions, the Ni undetected by
XPS.
Figures S6 and S7 show that the TGA responses of the 700 ºC Sb-SnO2/0. 1% Ni 700 ºC closely
resemble those of the Sb-SnO2 and Ni/Sb-SnO2 samples calcined at 700 ºC, differing only in
magnitude.
11
Model
To integrate the observations reported above, we propose a model for the surface behaviour of Sb-
SnO2, based on the concept illustrated in Figure 13. BET surface area measurements give
information about the particle surface area as nitrogen is unable to access internal grain boundary
interfaces beneath the external particle surface at 77K. By way of contrast XRD gives an estimate
of crystallite size, limited by the internal interfaces between domains of identical crystallographic
orientation. To explain the experimental observations reported in this paper, we propose that water
(in the form of OH) accesses internal crystallite surfaces through diffusion of OH, and this then
controls the formation of O3. However, given that N2 cannot access the internal crystallite surfaces
it is unlikely that O3 can be generated on these and subsequently diffuse to the particle surface.
Instead, we propose that O3 is generated at particle surfaces from OH that is able to diffuse via
crystallite surfaces. The diffusion of water in rutile TiO2, which has the same crystal structure as
SnO2, is well known to take place (see, for example52-53).That the mobile species is in fact the OH
radical was shown by the detailed investigations of oxygen diffusion in rutile by Moore et al.54.
In addition to the morphological effects, there is clearly a synergic interaction between nickel and
antimony because Sb-doped SnO2 is inactive with respect to ozone evolution in the absence of Ni.
On the other hand Ni doping by itself does not give the sort of conductive oxide required for use as
an electrode. Formally Ni2+ would act as a two-hole p-type dopant, but SnO2 is not amenable to p-
type doping. This leads to the following considerations. Ni(II) has almost exactly the same ionic
radius as Sn(IV) but clearly has a lower charge. Ni(II) incorporation into subsurface region of SnO2
can be compensated by oxygen vacancies to maintain charge neutrality. We suggest that these
vacancies may promote dissociation of O2ads appearing in step (2) in the scheme discussed earlier: a
single O atom remains chemisorbed to donor Sb(III) sites and the second O atom diffuses onto a
bulk oxygen vacancy site in the subsurface region where it can trap two electrons from the
conduction band to give O2-sub. This will inhibit desorption of oxygen. However we speculate that
the process is reversible so that O may shuttle back to the surface. Instead of concerted addition of
O2 to OH we may envisage an alternative sequence of steps:
O2ads + 2e−CB → Oads + O2−
sub (6)
OHads + Oads → HO2ads (7)
HO2ads + O2−sub → HO3ads + 2e−
CB (8)
HO3ads → O3 + H+ + e− (9)
This proposal is speculative and does not involve participation by Ni(III) as has been proposed
elsewhere; on the other hand, it does explain the obvious synergy as the mechanism requires both
subsurface oxygen vacancies and electrons in the conduction band. The proposed synergy in ozone
generation between subsurface oxygen vacancies and surface lone pair cations in a metallic oxide
also helps explain the activity of PbO2 as an anode. Both SnO2 and PbO2 adopt the rutile structure,
but intrinsically PbO2 tolerates a much higher concentration of bulk oxygen vacancies: recent
neutron diffraction experiments supported by first principle calculations of defect formation
energies show that in commercial PbO2 powder, up to 1.6% of the oxygen sites may be empty55.
These vacancies act as two electron donors, so that PbO2-x is a metallic conductor. At the same time
the facile reduction of PbO2 at the surface will promote formation of surface Pb(II) cations which
support an electron lone pair. Thus in PbO2-x oxygen vacancies provide all three ingredients
required by our mechanism. In NATO anodes, bulk and segregated Sb and Ni are each required as
the intrinsic O vacancy concentration in SnO2 is much lower. Bulk Sb(V) acts as the electron donor
resulting in metallic behaviour, surface Sb(III) acts as the surface lone pair cation and bulk Ni(II) is
required to promote formation of oxygen vacancies below the surface.

12
Conclusions
In Ni and Sb co-doped SnO2, the Ni and Sb ions replace Sn(IV) ions with no effect upon the unit
cell dimensions. The Sb is present as Sb(V) in the crystal bulk where it acts as a one electron donor,
with segregation of Sb(III) to the surface, whilst Ni occupies Sn(IV) sites in the subsurface region at
concentrations below the level of detectability by XPS. Sb(V) confers electronic conductivity on
SnO2 whilst both Sb(III) and subsurface Ni are essential for ozone generation. Ni(II) incorporation
is compensated by oxygen vacancies which promote the dissociation of adsorbed molecular oxygen
to give single oxygen atoms adsorbed on Sb(III) sites. These atoms react with adsorbed hydroxyl
molecules to produce O3. The Ni/Sb-SnO2 particles individually are composed of several
crystallites, and ozone generation is controlled by the diffusion of OH radicals to the internal
crystallite surfaces.
For the first time, Ni/Sb-SnO2 nanopowders have been made that are highly active and selective
towards the electrochemical generation of ozone. The synthesis of these nanopowders has not been
optimised, but with such optimisation our approach should lead to the production of compact, zero
gap and energy efficient electrochemical systems capable of treating real waters.
Acknowledgements
SM would like to thank the Thai Government for the award of a Royal Thai Scholarship. The
authors would like to thank Mr. Bernard Bowler for his expertise in thermogravimetric analysis and
Ms. Emma Shuttleworth for her invaluable help with the ozone measurements.
References
1. Silva, L. M. d.; Jardim, W. F., Trends and Strategies of Ozone Application in Environmental
Problems. Química Nova 2006, 29, 310-317.
2. Khoudja, R. Y.; Xu, Y.; Li, T.; Zhou, C., Better Ivf Outcomes Following Improvements in
Laboratory Air Quality. Journal of Assisted Reproduction and Genetics 2013, 30, 69-76.
3. Siemens, W., Ueber Die Elektrostatische Induction Und Die Verzögerung Des Stroms in
Flaschendrähten. Annalen der Physik 1857, 178, 66-122.
4. Christensen, P. A.; Yonar, T.; Zakaria, K., The Electrochemical Generation of Ozone: A
Review. Ozone-Science & Engineering 2013, 35, 149-167.
5. Kirk-Othmer, Encyclopedia of Chemical Technology, 5th ed.. ed.; Hoboken, N.J. : Wiley-
Interscience: Hoboken, N.J., 2004; Vol. 17.
6. De Sousa, L. G.; Franco, D. V.; Da Silva, L. M., Electrochemical Ozone Production Using
Electrolyte-Free Water for Environmental Applications. Journal of Environmental Chemical
Engineering 2016, 4, 418-427.
7. Arihara, K.; Terashima, C.; Fujishima, A., Application of Freestanding Perforated Diamond
Electrodes for Efficient Ozone-Water Production. Electrochemical and Solid-State Letters
2006, 9, D17-D20.
8. Kraft, A.; Stadelmann, M.; Wünsche, M.; Blaschke, M., Electrochemical Ozone Production
Using Diamond Anodes and a Solid Polymer Electrolyte. Electrochemistry Communications
2006, 8, 883-886.
9. Arihara, K.; Terashima, C.; Fujishima, A., Electrochemical Production of High-
Concentration Ozone-Water Using Freestanding Perforated Diamond Electrodes. Journal of
The Electrochemical Society 2007, 154, E71-E75.
10. Chan, K. Y.; Cheng, S. A., Electrolytic Generation of Ozone on an Antimony-Doped Tin
Dioxide Coated Electrode. Electrochemical and solid-state letters 2004, 7, D4-D6.

13
11. Wang, Y. H.; Cheng, S. A.; Chan, K. Y.; Li, X. Y., Electrolytic Generation of Ozone on
Antimony- and Nickel-Doped Tin Oxide Electrode. Journal of the Electrochemical Society
2005, 152, D197-D200.
12. Christensen, P. A.; Lin, W. F.; Christensen, H.; Imkum, A.; Jin, J. M.; Li, G.; Dyson, C. M.,
Room Temperature, Electrochemical Generation of Ozone with 50% Current Efficiency in
0.5m Sulfuric Acid at Cell Voltages < 3v. Ozone: Science & Engineering 2009, 31, 287-293.
13. Christensen, P. A.; Zakaria, K.; Christensen, H.; Yonar, T., The Effect of Ni and Sb Oxide
Precursors, and of Ni Composition, Synthesis Conditions and Operating Parameters on the
Activity, Selectivity and Durability of Sb-Doped SnO2 Anodes Modified with Ni. Journal of
the Electrochemical Society 2013, 160, H405-H413.
14. Wang, Y. H.; Cheng, S.; Chan, K. Y., Synthesis of Ozone from Air Via a Polymer-
Electrolyte-Membrane Cell with a Doped Tin Oxide Anode. Green Chemistry 2006, 8, 568-
572.
15. Cui, Y.; Wang, Y.; Wang, B.; Zhou, H.; Chan, K.-Y.; Li, X.-Y., Electrochemical Generation
of Ozone in a Membrane Electrode Assembly Cell with Convective Flow. Journal of The
Electrochemical Society 2009, 156, E75-E80.
16. Zakaria., K. Industrial Wastewater Treatment Using Electrochemically Generated Ozone.
Ph.D. Thesis, Newcastle University, Newcastle Upon Tyne, 2013.
17. Basiriparsa, J.; Abbasi, M., High-Efficiency Ozone Generation Via Electrochemical
Oxidation of Water Using Ti Anode Coated with Ni-Sb-SnO2. Journal of Solid State
Electrochemistry 2012, 16, 1011-1018.
18. Wang, Y. H.; Chan, K. Y.; Li, X. Y.; So, S. K., Electrochemical Degradation of 4-
Chlorophenol at Nickel–Antimony Doped Tin Oxide Electrode. Chemosphere 2006, 65,
1087-1093.
19. Yang, S. Y.; Choo, Y. S.; Kim, S.; Lim, S. K.; Lee, J.; Park, H., Boosting the
Electrocatalytic Activities of SnO2 Electrodes for Remediation of Aqueous Pollutants by
Doping with Various Metals. Applied Catalysis B: Environmental 2012, 111–112, 317-325.
20. Christensen, P. A.; Zakaria, K.; Curtis, T. P., Structure and Activity of Ni- and Sb–Doped
SnO2 Ozone Anodes. Ozone: Science & Engineering 2012, 34, 49-56.
21. Christensen, P. A.; Attidekou, P. S.; Egdell, R. G.; Maneelok, S.; Manning, D. A. C., An in
Situ FTIR Spectroscopic and Thermogravimetric Analysis Study of the Dehydration and
Dihydroxylation of SnO2: The Contribution of the (100), (110) and (111) Facets. Physical
Chemistry Chemical Physics 2016, 18, 22990-22998.
22. Fujihara, S.; Maeda, T.; Ohgi, H.; Hosono, E.; Imai, H.; Kim, S.-H., Hydrothermal Routes
to Prepare Nanocrystalline Mesoporous SnO2 Having High Thermal Stability. Langmuir
2004, 20, 6476-6481.
23. Xue, Y.; Zhang, Y.; Zhang, P., Theory of the Color Change of NaxWO3 as a Function of Na-
Charge Doping. Physical Review B 2009, 79, 205113.
24. Dusastre, V.; Williams, D. E., Sb(III) as a Surface Site for Water Adsorption on Sn(Sb)O2,
and Its Effect on Catalytic Activity and Sensor Behavior. The Journal of Physical Chemistry
B 1998, 102, 6732-6737.
25. Rockenberger, J.; zum Felde, U.; Tischer, M.; Tröger, L.; Haase, M.; Weller, H., Near Edge
X-Ray Absorption Fine Structure Measurements (XANES) and Extended X-Ray Absorption
Fine Structure Measurements (EXAFS) of the Valence State and Coordination of Antimony
in Doped Nanocrystalline SnO2 The Journal of Chemical Physics 2000, 112, 4296-4304.
26. Cross, Y. M.; Pyke, D. R., An X-Ray Photoelectron Spectroscopy Study of the Surface
Composition of Tin and Antimony Mixed Metal Oxide Catalysts. Journal of Catalysis 1979,
58, 61-67.

14
27. Egdell, R. G.; Cox, P. A.; Harding, C.; Patterson, W. R.; Tavener, P. J., Surface Properties
of Antimony Doped Tin(IV) Oxide: A Study by Electron Spectroscopy. Surface Science
1982, 123, 179-203.
28. Ono, T.; Yamanaka, T.; Kubokawa, Y.; Komiyama, M., Structure and Catalytic Activity of
Sb Oxide Highly Dispersed on Sno2 for Propene Oxidation. Journal of Catalysis 1988, 109,
423-432.
29. Slater, B.; Catlow, C. R. A.; Gay, D. H.; Williams, D. E.; Dusastre, V., Study of Surface
Segregation of Antimony on SnO2 Surfaces by Computer Simulation Techniques. The
Journal of Physical Chemistry B 1999, 103, 10644-10650.
30. McGinley, C.; Al Moussalami, S.; Riedler, M.; Pflughoefft, M.; Borchert, H.; Haase, M.; de
Castro, A. R. B.; Weller, H.; Möller, T., Pure and Sb-Doped Sno2 Nanoparticles Studied by
Photoelectron Spectroscopy. The European Physical Journal D - Atomic, Molecular,
Optical and Plasma Physics 2001, 16, 225-228.
31. Sun, K.; Liu, J.; Browning, N. D., Correlated Atomic Resolution Microscopy and
Spectroscopy Studies of Sn(Sb)O2 Nanophase Catalysts. Journal of Catalysis 2002, 205,
266-277.
32. Montilla, F.; Morallón, E.; De Battisti, A.; Barison, S.; Daolio, S.; Vázquez, J. L.,
Preparation and Characterization of Antimony-Doped Tin Dioxide Electrodes. 3. XPS and
SIMS Characterization. The Journal of Physical Chemistry B 2004, 108, 15976-15981.
33. Egdell, R. G.; Flavell, W. R.; Tavener, P., Antimony-Doped Tin(IV) Oxide: Surface
Composition and Electronic Structure. Journal of Solid State Chemistry 1984, 51, 345-354.
34. Grosvenor, A. P.; Biesinger, M. C.; Smart, R. S. C.; McIntyre, N. S., New Interpretations of
XPS Spectra of Nickel Metal and Oxides. Surface Science 2006, 600, 1771-1779.
35. Nut, K., On the Dissolution Behavior of Nio. Corrosion Science 1970, 10, 571-583.
36. Pichugina, N. M.; Kutepov, A. M.; Gorichev, I. G.; Izotov, A. D.; Zaitsev, B. E., Dissolution
Kinetics of Nickel(II) and Nickel(III) Oxides in Acid Media. Theoretical Foundations of
Chemical Engineering 2002, 36, 485-494.
37. Pourbaix, M., Atlas of Electrochemical Equilibria in Aqueous Solutions; National
Association of Corrosion Engineers: Houston, Tex., 1974, p 342.
38. D. D. Wagman, W. H. E., V. B. Parker, R. H. Schumm, I. Halow, S. M. Bailey, K. L.
Churney, and R. L. Nuttall, The Nbs Tables of Chemical Thermodynamic Properties.
Journal of Physical and Chemical Reference Data 1982, 11, 1807.
39. Bard, A. J.; Parsons, R.; Jordan, J., Standard Potentials in Aqueous Solution, 1st ed.. ed.;
New York : M. Dekker: New York, 1985.
40. Freitas, R. G.; Antunes, E. P.; Christensen, P. A.; Pereira, E. C., The Influence of Ir and
Pt1Ir1 Structure in Metallic Multilayers Nanoarchitectured Electrodes Towards Ethylene
Glycol Electro-Oxidation. Journal of Power Sources 2012, 214, 351-357.
41. Harrison, P. G.; Guest, A., Tin Oxide Surfaces. Part 17.-an Infrared and Thermogravimetric
Analysis of the Thermal Dehydration of Tin(IV) Oxide Gel. Journal of the Chemical Society,
Faraday Transactions 1: Physical Chemistry in Condensed Phases 1987, 83, 3383-3397.
42. Morishige, K.; Kittaka, S.; Morimoto, T., The Thermal Desorption of Surface Hydroxyls on
Tin(IV) Oxide. Bulletin of the Chemical Society of Japan 1980, 53, 2128-2132.
43. Morimoto, T.; Yokota, Y.; Kittaka, S., Adsorption Anomaly in the System Tin(IV) Oxide-
Water. The Journal of Physical Chemistry 1978, 82, 1996-1999.
44. Morimoto, T.; Kiriki, M.; Kittaka, S.; Kadota, T.; Nagao, M., Differential Heat of
Chemisorption. 3. Chemisorption of Water on Tin(IV) Oxide. The Journal of Physical
Chemistry 1979, 83, 2768-2770.
45. Brown, I.; Patterson, W. R., Reactivity of Tin Oxide and Some Antimony-Tin Oxide
Catalysts for the Oxidation of Methane and the Isotopic Exchange of Oxygen. An

15
Examination of the Role of Adsorbed and Lattice Oxygen in Catalytic Oxidation. Journal of
the Chemical Society, Faraday Transactions 1: Physical Chemistry in Condensed Phases
1983, 79, 1431-1449.
46. Mizusaki, J.; Koinuma, H.; Shimoyama, J.-I.; Kawasaki, M.; Fueki, K., High Temperature
Gravimetric Study on Nonstoichiometry and Oxygen Adsorption of SnO2. Journal of Solid
State Chemistry 1990, 88, 443-450.
47. Kotz, R.; Stucki, S.; Carcer, B., Electrochemical Waste Water Treatment Using High
Overvoltage Anodes. Part I: Physical and Electrochemical Properties of SnO2 Anodes.
Journal of Applied Electrochemistry 1991, 21, 14-20.
48. Montilla, F.; Morallón, E.; De Battisti, A.; Benedetti, A.; Yamashita, H.; Vázquez, J. L.,
Preparation and Characterization of Antimony-Doped Tin Dioxide Electrodes. Part 2. Xrd
and Exafs Characterization. The Journal of Physical Chemistry B 2004, 108, 5044-5050.
49. Montilla, F.; Morallón, E.; De Battisti, A.; Vázquez, J. L., Preparation and Characterization
of Antimony-Doped Tin Dioxide Electrodes. Part 1. Electrochemical Characterization. The
Journal of Physical Chemistry B 2004, 108, 5036-5043.
50. Higgins, S.; Sammes, N. M.; Smirnova, A.; Kilner, J. A.; Tompsett, G., Yttrium-Doped
Barium Zirconates as Ceramic Conductors in the Intermediate Temperature Range. Journal
of Fuel Cell Science and Technology 2008, 5, 011003-011003.
51. Aldao, C. M.; Schipani, F.; Ponce, M. A.; Joanni, E.; Williams, F. J., Conductivity in SnO2
Polycrystalline Thick Film Gas Sensors: Tunneling Electron Transport and Oxygen
Diffusion. Sensors and Actuators B: Chemical 2014, 193, 428-433.
52. Cathcart, J. V.; Perkins, R. A.; Bates, J. B.; Manley, L. C., Tritium Diffusion in Rutile
(TiO2). Journal of Applied Physics 1979, 50, 4110-4119.
53. Farver, J. R., Oxygen and Hydrogen Diffusion in Minerals. Reviews in Mineralogy and
Geochemistry 2010, 72, 447-507.
54. Moore, D. K.; Cherniak, D. J.; Watson, E. B., Oxygen Diffusion in Rutile from 750 to
1000℃ and 0.1 to 1000 Mpa. American Mineralogist 1998, 83, 700-711.
55. Scanlon, D. O.; Kehoe, A. B.; Watson, G. W.; Jones, M. O.; David, W. I. F.; Payne, D. J.;
Egdell, R. G.; Edwards, P. P.; Walsh, A., Nature of the Band Gap and Origin of the
Conductivity of PbO2 Revealed by Theory and Experiment. Physical Review Letters 2011,
107, 246402.

16
Figure captions
1. Plots of ratio of grain volume (calculated from the BET surface areas) to crystallite volume
(calculated from the XRD data using Scherrer’s equation), for the SnO2, Sb-SnO2 and Ni/Sb-
SnO2 nanopowders calcined at (i) 400 ºC and (ii) 700 ºC, see text for details. “0.5%Ni” is
0.5%Ni/Sb-SnO2, fabricated from a precursor solution containing 0.5 wt.% Ni.
2. Plots of the rate of O3 evolution from 0.64 cm2 nanopowder and ceramic anodes vs the Sb(III)
content obtained from the XPS data. The ozone evolution rate was determined after 30 s
electrolysis of 0.5M H2SO4 in a UV Vis cuvette cell at 2.7V using a 0.64 cm2 Pt/Ti mesh
cathode, see text for details
3. XPS spectra of the Ni2p region of (i) untested and 9ii) tested ceramic 1% Ni/Sb-SnO2 anodes.
See text for details.
4. The current density and ozone current efficiency observed during the durability testing of a
ceramic 1% Ni/Sb-SnO2 anode. The anode was employed to electrolyse 0.5M H2SO4 twice a
day for 30 s, the electrolysis repeated three times for both electrolyses. Between electrolyses,
the anode was left immersed in 0.5M H2SO4 at open circuit.
5. (a) The thermogravimetric responses of the SnO2-containing nanopowders produced via the
hydrothermal method and calcined at 400 °C. The samples were heated in 40 cm3 min-1
flowing air at 5°C min-1 from room temperature to 900 °C. The samples were then held at
900°C for 10 minutes and then cooled at 5°C min-1 to room temperature. See Table ST5 for
sample masses. (b) The differential plots of the curves in (a).
6. Plots of the mass of water released during heating up to 150 ºC in TGA experiments
conducted using all nanopowder samples calcined at 400 ºC vs the surface area of the
particles calculated from the crystallite sizes using the Scherrer equation and assuming
spherical crystallites.
7. Plots of water coverage at 25 ºC on the Sb-containing nanoparticles calcined at (i) 400 °C and
(ii) 700 °C calculated from TGA and XRD data vs the Sb(III) content of the samples,
determined using XPS.
8. Plots of water coverage at 25 ºC on the Sb-containing nanoparticles as a function of Sb(III)
content.
9. (a) The thermogravimetric response of 56.0 mg of the SnO2 nanopowder produced via the
hydrothermal method and calcined at 400 °C. The sample was heated in 40 cm3 min-1
flowing air at 5°C min-1 from room temperature to 900 °C. The sample was held at 900°C for
10 minutes and then cooled at 5°C min-1 to room temperature. This cycle was repeated a
further three times. (i) Cycle 1, (ii) cycle 2 and (iii) cycle 4. (b) The thermogravimetric
responses of the SnO2-containing nanopowders produced via the hydrothermal method and
calcined at 400 °C. The samples were heated in 40 cm3 min-1 flowing air at 5°C min-1 from
room temperature to 900 °C. The samples were held at 900°C for 10 minutes and then cooled
at 5°C min-1 to room temperature. This cycle was repeated a further three times. Only the
fourth cycles are shown. See Table ST6 for sample masses.
10. The differential mass plots of the heating parts of the TGA responses in fig. 9(b).
11. A plot of the number of O2 molecules gained per Sn atom for all the Sb-SnO2 and Ni/Sb-SnO2
nanopowders calcined at 400 ºC vs the Sb(III) content, from the TGA data on the heating part
of the 4th cycles up to ca. 350 ºC, the BET surface areas of the samples and XPS data. See
Table ST6 for sample masses.
12. (a) Plots of current efficiency vs Ni content of the 700 °C Sb-SnO2/Ni T2 samples with T2 =
460 °C and 700 °C. (b) Plots of current density vs Ni content for the samples in fig. 12(a).
13. Conceptual model of the grains and crystallites of the Ni/Sb-SnO2 nanopowders.

17
Scheme 1. The preparation of the SnO2, Sb-SnO2 and Ni/Sb-SnO2 nanpowders.
18
Scheme 2. The preparation of the Sb-SnO2/Ni nanopowders.

19
TOC graphic