the icfai university 2006-31 cases/biocon - model question paper.pdfthe icfai university 2006-31...
TRANSCRIPT
The ICFAI University 2006-31
Biocon Limited
“We have two goals. One is to benefit the ordinary people and help
the country’s development. The other is to promote innovation1.”
–– Dr. M K Bhan, Secretary, Department of Biotechnology in April 2005.
When Kiran Mazumdar-Shaw set up a small unit of operation in her garage in 1978 with a capital of just Rs.10,000 and with a staff of two employees in a Bangalore neighborhood, for extracting an enzyme from papayas, few in India have ever heard of biotechnology. Today, she is the richest woman in India and made it to the FORTUNE’s list of 50 most powerful women in international business for the first time in 2005 and heads Biocon, the leading biotech firm in India. The company has evolved from a maker of enzymes to a major biopharmaceutical enterprise producing everything from insulin to antibodies, with annual revenues of around $150 million in the fiscal year 2004-05. The company was singled out as a World Economic Forum Tech Pioneer in 2001 and Mazumdar-Shaw aims to make it one of the world’s top-five biotech companies in the not-too-distant future.
According to Kiran Mazumdar-Shaw, chairperson and managing director, Biocon, the biotechnology industry, which took root in India five decades ago, has a potential to reach $9 billion by 2010, and the industry is expected to grow at 25-30 percent per annum.
THE INDUSTRY BACKGROUND
Biotechnology deals with modification of DNA or genetic material in plants, animals and
microorganisms to discover useful products and technologies. It helps in developing genetically
modified plants, animals and microorganisms to improve human lives and environment.
In India, biotechnology had its birth in 1954 when two scientists from University of Madras,
Prof. G N Ramachandran and Prof G Kartha, uncovered the interlocked three-chain triple helix
structure of collagen, the most abundant protein of the connective tissue. Prof. Ramachandran,
after spending around 20 years in Chennai, shifted to the Indian Institute of Science(IISc),
Bangalore, and set up the Molecular Biophysics Unit. At that time, government laboratories such
as the Hyderabad based Center for Cellular and Molecular Biology (CCMB), the Delhi-based
Center for Biochemical Technology (CBT) and the Banglore-based National Center for Biological
Sciences (NCBS) were also doing fundamental research in biology. But, none of these institutes
tried to exploit the commercial opportunities in research.
The major biotechnology companies then were Biocon, Panacea Biotec, Bharath Serums and
Vaccines, Bangalore Genei and the Serum Institute of India. Except Bangalore Genei, none of
these could be termed as pure or modern biotechnology companies. Bangalore Genei was set up in
1989 as the first start-up in India. However, till 1997, Indian biotechnology was limited to classical
biotechnology, with tissue culture and fermentation as its two main activities.
A number of start-ups followed and pharmaceutical companies started investing more in
biotechnology. By early 2001, there was a feeling that the Indian biotechnology industry was
about to take off; but, there was a global biotech downturn then and Venture Capital (VC) funds
for biotechnology vanished. As a result, Indian biotech start-ups struggled for funds. However, by
2003 the global biotechnology industry was back into its growth phase, and VCs started looking at
the sector again. The VC commitment in the global biotech industry increased 15% to $21.1
billion in 2004. As a result, biotech companies in India started coming up. However, Indian VCs
are still cautious to invest in the biotech sector. Annual commitment of VCs in India is estimated
at $150 million in 2004, an increase of just 9% over $137 million in 2003. Moreover, out of these
investments, only around 15% is being invested in seed stage companies. The rest is tilted towards
1 Speaking at a Press Conference on April 11, 2005.
BIOCON 2006-31
672
the biotech companies with clear products, technology and markets. Currently, the Indian industry
consists of more start-ups and companies that have diversified into this area than companies with
concrete business activity.
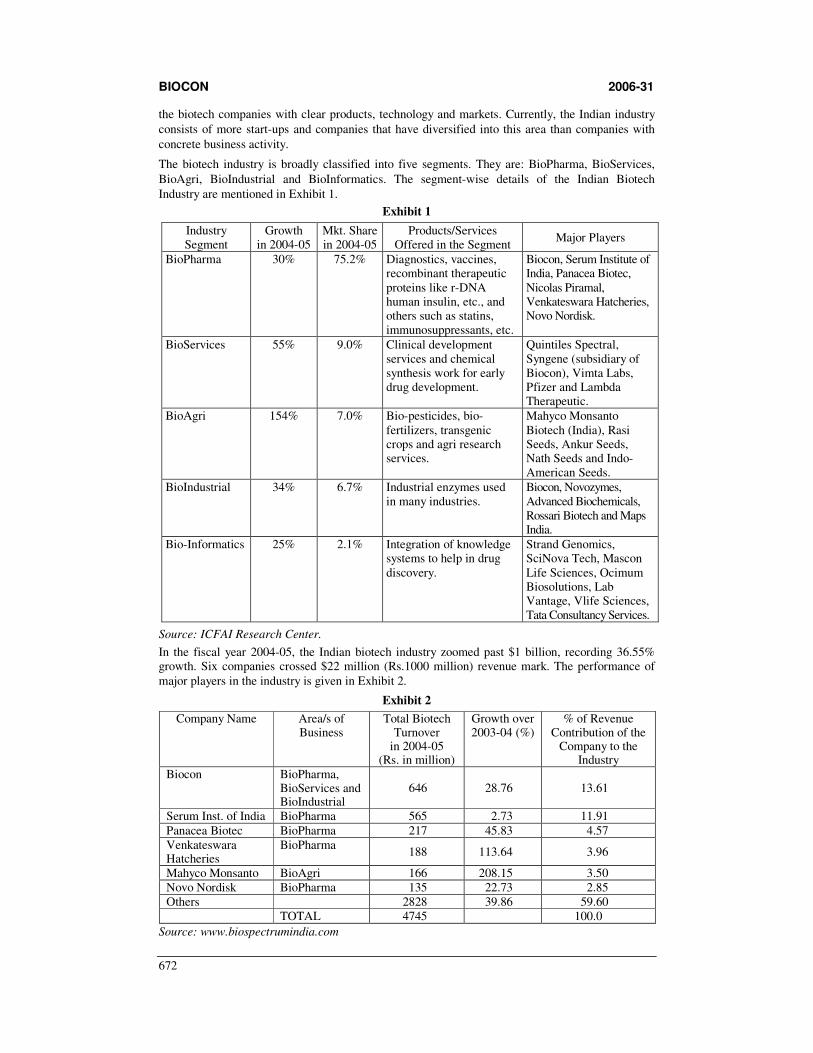
The biotech industry is broadly classified into five segments. They are: BioPharma, BioServices,
BioAgri, BioIndustrial and BioInformatics. The segment-wise details of the Indian Biotech
Industry are mentioned in Exhibit 1.
Exhibit 1
Industry Segment
Growth in 2004-05
Mkt. Share in 2004-05
Products/Services Offered in the Segment
Major Players
BioPharma 30% 75.2% Diagnostics, vaccines, recombinant therapeutic proteins like r-DNA human insulin, etc., and others such as statins, immunosuppressants, etc.
Biocon, Serum Institute of India, Panacea Biotec, Nicolas Piramal, Venkateswara Hatcheries, Novo Nordisk.
BioServices 55% 9.0%
Clinical development services and chemical synthesis work for early drug development.
Quintiles Spectral, Syngene (subsidiary of Biocon), Vimta Labs, Pfizer and Lambda Therapeutic.
BioAgri 154% 7.0% Bio-pesticides, bio-fertilizers, transgenic crops and agri research services.
Mahyco Monsanto Biotech (India), Rasi Seeds, Ankur Seeds, Nath Seeds and Indo-American Seeds.
BioIndustrial 34% 6.7% Industrial enzymes used in many industries.
Biocon, Novozymes, Advanced Biochemicals, Rossari Biotech and Maps India.
Bio-Informatics 25% 2.1% Integration of knowledge systems to help in drug discovery.
Strand Genomics, SciNova Tech, Mascon Life Sciences, Ocimum Biosolutions, Lab Vantage, Vlife Sciences, Tata Consultancy Services.
Source: ICFAI Research Center.
In the fiscal year 2004-05, the Indian biotech industry zoomed past $1 billion, recording 36.55% growth. Six companies crossed $22 million (Rs.1000 million) revenue mark. The performance of major players in the industry is given in Exhibit 2.
Exhibit 2
Company Name Area/s of Business
Total Biotech Turnover
in 2004-05 (Rs. in million)
Growth over 2003-04 (%)
% of Revenue Contribution of the
Company to the Industry
Biocon BioPharma, BioServices and BioIndustrial
646 28.76 13.61
Serum Inst. of India BioPharma 565 2.73 11.91 Panacea Biotec BioPharma 217 45.83 4.57 Venkateswara Hatcheries
BioPharma 188 113.64 3.96
Mahyco Monsanto BioAgri 166 208.15 3.50 Novo Nordisk BioPharma 135 22.73 2.85 Others 2828 39.86 59.60 TOTAL 4745 100.0
Source: www.biospectrumindia.com
BIOCON 2006-31
673
Analysts say that the Indian biotech firms, especially Biocon Ltd., are making strong positions in
this highly potential business by developing business models and improving product
commercialization capabilities and product differentiation.
The global pharmaceuticals market can be broadly classified into the regulated and
unregulated/semi-regulated markets. The regulated markets protect intellectual property rights and
offer a premium for intellectual property protection, quality, regulatory compliance and also more
stability for prices and volumes. That is why the globally top selling drugs are generally patented
pharmaceuticals sold in regulated markets. The United States and Europe are considered to be
highly regulated markets. Products have to meet stringent quality standards to be sold in these
markets. On the other hand, the unregulated/semi-regulated markets include developing countries
with a few entry barriers in relation to regulatory requirements such as the qualification process
and intellectual property rights. There has been an impressive growth of the industry outside the
US in the last decade. Europe now dominates the US in terms of number of biotech companies
with 41% compared to 33% in the US Asia-Pacific is also growing rapidly in this sector with
Australia, Japan, China, India and Korea performing well. Though the number of companies is an
important indicator of the globalization trend, it is worth mentioning here that more companies
outside the US are in the pioneering stage than the US biotech companies with lower valuations,
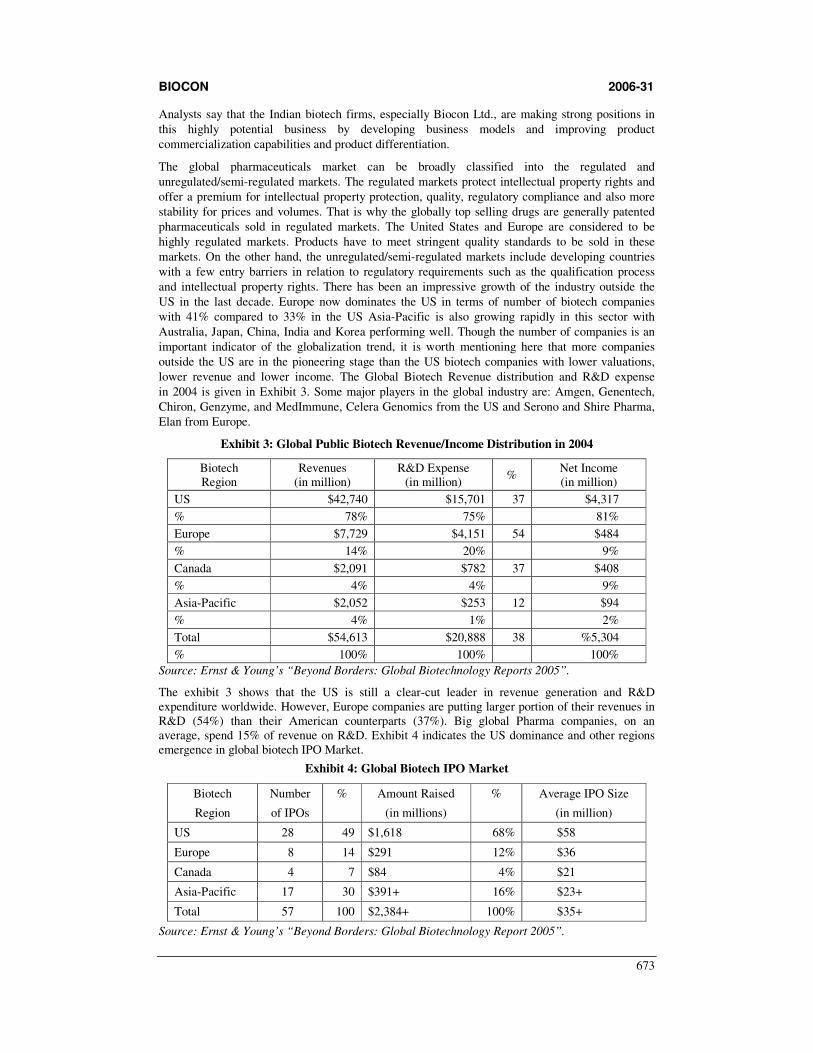
lower revenue and lower income. The Global Biotech Revenue distribution and R&D expense
in 2004 is given in Exhibit 3. Some major players in the global industry are: Amgen, Genentech,
Chiron, Genzyme, and MedImmune, Celera Genomics from the US and Serono and Shire Pharma,
Elan from Europe.
Exhibit 3: Global Public Biotech Revenue/Income Distribution in 2004
Biotech Region
Revenues (in million)
R&D Expense (in million)
% Net Income (in million)
US $42,740 $15,701 37 $4,317
% 78% 75% 81%
Europe $7,729 $4,151 54 $484
% 14% 20% 9%
Canada $2,091 $782 37 $408
% 4% 4% 9%
Asia-Pacific $2,052 $253 12 $94
% 4% 1% 2%
Total $54,613 $20,888 38 %5,304
% 100% 100% 100%
Source: Ernst & Young’s “Beyond Borders: Global Biotechnology Reports 2005”.
The exhibit 3 shows that the US is still a clear-cut leader in revenue generation and R&D expenditure worldwide. However, Europe companies are putting larger portion of their revenues in R&D (54%) than their American counterparts (37%). Big global Pharma companies, on an average, spend 15% of revenue on R&D. Exhibit 4 indicates the US dominance and other regions emergence in global biotech IPO Market.
Exhibit 4: Global Biotech IPO Market
Biotech
Region
Number
of IPOs
% Amount Raised
(in millions)
% Average IPO Size
(in million)
US 28 49 $1,618 68% $58
Europe 8 14 $291 12% $36
Canada 4 7 $84 4% $21
Asia-Pacific 17 30 $391+ 16% $23+
Total 57 100 $2,384+ 100% $35+
Source: Ernst & Young’s “Beyond Borders: Global Biotechnology Report 2005”.
BIOCON 2006-31
674
The global pharmaceutical sales in 2004 were $550 billion with North America, Europe and Japan
accounting for around 48%, 28% and 11% of the total world market respectively. Biotechnology
drugs account for 10% of global pharmaceutical sales and continue to increase their share in the
next five years with double-digit growth.
According to Indian Patents Act, 2005, India would recognize pharma product patents effective
January 1, 2005; this results in enhanced worldwide convergence of patent law concerning pharma
products. Currently, Biocon and other Indian pharma companies enjoy the advantage in
developing processes for pharma products patented in the US and the European Union. This
advantage will vanish with the introduction of pharma product patents in India as these companies
cannot develop and sell, anywhere in the world, pharma products under patent protection in the US
or the EU, if they also have patent protection in India.
MERGERS AND ACQUISITIONS
On one hand, pharmaceutical companies are either investing or propose to invest in biotechnology,
and on the other hand biotechnology start-ups are coming up. As a result, industry experts say, that
the industry may witness a series of mergers and acquisitions.
According to a well-known consultancy company, companies in this sector are growing through
collaborations, partnerships and alliances both nationally and globally. It observes that global
companies are increasingly recognizing India as a low cost hub for research and development and
most of the small to medium sized Indian biotech companies may turn out to be striking
acquisition targets for big pharma and biotech companies and MNC Contract Research
Organizations (CROs) with enormous liquidity.
In the global market, the UK was the focal point of some very high profile Mergers and
Acquisitions (M&As) since 2003. In 2003, 75 UK companies lost their identity as a result of
M&As and some went out of business. M&As in UK increased from 39 in 2003 to 42 in 2004.
M&As involving US and European companies increased from 9 in 2003 to 19 in 2004.
INDUSTRY POTENTIAL
The growth potential of the industry can be supported by the fact that there is a real need for newer
drugs to treat cancer and other life style diseases worldwide. Scientists say that biotechnology is a
cutting edge 21st century science that can set mankind free from the curse of hunger and disease.
So, there has been a lot of global interest towards this industry, and global pharmaceutical
companies started making substantial investments.
Towards the end of 2003, the US and Europe biotechnology companies launched 740 and 261
products respectively in the market. In Europe, the UK remains the dominant player with 132
products in its account. According to Ernst & Young’s 2005 global biotech report European sector
is in a good position to move forward. The report says that more number of large pharmaceutical
companies are teaming with biotech companies to focus on R&D activity.
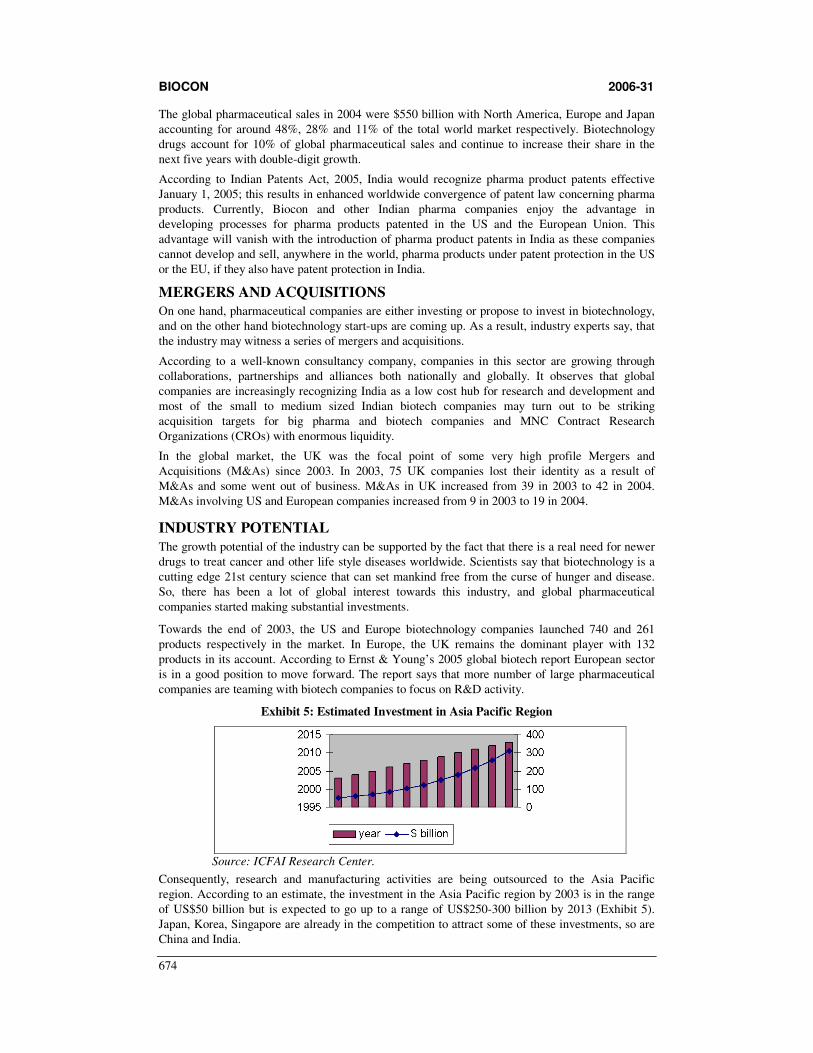
Exhibit 5: Estimated Investment in Asia Pacific Region
Source: ICFAI Research Center.
Consequently, research and manufacturing activities are being outsourced to the Asia Pacific
region. According to an estimate, the investment in the Asia Pacific region by 2003 is in the range
of US$50 billion but is expected to go up to a range of US$250-300 billion by 2013 (Exhibit 5).
Japan, Korea, Singapore are already in the competition to attract some of these investments, so are
China and India.
BIOCON 2006-31
675
In this scenario, India is considered to have competitive edge because biotechnology is basically a
knowledge-based industry for which human capital is the first and fore most requirement and India
has substantial human capital. According to an estimate, India generates approximately 2.5 million
graduates in IT, engineering and life sciences, about 6,50,000 post-graduates and around 1,500
PhDs qualified in biosciences and engineering every year. Moreover, these educated Indians speak
English, and are good at it too. Additionally, a geographical study of the Indian subcontinent
reveals that India has the most varied species of environment that enable companies find samples
with ease and conduct field research more efficiently and cost effectively. As a result, the world
pharmaceutical companies from all over the world are seeking to set up their R&D centers in India
and countries such as US and UK are choosing India as a partner for collaborative research.
Thus, the learning curve has started in India. The Indian biotech industry, with mostly
non-unionized workers, is already demonstrating its ability in some areas. India has started
strengthening its intellectual property rights. The industry has begun getting budgetary allocations
and tax sops for R&D from the government. The country has unveiled a draft of the National
Biotechnology Development Strategy (NBDS) in March 2005. According to the Union Minister
for Science and Technology, Mr. Kapil Sibal, NBDS aimed to make the processes easier, quicker
and friendly for the common man. The policy would provide adequate support to basic,
translational and clinical research. Up to 30% of Rs.2000 million biotechnology research budget
will be spent through public-private partnerships. It is also said that there would be no restriction
on Foreign Direct Investment (FDI) in biotech companies. NBDS also addresses issues such as
fiscal and trade policy in relation to the industry, financial incentives to biotech companies,
regulatory mechanism of the industry, encouragement to innovation and setting up of a taskforce
on education and training, etc.
THE COMPANY
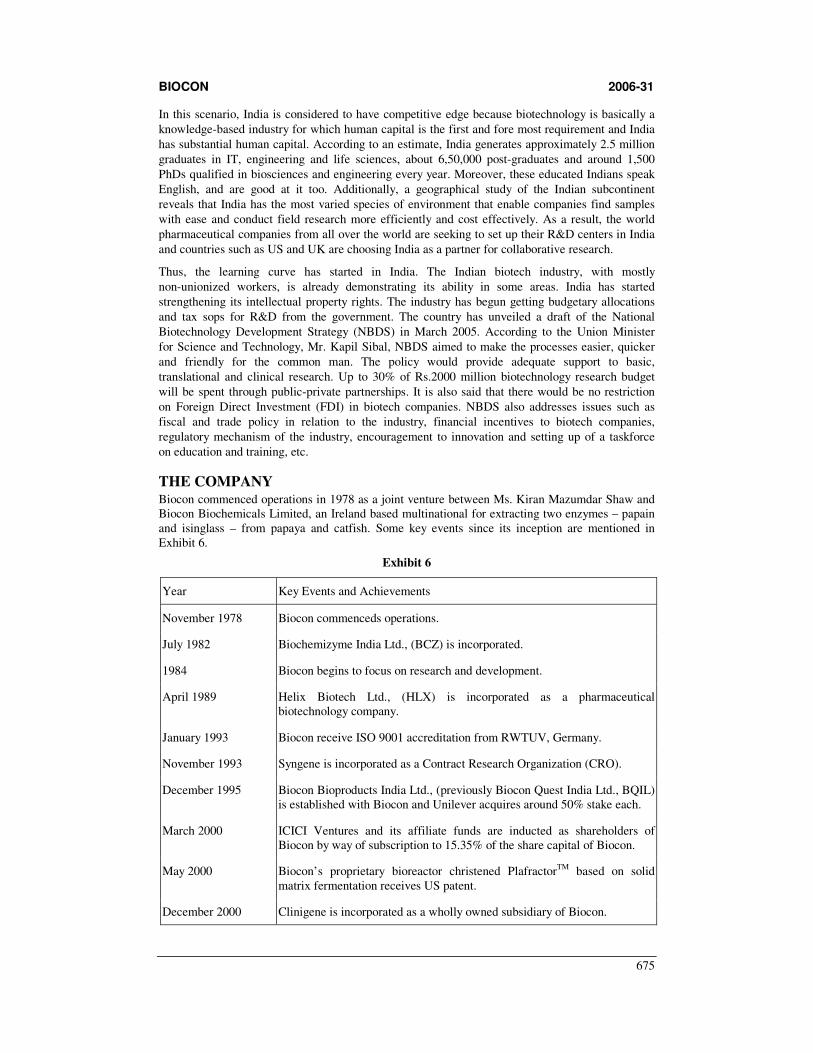
Biocon commenced operations in 1978 as a joint venture between Ms. Kiran Mazumdar Shaw and Biocon Biochemicals Limited, an Ireland based multinational for extracting two enzymes – papain and isinglass – from papaya and catfish. Some key events since its inception are mentioned in Exhibit 6.
Exhibit 6
Year Key Events and Achievements
November 1978 Biocon commenceds operations.
July 1982 Biochemizyme India Ltd., (BCZ) is incorporated.
1984 Biocon begins to focus on research and development.
April 1989 Helix Biotech Ltd., (HLX) is incorporated as a pharmaceutical biotechnology company.
January 1993 Biocon receive ISO 9001 accreditation from RWTUV, Germany.
November 1993 Syngene is incorporated as a Contract Research Organization (CRO).
December 1995 Biocon Bioproducts India Ltd., (previously Biocon Quest India Ltd., BQIL) is established with Biocon and Unilever acquires around 50% stake each.
March 2000 ICICI Ventures and its affiliate funds are inducted as shareholders of Biocon by way of subscription to 15.35% of the share capital of Biocon.
May 2000 Biocon’s proprietary bioreactor christened PlafractorTM based on solid matrix fermentation receives US patent.
December 2000 Clinigene is incorporated as a wholly owned subsidiary of Biocon.
BIOCON 2006-31
676
Year Key Events and Achievements
January 2001 As part of a court based restructuring, BCZ, BQIL and HLX are amalgamated into Biocon, with effect from April 1, 1999. Biocon’s Lovastatin facility is approved by the US FDA.
March 2003 Biocon Biopharmaceuticals Pvt. Ltd., (BBPL) is incorporated as a 51:49 joint venture between CIMAB and Biocon.
May-September 2003 ICICI Ventures along with its affiliate funds divests its shareholder interests in Biocon.
October 2004 Inauguration of new research center at Biocon’s new facility Biocon Park.
Source: www.biocon.com
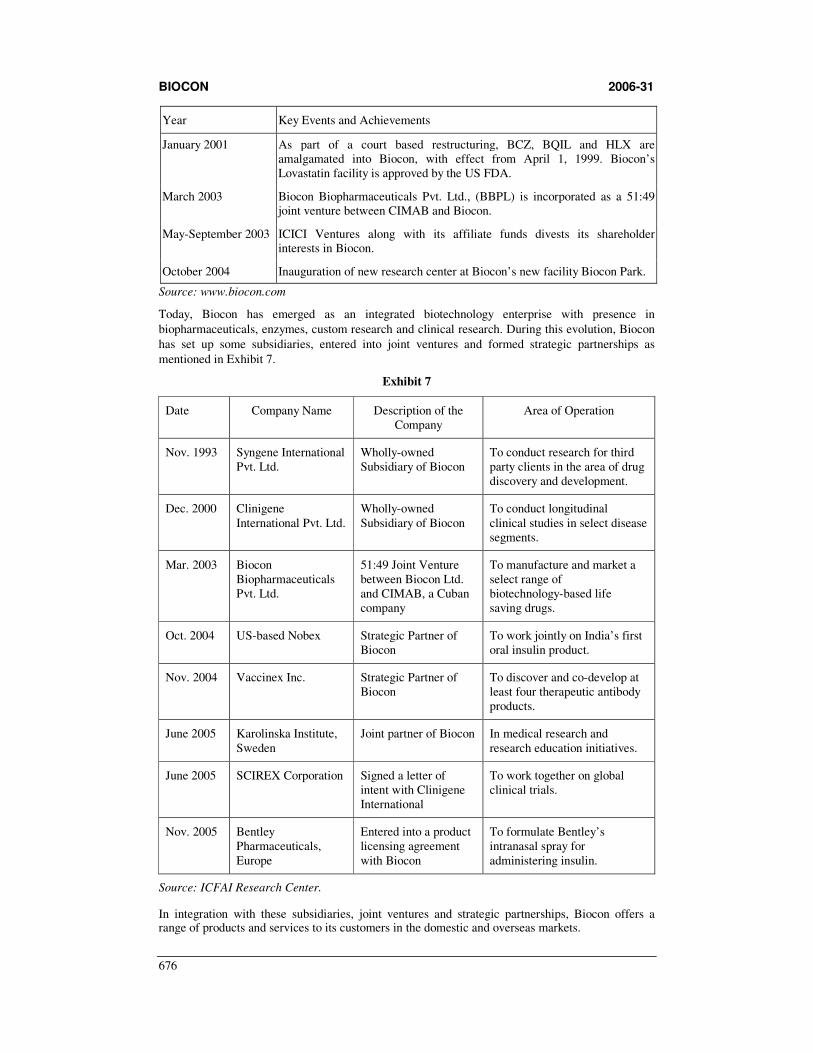
Today, Biocon has emerged as an integrated biotechnology enterprise with presence in
biopharmaceuticals, enzymes, custom research and clinical research. During this evolution, Biocon
has set up some subsidiaries, entered into joint ventures and formed strategic partnerships as
mentioned in Exhibit 7.
Exhibit 7
Date Company Name Description of the Company
Area of Operation
Nov. 1993 Syngene International Pvt. Ltd.
Wholly-owned Subsidiary of Biocon
To conduct research for third party clients in the area of drug discovery and development.
Dec. 2000 Clinigene International Pvt. Ltd.
Wholly-owned Subsidiary of Biocon
To conduct longitudinal clinical studies in select disease segments.
Mar. 2003 Biocon Biopharmaceuticals Pvt. Ltd.
51:49 Joint Venture between Biocon Ltd. and CIMAB, a Cuban company
To manufacture and market a select range of biotechnology-based life saving drugs.
Oct. 2004 US-based Nobex Strategic Partner of Biocon
To work jointly on India’s first oral insulin product.
Nov. 2004 Vaccinex Inc. Strategic Partner of Biocon
To discover and co-develop at least four therapeutic antibody products.
June 2005 Karolinska Institute, Sweden
Joint partner of Biocon In medical research and research education initiatives.
June 2005 SCIREX Corporation Signed a letter of intent with Clinigene International
To work together on global clinical trials.
Nov. 2005 Bentley Pharmaceuticals, Europe
Entered into a product licensing agreement with Biocon
To formulate Bentley’s intranasal spray for administering insulin.
Source: ICFAI Research Center.
In integration with these subsidiaries, joint ventures and strategic partnerships, Biocon offers a range of products and services to its customers in the domestic and overseas markets.
BIOCON 2006-31
677
BUSINESS STRATEGY
Biocon’s strategic edge has been Mazumdar’s instinctive vision in determining strategic decisions.
The company’s growth strategy has been driven by innovation in both Biopharmaceuticals2 and
Enzymes3. The company focuses on the manufacture and marketing of Active Pharmaceutical
Ingredients (APIs)4 that offer large market potential in the regulated markets (such as US and
Europe where technical and regulatory barriers are high) once the products are off patent. Statins5
are Biocon’s key APIs for growth. Unlike the antibiotics, the statins are low-volume but high-
value products and are not easy to make. Manufacture of APIs requires advanced
ermentation6 and other skills.
A large number of companies uses submerged or liquid fermentation rather than solid-state
fermentation. But, Biocon mastered solid-state fermentation process, which can produce up to
20 times more yields than submerged fermentation. Biocon went ahead and designed a novel
reactor, the Plafractor, which is a strategic weapon as it enables the company to be highly
competitive in BioPharma and BioIndustrial businesses.
PRODUCTS AND SERVICES PORTFOLIO
Biocon is active in the following segments of the industry.
i. BioPharma
ii. BioIndustrial
iii. BioServices.
Biopharma
Biocon manufactures and markets Active Pharmaceutical Ingredients (APIs). These include Statins
and APIs for immunosuppressants7 and anti-diabetic drugs. Biocon has also its presence in
recombinant insulin and a broad product range across key therapeutic segments including
diabetology, cardiology and oncology. Biocon Biopharmaceuticals produces Monoclonal
Antibodies (MABs) and cancer vaccines. The company is also into research, manufacture and
marketing of high value biopharmaceuticals.
Statins: With expertise in Solid-state fermentation, Biocon chose statins as a major focus area for
research. Biocon launched its first statin in countries like Canada and Mexico, and regions like
East Europe and South-east Asia. Subsequently, with expiry of patents on some statins in 2001,
Biocon started selling its statins in all countries. Biocon holds 30 per cent of the Europe market for
some statins and in some countries that share is higher. Biocon would rather be perceived as a
preferred global supplier than a competitor as the company does not make its own formulations.
Statins now comprise a $23-billion market growing at 30%. Nitin Deshmukh, director, Dresdner
Kleinwort Capital says that the statins market will be rich enough for Biocon for the next decade.
Immunosuppressants: Immunosuppressants involve high technology-based manufacturing
capabilities. Currently, Biocon’s immunosuppressants are sold primarily in India and some
semi-regulated export markets. Biocon has plans to enter new segments and reach regulated
exports markets such as US and Europe aggressively. The company’s management says that patent
expiry of key immunosuppressant drugs and the possible opening up of generic biologicals in the
near future is seen as a big opportunity.
Having been positioned well in Statins, Biocon chose emerging market opportunities in insulin and
MAbs (monoclonal antibodies used in cancer therapy) to drive its growth.
2 BioPharmaceuticals are the pharmaceuticals produced through Biotechnology. 3 Enzymes are proteins that are used as biocatalysts in chemical processes. 4 API is the substance in drug that is pharmaceutically active. A capsule, tablet, syrup or any other
formulation of a drug is composed of two things: The API, which is the drug itself; and the substance of the tablet, or the liquid the API is suspended in, or other material that is pharmaceutically inactive.
5 Statins are a group of cholesterol-lowering drugs whose generic names end in ‘statin’ 6 Fermentation is one of the key enabling technologies in the manufacture of pharma products. 7 Immunosuppressants are drugs that reduce or eliminate the body’s ability to make an immune response.
BIOCON 2006-31
678
Insulin take off: Insulin is the key hormone that regulates uptake of glucose into cells, mainly
muscle and fat cells, from the blood. Making a biological product such as insulin and MABs needs
very high molecular biology skills. The biological team of Syngene International acquired all the
skills required. Biocon, on November 10, 2004, launched INSUGENTM, the new generation bio-
insulin used in the treatment of diabetes, in the domestic market. INSUGENTM is the world’s first
recombinant human (r-DNA) insulin and India’s most clinically validated r-DNA insulin. Biocon
is the largest producer of recombinant human (r-DNA) insulin in Asia. Biocon’s planned insulin
capacity is more than the total volumes sold in India, which shows that the company has global
plans. There are less than a handful of producers of r-DNA insulin worldwide.
According to an estimate, India has 25% of the world’s 135-million-strong population of diabetics
and the number of people suffering from this disease is expected to more than double over the next
20 years to reach 300 million by 2025. The global insulin market is worth $5-billion and is
expected to grow. HSBC, in its recent research report on Novo Nordisk, the global leader in
insulin business, point out that a potential threat to Novo’s insulin business is likely to be from the
upcoming challengers such as Wockhardt and Biocon.
Bioindustrial
Biocon started business as an enzyme maker. It didn’t leave this business though it has entered
into different new areas. Biocon develops and markets novel enzymes and customized applications
for a wide range of industries such as animal feed, starch processing, brewing and distilling, food
and beverages, textiles, pulp and paper, and leather. Biocon is the leading enzyme maker in India.
Other large enzyme companies in the global market purchase much of Biocon’s exported enzyme
products. The total Indian BioIndustrial Sector revenue is Rs.2500 million and Rs.3200 million in
2003-04 and 2004-05, a 35% jump. The growth in industrial enzymes is due to the increased
demand from emerging markets. However, the competition from a number of smaller players for a
piece of the pie creates downward pricing pressure in the sector.
Many enzymes in the global market are manufactured in large-scale production facilities and are
dominated by a small number of big global companies such as Novozymes, Genencor
International, AB Enzymes GmbH, DSM Group and Danisco. Biocon is relatively small when
compared to the global majors. However, Biocon differentiates itself by developing niche enzyme
products with unique characteristics cost effectively using its R&D skills.
Bioservices
Biocon started its first research and development activity to manufacture enzymes through
fermentation in 1984. The R&D team started working on solid-state fermentation with zero
previous knowledge about it and successfully came up with a design, and opened its first
commercial plant in 1991. Since then, Biocon’s R&D team kept upgrading the solid-state
fermentation technology and developed its proprietary bioreactor christened PlafractorTM and got a
US patent for it.
Also, Biocon gained skills in synthetic chemistry and biology through Syngene International.
Biocon obtained clinical R&D skills through Clinigene International, the first Indian CRO to get
an accreditation from the College of American Pathologists (CAP). MNCs such as AstraZeneca,
Pfizer, and Quintiles are using its central laboratory facilities. A S Arvind, Clinigene’s Chief
Operating Officer says that their approach is not activity-oriented but research-oriented. They
really want to understand diseases and this differentiates them from other CROs. Biocon has made
its first move in drug discovery and development, bioprocessing and global marketing and delivers
products and solutions to partners and customers in over 50 countries.
Biocon’s R&D culture was built-up from scratch under its R&D head, Mr. Suryanarayan, joined
the company during the 1980s and fresh out of IIT. Today (2005), the team of 500 plus scientists
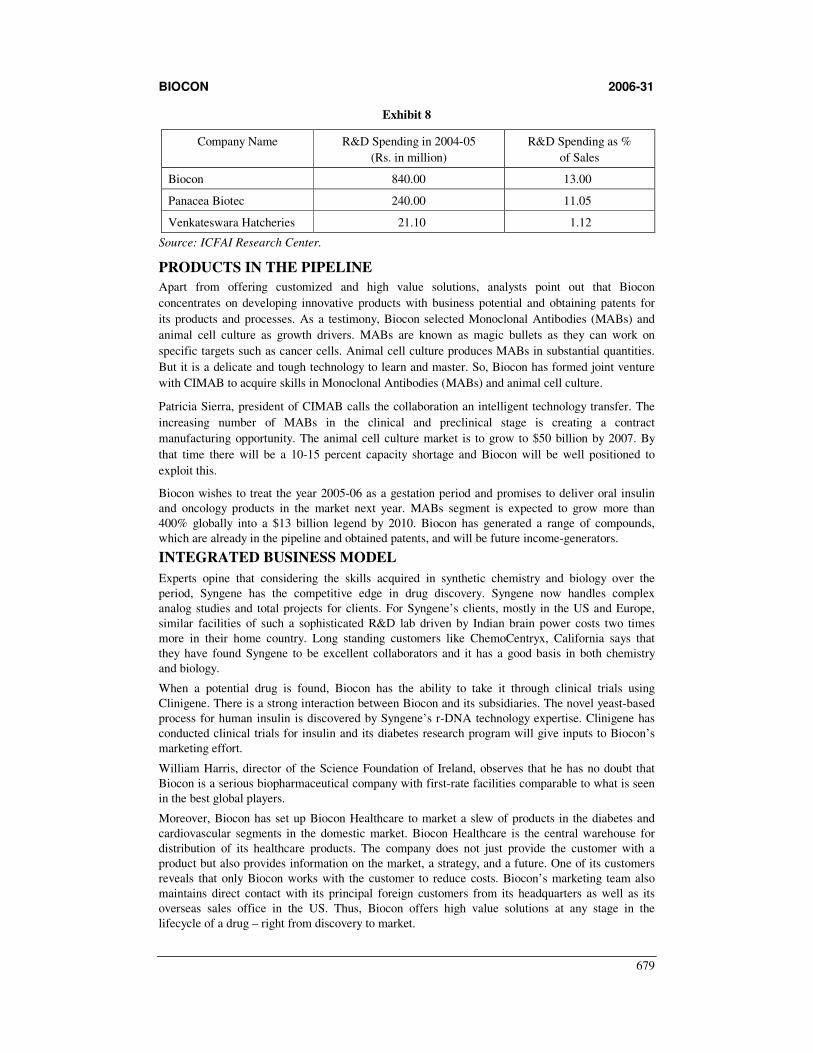
enables Biocon develop an integrated business model to gain competitive edge. Exhibit 8 provides
the details of R&D spending by some companies.
BIOCON 2006-31
679
Exhibit 8
Company Name R&D Spending in 2004-05
(Rs. in million)
R&D Spending as %
of Sales
Biocon 840.00 13.00
Panacea Biotec 240.00 11.05
Venkateswara Hatcheries 21.10 1.12
Source: ICFAI Research Center.
PRODUCTS IN THE PIPELINE
Apart from offering customized and high value solutions, analysts point out that Biocon
concentrates on developing innovative products with business potential and obtaining patents for
its products and processes. As a testimony, Biocon selected Monoclonal Antibodies (MABs) and
animal cell culture as growth drivers. MABs are known as magic bullets as they can work on
specific targets such as cancer cells. Animal cell culture produces MABs in substantial quantities.
But it is a delicate and tough technology to learn and master. So, Biocon has formed joint venture
with CIMAB to acquire skills in Monoclonal Antibodies (MABs) and animal cell culture.
Patricia Sierra, president of CIMAB calls the collaboration an intelligent technology transfer. The
increasing number of MABs in the clinical and preclinical stage is creating a contract
manufacturing opportunity. The animal cell culture market is to grow to $50 billion by 2007. By
that time there will be a 10-15 percent capacity shortage and Biocon will be well positioned to
exploit this.
Biocon wishes to treat the year 2005-06 as a gestation period and promises to deliver oral insulin
and oncology products in the market next year. MABs segment is expected to grow more than
400% globally into a $13 billion legend by 2010. Biocon has generated a range of compounds,
which are already in the pipeline and obtained patents, and will be future income-generators.
INTEGRATED BUSINESS MODEL
Experts opine that considering the skills acquired in synthetic chemistry and biology over the
period, Syngene has the competitive edge in drug discovery. Syngene now handles complex
analog studies and total projects for clients. For Syngene’s clients, mostly in the US and Europe,
similar facilities of such a sophisticated R&D lab driven by Indian brain power costs two times
more in their home country. Long standing customers like ChemoCentryx, California says that
they have found Syngene to be excellent collaborators and it has a good basis in both chemistry
and biology.
When a potential drug is found, Biocon has the ability to take it through clinical trials using
Clinigene. There is a strong interaction between Biocon and its subsidiaries. The novel yeast-based
process for human insulin is discovered by Syngene’s r-DNA technology expertise. Clinigene has
conducted clinical trials for insulin and its diabetes research program will give inputs to Biocon’s
marketing effort.
William Harris, director of the Science Foundation of Ireland, observes that he has no doubt that
Biocon is a serious biopharmaceutical company with first-rate facilities comparable to what is seen
in the best global players.
Moreover, Biocon has set up Biocon Healthcare to market a slew of products in the diabetes and
cardiovascular segments in the domestic market. Biocon Healthcare is the central warehouse for
distribution of its healthcare products. The company does not just provide the customer with a
product but also provides information on the market, a strategy, and a future. One of its customers
reveals that only Biocon works with the customer to reduce costs. Biocon’s marketing team also
maintains direct contact with its principal foreign customers from its headquarters as well as its
overseas sales office in the US. Thus, Biocon offers high value solutions at any stage in the
lifecycle of a drug – right from discovery to market.
BIOCON 2006-31
680
RAW MATERIALS
The key raw materials of Biocon include base level fermentation media and nutrients such as sugar
like dextrose mono hydrate, flour, caustic, hydrochloric acid and solvents such as acetone, ethyl
acetate, methanol, iso propyl alcohol, pyrollidine and n-butyl lithium. These raw materials are
regularly available and the Company does not depend on any single supplier for any such raw
material. Several micro-organisms used in the fermentation processes are developed through its
own bio-diversity program.
Other vital chemicals include enzymes and other additives sourced from third parties for blending
with one or more of its products. Certain raw materials are subject to fluctuation based on
commodity prices. Biocon has captive power generation facilities, which are adequate to meet its
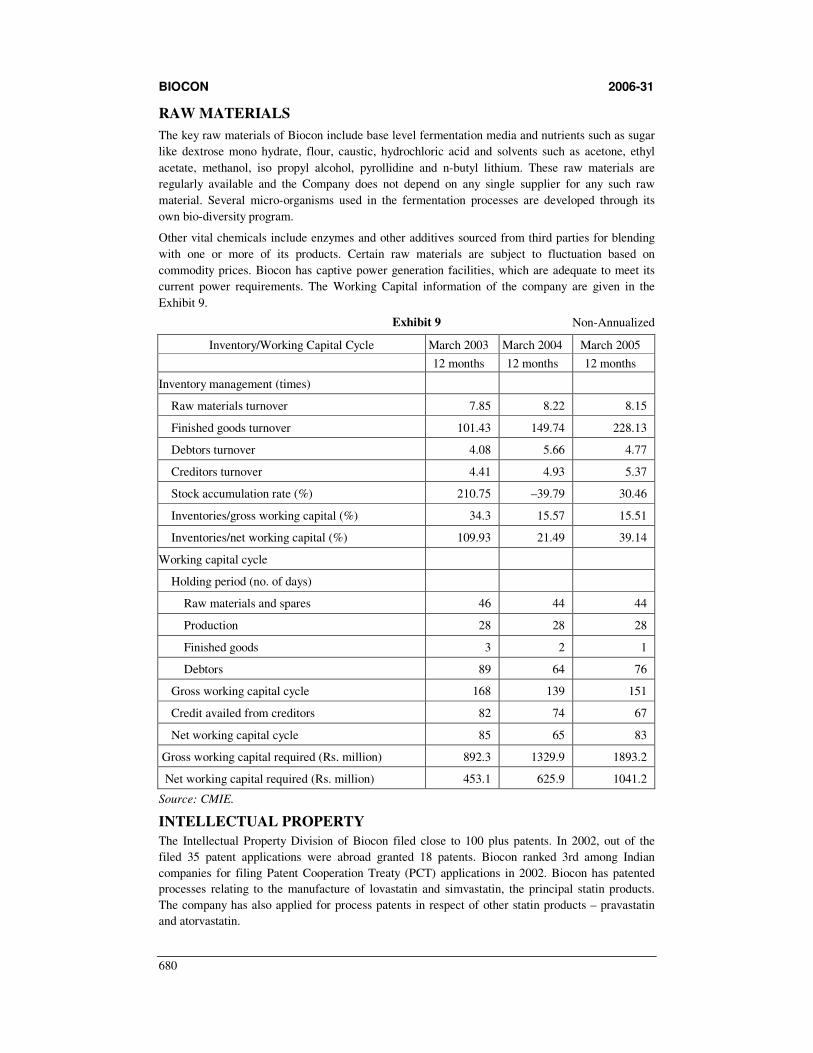
current power requirements. The Working Capital information of the company are given in the
Exhibit 9.
Exhibit 9 Non-Annualized
Inventory/Working Capital Cycle March 2003 March 2004 March 2005
12 months 12 months 12 months
Inventory management (times)
Raw materials turnover 7.85 8.22 8.15
Finished goods turnover 101.43 149.74 228.13
Debtors turnover 4.08 5.66 4.77
Creditors turnover 4.41 4.93 5.37
Stock accumulation rate (%) 210.75 –39.79 30.46
Inventories/gross working capital (%) 34.3 15.57 15.51
Inventories/net working capital (%) 109.93 21.49 39.14
Working capital cycle
Holding period (no. of days)
Raw materials and spares 46 44 44
Production 28 28 28
Finished goods 3 2 1
Debtors 89 64 76
Gross working capital cycle 168 139 151
Credit availed from creditors 82 74 67
Net working capital cycle 85 65 83
Gross working capital required (Rs. million) 892.3 1329.9 1893.2
Net working capital required (Rs. million) 453.1 625.9 1041.2
Source: CMIE.
INTELLECTUAL PROPERTY
The Intellectual Property Division of Biocon filed close to 100 plus patents. In 2002, out of the
filed 35 patent applications were abroad granted 18 patents. Biocon ranked 3rd among Indian
companies for filing Patent Cooperation Treaty (PCT) applications in 2002. Biocon has patented
processes relating to the manufacture of lovastatin and simvastatin, the principal statin products.
The company has also applied for process patents in respect of other statin products – pravastatin
and atorvastatin.
BIOCON 2006-31
681
CAPITAL STRUCTURE
Biocon has little debt in its capital structure since its inception. The company’s bank borrowings
are short-term and are used for working capital needs. Biocon started operations with an equity
capital of Rs.5,000 (50 shares with a face value of Rs.100). Subsequently, the company issued
equity shares to different parties. In December 1996, the company issued two bonus shares for
every one share held. In March 2000, ICICI Ventures, a venture capital fund and its affiliate funds
were inducted as shareholders of Biocon by way of subscription to 15% of the share capital of the
company. ICICI Ventures and its affiliate funds also acquired 10% stake in Syngene International.
The company sub-divided (split) the outstanding shares into Rs.10 per share and then Rs.5 per
share.
Biocon acquired 99.99% of Syngene from its other shareholders, including ICICI Venture and its
affiliate funds, who divested their entire stake in Syngene in exchange for issue of shares by
Biocon in March 2002. The early investors in Biocon made very decent returns. ICICI Ventures
along with its affiliate funds made 156 percent return (ICICI Ventures paid Rs.180 million in
March 2000 for a 15% and sold it for Rs.460 million during May-September 2003) by divesting its
shareholder interests in Biocon in favor of AIG AOF, a private equity fund. AIG AOF has the
right for the next three years to appoint one director to the Board. That Director has a veto power
with respect to some important Board actions including without limitation the issue of equity
shares, mergers and acquisitions, sale or other disposition of subsidiary shares or a material part of
Biocon’s or a subsidiary’s assets or any amendment to Biocon’s or a subsidiary’s Memorandum
and Articles of Association.
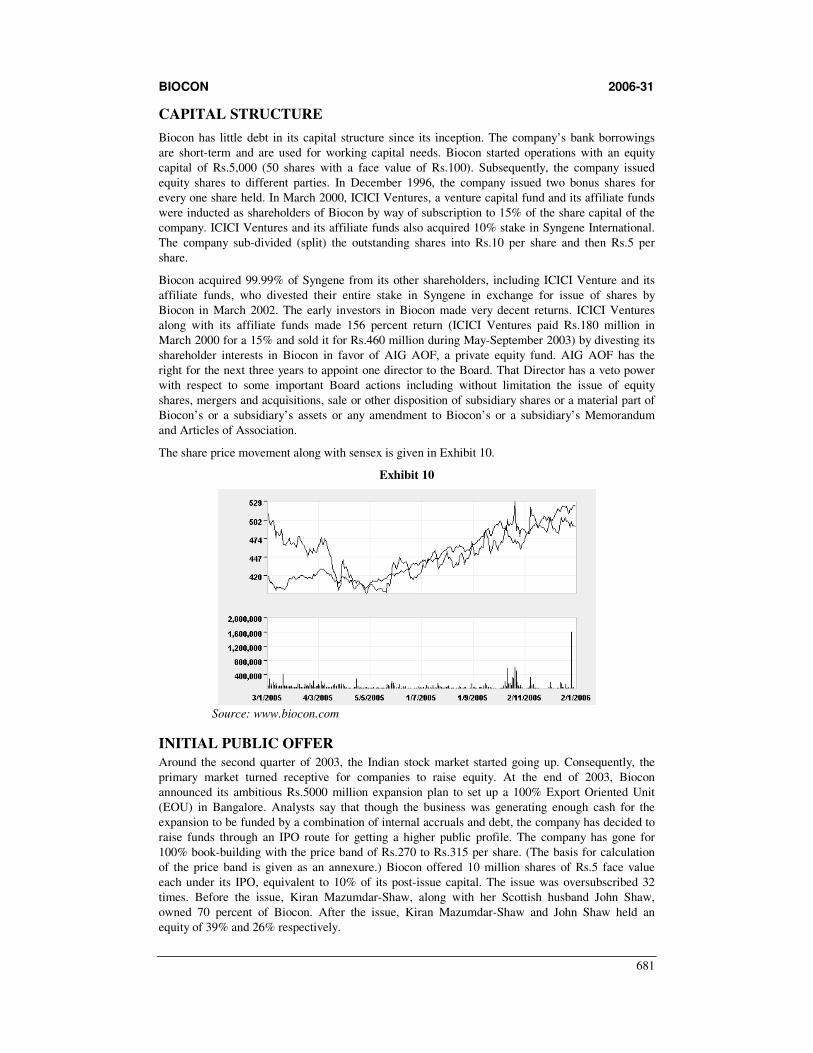
The share price movement along with sensex is given in Exhibit 10.
Exhibit 10
Source: www.biocon.com
INITIAL PUBLIC OFFER
Around the second quarter of 2003, the Indian stock market started going up. Consequently, the
primary market turned receptive for companies to raise equity. At the end of 2003, Biocon
announced its ambitious Rs.5000 million expansion plan to set up a 100% Export Oriented Unit
(EOU) in Bangalore. Analysts say that though the business was generating enough cash for the
expansion to be funded by a combination of internal accruals and debt, the company has decided to
raise funds through an IPO route for getting a higher public profile. The company has gone for
100% book-building with the price band of Rs.270 to Rs.315 per share. (The basis for calculation
of the price band is given as an annexure.) Biocon offered 10 million shares of Rs.5 face value
each under its IPO, equivalent to 10% of its post-issue capital. The issue was oversubscribed 32
times. Before the issue, Kiran Mazumdar-Shaw, along with her Scottish husband John Shaw,
owned 70 percent of Biocon. After the issue, Kiran Mazumdar-Shaw and John Shaw held an
equity of 39% and 26% respectively.
BIOCON 2006-31
682
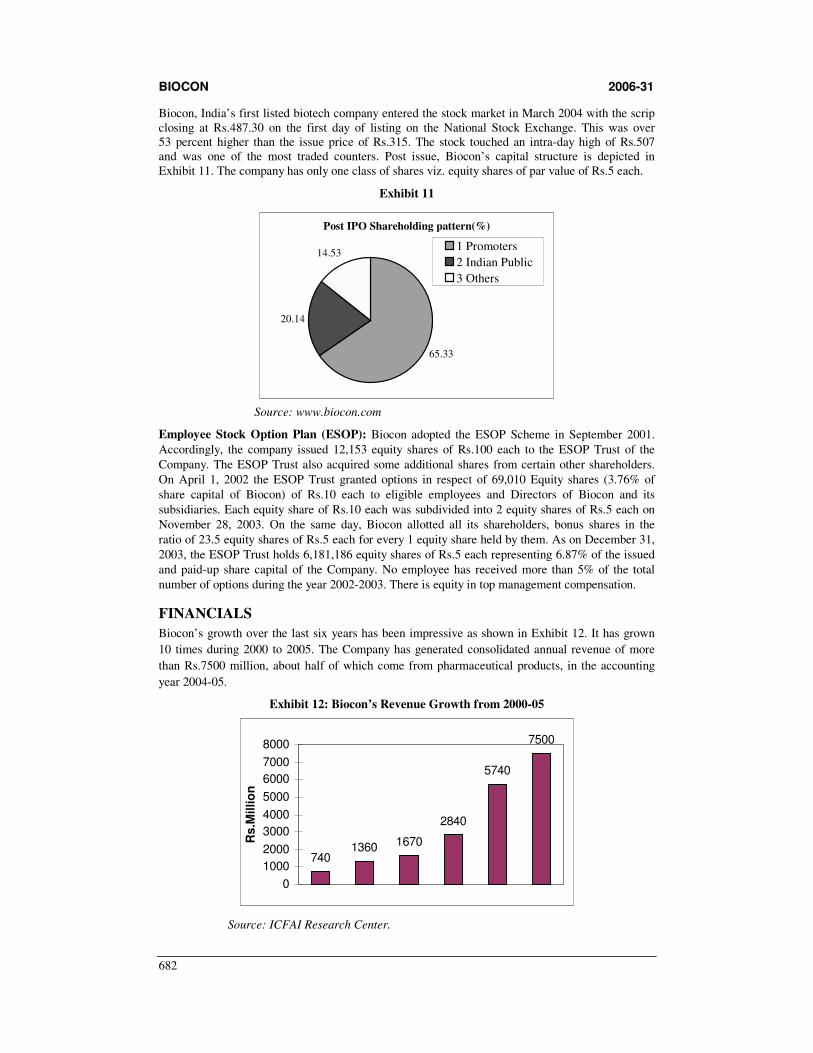
Biocon, India’s first listed biotech company entered the stock market in March 2004 with the scrip closing at Rs.487.30 on the first day of listing on the National Stock Exchange. This was over 53 percent higher than the issue price of Rs.315. The stock touched an intra-day high of Rs.507 and was one of the most traded counters. Post issue, Biocon’s capital structure is depicted in Exhibit 11. The company has only one class of shares viz. equity shares of par value of Rs.5 each.
Exhibit 11
Post IPO Shareholding pattern(%)
65.33
20.14
14.531 Promoters
2 Indian Public
3 Others
Source: www.biocon.com
Employee Stock Option Plan (ESOP): Biocon adopted the ESOP Scheme in September 2001.
Accordingly, the company issued 12,153 equity shares of Rs.100 each to the ESOP Trust of the
Company. The ESOP Trust also acquired some additional shares from certain other shareholders.
On April 1, 2002 the ESOP Trust granted options in respect of 69,010 Equity shares (3.76% of
share capital of Biocon) of Rs.10 each to eligible employees and Directors of Biocon and its
subsidiaries. Each equity share of Rs.10 each was subdivided into 2 equity shares of Rs.5 each on
November 28, 2003. On the same day, Biocon allotted all its shareholders, bonus shares in the
ratio of 23.5 equity shares of Rs.5 each for every 1 equity share held by them. As on December 31,
2003, the ESOP Trust holds 6,181,186 equity shares of Rs.5 each representing 6.87% of the issued
and paid-up share capital of the Company. No employee has received more than 5% of the total
number of options during the year 2002-2003. There is equity in top management compensation.
FINANCIALS
Biocon’s growth over the last six years has been impressive as shown in Exhibit 12. It has grown
10 times during 2000 to 2005. The Company has generated consolidated annual revenue of more
than Rs.7500 million, about half of which come from pharmaceutical products, in the accounting
year 2004-05.
Exhibit 12: Biocon’s Revenue Growth from 2000-05
7401360 1670
2840
5740
7500
0
1000
2000
3000
4000
5000
6000
7000
8000
Rs
.Millio
n
Source: ICFAI Research Center.
BIOCON 2006-31
683
The contribution of different components to Biocon’s total income is as follows:
Exhibit 13: For the Year Ended
31-3-2005 31-3-2004
BioPharmaceuticals 84.1% 85.2%
Enzymes 13.5% 13.0%
R&D Fees 0.1% 0.1%
Other income 2.3% 1.7%
100.0% 100.0%
Source: CMIE database
In 2004-05, Biocon’s revenue from biopharmaceutical business increased by 28%. The company’s
exports, largely to regulated markets, rose by 30% contributing 62% to overall revenues. Share of
revenues from net sales between domestic and export markets are mentioned in Exhibit 14.
Exhibit 14
Particulars 2004-05 2003-04
Domestic 41.8% 40.2%
Exports 58.2% 59.8%
Source: www.biocon.com
EXPORT BUSINESS
The company says that the largest and fastest growing component of its revenue comes from
product exports and services to developed country markets, largely the United States and the
European Union. These markets feature high environmental laws and governmental regulations.
Demand in these markets is often influenced by reimbursement policies of large health insurers
and government-benefits providers.
Analysts say that during the fiscal year 2004-05, exports of Biocon were driven by sales of
Simvastatin to the UK and Germany following patent expiry in March 2003, and Pravastatin to
Europe (patent expired in a phased manner from March 2004). The company expects significant
exports of bulk insulin drugs to semi-regulated markets from mid-2005 and to regulated markets
from mid-2007.
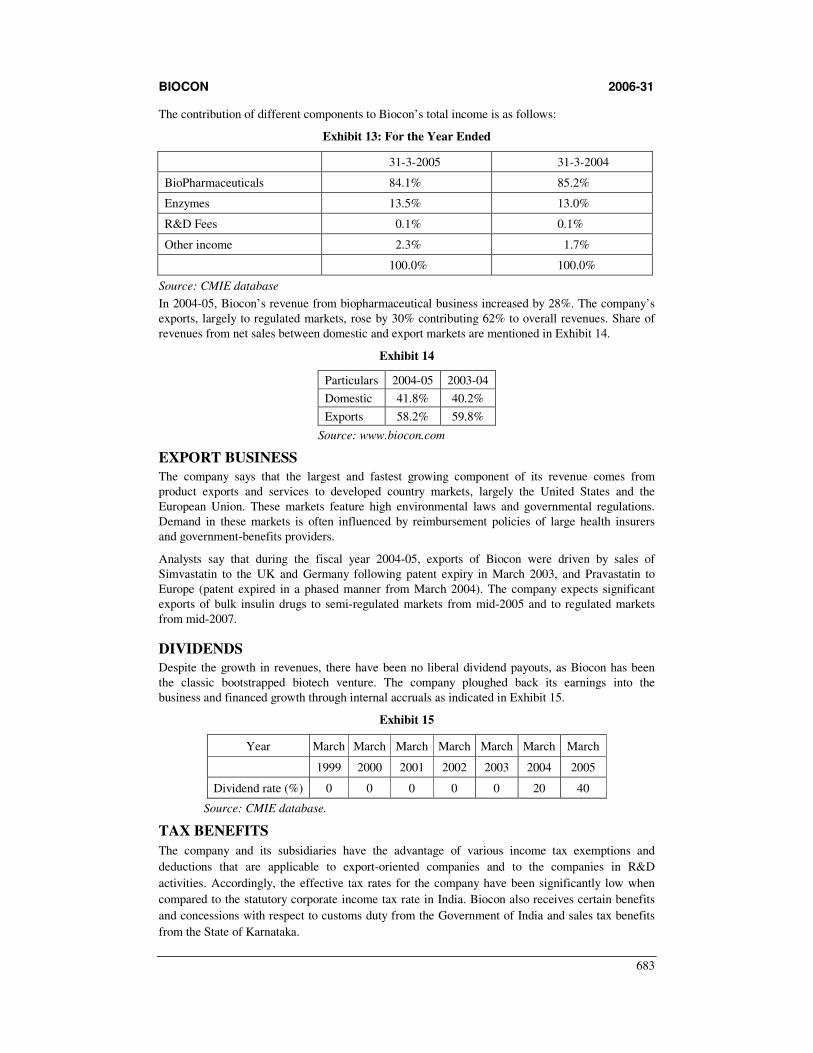
DIVIDENDS
Despite the growth in revenues, there have been no liberal dividend payouts, as Biocon has been
the classic bootstrapped biotech venture. The company ploughed back its earnings into the
business and financed growth through internal accruals as indicated in Exhibit 15.
Exhibit 15
Year March March March March March March March
1999 2000 2001 2002 2003 2004 2005
Dividend rate (%) 0 0 0 0 0 20 40
Source: CMIE database.
TAX BENEFITS
The company and its subsidiaries have the advantage of various income tax exemptions and
deductions that are applicable to export-oriented companies and to the companies in R&D
activities. Accordingly, the effective tax rates for the company have been significantly low when
compared to the statutory corporate income tax rate in India. Biocon also receives certain benefits
and concessions with respect to customs duty from the Government of India and sales tax benefits
from the State of Karnataka.
BIOCON 2006-31
684
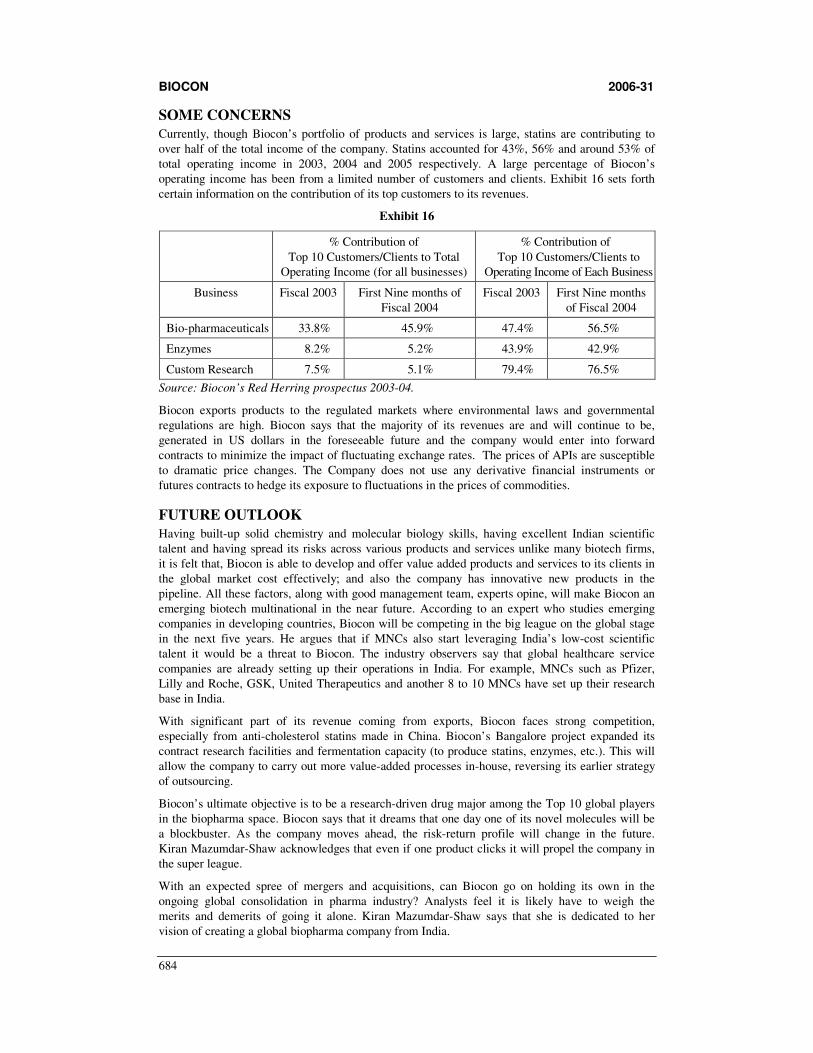
SOME CONCERNS
Currently, though Biocon’s portfolio of products and services is large, statins are contributing to
over half of the total income of the company. Statins accounted for 43%, 56% and around 53% of
total operating income in 2003, 2004 and 2005 respectively. A large percentage of Biocon’s
operating income has been from a limited number of customers and clients. Exhibit 16 sets forth
certain information on the contribution of its top customers to its revenues.
Exhibit 16
% Contribution of
Top 10 Customers/Clients to Total
Operating Income (for all businesses)
% Contribution of
Top 10 Customers/Clients to
Operating Income of Each Business
Business Fiscal 2003 First Nine months of
Fiscal 2004
Fiscal 2003 First Nine months
of Fiscal 2004
Bio-pharmaceuticals 33.8% 45.9% 47.4% 56.5%
Enzymes 8.2% 5.2% 43.9% 42.9%
Custom Research 7.5% 5.1% 79.4% 76.5%
Source: Biocon’s Red Herring prospectus 2003-04.
Biocon exports products to the regulated markets where environmental laws and governmental
regulations are high. Biocon says that the majority of its revenues are and will continue to be,
generated in US dollars in the foreseeable future and the company would enter into forward
contracts to minimize the impact of fluctuating exchange rates. The prices of APIs are susceptible
to dramatic price changes. The Company does not use any derivative financial instruments or
futures contracts to hedge its exposure to fluctuations in the prices of commodities.
FUTURE OUTLOOK
Having built-up solid chemistry and molecular biology skills, having excellent Indian scientific
talent and having spread its risks across various products and services unlike many biotech firms,
it is felt that, Biocon is able to develop and offer value added products and services to its clients in
the global market cost effectively; and also the company has innovative new products in the
pipeline. All these factors, along with good management team, experts opine, will make Biocon an
emerging biotech multinational in the near future. According to an expert who studies emerging
companies in developing countries, Biocon will be competing in the big league on the global stage
in the next five years. He argues that if MNCs also start leveraging India’s low-cost scientific
talent it would be a threat to Biocon. The industry observers say that global healthcare service
companies are already setting up their operations in India. For example, MNCs such as Pfizer,
Lilly and Roche, GSK, United Therapeutics and another 8 to 10 MNCs have set up their research
base in India.
With significant part of its revenue coming from exports, Biocon faces strong competition,
especially from anti-cholesterol statins made in China. Biocon’s Bangalore project expanded its
contract research facilities and fermentation capacity (to produce statins, enzymes, etc.). This will
allow the company to carry out more value-added processes in-house, reversing its earlier strategy
of outsourcing.
Biocon’s ultimate objective is to be a research-driven drug major among the Top 10 global players
in the biopharma space. Biocon says that it dreams that one day one of its novel molecules will be
a blockbuster. As the company moves ahead, the risk-return profile will change in the future.
Kiran Mazumdar-Shaw acknowledges that even if one product clicks it will propel the company in
the super league.
With an expected spree of mergers and acquisitions, can Biocon go on holding its own in the
ongoing global consolidation in pharma industry? Analysts feel it is likely have to weigh the
merits and demerits of going it alone. Kiran Mazumdar-Shaw says that she is dedicated to her
vision of creating a global biopharma company from India.
BIOCON 2006-31
685
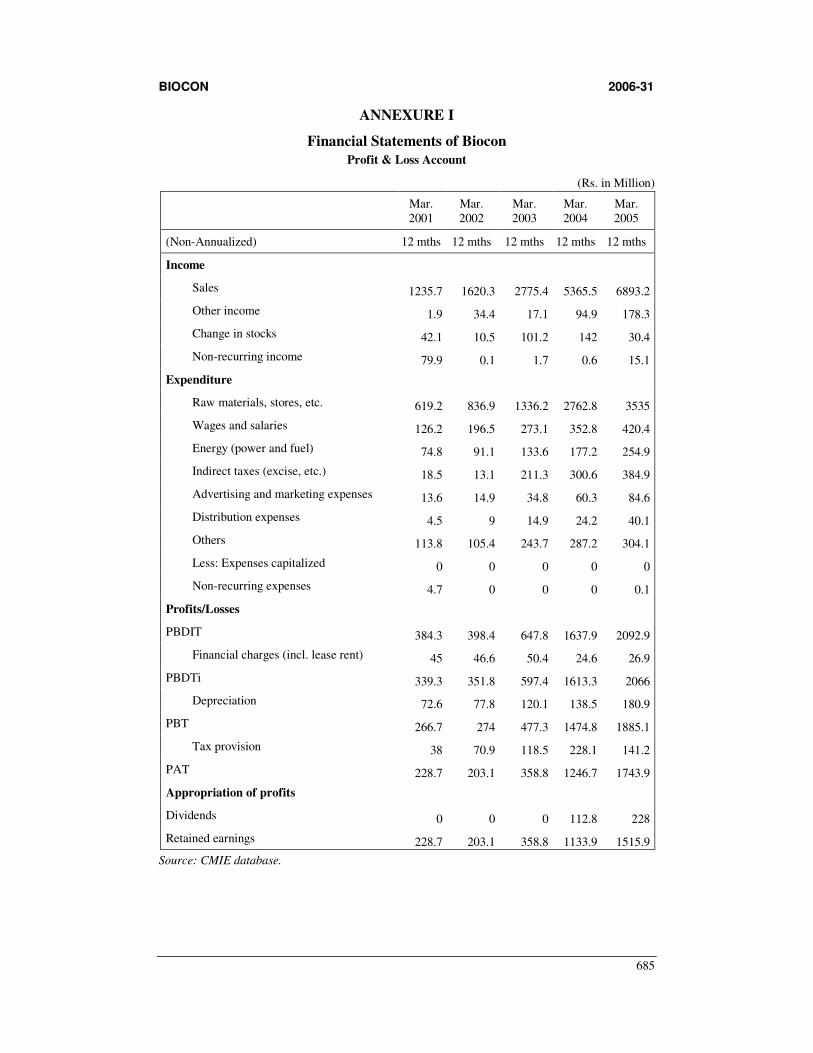
ANNEXURE I
Financial Statements of Biocon
Profit & Loss Account
(Rs. in Million)
Mar. 2001
Mar. 2002
Mar. 2003
Mar. 2004
Mar. 2005
(Non-Annualized) 12 mths 12 mths 12 mths 12 mths 12 mths
Income
Sales 1235.7 1620.3 2775.4 5365.5 6893.2
Other income 1.9 34.4 17.1 94.9 178.3
Change in stocks 42.1 10.5 101.2 142 30.4
Non-recurring income 79.9 0.1 1.7 0.6 15.1
Expenditure
Raw materials, stores, etc. 619.2 836.9 1336.2 2762.8 3535
Wages and salaries 126.2 196.5 273.1 352.8 420.4
Energy (power and fuel) 74.8 91.1 133.6 177.2 254.9
Indirect taxes (excise, etc.) 18.5 13.1 211.3 300.6 384.9
Advertising and marketing expenses 13.6 14.9 34.8 60.3 84.6
Distribution expenses 4.5 9 14.9 24.2 40.1
Others 113.8 105.4 243.7 287.2 304.1
Less: Expenses capitalized 0 0 0 0 0
Non-recurring expenses 4.7 0 0 0 0.1
Profits/Losses
PBDIT 384.3 398.4 647.8 1637.9 2092.9
Financial charges (incl. lease rent) 45 46.6 50.4 24.6 26.9
PBDTi 339.3 351.8 597.4 1613.3 2066
Depreciation 72.6 77.8 120.1 138.5 180.9
PBT 266.7 274 477.3 1474.8 1885.1
Tax provision 38 70.9 118.5 228.1 141.2
PAT 228.7 203.1 358.8 1246.7 1743.9
Appropriation of profits
Dividends 0 0 0 112.8 228
Retained earnings 228.7 203.1 358.8 1133.9 1515.9
Source: CMIE database.
BIOCON 2006-31
686
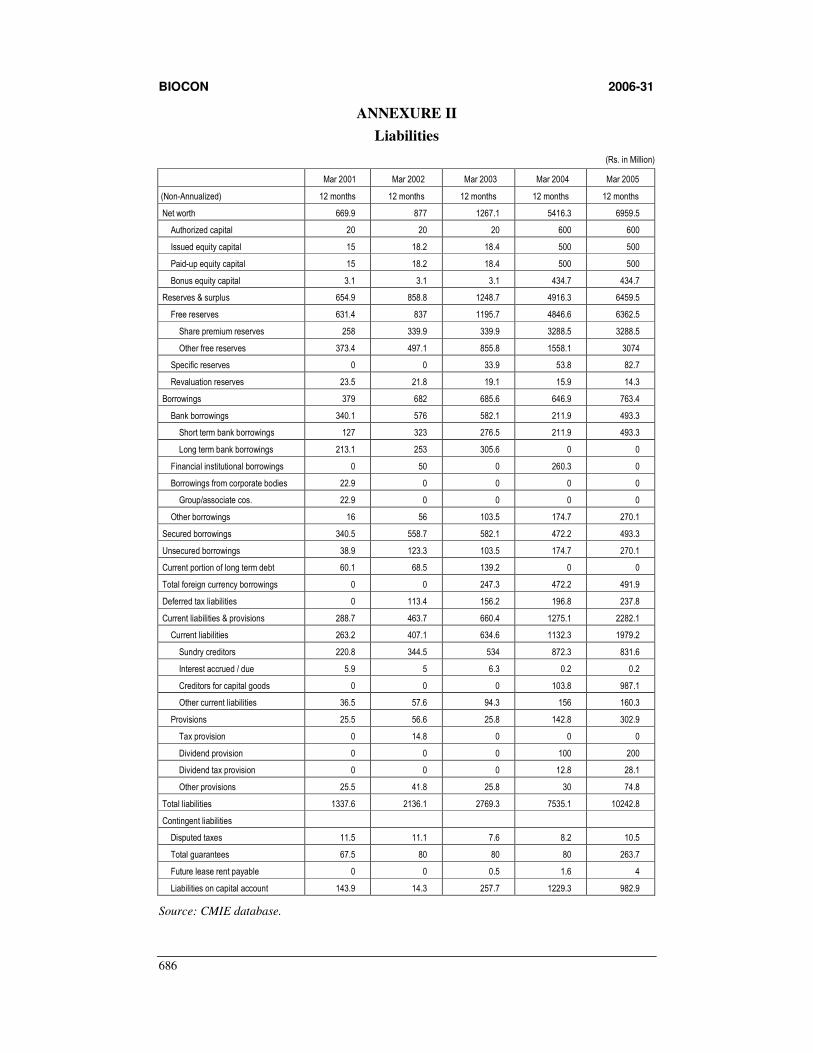
ANNEXURE II
Liabilities
(Rs. in Million)
Mar 2001 Mar 2002 Mar 2003 Mar 2004 Mar 2005
(Non-Annualized) 12 months 12 months 12 months 12 months 12 months
Net worth 669.9 877 1267.1 5416.3 6959.5
Authorized capital 20 20 20 600 600
Issued equity capital 15 18.2 18.4 500 500
Paid-up equity capital 15 18.2 18.4 500 500
Bonus equity capital 3.1 3.1 3.1 434.7 434.7
Reserves & surplus 654.9 858.8 1248.7 4916.3 6459.5
Free reserves 631.4 837 1195.7 4846.6 6362.5
Share premium reserves 258 339.9 339.9 3288.5 3288.5
Other free reserves 373.4 497.1 855.8 1558.1 3074
Specific reserves 0 0 33.9 53.8 82.7
Revaluation reserves 23.5 21.8 19.1 15.9 14.3
Borrowings 379 682 685.6 646.9 763.4
Bank borrowings 340.1 576 582.1 211.9 493.3
Short term bank borrowings 127 323 276.5 211.9 493.3
Long term bank borrowings 213.1 253 305.6 0 0
Financial institutional borrowings 0 50 0 260.3 0
Borrowings from corporate bodies 22.9 0 0 0 0
Group/associate cos. 22.9 0 0 0 0
Other borrowings 16 56 103.5 174.7 270.1
Secured borrowings 340.5 558.7 582.1 472.2 493.3
Unsecured borrowings 38.9 123.3 103.5 174.7 270.1
Current portion of long term debt 60.1 68.5 139.2 0 0
Total foreign currency borrowings 0 0 247.3 472.2 491.9
Deferred tax liabilities 0 113.4 156.2 196.8 237.8
Current liabilities & provisions 288.7 463.7 660.4 1275.1 2282.1
Current liabilities 263.2 407.1 634.6 1132.3 1979.2
Sundry creditors 220.8 344.5 534 872.3 831.6
Interest accrued / due 5.9 5 6.3 0.2 0.2
Creditors for capital goods 0 0 0 103.8 987.1
Other current liabilities 36.5 57.6 94.3 156 160.3
Provisions 25.5 56.6 25.8 142.8 302.9
Tax provision 0 14.8 0 0 0
Dividend provision 0 0 0 100 200
Dividend tax provision 0 0 0 12.8 28.1
Other provisions 25.5 41.8 25.8 30 74.8
Total liabilities 1337.6 2136.1 2769.3 7535.1 10242.8
Contingent liabilities
Disputed taxes 11.5 11.1 7.6 8.2 10.5
Total guarantees 67.5 80 80 80 263.7
Future lease rent payable 0 0 0.5 1.6 4
Liabilities on capital account 143.9 14.3 257.7 1229.3 982.9
Source: CMIE database.
BIOCON 2006-31
687
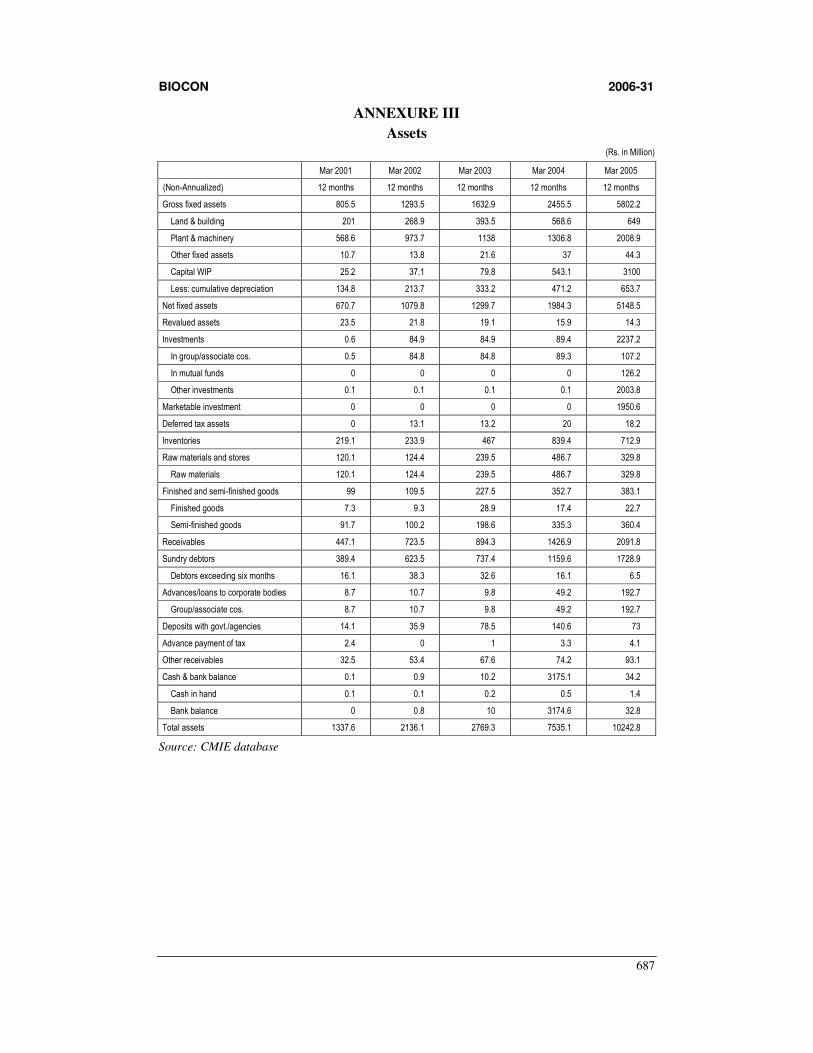
ANNEXURE III
Assets
(Rs. in Million)
Mar 2001 Mar 2002 Mar 2003 Mar 2004 Mar 2005
(Non-Annualized) 12 months 12 months 12 months 12 months 12 months
Gross fixed assets 805.5 1293.5 1632.9 2455.5 5802.2
Land & building 201 268.9 393.5 568.6 649
Plant & machinery 568.6 973.7 1138 1306.8 2008.9
Other fixed assets 10.7 13.8 21.6 37 44.3
Capital WIP 25.2 37.1 79.8 543.1 3100
Less: cumulative depreciation 134.8 213.7 333.2 471.2 653.7
Net fixed assets 670.7 1079.8 1299.7 1984.3 5148.5
Revalued assets 23.5 21.8 19.1 15.9 14.3
Investments 0.6 84.9 84.9 89.4 2237.2
In group/associate cos. 0.5 84.8 84.8 89.3 107.2
In mutual funds 0 0 0 0 126.2
Other investments 0.1 0.1 0.1 0.1 2003.8
Marketable investment 0 0 0 0 1950.6
Deferred tax assets 0 13.1 13.2 20 18.2
Inventories 219.1 233.9 467 839.4 712.9
Raw materials and stores 120.1 124.4 239.5 486.7 329.8
Raw materials 120.1 124.4 239.5 486.7 329.8
Finished and semi-finished goods 99 109.5 227.5 352.7 383.1
Finished goods 7.3 9.3 28.9 17.4 22.7
Semi-finished goods 91.7 100.2 198.6 335.3 360.4
Receivables 447.1 723.5 894.3 1426.9 2091.8
Sundry debtors 389.4 623.5 737.4 1159.6 1728.9
Debtors exceeding six months 16.1 38.3 32.6 16.1 6.5
Advances/loans to corporate bodies 8.7 10.7 9.8 49.2 192.7
Group/associate cos. 8.7 10.7 9.8 49.2 192.7
Deposits with govt./agencies 14.1 35.9 78.5 140.6 73
Advance payment of tax 2.4 0 1 3.3 4.1
Other receivables 32.5 53.4 67.6 74.2 93.1
Cash & bank balance 0.1 0.9 10.2 3175.1 34.2
Cash in hand 0.1 0.1 0.2 0.5 1.4
Bank balance 0 0.8 10 3174.6 32.8
Total assets 1337.6 2136.1 2769.3 7535.1 10242.8
Source: CMIE database
BIOCON 2006-31
688
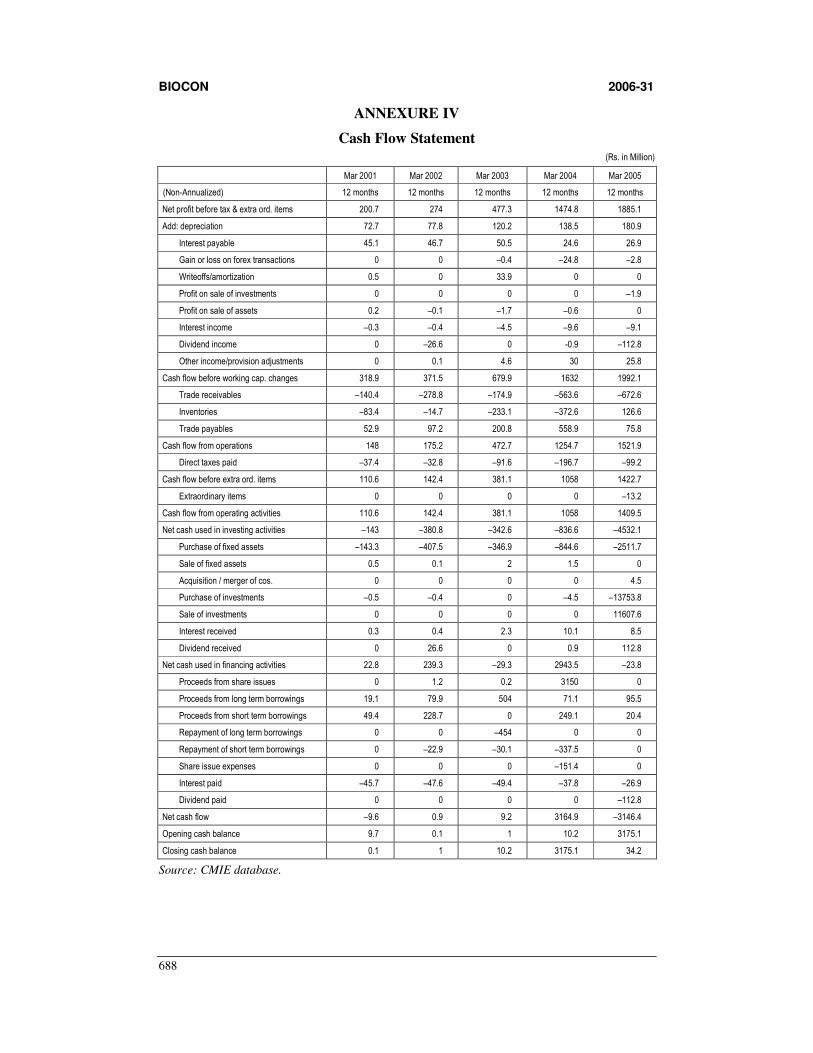
ANNEXURE IV
Cash Flow Statement
(Rs. in Million)
Mar 2001 Mar 2002 Mar 2003 Mar 2004 Mar 2005
(Non-Annualized) 12 months 12 months 12 months 12 months 12 months
Net profit before tax & extra ord. items 200.7 274 477.3 1474.8 1885.1
Add: depreciation 72.7 77.8 120.2 138.5 180.9
Interest payable 45.1 46.7 50.5 24.6 26.9
Gain or loss on forex transactions 0 0 –0.4 –24.8 –2.8
Writeoffs/amortization 0.5 0 33.9 0 0
Profit on sale of investments 0 0 0 0 –1.9
Profit on sale of assets 0.2 –0.1 –1.7 –0.6 0
Interest income –0.3 –0.4 –4.5 –9.6 –9.1
Dividend income 0 –26.6 0 -0.9 –112.8
Other income/provision adjustments 0 0.1 4.6 30 25.8
Cash flow before working cap. changes 318.9 371.5 679.9 1632 1992.1
Trade receivables –140.4 –278.8 –174.9 –563.6 –672.6
Inventories –83.4 –14.7 –233.1 –372.6 126.6
Trade payables 52.9 97.2 200.8 558.9 75.8
Cash flow from operations 148 175.2 472.7 1254.7 1521.9
Direct taxes paid –37.4 –32.8 –91.6 –196.7 –99.2
Cash flow before extra ord. items 110.6 142.4 381.1 1058 1422.7
Extraordinary items 0 0 0 0 –13.2
Cash flow from operating activities 110.6 142.4 381.1 1058 1409.5
Net cash used in investing activities –143 –380.8 –342.6 –836.6 –4532.1
Purchase of fixed assets –143.3 –407.5 –346.9 –844.6 –2511.7
Sale of fixed assets 0.5 0.1 2 1.5 0
Acquisition / merger of cos. 0 0 0 0 4.5
Purchase of investments –0.5 –0.4 0 –4.5 –13753.8
Sale of investments 0 0 0 0 11607.6
Interest received 0.3 0.4 2.3 10.1 8.5
Dividend received 0 26.6 0 0.9 112.8
Net cash used in financing activities 22.8 239.3 –29.3 2943.5 –23.8
Proceeds from share issues 0 1.2 0.2 3150 0
Proceeds from long term borrowings 19.1 79.9 504 71.1 95.5
Proceeds from short term borrowings 49.4 228.7 0 249.1 20.4
Repayment of long term borrowings 0 0 –454 0 0
Repayment of short term borrowings 0 –22.9 –30.1 –337.5 0
Share issue expenses 0 0 0 –151.4 0
Interest paid –45.7 –47.6 –49.4 –37.8 –26.9
Dividend paid 0 0 0 0 –112.8
Net cash flow –9.6 0.9 9.2 3164.9 –3146.4
Opening cash balance 9.7 0.1 1 10.2 3175.1
Closing cash balance 0.1 1 10.2 3175.1 34.2
Source: CMIE database.
BIOCON 2006-31
689
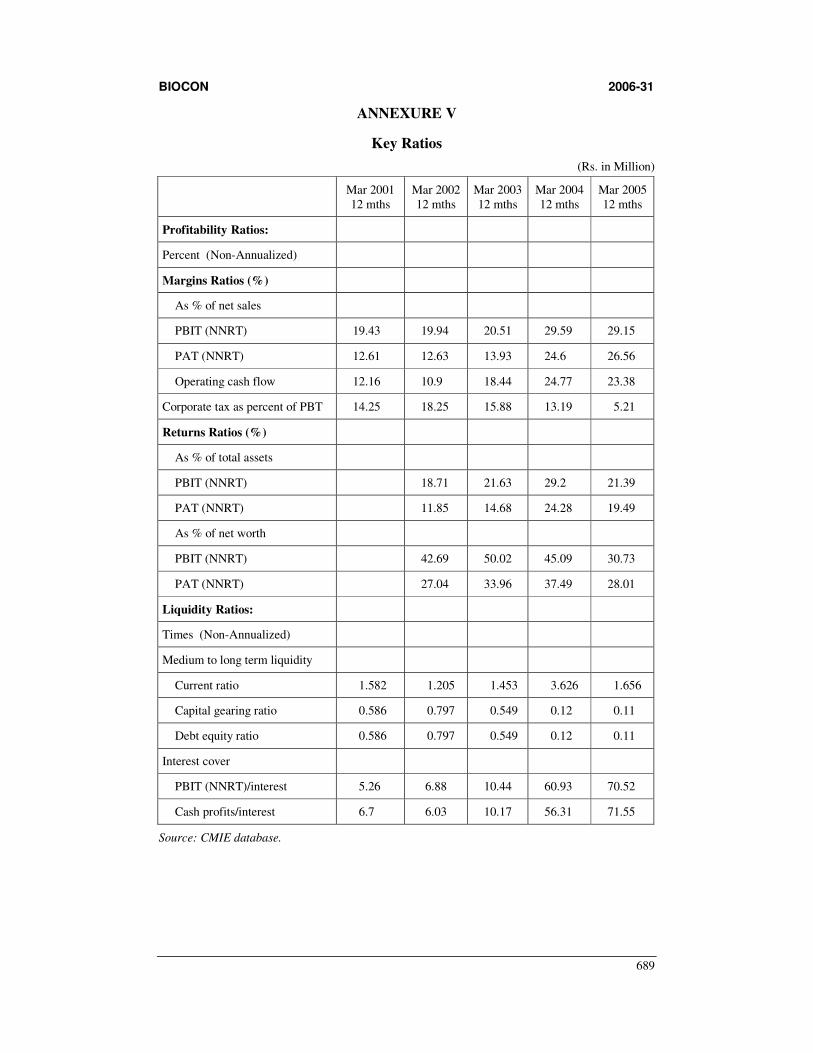
ANNEXURE V
Key Ratios
(Rs. in Million)
Mar 2001 12 mths
Mar 2002 12 mths
Mar 2003 12 mths
Mar 2004 12 mths
Mar 2005 12 mths
Profitability Ratios:
Percent (Non-Annualized)
Margins Ratios (%)
As % of net sales
PBIT (NNRT) 19.43 19.94 20.51 29.59 29.15
PAT (NNRT) 12.61 12.63 13.93 24.6 26.56
Operating cash flow 12.16 10.9 18.44 24.77 23.38
Corporate tax as percent of PBT 14.25 18.25 15.88 13.19 5.21
Returns Ratios (%)
As % of total assets
PBIT (NNRT) 18.71 21.63 29.2 21.39
PAT (NNRT) 11.85 14.68 24.28 19.49
As % of net worth
PBIT (NNRT) 42.69 50.02 45.09 30.73
PAT (NNRT) 27.04 33.96 37.49 28.01
Liquidity Ratios:
Times (Non-Annualized)
Medium to long term liquidity
Current ratio 1.582 1.205 1.453 3.626 1.656
Capital gearing ratio 0.586 0.797 0.549 0.12 0.11
Debt equity ratio 0.586 0.797 0.549 0.12 0.11
Interest cover
PBIT (NNRT)/interest 5.26 6.88 10.44 60.93 70.52
Cash profits/interest 6.7 6.03 10.17 56.31 71.55
Source: CMIE database.
BIOCON 2006-31
690
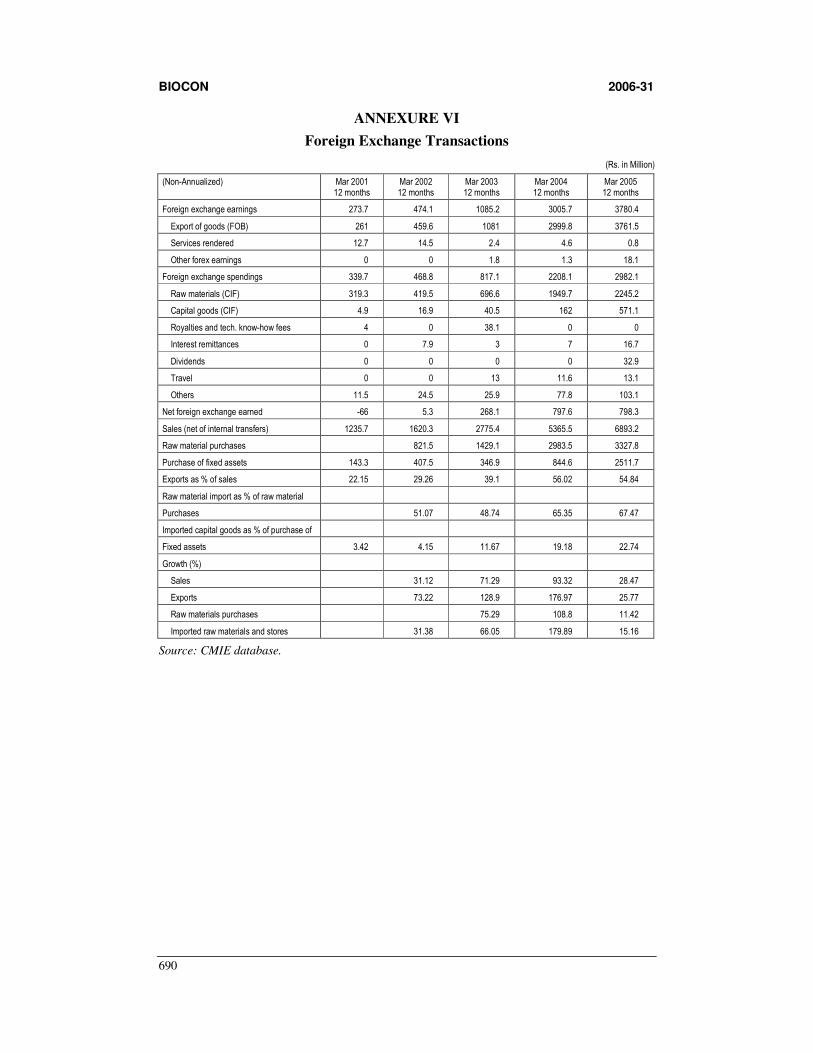
ANNEXURE VI
Foreign Exchange Transactions
(Rs. in Million)
(Non-Annualized) Mar 2001 12 months
Mar 2002 12 months
Mar 2003 12 months
Mar 2004 12 months
Mar 2005 12 months
Foreign exchange earnings 273.7 474.1 1085.2 3005.7 3780.4
Export of goods (FOB) 261 459.6 1081 2999.8 3761.5
Services rendered 12.7 14.5 2.4 4.6 0.8
Other forex earnings 0 0 1.8 1.3 18.1
Foreign exchange spendings 339.7 468.8 817.1 2208.1 2982.1
Raw materials (CIF) 319.3 419.5 696.6 1949.7 2245.2
Capital goods (CIF) 4.9 16.9 40.5 162 571.1
Royalties and tech. know-how fees 4 0 38.1 0 0
Interest remittances 0 7.9 3 7 16.7
Dividends 0 0 0 0 32.9
Travel 0 0 13 11.6 13.1
Others 11.5 24.5 25.9 77.8 103.1
Net foreign exchange earned -66 5.3 268.1 797.6 798.3
Sales (net of internal transfers) 1235.7 1620.3 2775.4 5365.5 6893.2
Raw material purchases 821.5 1429.1 2983.5 3327.8
Purchase of fixed assets 143.3 407.5 346.9 844.6 2511.7
Exports as % of sales 22.15 29.26 39.1 56.02 54.84
Raw material import as % of raw material
Purchases 51.07 48.74 65.35 67.47
Imported capital goods as % of purchase of
Fixed assets 3.42 4.15 11.67 19.18 22.74
Growth (%)
Sales 31.12 71.29 93.32 28.47
Exports 73.22 128.9 176.97 25.77
Raw materials purchases 75.29 108.8 11.42
Imported raw materials and stores 31.38 66.05 179.89 15.16
Source: CMIE database.
BIOCON 2006-31
691
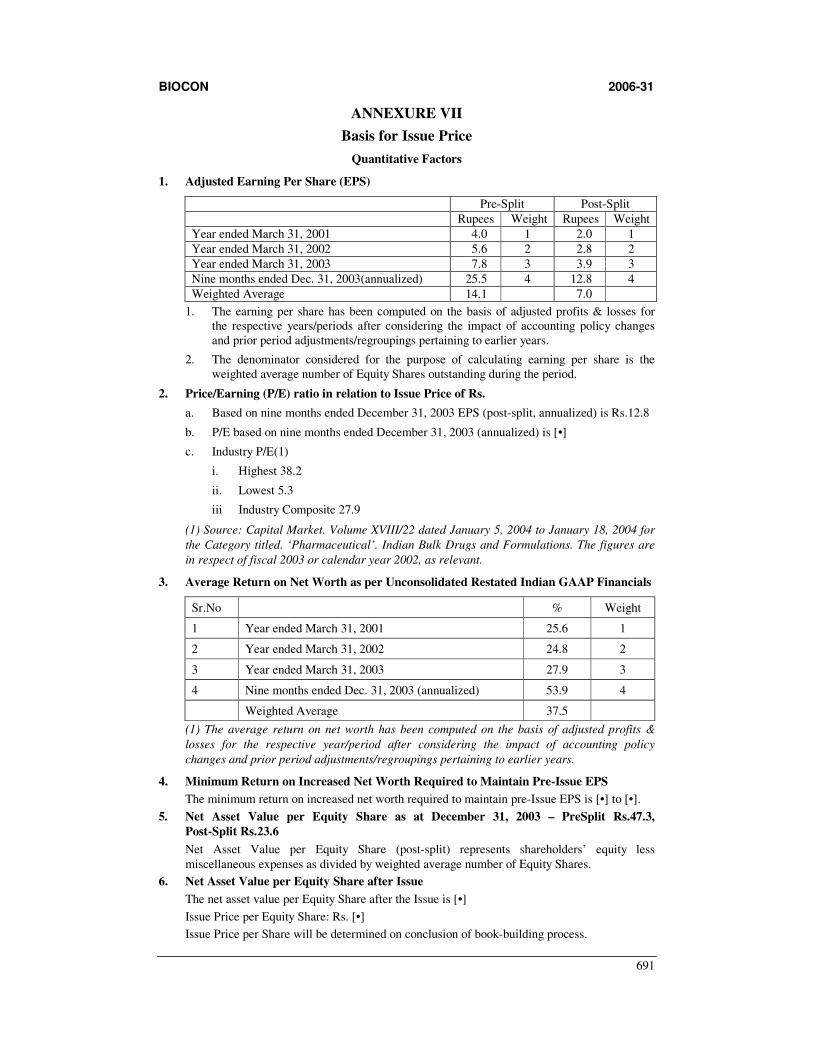
ANNEXURE VII
Basis for Issue Price
Quantitative Factors
1. Adjusted Earning Per Share (EPS)
Pre-Split Post-Split
Rupees Weight Rupees Weight
Year ended March 31, 2001 4.0 1 2.0 1
Year ended March 31, 2002 5.6 2 2.8 2
Year ended March 31, 2003 7.8 3 3.9 3
Nine months ended Dec. 31, 2003(annualized) 25.5 4 12.8 4
Weighted Average 14.1 7.0
1. The earning per share has been computed on the basis of adjusted profits & losses for the respective years/periods after considering the impact of accounting policy changes and prior period adjustments/regroupings pertaining to earlier years.
2. The denominator considered for the purpose of calculating earning per share is the weighted average number of Equity Shares outstanding during the period.
2. Price/Earning (P/E) ratio in relation to Issue Price of Rs.
a. Based on nine months ended December 31, 2003 EPS (post-split, annualized) is Rs.12.8
b. P/E based on nine months ended December 31, 2003 (annualized) is [•]
c. Industry P/E(1)
i. Highest 38.2
ii. Lowest 5.3
iii Industry Composite 27.9
(1) Source: Capital Market. Volume XVIII/22 dated January 5, 2004 to January 18, 2004 for
the Category titled. ‘Pharmaceutical’. Indian Bulk Drugs and Formulations. The figures are
in respect of fiscal 2003 or calendar year 2002, as relevant.
3. Average Return on Net Worth as per Unconsolidated Restated Indian GAAP Financials
Sr.No % Weight
1 Year ended March 31, 2001 25.6 1
2 Year ended March 31, 2002 24.8 2
3 Year ended March 31, 2003 27.9 3
4 Nine months ended Dec. 31, 2003 (annualized) 53.9 4
Weighted Average 37.5
(1) The average return on net worth has been computed on the basis of adjusted profits &
losses for the respective year/period after considering the impact of accounting policy
changes and prior period adjustments/regroupings pertaining to earlier years.
4. Minimum Return on Increased Net Worth Required to Maintain Pre-Issue EPS
The minimum return on increased net worth required to maintain pre-Issue EPS is [•] to [•].
5. Net Asset Value per Equity Share as at December 31, 2003 – PreSplit Rs.47.3,
Post-Split Rs.23.6
Net Asset Value per Equity Share (post-split) represents shareholders’ equity less
miscellaneous expenses as divided by weighted average number of Equity Shares.
6. Net Asset Value per Equity Share after Issue
The net asset value per Equity Share after the Issue is [•]
Issue Price per Equity Share: Rs. [•]
Issue Price per Share will be determined on conclusion of book-building process.
BIOCON 2006-31
692
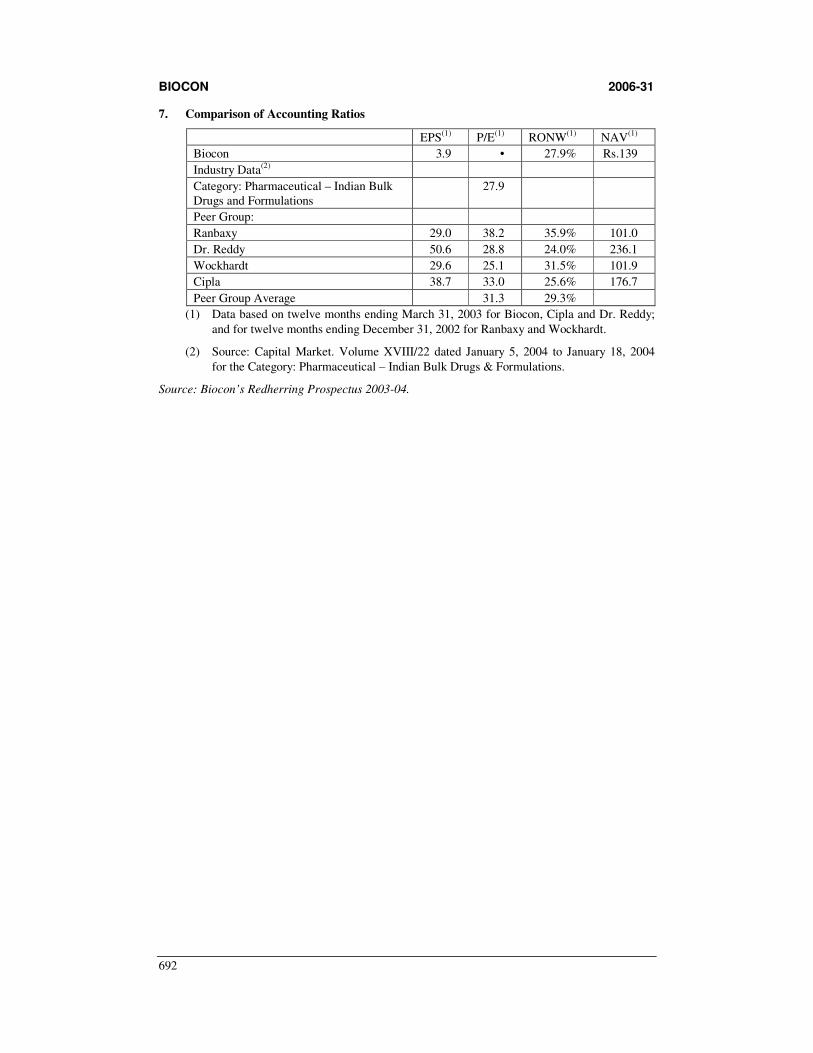
7. Comparison of Accounting Ratios
EPS(1) P/E(1) RONW(1) NAV(1)
Biocon 3.9 • 27.9% Rs.139
Industry Data(2)
Category: Pharmaceutical – Indian Bulk Drugs and Formulations
27.9
Peer Group:
Ranbaxy 29.0 38.2 35.9% 101.0
Dr. Reddy 50.6 28.8 24.0% 236.1
Wockhardt 29.6 25.1 31.5% 101.9
Cipla 38.7 33.0 25.6% 176.7
Peer Group Average 31.3 29.3%
(1) Data based on twelve months ending March 31, 2003 for Biocon, Cipla and Dr. Reddy;
and for twelve months ending December 31, 2002 for Ranbaxy and Wockhardt.
(2) Source: Capital Market. Volume XVIII/22 dated January 5, 2004 to January 18, 2004
for the Category: Pharmaceutical – Indian Bulk Drugs & Formulations.
Source: Biocon’s Redherring Prospectus 2003-04.
BIOCON 2006-31
693
References
1. Biocon’s Red Herring Prospectus 2003-04.
2. CMIE.
3. Ernst & Young’s “Beyond Borders: Global Biotechnology Report 2005”.
4. Integrating information drawn from different sources derives some Exhibits.
5. www.biocon.com
6. www.biospectrumindia.com
7. www.indiainfoline.com
8. www.medicinenet.com
9. www.ey.com
10. www.europabio.org
11. www.cs.berkeley.edu/~randit/MOT/Mot/post-mortemIII.html
BIOCON 2006-31
694
Model Question Paper Read the case carefully and answer the following questions:
1. Perform Michel Porter Analysis for Indian Biotechnology industry.
2. Perform the SWOT Analysis of Biocon Limited.
3. List key ratios in company analysis and analyze the performance of Biocon based on the
above ratios.
4. Discuss the Non-Financial Parameters to be examined by an investor in Biocon.
5. Major portion of revenues of Biocon comes from export to US and other developed
countries. What are the derivative instruments used by Biocon to hedge Foreign exchange
risk? Discuss the other alternatives that Biocon can use to hedge foreign exchange risk.
6. In 2004, Biocon raised Rs.500 million through IPO. The price band decided by the company
was Rs.270 to Rs.315 and issued at Rs.315 and listed on 7th March 2004 on the National
Stock Exchange of India Ltd. On that day, Biocon closed at Rs.487.3 and the Market Index
closed at 1848.7 against its previous close of 1851.15. In this context, determine whether the
issue was priced at its intrinsic worth or not, and discuss the implications and consequences
of the same.
7. What are the Primary and Support activities; and how are the Value Drivers in Biocon
identified?
8. Perform Portfolio Analysis to Biocon’s business segments (statins, insulin, enzymes and
R&D Services).
9. Discuss the role of Venture Capital (VC) in financing a Biotechnology industry. ICICI
ventures and its affiliates made a 156 percent return in merely three years through Venture
Capital investment in Biocon. In this context, discuss pros and cons of venture capital
investment from company point of view and venture capitalist point of view.
10. It is likely that a conflict of interests arises between the private equity fund, AIG AOF, and
the other shareholders of Biocon. In this context, discuss the agency problem in Biocon.
11. What are the key factors, which influence the dividend pay-out of a firm? Discuss the
dividend policy of Biocon.
12. Discuss the Merger and Acquisition scenario in Biotechnology Industry. What are the
reasons behind strategic partnerships and joint ventures of Biocon with other players of the
industry?
13. Discuss the factors of successful Diversification Strategy in relation to Biocon.
14. List the steps to be taken by a country and a company in the context of increased investment
in biotech industry in Asia Pacific region and competition among countries in the region for
their share. Do you think India and Biocon can implement the same?
BIOCON 2006-31
695
Suggested Answers
1. Michael Porter Analysis for Indian Biotech Industry
Threat of Entry
• The growth potential and government policies in India may attract many start-ups and
foreign players to get benefit out of this. This is a big threat of entry to existing firms in
the industry, especially in BioServices segment.
• The industry is not highly capital intensive. Moreover, the prevailing conditions in the
capital market and low interest rates create hardly any financial barriers to entry.
• It may be difficult for a new entrant to compete with Biocon in terms of economies of
scale unless they enter with huge investments. However, it is not a barrier to enter in
R&D services segment.
• The product differentiation of existing players may not be a big barrier to entry as it is
an R&D driven industry and all companies are concentrating on R&D to improve their
products/technology.
• Proprietary product technology and experience curve of established firms in the industry
may be a barrier of entry.
• The government policy is not a barrier of entry and there is little scope for retaliation
from the existing players.
Hence, the entry barriers are low in the industry.
Bargaining Power of Buyers
• Biocon’s majority of revenue comes from limited number of customers. It may lead to
high bargaining power of buyers. However, the stringent norms and regulations for
entry in the regulated markets may diminish competition among sellers.
• The retail clients may not have any bargaining power.
Overall, the bargaining power of buyers is moderate.
Bargaining Power of Suppliers
Biocon’s raw materials are commonly available and the company doesn’t depend on any
particular supplier; this means there are a number of suppliers. So, the bargaining power of
suppliers is less. The company itself produces some raw materials.
Hence, the bargaining power of suppliers is less.
Pressure from Substitute Products
Pharmaceutical products are substitutes for biotech products. However, pharmaceutical
companies themselves are investing in biotechnology in order to develop innovative products
for curing/preventing lifestyle diseases. Hence, the pressure from pharma products is low.
Competitive Rivalry
Economies of scale and R&D skills are two most important factors for biotechnology
industry’s growth. As there are relatively small number of players in the industry, and a high
growth potential in the industry now, the competition is moderate among the domestic
players. But as the number of firms grows in India and worldwide, these players may have to
compete with foreign companies who are also trying to grab some piece of global biotech
market. The competition may become intense in the industry in coming years with companies
coming up with innovative products.
BIOCON 2006-31
696
2. SWOT Analysis of Biocon
Strengths
• Proven solid-state fermentation skills of the company distinguish it from the other players in the industry.
• The company can make statins, enzymes and some other products at competitive prices using its PlafractorTM, which other players cannot use without paying huge royalties to Biocon.
• Solid presence in statins and the perception of global players about the company as rather a preferred supplier than a competitor.
• Top management with ‘can-do-spirit’ led by the dynamic leader, Kiran Mazumdar-Shaw.
• A very useful learning curve that the company experienced helps the company in choosing areas of operation, and developing them with due diligence and care.
• The company’s proprietary know-how, skills of its subsidiaries and its strategic motives in forming joint ventures and strategic alliances are all these factors that help Biocon in offering an integrated business model to its customers.
Weaknesses
• The company’s income is highly dependent on exports of its products to the regulated
markets where the regulatory norms and standards are very high.
• The company has to incur many costs in terms of R&D, processes development and in
taking approvals from the regulatory bodies such as US FDA in the US to market its
products there.
• The company’s dependence on limited number of customers to generate major portion
of its revenues.
Opportunitites
• Statins, immunosuppressants and insulin markets offer very good potential for growth
in the industry. Biocon has presence in these areas, and is expected to utilize these
opportunities.
• With global pharma companies realizing the potential of Biotech industry and India’s
cost advantage, Biocon’s ability to handle drug discovery and clinical trials may put the
company in driver’s seat in BioServices segment.
• The expected growth in animal cell culture market also offers good opportunities for
Biocon.
Threats
• The entry of global majors in India to take advantage of the low cost R&D will
adversely affect the company in BioServices sector.
• Competition from Chinese and other players, in the regulated markets may lead to price
wars; as a result Biocon may either have to lose some business or reduce bottom line.
• If any of Biocon’s competitors is able to grab some of its big customers, it will
negatively affect its revenues.
3. Key Ratios in Analyzing Biocon
The key ratios in analyzing a company’s performance are:
i. Profitability ratios such as:
a. Net Profit Margin
b. Return on Investment
c. Return on Equity.
BIOCON 2006-31
697
ii. Liquidity and Leverage ratios such as:
a. Current Ratio
b. Debt-Equity Ratio
c. Interest Coverage Ratio.
Analysis of Biocon’s performance during the last five years in relation to the above ratios.
• Net Profit Margin (NPM): The NPM of Biocon has more than doubled from 12.6% to
26.5% during the period. This shows that the overall efficiency in production,
administration, selling, financing, pricing, and tax management.
• Return on Investment (ROI): This is also called the earning power of the company.
This ratio can be used to evaluate how well the firm uses its operation basis. For
example, Return on Investment is 10% means, that for every Rs.100 invested in assets,
the affecting benefit is Rs.10. Except in the FY 2005, the company’s ROI has been
increasing. The decrease of ROI in 2005 can be attributed to the large amount of Capital
Work-in-Progress, which is included in the total assets.
• Return on Equity (ROE): This is the more simplified ratio, which measures the return available to the equity shareholder from the equity capital. Higher ROE represents better performance. For FY 2002, FY2003 and FY2004, ROE of Biocon went up from 27% to 37.5% and the Capital Work-in-Progress seems the main reason for the decrease in ROE for the FY 2005.
• Current Ratio: It measures the excess value of current assets over current liabilities. Higher current ratio indicates that higher the amount of current assets in relation to current liabilities the greater is the assurance to meet the current liabilities. For creditors, the excess of current assets provides a buffer against losses that may be incurred in disposition or liquidation of the current assets other than cash. The current ratio of Biocon has been moderate lingering around 1.5 against the normal standard of 2 except in the financial year 2004 in which it was 3.626.
• Debt-Equity Ratio: It indicates the relative contributions of creditors and owners and helps determine how well creditors are protected in case of insolvency. From the perspective of long-term debt-paying ability, the lower this ratio is, the better the company’s debt position. In this regard, Biocon is in a good position with its D/E ratio coming down from 0.59 to 0.11 during the last five years.
• Interest Coverage Ratio: This ratio indicates the number of times the firm can cover or meet the interest payments associated with debt. High times interest earned ratio indicates the greater ability to pay. Biocon’s Interest Coverage ratio increased from 5.2 times to 70.5 times during the last five years. This indicates that the ability of the company to service the debt has increased substantially.
Overall, Biocon’s performance has been good with stable profitability ratios, low debt-equity
ratio and high interest coverage ratio.
4. Non-Financial Parameters to be Examined by an Investor in Biocon
• Business of the Company: The company is well established with a wide range of products and services in biotechnology industry, and this is considered to have high potential.
• Top Management: Kiran Mazumdar-Shaw, the Chairman and Managing Director has an intuitive vision to make Biocon one of the top 10 biopharmaceutical companies in the world. She has built a like-minded top management team with can-do spirit.
• Product Range: Biocon currently offers a wide range of products and has some innovative new products in the pipeline.
• Diversification: The Company that started business as an enzyme maker has diversified its portfolio of products and services wisely to achieve sustainable growth in the earnings and profitability.
BIOCON 2006-31
698
• Foreign Collaboration: The Company formed strategic alliances and joint ventures with many foreign companies and institutions to enhance its technical skills in various areas.
• Availability and Cost of Inputs: The Company’s raw materials are linked to the prices of petrochemicals, which in turn follow global oil prices. The increase or decrease in global oil prices will affect Biocon’s profitability.
• Research and Development: Thirteen percent of Biocon’s sales is spent on R&D, which makes it clear that the company always tries to upgrade its skills, improve the quality of existing products and introduce new innovative products.
• Pattern of Shareholding and Listing: Non-promoters hold 35% of Biocon shares.
5. Biocon’s Type of Exposure to Foreign Exchange Risk and Alternative Techniques to
Manage it
Maurice D Levi describes foreign exchange risk as “the variance of the domestic-currency
value of an asset, liability, or operating income that is attributable to unanticipated changes in
exchange rates.”
Transaction Exposure: Transaction exposure is the exposure that arises from foreign
currency denominated transactions, which an entity is committed to complete. In other
words, it arises from contractual, foreign currency, and future cash flows.
Translation Exposure: Translation exposure is the exposure that arises from the need to convert values of assets and liabilities denominated in a foreign currency into the domestic currency.
Operating Exposure: Operating exposure is defined by Alan Shapiro as “the extent to which
the value of a firm stands exposed to exchange rate movements, the firm’s value being
measured by the present value of its expected cash flows”. Operating exposure is a result of
economic consequences (rather than accounting consequences, as in the case of transaction
and translation exposure) of exchange rate movements on the value of a firm, and hence, is also known as economic exposure.
The company faces Transaction Exposure. The company is currently entering into forward
contracts to hedge this risk. Apart from entering into forward contracts to manage
Transaction Exposure, the following techniques can be considered as alternatives.
i. Exposure Netting: It involves creating exposures in the normal course of business,
which offset the existing exposures. The exposures so created may be in the same
currency or in any other currency. This may be achieved by creating an opposite
exposure in the same currency or a currency, which moves in tandem with the currency
of the original exposure. It may also be achieved by creating a similar exposure in a
currency, which moves in the opposite direction to the currency of the original
exposure.
ii. Leading and Lagging: Leading involves advancing a payment, i.e., making a payment
before it is due. Lagging, on the other hand, refers to postponing a payment. A company
can lead payments required to be made in a currency that is likely to appreciate, and lag
the payment that it needs to make in a currency that is likely to depreciate.
iii. Hedging through Sourcing: Sourcing is a specific way of exposure netting. It involves
a firm buying the raw materials in the same currency in which it sells its products.
iv. Hedging through Futures: The rule is the same in the forward market, i.e., go short in
futures if you are long in the currency and vice versa.
v. Hedging through Options: A firm having a foreign currency receivable can buy a put
option on the currency, having the same maturity as the receivable.
BIOCON 2006-31
699
6. Overpricing or Underpricing of Biocon Issue:
Returns are computed for the purpose of determining whether the Biocon issue is overpriced
or underpriced. If these returns are positive, the indication is one of underpricing.
i. The returns on the stock Rit (in %) for Biocon is calculated using the equation:
Rit = {(Pit/Pio) – 1}x100
Where, Pio = Offer price of Biocon
Pit = Price of Biocon in period t.
Rit = {(487.3/315) – 1}x100 = 54.7%
ii. Return on Market Index is given by
Rmt = {(1848.70/1851.15) – 1}x100
= –0.13%
iii. The market adjusted return (ARit) = Rit – Rmt
= 54.7–(–0.13)
= 54.83%
Therefore, the issue was underpriced.
The Implications and Consequences of Biocon’s Underpricing
• Underpricing can be related to timing of the issue and prevailing market conditions
particularly in the stock market.
• The bull run in the stock market in 2004 has helped the stock gain substantially in the
secondary market.
• As a result of underpricing, the company lost the opportunity to raise more funds.
• Biocon’s shareholders received good returns thereby enhancing the company’s
credibility. This would enable the company to tap the market again for its future
ventures.
• Underpricing could result in a lower net worth on an increased equity, which might
make dividend pay-outs or investments in the future difficult.
7. Identification of the Value Drivers in Biocon
Value analysis, another wonderful tool developed by Michael Porter, is aimed at identifying
the activities of the firm that contribute value to the firm and those that do not. This is also a
structured tool like the five force model.
All the activities of a firm are grouped into two activities: primary activities and support
activities. The primary activities are in turn made into five groups.
These five groups are as follows:
i. Inbound Logistics: Activities like receiving, storing, and distributing inputs,
transportation of inputs, etc.
ii. Operations: Activities that convert the inputs into the final product like machinery,
assembling, packaging, etc.
iii. Outbound Logistics: Activities related to collecting, storing and distributing the final
product.
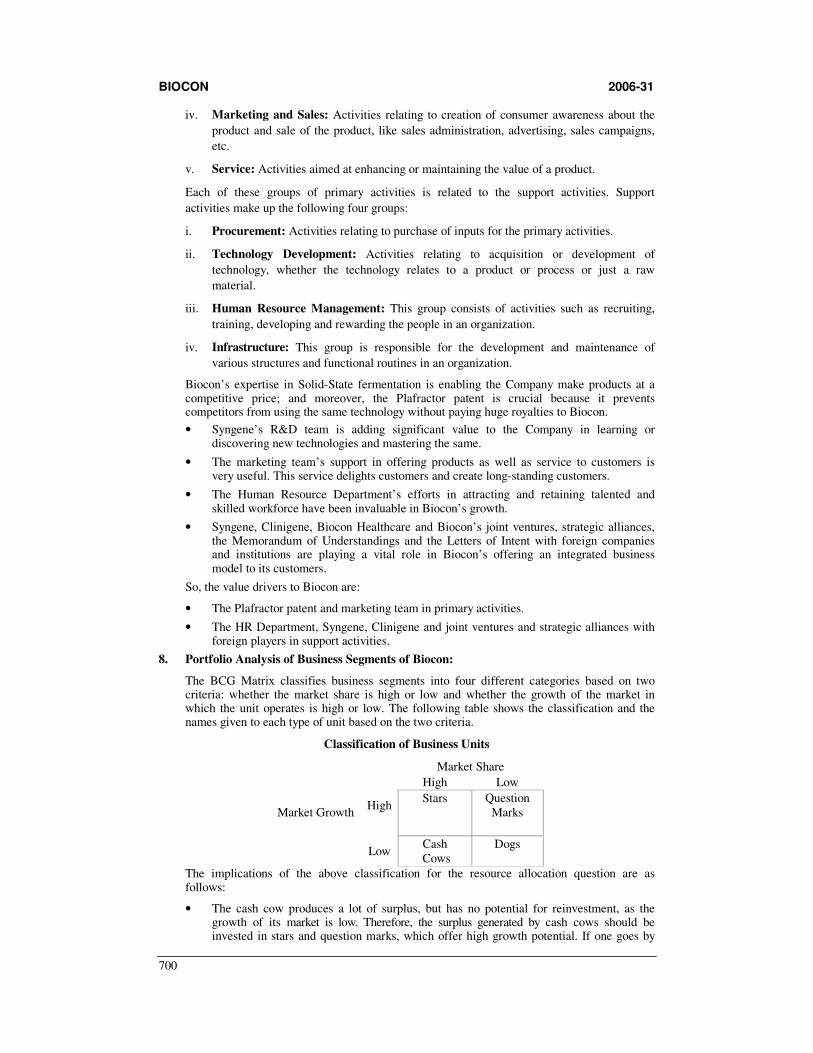
BIOCON 2006-31
700
iv. Marketing and Sales: Activities relating to creation of consumer awareness about the
product and sale of the product, like sales administration, advertising, sales campaigns,
etc.
v. Service: Activities aimed at enhancing or maintaining the value of a product.
Each of these groups of primary activities is related to the support activities. Support
activities make up the following four groups:
i. Procurement: Activities relating to purchase of inputs for the primary activities.
ii. Technology Development: Activities relating to acquisition or development of
technology, whether the technology relates to a product or process or just a raw
material.
iii. Human Resource Management: This group consists of activities such as recruiting,
training, developing and rewarding the people in an organization.
iv. Infrastructure: This group is responsible for the development and maintenance of
various structures and functional routines in an organization.
Biocon’s expertise in Solid-State fermentation is enabling the Company make products at a competitive price; and moreover, the Plafractor patent is crucial because it prevents competitors from using the same technology without paying huge royalties to Biocon.
• Syngene’s R&D team is adding significant value to the Company in learning or discovering new technologies and mastering the same.
• The marketing team’s support in offering products as well as service to customers is very useful. This service delights customers and create long-standing customers.
• The Human Resource Department’s efforts in attracting and retaining talented and skilled workforce have been invaluable in Biocon’s growth.
• Syngene, Clinigene, Biocon Healthcare and Biocon’s joint ventures, strategic alliances, the Memorandum of Understandings and the Letters of Intent with foreign companies and institutions are playing a vital role in Biocon’s offering an integrated business model to its customers.
So, the value drivers to Biocon are:
• The Plafractor patent and marketing team in primary activities.
• The HR Department, Syngene, Clinigene and joint ventures and strategic alliances with foreign players in support activities.
8. Portfolio Analysis of Business Segments of Biocon:
The BCG Matrix classifies business segments into four different categories based on two criteria: whether the market share is high or low and whether the growth of the market in which the unit operates is high or low. The following table shows the classification and the names given to each type of unit based on the two criteria.
Classification of Business Units
Market Share
High Low
High Stars Question
Marks
Market Growth
Low
Cash Cows
Dogs
The implications of the above classification for the resource allocation question are as follows:
• The cash cow produces a lot of surplus, but has no potential for reinvestment, as the growth of its market is low. Therefore, the surplus generated by cash cows should be invested in stars and question marks, which offer high growth potential. If one goes by
BIOCON 2006-31
701
theory, the Company should invest the cash flow generated from enzymes business in Statins, Insulin and R&D. However, the company may or may not do so and search for new areas in enzymes.
• Question marks and stars are very demanding not just in terms of financial resources, but also in terms of creative talent. Converting the growth potential offered by them into a useful opportunity calls for considerable amount of attention and creativity on the part of the managers. Firms should, therefore, make sure that their inventory of talented personnel is also adequate before pumping funds into them.
• Statins are Stars, as it is understood that the Company holds high market share and Statins offer high market growth as well. Insulin and R&D businesses come under Question Marks as the company holds less market share for now but these businesses offer impressive growth opportunity for the company.
• Dogs, which is the name used for units which neither have a good market share at present nor promise growth in future, should be sold off immediately and the proceeds should be diverted to stars and question marks. However, if the dog proposed to be sold off is the brainchild of one of the powerful persons in the organization, selling it off can be politically troublesome. This should also be considered before proposing to sell off a dog. The company doesn’t have any Dogs.
9. Role of Venture Capital (VC) in Financing a Biotechnology Industry
Venture Capital investment relates to the investment in high growth potential companies,
which are in their early phase of development. Generally, venture capital investments are
made in sunrise industries like biotechnology. A venture capital investor requires high-
expected return on his investment to compensate the losses on a probable large number of
failures. Venture capital involves investing in new companies, which may range from a new
start-up to a fully developed business. These are generally equity investments and the
investor makes this investment to benefit from the higher value of the invested equity. As
opposed to buyouts, venture capital deals are of a smaller size and generally involve only
non-controlling minority interest in the company.
• There are many start-ups coming up in the industry and the number of companies is in
their early phase of development.
• The growth potential of the industry and the companies operating in the industry is high.
• ICICI ventures made 156 percent return in three years on their investment in Biocon.
So, the investment in biotech companies can generate very high rates of return with
relatively high risk.
• As new biotech companies may not generate immediate and sustainable returns in the
short run, they often seek investment in equity form.
Taking all these factors into consideration, we can say that Venture Capital is very essential
for the development of the industry.
Pros and Cons of Venture Capital Investment:
i. From the company’s point of view:
• The threat of dilution of the ownership rights is minimum.
• Huge inflows of much desired capital come into the company at formative stages
where banks and financial institutions are also reluctant to fund the company.
• Venture capitalists will have a long-term perspective of the company and normally
ignore the short-term cash flow fluctuations.
• Larger share of VC in a start-up signals the company’s prospects, which is useful
during the IPO stages.
• The reputation and network of venture capitalists helps the company to explore
new markets and tap the market share with relative ease.
BIOCON 2006-31
702
• There may be conflicts of interest between promoters and Venture Capitalists.
• The VC always maintains a clause of refusal of subsequent funding to the
company, which is an issue of careful decisions and perception of the VC as to the
attractiveness of the venture previously planned.
ii. From the Venture Capitalist’s (VC) point of view:
• The VC that would exercise executive powers on the company, normally demands
a representation for him on the Board of Directors to monitor the decisions at the
apex level.
• There is high potential for huge returns from the VC investing if the company is
successful and starts growing.
• The venture capitalist holds the right to approve or object several key management
decisions like issuance of debentures/preference shares, going for IPOs, etc.
• VC financing is always provided on the basis of faith that a VC has on the abilities
of the promoters. Hence, the risk factor is high.
10. Biocon’s Susceptibility to Agency Problems
Agency theory is often described in terms of the relationships between the various interested
parties in the firm. Agency theory is helpful in explaining the actions of the various interest
groups in the corporate governance debate. For example, managers can be seen as the agents
of shareholders, employees as the agents of managers, managers and shareholders as the
agents of long and short-term creditors, etc. In most of these principal-agent relationships,
conflicts of interest are seen to exist. It has been widely observed that the conflicts between
shareholders and managers and in a similar way the objectives of employees and managers
may be in conflict. The agency relationship arising from the separation of ownership from
management is sometimes characterized as the agency problem. For example, if managers
hold none or very little of the equity shares of the company they work for, what is to stop
them from being inefficient or from not bothering to look for profitable new investment
opportunities themselves high salaries and perks or from growing.
One power that shareholders possess is the right to remove the directors from office. But
shareholders have to take the initiative to do this, and in many companies, the shareholders
lack the energy and organization to take such a step. Even so, directors will want the
company’s report and accounts, and the proposed final dividend, to meet with shareholders’
approval at the AGM. Another reason why managers might do their best to improve the
financial performance of their company is that managers’ pay is often related to the size or
profitability of the company. Managers in very big companies, or in very profitable
companies, will normally expect to earn higher salaries than managers in smaller or less
successful companies. Perhaps the most effective method is one of long-term share option
schemes to ensure that shareholder and manager objectives coincide. Management audits can
also be employed to monitor the actions of managers. Creditors commonly write restrictive
covenants into loan agreements to protect the safety of their funds. These arrangements
involve time and money both in initial set-up, and subsequent monitoring, these being
referred to as agency costs.
In case of Biocon, it is likely that a conflict of interests arises between the private equity
fund, AIG AOF, the minority shareholder and the other shareholders. AIG AOF has the right
to veto some important Board actions, including without limitation the issue of equity shares,
mergers and acquisitions, sale or other disposition of subsidiary shares or a material part of
Biocon’s or a subsidiary’s assets or any amendment to Biocon’s or a subsidiary’s
Memorandum and Articles of Association. Any disagreement between AIG AOF and the
Board may adversely affect the ability of the company to implement its business strategy.
BIOCON 2006-31
703
11. Strategic Determinants of Dividend Policy of Biocon
Some of the key factors which influence dividend payout of a firm are delineated below.
Liquidity: While earnings are an important determinant for the dividend decision, the role of
liquidity cannot be ignored. Dividend payout entails cash outflow for the firm. Hence, the quantum of dividends proposed to be distributed critically depends on the liquidity position of the firm. In practice, firms often face cash crunch in spite of having good earnings. Such
firms may not be in a position to declare dividends despite their profitability.
Investment Opportunities: Another key determinant to the dividend decision is the requirement of capital by the firm. Normally, firms tend to have low payout if profitable
investment opportunities exist and conversely, firms tend to resort to high payouts if profitable investment opportunities are lacking. Generally, firms operating in industries which are in the nascent and growth phases of the product life cycle are characterized by high
dependence on retained earnings. On the other hand, firms operating in industries which are in the maturity and decline stages normally distribute a larger proportion of their earnings as dividends.
Access to Finance: A company which has easy access to external sources of finance can
afford to be more liberal in its dividend payout. The dividend policy of such firms is relatively independent of its financing decisions. Firms having little or no access to external
financing have rather limited flexibility in their dividend decisions.
Flotation Costs: Issue of securities to raise capital in lieu of retained earnings involves flotation costs. These costs include fees payable to the merchant bankers, underwriting
commission, brokerage, listing fees, marketing expenses, etc. Moreover smaller the size of the issue, higher will be the flotation costs as a percentage of amounts mobilized. Further there are indirect flotation costs in the form of underpricing. Normally issue of shares is made
at a discount to the prevailing market price. The cost of external financing has an influence on the dividend policy.
Corporate Control: Further issue of shares (unless done through rights issue) results in
dilution of the stake of the existing shareholders. On the other hand, reliance on retained earnings has no impact on the controlling interest. Hence, companies vulnerable to hostile takeovers prefer retained earnings rather than fresh issue of securities. In practice, this
strategy can be a double edged sword. The niggardly payout policy of the company may result in low market valuation of the company vis-á-vis its intrinsic value. Consequently, the company becomes a more attractive target and is in the danger of being acquired.
Investor Preferences: The preference of the shareholders has a strong influence on the dividend policy of the firm. A firm tends to have a high payout ratio if the shareholders have
a strong preference towards current dividends. On the other hand, a firm resorts to retained
earnings if the shareholders exhibit a clear tilt towards capital gains.
Restrictive Covenants: The protective covenants in bond indentures or loan agreements often include restrictions pertaining to distribution of earnings. These conditions are incorporated to preserve the ability of the issuer/borrower to service the debt. These
covenants limit the flexibility of the company in determining its dividend policy.
Taxes: The incidence of taxation on the firm and the shareholders has a bearing on the
dividend policy. India levies a 10% tax on the amount of distributed profits. This tax is a strong fiscal disincentive on dividend distribution. These dividends are totally tax-free in the hands of the shareholders. The capital gains (long-term) are taxed at 20%.
Dividend Stability: The earnings of a firm may fluctuate wildly between various time
periods. Most firms do not like to have an erratic dividend pay-out in line with their varying
earnings. They try to maintain stability in their dividend policy. Stability does not mean that the dividends do not vary over a period of time. It only indicates that the previous dividends have a positive correlation with the current dividends. In the long run, the dividends have to
be invariably adjusted to synchronize with the earnings. However, the short-term volatility in earnings need not be fully reflected in dividends.
BIOCON 2006-31
704
Dividend Policy of Biocon
• From liquidity ratios, it is clear that the liquidity of the firm is better in the financial
year 2003-04 and 2004-05 than in the preceding years.
• Biocon found many profitable investment avenues since its inception, particularly in the
last 10 years and used internal accruals for capital expenditures.
• With its leading performance, the company currently has favorable access to external
funds.
• After its IPO, the company seems to have taken the general tendency of investor
preference for dividends into consideration in determining its dividend policy.
• Though the two-year dividend paying track record of Biocon is insufficient to say that
the company has a stable dividend policy, the way Biocon has been built-up and being
nurtured by the promoters may give us a clue that it values shareholders’ preferences.
All the above factors determined the dividend policy of Biocon before and after IPO.
12. Mergers and Acquisitions Scenario in the Industry:
Big global pharma companies realizing the potential of biotechnology industry are entering into the industry. The crucial point for success in this industry is focus and success in Research and Development. So, many small firms are entering into R&D space with some niche market in focus, leading to enhanced mergers and acquisitions activity in the industry. Major pharma players are acquiring small and medium-sized companies to enter into the biotechnology space.
Biocon’s Motives to form Joint Ventures and Strategic Partnerships
Joint Ventures, as a strategy, are more complex and more formal than all other arrangements, such as licensing arrangement, etc. Joint ventures involve the creation of a third entity, representing the interests and capital of the partners involved. In a joint venture, both the partners contribute their own proportional amounts of capital, distinctive skills, managers, reporting systems, and technologies to the venture. The emphasis is on collaboration rather than mere exchange. While exchange simply involves obtaining something back for what you have put in, collaboration involves creation of new value.
Joint Ventures in Business Strategy
More recently, joint ventures are being referred to as “strategic alliances”. Joint ventures are stimulated by a number of motives as described below:
i. The primary motive for starting a joint venture is to share investment expenses or enable a large company rich in cash to invest to collaborate with a smaller company having a product or production idea but lacking in funds to pursue the opportunity. However, it has been observed that finance is usually forthcoming if the product idea is a good one. It is only when the outcome is highly uncertain (high risks involved) and payoff is not likely to ensure till several years into the future, that financing is likely to become a problem. Though outside investors may be reluctant to finance the project even on an equity basis because of the high risks involved, a business firm may be interested because it possesses more information on the project or has other projects that may benefit from the learning experience that may be gained from the joint venture.
ii. The learning experience that may be obtained is the second strong motive for joint ventures.
iii. A joint venture serves as a method for reducing the investment outlay and sharing the risks, even for a large company. This is, of course, in addition to the learning experience that may be achieved.
iv. As reported in the Los Angeles Times in 1984, antitrust authorities may be more willing to permit joint ventures rather than mergers. This is because joint ventures result in an increase in the number of firms while mergers lead to a decrease in the number of firms. In a joint venture, parent firms continue their operations even after a new firm is created. The likelihood of receiving endorsement from government agencies is particularly more in case of joint ventures in research and development areas.
BIOCON 2006-31
705
Further, joint ventures may be used to acquire complementary or technological resources at less cost, or to derive benefits from economies of scale, critical mass, and learning experience, all of which are elements of strategic alliances.
Biocon’s Motives for Joint Ventures and Strategic Alliances
• Biocon’s strongest motive for joint ventures is apparently gaining technical skills from the joint venture partner and strategic alliances.
• Another motive looks like synergy of its joint venture partner’s technical know how and its manufacturing capability.
• As biotechnology is a relatively high-risk business, one of the motives is certainly reducing investment and sharing risks with the partner.
• Another reason for joint ventures could be the company would be able to concentrate on its existing business without deviating from it and at the same time pursue new growth opportunities through joint ventures and strategic alliances.
13. Characteristics of a Successful Diversification Strategy:
• Platform of existing capabilities
• Choice of new markets
• New capabilities
• Management skills and leadership
• Employee skills and productivity and
• Lean and tenacious.
Biocon’s Successful Diversification Strategy
• Biocon’s diversification strategy is built on its expertise in solid-state fermentation
skills, which can be used for almost all products and cannot be duplicated by
competitors and this adds significant value to the customers.
• The company has chosen new markets such as insulin, MABs, etc., which have great
growth potential.
• The company has strengthened its manufacturing capabilities through its expansion
program.
• It is already equipped with talented and skillful top management with instinctive vision.
• The company’s location has an advantage of grabbing skilled and productive workforce,
which is useful for its diversification strategy.
• The top and middle managements have can-do-spirit.
Overall, Biocon has characteristics of making a diversification strategy successful.
14. Steps to be taken by a country and a company in the context of increased investment in
biotech industry in Asia Pacific region and competition among countries in the region
for their share
Steps that should be taken by government include:
Technology Policy
• Greater emphasis on R&D allocations.
• Better coordination among government agencies in policy setting and allocation of
funds to R&D.
BIOCON 2006-31
706
• Increased tax credits for R&D investments in industry.
• Companies should be encouraged to form alliances for developing new technologies.
Industrial Policy
• The government should help the industry strengthen its technological muscle.
• Subsidize the technological development under taken by the companies in the industry.
Strengthening Education Programs
• Elementary and secondary schools to be reformed and improved in terms of both
general learning and technical knowledge.
• Universities should place more emphasis on manufacturing, engineering, product
innovation and international management. A national policy of stipends encouraging the
meritorious students in science and engineering could pay high dividends.
Financial Reforms
• Change in tax laws to stimulate a higher rate of savings.
• Change in capital gains laws to provide incentives for entrepreneurs and long-term investment.
• Removal of incentives for financial manipulation in buying and selling corporations.
A company should do the following:
• It should seek long-term investors and give them a voice in governance.
• Managers’ compensation should be linked to the firm’s competitive position.
• Improve worker-training programs in the company.
• Take special interest in adherence to international codes of social responsibility and ethics.
Yes, India and Biocon are in the right path for grabbing their share.