the ib diploma programme statistical bulletin management information coordinator: the ib diploma...
TRANSCRIPT

November 2008 Examination session
The IB Diploma Programme statistical bulletin

1
The IB Diploma Programme statistical bulletin, November 2008 examination session
Published in June 2009
International Baccalaureate Peterson House, Malthouse Avenue, Cardiff Gate
Cardiff, Wales CF23 8GL United Kingdom
Phone: + 44 29 2954 7777 Fax: + 44 29 2054 7778 Web site: www.ibo.org
© International Baccalaureate Organization 2009
Statistical queries should be directed to the Management Information Coordinator:
Phone: +44 29 2054 7657 Fax: +44 29 2054 7778
E-mail: [email protected]

2
Contents
Tables and graphs Page Index: key to abbreviations
4
PART A: general school statistics
5–7
1 Number of schools following the Diploma Programme 2004–2008
5
2 Number and percentage of schools following the Diploma Programme by working language 2004–2008
6
3 Number and percentage of schools following the Diploma Programme by IB region 2004–2008
7
PART B: registration statistics
8–25
4 Number of schools registering candidates November 2004–November 2008
8
5 Number of November session schools registering candidates November 2004–November 2008
8
6 Number of schools registering candidates by working language November 2004–November 2008
9
7 Number and percentage of schools registering candidates by IB region November 2004–November 2008
10
8 Number of candidates registered by category November 2004–November 2008
11
9 Number of candidates registered by gender November 2004–November 2008
13
10 Number of candidates registered by IB region November 2004–November 2008
14
11 Number of candidates registered by category, gender and IB region November 2008
15
12 Summary of Diploma Programme examination entries: schools with registered candidates November 1990–November 2008
16
13 Number of schools that registered a particular number of candidates November 2004–November 2008
18
14 Subject registration summary November 2008
19
15 Subject group registrations November 2004–November 2008
19
16 Additional Diploma Programme requirements: extended essay and theory of knowledge November 2008
20
17 Subject registration summary: extended essay by subject group November 2008
20

3
18 Subject registration summary: theory of knowledge by language
November 2008
21
19 Nationalities of candidates registered November 2008
22
20 Number of countries represented by examination session November 2004–November 2008
24
21 Number of candidates registered by country November 2008
25
PART C: results statistics
26–37
22 Analysis of examination results by subject and level November 2008
26
23 Diploma and retake candidates (D+R): distribution of points totals November 2008
31
24 Retake candidates only (R): distribution of points totals November 2008
32
25 Diploma score distribution: diploma and retake candidates (D+R) and retake candidates only (R) November 2008
33
26 Extended essay results November 2008
34
27 Theory of knowledge results November 2008
35
28 Distribution of additional points November 2004–November 2008
36
29 Mean points score worldwide November 2004–November 2008
37
30 Mean grade worldwide November 2004–November 2008
37
31 Pass rate worldwide November 2004–November 2008
37
32 Number of diplomas and bilingual diplomas awarded November 2004–November 2008
37
33 Number of diplomas awarded by IB region November 2008
37

4
Index: key to abbreviations
Categories of registration Diploma Programme candidates must register in one of four categories. These are identified by one of the following letters.
D Diploma: candidates intending to complete the requirements for the award of an IB diploma.
R Retake: previous IB diploma candidates who are seeking to improve their results.
The highest grade obtained for a subject will contribute towards the IB diploma. C Certificate: candidates taking one or more subjects who are not seeking the award
of the IB diploma.
A Anticipated: candidates intending to complete the requirements for one or two standard level subjects (excluding languages ab initio and pilot subjects) at the end of their first year of the Diploma Programme. They must complete all remaining IB diploma requirements in the corresponding examination session in the following year.
IB regions Schools that are authorized to offer the IB Diploma Programme are grouped by geographical region. The abbreviations used in the tables are the codes describing the following geographical regions:
IBAEM IB Africa, Europe and the Middle East IBAP IB Asia-Pacific IBLA IB Latin America IBNA IB North America and the Caribbean
Other abbreviations HL Higher level SL Standard level EE Extended essay TOK Theory of knowledge PS Pilot subjects SBS School-based syllabuses

5
PART A: general school statistics
1 Number of schools following the Diploma Programme 2004–2008
Number of schools following the
Diploma Programme* 2004 2005 2006 2007 2008
May session schools 1,086 1,192 1,324 1,454 1,636
November session schools
134 143 156 169 181
Total 1,220 1,335 1,480 1,623 1,817
*as of 30 November each year
Graph 1.1 Number of schools following the Diploma Programme 2004–2008
0
200
400
600
800
1,000
1,200
1,400
1,600
1,800
2,000
2004 2005 2006 2007 2008
Nu
mb
er
of
sch
oo
ls
Year
Number of November session schools following the Diploma Programme
Number of May session schools following the Diploma Programme

6
2 Number and percentage of schools following the Diploma Programme by working language 2004–2008
Number of schools following
the Diploma Programme by
working language*
2004 2005 2006 2007 2008
English 1,065 1,169 1,302 1,429 1,594
French 17 18 19 18 21
Spanish 138 148 159 176 202
Total 1,220 1,335 1,480 1,623 1,817
*as of 30 November each year
Graph 2.1 Number of schools following the Diploma Programme by working language
2004–2008
Percentage of schools following
the Diploma Programme by
working language*
2004 2005 2006 2007 2008
English 87.30% 87.57% 87.97% 88.05% 87.73%
French 1.39% 1.35% 1.28% 1.11% 1.16%
Spanish 11.31% 11.09% 10.74% 10.84% 11.11%
*as of 30 November each year
0
200
400
600
800
1,000
1,200
1,400
1,600
1,800
2004 2005 2006 2007 2008
Nu
mb
er
of
sch
oo
ls
Year
English
French
Spanish

7
3 Number and percentage of schools following the Diploma Programme by IB region 2004–2008
Number of schools following
the Diploma Programme by IB
region*
2004 2005 2006 2007 2008
IBAEM 388 424 483 532 605
IBAP 133 159 186 214 247
IBLA 161 170 181 194 217
IBNA 538 582 629 683 748
Total 1,220 1,335 1,479 1,623 1,817
*as of 30 November each year
Graph 3.1 Number of schools following the Diploma Programme by IB region 2004–2008
Percentage of schools following
the Diploma Programme by IB
region*
2004 2005 2006 2007 2008
IBAEM 31.80% 31.76% 32.57% 32.78% 33.3%
IBAP 10.90% 11.91% 12.57% 13.19% 13.59%
IBLA 13.20% 12.73% 12.24% 11.95% 11.94%
IBNA 44.10% 43.60% 42.52% 42.08% 41.17%
*as of 30 November each year
0
100
200
300
400
500
600
700
800
2004 2005 2006 2007 2008
Nu
mb
er
of
sch
oo
ls
Year
IBAEM
IBAP
IBLA
IBNA

8
PART B: registration statistics
4 Number of schools registering candidates November 2004–November 2008
Number of schools
registering candidates
November 2004
November 2005
November 2006
November 2007
November 2008
361 393 453 461 540
Percentage of total number of
schools 29.59% 29.44% 30.61% 28.40% 29.72%
Graph 4.1 Number of schools registering candidates November 2004–November 2008
5 Number of November session schools registering candidates
November 2004–November 2008
Number of November
session schools registering candidates
November 2004
November 2005
November 2006
November 2007
November 2008
122 126 132 139 149
Total number of November
session schools 134 143 156 170 181
Percentage of all November
session schools 91.04% 88.11% 84.61% 81.76% 82.32%
0
200
400
600
800
1,000
1,200
1,400
1,600
1,800
2,000
November 2004
November 2005
November 2006
November 2007
November 2008
Nu
mb
er
of
sch
oo
ls
Examination session
Total number of Diploma Programme schools
Number of schools registering candidates for November examination session

9
6 Number of schools registering candidates by working language
November 2004–November 2008
Number of schools
registering candidates by
working language
November 2004
November 2005
November 2006
November 2007
November 2008
English 287 313 369 380 460
French 0 1 3 1 2
Spanish 74 79 82 80 78
Total 361 393 454 461 540
Graph 6.1 Number of schools registering candidates by working language November 2004–
November 2008
0
50
100
150
200
250
300
350
400
450
500
November 2004
November 2005
November 2006
November 2007
November 2008
Nu
mb
er
of
sch
oo
ls
Examination session
English
French
Spanish
10
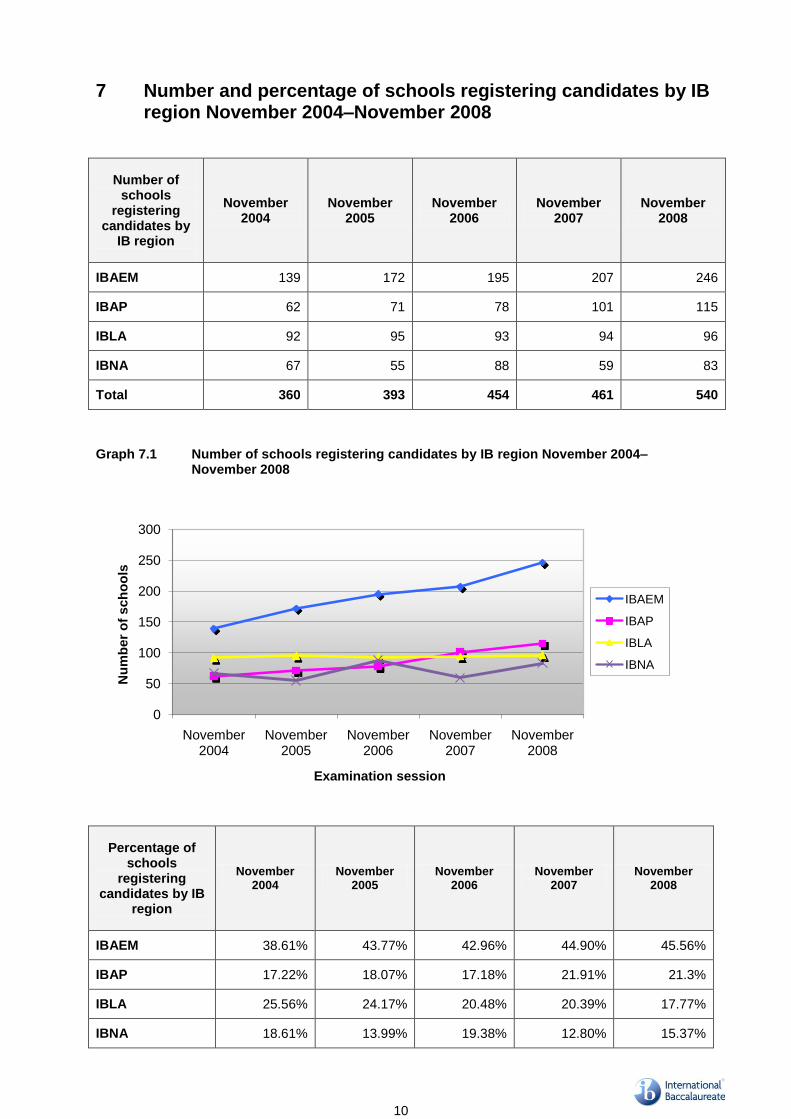
7 Number and percentage of schools registering candidates by IB
region November 2004–November 2008
Number of schools
registering candidates by
IB region
November 2004
November 2005
November 2006
November 2007
November 2008
IBAEM 139 172 195 207 246
IBAP 62 71 78 101 115
IBLA 92 95 93 94 96
IBNA 67 55 88 59 83
Total 360 393 454 461 540
Graph 7.1 Number of schools registering candidates by IB region November 2004–
November 2008
Percentage of schools
registering candidates by IB
region
November 2004
November 2005
November 2006
November 2007
November 2008
IBAEM 38.61% 43.77% 42.96% 44.90% 45.56%
IBAP 17.22% 18.07% 17.18% 21.91% 21.3%
IBLA 25.56% 24.17% 20.48% 20.39% 17.77%
IBNA 18.61% 13.99% 19.38% 12.80% 15.37%
0
50
100
150
200
250
300
November 2004
November 2005
November 2006
November 2007
November 2008
Nu
mb
er
of
sch
oo
ls
Examination session
IBAEM
IBAP
IBLA
IBNA

11
8 Number of candidates registered by category November 2004–
November 2008
Number of candidates
registered by category
November 2004
November 2005
November 2006
November 2007
November 2008
Diploma 2,671 2,997 3,237 3,522 4,134
Retake 537 738 949 961 1,343
Certificate 1,086 1,179 1,116 1,341 *1,124
Anticipated 265 236 572 664 *795
Total 4,559 5,150 5,874 6,488 7,396
* Please note: Anticipated candidates are allowed to change their category to certificate and this will affect
these figures.
Graph 8.1 Number of candidates registered by category November 2004–November 2008
0
500
1,000
1,500
2,000
2,500
3,000
3,500
4,000
4,500
November 2004
November 2005
November 2006
November 2007
November 2008
Nu
mb
er
of
can
did
ate
s
Examination session
Diploma
Retake
Certificate
Anticipated

12
Graph 8.2 Number of candidates registered November 2004–November 2008
Percentage of
candidates registered by
category
November 2004
November 2005
November 2006
November 2007
November 2008
Diploma 58.59% 58.19% 55.11% 54.28% 55.9%
Retake 11.78% 14.33% 16.16% 14.81% 18.16%
Certificate 23.82% 22.89% 19.00% 20.67% *15.2%
Anticipated 5.81% 4.58% 9.74% 10.24% 10.74%
* Please note: Anticipated candidates are allowed to change their category to certificate and this will affect these figures.
Graph 8.3 Percentages of candidates registered November 2004–November 2008
0
1,000
2,000
3,000
4,000
5,000
6,000
7,000
8,000
November 2004
November 2005
November 2006
November 2007
November 2008
Nu
mb
er
of
can
did
ate
s
Examination session
Number of candidates registered
0%
10%
20%
30%
40%
50%
60%
70%
80%
90%
100%
November 2004
November 2005
November 2006
November 2007
November 2008
Perc
en
tag
e o
f can
did
ate
s
Examination session
Anticipated
Certificate
Retake
Diploma

13
9 Number of candidates registered by gender November 2004–November 2008
Number of candidates
registered by gender
November 2004
November 2005
November 2006
November 2007
November 2008
Female 2,370 2,739 3,023 3,137 3,728
Male 2,189 2,411 2,851 3,351 3,668
Total 4,559 5,150 5,874 6,488 7,396
Graph 9.1 Number of candidates registered by gender November 2004–November 2008
Percentage of
candidates registered by
gender
November 2004
November 2005
November 2006
November 2007
November 2008
Female 51.99% 53.18% 51.46% 48.35% 50.40%
Male 48.01% 46.82% 48.54% 51.65% 49.60%
0
500
1,000
1,500
2,000
2,500
3,000
3,500
4,000
November 2004
November 2005
November 2006
November 2007
November 2008
Nu
mb
er
of
can
did
ate
s
Examination session
Female
Male

14
10 Number of candidates registered by IB region November 2004–November 2008
Number of candidates
registered by IBO region
November 2004
November 2005
November 2006
November 2007
November 2008
IBAEM 630 844 976 1,059 1,342
IBAP 1,347 1,519 1,981 2,494 3,099
IBLA 2,455 2,683 2,758 2,830 2,815
IBNA 126 104 156 105 140
Total 4,558 5,150 5,871 6,488 7,396
Graph 10.1 Number of candidates registered by IB region November 2004–November 2008
Percentage of
candidates registered by
IB region
November 2004
November 2005
November 2006
November 2007
November 2008
IBAEM 13.82% 16.39% 16.62% 16.32% 18.15%
IBAP 29.56% 29.50% 33.74% 38.44% 41.9%
IBLA 53.86% 52.10% 46.98% 43.62% 38.06%
IBNA 2.76% 2.01% 2.66% 1.62% 1.89%
0
500
1000
1500
2000
2500
3000
3500
November 2004
November 2005
November 2006
November 2007
November 2008
Nu
mb
er
of
can
did
ate
s
Examination session
IBAEM
IBAP
IBLA
IBNA

15
11 Number of candidates registered by category, gender and IB region November 2008
IB region Category
Number of candidates registered Total number of candidates registered
Number of female candidates
Number of male candidates
IBAEM
Diploma 117 146 263
Retake 456 521 977
Certificate 7 21 28
Anticipated 31 43 74
IBAP
Diploma 1,110 1,070 2,180
Retake 63 129 192
Certificate 33 14 47
Anticipated 267 413 680
IBLA
Diploma 966 725 1691
Retake 23 27 50
Certificate 562 483 1045
Anticipated 14 15 29
IBNA
Diploma 0 0 0
Retake 73 51 124
Certificate 1 3 4
Anticipated 5 7 12
Total 3728 3668 7396
Graph 11.1 Number of candidates registered by category and IB region November 2008
0
200
400
600
800
1,000
1,200
1,400
1,600
1,800
2,000
2,200
IBAEM IBAP IBLA IBNA
Nu
mb
er
of
can
did
ate
s
IB region
Diploma candidates
Retake candidates
Certificate candidates
Anticipated candidates

16
12 Summary of Diploma Programme examination entries: schools with registered candidates November 1990–November 2008
Year
Number of
schools entered
Percentage increase
Number of candidates examined
Percentage increase
Average number of candidates per
school
Number of diploma and
retake candidates
Average number of diploma
and retake candidates per
school
1990 27 - 714 - 26.4 326 12.1
1991 34 26.0% 797 11.6% 23.4 416 12.2
1992 47 38.2% 1,144 43.5% 24.3 573 12.2
1993 54 14.9% 1,454 27.1% 27.0 779 14.4
1994 70 29.6% 1,812 24.6% 25.9 1,020 14.6
1995 71 1.4% 2,021 11.5% 28.5 1,114 15.7
1996 89 25.4% 2,402 18.9% 27.0 1,224 13.8
1997 91 2.2% 2,807 16.9% 30.8 1,517 16.7
1998 164 80.2% 3,290 17.2% 20.1 1,817 11.1
1999 247 50.6% 3,889 18.2% 15.7 2,389 9.7
2000 236 -4.5% 4,126 6.1% 17.5 2,590 11.0
2001 271 14.8% 4,217 2.2% 15.6 2,754 10.2
2002 293 8.1% 4,392 4.1% 15.0 2,943 10.0
2003 343 17.1% 4,677 6.5% 13.6 3,183 9.3
2004 361 5.2% 4,559 -2.5% 12.6 3,211 8.9
2005 393 8.9% 5,150 13.0% 13.1 3,735 9.5
2006 453 15.3% 5,874 14.1% 13.0 4,186 9.2
2007 461 1.77% 6,488 10.45% 14.1 4,483 9.7
2008 540 17.14% 7,396 14.0% 13.7 5,477 10.1
Note: The six-month retake facility was introduced in 1998 and has a significant impact on the data after this point. A larger choice of subjects was made available from November 1996.

17
Graph 12.1 Summary of Diploma Programme examination entries: schools with candidates registered November 1990–November 2008
Graph 12.2 Summary of Diploma Programme examination entries: total number of candidates registered and number of diploma and retake candidates registered November 1990–November 2008
0
100
200
300
400
500
600
1990 1992 1994 1996 1998 2000 2002 2004 2006 2008
Nu
mb
er
of
sch
oo
ls
Year
Number of schools with registered candidates
0
1,000
2,000
3,000
4,000
5,000
6,000
7,000
8,000
1990 1992 1994 1996 1998 2000 2002 2004 2006 2008
Nu
mb
er
of
can
did
ate
s
Year
Total number of candidates registered Number of diploma and retake candidates registered

18
13 Number of schools that registered a particular number of
candidates November 2004–November 2008
Graph 13.1 Number of schools that registered a particular number of candidates
November 2004–November 2008
020406080
100120140160180200220240260280300320340360380400420
November 2004
November 2005
November 2006
November 2007
November 2008
Nu
mb
er
of
sch
oo
ls
Examination session
Number of schools that registered 1–10 candidates
Number of schools that registered 11–30 candidates
Number of schools that registered 31–50 candidates
Number of schools that registered 51–80 candidates
Number of schools that registered 81–120 candidates
Number of schools that registered 121–200 candidates
Number of schools that registered over 200 candidates
Number of schools
that registered a particular number
of candidates
November 2004
November 2005
November 2006
November 2007
November 2008
1–10 candidates 256 277 331 333 392
11–30 candidates 61 60 59 62 80
31–50 candidates 20 29 32 36 37
51–80 candidates 15 17 20 16 16
81–120 candidates 6 8 6 10 8
121–200 candidates 3 2 4 3 6
0ver 200 candidates 0 0 1 1 1
Total 361 393 453 461 540

19
14 Subject registration summary November 2008
Subject group
Subject registrations Number of subjects
English French Spanish German Total Higher level
Standard level
Total
Group 1 - - - - 4,612 10 13 23
Group 2 - - - - 5,827 14 23 37
Group 3 4,947 1,286 40 6,273 9 11 20
Group 4 5,648 1,209 41 6,898 4 6 10
Group 5 3,858 1,483 5,341 2 3 5
Group 6 851 540 1,391 4 6 10
PS 2 2 1 1 2
SBS 41 41 3 3
Totals 15,347 - 4,518 81 30,385 44 66 110
15 Subject group registrations November 2004–November 2008 Graph 15.1 Number of candidates registered for subject groups November 2004–November 2008
0
500
1,000
1,500
2,000
2,500
3,000
3,500
4,000
4,500
5,000
5,500
6,000
6,500
7,000
November 2004
November 2005
November 2006
November 2007
November 2008
Nu
mb
er
of
can
did
ate
s
Examination session
Group 1
Group 2
Group 3
Group 4
Group 5
Group 6
Pilot subjects
School-based syllabuses

20
16 Additional Diploma Programme requirements: extended essay and theory of knowledge November 2004–November 2008
Number of candidates
registered for extended essay and theory of knowledge
November 2004
November 2005
November 2006
November 2007
November 2008
Extended essay 2,799 3,093 3,353 3,646 4,301
Theory of knowledge 2,720 3,045 3,321 3,595 4,223
17 Subject registration summary: extended essay by subject group November 2008
Number of EE candidates
registered for a particular
subject group
Group 1 Group 2 Group 3 Group 4 Group 5 Group 6 Pilot
subjects Total
844 197 2,075 698 98 372 17 4,301
Percentage of EE
candidates registered for a particular
subject group
19.62% 4.58% 48.24% 16.23% 2.28% 8.65% 0.4% 100.00%
Graph 17.1 Subject registration summary: extended essay by subject group November 2008
Group 1
Group 2
Group 3
Group 4
Group 5
Group 6
Pilot Subjects
Group 1
Group 2
Group 3
Group 4
Group 5
Group 6
Pilot Subjects

21
18 Subject registration summary: theory of knowledge by language November 2008
Theory of knowledge registration by language
English French Spanish German Total
Number of candidates registered
3,046 - 1,177 - 4,223
Percentage of candidates registered
72.13% - 27.87% -
Graph 18.1 Subject registration summary: theory of knowledge by language November 2008
English
Spanish
English
Spanish

22
19 Nationalities of candidates registered November 2008
Country name Number of candidates
Country name Number of candidates
AFGANISTAN 6 HONG KONG SPEC. ADMIN REGION CHINA
15
ALBANIA 1 HUNGARY 7
ALGERIA 2 ICELAND 1
ANGOLA 2 INDIA 137
ARGENTINA 999 INDONESIA 52
ARMENIA 1 IRAN, ISLAMIC REPUBLIC OF 5
AUSTRALIA 1,295 IRAQ 4
AUSTRIA 6 IRELAND 10
BAHAMAS 1 ISRAEL 6
BANGLADESH 2 ITALY 45
BELGIUM 6 JAMAICA 1
BENIN 1 JAPAN 27
BERMUDA 2 JORDAN 1
BOLIVIA 1 KAZAKHSTAN 3
BOSNIA AND HERZEGOVINA 10 KENYA 77
BOTSWANA 5 KOREA, DEMOCRATIC PEOPLE'S REPUBLIC OF
2
BRAZIL 127 KOREA, REPUBLIC OF 45
BRUNEI DARUSSALAM 2 LATVIA 6
BULGARIA 3 LEBANON 4
CAMBODIA 1 LESOTHO 14
CAMEROON 3 LITHUANIA 4
CANADA 47 LUXEMBORG 1
CENTRAL AFRICAN REPUBLIC 1 MACEDONIA, THE FORMER YUGOSLAV REPUBLIC OF
3
CHILE 614 MALAWI 2
CHINA 185 MALAYSIA 129
COLOMBIA 28 MALDIVES 1
COSTA RICA 66 MALTA 1
CROATIA 6 MAURITIUS 68
CYPRUS 6 MEXICO 8
CZECH REPUBLIC 9 MOROCCO 1
DENMARK 13 MOZAMBIQUE 6
ECUADOR 260 MYANMAR 2
EGYPT 16 NAMIBIA 5
ERITREA 1 NEPAL 3
ESTONIA 2 NETHERLANDS 49
ETHIOPIA 3 NETHERLANDS ANTILLES 1
FIJI 13 NEW ZEALAND 177
FINLAND 52 NICARAGUA 7
FRANCE 35 NIGERIA 2
GEORGIA 2 NORWAY 35
GERMANY 184 OMAN 1
GHANA 4 PAKISTAN 4
GREECE 31 PARAGUAY 23
GUATEMALA 68 PERU 413

23
Country name Number of candidates
Country name Number of candidates
PHILIPPINES 11 SWITZERLAND 22
POLAND 46 SYRIAN ARAB REPUBLIC 1
PORTUGAL 10 TAIWAN 10
PUERTO RICO 1 TANZANIA, UNITED REPUBLIC OF 44
ROMANIA 3 THAILAND 13
RUSSIAN FEDERATION 22 TUNISIA 1
RWANDA 20 TURKEY 17
SAUDI ARABIA 3 UGANDA 7
SERBIA 5 UKRAINE 5
SINGAPORE 766 UNITED ARAB EMIRATES 1
SLOVAKIA 4 UNITED KINGDOM 336
SLOVENIA 1 UNITED STATES 187
SOMALIA 1 URUGUAY 100
SOUTH AFRICA 38 UZBEKISTAN 1
SPAIN 28 VENEZUELA 7
SRI LANKA 8 VIETNAM 15
SUDAN 2 ZAMBIA 8
SURINAME 1 ZIMBABWE 29
SWAZILAND 24 OTHER 3
SWEDEN 62
Total number of nationalities: 128 (126 are above, and 2 other nationalities are from dual nationality candidates whose second nationality is not in the above) Candidates with dual nationality (Second nationality is not included in the above): 834

24
20 Number of countries represented by examination session November 2004–November 2008
Number of countries
represented by examination
session
November 2004
November 2005
November 2006
November 2007
November 2008
79 86 91 88 91
Graph 20.1 Number of countries represented by examination session November 2004–
November 2008
60
70
80
90
100
November 2004
November 2005
November 2006
November 2007
November 2008
Nu
mb
er
of
co
un
trie
s
Examination session
Number of countries represented by examination session

25
21 Number of candidates registered by country November 2008
Country name Number of candidates registered
Country name Number of candidates registered
ARGENTINA 1,047 MALAYSIA 48
AUSTRALIA 1,690 MALTA 2
AUSTRIA 4 MAURITIUS 83
AZERBAIJAN 1 MEXICO 3
BELGIUM 13 MOROCCO 2
BOSNIA AND HERZEGOVINA 11 MOZAMBIQUE 4
BOTSWANA 18 NAMIBIA 5
BRAZIL 119 NETHERLANDS 54
BRUNEI DARUSSALAM 4 NETHERLANDS ANTILLES 1
CANADA 22 NEW ZEALAND 192
CHILE 623 NICARAGUA 8
CHINA 13 NORWAY 29
COLOMBIA 21 PAKISTAN 2
COSTA RICA 81 PAPUA NEW GUINEA 9
CROATIA 7 PARAGUAY 28
CYPRUS 5 PERU 435
CZECH REPUBLIC 9 PHILIPPINES 14
DENMARK 6 POLAND 46
ECUADOR 271 PORTUGAL 7
EGYPT 17 QATAR 3
FIJI 30 RUSSIAN FEDERATION 8
FINLAND 54 RWANDA 21
FRANCE 15 SERBIA 2
GERMANY 74 SINGAPORE 913
GHANA 5 SLOVAKIA 3
GREECE 34 SOUTH AFRICA 2
GUATEMALA 69 SPAIN 25
HONG KONG 25 SRI LANKA 4
HUNGARY 7 SWAZILAND 89
ICELAND 1 SWEDEN 63
INDIA 105 SWITZERLAND 65
INDONESIA 12 TAIWAN 3
IRAN, ISLAMIC REPUBLIC OF 6 TANZANIA, UNITED REPUBLIC OF 44
IRELAND 5 THAILAND 16
ISLE OF MAN 2 TOGO 1
ITALY 22 TUNISIA 1
JAPAN 19 TURKEY 18
JORDAN 2 UGANDA 4
KENYA 69 UKRAINE 3
LATVIA 5 UNITED ARAB EMIRATES 19
LEBANON 6 UNITED KINGDOM 280
LESOTHO 14 UNITED STATES 117
LITUANIA 2 URUGUAY 108
LUXEMBORG 2 VENEZUELA 2
MACEDONIA, FORMER YUGOSLAV R REPUBLIC OF
5 ZAMBIA 7
ZIMBABWE 31

26
PART C: results statistics
22 Analysis of examination results by subject and level November 2008
Subject Level
Number of candidates
Percentage of candidates awarded grades Mean grade GROUP 1 1 2 3 4 5 6 7
AFRICANS A1 HL 1 100 4
AFRICANS A1 SL 2 50 50 5.5
CHINESE A1 HL 60 32 52 17 5.85
CHINESE A1 SL 109 1 2 9 61 27 6.11
ENGLISH A1 HL 1,441 2 17 43 30 7 5.23
ENGLISH A1 SL 977 2 19 44 29 6 5.18
FRENCH A1 HL 8 25 50 13 13 5.13
FRENCH A1 SL 44 11 23 32 30 5 4.93
GERMAN A1 HL 13 31 46 8 15 5.08
GERMAN A1 SL 14 36 14 21 29 5.43
INDONESIAN A1 HL 3 67 33 6.33
INDONESIAN A1 SL 3 33 33 33 6
JAPANESE A1 HL 20 10 40 50 6.4
JAPANESE A1 SL 3 100 7
KOREAN A1 HL 10 10 0 6.9
KOREAN A1 SL 6 17 83 6.83
PORTUGUESE A1 HL 52 8 25 46 15 6 4.87
PORTUGUESE A1 SL 13 8 31 38 23 4.77
SISWATI A1 SL 7 100 7
SPANISH A1 HL 1,286 5 34 42 18 2 4.78
SPANISH A1 SL 352 1 5 30 41 20 3 4.84
TEXT AND PERFORMANCE*
SL 10 50 40 10 3.6
GROUP 1 TOTAL 4,434 0 0 3 23 41 26 7 5.09
*Trans-disciplinary subject groups 1 and 6
Subject Level
Number of candidates
Percentage of candidates awarded grades Mean grade GROUP 2 1 2 3 4 5 6 7
ENGLISH A2 HL 893 19 56 22 2 5.05
ENGLISH A2 SL 170 14 22 34 24 6 4.86
ENGLISH B HL 1,235 1 13 45 34 6 5.30
ENGLISH B SL 364 9 27 49 15 5.69
FRENCH A2 HL 22 5 27 18 41 9 5.23
FRENCH A2 SL 19 21 37 32 11 5.32
FRENCH AB INITIO HL 194 2 7 19 26 36 11 5.18
FRENCH B HL 154 1 5 16 27 36 15 5.39
FRENCH B SL 559 1 6 15 29 32 18 5.38
GERMAN A2 HL 29 17 48 28 7 5.24
GERMAN A2 SL 23 13 35 30 22 4.61
GERMAN B HL 94 1 20 27 30 22 5.52
GERMAN B SL 140 2 14 34 32 18 5.49
INDONESIAN AB INITIO SL 34 29 38 24 9 5.12
INDONESIAN B HL 12 42 58 6.58

27
INDONESIAN B SL 38 3 18 32 21 26 5.50
ITALIAN B HL 28 7 25 54 11 4 4.79
ITALIAN B SL 29 3 38 45 14 4.69
JAPANESE AB INITIO SL 52 2 17 25 42 13 5.48
JAPANESE B SL 69 7 22 32 28 12 5.14
LATIN HL 1 100 7
LATIN SL 12 42 33 17 8 3.92
MALAY B SL 37 8 24 68 6.59
MANDARIN AB INITIO SL 60 2 5 13 17 32 32 5.67
MANDARIN B HL 29 17 83 6.83
MANDARIN B SL 540 1 4 9 16 70 6.49
PORTUGUESE A2 HL 27 19 59 22 6.04
PORTUGUESE A2 SL 15 60 33 7 5.47
PORTUGUESE B SL 40 5 45 40 10 5.55
SPANISH A2 HL 72 1 26 65 7 5.78
SPANISH A2 SL 19 11 79 11 6
SPANISH AB INITIO SL 423 5 17 31 30 16 5.32
SPANISH B HL 30 3 27 37 33 6
SPANISH B SL 33 6 24 15 21 33 5.52
SWAHILI B HL 11 27 73 5.73
SWAHILI B SL 20 15 30 45 10 5.50
TAMIL B SL 32 6 25 69 6.63
GROUP 2 TOTAL 5,559 0 0 3 14 35 31 17 5.44
Subject Level
Number of candidates
Percentage of candidates awarded grades Mean grade GROUP 3 1 2 3 4 5 6 7
BUSINESS & MANAGEMENT
HL 541 3 11 32 30 18 5 4.64
BUSINESS & MANAGEMENT
SL 359 6 21 23 21 19 10 4.55
ECOSYSTEMS & SOCIETIES**
SL 39 8 23 31 33 5 5.05
ECONOMICS HL 994 3 12 18 23 22 22 5.17
ECONOMICS SL 542 2 9 14 22 25 28 5.41
GEOGRAPHY HL 383 1 10 19 30 25 15 5.11
GEOGRAPHY SL 198 1 5 25 22 22 14 12 4.47
HISTORY HL 1,232 1 6 20 31 26 17 5.24
HISTORY SL 633 3 13 28 31 20 6 4.69
ISLAMIC HISTORY HL 16 6 19 56 19 5.88
ITGS* HL 151 3 7 21 30 23 16 5.10
ITGS* SL 90 2 3 7 21 34 29 3 4.82
PHILOSOPHY HL 94 1 18 41 33 6 5.24
PHILOSOPHY SL 33 3 15 33 42 6 5.33
PSYCHOLOGY HL 279 2 3 10 28 38 19 5.53
PSYCHOLOGY SL 173 1 2 5 20 34 27 11 5.09
SOCIAL & CULTURAL ANTHROPOLOGY
HL 92 5 16 41 21 15 1 4.27
SOCIAL & CULTURAL ANTHROPOLOGY
SL 52 13 37 37 10 4 4.54
GROUP 3 TOTAL 5,901 0 2 10 22 28 23 15 5.03
*ITGS = Information Technology in a global society
** Trans-disciplinary subject groups 3 and 4

28
Subject Level
Number of candidates
Percentage of candidates awarded grades Mean grade GROUP 4 1 2 3 4 5 6 7
BIOLOGY HL 1,142 9 19 23 19 18 12 4.53
BIOLOGY SL 1,383 8 27 29 20 13 2 4.08
CHEMISTRY HL 1,132 6 15 15 17 18 28 5.09
CHEMISTRY SL 918 2 10 14 19 17 24 14 4.67
DESIGN TECHNOLOGY HL 65 3 31 35 26 5 4.98
DESIGN TECHNOLOGY SL 20 15 5 25 50 5 5.25
ENVIRONMENTAL SYSTEMS
SL 220 5 14 29 21 20 10 4.64
PHYSICS HL 734 6 16 21 13 17 26 4.98
PHYSICS SL 785 1 6 18 22 17 15 21 4.76
GROUP 4 TOTAL 6,399 0 7 19 22 18 18 16 4.64
Subject Level
Number of candidates
Percentage of candidates awarded grades Mean grade GROUP 5 1 2 3 4 5 6 7
COMPUTER SCIENCE HL 23 30 13 17 13 26 4.91
COMPUTER SCIENCE SL 25 16 8 40 12 16 8 4.28
MATHEMATICAL SSTUDIES
SL 1,544 3 16 28 29 17 7 4.63
MATHEMATICS HL 943 7 17 15 20 25 15 4.81
MATHEMATICS SL 2,381 2 10 18 19 20 18 14 4.54
GROUP 5 TOTAL 4,916 1 7 17 21 23 19 12 4.62
Subject Level
Number of candidates
Percentage of candidates awarded grades Mean grade GROUP 6 1 2 3 4 5 6 7
FILM HL 29 7 28 38 17 10 4.97
MUSIC HL 153 3 17 29 41 10 5.37
MUSIC SL 39 15 23 28 10 23 5.03
THEATRE ARTS HL 151 10 21 38 21 10 5.0
THEATRE ARTS SL 29 10 28 24 17 21 4.1
VISUAL ARTS HL 640 1 4 26 28 26 15 5.2
VISUAL ARTS SL 277 2 5 39 34 17 3 4.69
GROUP 6 TOTAL 1,328 0 1 6 27 31 24 11 5.06
Subject Level
Number of candidates
Percentage of candidates awarded grades Mean grade PILOT SUBJECTS 1 2 3 4 5 6 7
DANCE HL 1 100 7
DANCE SL 1 100 7
PS TOTAL 2 0 0 0 0 0 0 100 7

29
Subject
Level Number of candidates
Percentage of candidates awarded grades Mean grade SCHOOL-BASED
SYLLABUSES 1 2 3 4 5 6 7
ANCIENT HISTORY SL 3 33 33 33 6
ART HISTORY SL 11 45 55 5.55
CHILE & THE PACIFIC BASIN
SL 14 36 57 7 4.49
CLASSICAL GREEK _AND ROMAN STUDIES
SL 15 13 73 13 6
HISTORICAL & _CONTEMPORARY _BRAZILIAN STUDIES
SL 31 10 29 19 29 3 10 4.16
PEACE & CONFLICT _STUDIES
SL 5 40 40 20 5.8
SBS TOTAL 79 0 4 11 14 34 27 10 5.06
ALL SUBJECTS TOTAL 28,657 0 3 11 21 28 23 14 4.97

30
Graph 22.1 Grade distribution by subject group November 2008
Group 1 Group 2
Group 3 Group 4
Group 5 Group 6
Pilot subjects School-based syllabuses
All subjects
2
3
4
5
67
1
2
3
4
5
6
7
2
3
4
5
6
7
1
2
3
4
5
6
7
2
3
4
5
6
7
1
2
3
4
5
6
7
1
2
3
4
5
6
7
1
2
3
4
5
6
7
1
2
3
4
5
67
1
2
3
4
5
6
7
1
2
3
4
5
6
7
1
2
3
4
5
6
7
7
1
2
3
4
5
6
7
12
3
4
5
67
1
2
3
4
5
6
7
1
2
3
45
6
71
2
3
4
5
6
7

31
23 Diploma and retake candidates (D+R): distribution of points totals November 2008
Total Points
Diploma awarded Diploma not awarded
Cumulative Number of candidates
Percentage of candidates
Number of candidates
Percentage of candidates
0 0.00%
1 0.00%
2 1 0.02% 0.02%
3 1 0.02% 0.04%
4 1 0.02% 0.06%
5 0.06%
6 3 0.06% 0.12%
7 2 0.04% 0.15%
8 3 0.06% 0.21%
9 2 0.04% 0.25%
10 2 0.04% 0.29%
11 6 0.12% 0.40%
12 3 0.06% 0.46%
13 10 0.19% 0.65%
14 9 0.17% 0.83%
15 12 0.23% 1.06%
16 18 0.35% 1.40%
17 16 0.31% 1.71%
18 25 0.48% 2.19%
19 44 0.85% 3.03%
20 67 1.29% 4.32%
21 116 2.23% 6.55%
22 149 2.86% 9.41%
23 266 5.11% 14.52%
24 176 3.38% 109 2.09% 20.00%
25 179 3.44% 76 1.46% 24.89%
26 218 4.18% 66 1.27% 30.35%
27 222 4.27% 43 0.83% 35.44%
28 298 5.73% 5 0.10% 41.26%
29 290 5.57% 2 0.04% 46.87%
30 294 5.65% 52.52%
31 255 4.90% 2 0.04% 57.45%
32 253 4.86% 62.31%
33 216 4.15% 66.46%
34 214 4.12% 70.57%
35 207 3.98% 74.55%
36 192 3.69% 78.24%
37 186 3.57% 1 0.02% 81.83%
38 150 2.88% 84.71%
39 177 3.40% 1 0.02% 88.13%
40 163 3.13% 1 0.02% 91.28%
41 137 2.63% 93.91%
42 109 2.09% 96.00%
43 103 1.98% 97.98%
44 67 1.28% 99.27%
45 38 0.73% 100.00%
4144 79.6% 1062 20.4% 5206

32
24 Retake candidates only (R): distribution of points totals November 2008
Total Points
Diploma awarded Diploma not awarded
Cumulative Number of candidates
Percentage of candidates
Number of candidates
Percentage of candidates
0 0.00%
1 0.00%
2 0.00%
3 0.00%
4 0.00%
5 0.00%
6 0.00%
7 0.00%
8 1 0.09% 0.09%
9 0.09%
10 0.09%
11 1 0.09% 0.18%
12 0.18%
13 1 0.09% 0.27%
14 2 0.18% 0.45%
15 2 0.18% 0.63%
16 6 0.54% 1.17%
17 4 0.36% 1.54%
18 4 0.36% 1.90%
19 7 0.63% 2.53%
20 20 1.81% 4.34%
21 39 3.52% 7.86%
22 66 5.96% 13.82%
23 153 13.82% 27.64%
24 84 7.58% 63 5.69% 40.92%
25 47 4.25% 45 4.07% 49.23%
26 59 5.33% 40 3.61% 58.18%
27 54 4.88% 22 1.99% 65.04%
28 59 5.33% 3 0.27% 70.64%
29 49 4.43% 2 0.18% 75.25%
30 53 4.79% 80.04%
31 40 3.62% 83.65%
32 27 2.44% 86.09%
33 18 1.62% 87.71%
34 24 2.16% 89.88%
35 24 2.16% 92.05%
36 26 2.35% 94.40%
37 21 1.89% 96.30%
38 9 0.81% 97.11%
39 9 0.81% 1 0.09% 98.01%
40 9 0.81% 98.83%
41 6 0.54% 99.37%
42 2 0.18% 99.55%
43 3 0.27% 99.82%
44 1 0.09% 99.91%
45 1 0.09% 100.00%
625 56% 482 44% 1107

33
25 Diploma score distribution: diploma and retake candidates (D+R) and retake candidates only (R) November 2008
Graph 25.1 Number of diploma and retake candidates with diplomas awarded and diplomas not awarded per points score November 2008
Graph 25.2 Number of retake candidates only with diplomas awarded and diplomas not awarded
per points score November 2008
0
20
40
60
80
100
120
140
160
180
200
220
240
260
280
300
0 3 6 9 12 15 18 21 24 27 30 33 36 39 42 45
Nu
mb
er
of
can
did
ate
s
Points score
Total number of candidates awarded points
Diploma awarded
Diploma not awarded
0
10
20
30
40
50
60
70
80
90
100
110
120
130
140
150
160
0 3 6 9 12 15 18 21 24 27 30 33 36 39 42 45
Nu
mb
er
of
can
did
ate
s
Points score
Total number of candidates awarded points
Diploma awarded
Diploma not awarded

34
26 Extended essay results November 2008
EE grade awarded
per subject group
A B C D E
Total of candidates
awarded grade
Total of all registered candidates
Percentage of
candidates awarded
grade
Group 1 168 276 303 61 6 814 819 99.39%
Group 2 38 39 59 46 10 192 192 100.00%
Group 3 278 417 825 400 70 1,990 2,004 99.30%
Group 4 63 126 285 159 32 665 669 99.40%
Group 5 11 12 31 32 5 91 91 100.00%
Group 6 73 110 122 51 5 361 361 100.00%
PS 2 4 9 2 0 17 17 100.00%
SBS 5 3 2 1 0 11 11 100.00%
Total 638 987 1,636 752 128
4,141 4,164 99.45%
Percentage of candidates awarded a particular grade
15.41% 23.83% 39.51% 18.16% 3.09%
Graph 26.1 Percentage of grades awarded: extended essay November 2008
A
B
C
DE
A
B
C
D
E

35
27 Theory of knowledge results November 2008
TOK grade awarded
A B C D E
Total of candidates
awarded grade
Total of all registered candidates
Percentage of
candidates awarded
grade
Number of candidates awarded grade
314 1,428 1,605 749 42
4,138 4,222 98.01% Percentage of candidates awarded grade
7.59% 34.52% 38.78% 18.10% 1.01%
Graph 27.1 Percentage of grades awarded: theory of knowledge November 2008
A
B
C
DE
A
B
C
D
E

36
28 Distribution of additional points November 2004–November 2008
Graph 28.1 Distribution of additional points November 2008
0
1
2
3
0
1
2
3
Additional points 0 1 2 3 Total Mean points
November 2004
Number of candidates awarded
839 1,261 588 383 3,071
1.17 Percentage of candidates awarded
27.32% 41.06% 19.15% 12.47% 100.00%
November 2005
Number of candidates awarded
1,032 1,574 578 385 3,569
1.09 Percentage of candidates awarded
28.92% 44.10% 16.20% 10.79% 100.00%
November 2006
Number of candidates awarded
1,209 1,707 652 445 4,013
1.08 Percentage of candidates awarded
30.13% 42.54% 16.25% 11.09% 100.00%
November 2007
Number of candidates awarded
1,252 1,918 762 468 4,400
1.10 Percentage of candidates awarded
28.45% 43.59% 17.32% 10.64% 100.00%
November 2008
Number of candidates awarded
1,535 2,252 853 555 5,195
1.08 Percentage of candidates awarded
29.55% 43.34% 16.42% 10.69% 100.00%

37
29 Mean points score worldwide November 2004–November 2008 Mean score
per examination
session
November 2004
November 2005
November 2006
November 2007
November 2008
30.29 30.11 30.05 30.73 30.58
30 Mean grade worldwide November 2004–November 2008 Mean grade
per examination
session
November 2004
November 2005
November 2006
November 2007
November 2008
4.87 4.87 4.89 4.95 4.97
31 Pass rate worldwide November 2004–November 2008
Pass rate per examination
session
November 2004
November 2005
November 2006
November 2007
November 2008
80.84% 81.03% 81.36% 81.29% 79.54%
32 Number of diplomas and bilingual diplomas awarded November 2004–November 2008
33 Number of diplomas awarded by IB region November 2008
Number of bilingual diplomas awarded
IBAEM IBAP IBLA IBNA Total
369 257 1,057 3 1,686
Number of all diplomas awarded (includes bilingual diplomas)
677 2,106 1,331 31 4,145
Examination session
Number of bilingual
diplomas awarded
Number of all diplomas awarded (includes bilingual
diplomas)
Percentage of bilingual diplomas in all
diplomas awarded
November 2004 1,170 2,494 46.91%
November 2005 1,353 2,914 46.43%
November 2006 1,561 3,260 47.88%
November 2007 1,476 3,511 42.04%
November 2008 1,686 4,145 40.68%