the hybrid synthesizer - granta design€¦ · the hybrid synthesizer uses continuum and...
TRANSCRIPT

CES EDUPACK TOOLS
A White Paper
The Hybrid Synthesizer Mike Ashby(1,2)
, Charlie Bream(2), Cristiano Cesaretto(2), Nick Ball(2)
(1) Engineering Department, Cambridge University (2) Granta Design, Cambridge, UK
First published May, 2010 Version 1.1 © Granta Design Ltd, January 2011
Cellular structures
Foams Triangulated lattices
Sandwich structures Symmetric sandwiches
Composites Unidirectional Quasi-isotropic Particulates
Contents 1. Introduction 2. Holes in material-property space 3. The CES Hybrid Synthesizer 4. Examples of what the Synthesizer can do 5. Summary: what the Synthesizer can and can’t do Appendices: Equations used by the Hybrid Synthesizer A1. Cellular structures: foams and lattices A2. Sandwich structures A3. Fibrous and particulate composites Further reading

The Hybrid Synthesizer Tool
1 Introduction and synopsis
Hybrid materials are combinations of two or more materials, or of materials and space, assembled in such a way as to have attributes not offered by any one material alone (Figure 1, central circle). Particulate and fiber composites are examples of one type of hybrid, but there are many others: sandwich structures, lattice structures, segmented structures and more. Here we describe a tool to explore the potential of hybrid materials, emphasizing the choice of the components, their configuration and their relative fraction (Table 1). These new variables expand design space, allowing the creation of new “materials” with specific property profiles. But how are we to compare a hybrid–a sandwich structure for example–with monolithic materials such as polycarbonate or titanium? To do this we must think of the sandwich not only as a hybrid with faces of one material bonded to a core of another, but as a “material” in its own right, with its own set of effective properties; it is these that allow the comparison. They are developed in the Appendices.
Components The choice of materials to be combined
Configuration The shape and connectivity of the components
Relative volumes
The volume fraction of each component
Scale The length-scale of the structural unit
Table 1: Ingredients of hybrid design.
Figure 1: Hybrid materials combine the properties of two (or more) monolithic materials, or of one material and space. They include fibrous and particulate composites, foams and lattices, sandwiches and almost all natural materials.
The approach adopted here is one of breadth rather than precision. The aim is to assemble methods to allow the properties of alternative hybrids to be scanned and compared with those of monolithic materials, seeking those that best meet a given set of design requirements. Once materials and configuration have been chosen, standard methods–optimization routines, finite-element analyses–can be used to refine them. But what the standard methods are not good at is the quick scan of alternative combinations. That is where the approximate methods developed below, in which material and configuration become the variables, pay off.
The tool in its present form contains models for three broad classes of hybrid, each with a number of discrete members.
Cellular structures are combinations of material and space giving precise control of density, stiffness, strength and thermal conductivity.
Sandwich structures have outer faces of one material supported by a core of another, usually a low density material. This configuration that can offer a flexural stiffness per unit weight that is greater than that offered by either component alone.
Composites combine two solid components, one, the reinforcement, contained in the other, the matrix.
The Hybrid Synthesizer uses continuum and micro-mechanical models to estimate the equivalent properties of each configuration. These can then be plotted on material selection charts, which become comparison-tools for exploring unique combinations of configuration and material. The examples of Section 4 illustrate its capabilities.
This tool will continue to be developed in response to feedback from users. The models released in this early version are simple and approximate. Users familiar with one or other of the configurations modeled here will have ideas about how the tool might be made more sophisticated. We welcome suggestions and will explore ways to implement them.
2 Holes in material-property space
Material properties can be “mapped” as Material Property Charts of which Figure 2 is an example (for an up-to-date survey see Ashby, 2010). All the charts have one thing in common: parts of them are populated with materials but other parts are not. Some parts of the holes are inaccessible for fundamental reasons that relate to the size of atoms and the nature of the forces that bind them together. But others are empty even though, in principle, they could be filled.
Criteria of excellence. Is anything to be gained by developing materials (or material-combinations) that lie in these holes? To answer this we need criteria of excellence to assess the merit of any given hybrid.
The Hybrid Synthesizer 1 Version 1.1 © Granta Design Ltd, January 2011
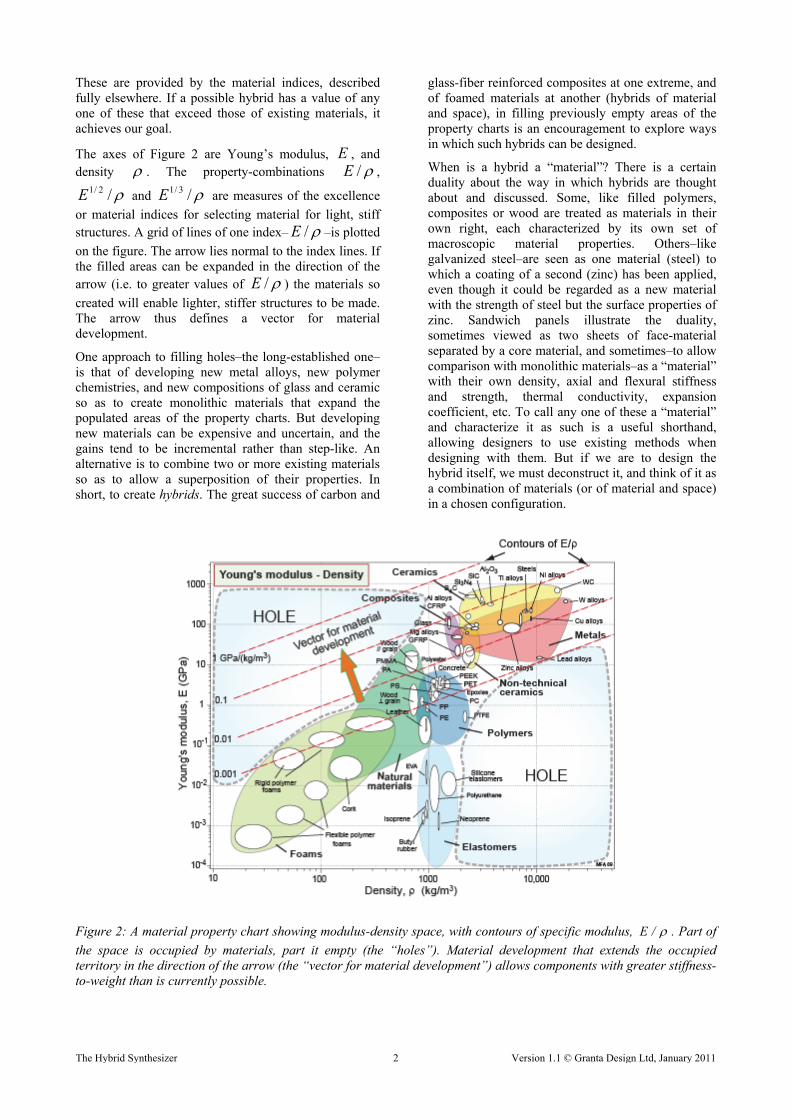
These are provided by the material indices, described fully elsewhere. If a possible hybrid has a value of any one of these that exceed those of existing materials, it achieves our goal.
The axes of Figure 2 are Young’s modulus, E , and density . The property-combinations /E ,
and are measures of the excellence
or material indices for selecting material for light, stiff structures. A grid of lines of one index–
/2/1E /3/1E
/E –is plotted
on the figure. The arrow lies normal to the index lines. If the filled areas can be expanded in the direction of the arrow (i.e. to greater values of /E ) the materials so
created will enable lighter, stiffer structures to be made. The arrow thus defines a vector for material development.
One approach to filling holes–the long-established one–is that of developing new metal alloys, new polymer chemistries, and new compositions of glass and ceramic so as to create monolithic materials that expand the populated areas of the property charts. But developing new materials can be expensive and uncertain, and the gains tend to be incremental rather than step-like. An alternative is to combine two or more existing materials so as to allow a superposition of their properties. In short, to create hybrids. The great success of carbon and
glass-fiber reinforced composites at one extreme, and of foamed materials at another (hybrids of material and space), in filling previously empty areas of the property charts is an encouragement to explore ways in which such hybrids can be designed.
When is a hybrid a “material”? There is a certain duality about the way in which hybrids are thought about and discussed. Some, like filled polymers, composites or wood are treated as materials in their own right, each characterized by its own set of macroscopic material properties. Others–like galvanized steel–are seen as one material (steel) to which a coating of a second (zinc) has been applied, even though it could be regarded as a new material with the strength of steel but the surface properties of zinc. Sandwich panels illustrate the duality, sometimes viewed as two sheets of face-material separated by a core material, and sometimes–to allow comparison with monolithic materials–as a “material” with their own density, axial and flexural stiffness and strength, thermal conductivity, expansion coefficient, etc. To call any one of these a “material” and characterize it as such is a useful shorthand, allowing designers to use existing methods when designing with them. But if we are to design the hybrid itself, we must deconstruct it, and think of it as a combination of materials (or of material and space) in a chosen configuration.
Figure 2: A material property chart showing modulus-density space, with contours of specific modulus, /E . Part of
the space is occupied by materials, part it empty (the “holes”). Material development that extends the occupied territory in the direction of the arrow (the “vector for material development”) allows components with greater stiffness-to-weight than is currently possible.
The Hybrid Synthesizer 2 Version 1.1 © Granta Design Ltd, January 2011

3 The Hybrid Synthesizer Tool
The Hybrid Synthesizer allows the user to select any material or combination of materials from the MaterialUniverse in CES Selector (or the equivalent Advanced Level 3 materials database in CES EduPack), and use them to create records with “effective” properties for a chosen set of composites, sandwiches or cellular structures. The records are added to the chosen database, becoming part of its content. The “effective” properties allow direct comparison of the hybrids with the other members of the database. All the selection tools of the CES Selector system (Limit stages, Graphical stages, Tree stages, use of Indices, etc.) operate on the new hybrid records as well as the other members of the database, allowing optimized selection that includes the hybrids.
The motive behind the tool is to enable fast assessment of a wide range of configurations and of materials to make them. To achieve this the Hybrid Synthesizer uses models that are approximate but that allow the maximum breadth of comparison. The hybrids that appear promising can be subsequently analyzed using standard, but more specialized, methods.
Cellular structures with choice of:
Bending‐dominated structures (“Foams”)
Stretch‐dominated structures (“Lattices”)
Sandwich panels with choice of:
Mode of loading
Span
Composite structures, with the choice of:
Uni‐directional, continuous fiber, plies
Quasi‐isotropic (0‐45‐90‐135 balanced, symmetric) laminates
Particulate composites
Table 2: Configurations available in the Hybrid Synthesizer (as of December 2010).
The Hybrid Synthesizer is accessed from the TOOLS button on the main CES Selector (or CES EduPack) toolbar. This brings up an input window allowing choice of configuration. The present version of the tool opens by offering the user the choice of six basic configurations, identified by the icons shown in Table 2. The sub-classes are accessed from a pull-down list within the chosen configuration window.
When the user selects a configuration the tool retrieves from its library a set of approximate predictive equations characterizing the chosen configuration, presenting the user with an input window choice of materials and control parameters (Table 3). Closing the input window causes the tool to calculate the property-set for each of the chosen ranges of the parameters of the hybrid, adding them to the database in a new folder called
My records. More than one set of virtual materials can be created. Either materials from the database or user-created records (made using the “Add material” facility in CES Selector or by using the tool itself) can be used as inputs. Examples of the input windows allowing choice of configuration and control parameters appear in each of the Case Studies of Section 4.
The Cellular structures unit allows the user to choose:
A material for the solid of which the structure is made
A range and number for the relative density (and thus the number of new material records to create)
Value for the l/a ratio that determines the fracture toughness
The Sandwich panel unit allows the user to choose:
A material for the face‐sheet
A material for the core material
A range and number for face‐sheet thickness
A range and number for core thickness
A span for the panel
Values for the ratios B1/B2 and B3/B4 that characterize the mode of loading
The Composite structures unit allows the user to choose:
A material for the matrix
A material for reinforcement (including a range of fibers)
A range and number for the volume fractions of reinforcement
Table 3: The control parameters for each configuration.
4 Examples of what the Hybrid Synthesizer can do
The figures on the following pages show ten examples of the input dialog-box and an output, in the form of a material property chart, illustrating how the Hybrid Synthesizer works for each of the configurations. In each the input-materials are selected from the database. Data for real hybrids, too, come from the database. These are used for comparison with the virtual materials created by the Hybrid Synthesizer to illustrate how closely the tool can reproduce known properties; as a way of validating its procedures. The ultimate motivation of the Hybrid Synthesizer, however, extends beyond this: it is to stimulate innovation by allowing novel hybrid combinations to be explored rapidly.
All material data drawn from the database are labeled in black. All those created by the Hybrid Synthesizer are labeled in red.
The Hybrid Synthesizer 3 Version 1.1 © Granta Design Ltd, January 2011

Figure 3: The upper part of the figure shows the input window for Cellular Structures, set at Foam. The starting material, cross-linked LDPE, is identified on the chart below. The yellow ellipses show the computed Young’s moduli of cross-linked PE foams with the relative densities (in brackets) corresponding to those set in the input window. The green ellipses show data for real cross-linked LDPE foams.
The Hybrid Synthesizer 4 Version 1.1 © Granta Design Ltd, January 2011

Figure 4: The input window of the Hybrid Synthesizer, set for Cellular Structures–Octet lattice. The chart shows some of the output. The starting material, Al 20% SiC(p) appears at the upper right. The line of yellow ellipses with red labels show the moduli and densities of foams made from Al–SiC(p). They should be compared with the measured values for real aluminum SiC(p) foams, shown in red with black labels. The relative densities are listed in brackets. The moduli and densities of lattices made of the same material are shown in green for comparison.
The Hybrid Synthesizer 5 Version 1.1 © Granta Design Ltd, January 2011
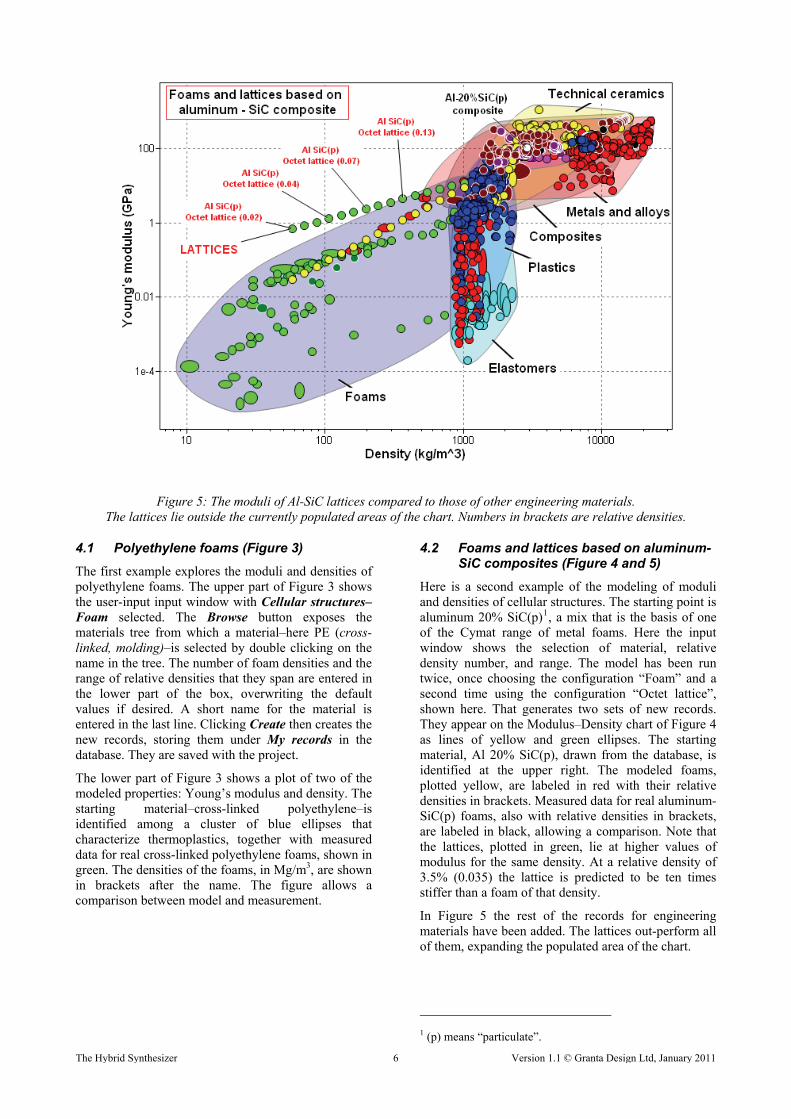
Figure 5: The moduli of Al-SiC lattices compared to those of other engineering materials. The lattices lie outside the currently populated areas of the chart. Numbers in brackets are relative densities.
4.1 Polyethylene foams (Figure 3) 4.2 Foams and lattices based on aluminum-SiC composites (Figure 4 and 5)
The first example explores the moduli and densities of polyethylene foams. The upper part of Figure 3 shows the user-input input window with Cellular structures–Foam selected. The Browse button exposes the materials tree from which a material–here PE (cross-linked, molding)–is selected by double clicking on the name in the tree. The number of foam densities and the range of relative densities that they span are entered in the lower part of the box, overwriting the default values if desired. A short name for the material is entered in the last line. Clicking Create then creates the new records, storing them under My records in the database. They are saved with the project.
Here is a second example of the modeling of moduli and densities of cellular structures. The starting point is aluminum 20% SiC(p)1, a mix that is the basis of one of the Cymat range of metal foams. Here the input window shows the selection of material, relative density number, and range. The model has been run twice, once choosing the configuration “Foam” and a second time using the configuration “Octet lattice”, shown here. That generates two sets of new records. They appear on the Modulus–Density chart of Figure 4 as lines of yellow and green ellipses. The starting material, Al 20% SiC(p), drawn from the database, is identified at the upper right. The modeled foams, plotted yellow, are labeled in red with their relative densities in brackets. Measured data for real aluminum-SiC(p) foams, also with relative densities in brackets, are labeled in black, allowing a comparison. Note that the lattices, plotted in green, lie at higher values of modulus for the same density. At a relative density of 3.5% (0.035) the lattice is predicted to be ten times stiffer than a foam of that density.
The lower part of Figure 3 shows a plot of two of the modeled properties: Young’s modulus and density. The starting material–cross-linked polyethylene–is identified among a cluster of blue ellipses that characterize thermoplastics, together with measured data for real cross-linked polyethylene foams, shown in green. The densities of the foams, in Mg/m3, are shown in brackets after the name. The figure allows a comparison between model and measurement.
In Figure 5 the rest of the records for engineering materials have been added. The lattices out-perform all of them, expanding the populated area of the chart.
1 (p) means “particulate”.
The Hybrid Synthesizer 6 Version 1.1 © Granta Design Ltd, January 2011

Figure 6: The input window of the Hybrid Synthesizer, set for Cellular Structures–Foam, and selecting a phenolic casting resin as the input material. The yellow ellipses with red labels show the computed thermal conductivities of foams made from phenolic casting resin, compared with the measured conductivities of real phenolic foams. The relative densities are shown in brackets.
The Hybrid Synthesizer 7 Version 1.1 © Granta Design Ltd, January 2011
Increased performance
3
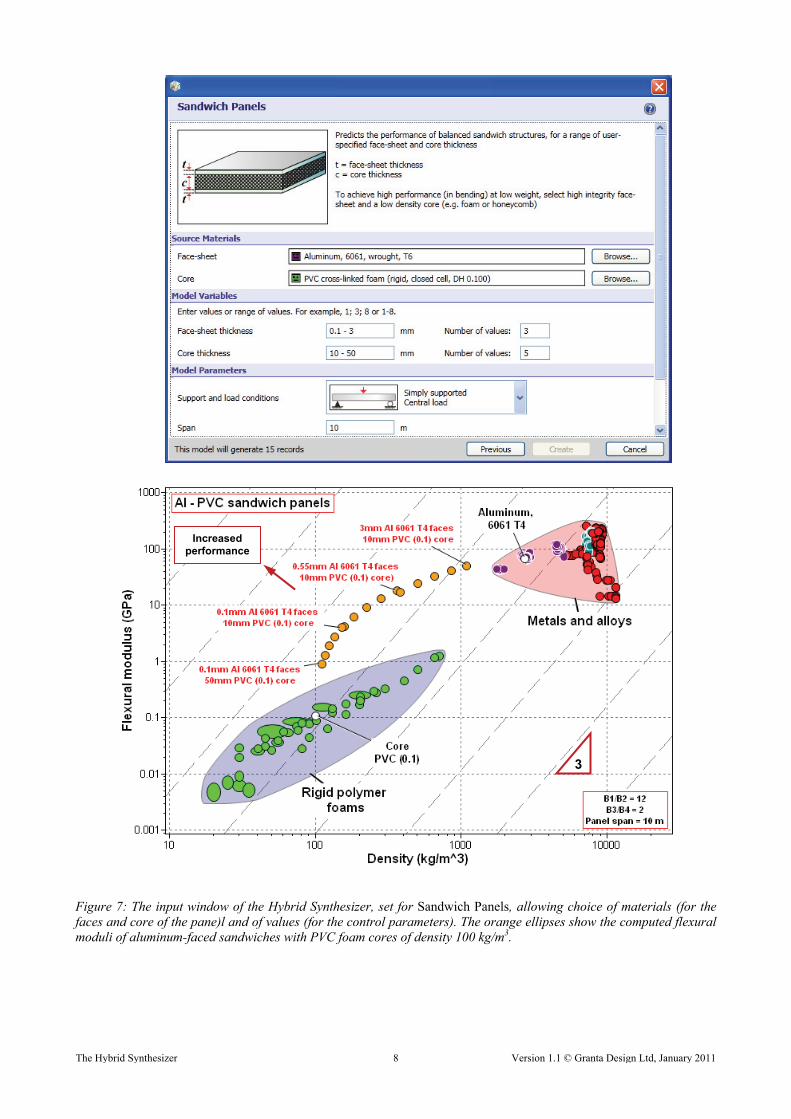
Figure 7: The input window of the Hybrid Synthesizer, set for Sandwich Panels, allowing choice of materials (for the faces and core of the pane)l and of values (for the control parameters). The orange ellipses show the computed flexural moduli of aluminum-faced sandwiches with PVC foam cores of density 100 kg/m3.
The Hybrid Synthesizer 8 Version 1.1 © Granta Design Ltd, January 2011

4.3 Phenolic foams for thermal insulation (Figure 6)
This is a third example of the use of the Cellular Structures configuration, this time to explore a thermal property, the thermal conductivity of phenolic foams. The input window at the top of Figure 6 shows the material choice–a phenolic casting resin–and the number and range of relative density. The bulk resin is identified in the upper right of the chart. Yellow ellipses show the predicted thermal conductivities of foams made from this polymer, labeled in red with relative densities shown in brackets. The database contains measured data for a number of phenolic foams. These are plotted as blue ellipses, labeled in black with relative density in brackets, allowing a comparison of model predictions with data for real foams
4.4 Stiff sandwich structures: Aluminum-faced PVC foam-cored sandwiches (Figure 7 and 8)
The input window in the upper part of Figure 7 shows the required inputs. It asks for two materials from the database, one for the face sheets and one for the core. In designing sandwich panels and shells it makes sense to choose stiff, strong materials for the thin faces and lightweight materials for the core, the role of which is to separate the faces and carry shear stresses. The model equations will, however, work for other choices.
Here the choice of materials for faces is 6061 T4 aluminum alloy. A PVC foam with a density of 100 kg/m3 (0.1 Mg/m3) is used for the core. The face-sheet thickness is varied from 0.1 to 3 mm in three (logarithmic) steps. For each of these there are five thicknesses of core, ranging from 10 mm to 50 mm. The choice of support and load conditions are selected from the drop-down menu (determining the loading constants B1/B2 and of B3/B4: they are explained in the Appendices). Here, a simply supported panel with a central load is selected. The final parameter is the span of the panel. The default value is set at 10 m.
The chart in the lower part of the figure shows the flexural modulus and density of this set of panels. The face-sheet material is identified at the top right, the core material at the lower left. As before, data drawn from the database are labeled in black; those that are modeled are labeled in red. The sandwich panels lie on an arc linking the two.
How good are they? Here we need a criterion of excellence. The index M for selecting materials for a light, stiff panel is
31
flexEM
which plots as a set of lines of slope 3 on Figure 7 (here
is the flexural modulus and flexE is the density). A
contour that is tangent to the arc of sandwiches identifies the optimum choice of face and core thicknesses.
In Figure 8 the rest of the records (excluding natural materials) has been added. The best of the sandwiches ranks more highly than any other material by this criterion. The chart illustrates how effectively sandwich structures can populate holes in material-property space.
4.5 Strong sandwich structures: aluminum-faced PVC foam-cored sandwiches (Figure 9)
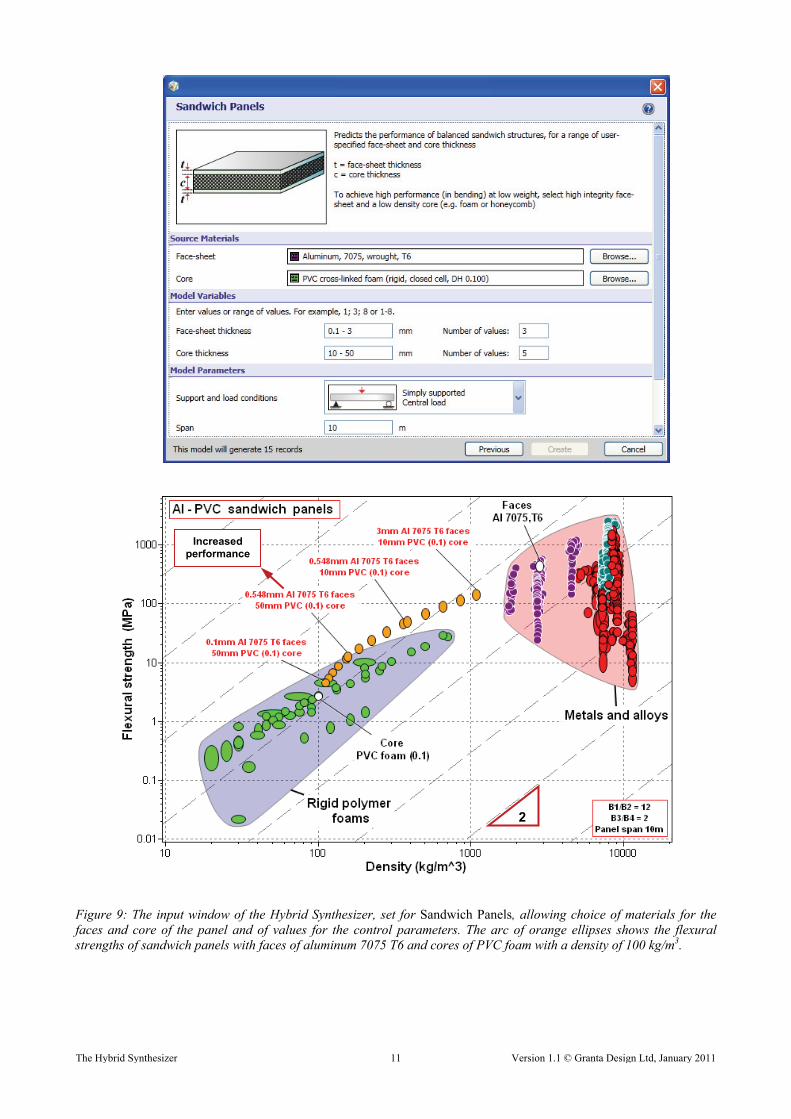
Here is an example in which strength, rather than stiffness, is explored. The input window in the upper part of Figure 9 shows the required inputs. The core, PVC foam with a density of 100 kg/m3, is the same as that of the previous two figures. The face-sheet material, in this case, is a high strength aluminum alloy: 7075 in the T6 condition. The other parameters are set at the same values as in Example 4.4.
The chart in the lower part of the figure shows the flexural strength and density of this set. The face-sheet material is identified at the top right, the core material at the lower left. As before, data drawn from the database are labeled in black; those that are modeled are labeled in red. The sandwich panels lie on an arc linking the two.
The criterion for selecting materials for a light, strong panel is the index
21
flexM
which plots as a set of lines of slope 2 on Figure 9
(here flex is the flexural strength). In this example,
too, sandwiches perform exceptionally well.
4.6 Sandwich structures: simulating Aluminum / Polyethylene sandwiches (Figure 10)
This aluminum composite material (Alcubond; Architecks; Alutile; Alucolor; Etalbond) is a sandwich of two sheets of aluminum (of thickness between 0.3–1.0 mm) bonded to a solid thermoplastic core, commonly polyethylene. The resulting material combines the durability and strength of aluminum with the low density and flexibility of the polymer core. Data are available for a sandwich with Al 3105 sheet faces of thickness 0.5 mm with a solid polyethylene core of thickness 3.0 mm. Thermal and electrical resistivities are quoted perpendicular to the board. In this example the properties of such sandwiches are synthesized and compared with the measured data.
The input window of Figure 10 shows the choice of materials: ten thicknesses of 3105 aluminum faces bonded to a 3 mm core of HD polyethylene. The chart in the lower part of Figure 10 compares the predicted flexural moduli and densities with that of the Alcubond panel. The properties are well predicted. A systematic comparison reveals that in-plane modulus, through-thickness thermal conductivity and electrical
The Hybrid Synthesizer 9 Version 1.1 © Granta Design Ltd, January 2011

Increased performance
3
Figure 8: The same set of aluminum-faced sandwiches with PVC foam cores shown in Figure 7, with 2800 other materials of engineering for comparison. The sandwiches expand the filled part of the space.
resistivity are all predicted well. The flexural strength is underestimated by a factor of 1.5 for reasons that, at this point, are not fully understood.
4.7 Composites: Epoxy / S-glass UD and quasi-isotropic laminates (Figure 11)
The input window of Figure 11 shows the choice of materials: an epoxy matrix reinforced with ten different volume fractions of S-glass fibers. The Hybrid Synthesizer has been run twice, once using the configuration Composite–Uni-directional laminate and once using Composite–Quasi-isotropic laminate, generating two sets of virtual materials. The modulus-density chart of Figure 11 shows the position of epoxy and S-glass. The arcs of ellipses plot the calculate moduli of UD laminates parallel to the fibers (blue ellipses) and the in-plane moduli of quasi-isotropic laminates (green ellipses). Computed data are labeled in red. The points at 53.4% S-glass should be compared with the measured data from database for 50% UD and quasi-isotropic laminates.
4.8 Composites: magnesium / carbon and magnesium / Saffil quasi-isotropic laminates (Figure 12)
The input window of Figure 12 shows the choice of quasi-isotropic configuration. The Hybrid Synthesizer was run once with inputs of magnesium AZ61 for the matrix and Saffil RG alumina fibers for the reinforcement, then run a second time with very high modulus (VHM) carbon fibres replacing Saffil. The modulus-density chart below plot the properties of a number of advanced fibers, among them the two used here. The matrix, AZ61, is identified. The arcs of ellipses show the predicted properties of the composites.
The criterion of excellence for selecting materials for a stiff beam of minimum weight is:
21EM
This plots as a grid of lines of slope 2 on the chart. The striking result is that the magnesium / carbon composites are strung out roughly normal to the grid: they offer a large gain in performance as measured by this criterion. By contrast the magnesium / Saffil composites are strung out parallel to the grid: they offer no gain in performance whatever.
The Hybrid Synthesizer 10 Version 1.1 © Granta Design Ltd, January 2011
Increased performance
2
Figure 9: The input window of the Hybrid Synthesizer, set for Sandwich Panels, allowing choice of materials for the faces and core of the panel and of values for the control parameters. The arc of orange ellipses shows the flexural strengths of sandwich panels with faces of aluminum 7075 T6 and cores of PVC foam with a density of 100 kg/m3.
The Hybrid Synthesizer 11 Version 1.1 © Granta Design Ltd, January 2011

Figure 10: The input window of the Hybrid Synthesizer, set for Sandwich Panels, allowing choice of materials for the faces and core of the panel and of values for the control parameters. The arc of orange ellipses shows the flexural moduli of sandwich panels with faces of aluminum 3025 and a 3 mm core of solid polyethylene.
The Hybrid Synthesizer 12 Version 1.1 © Granta Design Ltd, January 2011

Figure 11: The input window of the Hybrid Synthesizer, set for Composites–Quasi-isotropic laminate. It is used to explore the properties of both epoxy / S-glass UD and quasi-isotropic laminates. The epoxy matrix and S-glass reinforcement are identified. The UD laminates appear as an arc of blue ellipses, the quasi-isotropic laminates as an arc of green. Data for real epoxy / 50% S-glass composites are plotted for comparison.
The Hybrid Synthesizer 13 Version 1.1 © Granta Design Ltd, January 2011

Increased performance
2
Figure 12: The input window of the Hybrid Synthesizer, set for Composites–Quasi-isotropic laminates. It is used to explore the properties of magnesium reinforced with Saffil and with VHM carbon fibers. The magnesium / carbon
laminates offer large gain in performance when measured by the index . The magnesium / Saffil laminates
offer none.
/E 2/1
The Hybrid Synthesizer 14 Version 1.1 © Granta Design Ltd, January 2011

Figure 13: The input window of the Hybrid Synthesizer, set for Composites–Particulate reinforcement. It is used to explore particulate composites for heat sinks. The aim is to create a good thermal conductor that has an expansion coefficient that matches that silicon, shown bottom center. Copper with 70% particulate silicon carbide comes closest.
The Hybrid Synthesizer 15 Version 1.1 © Granta Design Ltd, January 2011
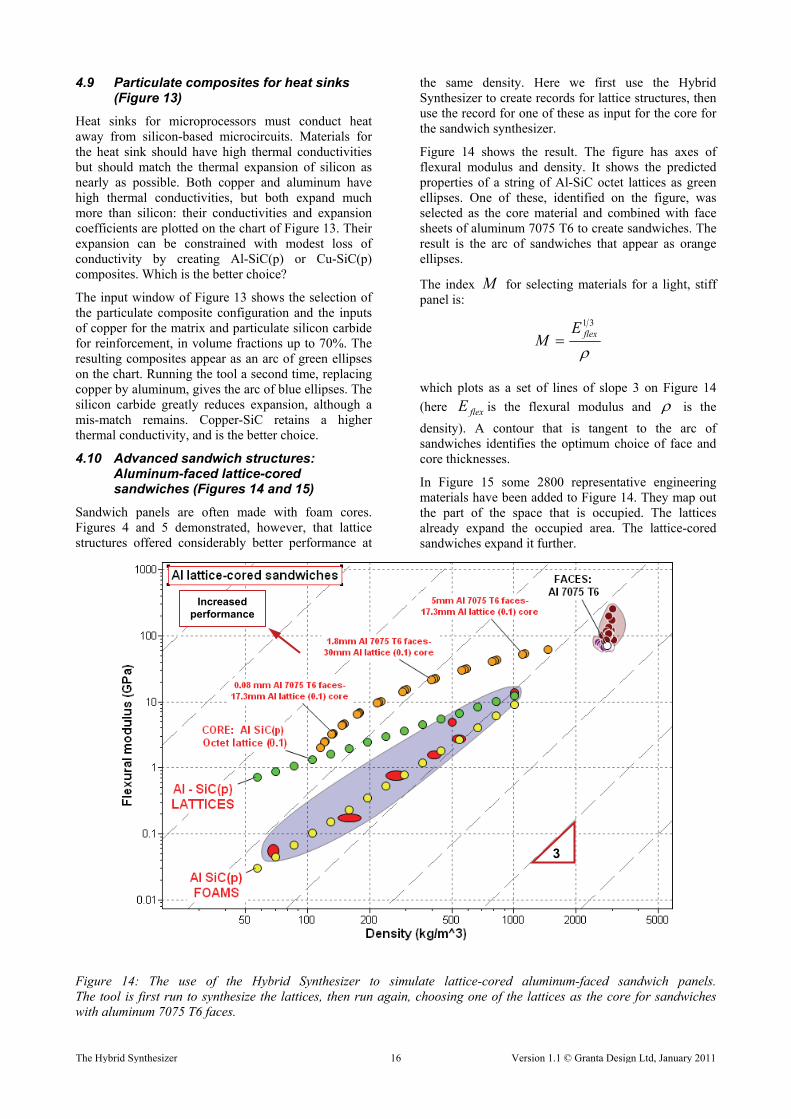
4.9 Particulate composites for heat sinks (Figure 13)
Heat sinks for microprocessors must conduct heat away from silicon-based microcircuits. Materials for the heat sink should have high thermal conductivities but should match the thermal expansion of silicon as nearly as possible. Both copper and aluminum have high thermal conductivities, but both expand much more than silicon: their conductivities and expansion coefficients are plotted on the chart of Figure 13. Their expansion can be constrained with modest loss of conductivity by creating Al-SiC(p) or Cu-SiC(p) composites. Which is the better choice?
The input window of Figure 13 shows the selection of the particulate composite configuration and the inputs of copper for the matrix and particulate silicon carbide for reinforcement, in volume fractions up to 70%. The resulting composites appear as an arc of green ellipses on the chart. Running the tool a second time, replacing copper by aluminum, gives the arc of blue ellipses. The silicon carbide greatly reduces expansion, although a mis-match remains. Copper-SiC retains a higher thermal conductivity, and is the better choice.
4.10 Advanced sandwich structures: Aluminum-faced lattice-cored sandwiches (Figures 14 and 15)
Sandwich panels are often made with foam cores. Figures 4 and 5 demonstrated, however, that lattice structures offered considerably better performance at
the same density. Here we first use the Hybrid Synthesizer to create records for lattice structures, then use the record for one of these as input for the core for the sandwich synthesizer.
Figure 14 shows the result. The figure has axes of flexural modulus and density. It shows the predicted properties of a string of Al-SiC octet lattices as green ellipses. One of these, identified on the figure, was selected as the core material and combined with face sheets of aluminum 7075 T6 to create sandwiches. The result is the arc of sandwiches that appear as orange ellipses.
The index M for selecting materials for a light, stiff panel is:
31flexE
M
which plots as a set of lines of slope 3 on Figure 14
(here is the flexural modulus and flexE is the
density). A contour that is tangent to the arc of sandwiches identifies the optimum choice of face and core thicknesses.
In Figure 15 some 2800 representative engineering materials have been added to Figure 14. They map out the part of the space that is occupied. The lattices already expand the occupied area. The lattice-cored sandwiches expand it further.
Increased performance
3
Figure 14: The use of the Hybrid Synthesizer to simulate lattice-cored aluminum-faced sandwich panels. The tool is first run to synthesize the lattices, then run again, choosing one of the lattices as the core for sandwiches with aluminum 7075 T6 faces.
The Hybrid Synthesizer 16 Version 1.1 © Granta Design Ltd, January 2011

5 Summary: what the Hybrid Synthesizer can and can’t do.
The Hybrid Synthesizer is a scoping tool that allows fast exploration of hybrid structures. It presents approximate analyses of the properties that might be achieved by forming a single material into a cellular structure or by combining two materials to form a sandwich or a composite. The starting material data are drawn either from the MaterialUniverse database, which is integrated into the tool, or from user-defined records (created with the “Add record” facility in CES Selector or created by the tool itself), allowing hierarchical materials design. The Hybrid Synthesizer currently allows the choice six configurations and the input of the parameters that characterize them. The ten examples of Section 4 illustrate its capabilities.
The initial release of this tool is expected to generate feed-back and ideas. Its longer-term purpose is to encourage innovation by allowing estimated property-profiles for virtual novel hybrids to be explored and compared with the property-profiles of established engineering materials. There remains the problem of making them–the central challenge of processing. That, at present, is beyond its capabilities.
Increased performance
3
Figure 15: The same data and axes as Figure 13, with 2800 other engineering materials added for comparison. The lattice-cored sandwiches offer significant gain in performance.
The Hybrid Synthesizer 17 Version 1.1 © Granta Design Ltd, January 2011

6 Appendices: The equations used by the Hybrid Synthesizer
A1. Cellular structures: foams and lattices2
Cellular structures–foams and lattices–are hybrids of a solid and a gas. The properties of the gas might at first sight seem irrelevant, but this is not so. The thermal conductivity of low-density foams of the sort used for insulation is determined by the conductivity of the gas contained in its pores; and the dielectric properties, and even the compressibility, can depend on the gas properties.
There are two distinct species of cellular solid. The first, typified by foams, are bending-dominated structures; the second, typified by triangulated lattice structures, are stretch dominated–a distinction explained more fully below.
Foams are cellular solids made by expanding polymers, metals, ceramics or glasses with a foaming agent: a generic term for one of many ways of introducing gas, much as yeast does in bread-making. Figure A1 shows an idealized cell of a low-density foam. It consists of solid cell walls or edges surrounding a void space containing a gas or fluid. Foams have the characteristic that, when loaded, the cell walls bend. Lattice-structures (Figure A2) are configured to suppress bending, so the cell edges have to stretch instead.
Figure A1: A cell in a low density foam. When the foam is loaded, the cell edges bend, giving a low-modulus structure.
Figure A2: A micro-truss structure and its unit cell. The cell edges stretch when the structure is loaded, making it stiffer and stronger than a foam of the same density.
2 Principal sources: Gibson and Ashby (1997), Deshpande et al (2001), Ashby et al (2000), Ashby (2006).
Density
Cellular solids are characterized by their relative density, which for the structure shown here (with t << L) is:
2
1
~
L
tC
s
(A.1)
where ~ is the density of the foam, s is the density
of the solid of which it is made, L is the cell size, t is the thickness of the cell edges and is a constant,
approximately equal to 1. 1C
Mechanical properties
The compressive stress-strain curve of a cellular solid looks like Figure A3. The material is linear elastic,
with modulus E~
up to its elastic limit, at which point the cell edges yield, buckle or fracture. The foam continues to collapse at a nearly constant stress (the
“plateau stress”, pl~ ) until opposite sides of the cells
impinge (the “densification strain” d~ ), when the
stress rises rapidly. The mechanical properties are calculated in the ways developed below (details in the texts in Further Reading).
Elastic moduli of bending-dominated foams. A remote compressive stress exerts a force
on the cell edges, causing them to bend and
leading to a bending deflection
2LF , as shown in
Figure A1. For the open-celled structure shown in the figure, the bending deflection scales as:
IE
LF
s
3 (A.2)
Figure A3: The modulus is determined by cell edge bending or stretching. The plateau stress is determined by buckling, plastic bending or fracturing of the cell walls.
The Hybrid Synthesizer 18 Version 1.1 © Granta Design Ltd, January 2011

where is the modulus of the solid of which the foam
is made and
sE
12
tI
4 is the second moment of area of the
cell edge of square cross section, t x t. The compressive strain suffered by the cell as a whole is then L/2 . Assembling these results gives the modulus
/E~ of the foam as:
s
2
s2 E
~CE
~
(A.3)
(bending-dominated behavior)
Since sEE~ when s
~ , we expect the constant
of proportionality to be close to unity–a speculation
confirmed by experiment. Numerical simulation gives , the value used in the Hybrid Synthesizer. The
quadratic dependence means that a small decrease in relative density causes a large drop in modulus. When the cells are equiaxed in shape, the foam properties are isotropic with shear modulus, bulk modulus, and Poisson’s ratio via:
2C
7.0C1
E~
8
3G~ , , EK
~~
3
1 (A.4)
Elastic moduli of stretch-dominated lattices. The structure shown in Figure A2, is fully triangulated. This means that the cell edges must stretch when the structure is loaded elastically. On average one third of its edges carry tension when the structure is loaded in simple tension, regardless of the loading direction. Thus:
ss
3 E~
CE~
(A.5) (stretch-dominated behavior)
with . The modulus is linear, not quadratic,
in density giving a structure that is stiffer than a foam of the same density. The structure of Figure A4 is almost isotropic, so we again approximate the shear modulus, bulk modulus and Poisson’s ratio by Equation A.4.
3/1C3
Yield strength, flexural strength and compressive strength
Strength of bending-dominated foams. When the structure of Figure A1 is loaded beyond the elastic limit, its cell walls may yield, buckle elastically or fracture as shown in Figure A4. Consider yielding first (Figure A4a): cell edges yield when the force exerted on them exceeds their fully plastic moment:
4
tM
3s,y
f
(A.6)
where is the yield strength of the solid of which the
foam is made. This moment is related to the remote
stress by .
s,y
M 3LFL
Figure A4: Collapse of foams. (a) When a foam made of a plastic materials loaded beyond its elastic limit, the cell edges bend plastically. (b) An elastomeric foam, by contrast, collapses by the elastic buckling of its cell edges. (c) A brittle foam collapses by the successive fracturing of cell edges.
Assembling these results gives the compressive failure strength when yield dominates, c
~ :
s,y
2/3
s4c
~C~
(A.7) (yield of foams)
where the constant of proportionality, 4C 0.3, has
been established both by experiment and by numerical computation.
Elastomeric foams collapse not by yielding but by elastic bucking; brittle foams by cell-wall fracture (Figures A4 (b) and (c)). As with plastic collapse, simple scaling laws describe this behavior well. Collapse by buckling occurs when the stress exceeds
s
2
sc E
~05.0~
(A.8) (buckling of foams)
We identify the compressive strength c~ with the
lesser of equations A.7 and A.8. We further set the yield strength y
~ and the flexural strength
flex~ equal to c
~ .
Strength of stretch-dominated lattices. Collapse occurs when the cell edges yield, giving the collapse stress:
s,ys
c
~
3
1~
(A.9) (yield of lattices)
The Hybrid Synthesizer 19 Version 1.1 © Granta Design Ltd, January 2011

This is an upper bound since it assumes that the struts yield in tension or compression when the structure is loaded. If the struts are slender, they may buckle before they yield. They do so at the stress:
s
2
sc E
~2.0~
(A.10)
We identify the compressive strength c~ with the lesser
of equations A.9 and A.10. We further identify the yield strength y
~ and the flexural strength flex~ with c
~ .
Fracture toughness
Fracture toughness of bending-dominated foams. Foams that contain crack-like flaws which are long compared to the cell size fail by fast fracture. This means the crack propagates unstably if the stress intensity factor exceeds
the critical value
c1K~
, which is the lesser of:
s,c1
2/3
s
2/1
c1 K~
a5.0K
~
and (A.11) scK ,1
Here is the intrinsic flaw size of the material, of the cell edges, is its fracture toughness and
a
s,c1K s,ts is its
tensile strength. Typically , the default value
used in the Hybrid Synthesizer.
10a/
This behavior is not confined to open-cell foams. Most closed-cell foams also follow these scaling laws, at first sight an unexpected result because the cell faces must carry membrane stresses when the foam is loaded, and these should lead to a linear dependence of both stiffness and strength on relative density. The explanation lies in the fact that the cell faces are very thin; they buckle or rupture at stresses so low that their contribution to stiffness and strength is small, leaving the cell edges to carry most of the load.
Fracture toughness of stretch-dominated lattices. Lattices that contain crack-like flaws which are long compared to the cell size fail by fast fracture if the
stress intensity factor exceeds the critical value
c1K~
,
which is the lesser of :
s,c1s
2/1
c1 K~
a5.0K
~
and (A.12) s,c1K
a/ is the ratio of the cell size of the foam to the flaw size in the material. A default value , is used
in the Hybrid Synthesizer.
10a/
Thermal properties
Specific heat and thermal expansion. The specific heat
pC~
of foams and lattices (units: J/kg.K) and the
expansion coefficient ~ (units K-1) are the same as those of the solid of which they are made.
Thermal conductivity. The cells in most cellular structures are sufficiently small that convection of the gas within them is completely suppressed. The thermal conductivity of the foam is then the sum of that conducted thought the cell walls and that through the still air (or other gas) they contain. To an adequate approximation
gs
s
2/3
s
~
s
~12
~
3
1~
(A.13)
where s is the conductivity of the solid and that
of the gas (for dry air it is 0.025 W/m.K). The term associated with the gas is important: blowing agents for foams intended for thermal insulation are chosen to have a low value of .
g
g
Electrical properties
Resistivity. The electrical resistivity, elec~ of a foam
is given by
s,elec2/3
ss
elec~
3
2
~
~
(A.14)
Dielectric properties. Insulating foams are attractive for their low dielectric constant, r
~ , falling towards 1
(the value for air or vacuum) as the relative density decreases:
s s,rr
~11~
(A.15)
where s,r is the dielectric constant of the solid of
which the foam is made. The dielectric loss tangent is independent of foam density and just equal to that of the solid of which the foam is made.
The Hybrid Synthesizer 20 Version 1.1 © Granta Design Ltd, January 2011

A2. Sandwich structures A sandwich panel epitomizes the concept of a hybrid. It combines two materials in a specified geometry and scale, configured such that one forms the faces, the other the core, to give a structure of high bending stiffness and strength at low weight (Figure A5). The separation of the faces by the core increases the moment of inertia of the section, I, and its section modulus, Z, producing a structure that resists bending and buckling loads well. Sandwiches are used where weight-saving is critical: in aircraft, trains, trucks, cars, portable structures, and in sports equipment. Nature, too, makes use of sandwich designs: sections through the human skull, the wing of a bird, and the stalk and leaves of many plants show a low-density foam-like core separating solid faces3.
The faces, each of thickness t, carry most of the load, so they must be stiff and strong; and they form the exterior surfaces of the panel so they must also tolerate the environment in which they operate. The core, of thickness c, occupies most of the volume. It must be light, stiff, and strong enough to carry the shear stresses necessary to make the whole panel behave as a load bearing unit. (If the core is much thicker than the faces these stresses are small.)
A sandwich as a “material”
So far we have spoken of the sandwich as a structure: faces of material A supported on a core of material B, each with its own density, modulus, and strength. But we can also think of it as a material with its own set of properties. This is useful because it allows comparison with more conventional materials. To do this we calculate equivalent material properties for the sandwich, identifying them, as with composites, by a
tilde (e.g. E~
,~ ). The quantities ~ and E~
can be
plotted on the modulus-density chart, allowing a direct comparison with all the other materials on the chart. All the constructions using material indices apply unchanged. We base the analysis on the symmetric sandwich with the dimensions defined in Figure A5. The symbols that appear in this section are defined in Table A1.
Density
The equivalent density of the sandwich (its mass divided
by its volume) is:
cf f1f~ (A.16)
Here is the volume fraction occupied by the faces: f
d/t2f .
3 The books by Allen (1969), Zenkert (1995) Gibson and Ashby (1997) and Ashby et al (2000) give introductions to the design of sandwich panels for engineering applications. That by Gibson et al (2010) does the same for their use in nature.
Figure A5: The sandwich. The face thickness is t, the core thickness c and the panel thickness d.
Mechanical properties
Sandwich panels are designed to be stiff and strong in bending. In thinking of the panel as a “material” we must therefore distinguish the in-plane modulus and strength from those in bending. The effective in-plane
modulus, planeinE~
and strength planein are
given, to an adequate approximation, by the rule of mixtures.
In-plane and through-thickness moduli are simply the arithmetic and harmonic means of the components:
cf Ef1fEE~
(in-plane) (A.17)
cftt E/)f1(E/f
1E
(A.18) (through thickness)
Equivalent flexural modulus. The flexural properties are quite different. The flexural compliance (the reciprocal of the stiffness) has two contributions, one from the bending of the panel as a whole, the other from the shear of the core (Figure A6). They add. The bending stiffness is:
c
3
f33 E
12
bcEcd
12
bEI
The shear stiffness is:
c
2G
c
bdAG
Summing deflections gives:
c2
2c3
f33
1
3
bGdB
PLc
EcEcdbB
PL12
(A.19)
The Hybrid Synthesizer 21 Version 1.1 © Granta Design Ltd, January 2011

Here the dimensions, d, c, t and L are identified in Figure A5, is Young’s modulus of the face sheets and is
the shear modulus of the core. The load configuration determines the constant values (B1, B2, B3 and B4) as summarized in Table A2. Comparison
with
fE cG
bdE~
PL123
3 for the “equivalent” material gives:
Note that, except for the bending-to-shear balancing
term the equivalent property is scale-
independent (as a material property should be); the only variable is the relative thickness of faces and core, . The bending stiffness ( ) is recovered by
forming the
2L/d
f EI
I~
E~
where I~
is the second moment of a
homogeneous panel ( 12/bdI~ 3 ).
c
2
2
1
3
f
c3f
flex G
f1
L
d
B
B
f1E
Ef11E
1
E~
1
(A.20)
Symbol Meaning and usual units
t, c, d Face thickness, core thickness and overall panel thickness (m)
L, b Panel length and width (m)
ma Mass per unit area of the panel (kg/m2)
f = 2t/d Relative volumes occupied by the faces
(1-f) = c/d Relative volume occupied by the core
I Second moment of area (m4)
cf , Densities of face and core material (kg/m3)
~ Equivalent density of panel (kg/m3)
Ef Young’s modulus of the faces (GN/m2)
Ec, Gc Young’s modulus and shear modulus of the core (GN/m2)
flexplanein E~
,E~
Equivalent in-plane and flexural modulus of panel (GN/m2)
f,y Yield strength of faces (MN/m2)
c,flexc,cc,ts,c,y ,, Yield strength, tensile strength, compressive strength and flexural strength of core (MN/m2)
planein~
Equivalent in-plane strength of panel (MN/m2)
3flex2flex1flex~,~,~ Equivalent flexural strength of panel, depending on mechanism of failure (MN/m2)
Table A1: Symbols used in describing sandwich structures.
The Hybrid Synthesizer 22 Version 1.1 © Granta Design Ltd, January 2011
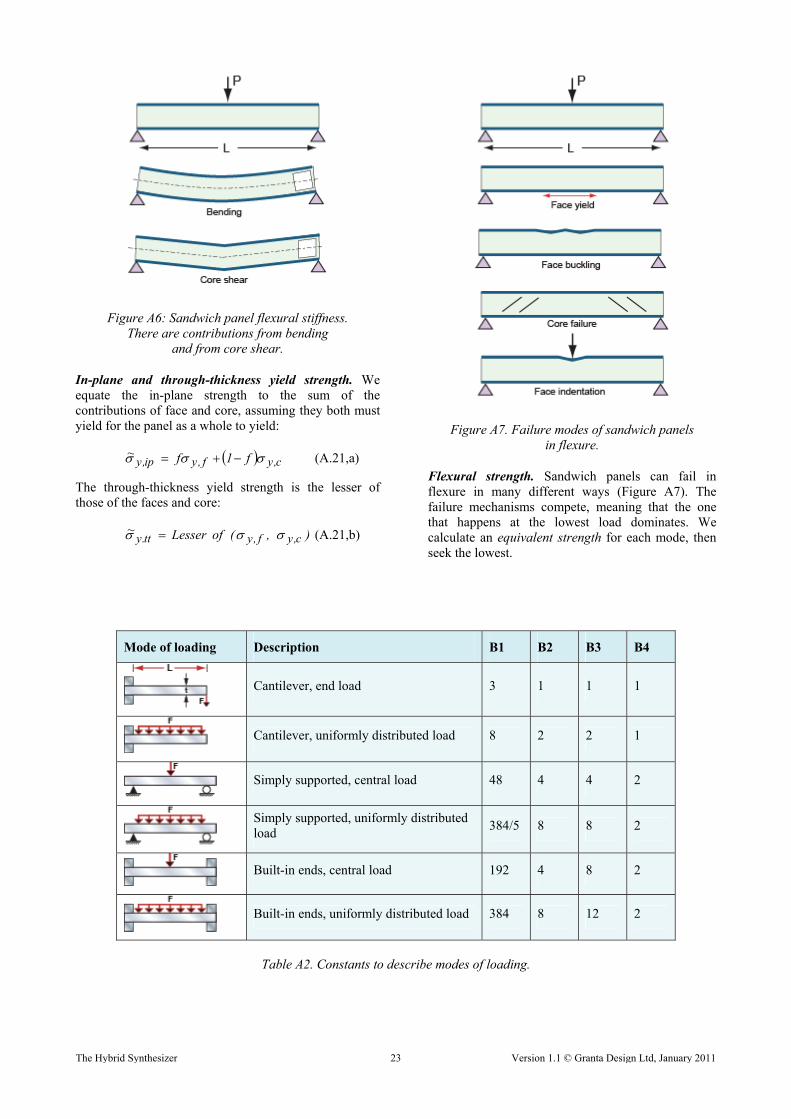
Figure A6: Sandwich panel flexural stiffness. There are contributions from bending
and from core shear.
In-plane and through-thickness yield strength. We equate the in-plane strength to the sum of the contributions of face and core, assuming they both must yield for the panel as a whole to yield:
c,yf,yip,y f1f~ (A.21,a)
The through-thickness yield strength is the lesser of those of the faces and core:
),(ofLesser~c,yf,ytt.y (A.21,b)
Figure A7. Failure modes of sandwich panels in flexure.
Flexural strength. Sandwich panels can fail in flexure in many different ways (Figure A7). The failure mechanisms compete, meaning that the one that happens at the lowest load dominates. We calculate an equivalent strength for each mode, then seek the lowest.
Mode of loading Description B1 B2 B3 B4
Cantilever, end load 3 1 1 1
Cantilever, uniformly distributed load 8 2 2 1
Simply supported, central load 48 4 4 2
Simply supported, uniformly distributed load
384/5 8 8 2
Built-in ends, central load 192 4 8 2
Built-in ends, uniformly distributed load 384 8 12 2
Table A2. Constants to describe modes of loading.
The Hybrid Synthesizer 23 Version 1.1 © Granta Design Ltd, January 2011
Face yield. The fully plastic moment of the sandwich is:
c,flex2
f,y22
f ccd4
b The equivalent flexural strength when face yielding is the dominant failure mode is then:
c,flex2
f,y2
2
f1flex f1f11
db
M4~
(A.22)
which, again, is independent of scale.
Face buckling. In flexure, one face of the sandwich is in compression. If it buckles, the sandwich fails. The face-stress at which this happens is:
(A.23) 3/12cfb EE57.0
The failure moment is then well approximated by: fM
33bf )t2d(d
d6
bM
Equating this to:
6
db~M2
2flexf
Gives:
3/12cf
32flex EE))f1(1(57.0 (A.24)
Core shear. Failure by core shear occurs at the load:
)cL
t(cbBP f,y
2
c,y4f
Here the first term results from shear in the core (shear strength ), the second from the formation of plastic
hinges in the faces. Equating toL c,y
3
23
f~
L4
bdBP
gives the equivalent strength when failure is by shear:
f,y
2c,y
3
43flex ff1
d
L4
B
B~ (A.25)
(The load configuration determines the constant values B3 and B4, as summarized in Table A2.) When the core material is roughly isotropic (as foams are) can be
replaced by
c,y
2/c,c . When it is not (an example is that
of a honeycomb core), must be retained. c,y
Core bending. In the extreme case that face sheets have very low strength, or that the face-sheet thickness is set to zero, the “sandwich” still exhibits the bending strength of the core itself:
cflexflex f ,
24 1~
(A.26)
Indentation. The indentation pressure a/Ppind
is:
c,y2/1
c,yf,yind a
t2p
ab
F
from which we find the minimum face thickness to avoid indentation (Ashby et al 2000).
The flexural strength is set equal to
Greater of 4flex and
(least of 1flex , 2flex and 3flex ).
Indentation has to be treated separately as a constraint on the face-sheet thickness.
Thermal properties
Specific heat. The volumetric specific heat,
pC~~ follows a rule of mixtures:
cf
c,pcfp,fp )f1(f
C)f1(CfC~
(A.27)
Thermal conductivity. The in-plane conductivity is just the sum of the contributions from core and faces:
cfip f1f~ (A.28,a)
The through-thickness conductivity, ~
, is given by
the harmonic mean:
fc
cftt )f1(f
~
(A.28,b)
Expansion coefficient. Thermal expansion in-plane is complicated by the fact that faces and core have different expansion coefficients, but being bonded together, they are forced to suffer the same strain. This constraint leads to an in-plane expansion coefficient of:
cf
ccff// E)f1(Ef
E)f1(Ef~
(A.29,a)
The through-thickness coefficient is simpler; it is given by the weighted mean:
ct2
ct2~ cf
(A.29,b)
The Hybrid Synthesizer 24 Version 1.1 © Granta Design Ltd, January 2011
Through-thickness thermal diffusivity is not a single-valued quantity, but depends on time. At short times heat does not penetrate the core and the diffusivity is that of the face, but at longer times the diffusivity tends to the
value given by the ratio pC~~/
~ .
Electrical properties
Electrical resistivity (through thickness) elec~ :
c,elecf,elecelec )f1(f~ (A.30)
Dielectric constant. The dielectric constant of a sandwich, as with composites, is given by a rule of mixtures: c.rf,rr )f1(f~ (A.31)
provided both f,r c.r exist. If either one does not
exist, leave blank.
Dielectric loss tangent:
c,f, D)f1(fDD~
(A.32)
provided both and exist. If either one does
not exist, leave blank. f,D c,D
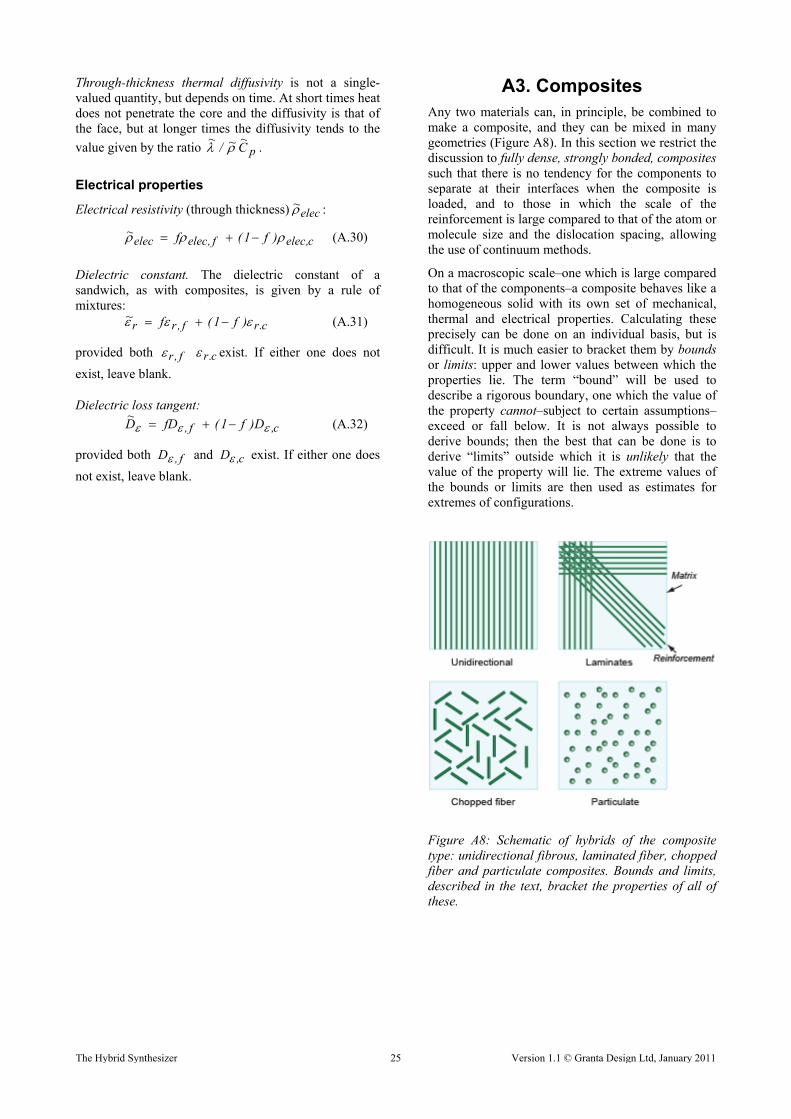
A3. Composites Any two materials can, in principle, be combined to make a composite, and they can be mixed in many geometries (Figure A8). In this section we restrict the discussion to fully dense, strongly bonded, composites such that there is no tendency for the components to separate at their interfaces when the composite is loaded, and to those in which the scale of the reinforcement is large compared to that of the atom or molecule size and the dislocation spacing, allowing the use of continuum methods.
On a macroscopic scale–one which is large compared to that of the components–a composite behaves like a homogeneous solid with its own set of mechanical, thermal and electrical properties. Calculating these precisely can be done on an individual basis, but is difficult. It is much easier to bracket them by bounds or limits: upper and lower values between which the properties lie. The term “bound” will be used to describe a rigorous boundary, one which the value of the property cannot–subject to certain assumptions–exceed or fall below. It is not always possible to derive bounds; then the best that can be done is to derive “limits” outside which it is unlikely that the value of the property will lie. The extreme values of the bounds or limits are then used as estimates for extremes of configurations.
Figure A8: Schematic of hybrids of the composite type: unidirectional fibrous, laminated fiber, chopped fiber and particulate composites. Bounds and limits, described in the text, bracket the properties of all of these.
The Hybrid Synthesizer 25 Version 1.1 © Granta Design Ltd, January 2011
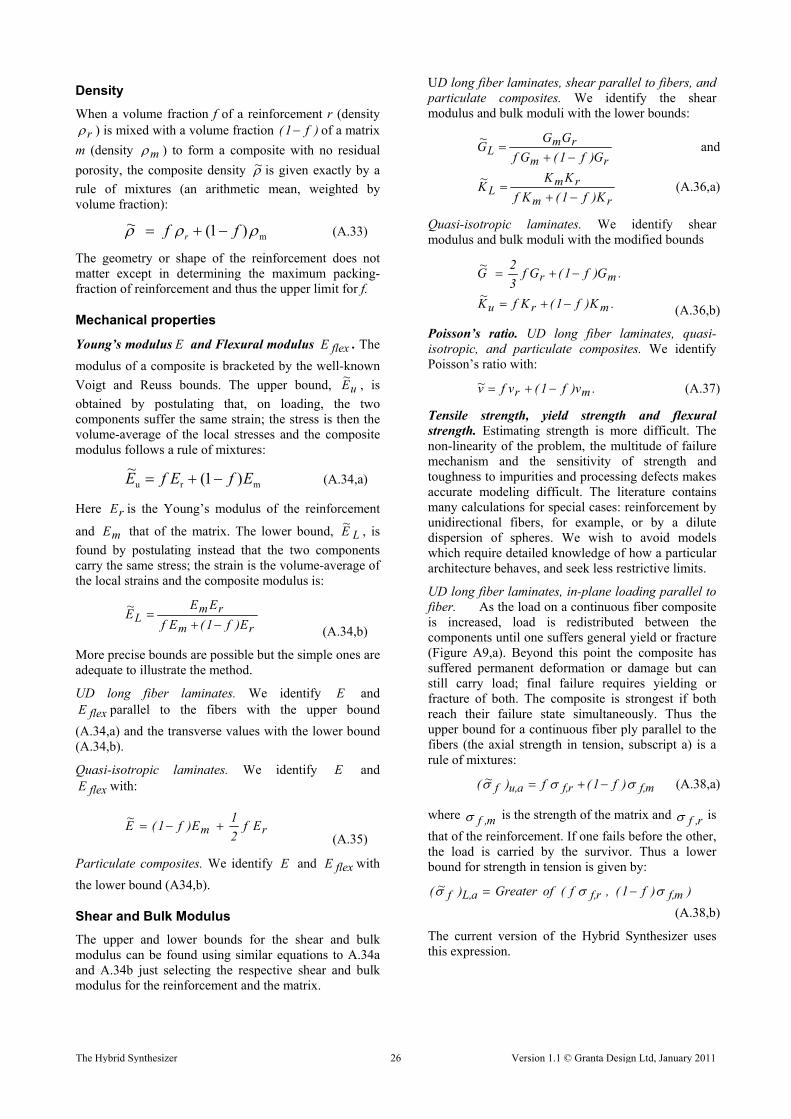
Density
When a volume fraction f of a reinforcement r (density
r ) is mixed with a volume fraction of a matrix
m (density
)f1(
m ) to form a composite with no residual
porosity, the composite density ~ is given exactly by a
rule of mixtures (an arithmetic mean, weighted by volume fraction):
m)1(~ ff r (A.33)
The geometry or shape of the reinforcement does not matter except in determining the maximum packing-fraction of reinforcement and thus the upper limit for f.
Mechanical properties
Young’s modulus and Flexural modulus . The
modulus of a composite is bracketed by the well-known
Voigt and Reuss bounds. The upper bound,
E flexE
uE~
, is
obtained by postulating that, on loading, the two components suffer the same strain; the stress is then the volume-average of the local stresses and the composite modulus follows a rule of mixtures:
mru )1(~
EfEfE (A.34,a)
Here is the Young’s modulus of the reinforcement
and that of the matrix. The lower bound,
rE
mE LE~
, is
found by postulating instead that the two components carry the same stress; the strain is the volume-average of the local strains and the composite modulus is:
rm
rmL E)f1(Ef
EEE~
(A.34,b)
More precise bounds are possible but the simple ones are adequate to illustrate the method.
UD long fiber laminates. We identify E and parallel to the fibers with the upper bound
(A.34,a) and the transverse values with the lower bound (A.34,b).
flexE
Quasi-isotropic laminates. We identify and with:
E
flexE
rm Ef
2
1E)f1(E
~
(A.35)
Particulate composites. We identify and with
the lower bound (A34,b).
E flexE
Shear and Bulk Modulus
The upper and lower bounds for the shear and bulk modulus can be found using similar equations to A.34a and A.34b just selecting the respective shear and bulk modulus for the reinforcement and the matrix.
UD long fiber laminates, shear parallel to fibers, and particulate composites. We identify the shear modulus and bulk moduli with the lower bounds:
rm
rmL G)f1(Gf
GGG~
and
rm
rmL K)f1(Kf
KKK~
(A.36,a)
Quasi-isotropic laminates. We identify shear modulus and bulk moduli with the modified bounds
.G)f1(Gf3
2G~
mr
(A.36,b) .K)f1(KfK~
mru
Poisson’s ratio. UD long fiber laminates, quasi-isotropic, and particulate composites. We identify Poisson’s ratio with:
.v)f1(vfv~ mr (A.37)
Tensile strength, yield strength and flexural strength. Estimating strength is more difficult. The non-linearity of the problem, the multitude of failure mechanism and the sensitivity of strength and toughness to impurities and processing defects makes accurate modeling difficult. The literature contains many calculations for special cases: reinforcement by unidirectional fibers, for example, or by a dilute dispersion of spheres. We wish to avoid models which require detailed knowledge of how a particular architecture behaves, and seek less restrictive limits.
UD long fiber laminates, in-plane loading parallel to fiber. As the load on a continuous fiber composite is increased, load is redistributed between the components until one suffers general yield or fracture (Figure A9,a). Beyond this point the composite has suffered permanent deformation or damage but can still carry load; final failure requires yielding or fracture of both. The composite is strongest if both reach their failure state simultaneously. Thus the upper bound for a continuous fiber ply parallel to the fibers (the axial strength in tension, subscript a) is a rule of mixtures:
mf,rf,au,f )f1(f)~( (A.38,a)
where is the strength of the matrix and is
that of the reinforcement. If one fails before the other, the load is carried by the survivor. Thus a lower bound for strength in tension is given by:
m,f r,f
))f1(,f(ofGreater)~( mf,rf,aL,f
(A.38,b)
The current version of the Hybrid Synthesizer uses this expression.
The Hybrid Synthesizer 26 Version 1.1 © Granta Design Ltd, January 2011

Quasi-isotropic laminates. We identify the upper limit for strength with:
mf,rf,au,f )f1(f4
1)~( (A.39,a)
(based on the assumption that failure means the fracture of the approximately 1/4 of the fibers that lie parallel to the tensile axis, with a contribution from the matrix) and the lower limit with:
))f1(,f4
1(ofGreater)~( mf,rf,aL,f
(A.39,b)
The current version of the Hybrid Synthesizer uses this expression.
Continuous fiber composites can fail in compression by fiber kinking (Figure A9,a, extreme right). The kinking is resisted by the shear strength of the matrix, approximately 2/m,f , requiring an axial stress:
m,fm,f
a,uc 142
1~
(A.40)
Here is the initial misalignment of the fibers from the axis of compression, in radians. Experiments show that a typical value, in carefully aligned composites, is
035 .0 , giving the final value shown on the right of
the equation. We identify the compressive strength with the lesser of this and equation (A.38,a). When, instead,
misalignment is severe, meaning 1 , the strength
falls greatly. We identify the lower bound for compressive failure with that of the matrix, . m,f
Particulate composites and UD laminates loaded transversely. The transverse strength of UD composites and of particulate composites (Figure A9,b) is equally difficult to model. It depends on interface bond-strength, fiber distribution, stress concentrations and the presence of voids. In general the transverse strength is less than that of the unreinforced matrix, and the strain to failure, too, is less. In a continuous, ductile, matrix containing strongly bonded, non-deforming, particles or fibers, the flow in the matrix is constrained. The constraint increases the stress required for flow in the matrix. We base the model on the assumption that the matrix has a fixed failure strain. The reinforcement makes it stiffer so it takes a higher stress to reach the failure strain of the matrix:
m
ry f1(
E
Ef
4
1~
m,y)
m,y
(A.41,a)
This is truncated at the rule of mixtures strength:
r,yy )f1(f~ (A.41,b)
~ ~We set the flexural strength yflex .
Figure A9: Failure modes in composites.
The Hybrid Synthesizer 27 Version 1.1 © Granta Design Ltd, January 2011
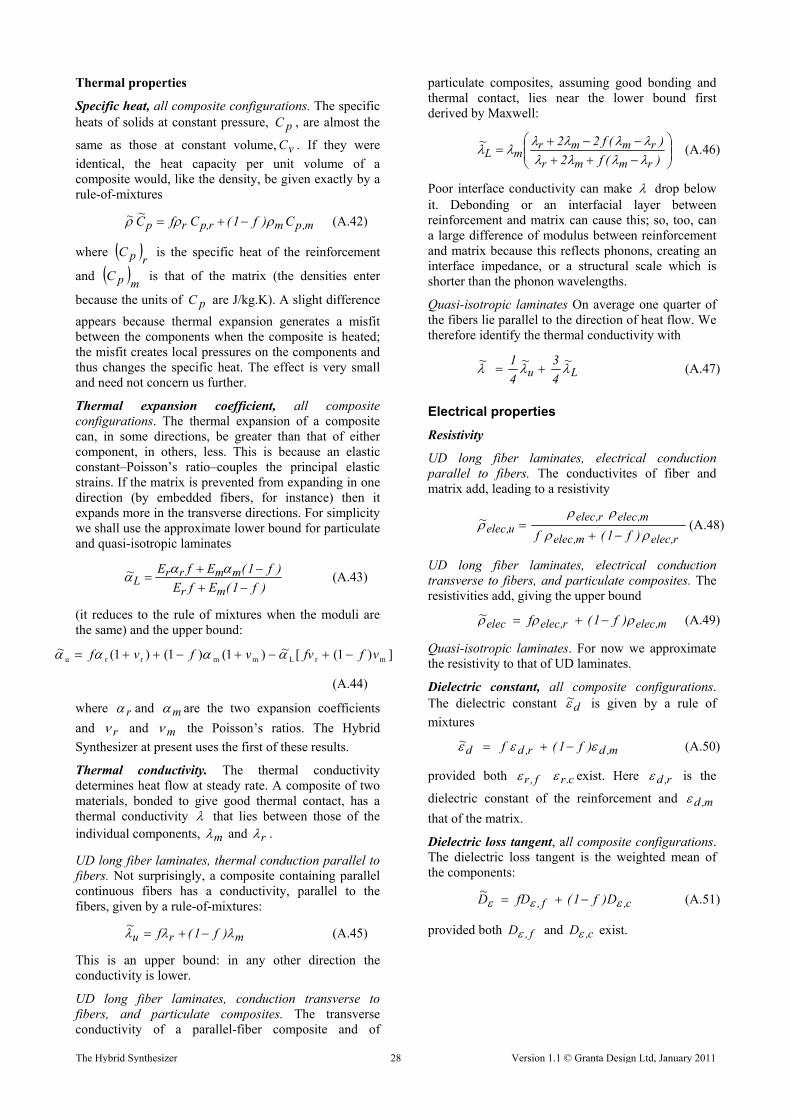
Thermal properties
Specific heat, all composite configurations. The specific heats of solids at constant pressure, , are almost the
same as those at constant volume, . If they were
identical, the heat capacity per unit volume of a composite would, like the density, be given exactly by a rule-of-mixtures
pC
vC
m,pmrp,rp C)f1(CfC~~ (A.42)
where rpC is the specific heat of the reinforcement
and mpC is that of the matrix (the densities enter
because the units of are J/kg.K). A slight difference
appears because thermal expansion generates a misfit between the components when the composite is heated; the misfit creates local pressures on the components and thus changes the specific heat. The effect is very small and need not concern us further.
pC
Thermal expansion coefficient, all composite configurations. The thermal expansion of a composite can, in some directions, be greater than that of either component, in others, less. This is because an elastic constant–Poisson’s ratio–couples the principal elastic strains. If the matrix is prevented from expanding in one direction (by embedded fibers, for instance) then it expands more in the transverse directions. For simplicity we shall use the approximate lower bound for particulate and quasi-isotropic laminates
)f1(EfE
)f1(EfE~
mr
mmrrL
(A.43)
(it reduces to the rule of mixtures when the moduli are the same) and the upper bound:
(A.44)
where r and m are the two expansion coefficients
and r and m the Poisson’s ratios. The Hybrid
Synthesizer at present uses the first of these results.
Thermal conductivity. The thermal conductivity determines heat flow at steady rate. A composite of two materials, bonded to give good thermal contact, has a thermal conductivity that lies between those of the individual components, m and r .
UD long fiber laminates, thermal conduction parallel to fibers. Not surprisingly, a composite containing parallel continuous fibers has a conductivity, parallel to the fibers, given by a rule-of-mixtures:
(A.45) mru )f1(f~
This is an upper bound: in any other direction the conductivity is lower.
UD long fiber laminates, conduction transverse to fibers, and particulate composites. The transverse conductivity of a parallel-fiber composite and of
particulate composites, assuming good bonding and thermal contact, lies near the lower bound first derived by Maxwell:
)(f2
)(f22~
rmmr
rmmrmL
(A.46)
Poor interface conductivity can make drop below it. Debonding or an interfacial layer between reinforcement and matrix can cause this; so, too, can a large difference of modulus between reinforcement and matrix because this reflects phonons, creating an interface impedance, or a structural scale which is shorter than the phonon wavelengths.
Quasi-isotropic laminates On average one quarter of the fibers lie parallel to the direction of heat flow. We therefore identify the thermal conductivity with
Lu~
4
3~
4
1~ (A.47)
Electrical properties
Resistivity
UD long fiber laminates, electrical conduction parallel to fibers. The conductivites of fiber and matrix add, leading to a resistivity
r,elecm,elec
m,elecr,elecu,elec )f1(f
~
(A.48)
UD long fiber laminates, electrical conduction transverse to fibers, and particulate composites. The resistivities add, giving the upper bound
m,elecr,elecelec )f1(f~ (A.49)
Quasi-isotropic laminates. For now we approximate the resistivity to that of UD laminates.
~ ~)1()1()1( ])1([ mrLmmrru vffvvfvf
Dielectric constant, all composite configurations. The dielectric constant d
~ is given by a rule of
mixtures
m,dr,dd )f1(f~ (A.50)
provided both f,r c.r exist. Here r,d is the
dielectric constant of the reinforcement and m,d
that of the matrix.
Dielectric loss tangent, all composite configurations. The dielectric loss tangent is the weighted mean of the components:
c,f, D)f1(fDD~
(A.51)
provided both and exist. f,D c,D
The Hybrid Synthesizer 28 Version 1.1 © Granta Design Ltd, January 2011

7 Further reading
7.1 Hybrid materials–general
Ashby, M.F. (2010) “Materials selection in mechanical design”, 4th edition, Butterworth Heinemann, Oxford, UK
Ashby, M.F. and Brechet, Y. (2003) “Designing hybrid materials”, Acta Materialia, Volume 51, Issue 19, Pages 5801-5821.
Bendsoe, M.P. and Sigmund, O. (2003) “Topology optimization, theory methods and applications” Springer-Verlag, Berlin, Germany. ISBN 3-540-42992-1.
Kromm, F.X., Quenisset, J.M, Harry, R. and Lorriot, T. (2001) “An example of multimaterial design”, Proc Euromat’01, Rimini, Italy.
7.2 Cellular structures
Ashby, M.F. (2006) Phil. Trans. R. Soc. A vol. 364, 15-30
Ashby, M.F., Evans, A.G., Fleck, N.A., Gibson, Lorna J., Hutchinson J.W.and Wadley, H.N.G. (2000) “Metal Foams: a Design Guide” Butterworth Heinemann, Oxford. ISBN 0-7506-7219-6.
Deshpande, V.S. Ashby, M.F. and Fleck, N.A. (2001) “Foam topology: bending versus stretching dominated architectures”, Acta Mater, 49, 1035–1040.
Gibson, L.J. and Ashby, M.F. (1997) “Cellular solids, structure and properties”, 2nd edition, Cambridge University Press, Cambridge, UK . ISBN 0-521-49560-1.
Gibson, L.J., Ashby, M.F. and Harley, B. (2010) “Cellular bio-materials”, Cambridge University Press, Cambridge, UK.
Hutchinson, R.G. and Fleck, N.A. (2006) Journal of the Mechanics and Physics of Solids, 756-782.
7.3 Composites
Ashby, M.F. (1993) “Criteria for selecting the components of composites”, Acta Mater. 41, pp. 1313–1335.
Budiansky, B. and Fleck, N.A. (1993) “Compressive failure of fibre composites”, J. Mech, Phys. Solids, Vol 41, pp. 183–2A.
Chamis, C.C. (1987) in “Engineers Guide to Composite Materials”, pp 3-8–3-24. Am. Soc. Metals, Materials Park, Ohio, USA.
Clyne, T.W. and Withers, P.J. (1993) “An introduction to metal matrix composites” Cambridge University Press, Cambridge, UK. ISBN 0-521-41808-9.
Hull, D and Clyne, T.W. (1996), “An introduction to composite materials”, Cambridge University Press, Cambridge, UK. ISBN 0-521-38855-4.
Schoutens, J.E. and Zarate, D.A. (1986) Composites 17, 188.
Watt, J.P., Davies, G.F. and O’Connell, R.J. (1976), “Reviews of Geophysics and Space Physics”, 14, 541.
7.4 Sandwich structures
Allen, H.G. (1969) “Analysis and design of structural sandwich panels”, Pergamon Press, Oxford, UK.
Ashby, M.F., Evans, A.G., Fleck, N.A., Gibson, Lorna J., Hutchinson J.W.and Wadley, H.N.G. (2000) “Metal Foams: a Design Guide” Butterworth Heinemann, Oxford. ISBN 0-7506-7219-6.
Gill M.C. (2009) “Simplified sandwich panel design” http://www.mcgillcorp.com/doorway/pdf/97_Summer.pdf
Pflug, J (2006) Journal of Sandwich Structures and Materials, Vol. 8, No. 5, 407-421
Pflug, J. Vangrimde, B and Verpoest, I. (2003) “Material efficiency and cost effectiveness of sandwich materials”, Sampe US Proceedings.
Pflug, J. Verpoest, I and Vandepitte, D (2004) SAND.CORE Workshop, Brussels, December.
Wadley, H.N.G., Fleck, N.A. andEvans,A.G. (2003) Composites Science and Technology, 63, 2331–2343.
Zenkert, D. (1995) “An introduction to sandwich construction”, Engineering Advisory Services Ltd.,, Solihull, UK, published by Chameleon Press Ltd., London, UK ISBN 0 947817778.
The Hybrid Synthesizer 29 Version 1.1 © Granta Design Ltd, January 2011