the hurdles analysis as an instrument for improving
TRANSCRIPT

Error! Style not defined. 1
Sustainable Social and Ecosystem Stewardship
International Conference of the Greening of Industry Network
June 15-17, 2007 Wilfrid Laurier University, Waterloo, Ontario, Canada
Edeltraud Guenther, Lilly Scheibe, Vera Farkavcová
The Hurdles Analysis as an instrument for improving sustain-able stewardship
Results of an empirical study of hurdles to green procurement of German industry
Keywords......................................................................................................................... 2
Introduction .................................................................................................................... 3
1 Procurement as Gate-keeper ................................................................................. 4
2 The empirical study................................................................................................ 5
2.1 Motivation ....................................................................................................... 5
2.2 The Search for Reasons – the Hurdles Analysis .......................................... 6
2.3 The Design of the Study ................................................................................. 7 2.3.1 The hurdles catalogue............................................................................... 7 2.3.2 The actors focus........................................................................................ 8 2.3.3 Size focus................................................................................................ 10 2.3.4 Industry focus ......................................................................................... 10
3 Results.................................................................................................................... 10
3.1 Return of the study....................................................................................... 10
3.2 Actors..............................................................................................................11
3.3 Size ................................................................................................................. 13
3.4 Industry ......................................................................................................... 14 3.4.1 Hurdles perception over all industries .................................................... 14 3.4.2 Differences in hurdles perception between the industries ...................... 16
4 Lessons learned from the hurdles analysis for environmental responsibility. 17
References...................................................................................................................... 19
Error! Style not defined. 2
Abstract
Regarding an integrated stewardship of resources, the management of procurement processes can be one important driver. For 25 years efforts to integrate environmental aspects in procurement decisions have been made by legislation or procurement initia-tives. Nevertheless the results are moderate. Therefore, just integrating other sustain-ability issues, like social or generational aspects in procurement decisions, would not promise more success. Moreover, factors capable to hamper, decelerate or even block the integration of sustainability issues in procurement decisions – so-called hurdles – should be analysed first.
This conclusion motivated an empirical study to record the current perception of hur-dles. The questionnaire based survey was conducted in 883 German companies, includ-ing the 500 biggest companies and the medium-sized companies that are members of the “German Association of Materials Management, Purchasing, and Logistics (AMMPL)”. In order to determine existing hurdles, 24 theory based questions from sev-eral areas (legislation, company objectives, knowledge of products and services, costs, motivation) were asked in an explorative design to firstly, compare the perception of hurdles by different actors, secondly, analyse the correlation of company size and hur-dles perception, thirdly, focus on the impact of the industry on the perception of hurdles. To give some results, the study identified hurdles that are perceived significantly higher than others. Moreover, the perception of hurdles differs between the industries, but also within one industry. Finally, medium-sized companies feel more uncertainties, regarding legislation or miss supportive guidelines.
For a continuous integration of stewardship issues in procurement decisions the authors suggest the consequent and offensive reduction of the identified hurdles to further legis-lation or information campaigns initiatives. New sustainability issues should be inte-grated in procurement decision by considering probable hurdles.
Keywords
Environmental responsibility
Hurdles Analysis
Decision analysis
Integration of environmental aspects
Organisational development
Green procurement

Error! Style not defined. 3
Introduction
The requirement to integrate environmental aspects in business and entrepreneurial de-cisions is increasing. Choices made by the organisations, esp. companies, often have far reaching effects and even unknown consequences on the environment so that more and more environmental aspects become urgent for the decisions of companies. Especially regarding already existing shortages and pressures connected with the usage of specific resources (as e.g. oil) and increasing requirements of stakeholders, the integration of environmental aspects gains importance as “stakeholders interested in environmental reporting are placing increasing pressure on companies to be environmentally responsi-ble.”1 Therefore new strategies for managing all these requirements are demanded for. The better organisations do in this task the more they accepted their environmental re-sponsibility – or environmental stewardship – by considering and implementing envi-ronmental and social aspects into organisation’s decision processes.
Environmental responsibility – also environmental stewardship – is the responsibility of environmental quality shared by all those whose actions effect the environment. Besides "stewardship" terms like "sustainability" or "environmental responsibility" are used more commonly to capture many of the same concepts. Therefore the term “environ-mental responsibility” was chosen for this research paper. The idea of sustainable re-sponsibility consists of two parts, the social and the environmental part. The social part of it means that organisations are responsible to their people, which includes all stake-holders.2 They are responsible for the actions of people working with the company as well as for actions that effect people in and outside it. Social responsibility is about holding organization accountable for its effect on the people around it. The second part of sustainable responsibility can be seen as the idea that a company has even more re-sponsibility to the environment and the world around it than an individual. Companies by nature act on a far larger scale than an individual could. Thus, their environmental impacts generally are far greater and have much farther reaching impacts than an indi-vidual consumer could. Therefore the pressure on companies to manage their environ-mental impacts positively is increasing. There are great efforts especially in the Euro-pean Union towards useful legislative pressure, support as well as guidance to make companies consider their environmental aspects and therewith take their responsibility.3
To cope with these requirements companies can have different positions:4
• Compliant position ( companies just fulfil legal requirements) • Informed position (companies fulfil legal requirements but keep informed about
coming changes in this area)
1 Wingard, H. C. (2001), p. 65. 2 Freeman, R. E. (1984), p. 25. 3 Wingard, H. C. (2001), p. 67f, European Parliament and the Council of the European Union (2006), European Par-
liament and the Council of the European Union (2002). 4 Wingard, H. C. (2001), p. 63f.

Error! Style not defined. 4
• Market-driven position (Companies combine legal compliance with voluntary environmental action as long as the market pays for it)
• Competitive advantage position (Companies following this strategy try to change the market by introducing advanced environmental technology and hope to become market leader)
• Sustainability position (Companies with this strategy try to live up to their whole responsibility – economically, environmentally and socially)
Assuming to take its environmental responsibility to be the long-term aim of every company strategies to initiate a continuous improvement of the company’s position up to the sustainable one have to be developed. Thus procurement can be considered an important factor to either get such a development started (i.e. from a compliant position) or to improve it (e.g. to come from a market-driven position to the competitive advan-tage or even to the sustainable position) as the management of procurement processes towards more green procurement can be seen as a good possibility for improving the in-tegration of environmental aspects into company’s decisions and therewith to cope with its responsibility.
1 Procurement as Gate-keeper
Procurement opens up an important possibility for integrating environmental aspects into all processes and all units of a company and hence for reduction of environmental pressure caused by business actions. This can be explained with the change of the term “procurement” over the last 50 years. In the past the procurement department was un-derstood only as the operational purchase unit of a company. This changed to a more holistic point of view that includes the planning, the accomplishment and the control of all supplying processes of a company.5 Nowadays procurement is seen as an important functional unit as it provides all other processes6 and all other units with the required goods and services7 by managing and coordinating the whole process with all its stake-holders and their requirements. It is therefore linked to all parts of the company and de-cisions made in the procurement phase influence the whole company. It influences the production processes, the product itself and the effects arising in and after the usage phase of the products. It furthermore affects even those units not directly related to the production process by providing them with needed products and services as well (e.g. computers, lightning, food, etc.). Beyond that procurement depends on other decisions – like R&D – as well and has to influence them proactively to achieve a broader scope for action. Arising from that procurement can be seen as a gate-keeper for greening deci-
5 Kaufmann, L. (2002), pp 3-33. 6 As are following the value chain of Porter: Inbound and Outbound Logistics, Operations (Manufacturing), Market-
ing and Sales, After-Sale Service, Porter, M. E. (1990), p. 41 7 “I define supply management as all processes of supplying the company with direct and indirect materials, services,
rights, and machinery and equipment from sources external to the organisation, aimed at contributing to the achievement of sustainable competitive advantage. This definition includes strategic and operational activities.”, Kaufmann, L. (2002), pp 3-33

Error! Style not defined. 5
sions in companies and therewith increasing a company’s environmental responsibility. For this reason efforts toward greening procurement decisions shall be focussed on in this paper.
2 The empirical study
2.1 Motivation
As procurement with its function as gate-keeper within an organisation is so important to positively influence the environmental aspects it is not amazing that efforts from varying groups to integrate such aspects into company’s decisions have been existing for more than 25 years. Some examples may outline this:
The German Umweltbundesamt has published a handbook on „environmental friendly procurement“ ever since 1987.8 To cope with current requirements all con-tent was integrated in the internet platform www.beschaffung-info.de.
Other European countries, especially the Scandinavian countries and Austria, as well as non-European Countries like Canada9 or Japan10 try to support efforts in the area of green procurement via Internet11 or Best Practice Sharing.12
The European Union provides organisations with different agreements,13 interpret-ing information,14 directives,15 regulations16 and other activities as for example Eco-labels.17 Furthermore a handbook „Buying green!“18 and the „Environmental Data-base“19 can be used. And if there is precedence in green procurement like „Concor-dia Bus Finland“ 20 the Court of Justice of the European Communities decisively of-fers judgement that guides further actions.
International organisations like the International Council for Local Environmental Initiatives (ICLEI)21 or GRIP – Foundation for Sustainable Production and Con-sumption22 support green procurement by initiatives and guidelines.
8 The 4th edition was released in 1999, UMWELTBUNDESAMT (ed.) (1999). 9 THE GREEN LANE (2002). 10 BARTH, R.; ERDMENGER, C. GÜNTHER, E. (ed..) (2005), p. 19. 11 FEDERAL MINISTRY OF AGRICULTURE, FORESTRY, ENVIRONMENT AND WATER MANAGEMENT ET AL. (Austria) (ed.). 12 Within the EU projekt RELIEF (Environmental Relief Potential of Urban Action on Avoidance and Detoxifica-
tion of Waste Streams through Green Public Procurement) Austria, Sweden and Denmark were farthest devel-oped in the area of green procurement and therewith had a leading role to part their knowledge with „beginners“ in this area like Hungary, ERDMENGER, C. (ed.) (2003) as well as INTERNATIONAL COUNCIL FOR LOCAL ENVIRON-MENTAL INITIATIVES (ICLEI) (2003).
13 European Council (ed.) (1996). 14 European Commission (ed.) (2001),. 15 European Parliament (ed.) (2004). 16 European Parliament (ed.) (2001),. 17 European Commission (2006). 18 European Commission (ed.) (2005). 19 European Commission (ed.) (2006). 20 European Court of Justice (ed.) (2202). 21 International Council for Local Environmental Initiatives (ICLEI). 22 GRIP – Foundation for Sustainable Production and Consumption (2003).

Error! Style not defined. 6
In spite of all these efforts environmental aspects are not as widely integrated in organi-sation’s decisions as supposed neither in public nor in private organisations. This reali-sation motivated the development of the Hurdles Analysis Method as a tool to identify and analyse reasons – so called hurdles – to greening procurement decisions.
2.2 The Search for Reasons – the Hurdles Analysis
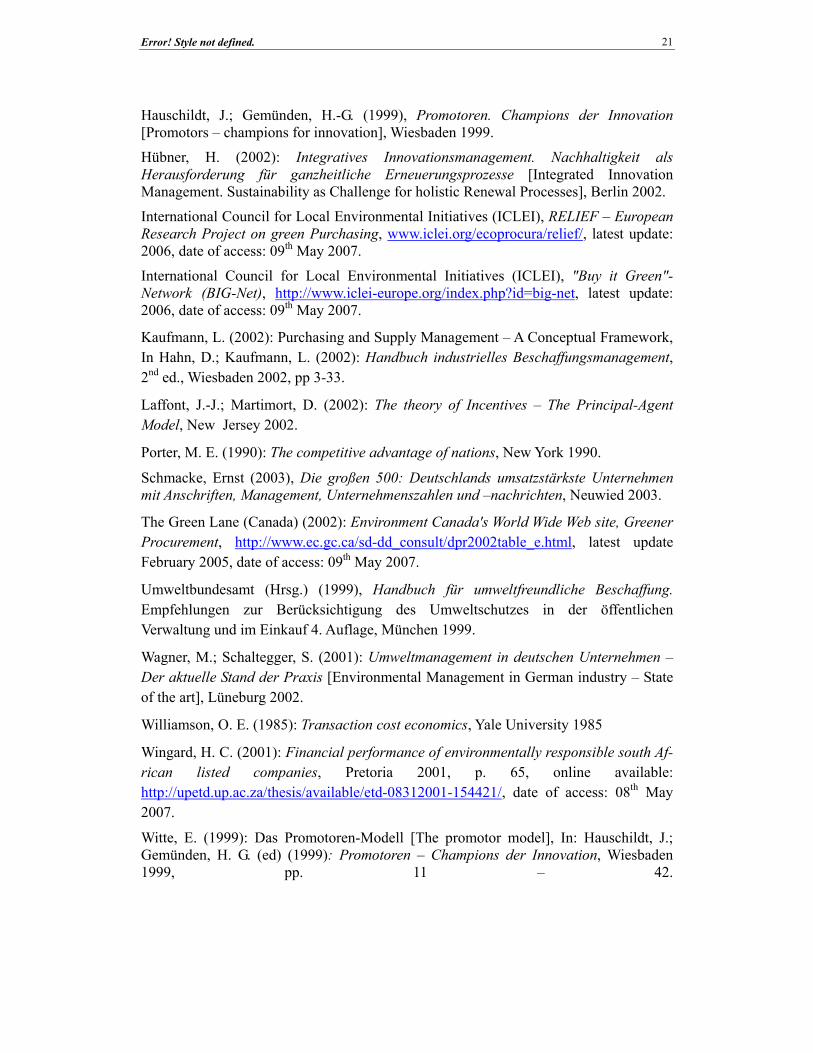
The idea of the Hurdles Analysis Method was developed by Technische Universität Dresden (TU Dresden) within a European research project – the RELIEF project – which was conducted together with partners from all over Europe.23 Within this project a first questionnaire on hurdles to green public procurement was developed and tested with the participating European cities. Afterwards the experiences so far collected with the Hurdles Analysis Method were refined in further projects within the public sector.24 Based on the main result that there is no possibility to identify a set of core hurdles rele-vant for all organisations the strategy had to be changed. TU Dresden started to give or-ganisations guidance while they accomplish a Hurdles Analysis on their own. A self-evaluation tool was developed and installed on the website that provided organisations with a procedure how to accomplish a hurdles analysis and identify the relevant hurdles to green procurement themselves. Therefore a guideline on the methodology of the hur-dles analysis self-evaluation tool is given. Furthermore an online questionnaire, that the members of an organisation could fill in and a document which offers the results of the questioning together with short interpretation of the results belong to the methodology. Since 2004 the hurdles analysis experienced a further adaptation as it should be used not only for public organisations but also for private ones which lead to the study whose re-sults shall be presented in this article.
figure 1: Development of the Hurdles Analysis Method and its self-evaluation tool
As figure 2 shows the study to be presented in this paper was based on the hurdles analysis method. This survey should identify reasons for the not satisfactory integration of green products and services in procurement decisions of companies in Germany al-though the positive effects of such an early integration in company’s decisions should be known regarding all those initiatives and supports mentioned above.
23 Some partners were: International Council for Local Environmental Initiatives (ICLEI), Institut für Finanzwissen-
schaft und Infrastrukturpolitik of the Technische Universität Wien, Institute for Environmental Studies of the Vrije Universiteit, Amsterdam, dk-TEKNIK ENERGY & ENVIRONMENT, Interuniversitäres Forschungszen-trum für Technik, Arbeit und Kultur (IFZ), Center for Environmental Studies (CES), municipalities of different European cities, for further information see www.tu-dresden.de/wwbwlbu/forschung/abgeschlossene_projekte/relief/, www.iclei.org/ecoprocura/relief/.
24 Potentials of a Sustainable Procurement and Instruments for Implementation (NaBesI) (www.tu-dresden.de/wwbwlbu/forschung/abgeschlossene_projekte/nachhaltig_beschaffen/en) as well as in a questioning in co-operation with Global to Local Ltd.
Error! Style not defined. 7
2.3 The Design of the Study
The study presented in the following was conducted with the biggest 500 German Com-panies25 as well as all medium sized companies of the German Association of Material Management, Purchasing and Logistics (AMMPL). It focused on the identification and analysis of hurdles to green procurement in companies in different areas:
Firstly, it should be clarified whether hurdles to green procurement are related to the ac-tors within the procurement process and
secondly, whether they differ because of the company size and
thirdly, whether the industry a company belongs to influences the perception of hurdles of its employees.
To get an overview of the personal perspectives and the perception of the actors in the company’s procurement process and the existing hurdles within it, a standardized ques-tionnaire was used. This questionnaire had to be filled in at least by two participants (procurement and environment) in each company. To generate results in the areas ex-plained above the study on the one hand focussed on perception of hurdles as only per-ception influences decisions because individuals base their actions on experience and perception. On the other hand different points of view (efforts and influence) and differ-ent actors (procurement and environment) were covered by the questioning to answer all research questions that arose out of this for the survey. Therefore the questionnaire con-sisted of tree main parts:
1. A general part with questions on number of employees, turnover and industry, 2. Questions on the procurement process as a multi-actor process to get knowledge
about: • the function of the participant, • the perceived influence on the implementation of green procurement, • the efforts other actors within the company might take to improve green pro-
curement, 3. Questions to assess the perceived relevance of potential hurdles summarized in a
hurdles catalogue.
A short theoretical description of the questionnaire’s content shall be given in the fol-lowing paragraphs.
2.3.1 The hurdles catalogue
The hurdles catalogue is the main part of the hurdles analysis method. The existence of hurdles in decision processes – like the procurement process – has been known for a long time and the topic became an important field of scientific research. That led to a
25 Schmacke, E. (2003).

Error! Style not defined. 8
multitude of approaches26 dealing with the description and explanation of different types of hurdles.27 From the variety of available approaches the approach of the Bases of Power by FRENCH / RAVEN28 and based on that the Theory of Promotors founded by WITTE29 and enhanced by HAUSCHILDT / GEMÜNDEN30 respectively were chosen as suit-able basis for the development of the hurdles analysis, because both together were found to cover a broader field of types of hurdles since most of the other theories only focus on but one type of hurdles. Hence both theories combined allowed the authors to gener-ate as many potential hurdles as possible. The following hurdles statements were de-rived based on the two theories together with all participants so far involved in a hurdles analysis:
table 1: hurdles catalogue structured by content
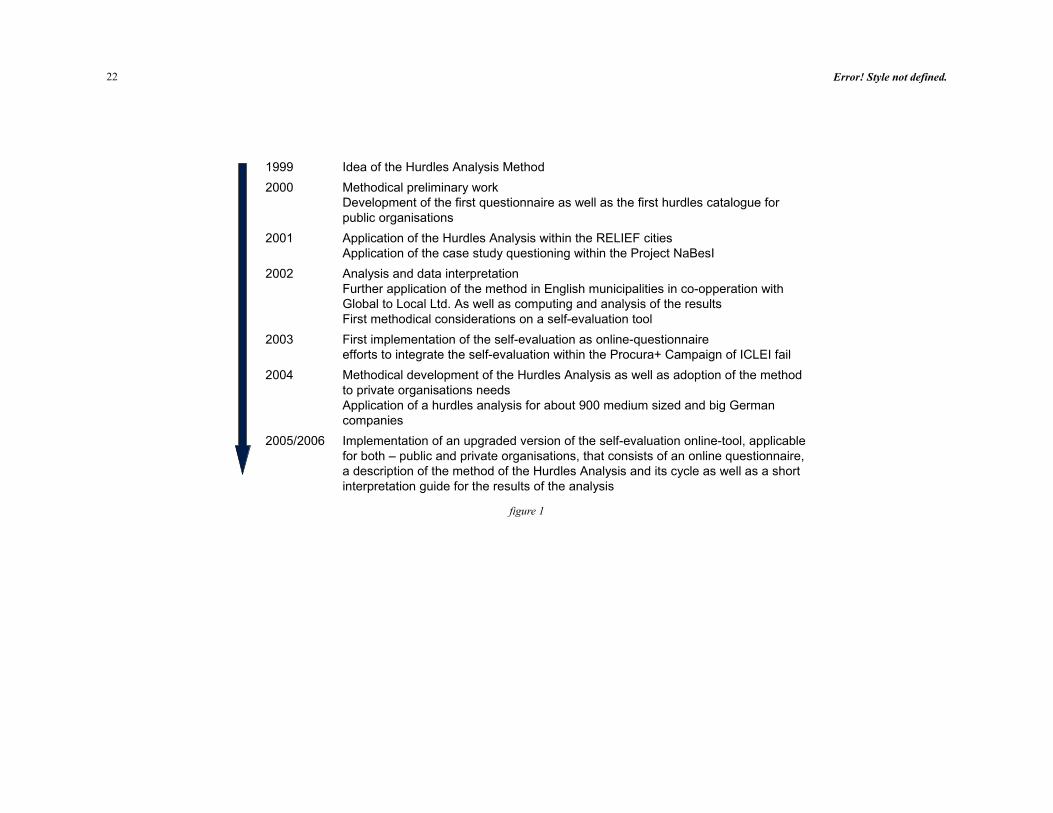
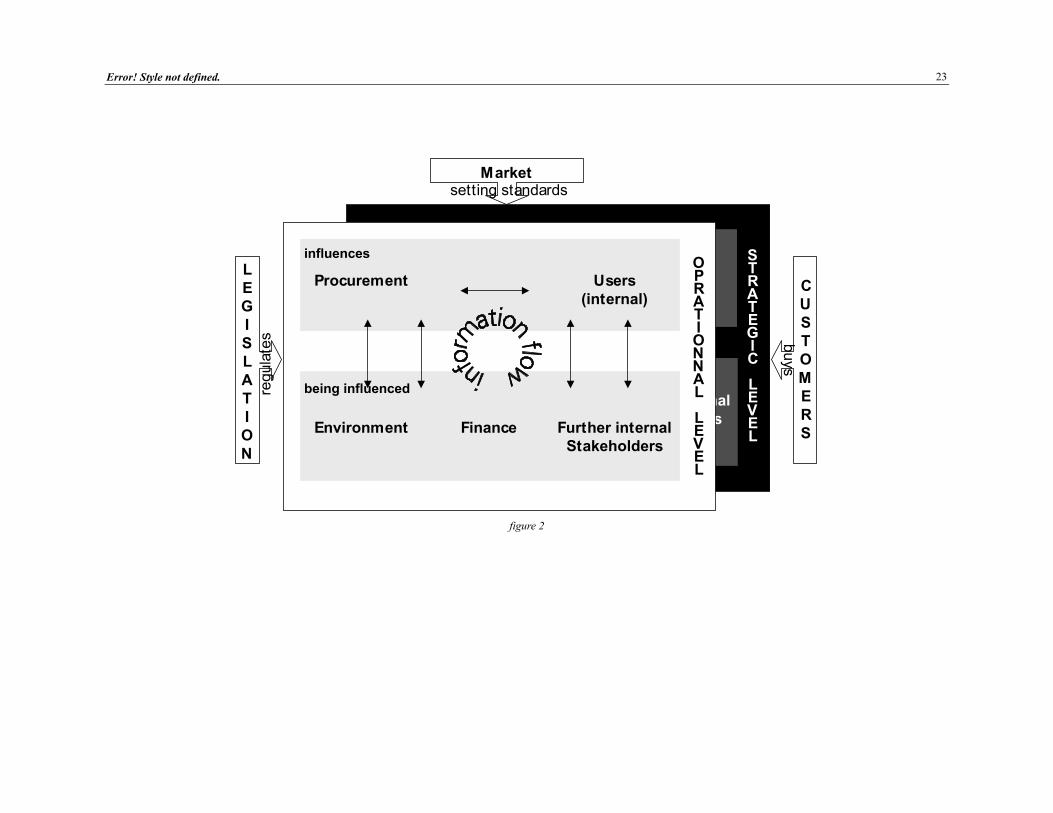
These hurdles statements were to answer by different actors (the procurement depart-ment and the environmental department) as every actor [figure 2] on every step of the decision process can be a potential source of hurdles, and may hamper, decelerate, even block green procurement on the one hand or may support, encourage and promote it on the other hand.
2.3.2 The actors focus
Procurement can be seen as a special decision process and there are different groups and/or persons (internal as well as external) acting within each step of this decision process – the so-called stakeholders. Regarding the greening of procurement processes as target the following groups or persons are assumed to be able to affect or be affected by green procurement decisions.
Internally:
• the Procurement Department because of choosing the products and services accord-ing to the requirements of the stakeholders and their attitude,
• the Internal User who uses the products and services and therefore is affected by procurement decisions (Operations, Administration etc.),
• the Finance Department by setting cost limits and/or profitability requirements for new machinery etc.,
26 As representatives for such approaches may stand: Laffont, J.-J.; Martimort, D. (2002); Williamson, O. E. (1985);
Freeman, R. E. (1984); Hauschildt, J; Gemünden, H. G. (1999), French, J. R. P. jr.; Raven, B. (1959). 27Types of hurdles investigated were information, communication, power, motivation, knowledge, willingness etc. 28 French, J. R. P. jr.; Raven, B. (1959). 29 Witte, E. (1999). 30 Hauschildt, J.; Gemünden, H. G. (1999). The authors identified barriers (hurdles) as hampering and difficult but
something that can be overcome/dealt with. Furthermore they found a “barrier of will” and a “barrier of capabil-ity” as possible causes that lead to the blocking of innovations.

Error! Style not defined. 9
• the Environmental Department that provides information and advice concerning en-vironmentally friendly products and services and
• other internal Stakeholders e.g. by setting technical requirements for new products or services that they develop (R&D, Operations, etc.).
Each internal actor in a procurement decision belongs to a functional area of the com-pany.31 These areas generally consist of an operational and a strategic, i.e. management, level. On the operational level specialists – “promotors by know-how” – act. They are persons who can actively and intensively encourage an innovation process by means of object specific knowledge. Management executives – “promotors by power” – working on the strategic level, are persons who promote innovation processes by means of their hierarchic power actively and intensively.32
figure 2: The Actors model
From outside the company stakeholders are influencing the procurement decision as well. Those are particularly:
• the state by passing laws, directives and regulations;
• the market which on the one hand generates pressure through competitors in case they are more advanced in their development toward greening procurement proc-esses and thus gaining market advantages. On the other hand it has to provide the company with suitable goods and services; and
• the customers who take influence on the decision-makers in procurement through their buying patterns.
The whole interplay between the potential actors involved in a procurement process can be as displayed in figure 2. Not necessarily all groups/persons have to be identified as important for one company. The groups/persons might differ from company to company depending on size, industry, organisation structure, etc.
The following research question meeting the assumption that different actors might per-ceive different hurdles as relevant was formed for the survey and therefore computed and interpreted within the analysis:
Perceive different actors (procurement and environment) different hurdles to be rele-vant?
Another interesting factor worth further research occurred to the authors while working on the design of the study:
What about efforts and influence? Are there actors groups that are perceived to have 31 Only users could belong to different functional areas. 32 Gemünden, H. G. (1988), p. 353.

Error! Style not defined. 10
high influence on procurement decisions but do not take so much effort to greening them?
2.3.3 Size focus
To clarify whether the company size influences the perception of hurdles two different types of companies were included into the survey:
• First of all the study comprised the biggest 500 companies of Germany33 and • Secondly the medium sized companies of the AMMPL34
Based on this selection the following research question should be answered by the sur-vey:
Does the number of hurdles perceived as relevant increases with increasing company size?
2.3.4 Industry focus
As the companies chosen to the study belonged to different industries it seemed natu-rally to include another train of though and therewith another perspective on the percep-tion of hurdles in the analysis. The authors were interested in the two interesting ques-tions:
Do hurdles exist that are generally perceived as low or high by all industries?
Does the number of hurdles perceived as relevant differ from industry to industry be-cause of i.e. specific knowledge or different external pressures?
table 2: industries comprised in the study
In the following chapters the results of the survey regarding the outlined research ques-tions are presented. But first of all a small overview on the database of the empirical study is given to certify the reliability of the presented results.
3 Results35
3.1 Return of the study
The study was designed as a written survey. Therefore 883 companies were asked to fill in the questionnaire on hurdles to green procurement. As the authors wanted to picture differences between actors groups as well each company was provided with two ques-
33 The assortment followed Schmacke, E. (2003) 34 The assortment in this area followed the EU-Commission (2003), which defines medium sized companies as com-
panies with 50 to 250 employees and less than 50 Mio Euro annual turnover. 35 Further detailed results can be found in Guenther, E.; Scheibe, L. (2005), pp.12.

Error! Style not defined. 11
tionnaires to be filled in by the procurement department on the one hand and the envi-ronmental department on the other hand. Furthermore an electronic version was held online that just in case other interested groups within a company exist they could fill in the questionnaire as well.
The rate of return for the whole study adjusted at 13.5 % out of all companies. Thereof 2.9 % of the companies indicated various reasons for not taking part in the survey, about 10.5 % sent back analysable questionnaires.36 It became obvious that the return of the biggest 500 German companies was with 18.9 % much higher than that of the medium sized companies with 7.4 %. Regarding the research questions further distributions of the answers are of interest which shall be presented in the following figures.
figure 3: distribution of answers regarding the actors groups
figure 3 visualizes the different answer profiles for the actors groups procurement and environment whereas figure 4 displays the segmentation of answers regarding the indus-try.
figure 4: distribution of answers regarding the industries
In the next section of the paper concrete results of the empirical study concerning the above sketched research questions will be presented. First of all an overview on the dif-ferences between the actors shall be given.
3.2 Actors
The descriptive result to the first research question whether different actors groups might see different hurdles is presented in figure 5. As can be seen easily the differences are not as significant as the authors assumed beforehand. There are only four hurdles which the environmental departments perceive higher than the procurers. These are: “obstructed by process”, “no green alternatives available”, “follow-up costs not in-cluded”, “no aim of organisation”. In one case – “to expensive” – the procurement de-partment perceives a higher hurdle relevance.
figure 5: comparison of perceived hurdles relevance regarding the included actors groups
36 The rate of return of about 10% corresponds to the rate usual for such studies, WAGNER, M.; SCHALTEGGER, S.
(2002), p. 7; BIEBELER, H. (2004), p. 4; Balderjahn, I.; Hauser, K.; Beckmann, D. (2004), p. 53.
Error! Style not defined. 12
A statistical T-Test proved the hurdles “obstructed by process”, “no green alternatives available”, “follow-up costs not included” to be significantly different, which coincides with the descriptive findings.
H0,1: the perception of hurdles is independent from the position of the responding person (procurer or environmental department)
table 3: Comparison of the hurdles perceived by the procurer and the environmental department – T-Test
The T-Tests show that for those three hurdles the equity of means is rejected for “ob-structed by process” and “no green alternatives available” on a significance level of α=0,05 and for the hurdle “follow-up costs not included” on a significance level of α=0,10. For all other hurdles there are no significant differences. It is interesting that for the three cases the environmental department sees the higher hurdle.
Summarising it can be stated for this research question that the differences between the actors were not as high as assumed. For three hurdles a significant difference could be proved. For those the conclusion might be drawn, that there is a need for education to reach a common information base. The other two hurdle’s divergence can only be de-duced from the descriptive figure. Hence it can be stated that it’s not so much the actors determining the so-far core-recognition of the Hurdles Analysis that there does not exist a hurdles set valid for all organisations.37
The second aspect of the examination of the actors within the study was the question whether actors groups exist that dispose of influence on procurement decisions but do not strive for greening such decisions. figure 6 provides the descriptive outcome to this question. The participants had the feeling that clearly the environmental department takes the highest efforts to reach the objective of greening procurement decisions. Un-fortunately they do not have enough influence to do so on their own. For all other actors groups the influence was higher ranked than their efforts but the effort’s curve echoed the form of the influence’s. Thereby the highest influence was fixed to the procurement department.
figure 6: comparison of influence and efforts for all actors groups
To test this statement, a paired t-test was conducted. Therefore the means of the percep-tion of the influence of the procurers on procurement decisions were compared with the perception of the influence of all the other departments.
Hypothese H0,2: The influence of the procurement department is equal to the influence of all the other departments.
37 This statement has already been introduced in the paragraph on the development of the Hurdles Analysis, pp. 6.
Error! Style not defined. 13
The t-Tests for the influence did show the following results:
table 4: Influence of the procurement department compared to the other departments
The difference of the means between the procurers and all the other departments is al-ways positive and significantly different (α<0,0001). The conclusion can be drawn that the procurers have the highest influence on the procurement decisions.
The same t-tests were conducted for the perception of the efforts of the environmental department compared to the efforts of all the other departments.
Hypothese H0,3: The efforts of the environmental department are equal to the efforts of all the other departments.
table 5: Efforts of the environmental department compared to all the other departments(H0,3)
The difference of the means between the environmental department and all the other departments is always positive and significantly different (α<0,0001). It can be con-cluded that the environmental departments takes the highest efforts to integrate envi-ronmental aspects in procurement decisions.
Hence the statistical assessment proved the descriptive one as the procurement has the highest influence on procurement decisions and the environmental department takes the greatest efforts. To conclude, the procurers should be motivated to increase their efforts for environmental procurement, whereas the influence of the environmental department should be anchored.
3.3 Size
The next research question of the empirical study tried to figure out whether the com-pany size influences the perception of hurdles. The assumption was that bigger compa-nies might face higher hurdles to green procurement because of their more complex structure and connected therewith asymmetric distribution of information within it. But the results of the descriptive analysis could not prove the assumption. In fact the results lined out that the medium sized companies tend to perceive higher relevance for the fol-lowing hurdles: “uncertain legal position”, “guidelines do not support”, “follow-up costs not included” and “no aim of organisation”. This may be explained by smaller personal capacities of these companies as they often cannot pay extra staff to e.g. solve legal questions or create understandable guidelines. Employees with other functions have to answer all these demands as well.
figure 7: comparison of perceived hurdles relevance regarding the companies size

Error! Style not defined. 14
In order to identify the significance of the assessments, for each relationship between hurdle and company size a contingency test was conducted, all in all 25 tests. The groups were classified as described above in the two groups: the biggest 500 and the medium-sized companies.
Hypothesis H0,4: The perception of the hurdles of environmental procurement is inde-pendent from the size of the company.
table 6: Interrelation between hurdle and company size (H0,4)
This result reflects the results of the descriptive analysis concerning the higher hurdle perception of the medium-sized companies. For the hurdles “uncertain legal position”, “guidelines do not support”, “follow-up costs not included”, “no aim of the organisa-tion” and “user prejudices” the null hypothesis can be rejected.
The reason might be in all these cases there is – as already mentioned – a lack of capac-ity inducing legal and financial inflexibility to some extend but also a lack of aim can be considered. But regarding the experiences of a number of projects with small and me-dium sized companies the integration of environmental aspects in organisation’s deci-sions becomes more and more important for them as amongst others their customers – mostly bigger companies – require certificates of their environmental management more often. Therefore the idea will be embedded in company strategies sooner or later. Nev-ertheless the differences between both perceptions were not as high as assumed. There-fore it’s not the company size which inhibits the deduction of the generally valid hurdles set either.
3.4 Industry
At last the article shall focus on different questions combining hurdles to green pro-curement and the industries included in the survey. Therefore two aspects were assessed within the study. Firstly whether hurdles exist that are perceived as low/high by all in-dustries and secondly whether industries could be identified that perceive all hurdles low/high.
3.4.1 Hurdles perception over all industries
1. Hurdles perceived as high for all industry in general
The analysis of the empirical study showed that there are in fact hurdles which all participating industries perceived as especially high. As example for this paper “no cost savings” was chosen as it was the hurdle with the highest perceived relevance (see figure 8). In general it could be found that all cost hurdles were perceived as higher than others which indicates that in this area either information on current prices is missing – in case the prices are almost equal – or the market actually could

Error! Style not defined. 15
or would not provide the companies with greener alternatives and services to ac-ceptable prices.
There was only one other hurdles – additional work – perceived higher than the rest by almost all industries. Only companies belonging to ‘energy, gas and water sup-ply’ saw almost no hurdle here because maybe in this market green product and ser-vice alternatives are completely integrated already so that the identification and pro-curement of green products and services in general seems to those companies almost without difficulties.
figure 8: results of the empirical study for “no cost savings”
2. Hurdles perceived as low for all industry in general
In the area of hurdles that all industries see as low especially the hurdle “efforts not useful” could be identified (figure 9). The result indicates that there is a willingness to integrate environmental aspects in company’s decisions. This is supported by the result of perception of hurdles regarding the aim as they are not so high as well. These findings can be seen as a good starting point to manage such highly relevant hurdles like the cost hurdles better in future until they could be relieved altogether.
figure 9: results of the empirical study for “efforts not useful”
3. Hurdles perceived as varying between industries
For all other hurdles not mentioned yet the findings of the study vary largely from industry to industry. As an example may stand the figure for the hurdle “not in-formed about legal framework” which shows impressively the wide spreading of perception (figure 10). These differing results can be explained with the specific en-vironments of each industry which the companies belong to. I.e. for the cited hurdle the legal framework for “energy, gas and water supply” is very clear, strict and envi-ronmentally oriented – often caused by EU directives and a very clear and uniform definition of the market. Whereas for “wholesale, trade and repair” the legal frame-work presents a relevant hurdle. The reasons can be seen in very different or non ex-istent regulations each depending from the product or service varying widely within this very inhomogeneous market.
figure 10: results of the empirical study for “not informed about legal framework”
Not every other analysed hurdle was as differentiated as the hurdle presented in figure 10. But it became clear that the next step in assessment has to be the analysis

Error! Style not defined. 16
of the industries themselves to find out whether the so far generated results could be further improved by an analysis of each industry and the answer to the question whether the hurdles within an industry were seen identically or not.
3.4.2 Differences in hurdles perception between the industries
As for the single hurdles in the paragraphs before the presentation of the results shall start with a look at industries that see hurdles to green procurement higher than the oth-ers followed by those who see very low hurdles to conclude with industries having a very distinct perception on the hurdles.
1. Generally high perception of hurdles within industries
It is especially true for “wholesale and retail trade, repair of motor vehicles, motor-cycles, personal and household goods”. The companies in this industry perceive mostly higher hurdles than the other industries. An explanation for this might be the diversity of this industry as lots of different companies are combined in this sector. Furthermore there are not so many regulations for this industry, either, giving sup-port by settling the basic conditions to act in. This is emphasized by looking at the results for the single hurdles. It can be seen that as highest hurdles pose “increase of costs”, “uncertain legal framework” and “no cost savings”. Further cost and legal hurdles follow shortly after which confirms the conclusion that firstly regulations are perceived as possibly missing. Secondly the question arises whether green prod-uct and service alternatives are really more cost intensive than the conventional which should be clarified for this industry.
figure 11: results of the empirical study for “wholesale and retail trade, repair of motor vehicles, motorcycles, per-
sonal and household goods”
2. Generally low perception of hurdles within industries
As figure 12 shows vividly the hurdles perception of the “electricity, gas and water supply” industry is significantly lower than the before presented. As it is the cost hurdles are identified as the most relevant ones, which can be explained with the fact that in this market green products are perceived as available but nonetheless cost intensive. The lowest hurdle is “not informed about legal framework” which indicates that for this industry more regulation is given, which on the other side causes a bit of confusion as the hurdles “uncertain legal framework” and “legal framework prevents” indicate. But in comparison to “wholesale, retail trade and re-pair of motor vehicles, motorcycles, personal and household goods” these hurdles are perceived less relevant. This indicates that the legal framework is almost clear and extensive and can be seen as a helpful and encouraging guide.

Error! Style not defined. 17
figure 12: results of the empirical study for “electricity, gas and water supply”
3. Widely varying perception of hurdles within one industry
figure 13: results of the empirical study for “manufacture of machinery and equipment not elsewhere classified”
The last result generated of the survey was the conclusion that there are industries in which almost every hurdle is seen differently by each participating company. The most extreme diversity presented the “manufacture of machinery and equipment not else-where classified” as every single hurdles statement is seen as ‘existing’ and ‘non-existing’ except the one hurdle “missing information about alternatives”. Besides this result it is obvious that this industry sees a lot of relevant hurdles too – the values are almost similarly high as such of “wholesale, retail trade, repair of motor vehicles, mo-torcycles, personal and household goods”. Though the hurdles perception in general is relatively high the broad spread leads to the conclusion that this industry consists of companies with very different state of the arts regarding green procurement as for every hurdle at least one company exists that relieved this hurdles (e.g. because of require-ments from their customers) and one that feels it completely. A second conclusion is that the industry is as manifold as the “trade and repair” industry but with much more differ-ent experiences than this, which could be of interest in improving the whole industries environmental performance as knowledge how to overcome specific hurdles is available already. The highest hurdle for this industry is a cost hurdles as well, which proves the relevance attached to this hurdle.
4 Lessons learned from the hurdles analysis for environmental responsibility
Definitely hurdles to green procurement exist! But it is neither the actors nor the size of a company displaying the greatest differences between the perceived hurdles relevance. As the last paragraphs lined out mostly the affiliation of a company to a specific indus-try determines the hurdles perception. If there are hurdles seen almost identically by all industries others are perceived completely different. As there are industries with a lower hurdles perception there are others with very high relevant hurdles as well. So the indus-try could be identified as the parameter determining the hurdles perception.
What can be learned from the empirical study for environmental stewardship?
The aim should be to enhance the environmental strategy of a company to move on from a lower form of environmental stewardship (as e.g. on the compliant or informed position) to a higher. Therefore the following things could be learned out of the study:
1. use the hurdles analysis method and its self-evaluation tool to identify the state of the art of hurdles to green procurement
2. train the staff to avoid perception of different hurdles as shown in “actors” and “size“ paragraph

Error! Style not defined. 18
3. be aware of the industry the company belongs to as industry specific hurdles might exist
4. learn from other companies of the industry to use advanced knowledge
5. learn from companies from Best-Practice industries (like electricity, gas and wa-ter supply) and adopt strategies for overcoming hurdles
If some of these lessons learned can be implemented in the procurement process the awareness of companies responsibility is raised and a development of the companies position in environmental stewardship to higher levels (top-level: sustainable posi-tion) initiated.

Error! Style not defined. 19
References
Balderjahn, I.; Hauser, K.; Beckmann, D. (2004): Empirische Studie zur Stellung von Nachhaltigkeit und CO2-Management in transportintensiven und transportnahen Branchen [Empiric study of the position of sustainablilty and CO2 management in transport intensive and close-to-trasportation industries], Potsdam 2004.
Barth, R.; Erdmenger, C.; Günther (Hrsg.) (2005): Umweltfreundliche öffentliche Beschaffung. Innovationspotenziale, Hemmnisse, Strategien, Heidelberg 2005.
Biebeler, H. (2004): Ergebnisse der Unternehmensbefragung zum nachhaltigen Wirtschaften [Results of a survey to sustainable management in German companies], Köln 2004, http://www.iwkoeln.de/data/pdf/content/st1104_nachhaltigkeits_unternehmensbefragung2004.pdf, date of access: 18th May 2007.
Erdmenger, C. (Ed.) (2003), Buying Into the Environment, Experiences, Opportunities and Potentials for Eco-Procurement in Europe, Sheffield 2003.
European Commission (ed.) (2001), Commission interpretative communication the Community law applicable on the public procurement and the possibilities for integrat-ing environmental considerations in public procurement vom 04.07.2001, COM(2001) 274final, Official Journal C 333 vom 28.11.2001, S. 12. Brüssel 2001, http://eur-lex.europa.eu/LexUriServ/site/en/com/2001/com2001_0274en01.pdf, date of access: 23rd May 2007.
European Commission (2003): Commission recommendation of 6 May 2003 concerning the definition of micro, small and medium-sized enterprises, C(2003) 1422, Brüssel, L 124/36, http://eur-lex.europa.eu/LexUriServ/site/en/oj/2003/l_124/l_12420030520en00360041.pdf, date of access: 23rd May 2007.
European Commission (ed.) (2005): Buying Green! A handbook on environmental pub-lic procurement, http://ec.europa.eu/environment/gpp/guideline_en.htm , latest update 2005, date of access: 09th May 2007.
European Commission (ed.) (2006), Green Public Procurement – Database, http://www.iclei-europe.org/fileadmin/user_upload/Procurement/LEAP2/Tool_9.xls, latest update 2007, date of access: 09th May 2007.
European Commission (2006), Welcome to the European Union Eco-label Homepage, http://ec.europa.eu/environment/ecolabel/index_en.htm, latest update 2007, date of ac-cess: 09th May 2007.
European Council (ed.) (1996), Agreement on government procurement in Annex 4 to the Agreement establishing the World Trade Organization (Government Procurement Act – GPA), Official Journal C 256 S. 1 v. 3.9.1996, http://eur-lex.europa.eu/Notice.do?hwords=&pgs=10&list=312788:cs,215234:cs,&val=215234:cs&nbl=2&lang=de&pos=2&page=1

Error! Style not defined. 20
European Court of Justice (2002): C-513/99, judgement of the court, 17th September 2002 (Concordia Bus Finland), http://eur-lex.europa.eu/LexUriServ/site/en/oj/2002/c_274/c_27420021109en00040005.pdf, date of access: 09th May 2007.
European Parliament (ed.) (2001), Regulation of the European Parliament and of the Council (EC) of 19 March 2001 allowing voluntary participation by organisations in a Community eco-management and audit scheme (EMAS), http://eur-lex.europa.eu/LexUriServ/site/en/oj/2001/l_114/l_11420010424en00010029.pdf, date of access: 23.05.2007.
European Parliament and the Council (2002): Directive 2002/96/EC on waste electrical and electronic equipment (WEEE), version 27th January 2003, Brussels 2003.
European Parliament (Hrsg.) (2004), Directive 2004/17/EC of the European Parliament and the Council of 31 March 2004 coordinating the procurement procedures of entities operating in the energy, water, transport and postal service sectors, http://eur-lex.europa.eu/LexUriServ/site/en/oj/2004/l_134/l_13420040430en00010113.pdf, date of access: 23.05.2007.
European Parliament and the Council (2006): REGULATION (EC) No 1907/2006 of the European Parliament and of the Council concerning the Registration, Evaluation, Au-thorisation and Restriction of Chemicals (REACH), establishing a European Chemicals Agency, amending Directive 1999/45/EC and repealing Council Regulation (EEC) No 793/93 and Commission Regulation (EC) No 1488/94 as well as Council Directive 76/769/EEC and Commission Directives 91/155/EEC, 93/67/EEC, 93/105/EC and 2000/21/EC, version 18th December 2006, Brussels 2006.
Federal Ministry of Agriculture, Forestry, Environment and Water Management et al. (Austria) : Check it! Green Purchasing Criteria, http://www.ifz.tugraz.at/oekoeinkauf/index_en.php, date of access: 09th May 2007.
Federal Statistical Office of Germany (2003), German Classification of Economic Ac-tivities, ed. 2003 (WZ 2003), Wiesbaden 2003.
Freeman, R. E. (1984): Strategic Management. A Stakeholder Approach, Marsfield Massachusetts 1984.
French, J. R. P.; Raven, B. (1959), The Bases of Social Power, in: Cartwright, D. (1959): Studies in Social Power, Michigan.
Gemünden, H. G. (1988): “Promotors” Key Persons for the Development and Marketing of Innovative Industrial Products, In: Gronhaug, K.; Kaufmann, G. (1988): Innovations: A Cross-Disciplinary Perspective, Oxford 1988, p. 347-374.
GRIP – foundation for sustainable production and consumption: Purchasing, http://www.grip.no/Innkjop/English/Hoved.htm, , date of access: 09th May 2007.
Guenther, E.; Scheibe, L. (2005): Green eBusiness - Auswertung der empirischen Untersuchung zu Hemmnissen umweltfreundlicher Beschaffung [Green eBusiness – assessment of the emperical study on hurdles to green procurement], Dresdner Beiträge zur Betriebswirtschaftslehre No. 102, Dresden 2005.
Error! Style not defined. 21
Hauschildt, J.; Gemünden, H.-G. (1999), Promotoren. Champions der Innovation [Promotors – champions for innovation], Wiesbaden 1999.
Hübner, H. (2002): Integratives Innovationsmanagement. Nachhaltigkeit als Herausforderung für ganzheitliche Erneuerungsprozesse [Integrated Innovation Management. Sustainability as Challenge for holistic Renewal Processes], Berlin 2002.
International Council for Local Environmental Initiatives (ICLEI), RELIEF – European Research Project on green Purchasing, www.iclei.org/ecoprocura/relief/, latest update: 2006, date of access: 09th May 2007.
International Council for Local Environmental Initiatives (ICLEI), "Buy it Green"-Network (BIG-Net), http://www.iclei-europe.org/index.php?id=big-net, latest update: 2006, date of access: 09th May 2007.
Kaufmann, L. (2002): Purchasing and Supply Management – A Conceptual Framework, In Hahn, D.; Kaufmann, L. (2002): Handbuch industrielles Beschaffungsmanagement, 2nd ed., Wiesbaden 2002, pp 3-33.
Laffont, J.-J.; Martimort, D. (2002): The theory of Incentives – The Principal-Agent Model, New Jersey 2002.
Porter, M. E. (1990): The competitive advantage of nations, New York 1990.
Schmacke, Ernst (2003), Die großen 500: Deutschlands umsatzstärkste Unternehmen mit Anschriften, Management, Unternehmenszahlen und –nachrichten, Neuwied 2003.
The Green Lane (Canada) (2002): Environment Canada's World Wide Web site, Greener Procurement, http://www.ec.gc.ca/sd-dd_consult/dpr2002table_e.html, latest update February 2005, date of access: 09th May 2007.
Umweltbundesamt (Hrsg.) (1999), Handbuch für umweltfreundliche Beschaffung. Empfehlungen zur Berücksichtigung des Umweltschutzes in der öffentlichen Verwaltung und im Einkauf 4. Auflage, München 1999.
Wagner, M.; Schaltegger, S. (2001): Umweltmanagement in deutschen Unternehmen – Der aktuelle Stand der Praxis [Environmental Management in German industry – State of the art], Lüneburg 2002.
Williamson, O. E. (1985): Transaction cost economics, Yale University 1985
Wingard, H. C. (2001): Financial performance of environmentally responsible south Af-rican listed companies, Pretoria 2001, p. 65, online available: http://upetd.up.ac.za/thesis/available/etd-08312001-154421/, date of access: 08th May 2007.
Witte, E. (1999): Das Promotoren-Modell [The promotor model], In: Hauschildt, J.; Gemünden, H. G. (ed) (1999): Promotoren – Champions der Innovation, Wiesbaden 1999, pp. 11 – 42.
Error! Style not defined. 22
1999 Idea of the Hurdles Analysis Method2000 Methodical preliminary work
Development of the first questionnaire as well as the first hurdles catalogue for public organisations
2001 Application of the Hurdles Analysis within the RELIEF citiesApplication of the case study questioning within the Project NaBesI
2002 Analysis and data interpretation Further application of the method in English municipalities in co-opperation with Global to Local Ltd. As well as computing and analysis of the resultsFirst methodical considerations on a self-evaluation tool
2003 First implementation of the self-evaluation as online-questionnaireefforts to integrate the self-evaluation within the Procura+ Campaign of ICLEI fail
2004 Methodical development of the Hurdles Analysis as well as adoption of the method to private organisations needsApplication of a hurdles analysis for about 900 medium sized and big German companies
2005/2006 Implementation of an upgraded version of the self-evaluation online-tool, applicable for both – public and private organisations, that consists of an online questionnaire, a description of the method of the Hurdles Analysis and its cycle as well as a short interpretation guide for the results of the analysis
figure 1
Error! Style not defined. 23
Marketsetting standards
LEGISLATION
regu
late
sCUSTOMERS
buys
Further internal Stakeholders
STRATEGICLEVEL
OPERATIONALLEVEL
Finanz-abteilung
Beschaffungs-abteilung
Umwelt-abteilung
InterneNutzer
beeinflusst
beeinflussen
Further internalStakeholders
Finance
Procurement
Environment
Users (internal)
influences
being influenced
OPRATIONNALLEVEL
figure 2

Error! Style not defined. 24
The biggest 500 German Companies(97 analysable questionnaire)
Procurement56%
Environment38%
Others6%
Medium sized Companies of AMMPL (37 analysable questionnaire)
Procurement62%
Environment19%
Others19%
Complete Survey (134 analysable questionnaire)
Procurement57%
Environment33%
Others10%
figure 3

Error! Style not defined. 25
5%9%
5%
7%
7%
7%5%18%
5%
7%
25%
Construction Manufacture of electrical and optical equipmentElectricity, gas and water supply Manufacture of transport equipment Wholesale, trade; repair Manufacture of chemicalsManufacture of rubber and plastic products Manufacture of machineryManufacture of metals Transport, storage and communication others
figure 4

Error! Style not defined. 26
Comparison by actors
eff o
rt s n
ot u
sefu
l l
obst
ruct
ion s
by
proc
ess
gree
n al
ter n
ativ
es n
ot k
now
n
not i
nfor
med
abo
ut t h
e ai
m
not i
nfor
med
abo
ut p
ossi
bili t
i es
no a
im o
f or g
ani s
ati o
n
low
er fu
n ct io
nalit
y
not i
nfor
med
abo
ut th
e r e
leva
nce
poss
i bili t
ies
not w
ide l
y u s
e d
gui d
eli n
es d
o no
t sup
por t
i nit i
ativ
es n
ot e
ncou
r age
d
not i
nfor
med
abo
ut le
g al f
r am
e wor
k
no g
ree n
al te
r nat
ives
ava
i labl
e
scop
e m
issi
ng
fol lo
w-u
p co
sts
not i
n clu
ded
mi s
sing
inf o
rmat
i on
abou
t alt e
rnat
i ves
user
pr e
judi
ces
unce
r tai n
l ega
l pos
it ion
lega
l fra
mew
ork
prev
ent s
t oo
expe
nsiv
e
addi
tion a
l wor
k
dif fi
cult
t o i d
enti f
y
incr
ease
of c
osts
no c
ost s
avin
gs
hurdles
aver
age
ProcurementEnvironment
I do not agree
I rather do not agree
I rather agree
I agree
figure 5

Error! Style not defined. 27
influence vs. effort
legisl
ation
market
custo
merspro
curem
ent
users
(inter
nal)
finan
ceen
viron
ment
furthe
r int s
takeh
olders
Actors
Ave
rage
influenceefforts
low
rather low
rather high
high
none
figure 6

Error! Style not defined. 28
Comparison by company size
eff o
r ts n
ot u
sefu
l l
gree
n al
ter n
ativ
es n
o t k
n ow
n
low
er fu
nct io
nal it
y
not i
nfor
med
abo
ut th
e ai
m
obst
ruct
ions
by
proc
ess
not i
nfor
med
ab o
ut p
ossi
bil it
ies
no a
im o
f or g
anis
a ti o
n
not i
nfor
med
abo
ut t h
e r e
leva
n ce
poss
i bil it
ies
not w
idel
y us
ed
guid
elin
es d
o no
t sup
port
ini ti
ati v
es n
ot e
ncou
r age
d
not i
nfor
med
abo
ut l e
gal f
r am
e wor
k
scop
e m
i ssi
ng
mi s
sing
inf o
rmat
ion
abou
t alt e
rnat
ive s
no g
r een
al te
r nat
ives
ava
i labl
e
fol lo
w- u
p co
sts
not i
ncl u
ded
user
pre
j udi
ces
unce
rt ain
lega
l pos
i tion
lega
l fr a
mew
ork
prev
ent s
too
expe
nsiv
e
dif fi
cult
t o i d
enti f
y
addi
ti ona
l wor
k
i ncr
ease
of c
osts
no c
ost s
avi n
gs
hurdles
aver
age
Medium sized companiesThe biggest 500
I do not agree
I rather do not agree
I rather agree
I agree
figure 7

Error! Style not defined. 29
no cost savings
Con
stru
ctio
n
Man
ufac
ture
of e
lect
rical
and
optic
aleq
uipm
ent
Ele
ctric
ity,
gas
and
wat
er s
uppl
y
Man
ufac
ture
of tr
ansp
ort
equi
pmen
t
Who
lesa
le,
trade
; rep
air
Man
ufac
ture
of c
hem
ical
s
Man
ufac
ture
of ru
bber
and
plas
ticpr
oduc
tsM
anuf
actu
reof
mac
hine
ry
Man
ufac
ture
of m
etal
s
industries
hurd
les
rele
vanc
e
I do not agree
I rather do not agree
I rather agree
I agree
figure 8

Error! Style not defined. 30
efforts not usefull
Con
stru
ctio
n
Man
ufac
ture
of
elec
trica
l and
optic
al
Ele
ctric
ity, g
asan
d w
ater
supp
ly
Man
ufac
ture
of
trans
port
equi
pmen
t
Who
lesa
le,
trade
; rep
air
Man
ufac
ture
of
chem
ical
s
Man
ufac
ture
of
rubb
er a
ndpl
astic
pro
duct
s
Man
ufac
ture
of
mac
hine
ry
Man
ufac
ture
of
met
als
Tran
spor
t,st
orag
e an
dco
mm
unic
atio
n
industries
hurd
les
rele
vanc
e
I do not agree
I rather do not agree
I rather agree
I agree
figure 9

Error! Style not defined. 31
not informed about legal framework
Con
stru
ctio
n
Man
ufac
ture
of e
lect
rical
and
optic
aleq
uipm
ent
Ele
ctric
ity,
gas
and
wat
er s
uppl
y
Man
ufac
ture
of tr
ansp
ort
equi
pmen
t
Who
lesa
le,
trade
; rep
air
Man
ufac
ture
of c
hem
ical
s
Man
ufac
ture
of ru
bber
and
plas
ticpr
oduc
tsM
anuf
actu
reof
mac
hine
ry
Man
ufac
ture
of m
etal
s
industries
hurd
les
rele
vanc
e
I do not agree
I rather do not agree
I rather agree
I agree
figure 10

Error! Style not defined. 32
Hurdles Profile
incr
ease
of c
ost s
unce
r tain
leg a
l pos
i t ion
no c
o st s
avi n
gs
dif fi
cult
t o i d
enti f
y
not i
nfor
med
abo
ut l e
gal f
r am
ewor
k
lega
l fra
mew
ork
p rev
ent s
fol lo
w- u
p co
sts
not i
ncl u
ded
mi s
sing
i nfo
r mat
i on
abou
t al te
r nat
ives
addi
ti ona
l wor
k
t oo
expe
nsi v
e
user
pr e
judi
ces
guid
elin
es d
o no
t sup
port
not i
nfor
med
abo
ut p
ossi
bilit
ies
obst
ruct
ions
by
proc
ess
no g
r een
alt e
rnat
ives
ava
il abl
e
no a
im o
f or g
anis
atio
n
not i
nfor
med
abo
ut th
e re
leva
nce
ini ti
ativ
es n
ot e
ncou
r age
d
not i
nfor
med
abo
ut th
e ai
m
poss
ibi li t
i es
not w
i del
y us
ed
scop
e m
i ssi
ng
gree
n al
ter n
ati v
es n
ot k
now
n
l ow
er f u
ncti o
nalit
y
effo
r ts n
ot u
sef u
ll
Hurdles
Ave
rage
I do not agree
I rather do not agree
I rather agree
I agree
figure 11

Error! Style not defined. 33
Hurdles Profile
no c
o st s
avi n
gs
incr
ease
of c
osts
diff i
cult
t o id
ent if
y
unce
r tai n
l ega
l pos
it ion
l ega
l fr a
mew
ork
prev
ent s
f ollo
w-u
p co
sts
not i
ncl u
ded
too
expe
nsiv
e
no g
reen
alt e
r nat
i ves
ava
i labl
e
mi s
sing
inf o
rmat
i on
abou
t alt e
rnat
ives
obst
r uct
ion s
by
proc
ess
user
pre
j udi
ces
scop
e m
issi
ng
i nit i
ativ
es n
o t e
ncou
rage
d
addi
t iona
l wor
k
no a
i m o
f or g
anis
atio
n
low
er fu
nct io
nal it
y
gree
n al
t ern
ativ
es n
ot k
now
n
guid
eli n
es d
o no
t sup
por t
poss
ibil it
ies
not w
i del
y us
e d
not i
nfor
med
abo
ut th
e r e
leva
nce
eff o
r ts n
ot u
sefu
l l
not i
nfor
med
abo
ut th
e ai
m
not i
nfor
med
abo
ut p
ossi
bili t
ies
not i
nfor
med
abo
ut le
gal f
ram
ewor
k
Hurdles
Ave
rage
I do not agree
I rather do not agree
I rather agree
I agree
figure 12

Error! Style not defined. 34
Hurdles Profile
no c
ost s
avi n
gs
t oo
expe
nsiv
e
incr
ease
of c
ost s
addi
ti ona
l wor
k
fol lo
w- u
p co
sts
not i
nclu
ded
diff i
cul t
to id
ent if
y
gui d
eli n
es d
o no
t sup
por t
init i
ativ
es n
ot e
ncou
r age
d
mis
sing
i nfo
r mat
i on
abou
t al te
r nat
i ves
scop
e m
i ssi
ng
no a
i m o
f org
anis
ati o
n
user
pr e
judi
ces
lega
l fr a
mew
ork
prev
ent s
no g
reen
alt e
rnat
ives
ava
il abl
e
unce
rt ain
lega
l pos
i tion
poss
ibil it
ies
not w
i del
y us
e d
not i
nfor
med
ab o
ut le
gal f
ram
ewor
k
not i
nfor
med
abo
ut t h
e ai
m
not i
nfor
med
abo
ut p
o ssi
bil it
ies
gree
n al
t ern
ati v
es n
ot k
now
n
not i
nfor
med
abo
ut th
e re
leva
nce
obst
ruct
ions
by
proc
ess
low
er fu
nct io
nali t
y
eff o
r ts n
ot u
sefu
l l
Hurdles
Ave
rage
I do not agree
I rather do not agree
I rather agree
I agree
fgure 13

Error! Style not defined. 35
hurdles shortcut of the hurdle hurdles classification
There are uncertainties concerning the legal position of green procurement (e.g. because of complexity).
uncertain legal position
The existing legal framework supports green procurement.
legal framework prevents
I am informed about the relevant legal framework for green procurement.
not informed about legal framework
legal restrictions
Efforts for green procurement are useful. efforts not useful Green procurement is one of the aims of my organisation. no aim of organisation I am sufficiently informed about the aim of green procurement.
not informed about the aim
company’s objectives
I am informed about green product and service alternatives.
green alternatives not known
There are sufficient green product and service alternatives available within the procurement market.
no green alternatives available
Information (criteria, prices, services) concerning green product and service alternatives are available.
missing information about alternatives
It is difficult to identify green product and service alternatives within the procurement market.
difficult to identify
Green procurement causes additional work. additional work
knowledge and identification of green products and services
Green procurement opens up opportunities for cost savings.
no cost savings
Green procurement causes cost increases. Increase of costs Follow-up costs (e.g. energy or disposal costs) cannot be included in procurement decisions.
follow-up cost not included
Green products and services are too expensive. too expensive It is possible to procure green product and service alternatives within a given cost scope.
scope missing
costs of green procurement
Green products and services have a lower functionality compared to conventional products.
lower functionality
Many users have prejudices concerning green product and service alternatives.
user prejudices
Given possibilities to include environmental criteria in the procurement process are widely used in my organisation.
possibilities not widely used
The procurement guidelines of my organisation support green procurement.
guidelines do not support
Green procurement is obstructed by the administration processes (e.g. due to spread competences).
obstructed by process
Initiatives of employees who want to procure green are supported.
Initiatives not encouraged
I am informed about the possibilities of green procurement.
not informed possibilities
I am informed about the environmental relevance of procured product and service alternatives.
not informed about relevance
prejudices and motivation toward green procurement
table 1

Error! Style not defined. 36
Agriculture, hunting and forestry
Manufacture of basic metals and fabricated metal products
Manufacture of textiles and textile products
Construction Manufacture of chemicals, chemical products and man-made fibres
Manufacture of transport equipment
Education Manufacture of coke, refine petroleum products and nuclear fuel
Mining and quarrying, except of energy producing materials
Electricity, gas and water supply
Manufacture of electrical and optical equipment
Mining and quarrying of energy producing materials
Extra-territorial organisations and bodies
Manufacture of food products, beverages and tobacco
Other community, social and personal service activities
Financial intermediation Manufacture of leather and leather products
Private households with employed persons
Fishing Manufacture of machinery and equipment not elsewhere classified
Public administration and defence; compulsory social security
Health and social work Manufacture of other non-metallic mineral products
Real estate, renting and business activities
Hotels and restaurants Manufacture of pulp, paper and paper products; publishing and printing
Transport, storage and communication
Manufacture not elsewhere classified.
Manufacture of rubber and plastic products
Wholesale and retail trade; repair of motor vehicles, motorcycles and personal and household goody
Others:. --------------------------------------------------------------------------------------------------------
table 2

Error! Style not defined. 37
Levene-Test
of the equity of variances T-Test for the equity of means
F significance T df significance (two-sided)
medial difference
equal variances 0.002 0.962 0.274 121.000 0.784 0.041 green alternatives not known (NB=77; NU=46) unequal variances 0.273 93.720 0.785 0.041
equal variances 3.092 0.081 -2.073 121.000 0.040 -0.309 no green alternatives available (NB=77; NU=46) unequal variances -2.022 87.432 0.046 -0.309
equal variances 0.053 0.818 0.193 121.000 0.847 0.020 efforts not useful (NB=77; NU=46) unequal variances 0.195 97.446 0.846 0.020
equal variances 1.662 0.200 -0.772 121.000 0.442 -0.147 guidelines do not support (NB=77; NU=46) unequal variances -0.745 84.501 0.459 -0.147
equal variances 0.543 0.463 -0.645 121.000 0.520 -0.090 possibilities not widely used (NB=77; NU=46) unequal variances -0.646 95.375 0.520 -0.090
equal variances 0.373 0.543 0.045 119.000 0.964 0.009 uncertain legal posi-tion (NB=75; NU=46) unequal variances 0.046 99.149 0.964 0.009
equal variances 0.001 0.976 -0.231 121.000 0.817 -0.034 no cost savings (NB=77; NU=46) unequal variances -0.231 94.295 0.818 -0.034
equal variances 1.268 0.262 0.328 119.000 0.744 0.054 additional work (NB=76; NU=45) unequal variances 0.317 83.478 0.752 0.054
equal variances 0.694 0.406 0.471 120.000 0.638 0.062 scope missing (NB=76; NU=46) unequal variances 0.472 95.710 0.638 0.062
equal variances 1.024 0.314 0.320 121.000 0.749 0.049 difficult to identify (NB=77; NU=46) unequal variances 0.328 102.232 0.743 0.049
equal variances 1.420 0.236 0.475 119.000 0.635 0.084 legal framework prevents (NB=75; NU=46) unequal variances 0.460 85.558 0.646 0.084
equal variances 2.901 0.091 -1.800 120.000 0.074 -0.325 follow-up costs not included (NB=76; NU=46) unequal variances -1.740 85.168 0.085 -0.325
equal variances 1.336 0.250 0.983 121.000 0.328 0.125 not informed about possibilities (NB=77; NU=46) unequal variances 0.975 92.484 0.332 0.125
equal variances 0.284 0.595 0.409 117.000 0.683 0.070 not informed about the aim (NB=75; NU=44) unequal variances 0.417 95.286 0.678 0.070
equal variances 0.129 0.720 0.125 121.000 0.901 0.019 missing information about alternatives (NB=77; NU=46) unequal variances 0.124 92.862 0.901 0.019
equal variances 0.000 0.984 -0.272 120.000 0.786 -0.043 not informed about legal framework (NB=76; NU=46) unequal variances -0.270 93.360 0.787 -0.043
equal variances 0.224 0.637 -0.040 120.000 0.968 -0.006 not informed about relevance (NB=76; NU=46) unequal variances -0.040 90.022 0.968 -0.006
equal variances 0.503 0.479 -1.286 121.000 0.201 -0.242 no aim of organisa-tion (NB=77; NU=46) unequal variances -1.254 87.371 0.213 -0.242
equal variances 2.623 0.108 -2.954 120.000 0.004 -0.439 obstructed by proc-ess (NB=76; NU=46) unequal variances -2.726 72.940 0.008 -0.439
equal variances 0.909 0.342 -0.154 119.000 0.878 -0.023 initiatives not sup-ported (NB=75; NU=46) unequal variances -0.149 85.669 0.882 -0.023 increase of costs equal variances 0.002 0.964 0.744 119.000 0.459 0.116

Error! Style not defined. 38
(NB=75; NU=46) unequal variances 0.747 96.528 0.457 0.116 equal variances 0.021 0.886 0.185 119.000 0.854 0.024 lower functionality
(NB=75; NU=46) unequal variances 0.186 96.715 0.853 0.024 equal variances 0.082 0.774 1.517 120.000 0.132 0.235 too expensive
(NB=76; NU=46) unequal variances 1.491 89.881 0.140 0.235 equal variances 0.582 0.447 -0.788 120.000 0.433 -0.133 user prejudices
(NB=76; NU=46) unequal variances -0.776 90.635 0.440 -0.133
table 3

Error! Style not defined. 39
paired differences T df N significance(two-sided)
mean standard deviation
pair 1 influence procurer – influence law 1.33333333 1.6415474 8.89766257 119 120 7.564E-15
pair 2 influence procurer – influence market 1.03361345 1.46676615 7.68724553 118 119 4.9375E-12
pair 3 influence procurer – influence customer 0.5210084 1.57764435 3.60254242 118 119 0.00046244
pair 4 influence Procurer – influence user 0.83333333 1.1975699 7.62269432 119 120 6.6594E-12
pair 5 influence Procurer – influence finance 1.37288136 1.55687947 9.57897456 117 118 2.1418E-16
pair 6 influence Procurer – influence environment 1.03333333 1.48908259 7.60172715 119 120 7.4271E-12
pair 7
influence Procurer – influence stakeholder-sothers 1.53271028 1.62130717 9.77882462 106 107 1.7628E-16
table 4
paired difference T df N significance(two-sided)
mean standard devia-tion
pair 1 effort environment– effort law 1.63414634 1.51640371 11.9516719 122 120 2.849E-22
pair 2 effort environment – effort market 1.52542373 1.44832272 11.4410572 117 119 8.4393E-21
pair 3 effort environment – effort customer 0.9338843 1.3337637 7.7020594 120 119 4.2425E-12
pair 4 effort environment – effort procurer 0.5 1.39805059 3.95027229 121 120 0.00013169
pair 5 effort environment – effort user 1.1557377 1.34852532 9.46629629 121 118 3.0096E-16
pair 6 effort environment – effort finance 2.19327731 1.34212904 17.8267738 118 120 2.8561E-35
pair 7 effort environment – effort stakeholdersothers 1.72641509 1.36300102 13.0407322 105 107 1.0832E-23
table 5

Error! Style not defined. 40
level valid cases chi-square level of significance null hypothesis
green alternatives not known 126 4.429 0.219 not rejected
no green alternatives available 126 4.941 0.176 not rejected
efforts not useful 126 2.617 0.455 not rejected
guidelines do not support 124 10.420 0.015 rejected *
possibilities not widely used 126 3.808 0.283 not rejected
uncertain legal position 124 4.128 0.248 not rejected
no cost savings 125 3.782 0.286 not rejected
additional work 126 2.610 0.456 not rejected
scope missing 124 3.681 0.298 not rejected
difficult to identify 126 2.317 0.509 not rejected
legal framework prevents 126 6.748 0.080 rejected **
follow-up costs not included 125 9.394 0.024 rejected *
not informed about possibilities 126 3.026 0.388 not rejected
not informed about the aim 122 2.027 0.567 not rejected
missing information about alternatives 126 1.133 0.769 not rejected
not informed about legal framework 125 2.458 0.483 not rejected
not informed about relevance 125 3.841 0.279 not rejected
no aim of organisation 126 6.468 0.091 rejected **
obstructed by process 125 2.800 0.423 not rejected
initiatives not supported 124 2.413 0.491 not rejected increase of costs 124 2.067 0.559 not rejected lower functionality 124 2.059 0.560 not rejected too expensive 125 0.220 0.974 not rejected user prejudices 125 9.952 0.019 rejected *
table 6