the hobby-eberly telescope chemical abundances of stars in the halo
TRANSCRIPT
Physics
Physics Research Publications
Purdue University Year
The Hobby-Eberly Telescope Chemical
Abundances of Stars in the Halo (CASH)
project. I. The lithium-, s-, and
r-enhanced metal-poor giant HKII
17435-00532I. U. Roederer, A. Frebel, M. D. Shetrone, C. A. Prieto, J. Rhee, R. Gallino, S.Bisterzo, C. Sneden, T. C. Beers, and J. J. Cowan
This paper is posted at Purdue e-Pubs.
http://docs.lib.purdue.edu/physics articles/654

THE HOBBY-EBERLY TELESCOPE CHEMICAL ABUNDANCES OF STARS IN THE HALO (CASH) PROJECT. I.THE LITHIUM-, s-, AND r-ENHANCED METAL-POOR GIANT HKII 17435�005321
Ian U. Roederer,2Anna Frebel,
2,3Matthew D. Shetrone,
2,3Carlos Allende Prieto,
2Jaehyon Rhee,
4,5
Roberto Gallino,6,7
Sara Bisterzo,6Christopher Sneden,
2Timothy C. Beers,
8and John J. Cowan
9
Received 2007 October 8; accepted 2008 February 21
ABSTRACT
We present the first detailed abundance analysis of the metal-poor giant HKII 17435�00532. This star wasobserved as part of the University of Texas long-term project Chemical Abundances of Stars in the Halo (CASH). Aspectrum was obtained with the High Resolution Spectrograph (HRS) on the Hobby-Eberly Telescope with aresolving power of R � 15;000. Our analysis reveals that this star may be located on the red giant branch, redhorizontal branch, or early asymptotic giant branch. We find that this metal-poor (½Fe/H � ¼ �2:2) star has an un-usually high lithium abundance [log "(Li) ¼ þ2:1], mild carbon (½C/Fe� ¼ þ0:7) and sodium (½Na/Fe� ¼ þ0:6)enhancement, as well as enhancement of both s-process (½Ba/Fe� ¼ þ0:8) and r-process (½Eu/Fe� ¼ þ0:5) material.The high Li abundance can be explained by self-enrichment through extra mixing that connects the convectiveenvelope with the outer regions of the H-burning shell. If so, HKII 17435�00532 is the most metal-poor star in whichthis short-lived phase of Li enrichment has been observed. The Na and n-capture enrichment can be explained bymass transfer from a companion that passed through the thermally pulsing AGB phase of evolution with only a smallinitial enrichment of r-process material present in the birth cloud. Despite the current nondetection of radial velocityvariations (over �180 days), it is possible that HKII 17435�00532 is in a long-period or highly inclined binarysystem, similar to other stars with similar n-capture enrichment patterns.
Subject headinggs: nuclear reactions, nucleosynthesis, abundances — stars: abundances —stars: individual (HKII 17435�00532) — stars: Population II
Online material: color figures, machine-readable table
1. INTRODUCTION
The story of early Galactic nucleosynthesis is written in thechemical compositions of very metal-poor halo stars. The abun-dances in these stars reflect only a few chemical enrichmentevents, and hence this fossil record can be used to trace thechemical and dynamical evolution of the early Galaxy. Whilethe individual abundances of most metals in these stars will re-main unchanged throughout the stellar lifetimes, close exami-nation is necessary to discern exceptions to this rule.
Lithium (Li), the only metal produced during the big bang, isoften observed in unevolvedmetal-poor stars. Information on the
primordial Li abundance can be inferred from, e.g., the Spiteplateau (Spite & Spite 1982) Li abundance characteristic of mostwarm, metal-poor turnoff and subgiant stars. A wide spectrumof Spite plateau /primordial Li abundances has been inferredfrom recent studies of these stars: log "(Li) ¼ 2:37 (with an ob-servational scatter of 0.05Y0.06 dex; Melendez & Ramırez2004), log "(Li) ¼ 2:21� 0:09 (Charbonnel & Primas 2005),log "(Li) ¼ 2:04 or 2.15 (depending on the range of metallicitiesof the stars included in the fit, since their plateau has a metallicitydependence; Asplund et al. 2006), and log "(Li) ¼ 2:10 � 0:09(Bonifacio et al. 2007).10 Despite the wide range, the stellarresult does not agree with theWMAP estimate of the primordialLi abundance, log "(Li) ¼ 2:64 � 0:03 (Spergel et al. 2007).
Metal diffusion in long-lived, low-mass stars could present asolution to the problem for globular cluster stars (Korn et al.2006), while processing and depletion of 7Li by Population IIIstars prior to the formation of Population II stars could ex-plain the Li abundance found in present-day metal-poor fieldstars (Piau et al. 2006). Some objects, however, appear to haveoverabundances of Li, in contrast to the sparse Galactic pro-duction mechanisms of Li through cosmic-ray spallation, and inspite of the fact that Li is completely diluted and destroyed in thestellar atmosphere by the time the star reaches the giant branch.
It was first proposed by Cameron (1955) and Cameron &Fowler (1971) that 7Li could be synthesized via the 3He(� , �)7Beand 7Be(e��)7Li reactions during the late stages of stellar evo-lution, when a star is ascending the asymptotic giant branch(AGB). Here the outer convection zone extends down into theH-burning shell, which is enriched in 3He from proton-proton
1 Based on observations obtained with the Hobby-Eberly Telescope, which isa joint project of the University of Texas at Austin, the Pennsylvania StateUniversity, StanfordUniversity, Ludwig-Maximilians-Universitat Munchen, andGeorg-August-Universitat Gottingen.
2 Department of Astronomy, University of Texas, Austin, TX 78712-0259;[email protected], [email protected], [email protected], [email protected], [email protected].
3 McDonald Observatory, University of Texas, Fort Davis, TX 79734.4 Department of Physics, PurdueUniversity,West Lafayette, IN 47907-2036;
[email protected] Visiting Astronomer, Kitt Peak National Observatory, National Optical
AstronomyObservatory, which is operated by the Association of Universities forResearch in Astronomy (AURA), Inc., under cooperative agreement with theNational Science Foundation.
6 Dipartimento di FisicaGenerale, Universita di Torino, Torino, Italy; [email protected], [email protected].
7 Centre for Stellar and Planetary Astrophysics, Monash University, Clayton,VIC 3800, Australia.
8 Department of Physics and Astronomy, Center for the Study of CosmicEvolution, and Joint Institute for Nuclear Astrophysics, Michigan State University,East Lansing, MI 48824; [email protected].
9 Homer L. Dodge Department of Physics and Astronomy, University ofOklahoma, Norman, OK 73019; [email protected].
10 We adopt the usual spectroscopic notations that ½A/B� � log10(NA/NB)?�log10(NA/NB)� and that log "(A) � log10(NA/NH)þ 12:00, for elements A and B.
AThe Astrophysical Journal, 679:1549Y1565, 2008 June 1
# 2008. The American Astronomical Society. All rights reserved. Printed in U.S.A.
1549

chain reactions. These nucleosynthesis reactions make it indeedpossible for a star to self-enrich its atmosphere with Li, but onlyfor a very short period of time before the freshly produced Liburns again. The enrichment can be quite extreme, however,with Li abundances sometimes 1Y2 dex higher than the Spiteplateau value (e.g., Reddy & Lambert 2005). In the past decadeor so, a number of stars at roughly solar metallicity have beendiscovered that exhibit high Li abundances associated withself-enrichment. These cases have been confirmed on theoreticalgrounds (Charbonnel & Balachandran 2000) from their distinctposition on the Hertzsprung-Russell diagram.
At the heavy end of the periodic table, the neutron-capture(n-capture) elements are also useful diagnostics of stellar in-teriors and nucleosynthesis. During the last decade or so, newhigh-resolution echelle spectrographs on large-aperture telescopesand new laboratory measurements of atomic data have revolu-tionized the study of n-capture species in metal-poor stars (seeSneden et al. 2008 and references therein). In most cases, slowprocess (s-process) enrichment in metal-poor stars is associatedwith binary systems, where the primary goes through the ther-mally pulsingAGB (TP-AGB) phase and produces large amountsof s-process material. This material is transferred onto the lowermass, longer lived companion that is still observable. On the otherhand, rapid process (r-process) enrichment observed inmetal-poorstars can be associated with explosive nucleosynthesis, althoughthe exact site of the r-process has not yet been conclusivelyidentified.
Barium and europium are the heavy elements most commonlyused to diagnose the n-capture enrichment history of a starbecause they are so dominantly produced by the main s- andr-processes,11 respectively.While [Ba/Fe] or [Eu/Fe] ratios cantypically reveal the overall content of s- and r-process material ina star, the [Ba/Eu] ratio gives an indication of the relative con-tributions of the s- and r-processes to the observed star. Becauseof the physical conditions necessary to produce the n-capturespecies, it is probable that none of the observed n-capture speciesin metal-poor stars were actually created by the star they are cur-rently observed in. Some stars exhibit strong s-process enhance-ment, some exhibit strong r-process enhancement, and othersexhibit significant amounts of both s- and r-process material (seeJonsell et al. 2006 and references therein).
In this paper we present HKII 17435�00532, a metal-poor starthat possesses an unexpectedly high (for its evolutionary state)Li abundance, a significant amount of s-process material, and asmaller but nonnegligible amount of r-process material.
2. OBSERVATIONAL DATA AND MEASUREMENTS
2.1. Target Selection
The HK-II survey (Rhee 2001; J. Rhee et al. 2008, in prepa-ration) originated as an extension of the original HK objective-prism survey of Beers et al. (1985, 1992). HK-II was designed todiscover a large sample of very metal-poor red giant stars with½Fe/H � � �2:0 by using digitized objective-prism spectra andTwo Micron All Sky Survey (2MASS) JHK colors; many ofthese stars were likely to have beenmissed in the original (visual)
selection of metal-poor candidates due to an unavoidable tem-perature bias. The HK-II survey covers more than �7000 deg2
(1/6 of the entire sky), targeting the thick disk and halo of theMilkyWay, over themagnitude range 11:0 � B � 15:5. Ongoingmedium-resolution spectroscopic follow-up has newly confirmedmore than 200 red giants and subgiants with ½Fe/ H � � �2:0in the first sample selected from about 100 plates (J. Rhee &T. Beers 2008, in preparation).We have recently started the Chemical Abundances of Stars in
theHalo (CASH) Project with theHobby-Eberly Telescope (HET;Ramsey et al. 1998) located at McDonald Observatory. Thisproject aims to characterize the chemical composition of theGalactic halo by means of abundance analyses of metal-poorstars. Our goal is to build up, over the next several years, thelargest high-resolution database available for these objects to in-vestigate, inter alia, the recent claim by Carollo et al. (2007) thatthere is a chemical difference between the so-called ‘‘inner’’ and‘‘outer’’ halo populations. Furthermore, frequencies of stars withparticular chemical abundances will be established. The verymetal-poor giants identified inHK-II are one source of targets forour HET CASH Project, and the spectrum of HKII 17435�0053212 was taken as part of this project. The low metallicity ofHKII 17435�00532 was first identified in a medium-resolutionfollow-up spectrum obtained in 2005 May at the 2.1 m telescopeof Kitt Peak National Observatory. Additional stars and largersamples will be presented in separate papers.
2.2. Observations and Data Reduction
The star HKII 17435�00532 was observed on 2007 February9 and 28 with the High Resolution Spectrograph (HRS; Tull1998) at the HET at McDonald Observatory as part of normalqueue mode scheduled observing (Shetrone et al. 2007). Ourspectra have R � 15; 000 and were taken through the 300 slit withthe 316g cross-disperser setting. The spectral coverage is 4120Y7850 8, with a small break from 5930 to 6030 8 resulting fromthe gap between the blue and red CCDs of the HRS. One 10minute exposure was taken on each night; we scheduled the twovisits at least 2 weeks apart to test for radial velocity variations.For the reduction of all HET/HRS data obtained through the
CASH Project we set up the IDL-based REDUCE data reductionsoftware package (Piskunov&Valenti 2002). The extracted spec-tra were combined after correcting for any heliocentric radialvelocities. Overlapping echelle orders were merged together toproduce the final spectrum. The final signal-to-noise ratio (S/N)values per pixel measured from clean, line-free regions of thecontinuum in the REDUCE spectrum range from�50/1 at 44808to �130/1 at 5730 8 to �160/1 at 6700 8. More details on thisreduction procedure for the entire HET CASH sample will begiven in A. Frebel et al. (2008, in preparation).We also reduced the data with standard IRAF13 routines in the
echelle and onedspec packages for overscan removal, bias sub-traction, flat-fielding, scattered light removal, and order extraction.
11 Two methods are commonly used to determine the relative contributionsof the s- and r-processes to solar system (SS) material, the classical method(Clayton et al. 1961; Seeger et al. 1965; Kappeler et al. 1989) and the stellarmodel (Arlandini et al. 1999). The classical method predicts that 85% of the Ba inSS material originated in the s-process and that 97% of the Eu in SS materialoriginated in the r-process (Simmerer et al. 2004). The stellar model predicts that81% of the Ba in SS material originated in the s-process and that 96% of the Euin SS material originated in the r-process.
12 In order to distinguish two source surveys, the stars from the HK-II surveyuse the alphabetic prefix ‘‘HKII’’ while the stars from the original HK survey usethe prefixes ‘‘BS’’ and ‘‘CS.’’ The HK-II survey uses the exact same plates as theoriginal HK survey, so the first five digits (following the alphabetic prefix) in thestar names should be identical. However, running ID numbers ( last five digits)are completely different. For example, the star HKII 17435�00532 is differentfrom the star BS 17435�532, but HKII 17435�00532 is a rediscovery of the starBS 17435�012, which was noted as being a metal-poor candidate during theinitial visual inspection of the HK plates.
13 IRAF is distributed by the National Optical Astronomy Observatory,which is operated by the Association of Universities for Research in Astronomy,Inc., under cooperative agreement with the National Science Foundation.
ROEDERER ET AL.1550 Vol. 679

Individual orders were not merged together. The final S/N valuesfrom the IRAF spectrum are very comparable to the REDUCEspectrum. Equivalent widths were also measured for 121 linesin common to the two spectra to test any systematic differences.We find amean offset of � ¼ �3 � 8 m8 (where� is defined asEWREDUCE � EWIRAF). There are no statistically significant trendswith either equivalent width or wavelength between the two dif-ferently reduced sets of spectra.
To obtain additional information on the radial velocity ofHKII 17435�00532, two supplemental exposures were takenon 2007 July 15 and 2007 August 5 with the Cross-DispersedEchelle Spectrometer (Tull et al. 1995) on the Harlan J. Smith2.7 m Telescope at R � 60; 000. Reduction was performed usingthe standard IRAF routines. The exposure times were 1200 s,yielding S/N � 10/1 at 4480 8, �20/1 at 5730 8, and �25/1 at67008. Since the S/N of the 2.7 m spectra is much less than theS/N of the HET/HRS spectra, these spectra were solely used forthe radial velocity analysis and not for the abundance analysis.
2.3. Radial Velocity
The radial velocities were measured in the IRAF reducedspectrum by combining the orders covering the wavelengths4900Y58008, which aremostly clear of telluric features and skyemission lines. The spectra were then cross-correlated againstthe Arcturus atlas (Hinkle et al. 2000) spectra using the IRAFtask fxcor to yield a relative velocity. Heliocentric correctionswere made using the IRAF task rvcorrect. We also cross-correlated the telluric A band against a model of this band weconstructed to yield a zero-point correction to the wavelengthscale; this is necessary because the ThAr fibers are separate fromthe science fibers in the HRS. In Table 1 we have listed the epochsof observations, as well as the resulting velocities. The weightedaverage velocity is 38.9 km s�1 with an error of the mean of0.3 km s�1. The errors in the individual velocity measurementsinclude the systematic errors from the telluric features and theerror in the relative velocity with respect to Arcturus. All of thevelocity measurements are within 1 � of the average velocity.The first and last observations of this star are spaced nearly6 months apart, and successive observations are separated bymore than 2 weeks. We find no evidence from these radial ve-locity measurements that HKII 17435�00532 is in a binary sys-tem. If it were in a binary, it must have a very long period and/oran amplitude smaller than � 1.0 km s�1, a result of a face-onorbit with very large sin i.
2.4. Atmospheric Parameters
Basic stellar data for HKII 17435�00532 are shown in Table 2.For our analysis, we use themost recent version (2002) of the LTEspectrum analysis code MOOG (Sneden 1973). We use modelatmospheres computed from the Kurucz (1993) grid without con-vective overshooting. Interpolation software for the Kurucz gridhas been kindly provided by A. McWilliam & I. Ivans (2003,
private communication).Wemeasure equivalent widths of 86 Fe ilines and six Fe ii lines in HKII 17435�00532 by fitting Gaussianprofiles with the SPECTRE code (Fitzpatrick & Sneden 1987).Our equivalentwidthmeasurements for all species inHKII 17435�00532 are presented in Table 3.
TheSchlegel et al. (1998) dustmaps predictE(B� V ) ¼ 0:042in the direction of HKII 17435�00532. This is the expected red-dening value at infinite distance. At the high Galactic latitude ofour halo star, b ¼ þ73�, its distance implies that the reddeningalong the line of sight to this star is essentially the reddening atinfinity (see eq. [4] of Mendez & van Altena 1998). The earlierpredictions of Burstein & Heiles (1982) yield E(B� V )P 0:01.We also attempt to use the Munari & Zwitter (1997) calibrationsbetween the interstellar Na D1 line equivalent width and red-dening. The interstellar Na D lines suffer from telluric emissionand blending with the stellar lines in our HET spectra (and nosimultaneous sky spectra were obtained), and these lines fallbetween echelle orders in our higher resolution McDonald spec-tra. Given these difficulties, our interstellar Na D1 equivalentwidth should be interpreted as an upper limit. If we naively adoptthis equivalent width, the Munari & Zwitter (1997) calibrationsthen predict an uninteresting upper limit for the reddening ofE(B� V )P 0:12, and larger equivalent width estimates wouldincrease the reddening upper limit. Lacking further information,we adopt the Schlegel et al. (1998) reddening estimate.
TABLE 1
Summary of Radial Velocity Measurements
HJD
RV
(km s�1) Facility
2,454,140.79715............................. 38.61 (0.64) HET+HRS
2,454,159.73386............................. 38.77 (0.57) HET+HRS
2,454,297.61639............................. 39.36 (0.59) McD2.7m+cs21
2,454,318.60116............................. 38.79 (1.07) McD2.7m+cs23
TABLE 2
Basic Stellar Data and Model Atmosphere Parameters
Quantity Value Source
R.A. (J2000.0) ........................................ 11h49m03.3s 1
Decl. (J2000.0)........................................ +16�58041.700 1
V .............................................................. 13.145 � 0.166 2
I ............................................................... 12.237 � 0.067 2
J............................................................... 11.534 � 0.021 3
H.............................................................. 11.121 � 0.023 3
K .............................................................. 11.049 � 0.020 3
E(B� V )................................................. 0.042 4
log (L /L�)................................................ 2.01 � 0.50 1
TeA (K).................................................... 5200 � 150 1
log g......................................................... 2.15 � 0.4 1
vt ( km s�1).............................................. 2.0 � 0.3 1
[M/H] ..................................................... �1.85 � 0.23 1
[Fe/H] ..................................................... �2.23 � 0.23 1
References.— (1) This study; (2) TASS; (3) 2MASS; (4) Schlegel et al.1998.
TABLE 3
Equivalent Width Measurements
Species Z
k(8)
EP
(eV) log g f
EW
(m8)
Na i................................ 11 5682.63 2.100 �0.699 20.0
11 5688.21 2.100 �0.456 33.0
Mg i............................... 12 4571.10 0.000 �5.393 73.7
12 4702.99 4.330 �0.380 113.9
12 5183.62 2.720 �0.158 233.2
12 5528.42 4.330 �0.500 87.0
K i ................................. 19 7698.97 0.000 �0.170 47.6
Ca i ................................ 20 4435.68 1.890 �0.520 66.7
Notes.—Table 3 is published in its entirety in the electronic edition of theAstrophysical Journal. A portion is shown here for guidance regarding its formand content.
HET CASH PROJECT. I. 1551No. 2, 2008
We derive the effective temperature of HKII 17435�00532from recent color-TeA calibrations of Alonso et al. (1996, 1999).We collectedV, I (TASS: TheAmateur Sky Survey, ver. 2; Droegeet al. 2006), J, H, and K (2MASS14,15; Skrutskie et al. 2006)broadband photometry measurements from the literature.16 Usingthe dereddened (V � I ), (J � H ), (J � K ), and (V � K ) colorsderived from TASS and 2MASS photometry, we derive a meantemperature of 5173 K with a standard deviation of 82 K.17 Toestimate the amount of systematic uncertainty, we compare withthe temperature scale defined by the Ramırez&Melendez (2005a,2005b) (V � J ), (V � H ), and (V � K ) calibrations; at themetallicity of HKII 17435�00532, our (V � I ) falls beyond therange of applicability of their calibrations. These three color-TeAcalibrations predict a mean of 5079 K, about 100 K lower thanthe Alonso et al. (1999)mean. If wewere to adopt zero reddeningor twice the reddening predicted by the Schlegel et al. (1998)maps, our temperatures would differ by roughly 130 K. Con-sidering all of these matters, we round the Alonso et al. (1999)predicted temperature to 5200 K and adopt a conservative totaluncertainty of 150 K.
Our method for deriving the surface gravity requires that, forour adopted effective temperature, the abundances derived fromneutral and ionized lines of Fe agree. We neglect the effects ofnon-LTE (NLTE) line formation, which may affect the Fe i abun-dance measurements at the�0.1 dex level (e.g., Asplund 2005).The microturbulence is measured by requiring that the abun-dances derived from strong and weak lines of Fe i agree. Theseparameters are varied iteratively until we arrive at our finalvalues. [Fe/H] is defined by the Fe abundance for the final set ofTeA, log g, and vt. We increase the overall metallicity Z of theatmosphere by +0.4 dex to account for the extra electrons fromthe � -elements that contribute to the H� continuous opacity; thisartificial increase alters our derived abundances of the electron-donating elements by P0.01 dex and is completely negligiblewhen elemental abundance ratios are considered (see, e.g., x 4.3of Roederer et al. 2008). We adopt the following atmosphericparameters for HKII 17435�00532: (TeA; log g; vt; ½Fe/H �) ¼(5200 K; 2:15; 2:0 km s�1; �2:23). These values are also dis-played in Table 2.
An alternate method for deriving TeA, log g, and [Fe/H] usesthe HET calibration sample for the Sloan Digital Sky Survey tofit a region around the Mg i b triplet (see discussion in AllendePrieto et al. 2008). For the sum of the two individual spectra ofHKII 17435�00532, this method finds (TeA; log g; ½Fe/H �) ¼(4978 � 72 K; 2:06 � 0:13; �2:26 � 0:06). While the gravityand metallicity are in good agreement with our spectroscopic
values, the temperature is about 200 K cooler. The gravity ob-tained from the Fe ionization balance is also not well constrainedbecause we are only able to measure equivalent widths of sixFe ii lines, and we adopt an uncertainty of �0.4 in log g. We alsoadopt�0.3 km s�1 as the uncertainty in vt. The uncertainty in themetallicity, �0.23 dex, is found by combining the uncertaintiesin the other atmospheric parameters and the line-to-line Fe i abun-dance scatter in quadrature.
3. EVOLUTIONARY STATUS OF HKII 17435�00532
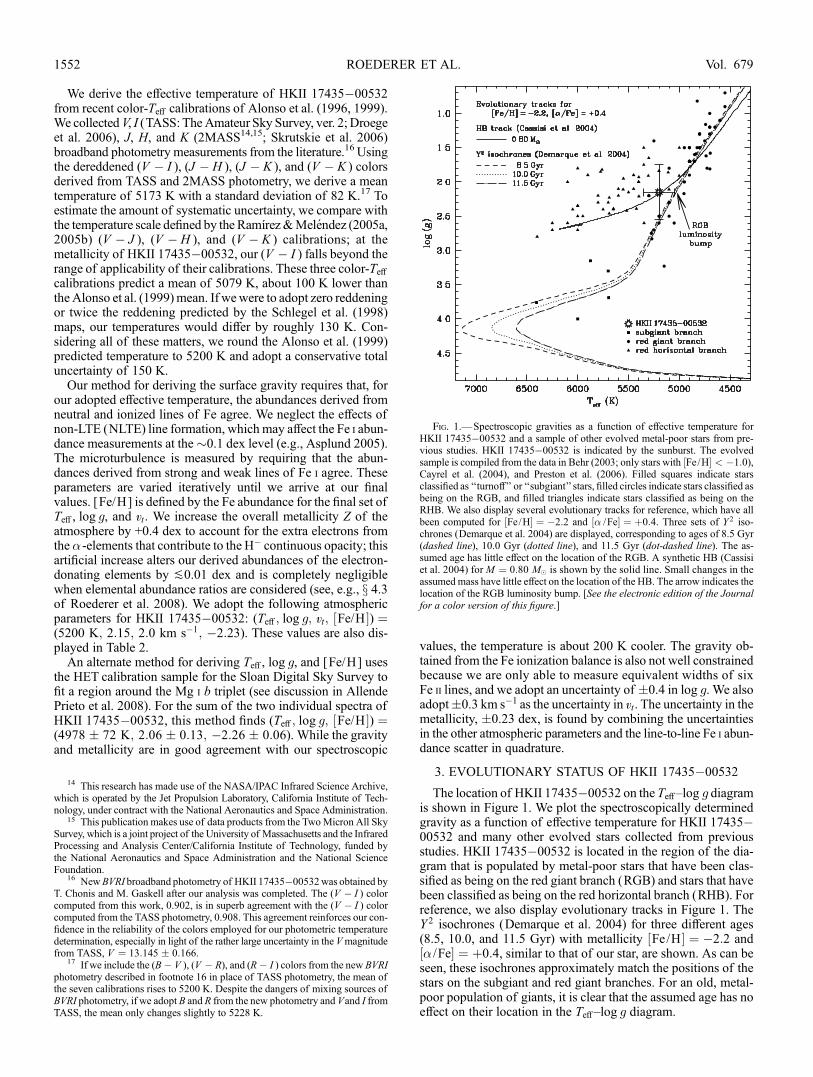
The location of HKII 17435�00532 on the TeAYlog g diagramis shown in Figure 1. We plot the spectroscopically determinedgravity as a function of effective temperature for HKII 17435�00532 and many other evolved stars collected from previousstudies. HKII 17435�00532 is located in the region of the dia-gram that is populated by metal-poor stars that have been clas-sified as being on the red giant branch (RGB) and stars that havebeen classified as being on the red horizontal branch (RHB). Forreference, we also display evolutionary tracks in Figure 1. TheY 2 isochrones (Demarque et al. 2004) for three different ages(8.5, 10.0, and 11.5 Gyr) with metallicity ½Fe/H� ¼ �2:2 and½� /Fe� ¼ þ0:4, similar to that of our star, are shown. As can beseen, these isochrones approximately match the positions of thestars on the subgiant and red giant branches. For an old, metal-poor population of giants, it is clear that the assumed age has noeffect on their location in the TeAYlog g diagram.
Fig. 1.—Spectroscopic gravities as a function of effective temperature forHKII 17435�00532 and a sample of other evolved metal-poor stars from pre-vious studies. HKII 17435�00532 is indicated by the sunburst. The evolvedsample is compiled from the data in Behr (2003; only stars with ½Fe/H� < �1:0),Cayrel et al. (2004), and Preston et al. (2006). Filled squares indicate starsclassified as ‘‘turnoff’’ or ‘‘subgiant’’ stars, filled circles indicate stars classified asbeing on the RGB, and filled triangles indicate stars classified as being on theRHB. We also display several evolutionary tracks for reference, which have allbeen computed for ½Fe/H� ¼ �2:2 and ½� /Fe� ¼ þ0:4. Three sets of Y 2 iso-chrones (Demarque et al. 2004) are displayed, corresponding to ages of 8.5 Gyr(dashed line), 10.0 Gyr (dotted line), and 11.5 Gyr (dot-dashed line). The as-sumed age has little effect on the location of the RGB. A synthetic HB (Cassisiet al. 2004) for M ¼ 0:80 M� is shown by the solid line. Small changes in theassumedmass have little effect on the location of the HB. The arrow indicates thelocation of the RGB luminosity bump. [See the electronic edition of the Journalfor a color version of this figure.]
14 This research has made use of the NASA/IPAC Infrared Science Archive,which is operated by the Jet Propulsion Laboratory, California Institute of Tech-nology, under contract with the National Aeronautics and Space Administration.
15 This publication makes use of data products from the TwoMicron All SkySurvey, which is a joint project of the University of Massachusetts and the InfraredProcessing and Analysis Center/California Institute of Technology, funded bythe National Aeronautics and Space Administration and the National ScienceFoundation.
16 NewBVRI broadband photometry of HKII 17435�00532was obtained byT. Chonis and M. Gaskell after our analysis was completed. The (V � I ) colorcomputed from this work, 0.902, is in superb agreement with the (V � I ) colorcomputed from the TASS photometry, 0.908. This agreement reinforces our con-fidence in the reliability of the colors employed for our photometric temperaturedetermination, especially in light of the rather large uncertainty in the Vmagnitudefrom TASS, V ¼ 13:145 � 0:166.
17 If we include the (B� V ), (V � R), and (R� I ) colors from the new BVRIphotometry described in footnote 16 in place of TASS photometry, the mean ofthe seven calibrations rises to 5200 K. Despite the dangers of mixing sources ofBVRI photometry, if we adopt B and R from the new photometry and Vand I fromTASS, the mean only changes slightly to 5228 K.
ROEDERER ET AL.1552 Vol. 679

We also show a synthetic horizontal branch (HB) track (Cassisiet al. 2004) forM ¼ 0:80 M�. At lowmetallicity, these tracks areonly available for Y ¼ 0:23, ½� /Fe� ¼ 0:0, and limited values ofthe metallicity Z. To scale Z of these tracks for an� -enhancementof +0.4, we use the formula given in Kim et al. (2002; see also,e.g., Salaris et al. 1993). A metallicity ½Fe/H� �2:2 with½� /Fe� ¼ þ0:4 corresponds to Z 2:6 ; 10�4, which we obtainfrom the Cassisi et al. (2004) tracks by interpolation between theZ ¼ 1 ; 10�4 and Z ¼ 3 ; 10�4 tracks. We follow the prescrip-tion given in Preston et al. (2006) to convert the log (L/L�) givenby Cassisi et al. (2004) to log (g/g�). On the scale of this figure,the location of the HB is very insensitive to small changes in theassumed mass for stars on the HB. Preston et al. (2006) per-formed a comparison of several different sets of HB tracks to theCassisi et al. (2004) set. They found differences in log L (which isequivalent to �log g) to be P0.15 dex, which is well within theuncertainty in our log L determination for HKII 17435�00532.
HKII 17435�00532 coincidentally appears to lie on theM ¼0:80 M� HB track; however, due to the large uncertainties in ourdetermination of the temperature and surface gravity of this star,we cannot draw any firm conclusions from this. This star couldpossibly be ascending the RGB for the first time or ascending theearly AGB from the HB. A higher gravity or cooler temperaturewould place the star on the RGB. A lower gravity or warmer tem-perature would place the star above theM ¼ 0:80 M� HB trackin the region of the diagram populated by (presumably) lowermass RHB stars (cf. Fig. 15 of Preston et al. 2006). This is rea-sonable because other metal-poor stars are found in this region.HKII 17435�00532 cannot be in theTP-AGBphase,whichwouldrequire log gP 0:9 andTeAP4800K (see, e.g., Fig. 3 of Masseronet al. 2006). To achieve Fe ionization balance at log g ¼ 0:9 wouldrequire an NLTE correction of roughly�0.5 dex to the Fe i abun-dance, which ismuch greater than has been suggested byAsplund(2005).
From fundamental relations, we calculate log (L/L�) ¼ 2:01 �0:50 for HKII 17435�00532, assuming M ¼ 0:8 � 0:1 M� forthis star and TeA ¼ 5780K and log g ¼ 4:44 for the Sun. The un-certainty in log L is dominated by our uncertainty in the gravity.
4. VALIDATION OF OUR ABUNDANCEANALYSIS TECHNIQUES
We chose suitable elemental lines for our abundance analysisin the range of �4120Y78508 from the extensive line lists of sixrecent studies of abundances in very metal-poor stars (Fulbright2000; Cayrel et al. 2004; Honda et al. 2004b; Barklem et al.2005; Ivans et al. 2006; Frebel et al. 2007). We adopt the log g fvalues employed by these studies for all species except Cr i, whoselog g f values were recently redetermined by Sobeck et al. (2007).To confirm the integrity of our line list and validate our abundanceanalysis method for measuring chemical compositions, we car-ried out a basic abundance analysis of the well-studied cool giantHD 122563 and the warmmain-sequence turnoff star HD 84937.The spectra have R � 80; 000, very high S/N, and were takenfrom the VLT UVES archive.
Wemeasure equivalent widths for 227 Fe i and 35 Fe ii lines inHD 122563 and 197 Fe i and 26 Fe ii lines in HD 84937. Wederive (TeA; log g; vt; ½Fe/H �) ¼ (4570 � 100 K; 0:85 � 0:3;2:0 � 0:3 km s�1; �2:81 � 0:15) for HD 122563 and (6300 �100 K; 4:0 � 0:3; 1:2 � 0:3 km s�1; �2:28 � 0:12) for HD84937 using the methods described in x 2.4. In Table 4 wecompare our derived parameters with a number of other recenthigh-resolution studies. For both HD 122563 and HD 84937,each of our derived parameters agrees with the mean from otherstudies within their mutual 1 � uncertainties.
We also measure 204 equivalent widths for 17 other species(11 � Z � 30) in HD 122563 and 161 equivalent widths for 16other species in HD 84937. In Figure 2 we compare our derivedabundances in these two stars with the abundances derived bytwo previous studies.
In HD 122563, the derived abundances agree with the Hondaet al. (2004a, 2004b) abundances within the uncertainties for allspecies except Cr, Ni, and Cu, which differ by�0.29, +0.27, and�0.44 dex, respectively, where the differences are in the sense of(our study)� (other study). We measured equivalent widths for16 Cr i lines and five Cr ii lines, whereas Honda et al. (2004a,2004b) only used three and two lines of these species, respec-tively. For Cr, only 0.02 dex of the difference can be accountedfor by our use of updated Cr i log g f values from Sobeck et al.(2007). Another 0.14 dex results from the different atmosphericparameters derived in these two studies. This is sufficient to bringthe two Cr abundance measurements into agreement within theuncertainties. Honda et al. (2004a, 2004b) derive the Ni abun-dance from two strong lines, whereas we measure 21 Ni lines.The equivalent widths of the two lines common to both studiesare in good agreement; therefore, we attribute the discrepancy inthe derived Ni abundances to the number of lines measured. TheCu abundance in both the Honda et al. (2004a, 2004b) studiesand our study was measured from the Cu i line at 51058; the dif-ference in the derived abundances can be traced to the different
TABLE 4
Comparison of Model Atmosphere Parameters
Reference
TeA(K) log g
vmicro
(km s�1) [Fe/H]
HD 122563
This study .......................................... 4570 0.85 2.0 �2.81
Aoki et al. (2005) .............................. 4600 1.1 2.2 �2.62
Barbuy et al. (2003) model 1 ............ 4600 1.5 2.0 �2.71
Barbuy et al. (2003) model 2 ............ 4600 1.1 2.0 �2.80
Fulbright (2000)................................. 4425 0.6 2.75 �2.60
Fulbright & Johnson (2003) .............. 4650 1.24 1.85 �2.63
Honda et al. (2004a).......................... 4570 1.1 2.2 �2.77
Johnson (2002) .................................. 4450 0.50 2.3 �2.65
Mishenina & Kovtyukh (2001) ......... 4570 1.1 1.2 �2.42
Roederer et al. (2008)........................ 4570 0.55 2.4 �2.83
Takada-Hidai et al. (2005)................. 4650 1.36 1.9 �2.65
Thevenin (1998)................................. 4582 0.8 2.4 �2.60
Westin et al. (2000) ........................... 4500 1.3 2.5 �2.70
Mean .............................................. 4564 1.03 2.14 �2.66
Standard deviation ......................... 69 0.33 0.40 0.11
HD 84937
This study .......................................... 6300 4.0 1.2 �2.28
Bihain et al. (2004)............................ 6277 4.03 1.0 �2.06
Fulbright (2000)................................. 6375 4.1 0.8 �2.0
Gratton et al. (2003) .......................... 6290 4.02 1.25 �2.18
Jonsell et al. (2005) ........................... 6310 4.04 1.5 �1.96
Mishenina & Kovtyukh (2001) ......... 6250 3.8 1.5 �2.00
Nissen et al. (2007) ........................... 6357 4.07 1.5 �2.11
Smith et al. (1993)............................. 6090 4.0 1.5 �2.4
Thevenin (1998)................................. 6222 4.0 1.3 �2.10
Zhang & Zhao (2005) ....................... 6261 4.07 1.8 �1.93
Mean .............................................. 6270 4.01 1.35 �2.08
Standard deviation ......................... 75 0.09 0.30 0.14
Note.—The mean and standard deviation calculations do not include thevalues derived in this study.
HET CASH PROJECT. I. 1553No. 2, 2008

equivalent width measurements of this very weak line, 3.3 and1.7 m8, respectively.
In HD 84937, the derived abundances agree with the Fulbright(2000) abundances within the uncertainties for all species exceptMg, V, and Fe, which differ by �0.15, +0.24, and �0.20 dex,respectively, again in the sense of (our study)� (other study).
We selected the Fulbright (2000) study for comparison because,in our efforts to compare with a set of homogeneous measure-ments, it offered themost elements in commonwith ourmeasure-ments. The Mg and Vabundance discrepancies can be explainedby the different atmospheric parameters, which account for 0.04and 0.06 dex of the difference, respectively, reducing the dis-crepancies to less than the uncertainties. When compared withmany other studies (in Table 4), our [Fe/H] is in agreement withthese studies within their mutual 1 � uncertainties, so we do notconsider it to be discrepant.We also smooth theUVES spectra of HD122563 andHD84937
to R � 15;000 to simulate the spectral resolving power employedin our study. We do not degrade the S/N of these spectra to matchthe S/N of ourHETspectra; the purpose of smoothing the spectra isto allow us to identify lines that are blended at the lower spectralresolution and remove them from our final line list. We accomplishthis by noting the spuriously high abundances produced by theblended lines in a line-by-line comparison with the abundancesderived from the higher resolution spectra.We thenmeasure equiv-alent widths from unblended lines in each star and rederive ele-mental abundances using the same atmospheric parameters. Theabundance ratios for both stars are identical to the abundance ratiosdetermined from the R � 80; 000 spectra within the measurementuncertainties. From this andother comparisons given above,we con-clude that our line list and abundance analysis technique are reliable.
5. ABUNDANCE ANALYSIS
5.1. Comments on Individual Species
In Table 5 we list our derived LTE abundances, along withNLTE corrections when available, for 23 elements in HKII17435�00532. We reference the elemental abundance ratios tothe solar photospheric abundances given by Grevesse & Sauval
Fig. 2.—Comparison of the abundances derived in our study and two previousstudies of HD 122563 and HD 84937, Honda et al. (2004a, 2004b) and Fulbright(2000).�[X /Fe] is in the sense of (our study)� (other study). For Fe, we show�[Fe /H] rather than �[X /Fe].
TABLE 5
Abundance Summary for HKII 17435�00532
Species
LTE
log "
NLTE
log "
LTE
[X/Fe]a � Number of Lines log "�a Notes
Fe i ........................................ 5.27 . . . �2.23b 0.23 86 7.50 EW
Fe ii ....................................... 5.27 . . . �2.23b 0.17 6 7.50 EW
Li i......................................... 2.06 2.16 . . . 0.16 1 1.10 Synth
C............................................ 6.97 . . . +0.68 0.3 . . . 8.52 Synth
O i ......................................... 7.56 �7.2 +1.06 0.27 3 8.73 EW
Na i........................................ 4.79 �4.7 +0.69 0.16 2 6.33 EW
Mg i....................................... 5.77 �5.9 +0.42 0.25 4 7.58 EW
K i ......................................... 3.33 �2.9 +0.44 0.17 1 5.12 EW
Ca i ........................................ 4.56 . . . +0.43 0.19 13 6.36 EW
Sc ii ....................................... 1.14 . . . +0.20 0.21 3 3.17 EW
Ti i ......................................... 3.01 . . . +0.22 0.22 9 5.02 EW
Ti ii ........................................ 3.12 . . . +0.33 0.20 9 5.02 EW
Cr i ........................................ 3.29 . . . �0.15 0.16 4 5.67 EW
Mn i....................................... 2.85 . . . �0.31 0.24 1 5.39 EW
Ni i ........................................ 4.13 . . . +0.11 0.18 3 6.25 EW
Sr ii ........................................ 1.05 . . . +0.36 0.26 1 2.92 Synth
Y ii ........................................ 0.18 . . . +0.17 0.19 4 2.24 Synth
Zr ii........................................ 1.14 . . . +0.77 0.27 2 2.60 Synth
Ba ii ....................................... 0.76 . . . +0.86 0.29 4 2.13 Synth
La ii ....................................... �0.28 . . . +0.78 0.21 6 1.17 Synth
Ce ii ....................................... 0.52 . . . +1.17 0.20 4 1.58 Synth
Pr ii ........................................ �0.42 . . . +1.10 0.20 3 0.71 Synth
Nd ii ...................................... 0.31 . . . +1.04 0.19 12 1.50 Synth
Sm ii ...................................... �0.49 . . . +0.73 0.22 3 1.01 Synth
Eu ii ....................................... �1.24 . . . +0.48 0.20 2 0.51 Synth
a Solar photospheric values from Grevesse & Sauval (2002).b [Fe /H] is shown here.
ROEDERER ET AL.1554 Vol. 679

(2002). These abundances have been derived primarily fromanalyses using one-dimensional (1D) hydrostatic model atmo-spheres under the assumption of LTE, as we have done in ourcurrent study of HKII 17435�00532.
We synthesize the Li i k6707 doublet using the line list of Hobbset al. (1999), who compiled the hyperfine structure component
wavenumbers of this resonance line from measurements bySansonetti et al. (1995) and the oscillator strength measure-ments of Yan et al. (1998). For the purposes of this paper, wecan assume that all of the Li present is 7Li without alteringany of our conclusions. Our synthesis of this line is shown inFigure 3. We derive log "(Li)LTE ¼ 2:06. Using the Carlsson
Fig. 3.—Portions of our spectrum of HKII 17435�00532. The top panel displays part of our synthesis of the CH G band near 4300 8, the middle panel shows thespectral window around the Na i kk5682 and 5688 lines, and the bottom panel shows our synthesis of the Li i k6707 resonance line. In the top and bottom panels, the solidline represents our best-fit synthesis, while the dashed lines represent variations in the best-fit abundance. The dot-dashed line represents a synthesis with no CH or Lipresent. The observed spectrum is indicated by filled squares. In the middle panel, the observed spectrum is indicated by the histogram and the dotted line indicates thelocation of the continuum. In the bottom panel, the relative strengths and positions of the hyperfine components of 7Li are represented by solid line segments, while the 6Licomponents are represented by dotted line segments. We can assume that only 7Li is present without altering any of our conclusions. [See the electronic edition of theJournal for a color version of this figure.]
HET CASH PROJECT. I. 1555No. 2, 2008

et al. (1994) NLTE corrections for the k6707 line, we findlog " (Li)NLTE ¼ 2:16 � 0:16.
We synthesize portions of the CH G band between 4290 and43308 to determine the C abundance. A portion of this region isshown in Figure 3. We adopt the CH line list of B. Plez (2006,private communication). Because our C abundance is derivedfrom molecular features that are very temperature sensitive in a1D model atmosphere, it is likely that the true C abundance issomewhat lower, as has been found by Asplund et al. (2005)when analyzing atomic and molecular C features in the solarspectrum using three-dimensional (3D) hydrodynamical modelatmospheres. We cannot estimate the 12C/13C ratio from theCH G band at our spectral resolution and S/N levels.
The [O i] lines at 6300 and 6363 8, usually taken as the bestO abundance indicator in metal-poor stars, are contaminated bytelluric features. We measure equivalent widths for the O i tripletat 7771, 7774, and 7775 8, adopt the log g f values from Wieseet al. (1996), and find log "(O)LTE ¼ 7:56 � 0:27. As summa-rized in Kiselman (2001), the line source function for this tripletwill show strong departures from LTE, always in the direction ofunderestimating the line strength and hence overestimating theabundance in LTE relative to NLTE. Kiselman (2001) adopts anNLTE correction of roughly �0.1 dex for solar-type stars witha similar O abundance, Nissen et al. (2002) found corrections ofroughly �0.1 to �0.2 dex for metal-poor main-sequence andsubgiant stars, and Garcıa Perez et al. (2006) found correctionsof roughly �0.1 dex for metal-poor subgiant and giant stars.Garcıa Perez et al. (2006) also found that the O abundances de-rived from the triplet were roughly +0.1Y0.3 dex higher thanwhen derived from the [O i] lines for stars in their sample with atemperature similar to HKII 17435�00532; this difference isalso presumably due to NLTE effects. Cavallo et al. (1997) founda similar effect in their sample of metal-poor subdwarfs and giants,and they reported a difference of +0.53 dex between the tripletand the [O i] lines.Adding the two corrections adopted fromGarcıaPerez et al. (2006), we arrive at a total NLTE correction for HKII17435�00532 of roughly�0.3 to�0.4 dex.We therefore derivelog "(O)NLTE � 7:2 dex for HKII 17435�00532.
Both lines in the Na i doublet at 5889 and 5895 8 are blendedwith interstellar absorption lines and telluric emission lines. Therelative radial velocity of HKII 17435�00532 at the time of ourobservations does not allow us to separate these components fromthe stellar absorption lines. Instead, wemeasure equivalent widthsfrom theNa i lines at 5682 and 56888. The spectral region aroundthese lines is shown in Figure 3. Gratton et al. (1999) offer NLTEcorrections for these lines inmetal-poor giants, butAsplund (2005)notes that their corrections for giants are at odds with other cal-culations for these lines. Gehren et al. (2004) studied the NLTEabundances of only dwarfs and early subgiants, so we cannot in-fer corrections from their work. Takeda et al. (2003) suggest thatNLTE effects for these lines will be relatively small (P�0.1 dex).
We derive Mg i abundances from equivalent width measure-ments of four lines. NLTE corrections for two of these lines,kk4571 and 5183, have been presented by Gratton et al. (1999),who estimate corrections of roughly +0.1Y0.15 dex in metal-poorgiants. Gehren et al. (2004) found corrections for dwarfs andsubgiants with similar metallicity to HKII 17435�00532 that areroughly +0.1 dex.
Wemeasure an equivalent width from the K i resonance line at76988. The electron structure of K i is similar to Na i; therefore,both elements will be sensitive to similar NLTE effects in stel-lar atmospheres (Bruls et al. 1992). We use the interpolationsoftware kindly provided by Y. Takeda (2007, private commu-nication) to estimate the NLTE correction from the analysis
performed by Takeda et al. (2002). The correction is rather large,roughly �0.4 dex.We do not adopt any NLTE corrections for the remaining six
light species that were detected: Ca, Sc, Ti, Cr, Mn, and Ni.We measure abundances for 10 n-capture elements (Sr, Y, Zr,
Ba, La, Ce, Pr, Nd, Sm, and Eu) in HKII 17435�00532 by gen-erating synthetic spectra for each line. Relative wavelengths forthe hyperfine structure and isotopic components were drawn fromMcWilliam (1998) for the Ba ii k4554 resonance line. All La iilines were synthesized with the hyperfine structure presented inLawler et al. (2001a) and Ivans et al. (2006). Pr ii lines weresynthesized from the hyperfine A constants presented in Ivarssonet al. (2001). Both Eu ii lines were synthesized with the hyper-fine structure presented in Lawler et al. (2001b) and Ivans et al.(2006). Each of these species has notable hyperfine splitting,and thus it is necessary to synthesize the hyperfine structureand isotope shifts in order to derive accurate abundances. Ourspectrum of HKII 17435�00532 does not extend far enoughinto the blue to observe the stronger transitions from many ofthe heavier n-capture species, such as the Pb i k4057 line. Wenote that no Tc is detected at the kk4238, 4262, and 4297 linesin HKII 17435�00532, and we only obtain an upper limit oflog "(Tc)Pþ 0:5.
5.2. Uncertainties
Total uncertainties in the derived elemental abundances wereestimated by adding uncertainties in the log g f values, uncertain-ties in the EW resulting from continuum placement, the statis-tical scatter associated with measuring multiple lines of eachspecies, and changes in the derived abundance in response to ouruncertainties in the atmospheric parameters in quadrature. Thestatistical scatter is �0.1Y0.2 dex for most species with morethan�5 lines analyzed; for species with fewer than�5 lines, theuncertainty in the continuum placement for individual lines wasfound to contribute�0.1Y0.2 dex to the overall abundance errorbudget. For neutral species, the effective temperature uncertain-ties translate into abundance uncertainties �0.15 dex, and forsingly ionized species the surface gravity uncertainties translateinto abundance uncertainties �0.10 dex. For a few species withseveral strong lines (Mg, Ca, Fe, Ti, and Ni), the microturbu-lent velocity uncertainties translate into abundance uncertain-ties �0.05 dex. Uncertainties in the log g f values and overallmetallicity of the model atmosphere result in abundance uncer-taintiesP0.05 dex. One extreme case is C, whose abundance wasderived from molecular CH bands; a change in TeA by �150 Kchanges the C abundance by approximately �0.30 dex, whichdominates over changes in the other atmospheric parameters.
6. RESULTS
6.1. Lithium
Contrary to expectations from the evolved nature of HKII17435�00532, we have detected the Li k6707 line, deriving anabundance of log "(Li)NLTE ¼ 2:16 � 0:16. This is consistentwith the Li abundance of unevolved metal-poor stars on theSpite plateau. The nearly constant level of Li in stars on the Spiteplateau is only found for dwarfs and subgiants with TeAk 5700K,which is much warmer than the temperature of HKII 17435�00532 (e.g., Pilachowski et al. 1993; Ryan et al. 1996; Ryan &Deliyannis 1998). The Li enrichmentmechanism of HKII 17435�00532 is likely unrelated to warm metal-poor turnoff stars, suchas CS 22898�027 and LP 706-7. These stars have metallicitiesas low as or lower than HKII 17435�00532 and nearly identicalLi abundances, yet they have (TeA; log g) � (6300 K; 4:0) and
ROEDERER ET AL.1556 Vol. 679

(6000 K, 3.8), respectively (Thorburn & Beers 1992; Norriset al. 1997; Preston & Sneden 2001). The different evolutionarystates of these stars indicate that different explanations for the Lienrichment may be necessary. High levels of Li have been ob-served in other evolved stars, too, but most of these stars havemetallicities close to solar.
The surface 7Li abundance in dwarf stars is depleted duringmain-sequence core H burning. This is because diffusion bygravitational settling becomes more efficient as the surface con-vection zone becomes increasingly shallow. Lower mass (M �0:5Y0:65 M�) stars have longer main-sequence lifetimes andalso burn more 7Li per unit time than higher mass (M � 0:65Y0:75 M�) stars due to more effective convective mixing in theirenvelopes. Therefore, the lower mass main-sequence stars willexhibit more 7Li depletion than higher mass main-sequence stars.As these stars evolve away from the main sequence, their con-vective zones deepen further, diluting the surface 7Li abundanceand destroying it in the deeper layers. More details of theseprocesses are described in Deliyannis et al. (1990) and Proffitt &Michaud (1991).
Pilachowski et al. (1993) showed that Li abundances in metal-poor subgiants continue to decline by an additional factor of �101Y102 relative to the standard evolutionary model predictions as thesestars ascend the RGB and AGB. Additional physical mecha-nisms, such as rotationally induced mixing, have been used toexplain some of the observed 7Li abundance decreases from pre-dictions made from standard evolutionary models (see the dis-cussion in, e.g., Pinsonneault et al. 1992; Deliyannis et al. 1993;Ryan & Deliyannis 1998). Even without detailed knowledge ofthe details of these processes, it is clear that the derived 7Liabundance in HKII 17435�00532 cannot be its zero-age main-sequence 7Li abundance.
There are several reasons to believe that the Li inHKII 17435�00532 was not transferred from an undetected companion. Ourfour radial velocity measurements for this star suggest that HKII17435�00532 is not a member of a binary star system, althoughperhaps the system is a long-period binary or the plane of theorbit is nearly face-on with respect to the Earth. Even if HKII17435�00532 is the secondary star of a binary system where thenow unseen and presumably more massive primary swelled insize during its TP-AGB phase and transferred mass (includingfreshly synthesized Li) to the secondary, such a scenario wouldrequire extremely efficient mass transfer to enrich HKII 17435�00532 to log "(Li) � 2:1.
Only two stars with ½Fe/H� < �1:5 have been reported topossess log "(Li)kþ 2:4: HD 160617 and BD +23 3912.WhileCharbonnel & Primas (2005) reported log "(Li) ¼ þ2:56 in HD160617, other studies have found lower abundances in this star,log "(Li) ¼ þ2:23 (Pilachowski et al. 1993) and log "(Li) ¼þ2:28 (Asplund et al. 2006). Charbonnel & Primas (2005) alsoreported log "(Li) ¼ þ2:64 in BD +23 3912, but other studieshave also found lower abundances in this star, log "(Li) ¼ þ2:38(Pilachowski et al. 1993) and log "(Li) ¼ þ2:23 (Thevenin199818).19 Thus, it appears that Li enrichment significantlyabove the Spite plateau value in metal-poor stars is, at best, arare phenomenon.
Similarly, the lack of Li-enriched stars anywhere above theSpite plateau or the Li abundances expected by normal dilutionas stars evolve up the RGB suggests that HKII 17435�00532was not enriched during or prior to its departure from the mainsequence, in which case it would be obeying the normal dilutioneffects predicted by standard evolutionary models. ( In otherwords, the pattern of Li abundances seen in Fig. 4b of Ryan &Deliyannis 1998 has not been shifted upward by 1Y2 dex due toextrinsic Li enrichment.)
Later, in x 7.3.2, we consider the possibility that the n-capturematerial in HKII 17435�00532 was accreted from a companionstar that passed through the TP-AGB phase of evolution. In thisscenario, we derive a dilution factor of 63 [where log10(63) ¼1:8]; i.e., 1 part of accreted material is observable in the stellaratmosphere of HKII 17435�00532 for every 63 parts of its own,original material necessary to produce the observed n-captureabundances. If the Li shares its nucleosynthesis origin with thisn-capture enrichment, it too would be expected to be diluted bythe same factor. Figure 10 of Gratton et al. (2000) leads us tosurmise that the unenriched Li abundance of HKII 17435�00532would be log "(Li) � 0Y1 at its present evolutionary state. There-fore, in order to enrich HKII 17435�00532 to a present Li abun-dance of log "(Li) ¼ þ2:1, nearly 3Y4 dex (i.e., the sum of theenrichment and the logarithmic dilution factor) would need to beacquired by HKII 17435�00532 from its companion. Further-more, the transfer would have needed to occur fairly recently;otherwise, the Li acquired by HKII 17435�00532 would bediluted and destroyed by the normal channels during its evolu-tion up the RGB. The likelihood of such extreme enrichmentseems small.
We conclude that the Li observed in HKII 17435�00532 is notof primordial origin and was not transferred from an unseen bi-nary companion. The Li should have originated within this star.
6.2. CNO, � , and Fe Peak Elements
Carbon and oxygen are overabundant in HKII 17435�00532,with ½C/Fe� þ0:7 and ½O/Fe� þ1:1. The CN molecularband at 38508 commonly used tomeasure the N abundance wasnot covered in our spectra. BothMcWilliam et al. (1995a, 1995b)and Cayrel et al. (2004) found a large amount of scatter in theC abundances of their very metal-poor star samples, despite thefact that the Cayrel et al. (2004) sample is biased against C-richstars. It is difficult to ascertain whether the C overabundance inHKII 17435�00532 is typical for metal-poor stars or is the resultof an additional enrichment process. If C enrichment has oc-curred, it is mild relative to the population of C-enriched metal-poor stars, which can have ½C/Fe�k 2:0 in stars with similarmetallicity to HKII 17435�00532 (Cohen et al. 2006; Aoki et al.2007). Comparison of our O abundance with the O abundancesof the sample of metal-poor subgiants and giants from GarcıaPerez et al. (2006), both derived from the triplet near 7770 8,reveals that the O abundance of HKII 17435�00532 is in verygood agreement with their results. Garcıa Perez et al. (2006)found ½O/Fe� � þ0:5 near ½Fe/H� ¼ �2:2 from the [O i] lines,which is only marginally smaller than our O abundance correctedfor NLTE effects, and within the uncertainties of these measure-ments the HKII 17435�00532 O abundance is not anomalous.This suggests that no extra enrichment of O-rich material hasoccurred.
In Figure 4we show the elemental abundances for 6 � Z � 30in HKII 17435�00532, the Sun, and 10 ‘‘typical’’ metal-poorstars. We represent the abundances of typical metal-poor stars byaveraging the 10 most metal-rich (�2:8 < ½Fe/H � < �2:0) stars
18 Vizier Online Data Catalog, 3193 (F. Thevenin, 1998).19 We also note that neither of these subgiants exhibits any significant
overabundances of C or Ba, two key signatures of s-process nucleosynthesis. InHD 160617, ½C/Fe� ¼ �0:6 and ½Ba/Fe� ¼ 0:0 (Jonsell et al. 2005; Johnson et al.2007). In BD +23 3912, ½C/Fe� ¼ �0:2 and ½Ba/Fe� ¼ þ0:1 (Fulbright 2000;Gratton et al. 2000).
HET CASH PROJECT. I. 1557No. 2, 2008

in the McWilliam et al. (1995a, 1995b) sample. The well-knownodd-even effect is clearly seen in the log " abundances for thesestars in Figure 4. With the exception of Na, the � and Fe peakelements appear very typical for a star in this metallicity regime.
Sodium is noticeably overabundant in HKII 17435�00532,½Na/Fe�LTE ¼ þ0:69, although inclusion of NLTE effects forthe kk5682 and 5688 Na lines could lower this abundance by�0.1 dex. Abundance analyses of large numbers of metal-poorstars (e.g., McWilliam et al. 1995a, 1995b; Cayrel et al. 2004)with ½Fe/H � < �2:0 have found little change in [Na/Fe] for me-tallicities �3:0 < ½Fe/H � < �2:0, with an intrinsic scatter of afew tenths of a dex. For the Pilachowski et al. (1996) field starsthat have comparable temperature and gravity to HKII 17435�00532, we note that there exists a difference in their LTE Naabundances and the LTE Na abundance of HKII 17435�00532by more than 0.4 dex, which presumably does represent a phys-ical difference in the Na abundances and not, e.g., an effect ofdisregarding NLTE effects since the same set of Na lines wereused for the analysis.
Gratton et al. (2000) found no evidence for a significant changein the Na abundance of field stars with �2:0 < ½Fe/H� < �1:0along the RGB, although all of the stars in their sample exhibited½Na/Fe� � þ0:4. Aoki et al. (2007) also find a number of C-enriched metal-poor stars that have overabundances of Na, in-cluding some stars with ½Na/Fe� > þ2:0. These authors showedthat the Na enhancement in their sample correlated with C and
N enhancements. We note that the C and Na overabundances inHKII 17435�00532 are much less extreme than the C and Naoverabundances in some of the stars in the Aoki et al. (2007)study. The available information hints that the Na overabundancein HKII 17435�00532 may share a common origin with theC overabundance rather than the evolutionary state of this star.
6.3. n-Capture Elements
HKII 17435�00532 exhibits overabundances of all n-captureelements relative to Fe when compared with the solar system (SS)abundance ratios. Both Ba and Eu exhibit significant overabun-dances in HKII 17435�00532, ½Ba/Fe� ¼ þ0:86 and ½Eu/Fe� ¼þ0:48. These ratios suggest that HKII 17435�00532 is enrichedto some degree in both s- and r-process material. Also, ½Ba/Eu� ¼þ0:38, which suggests that the s-process has contributed a greaterportion of the n-capture species in this star than the r-process. InFigure 5 we show the derived n-capture elemental abundances inHKII 17435�00532, as well as the scaled SS s- and r-processabundance patterns. If we examine the entire set of derivedn-capture abundances in HKII 17435�00532, it is clear that thescaled solar abundances of neither process alone provide a sat-isfactory fit. Furthermore, within the ranges 38 � Z � 40 and56 � Z � 58, the odd-even effect is more pronounced thanwouldbe expected, with the odd-Z elements exhibiting abundances�0.8Y1.0 dex lower than the neighboring even-Z elements.We display the abundance ratios for several sets of n-capture
species in Figure 6 for HKII 17435�00532 and the 16 starsclassified by Jonsell et al. (2006) as (r þ s)-enriched.20,21 Theabundances of the n-capture species are all derived from tran-sitions of singly ionized atoms, and the uncertainty in the surfacegravity of the model atmosphere will have relatively small ef-fects on the ratios of one n-capture species to another. Several ofthese ratios were chosen to examine whether the exaggeratedn-capture odd-even-Z effect is common to other stars enriched in
Fig. 4.—Light-element (6 � Z � 30) LTE abundances for HKII 17435�00532, the Sun, and ‘‘typical’’ metal-poor stars. The top panel shows absolutelog " abundances, and the bottom panel shows relative [X /Fe] abundances. Weshow the abundances for HKII 17435�00532 as filled diamonds. We also showthe solar photospheric abundances as gray circles and connect them with a solidline. Open triangles represent ‘‘typical’’ metal-poor stars by averaging the 10 mostmetal-rich (�2:8 < ½Fe/H � < �2:0) stars in theMcWilliam et al. (1995a, 1995b)sample. The abundances are normalized to the Fe abundance in HKII 17435�00532. [See the electronic edition of the Journal for a color version of this figure.]
Fig. 5.—Derived abundances in HKII 17435�00532 and the scaled SS s- andr-process abundance patterns, indicated by the gray and black lines, respectively.The SS s-process distribution is normalized to Ba, and the SS r-process distri-bution is normalized to Eu. It is clear that neither distribution provides a satis-factory fit to the n-capture elemental abundance pattern in HKII 17435�00532.[See the electronic edition of the Journal for a color version of this figure.]
20 The star CS 31062�012 is also called LP 706-7 and has been listed twicein the Jonsell et al. (2006) table of r þ s stars. This double identification was alsopointed out by Ryan et al. (2005).
21 Strictly speaking, the Jonsell et al. (2006) r þ s classification refers to starswith ½Ba/Fe� > þ1:0, ½Eu/Fe� > þ1:0, and ½Ba/Eu� > 0:0, and HKII 17435�00532 does not meet these criteria. In this paper we refer to r þ s stars in a lessstrict sense to indicate that they exhibit some enhancement of both Ba and Eu,i.e., +0:3P ½Ba/Fe� and +0:3P ½Eu/Fe�.
ROEDERER ET AL.1558 Vol. 679

both s- and r-processmaterial. In particular, the [Sr/Y] and [Y/Zr]ratios in HKII 17435�00532 appear normal with respect to otherstars in this class. The [La/Ce] ratio is slightly lower in HKII17435�00532 than the comparison stars but is still in agreement.The [Ba/Eu] and [La/Eu] ratios are in agreement. The [La/Eu]and [La/Ce] ratios exhibit remarkably small scatter among thestars of this class with the minor exceptions only for three stars.One of these stars, CS 29526�110, was noted by Aoki et al.(2002) to have a lowLa abundance. Jonsell et al. (2006) point outthat HE 1405�0822 was noticed to have strong Cmolecular fea-tures in the spectrum by Barklem et al. (2005) and the data pre-sented were preliminary. CS 30322�023, the most metal-poorstar to demonstrate an s-process abundance signature, appears tohave a rather low Eu abundance relative to the second s-processpeak elements (Masseron et al. 2006). The exaggerated (relativeto the scaled SS s- and r-process abundances) odd-even-Z effectfor 38 � Z � 40 and 56 � Z � 58 appears to be a characteristicof the nucleosynthesis in these stars.
Despite the small intrinsic scatter among these abundanceratios, the scatter in the [Pb/Ba] ratio is noticeably greater, farbeyond any reasonable variation in the atmospheric parameters
or uncertainties in measuring the abundances of these stars (seealso Masseron et al. 2006). No trend with [Fe/H] is apparent. Itis likely that HKII 17435�00532 has an overabundance of Pb,but we do not presently know because our spectra do not in-clude the Pb i k4057 line to confirm this. For the often-discussedquestion of Ba and Pb abundances in the (r þ s)-enriched starswe refer to Ivans et al. (2005), Bisterzo et al. (2006), and refer-ences therein.
We find a difference in the ratios of the mean light s-processabundances (Sr, Y, Zr; hereafter designated as ls) and heavys-process abundances (Ba, La, Ce; hereafter designated as hs)to Fe, ½ ls /Fe� ¼ 0:37 � 0:13 and ½hs/Fe� ¼ 0:96 � 0:13. In Fig-ure 7 we show the [hs/ ls] ratios for HKII 17435�00532 andother metal-poor stars as functions of [Ba/Eu] and [Fe/H]. Eventhough the Jonsell et al. (2006) r þ s classification required½Ba/Fe� > 1:0 and ½Eu/Fe� > 1:0, greater than the [Ba/Fe] and[Eu/Fe] ratios inHKII 17435�00532, the [Ba/Eu] ratios for theirstars are similar to ours. This suggests that HKII 17435�00532may have less overall n-capture enrichment than the Jonsell et al.(2006) r þ s stars, but the relative amounts of enrichment may besimilar. Also, HKII 17435�00532 and the r þ s stars fall in the
Fig. 6.—Abundance ratios of n-capture species for HKII 17435�00532 and other stars classified as (r þ s)-enriched. HKII 17435�00532 is indicated by the sunburst,and other stars are indicated by open squares. The solar photospheric ratios are indicated by dotted lines. The additional data were taken from other studies and the r þ s listof Jonsell et al. (2006), which was compiled from the measurements of others, including Aoki et al. (2001, 2002), Barbuy et al. (2005), Barklem et al. (2005), Cohen et al.(2003, 2006), Hill et al. (2000), Ivans et al. (2005), Johnson & Bolte (2002, 2004), Lucatello et al. (2003), Masseron et al. (2006), Norris et al. (1997), Preston & Sneden(2001), and Sivarani et al. (2004). We also include the r þ s star CS 22964�161 (Thompson et al. 2008).
HET CASH PROJECT. I. 1559No. 2, 2008

range between the pure s and pure r [Ba/Eu] ratios and betweenthe stars classified as s-enriched and r-enriched. The [hs/ ls] ratioin HKII 17435�00532may lie between the [hs / ls] ratio in r þ s-and r-enriched stars, but the uncertainties on this measurementare too great to clearly distinguish between these two classes.
From the data presented in Figure 7, it appears that, for themost part, stars enriched in both s- and r-process elements havehigh [hs/ ls] ratios (i.e., ½hs/ ls�k 0:6). Based on the overall chem-ical homogeneity of the stars in their r þ s class, Jonsell et al.(2006) argued that the s- and r-enrichment in these stars may nothave originated from independent nucleosynthetic events. Fur-thermore, based on the frequency of r þ s stars in the HERESsurvey (Barklem et al. 2005) relative to the numbers of r-II ands stars, they concluded that the combination of s- and r-enrichmentin the same star must point to a common (or at least a dependentset of ) nucleosynthesis event(s).
Lucatello et al. (2006) have recently examined theC-rich and/orvery cool stars, some of which include n-capture enhancements,that could not be studied by the automated procedures of Barklemet al. (2005). S. Lucatello et al. (2008, in preparation) are presently
considering the frequency of the various categories of n-capturestars in the C-rich/cool sample, so we defer further discussion ofsuch stars to their study.We also refer the reader to Bisterzo (2007)for a thorough comparison of chemical yields from stars in theTP-AGB phase to the n-capture abundances in r þ s stars.Our Tc upper limit in HKII 17435�00532, log "(Tc)Pþ 0:5,
is of little use, as it is 2Y3 dex greater than the scaled s- andr-process predictions shown in Figure 5.Given the metallicity of HKII 17435�00532, we can safely
surmise that this star is very old (k10 Gyr) and has a low mass(�0.8M�). The s and r nucleosynthesis reactions are not expectedto operate in stars of such lowmass, so theymust have been presentin the material from which this star formed or were transferred toit from an undetected binary companion.
7. INTERPRETATION
We arrive at the challenge to find a consistent model to ex-plain Li-, s-, and r-process enhancement, as well as C and Naenrichment, in ametal-poor star on the RGB, RHB, or early AGB.We have argued that the Li must have been produced in this star,while the s- and r-process elements must have been present in thematerial from which the star formed or were transferred to it bya nearby star. Radial velocity variations have not yet been de-tected, but we consider both binary and single-star explanationsbecause of the possibility of a long binary orbital period or ahighly inclined orbit.In Table 6 we summarize the radial velocity measurements
reported in the literature for HKII 17435�00532 and 18 other
Fig. 7.—The [hs/ls] abundance ratio as a function of [Ba /Eu] (top) and [Fe/H](bottom). HKII 17435�00532 is indicated by the sunburst. Large black squares,circles, and triangles indicate stars classified by Jonsell et al. (2006) as (r þ s)-enriched, s-enriched, and r-enriched, respectively. Most of the Jonsell et al. (2006)classifications were based on measurements made by previous studies of thesestars; we supplement their sample with HD 115444 (Westin et al. 2000), HD221170 (Ivans et al. 2006), CS 30322�023 (Masseron et al. 2006), and CS22964�161 (Thompson et al. 2008). Open triangles represent HD 122563 andHD 88609 (Honda et al. 2006, 2007), which may be enriched by products of the‘‘Lighter Element Primary Process’’ (LEPP; Travaglio et al. 2004) or the weakr-process (Wanajo et al. 2006; Qian & Wasserburg 2007). Gray circles, squares,and triangles represent stars from the metal-poor abundance surveys of Fulbright(2000), Burris et al. (2000), and Barklem et al. (2005), respectively. The stellarmodel pure s and pure r [Ba /Eu] ratios (Arlandini et al. 1999) are shown by thedotted line and the dashed line, respectively. [See the electronic edition of theJournal for a color version of this figure.]
TABLE 6
Radial Velocity Variations among Stars Exhibiting r þ s Enrichment
Star Name Radial Velocity Variations? aPeriod
(days) References
HKII 17435�00532..... N . . . 1
CS 22183�015 ............ Y . . . 2, 3
CS 22898�027 ............ N . . . 4, 5
CS 22948�027 ............ Y 426.5 5, 6
CS 22964�161 ............ Y 252 7
CS 29497�030 ............ Y 342 8, 9, 10
CS 29497�034 ............ Y 4130 6
CS 29526�110 ............ Y . . . 4
CS 30322�023 ............ Nb . . .
CS 31062�012 ............ N . . . 11
CS 31062�050 ............ Y . . . 4, 12
HE 0024�2523............ Y 3.41 13
HE 0131�3953............ ? . . .
HE 0338�3945............ N . . . 14
HE 1046�1352............ ? . . .
HE 1105+0027............. ? . . .
HE 1405�0822............ ? . . .
HE 2148�1247............ Y (Long) 15
LP 625-44 .................... Y k4400 16
a A ‘‘Y’’ indicates that the star exhibits radial velocity variations, an ‘‘N’’indicates that several measurements over a period of time have confirmed that thestar does not exhibit radial velocity variations, and a ‘‘?’’ indicates that fewer thantwo radial velocity measurements have been reported in the literature.
b CS 30322�023 is in the TP-AGB phase and may exhibit a pulsation periodof 192 days with an amplitude of 3 km s�1. This may mask the detection of along, low-amplitude orbital period, which cannot be ruled out by the availableobservations (Masseron et al. 2006).
References.—(1) This study; (2) Cohen et al. 2006; (3) Lai et al. 2004; (4) Aokiet al. 2002; (5) Preston & Sneden 2001; (6) Barbuy et al. 2005; (7) Thompsonet al. 2008; (8) Preston & Sneden 2000; (9) Sivarani et al. 2004; (10) Sneden et al.2003; (11) Norris et al. 1997; (12) Aoki et al. 2003; (13) Lucatello et al. 2003;(14) Jonsell et al. 2006; (15) Cohen et al. 2003; (16) Aoki et al. 2000.
ROEDERER ET AL.1560 Vol. 679

r þ s stars. Of these 19 stars, 10 show clear evidence of radialvelocity variations, 5 do not show any variations when observedfor a substantial period of time (including HKII 17435�00532),and 4 have fewer than two measurements reported in the liter-ature. Of the six stars with measured orbital periods, five haveperiods greater than 250 days, and one of these has a periodgreater than 12 yr. Given the similarities in the abundance ratiosbetween these stars and HKII 17435�00532, as well as its un-proven binary status, it is reasonable to expect that this star maybe a long-period binary. Future radial velocity monitoring will beundertaken to investigate the matter. A wider binary separationcould also explain the less extreme overabundances of n-capturematerial in HKII 17435�00532 relative to other r þ s stars, sim-ilar to the conclusion reached by Han et al. (1995) for the en-richment patterns in Ba and CH stars in binary systems. Thisexplanation also gains support from the work of Lucatello et al.(2005), who observed radial velocity variations in 68% of theirsample of 19 C- and s-processYenriched stars, yet were able toconclude from their Monte Carlo analysis of the sample that allC- and s-enriched metal-poor stars should be members of binarysystems.
7.1. Lithium Self-Enrichment through Extra Mixing
7.1.1. On the RGB
The first dredge-up episode occurs on the lower RGBwhen theouter convective envelope deepens and encounters material thathas been processed through H burning. Because it mixes freshH from the surface downward into the star, the first dredge-upleaves a strong molecular weight discontinuity at the point ofmaximum penetration into the star. This material is outside of theH-burning shell, and when the H-burning shell burns outwardthrough this molecular weight discontinuity, it encounters a freshsupply of H. As a result, the outward progress of the H-burningshell is halted, the radius of the star ceases to expand, and thestar’s ascent up the RGB is paused. The RGB luminosity bumpoccurs at the point on the RGBwhere stars spend a larger fractionof their time digesting this H fuel. The location of the RGB lu-minosity bump (which depends onmetallicity), inferred from thecalculations of Denissenkov & VandenBerg (2003), is indicatedin Figure 1.
Before the H-burning shell erases the molecular weight dis-continuity, no extramixing can occur; after it has been erased, thestar continues to evolve up the RGB. To explain the Li enrichmentobserved in some evolved stars, several authors (Charbonnel1995; Sackmann&Boothroyd 1999;Charbonnel&Balachandran2000) proposed that an extra, yet unspecified, mixing processmay occur in low- and intermediate-mass stars (i.e., 1 M�PM P 5 M�) after the molecular weight discontinuity has beenerased at the RGB luminosity bump. The 3D simulations of theHe flash presented in Dearborn et al. (2006) also suggest thatthis extra mixing may be present outside the H-burning shell.This extra mixing could drive 7Li production by the Cameron& Fowler (1971) mechanism. This hypothesis explains the low-and intermediate-mass Li-enriched stars found at the RGB lu-minosity bump.
Once the H-burning shell begins to exhaust its fresh supply ofH, it continues its outward burn, and the star once again expandsand continues to ascend the RGB. The convective envelope ex-tends deeper into the star, carrying the 7Li to these hotter regionswhere it is destroyed. The Li-rich phase is fleeting. From thecalculations presented in Denissenkov & Herwig (2004) for Lienrichment in low-mass, metal-poor stars along the RGB, weestimate that the Li-rich phase will not last more than 3Y4 Myr.
What is the physical cause of the extra mixing process, andcan it operate in low-mass, low-metallicity stars? Thermohalinemixing (Ulrich 1972; Kippenhahn et al. 1980; Eggleton et al.2006, 2008) has long been considered plausible. This type ofmixing is a result of a mean molecular weight inversion thatarises in stars on the AGB when the 3He(3He, 2p)4He reactionlowers the mean molecular weight (from 3 to 2 for the speciesthat participate in this reaction) near the upper boundary of theH-burning shell. Charbonnel & Zahn (2007) advocate a mech-anism that relies on the double diffusion of both the mean mo-lecular weight inversion and temperature instabilities to inducemixing. They successfully link changes in the surface 7Li abun-dance (as well as a decrease in C and 12C/13C and an increase inN) to this extra mixing mechanism in low-mass (M � 0:9 M�),low-metallicity (½Fe/H� ¼ �1:8,�1.3,�0.5) stars at and abovethe RGB luminosity bump.
Another possibility, known as the Li flash (Palacios et al.2001), was found as a possible source of Li enrichment in solar-metallicity, 1.5 M� stars at the RGB luminosity bump. The cre-ation of a thin Li-burning shell induces a convective instability,which carries Li to the surface of the star. The radius and lumi-nosity of the star also increase, lifting the star off the RGB lu-minosity bump on the H-R diagram. If such a process couldoccur in low-mass, low-metallicity stars, this could also explainthe Li enrichment observed in HKII 17435�00532.
If HKII 17435�00532 is ascending the RGB, the luminosityof this star is coincident with the luminosity of the bump for½Fe/H � ¼ �2:2. It is possible that the present Li abundance hasalready been reduced from its maximum abundance. Since wecannot measure the 12C/13C ratio from our spectrum, we have nodiagnostic tool to infer whether the surface Li abundance is stillincreasing, holding steady, or already decreasing. Such informa-tion would link the evolutionary status of HKII 17435�00532with the apparent self-enrichment with Li: once the extra mixingextends deep enough to convert 12C to 13C, the hotter tempera-tures there will begin to destroy Li (Gratton et al. 2000; Spiteet al. 2006). If HKII 17435�00532 is evolving through the RGBluminosity bump, it is themost metal-poor star for which an extramixing mechanism has been shown to produce Li enrichment inthe stellar envelope at this phase of evolution.
7.1.2. On the RHB or Early AGB
Enrichment of Li is not predicted to occur on the RHB or earlyAGB. Charbonnel & Balachandran (2000) note that an analog ofthe RGB extra mixing would have to be extremely efficient toconnect the 3He-rich envelope and the H-burning shell in lowermass, lower metallicity stars ascending the early AGB. The sec-ond dredge-up, which occurs after core He burning has ceased,does not affect the surface composition of stars with M P4 M�(Karakas et al. 2002). If our adopted surface gravity is too highand our adopted temperature is too cool, the star would still lieon the RHB or early AGB and, although we may have over-estimated the mass of this star by �0.1Y0.2M�, the Li questionwould remain.
We note that for stars in the later TP-AGB stage, H burningwill alter the surface composition, including Li abundance, whenthe outer convective zone overlaps with the H-burning shell(hot bottom burning, or HBB; e.g., Sugimoto 1971; Forestini& Charbonnel 1997 and references therein) or when an extramixing mechanism in the radiative layer above the H-burningshell connects it to the convective zone (cool bottom processing;e.g., Boothroyd et al. 1995; Wasserburg et al. 1995; Nollett et al.2003 and references therein). These processes occur in higherluminosity stars [i.e., log (L /L�)k 3], not lower luminosity stars
HET CASH PROJECT. I. 1561No. 2, 2008

near the base of the AGB (e.g., Kraft et al. 1999; Domınguezet al. 2004), and they are not suspects for the extra mixing inHKII 17435�00532. [Recall that log (L/L�) 2:0 for HKII17435�00532.]
If HKII 17435�00532 has recently arrived on the RHB fromthe tip of the RGB, is it possible that the supposed large Lioverabundance that was produced by the Cameron & Fowler(1971) mechanism at the RGB luminosity bump has not yet beenfully depleted? If we assume that the Li-rich phase will not lastmore than 3Y4 Myr, this timescale is far shorter (by nearly 2orders of magnitude) than the timescale necessary for the starto move from the RGB luminosity bump to the RHB (e.g.,Campbell 2007, p. 252). We therefore dismiss this hypothesis.
Also, for metal-poor stars in globular clusters on the RGB orAGB, we note that Li production does not need to be associatedwith C, Na, r-process, or s-process enrichment (e.g., Kraft et al.1999; Kraft & Shetrone 2000).
If HKII 17435�00532 is on the RHB or early AGB, we areleft to postulate that a previously unidentified efficient extra mix-ing episode may be operating during this stage of evolution inlow-mass, low-metallicity stars.
7.2. Enhanced Sodium Abundance
Several r þ s stars, including HKII 17435�00532, exhibitenhanced Na abundances, which we summarize in Table 7.23Na can be produced in thermally pulsing stars on the AGBthrough a series of reactions that convert CNO material pro-duced during He burning into 23Na. Briefly, as summarized bySneden et al. (2008), the H-burning shell of an AGB star firstconverts CNO nuclei into 14N. Then in the early phases of a ther-mal instability 22Ne is generated in the � -capture reaction chain14N(� , �)18F(�+�)18O(� , �)22Ne. Finally, enhanced 23Na is pro-duced by n-capture on the abundant 22Ne and subsequent�� decay.The available CNO nuclei include those present at the star’s birthand fresh ‘‘primary’’ 12C mixed into the envelope by previousthird dredge-up (TDU) episodes. This primary source becomespredominant in very metal-poor AGB stars (e.g., Gallino et al.2006). After the last TDU it is predicted that ½Na/Fe� � ½Ne/Fe�(with Ne almost pure 22Ne) in the AGB envelope.
7.3. r þ s Enrichment
Unlike the case of Li enrichment, these scenarios are virtuallyindependent of the evolutionary state, only assuming that thisstar is not in the TP-AGB stage.
7.3.1. Preenrichment
The simplest explanation assumes that HKII 17435�00532 is(and always has been) a single star. This scenario assumes that
the material from which HKII 17435�00532 formed was en-riched in both s- and r-process material and that no additionaln-capture enrichment occurred. Evidence for s-process enrich-ment has been observed in a few stars with very low metallicities(e.g., CS 22183�015: ½Fe/H � ¼ �3:1, Johnson & Bolte 2002;CS 29497�030: ½Fe/H � ¼ �2:8, Sivarani et al. 2004; CS 30322�023: ½Fe/H � ¼ �3:4, Masseron et al. 2006), and r-process ma-terial has been found in stars of all metallicities (at least for thosewith ½Fe/H �k � 4:0). In a generation of stars that precededHKII 17435�00532, it is possible that at least one binary pairformed with one star that would ultimately explode as a super-nova, producing r-process material, and another star that wouldultimately produce s-process material during its TP-AGB phase.This s- and r-enriched material would then be recycled into theinterstellar medium (ISM) fromwhichHKII 17435�00532 laterformed. Such a scenario cannot be ruled out and would alsoaccount for the possible link between the s- and r-enrichmentmechanisms.
7.3.2. Pollution from a 1.5 M� Companion
Let us assume the binary scenario for HKII 17435�00532, inwhich we consider the observed star to be the longer lived sec-ondary. We calculate the s-process yields from the primary, as-suming that both members of the binary had the same initialmetallicity. These calculations were based on the FRANEC stel-lar evolution models (Straniero et al. 1997, 2003; Zinner et al.2006) for low-metallicity stars on the AGB. The best fit is ob-tained with the model that adopts an initial mass of 1.5 M� forthe companion star that passed through the TP-AGB phase.Abundance predictions for three sets of model parameters aredisplayed in Figure 8. The initial mass of the companion staris the independent variable, although changing the mass affectsthe number of s-processYproducing thermal pulses (‘‘n’’) thatoccur, the logarithmic dilution factor (‘‘dil’’; defined to be thelogarithm of the ratio of original mass in the observed stellar
TABLE 7
Enhanced Na Abundances among Stars Exhibiting r þ s Enrichment
Star Name [Na /Fe]LTE [Na /Fe]NLTE References
HKII 17435�00532.................. +0.69 +0.6 1
CS 22898�027 ......................... +0.17 . . . 2
CS 22948�027 ......................... +0.57 +0.07 3
CS 29497�030 ......................... +0.58 . . . 4
CS 29497�034 ......................... +1.18 +0.68 3
CS 30322�023 ......................... +1.29 . . . 5
CS 31062�012a........................ +1.3 +0.6 6
a CS 30322�023 = LP 706-7.References.—(1) This study; (2) Preston & Sneden 2001; (3) Barbuy et al.
2005; (4) Ivans et al. 2005; (5) Masseron et al. 2006; (6) Aoki et al. 2007.
Fig. 8.—Predicted [X/Fe] ratios in HKII 17435�00532 assuming pollutionfrom a companion star that passed through the TP-AGB phase. The abundanceratios have been normalized to the solar photospheric values given in Lodders(2003). LTE abundances are displayed for all elements except O, Na, andMg, forwhich the NLTE-corrected abundances are displayed. The asymmetric uncer-tainties on Na reflect a conservative range on the NLTE corrections. All sets ofabundance predictions assume ½Fe/H� ¼ �2:3, ½� /Fe� ¼ þ0:5, and ½r/Fe�init ¼þ0:3. The initial mass of the TP-AGB star is the primary variable between thedifferent sets of abundance predictions, although changing the mass necessitatesaltering the number of thermal pulses (‘‘n’’), the logarithmic dilution factor(‘‘dil’’), and the 13C pocket efficiency (‘‘ST/’’). The black line reflects our best-fitmodel, withMAGB ¼ 1:5 M�, while the dark gray line and the light gray line haveMAGB ¼ 1:3 and 2.0M�, respectively. [See the electronic edition of the Journalfor a color version of this figure.]
ROEDERER ET AL.1562 Vol. 679

envelope to the amount of mass that is acquired), and the 13Cpocket efficiency (‘‘ST/’’; i.e., some fraction of the standard 13Cpocket efficiency of Gallino et al. 1998). As basic model input,we adopt ½Fe/H� ¼ �2:3, ½� /Fe� ¼ þ0:5, and ½r/Fe�init ¼ þ0:3.
If we adopt the various Na NLTE corrections for the kk5682and 5688 lines at face value, a conservative range for the Naabundance is found to be 0:45 < ½Na/Fe� < 0:85. This constrainsthe mass of the undetected companion to 1:3 M�PM P 2:0 M�.Of the elemental abundanceswe havemeasured inHKII 17435�00532, the Na abundance is the best discriminator of the mass ofthe companion star. The � and Fe peak abundance ratios are in-sensitive to the model parameters.
We derive a dilution factor of 1.8 dex (i.e., a factor of 63) forthis system, assuming that the companion had a main-sequencemass of 1.5 M�. An initial enrichment of r-process material isassumed in these models, but Eu is the only species that wemeasure in HKII 17435�00532 that is strongly sensitive to thisenrichment. If we assume an initial ½r/Fe� ¼ þ0:3 for this sys-tem, then only �0.2 dex of Eu needs to be acquired from thes-process material of the AGB companion. In contrast to the Eu,which mostly reflects the initial composition of the ISM fromwhich the system formed, the Ba (and other hs species with largeoverabundances) was dominantly produced by the companionstar during its TP-AGB phase and transferred to HKII 17435�00532 by s-processYenriched winds.
Predictions for the abundances of n-capture species vary some-what depending on the parameter choices, but they generallyagree with the observations. The most notable exception is Y,which is predicted to be overabundant by roughly +0.5Y0.7 dexbut is measured to have ½Y/Fe� ¼ þ0:17 � 0:19. Similar resultswere found byAoki et al. (2006) for CS 31062�050 and LP 625-44. If we were to adopt initial enrichment levels for Sr, Y, and Zrfrom the distribution of unevolved stars compiled by Travaglioet al. (2004), ½Sr/Fe� ¼ þ0:2, ½Y/Fe� ¼ �0:2, and ½Zr/Fe� ¼þ0:4, the changes in the final abundance predictions for [Y/Fe]are only decreased by0.1 dex, while the predicted [Sr/Fe] and[Zr/Fe] ratios remain approximately unchanged.
7.3.3. Enrichment from an 8Y10 M� Companion
Another enrichment scenario invokes a single high-mass com-panion star as the donor of both the s- and r-process material toHKII 17435�00532. Type II supernovae with 8:0 M�PM P10:0 M� have been identified as a possible source of r-processelements (specifically, Eu) in low-metallicity stars (Mathews et al.1992; Ishimaru & Wanajo 1999; Wanajo et al. 2003; Ishimaruet al. 2004; Ning et al. 2007). Similarly, at progressively lowermetallicities, stars with smaller initial masses will end the AGBphase of their life with masses above the Chandrasekhar limitand may explode as Type 1.5 (or AGB) supernovae and producer-process material ( Iben & Renzini 1983; Zijlstra 2004). It hasbeen shown (e.g., Gallino et al. 1998; Busso et al. 1999) that themain component of the s-process occurs during the interpulsephases of intermediate-mass stars on the AGB (1:5 M� < M <3:0 M�). Due to the accelerated evolutionary rates of stars withM > 3:0 M� and the relatively small amount of mass located inthe intershell region, however, very small amounts of s-processmaterial are expected to be produced by TP-AGB stars in the8:0 M�PM P10:0 M� range. Consequently, we dismiss thisunlikely enrichment scenario for HKII 17435�00532.
7.3.4. Enrichment from Two Companion Stars
A long-period triple-star system could be invoked to explainr-process material from a high-mass (M k8 M�) supernova ands-process material from an intermediate-mass (1:5 M�PM P
3:0 M�) star on the AGB, both of which deposited some of thisn-captureYenriched material on the tertiary star. In the case thatsuch a system is dynamically stable for the length of the lifetimeof a high-mass star, the object could evolve, explode as a super-nova, and enrich the two remaining stars with r-process material.If the two remaining stars then became separated from the com-pact supernova remnant but remained gravitationally bound, theintermediate-mass star could evolve, pass through the TP-AGBphase, and transfer s-processYenriched material to the low-masstertiary. The very large orbital separation that would be necessaryto maintain the triple system for a long period of time would nec-essarily imply a large dilution of the transferred material. Al-though perhaps a less likely scenario than the single 1.5M�AGBcompanion scenario, the triple-star system nevertheless couldaccount for the n-capture enrichment pattern observed in HKII17435�00532.
8. CONCLUSIONS
We have performed the first detailed abundance analysis onHKII 17435�00532, a star that was identified as a metal-poorcandidate during the original HK survey and reidentified duringthe HK-II survey. High-resolution spectra necessary for thisabundance analysis were obtained with the HRS on the HET atMcDonald Observatory. No radial velocity variations are de-tected over a time span of �180 days, which prevents us fromdistinguishing whether HKII 17435�00532 is a single star, amember of a long-period binary system, or in a binary systemwith a highly inclined orbit. Future radial velocity monitoringmay shed light on the situation. We derive TeA ¼ 5200 � 150 Kand log g ¼ 2:15 � 0:4 for HKII 17435�00532, which places iton the RGB or the RHB/early AGB. Our abundance analysisreveals that this star is indeed metal-poor, with ½Fe/H � ¼ �2:2.
A surprising result of our study is the high Li abundance,log "(Li) ¼ þ2:1, which is not predicted by standard stellarmodels for a low-mass, low-metallicity, evolved star such asHKII 17435�00532. If this star is evolving up the RGB, it islocated near the RGB luminosity bump, where extra mixing hasbeen found to cause a short-lived phase of Li enrichment in moremassive stars. In this case, HKII 17435�00532 would representthe most metal-poor object known for which this extra mixingphenomenon occurs. If the star is on the RHB or early AGB, anyLi that was present at earlier times should have been destroyed.In this case, we propose that an analog of the extra mixing thatoccurs at the RGB luminosity bump may be occurring on theRHB/early AGB. Future theoretical analysis of this point wouldbe necessary to confirm or refute this hypothesis. Measurementof the 12C/13C ratio would also help to better constrain the evo-lutionary state of this star.
Our abundance analysis also finds that C and Na are slightlyenhanced. The abundances of O, the � -elements, and the Fepeak elements all appear typical for stars with metallicity similarto HKII 17435�00532. This star is enriched with both s- andr-process elements. Several scenarios can be invoked to explainthe n-capture abundance patterns, as well as the C and Na en-hancements. These include preenrichment from supernovae, masstransfer from a companion in the TP-AGB phase, or enrichmentfrom a nearby supernova. Our favored scenario involves pollu-tion froma binary companion starwith an initialmass of 1.5M�;this would only require that a small initial enrichment of r-processmaterial was present in the ISM from which this star formed.
Inefficient mixing of the ISM, differing efficiencies of stellarwinds from stars on the AGB, or a wide range of orbital sepa-rations can likely account for the range of C, Na, s-process, andr-process enrichments observed in r þ s stars. Future studies of
HET CASH PROJECT. I. 1563No. 2, 2008

the frequency, binarity, and abundance patterns of stars enrichedin both s- and r-process material will be necessary to understandthe origins of this class of stars.
We gratefully thank Amanda Karakas and Oscar Straniero forenlightening discussions and the referee for providing a helpfulset of constructive suggestions on the manuscript. We also ac-knowledge Yoichi Takeda for sharing his K NLTE correctioninterpolation routine, Eusebio Terrazas and Frank Deglman fortheir support of these HET observations, and Joy Chavez fortaking one of the epochs of the 2.7 m data. We are indebted toTaylor Chonis andMartin Gaskell for obtaining new photometryof HKII 17435�00532 from theMiller Observatory. The Hobby-Eberly Telescope (HET) is a joint project of the University ofTexas at Austin, Pennsylvania State University, Stanford Uni-versity, Ludwig-Maximilians-Universitat Munchen, and Georg-August-Universitat Gottingen. The HET is named in honor of its
principal benefactors, William P. Hobby and Robert E. Eberly.This research has made use of the NASA Astrophysics DataSystem (ADS), NIST Atomic Spectra Database, The AmateurSky Survey (TASS), Two Micron All-Sky Survey (2MASS),and SIMBAD databases. The reliability and accessibility ofthese online databases are greatly appreciated. A. F. acknowl-edges support through the W. J. McDonald Fellowship of theMcDonald Observatory. J. R. gratefully acknowledges partialresearch support for this work by NASA through the AAS SmallResearch Grant Program and theGALEXGI grant 05-GALEX05-27. R. G. acknowledges the ItalianMIUR-PRIN06 Project ‘‘LatePhases of Stellar Evolution: Nucleosynthesis in Supernovae,AGB Stars, Planetary Nebulae’’ for support. Funding for thisproject has also been generously provided by the US NationalScience Foundation (grant AST 06-07708 to C. S; grants AST04-06784, AST 07-07776, and PHY02-15783 to T. C. B. and thePhysics Frontier Center/Joint Institute for Nuclear Astrophysics[JINA]; and grant AST 07-07447 to J. J. C.).
REFERENCES
Allende Prieto, C., et al. 2008, AJ, submittedAlonso, A., Arribas, S., & Martınez-Roger, C. 1996, A&A, 313, 873———. 1999, A&AS, 140, 261Aoki, W., Beers, T. C., Christlieb, N., Norris, J. E., Ryan, S. G., & Tsangarides,S. 2007, ApJ, 655, 492
Aoki, W., Bisterzo, S., Gallino, R., Beers, T. C., Norris, J. E., Ryan, S. G., &Tsangarides, S. 2006, ApJ, 650, L127
Aoki, W., Norris, J. E., Ryan, S. G., Beers, T. C., & Ando, H. 2000, ApJ, 536,L97
Aoki, W., Ryan, S. G., Norris, J. E., Beers, T. C., Ando, H., & Tsangarides, S.2002, ApJ, 580, 1149
Aoki, W., et al. 2001, ApJ, 561, 346———. 2003, ApJ, 592, L67———. 2005, ApJ, 632, 611Arlandini, C., Kappeler, F., Wisshak, K., Gallino, R., Lugaro, M., Busso, M., &Straniero, O. 1999, ApJ, 525, 886
Asplund, M. 2005, ARA&A, 43, 481Asplund, M., Grevesse, N., & Sauval, A. J. 2005, in ASP Conf. Ser. 336,Cosmic Abundances as Records of Stellar Evolution and Nucleosynthesis,ed. T. G. Barnes III & F. N. Bash (San Francisco: ASP), 25
Asplund, M., Lambert, D. L., Nissen, P. E., Primas, F., & Smith, V. V. 2006,ApJ, 644, 229
Barbuy, B., Spite, M., Spite, F., Hill, V., Cayrel, R., Plez, B., & Petitjean, P.2005, A&A, 429, 1031
Barbuy, B., et al. 2003, ApJ, 588, 1072Barklem, P. S., et al. 2005, A&A, 439, 129Beers, T. C., Preston, G. W., & Shectman, S. A. 1985, AJ, 90, 2089———. 1992, AJ, 103, 1987Behr, B. B. 2003, ApJS, 149, 101Bihain, G., Israelian, G., Rebolo, R., Bonifacio, P., & Molaro, P. 2004, A&A,423, 777
Bisterzo, S. 2007, Ph.D. thesis, Univ. TorinoBisterzo, S., Gallino, R., Straniero, O., Ivans, I. I., Kappeler, F., & Aoki, W.2006, Mem. Soc. Astron. Italiana, 77, 985
Bonifacio, P., et al. 2007, A&A, 462, 851Boothroyd, A. I., Sackmann, I.-J., & Wasserburg, G. J. 1995, ApJ, 442, L21Bruls, J. H. M. J., Rutten, R. J., & Shchukina, N. G. 1992, A&A, 265, 237Burris, D. L., Pilachowski, C. A., Armandroff, T. E., Sneden, C., Cowan, J. J.,& Roe, H. 2000, ApJ, 544, 302
Burstein, D., & Heiles, C. 1982, AJ, 87, 1165Busso, M., Gallino, R., & Wasserburg, G. J. 1999, ARA&A, 37, 239Cameron, A. G. W. 1955, ApJ, 121, 144Cameron, A. G. W., & Fowler, W. A. 1971, ApJ, 164, 111Campbell, S. W. 2007, Ph.D. thesis, Monash Univ.Carlsson, M., Rutten, R. J., Bruls, J. H. M. J., & Shchukina, N. G. 1994, A&A,288, 860
Carollo, D., et al. 2007, Nature, 450, 1020Cassisi, S., Castellani, M., Caputo, F., & Castellani, V. 2004, A&A, 426, 641Cavallo, R. M., Pilachowski, C. A., & Rebolo, R. 1997, PASP, 109, 226Cayrel, R., et al. 2004, A&A, 416, 1117Charbonnel, C. 1995, ApJ, 453, L41Charbonnel, C., & Balachandran, S. C. 2000, A&A, 359, 563Charbonnel, C., & Primas, F. 2005, A&A, 442, 961
Charbonnel, C., & Zahn, J.-P. 2007, A&A, 467, L15Clayton, D. D., Fowler, W. A., Hull, T. E., & Zimmermann, B. A. 1961, Ann.Phys., 12, 331
Cohen, J. G., Christlieb, N., Qian, Y.-Z., & Wasserburg, G. J. 2003, ApJ, 588,1082
Cohen, J. G., et al. 2006, AJ, 132, 137Dearborn, D. S. P., Lattanzio, J. C., & Eggleton, P. P. 2006, ApJ, 639, 405Deliyannis, C. P., Demarque, P., & Cavalier, S. D. 1990, ApJS, 73, 21Deliyannis, C. P., Pinsonneault, M. H., & Duncan, D. K. 1993, ApJ, 414, 740Demarque, P., Woo, J.-H., Kim, Y.-C., & Yi, S. K. 2004, ApJS, 155, 667Denissenkov, P. A., & Herwig, F. 2004, ApJ, 612, 1081Denissenkov, P. A., & VandenBerg, D. A. 2003, ApJ, 593, 509Domınguez, I., Abia, C., Straniero, O., Cristallo, S., & Pavlenko, Y. V. 2004,A&A, 422, 1045
Droege, T. F., Richmond, M. W., Sallman, M. P., & Creager, R. P. 2006, PASP,118, 1666
Eggleton, P. P., Dearborn, D. S. P., & Lattanzio, J. C. 2006, Science, 314, 1580———. 2008, ApJ, 677, 581Fitzpatrick, M. J., & Sneden, C. 1987, BAAS, 19, 1129Forestini, M., & Charbonnel, C. 1997, A&AS, 123, 241Frebel, A., Norris, J. E., Aoki, W., Honda, S., Bessell, M. S., Takada-Hidai, M.,Beers, T. C., & Christlieb, N. 2007, ApJ, 658, 534
Fulbright, J. P. 2000, AJ, 120, 1841Fulbright, J. P., & Johnson, J. A. 2003, ApJ, 595, 1154Gallino, R., Arlandini, C., Busso, M., Lugaro, M., Travaglio, C., Straniero, O.,Chieffi, A., & Limongi, M. 1998, ApJ, 497, 388
Gallino, R., Bisterzo, S., Straniero, O., Ivans, I. I., & Kappeler, F. 2006, Mem.Soc. Astron. Italiana, 77, 786
Garcıa Perez, A. E., Asplund, M., Primas, F., Nissen, P. E., & Gustafsson, B.2006, A&A, 451, 621
Gehren, T., Liang, Y. C., Shi, J. R., Zhang, H. W., & Zhao, G. 2004, A&A, 413,1045
Gratton, R. G., Carretta, E., Claudi, R., Lucatello, S., & Barbieri, M. 2003,A&A, 404, 187
Gratton, R. G., Carretta, E., Eriksson, K., & Gustafsson, B. 1999, A&A, 350,955
Gratton, R. G., Sneden, C., Carretta, E., & Bragaglia, A. 2000, A&A, 354, 169Grevesse, N., & Sauval, A. J. 2002, Adv. Space Res., 30, 3Han, Z., Eggleton, P. P., Podsiadlowski, P., & Tout, C. A. 1995, MNRAS, 277,1443
Hill, V., et al. 2000, A&A, 353, 557Hinkle, K., Wallace, L., Valenti, J., & Harmer, D., eds. 2000, Visible and NearInfrared Atlas of the Arcturus Spectrum 3727Y9300 8 (San Francisco: ASP)
Hobbs, L. M., Thorburn, J. A., & Rebull, L. M. 1999, ApJ, 523, 797Honda, S., Aoki, W., Ishimaru, Y., & Wanajo, S. 2007, ApJ, 666, 1189Honda, S., Aoki, W., Ishimaru, Y., Wanajo, S., & Ryan, S. G. 2006, ApJ, 643,1180
Honda, S., Aoki, W., Kajino, T., Ando, H., Beers, T. C., Izumiura, H., Sada-kane, K., & Takada-Hidai, M. 2004a, ApJ, 607, 474
Honda, S., et al. 2004b, ApJS, 152, 113Iben, I., Jr., & Renzini, A. 1983, ARA&A, 21, 271Ishimaru, Y., & Wanajo, S. 1999, ApJ, 511, L33Ishimaru, Y., Wanajo, S., Aoki, W., & Ryan, S. G. 2004, ApJ, 600, L47
ROEDERER ET AL.1564 Vol. 679

Ivans, I. I., Simmerer, J., Sneden, C., Lawler, J. E., Cowan, J. J., Gallino, R., &Bisterzo, S. 2006, ApJ, 645, 613
Ivans, I. I., Sneden, C., Gallino, R., Cowan, J. J., & Preston, G. W. 2005, ApJ,627, L145
Ivarsson, S., Litzen, U., & Wahlgren, G. M. 2001, Phys. Scr., 64, 455Johnson, J. A. 2002, ApJS, 139, 219Johnson, J. A., & Bolte, M. 2002, ApJ, 579, L87———. 2004, ApJ, 605, 462Johnson, J. A., Herwig, F., Beers, T. C., & Christlieb, N. 2007, ApJ, 658, 1203Jonsell, K., Barklem, P. S., Gustafsson, B., Christlieb, N., Hill, V., Beers, T. C.,& Holmberg, J. 2006, A&A, 451, 651
Jonsell, K., Edvardsson, B., Gustafsson, B.,Magain, P., Nissen, P. E., &Asplund,M. 2005, A&A, 440, 321
Kappeler, F., Beer, H., & Wisshak, K. 1989, Rep. Prog. Phys., 52, 945Karakas, A. I., Lattanzio, J. C., & Pols, O. R. 2002, Publ. Astron. Soc. Australia,19, 515
Kim, Y.-C., Demarque, P., Yi, S. K., & Alexander, D. R. 2002, ApJS, 143, 499Kippenhahn, R., Ruschenplatt, G., & Thomas, H.-C. 1980, A&A, 91, 175Kiselman, D. 2001, NewA Rev., 45, 559Korn, A. J., Grundahl, F., Richard, O., Barklem, P. S., Mashonkina, L., Collet,R., Piskunov, N., & Gustafsson, B. 2006, Nature, 442, 657
Kraft, R. P., Peterson, R. C., Guhathakurta, P., Sneden, C., Fulbright, J. P., &Langer, G. E. 1999, ApJ, 518, L53
Kraft, R. P., & Shetrone, M. D. 2000, in The Galactic Halo: From GlobularCluster to Field Stars, ed. A. Noels et al. (Belgium: Institut d’Astrophysiqueet de Geophysique), 177
Kurucz, R. L. 1993, Kurucz CD-ROM 13, ATLAS 9 Stellar AtmospherePrograms and 2 km/s Grid (Cambridge: SAO)
Lai, D. K., Bolte, M., Johnson, J. A., & Lucatello, S. 2004, AJ, 128, 2402Lawler, J. E., Bonvallet, G., & Sneden, C. 2001a, ApJ, 556, 452Lawler, J. E., Wickliffe, M. E., den Hartog, E. A., & Sneden, C. 2001b, ApJ,563, 1075
Lodders, K. 2003, ApJ, 591, 1220Lucatello, S., Beers, T. C., Christlieb, N., Barklem, P. S., Rossi, S., Marsteller,B., Sivarani, T., & Lee, Y. S. 2006, ApJ, 652, L37
Lucatello, S., Gratton, R., Cohen, J. G., Beers, T. C., Christlieb, N., Carretta, E.,& Ramırez, S. 2003, AJ, 125, 875
Lucatello, S., Tsangarides, S., Beers, T. C., Carretta, E., Gratton, R. G., & Ryan,S. G. 2005, ApJ, 625, 825
Masseron, T., et al. 2006, A&A, 455, 1059Mathews, G. J., Bazan, G., & Cowan, J. J. 1992, ApJ, 391, 719McWilliam, A. 1998, AJ, 115, 1640McWilliam, A., Preston, G. W., Sneden, C., & Searle, L. 1995a, AJ, 109, 2757McWilliam, A., Preston, G. W., Sneden, C., & Shectman, S. 1995b, AJ, 109,2736
Melendez, J., & Ramırez, I. 2004, ApJ, 615, L33Mendez, R. A., & van Altena, W. F. 1998, A&A, 330, 910Mishenina, T. V., & Kovtyukh, V. V. 2001, A&A, 370, 951Munari, U., & Zwitter, T. 1997, A&A, 318, 269Ning, H., Qian, Y.-Z., & Meyer, B. S. 2007, ApJ, 667, L159Nissen, P. E., Akerman, C., Asplund, M., Fabbian, D., Kerber, F., Kaufl, H. U.,& Pettini, M. 2007, A&A, 469, 319
Nissen, P. E., Primas, F., Asplund, M., & Lambert, D. L. 2002, A&A, 390, 235Nollett, K. M., Busso, M., & Wasserburg, G. J. 2003, ApJ, 582, 1036Norris, J. E., Ryan, S. G., & Beers, T. C. 1997, ApJ, 488, 350Palacios, A., Charbonnel, C., & Forestini, M. 2001, A&A, 375, L9Piau, L., Beers, T. C., Balsara, D. S., Sivarani, T., Truran, J.W., & Ferguson, J.W.2006, ApJ, 653, 300
Pilachowski, C. A., Sneden, C., & Booth, J. 1993, ApJ, 407, 699Pilachowski, C. A., Sneden, C., & Kraft, R. P. 1996, AJ, 111, 1689Pinsonneault, M. H., Deliyannis, C. P., & Demarque, P. 1992, ApJS, 78, 179Piskunov, N. E., & Valenti, J. A. 2002, A&A, 385, 1095Preston, G. W., & Sneden, C. 2000, AJ, 120, 1014———. 2001, AJ, 122, 1545Preston, G. W., Sneden, C., Thompson, I. B., Shectman, S. A., & Burley, G. S.2006, AJ, 132, 85
Proffitt, C. R., & Michaud, G. 1991, ApJ, 380, 238Qian, Y.-Z., & Wasserburg, G. J. 2007, Phys. Rep., 442, 237Ramırez, I., & Melendez, J. 2005a, ApJ, 626, 446———. 2005b, ApJ, 626, 465Ramsey, L. W., et al. 1998, Proc. SPIE, 3352, 34Reddy, B. E., & Lambert, D. L. 2005, AJ, 129, 2831Rhee, J. 2001, PASP, 113, 1569Roederer, I. U., Lawler, J. E., Sneden, C., Cowan, J. J., Sobeck, J. S., &Pilachowski, C. A. 2008, ApJ, 675, 723
Ryan, S. G., Aoki, W., Norris, J. E., & Beers, T. C. 2005, ApJ, 635, 349Ryan, S. G., Beers, T. C., Deliyannis, C. P., & Thorburn, J. A. 1996, ApJ, 458,543
Ryan, S. G., & Deliyannis, C. P. 1998, ApJ, 500, 398Sackmann, I.-J., & Boothroyd, A. I. 1999, ApJ, 510, 217Salaris, M., Chieffi, A., & Straniero, O. 1993, ApJ, 414, 580Sansonetti, C. J., Richou, B., Engleman, R. J., & Radziemski, L. J. 1995, Phys.Rev. A, 52, 2682
Schlegel, D. J., Finkbeiner, D. P., & Davis, M. 1998, ApJ, 500, 525Seeger, P. A., Fowler, W. A., & Clayton, D. D. 1965, ApJS, 11, 121Shetrone, M., et al. 2007, PASP, 119, 556Simmerer, J., Sneden, C., Cowan, J. J., Collier, J., Woolf, V. M., & Lawler, J. E.2004, ApJ, 617, 1091
Sivarani, T., et al. 2004, A&A, 413, 1073Skrutskie, M. F., et al. 2006, AJ, 131, 1163Smith, V. V., Lambert, D. L., & Nissen, P. E. 1993, ApJ, 408, 262Sneden, C., Cowan, J. J., & Gallino, R. 2008, ARA&A, in pressSneden, C., Preston, G. W., & Cowan, J. J. 2003, ApJ, 592, 504Sneden, C. A. 1973, Ph.D. thesis, Univ. Texas at AustinSobeck, J. S., Lawler, J. E., & Sneden, C. 2007, ApJ, 667, 1267Spergel, D. N., et al. 2007, ApJS, 170, 377Spite, F., & Spite, M. 1982, A&A, 115, 357Spite, M., et al. 2006, A&A, 455, 291Straniero, O., Chieffi, A., Limongi, M., Busso, M., Gallino, R., & Arlandini, C.1997, ApJ, 478, 332
Straniero, O., Domınguez, I., Cristallo, R., & Gallino, R. 2003, Publ. Astron.Soc. Australia, 20, 389
Sugimoto, D. 1971, Prog. Theor. Phys., 45, 761Takada-Hidai, M., Saito, Y.-J., Takeda, Y., Honda, S., Sadakane, K., Masuda,S., & Izumiura, H. 2005, PASJ, 57, 347
Takeda, Y., Zhao, G., Chen, Y.-Q., Qiu, H.-M., & Takada-Hidai, M. 2002,PASJ, 54, 275
Takeda, Y., Zhao, G., Takada-Hidai, M., Chen, Y.-Q., Saito, Y.-J., & Zhang, H.-W.2003, Chinese J. Astron. Astrophys., 3, 316
Thevenin, F. 1998, Bull. Cent. Donnees Stellaires, 49Thompson, I. B., et al. 2008, ApJ, 677, 556Thorburn, J. A., & Beers, T. C. 1992, BAAS, 24, 1278Travaglio, C., Gallino, R., Arnone, E., Cowan, J., Jordan, F., & Sneden, C.2004, ApJ, 601, 864
Tull, R. G. 1998, Proc. SPIE, 3355, 387Tull, R. G., MacQueen, P. J., Sneden, C., & Lambert, D. L. 1995, PASP, 107,251
Ulrich, R. K. 1972, ApJ, 172, 165Wanajo, S., Nomoto, K., Iwamoto, N., Ishimaru, Y., & Beers, T. C. 2006, ApJ,636, 842
Wanajo, S., Tamamura, M., Itoh, N., Nomoto, K., Ishimaru, Y., Beers, T. C., &Nozawa, S. 2003, ApJ, 593, 968
Wasserburg, G. J., Boothroyd, A. I., & Sackmann, I.-J. 1995, ApJ, 447, L37Westin, J., Sneden, C., Gustafsson, B., & Cowan, J. J. 2000, ApJ, 530, 783Wiese, W. L., Fuhr, J. R., & Deters, T. M., eds. 1996, Atomic TransitionProbabilities of Carbon, Nitrogen, and Oxygen: A Critical Data Compilation(Washington, DC: American Chemical Society)
Yan, Z.-C., Tambasco, M., & Drake, G. W. F. 1998, Phys. Rev. A, 57, 1652Zhang, H. W., & Zhao, G. 2005, MNRAS, 364, 712Zijlstra, A. A. 2004, MNRAS, 348, L23Zinner, E., Nittler, L. R., Gallino, R., Karakas, A. I., Lugaro, M., Straniero, O.,& Lattanzio, J. C. 2006, ApJ, 650, 350
HET CASH PROJECT. I. 1565No. 2, 2008