the hipc-initiative and poverty...
TRANSCRIPT

Department of Economics
Uppsala University
Essay, Advanced Level (D)
Author: Erika Sahlin
Advisor: Ranjula Bali Swain
Spring term, 2005
THE HIPC-INITIATIVE AND POVERTY ALLEVIATION
***
AN ANALYSIS OF MOZAMBIQUE

2
ABSTRACT
This paper deals with the relationship between the highly indebted poor countries (HIPC) debt
relief initiative and the incidence of poverty in Mozambique. In order to get assistance under the
enhanced HIPC initiative, a plan for reducing poverty has to be provided. The underlying
thought is that the resources freed up due to debt relief, should go to increased social spending
targeted at poverty alleviation. Mozambique’s debt stock has been brought done due to the HIPC
initiative and the average economic growth has been high, which gives a good ground for poverty
alleviation. However, the evidence in this paper shows a mixed picture of the progress made in
poverty alleviation. The household surveys made in 1996-97 and in 2002-03 show that the
incidence of poverty has been reduced satisfactory. Nontheless, expenditure on most of the
priority sectors, including education, health, HIV/AIDS, infrastructure, government and other
sectors, have been more or less the same since 1999, indicating that the authorities have not lived
up to the expectations. Despite that, there has been a positive progress in the social sectors
including education, water and sanitation and to some extent even health. The sectors that have
developed less satisfying are HIV/AIDS and gender equity.

3
CONTENTS
ABBREVIATIONS......................................................................................................................................................5
1. INTRODUCTION ............................................................................................................................................6
2. THE HIPC INITIATIVE.......................................................................................................................................7
3. LITERATURE SURVEY .....................................................................................................................................10
4. THEORY ...........................................................................................................................................................12
5. MOZAMBIQUE ....................................................................................................................................................15
5.1 THE POVERTY SITUATION..............................................................................................................................15 5.2 MOZAMBIQUE AND THE HIPC INITIATIVE ...............................................................................................17 5.3 POVERTY REDUCING STRATEGY ..................................................................................................................19
6. EMPIRICAL ANALYSIS .....................................................................................................................................21
6.1 INTRODUCTION ...............................................................................................................................................21 6.2 ECONOMIC GROWTH ......................................................................................................................................21 6.3 EXPENDITURE ON POVERTY ALLEVIATION...............................................................................................24 6.3.1 EDUCATION...................................................................................................................................................27 6.3.1.2 GENDER EQUALITY..................................................................................................................................28 6.3.2 HEALTH..........................................................................................................................................................29 6.3.3 SANITATION AND WATER ..........................................................................................................................30
7. SUMMARIZING CONCLUSION ....................................................................................................................31
8. REFERENCES.......................................................................................................................................................34
APPENDIX 1..............................................................................................................................................................37
APPENDIX 2..............................................................................................................................................................37
APPENDIX 3..............................................................................................................................................................38
APPENDIX 4..............................................................................................................................................................38

4
TABLES AND FIGURES
TABLE 1 Status of Countries considered under the HIPC Initiative ..................................................................8
TABLE 2 The Original and Enhanced HIPC Initiative .........................................................................................9
FIGURE 1 The Debt “Laffer Curve” .....................................................................................................................10
FIGURE 2 Effects of Debt Relief and Foreign Assistance on Output Growth..............................................13
TABLE 3 Avarage Consumption and Poverty Estimates by Zone and Region...............................................15
FIGURE 3 Value Added to the different sectors in Mozambique 2002 ...........................................................16
TABLE 4 A Snapshot of the Poverty Situation .....................................................................................................17
TABLE 5 Relief under the Original and Enhanced HIPC Initiative..................................................................17
FIGURE 4 Net Present Value of Debt, end-December 1998.............................................................................18
TABLE 6 Net Present Value of Debt and Debt Service, 1998-2004................................................................19
TABLE 7 Debt, Debt Service and Aid....................................................................................................................23
TABLE 8 Selected Economic Indicators ................................................................................................................24
FIGURE 5 GDP Growth and Foreign Direct Investment .................................................................................24
FIGURE 6 Expenditures on Priority Areas in percent of Total Expenditure..................................................25
FIGURE 7 Poverty Incidence by Province in percent .........................................................................................26
FIGURE 8 School Coverage Indicators 1999-2002 in percent ...........................................................................27
FIGURE 9 Primary Completion Rates in percent of relevant age group..........................................................28
FIGURE 10 Proportion of Girls in EP1 and EP2 in percent .............................................................................29
TABLE 9 Measures of Human Development .......................................................................................................30
TABLE 10 Official Country Estimates of Population Vaccinated .....................................................................30

5
ABBREVIATIONS
BADEA Arab Bank for Economic Development in Africa
CPI Consumer Price Index
E-HIPC Enhanced HIPC Initiative
EU European Union
HDI Human Development Index
HIPC Highly Indebted Poor Country
IDA International Development Association
IFAD International Fund for Agricultural Development
IFI International Financial Institution
IMF International Monetary Fund
LDC Less Developed Country
NPV Net Present Value
O-HIPC Original HIPC Initiative
PARPA Action Plan for Reduction of Absolute Poverty
PRSP Poverty Reduction Strategy Paper
SAP Structural Adjustment Program
WB World Bank
WHO World Health Organisation

6
1. INTRODUCTION
Between 1970 and 1995 the external debt of Less Developed Countries (LDCs) increased more
than 2300 percent from US $69.4 billion to over US $1.7 trillion (Omole 2004). The debt crisis
has among other things been caused by the sharp increase in interest rates and the appreciation of
the dollar in the late 70’s and the world recession during the 80’s. The rising debt stock has
become overwhelming for many of the LDCs and has made it harder for them to even service on
their debts (Elagöz and Güven Lisaniler 2004).
Civil society groups have argued that the International Financial Institutions (IFIs) should write
the debts off and give the LDCs a fair chance to take control over their economies and their
poverty situation. The conditions for borrowing money from the IFIs, the so called Structural
Adjustment Programs (SAPs) have actually worsened the economic situation for some LDCs. In
order to get a loan from the World Bank or the International Monetary Fund (IMF) a country
has to agree to certain terms that are supposed to assure a future pay back. These terms include
cutting social spending, shrinking the government, increasing interest rates, eliminating
regulations on foreign ownership of resources and businesses, eliminating tariffs, cutting
subsidies for basic goods and re-orientating economies from subsistence to exports. This has led
to reduced primary school enrolment, a reduced literacy rate, increased unemployment, increased
production of cash crops and reduced production of food for domestic needs and raised costs of
items needed to survive. Consequently the SAPs has resulted in the borrowing countries
becoming more dependant on IFIs and the economic growth and income per capita have been
brought down. (Elagöz and Güven Lisaniler 2004)
In 1996 the World Bank and the IMF launched the Heavily Indebted Poor Countries (HIPC)
initiative with the goal to supply a substantial debt relief for the most heavily indebted poor
countries in the world. The initiative was later further enhanced with the underlying thought that
the resources freed up due to debt relief, should go to increased social spending targeted at
poverty alleviation. The purpose of this paper is to investigate if the HIPC-initiative in
Mozambique has resulted in increased poverty expenditure and reduction in poverty. This is done
by examining different indicators of development over a time period reaching from the debt
reduction until today. These indicators include both economic and social measures since poverty
is a multi-dimensional concept.

7
2. THE HIPC INITIATIVE
In 1996 the HIPC Debt Initiative was proposed by the IMF and the World Bank. This was the
first time that multilateral, Paris Club1, other bilateral and commercial creditors joined together to
reduce the external debt burden of some of the world’s most heavily indebted countries. When a
country’s debt exceeds its ability to repay, the country is suffering from a debt overhang. The
underlying attempt of the HIPC was to remove the debt overhang constraining economic growth
in the most heavily indebted countries. As debt stock was brought down to sustainable levels,
export earnings, aid and private capital flows would make it possible for them to service on their
debts2 (IMF 1999). In 1999 the initiative was enhanced to make debt relief broader, faster and
deeper. The objectives set in the enhanced HIPC (E-HIPC) are to reduce the external debt stocks
to below the level of other poor countries, promote growth and free up resources for increased
social expenditures targeted at poverty alleviation. While the original HIPC (O-HIPC) did not
have any restrictions for how the funds released from debt relief were to be used, the E-HIPC set
out specific poverty reduction targets ensuring that resources go to improving education, health,
basic infrastructure and social safety nets (Gautam 2003). So far 48 countries have been
considered under the HIPC initiative. See Table 1.
1 The Paris Club is a group of informal and voluntary bilateral creditors, mostly from developed countries. 2 Debt service is payments of amortization and accumulated interest.

8
TABLE 1 Status of Countries considered under the HIPC Initiative
Pre-decision Point Decision Point Completion Point
Burundi Cameroon Benin
Central African Republic Chad Bolivia
Comoros Congo, Dem. Rep. of Burkina Faso
Republic of Congo Gambia, The Ethiopia
Côte d’Ivoir Guinea Ghana
Lao PDR Guinea-Bissau Guyana
Liberia Malawi Honduras
Myanmar São Tomé and Principe Madagascar
Somalia Sierra Leone Mali
Sudan Mauritania
Togo Mozambique
Nicaragua
Niger
Rwanda
Senegal
Tanzania
Uganda
Zambia
Source: World Bank 2005
In order to qualify for the HIPC assistance a country has to have a debt-to-exports ratio or a
debt-to-revenue ratio above a certain limit. Partly because of pressure from civil society groups
the threshold level for eligibility to the HIPC was lowered from a debt-to-exports ratio of 200-
250 percent in NPV terms under the O-HIPC to 150 percent under the E-HIPC. This was to
increase the capacity of the HIPC countries to deal with exogenous shocks. The objectives and
targets included in the two different initiatives are shown in Table 2.

9
TABLE 2 The Original and Enhanced HIPC Initiative
Original Enhanced Stated objectives
To bring the country’s debt down to sustainable levels
To remove debt overhang and provide a permanent exit from rescheduling, plus free up resources for higher social spending aimed at poverty reduction to the extent that cash debt-service payments are reduced
Targets NPV debt-of-exports: 200-250%
NPV debt-to-revenue: 280%
Export/GDP: 40%
Revenue/GDP: 20%
NPV debt-of-exports: 150%
NPV debt-to-revenue: 250%
Export/GDP: 30%
Revenue/GDP: 15%
Creditor
participation
Guiding principle: Comprehensive debt
relief action coordinated among all
creditors involved with broad and
equitable participation. New external
finance to be on appropriately
concessional terms
Principle for change: Same plus debt
relief should be additional to reinforce
the wider tools of the international
community to promote sustainable
development and poverty reduction
Source: Gautam 2003
After having shown commitment to establishing sound macroeconomic policies and developing a
Poverty Reduction Strategy Paper (PRSP) the country is considered to have reached its decision
point. Then the country starts receiving interim debt relief based on its immediate needs and
ability to channel resources to poverty reducing targets. After another period of implementing
key policy reforms together with sound macroeconomic and poverty-reducing policies, the
country can reach its completion point when the reminder of the relief committed is delivered.
To date 27 of the 38 countries classified as HIPCs are benefiting from relief (IMF 2004a and
World Bank 2005).
Debt relief is thought to be the first step towards economic recovery and long term debt
sustainability. In order to achieve this, the HIPC countries have to use their debt relief to create a
sustained economic growth and poverty reduction (IMF 2004a). The HIPC initiative is thus
thought to reduce poverty in two ways, increase economic growth and to increase public
expenditure targeted at poverty reduction (Danielsson 2002). The latter is to be achieved

10
provided that the level of foreign aid directed at the country at least stays the same (Gautam
2003)
3. LITERATURE SURVEY
When a country’s debt exceeds its ability to repay, the country is suffering from a debt overhang.
In economic theory foreign borrowing has a positive impact on domestic investments and
growth up to a certain threshold. Beyond that level the impact is negative. Expected debt-service
costs can crowd out foreign and domestic investment and harm growth since expectations of
raised taxes in order to service on debts intimidate potential investors (Bhattacharya and
Clements 2004). This can be shown in the debt “Laffer curve” in Figure 1. On the upward-
sloping side of the curve, increases in debt are associated with increases in expected debt
repayment, while on the downward-sloping side increases in debt are associated with lower
probabilities of debt repayment (Pattillo et al 2002).
FIGURE 1 The Debt “Laffer Curve”
Source: Pattillo et al 2002 Servicing on rapidly growing debt stocks have been empirically shown to reduce the availability
of resources to support growth renewal. Rising debt-service ratios have led to countries either not
being able to make their repayments at all or having to depreciate the local currency and thereby
damaging the foreign exchange, in order to make the payments (Elbadawi et al 1997).

11
Elbadawi, Ndulu and Ndung’u (1997) performed cross-section regressions for 99 developing
countries from different continents in order to assess the impacts of external debt overhang on
growth and investment. The evidence they obtained gives support to the debt “Laffer curve”
showing that, the current debt inflows stimulates growth but debt overhang effects growth
negatively. It also suggest that debt service payments constrain liquidity and affect growth
negatively as export earnings are reduced and leads to decline in public sector expenditures,
which also have a negative impact on growth. They further find that the turning point where
foreign borrowing negatively affects economic growth is at a debt-to-GDP ratio of 97 percent for
a sample of African countries. The results suggest that the debt burden has had a strongly
negative affect on the economic growth of African HIPCs since the 80’s, which had undermined
reforms and restrained the development of a functional state.
Pattillo, Poirson and Ricci (2002) on the other hand, find that the turning point where debt
appears to affect growth negatively is at 160-170 percent of exports and 35-40 percent of GDP,
in NPV terms. In their analysis they used 3-year average panel data for 93 developing countries
over the period 1969-98 in order to test whether debt and per capita growth are related. Their
results imply that halving the debt-to-exports ratio from 200 percent to 100 percent would
increase per capita growth by about 0.5 to 1 percentage point. They argue that although debt
overhang theories do not distinctly explain the effects on economic growth, they suggest that
large debt stocks do have a negative impact on growth partly due to reduction in investment.
There is also an implication that large debt stocks negatively effect incentives for policy reform
such as trade liberalization and fiscal adjustment because the government feel the benefits will
partly go to foreign lenders.
The research of Bhattacharya and Clements (2004), made on 55 low-income countries that were
in position of receiving funds under the IMF’s Poverty Reduction and Growth Facility (PRGF),
also suggest that high levels of debt can depress economic growth in low-income countries. They
found that the turning point appears to be when the NPV of debt amounts to about 20-25
percent of GDP or about 100-105 percent of exports, which is lower than the findings of both
the above. Their evidence also gives support to the hypothesis that high debt service crowds out
public investment. Their results indicate that a 1 percent point GDP increase in debt service,
reduce public investment by 0.2 percent of GDP. This indicates that debt relief cannot be
expected to have a great effect on public investment but rather on public consumption or private
consumption or investment.
12
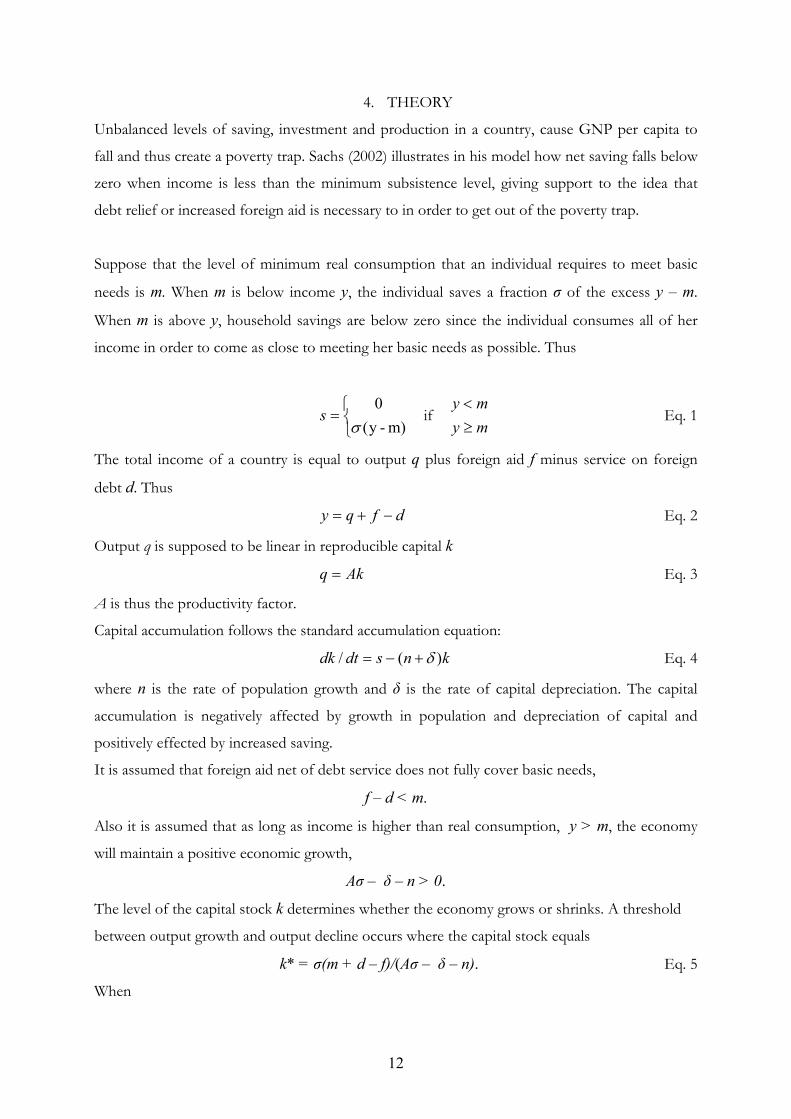
4. THEORY
Unbalanced levels of saving, investment and production in a country, cause GNP per capita to
fall and thus create a poverty trap. Sachs (2002) illustrates in his model how net saving falls below
zero when income is less than the minimum subsistence level, giving support to the idea that
debt relief or increased foreign aid is necessary to in order to get out of the poverty trap.
Suppose that the level of minimum real consumption that an individual requires to meet basic
needs is m. When m is below income y, the individual saves a fraction σ of the excess y – m.
When m is above y, household savings are below zero since the individual consumes all of her
income in order to come as close to meeting her basic needs as possible. Thus
⎩⎨⎧
=m) -y(
0σ
s if mymy
≥<
Eq. 1
The total income of a country is equal to output q plus foreign aid f minus service on foreign
debt d. Thus
dfqy −+= Eq. 2
Output q is supposed to be linear in reproducible capital k
Akq = Eq. 3
A is thus the productivity factor.
Capital accumulation follows the standard accumulation equation:
knsdtdk )(/ δ+−= Eq. 4
where n is the rate of population growth and δ is the rate of capital depreciation. The capital
accumulation is negatively affected by growth in population and depreciation of capital and
positively effected by increased saving.
It is assumed that foreign aid net of debt service does not fully cover basic needs,
f – d < m.
Also it is assumed that as long as income is higher than real consumption, y > m, the economy
will maintain a positive economic growth,
Aσ – δ – n > 0.
The level of the capital stock k determines whether the economy grows or shrinks. A threshold
between output growth and output decline occurs where the capital stock equals
k* = σ(m + d – f)/(Aσ – δ – n). Eq. 5
When

13
k < ( m + d – f)/A < k*,
savings equal zero, the capital accumulation equals
dk/dt = – (δ + n)k
so that the economy shrinks at the rate – (δ + n).
When instead
k > ( m + d – f)/A < k*,
capital accumulation
dk/dt = σ(Ak + f – d – m) – (δ + n)k < 0.
Output and the capital stock decline to the level where savings equal zero and the economy once
again shrinks at the rate – (δ + n).
When
k > ( m + d – f)/A > k*
the economy grows at a rising rate approaching
Aσ – δ – n.
In Figure 2 the growth of output is graphed against the level of the capital stock for given levels
of debt service and foreign aid. A rise in foreign aid or a cut in debt service of size ∆ shifts the
growth curve upward by the amount ∆ σ/k, assuming that k > k* and that k* falls by the amount
dk* = –σ∆ /(Aσ – δ – n).
Thus an economy that was shrinking will start to grow if k* shifts below k as a result of debt
cancellation or a rise in foreign aid.
FIGURE 2 Effects of Debt Relief and Foreign Assistance on Output Growth
Source: Sachs 2002.

14
Sachs argues, there are also other factors that can cause poverty traps. For instance, if the
population growth n increases as the income y decreases, a demographically induced poverty trap
is possible. In that case, a very poor population compensates for the very high infant and child
mortality rates by having many children, which in turn leads to lower investment in human capital
per child. Thus because of the high fertility rate, saving per capita is not sufficient enough to
maintain the capital-labour ratio and the economic growth stagnates or becomes negative.
Another alternative is that the profitability of using modern technology depends on a minimum
scale of the market, or a minimum level of public expenditure on public goods, or a minimum
quality of infrastructure. When k is too low, σq(k) – (n + δ)k becomes negative.
Sachs, therefore argues that the most important investments for poverty alleviation in countries
with very low levels of income per capita probably are public sector investments aimed at primary
health, education and basic infrastructure. This is because a country without basic literacy and
health levels is not likely to attract private investments.
Economies likely to end up in a poverty trap are poor countries which have inherited a debt
burden and suffer from negative growth. Economies with very low productivity A are especially
vulnerable. These economies include geographically isolated regions, as for example landlocked
states, countries with a small internal market and regions with adverse ecologies, such as tropical
rainforests. Economies with low initial levels of reproducible capital k, perhaps as result of
previous war or natural disaster, are also vulnerable. Countries with very high fertility rates, for
cultural reasons or in response to high infant and child mortality rates, are especially vulnerable as
well. However, not all very poor countries fall into a poverty trap. Countervailing forces, the
most important being inflows of technology and capital from the richer countries, can promote
very high growth rates in poor settings. In particular, if a poor country has an adequate mix of
favourable geography (good ports, nearness to major markets), physical ecology (fertile soils,
generous rainfall, absence of tropical diseases), little inherited debt, large internal markets (to
encourage domestic and foreign investment aimed at the home market), and good governance (to
promote private sector investment and provide essential public services), the prospects for rapid
growth are likely to be high and the risk of a poverty trap is likely to be remote (Sachs 2002).

15
5. MOZAMBIQUE
5.1 The poverty situation
Mozambique is a former Portuguese colony that became independent in 1975. Partly due to
socialist mismanagement and a civil war lasting from 1977 to 1992, the country was one of the
world’s poorest when it became independent. Marxism was formally abandoned in 1989 and free
market economy has been adopted ever since (ECA 2003 and CIA World Fact Book). See
appendix 1 and 2 for the map and the fact sheet of Mozambique.
Agriculture is the main source of livelihood for the rural households in the country. 81 percent of
the population are employed in the agriculture section, 6 percent in industry and 13 percent in
service sector (ECA 2003 and CIA World Fact Book). In 1999 about 69.37 percent of the total
population were poor, 81.8 percent of which, lived in the rural areas. See Table 3.
TABLE 3 Avarage Consumption and Poverty Estimates by Zone and Region
Portion of the population (%)
Head Count index3 (%)
Distribution of the poor (%)
Rural 79.7 71.25 81.8
Urban 20.3 62.01 18.2
North 32.5 66.28 31.0
Centre 42.6 73.81 45.3
South 24.9 65.80 23.6
National 100.0 69.37 100.0
Source: PRSP Implementation Evaluation Report 2001 Seeing as, since 1995, value added has been redistributed to the industry sector, employing 6
percent of the total population from the sector employing the vast majority of the poor
population, the agriculture sector, it is most likely that the poor have been affected (World
Development Indicators 2004). See Figure 3.
3 Head Count Index is the percentage of the population whose per capita incomes, or expenditures spending, are below the poverty line, that is, the population that cannot afford to buy a basic basket of goods.

16
FIGURE 3 Value Added to the different sectors in Mozambique 2002
(in percent of GDP)
05
101520253035404550
1995 1996 1997 1998 1999 2000 2001 2002
Services, value added Industry, value added Agriculture, value added
Source: World Development Indicators 2004
Mozambique is one of the world’s poorest countries with a per capita income of US $210 in
2003. The Human Development Index (HDI) that measures average achievement in three basic
dimensions of human development including a long and healthy life, knowledge and a decent
standard of living, ranks Mozambique as number 171 of 177 countries (Human Development
Report 2005). The different poverty measures shown in Table 4, reveal a more severe situation in
Mozambique than on average in Sub-Saharan Africa.

17
TABLE 4 A Snapshot of the Poverty Situation
Most recent estimate (latest year available 2002-2003) Mozambique Sub-Saharan Africa
Life expectancy at birth, (years) 41 46
Total fertility rate 5 5
Literacy rate, adult female (% of females aged 15 and above) 31 58
Literacy rate, adult male (% of males aged 15 and above) 62 71
Mortality rate, infant (per 1000 live births) 128 101
HIV/AIDS adult prevalence rate (in % of population) 12 7
Population growth rate in % 2 2
GNI/capita (Atlas method, current US $) 210 500
HDI value O,354 0,465
Source: World Bank Development Indicators and Human Development Report 2005
5.2 Mozambique and the HIPC Initiative
In April 1998 Mozambique became the sixth country in the world to benefit from the HIPC
initiative. The completion point under the original HIPC initiative was reached in June 1999 and
under the enhanced initiative in September 2001. The reduction in NPV of debt was $1.7 billion
i.e. 63 percent in the original framework and $0.3 billion i.e. 27 percent in the enhanced (Gautam
2003). See Table 5. At that time it was the largest debt-relief operation by the International
Financial Institutions (IFIs) ever made (IMF and IDA 2000a).
TABLE 5 Relief under the Original and Enhanced HIPC Initiative
Assistance (in present value terms at the
completion point)
Mozambique Decision point
Completion point
Total debt relief
nominal (millions of U.S. dollars)
Percent reduction in
debt
All creditors (millions of U.S. dollars)
O-HIPC Apr. 1998 June 1999 3700 63 1716
E-HIPC Apr. 2000 Sept. 2001 600 27 306
Source: IMF and IDA 2000a and Gautam 2003

18
After debt relief under the enhanced HIPC initiative the external debt of Mozambique was
calculated to be reduced to about two sevenths of the US$2.7 billion that would have been owed
without HIPC Initiative assistance. Figure 4 shows the debt in net present value terms after debt
relief under the two initiatives.
FIGURE 4 Net Present Value of Debt, end-December 1998
(in millions of US dollars)
7871047
2731
0
500
1000
1500
2000
2500
3000
After traditional debt reliefmechanisms
After original HIPC Initiative After enhanced HIPC Initaitive
Source: IMF and IDA 2000a
In Table 6 an estimation of future debt and debt service in net present value terms is shown. It is
evident that the O-HIPC and the E-HIPC initiatives would lead to considerable savings in debt
service payments. For detailes concerning the creditors see Appendix 3.

19
TABLE 6 Net Present Value of Debt and Debt Service4, 1998-2004
(in millions of US dollars)
1998 1999 2000 2001 2002 2003 2004 NPV of debt Before HIPC5 2731 2714 2782 2827 2893 2940 2989 After O-HIPC6 1042 1077 1162 1229 1298 1350 1404 After E-HIPC7 787 809 896 966 1037 1093 1150 Debt service due Before HIPC5 104 146 172 166 162 167 169 After O-HIPC6 … 86 67 67 69 72 72 After E-HIPC7 8 … … 50 48 51 54 55 Savings on debt service O-HIPC … 60 105 99 93 95 97 E-HIPC … 0 17 19 18 18 17 O-HIPC and E-HIPC … 60 122 118 111 113 114 Source: IMF and IDA 2000a
5.3 Poverty reducing strategy
Mozambique’s own definition of poverty, written in the PARPA (the Portuguese abbreviation for
Action Plan for Reduction of Absolute Poverty) from 2001 is the
"inability of individuals to ensure for themselves and their dependants a set of basic minimum conditions necessary
for their subsistence and well-being in accordance with the norms of society”.
All countries benefiting from the enhanced HIPC initiative are required to write an Interim
Poverty Reduction Strategy Paper (Interim PRSP). In 2000 the Mozambican authorities prepared
a PRSP consisting of the PARPA and an additional document which set out what needed to be
done in order to achieve a full PRSP. In this document the main objective set out by the
government was a 30 percent reduction in absolute poverty by 2009 with a 15 percent reduction
by 2004. Mozambique had enjoyed a period with a rapid growing economy, but with a living
4 Refers to public and publicly guaranteed debt only. 5 The NPVs of debt for bilateral and commercial creditors reflect a hypothetical stock-of-debt operation on Naples terms at end-1998. Actual stock-of-debt operations on Naples, Lyon, and Cologne terms have not been implemented but are expected to be consolidated into one operation at the completion point, and could result in some revisions. 6 Assumes full delivery of assistance under the original HIPC Initiative as of July 1999. 7 Assumes hypothetical delivery of debt relief under the traditional mechanisms, original and enhanced HIPC Initiative, as well as the accelerated relief from IDA and IMF during the interim period. 8 Paris Club announced in March 2000 that Mozambique would receive a deferral of debt service until it reaches the completion point under the enhanced HIPC Initiative, followed by a stock-of-debt operation on the eligible debt on Cologne terms. Assuming that completion point would be reached in April 2001, the estimated debt service reduction during this period is estimated to amount to about US$36 million. Several bilateral creditors also announced that additional cancellation would be provided to Mozambique in response to the flood emergency

20
standards growing more slowly because of the negative impact of high population growth rates.
For that reason, sustainable economic growth at a rate between 7 and 10 percent together with a
low inflation rate at about 5 to 7 percent was estimated needed in order to reduce absolute
poverty (IMF and IDA 2000b).
The needs emphasized in the PARPA Evaluation Implementation Report 2001 in order to
achieve the poverty reduction goal were:
To maintain rapid and sustainable economic growth by stimulating the development of
industry and construction and increasing productivity in agriculture.
To give priority to the development of human capital through public investments in
education, health, access to clean water and environmental sanitation.
To increase agricultural productivity in the family sector, particularly in areas with high agro-
ecological potential.
To develop infrastructure in rural areas.
To protect the most vulnerable groups through social security and assistance programmes.
To promote employment and self-employment in both rural and urban areas through
vocational training and the promotion of income generating micro-projects and enterprises,
with particular attention to women, unemployed and socially excluded young people.
To improve technical and institutional capacity to monitor and evaluate poverty and analyse
research in the poverty field in order to improve knowledge of the phenomenon and select
the appropriate strategies to fight it. These targets are well comparable to the UN Millennium Goals. See Appendix 4.
In the PARPA in the Assessment of the Interim Poverty Reduction Strategy Paper 2000 some
key social objectives, on which this paper is focused, were set. These are:
To ensure that children have access to basic education of an acceptable quality, with due
consideration of the need to reduce regional and gender disparities in admissions and school
performance.
To ensure that the population has access to clean water, specially the rural population.
To promote and provide good quality and sustainable health care, equitably and efficiently,
making it accessible to the population, especially the less privileged groups.
To prevent the main endemic diseases affecting children through immunization.
To prevent the HIV infection.

21
6. EMPIRICAL ANALYSIS
6.1 Introduction
The HIPC Initiative has two underlying purposes which are to reduce the debt service payments
and to reduce poverty. This is thought to happen through two channels: by increase in economic
growth and by direct investment in poverty alleviation. The literature survey gives a clear
indication on how a heavily indebted country can give a boost to its economic growth by
controlling its debt-to-GDP ratio and debt-to-exports ratio in terms of NPV, the underlying
argument being that the debt overhang leads to a reduction in investment. That can have a
negative effect on policy reform and crowd out public investment, leading to an impact on public
and private consumption. The theoretical model by Sachs further extends this discussion to
reduction of poverty through expenditure on health, education and basic infrastructure. The
Mozambican PRSP extends this further to expenditure on agriculture, employment, and income-
generating activities.
6.2 Economic growth
The purpose of this paper is to see if the HIPC initiative has led to increased poverty expenditure
and reduction in poverty. In order to assess this it is interesting to first of all see if the promised
reduction in debt has in fact taken place. From Table 7 it is evident that the total debt service in
current US dollars has decreased over the years, which is also indicated by debt service in percent
of exports and, although not as clearly, by debt service in percent of GNI. However, looking at
the present value of debt, there has been an increase in debt in 2003. Due to lack of data for 2003
it is not possible to tell how this has affected the other measures of present value of debt and
debt service after 2002.
The indicator for inflow of aid per capita, is interesting because, as said in section 2, poverty
reduction under the HIPC initiative is accounted achievable if aid assistance stays the same.
Seeing as this has been the case together with a reduction, at least partly, in debt payments, the
basic circumstances for poverty reduction are provided for. The reason why aid was doubled
from 2001 to 2002 most likely have to do with the fact that the central parts of the country was
hit by severe drought in 2002 (Oxfam 2005).
Of interest is comparing the present value of debt in percent of GNI and exports of goods and
services respectively, with the different debt-to-GDP and debt-to-exports ratio given in the
literature survey. Under the E-HIPC initiative the debt-to-exports level is 150 percent in terms of
NPV for countries to become eligible for debt relief. The literature suggest that the threshold

22
level where debt no longer has a positive impact on economic growth lie somewhere between
100 and 170 percent for the debt-to-exports ratio in NPV terms. The same level for the debt-to-
GDP ratio, is empirically shown to lie between 20 and 97 percent. In Table 7 we see that the
present value of debt in percent of exports was close to 88 percent, and the present value of debt
in percent of GNI9 was about 26 percent in 2002. This implies that Mozambique was out of the
risk area for debt overhang in 2002, at least when looking at the debt-to-exports ratio.
9 GNI and GDP were broadly the same for 2002, which implies the debt-to-GDP and debt-to-GNI ratios would be comparable.

23
TABLE 7 Debt, Debt Service and Aid
(Millions of US dollars)
1997 1998 1999 2000 2001 2002 2003
Present value of debt10 (current US $) ... ... ... 1162.0 916.0 893.7 1352.2
Present value of debt (in % of GNI) ... ... ... 32.44 27.56 26.22 ...
Present value of debt (in % of exports of goods and services) ... ... ... ... ... 87.95 ...
Total debt service (current US $) 109.7 103.6 104.5 87.7 89.2 75.6 ...
Total debt service (in % of GNI) 3.4 2.8 2.8 2.5 2.8 2.2 ...
Total debt service (in % of exports of goods and services) 19.0 18.0 16.4 11.4 8.3 6.1 ...
Aid per capita (current US $) 57.0 61.3 46.5 49.6 51.6 111.7 ...
Source: World Development Indicators 2004 and World Bank Africa Database 2003
In the PARPA, two of the means for reducing poverty, was achieving economic stability and a
high economic growth rate. The average annual GDP growth in Mozambique was about 7.4
percent between 1999 and 2003. See Table 8. This is in line with the targeted growth rate of 7-10
percent, set out in the PARPA. However, the PARPA target is set for the period 1999-2009, thus
whether the goal will be achieved is not yet clear. The development in GDP growth was
especially high 1997, 1998 and 2001. The halt in economic progress that occurred in-between can
be explained by the disastrous flooding created by heavy rains and cyclones that struck the
country in late 1999 and early 2000 (USAID 2000). Similarly the slow down in growth in 2002
can be explained by the severe drought that hit the central parts of Mozambique that year
(Oxfam 2005).
The average annual inflation rate has so far been about 10.4 percent 1999-2002, exceeding the
targeted inflation rate in the PARPA for 1999-2009 of 5-7 percent. Among the factors that
contributed to the high inflation are the poor production of cereals and vegetables, products with
a heavy weight in the CPI basket, and the depreciation of the Mozambican currency, the Metical,
due to the strengthening of the south African currency, the Rand in international markets. Since
South Africa is Mozambique’s main trade partner, the influence is considerable (IMF 2004b).
10 Present value of debt is the sum of short-term external debt plus the discounted sum of total debt service payments due on public, publicly guaranteed, and private nonguaranteed long-term external debt over the life of existing loans.

24
TABLE 8 Selected Economic Indicators
1997 1998 1999 2000 2001 2002 2003
GDP millions of current US $ 3396.8 3873.8 3984.6 3684.6 3435.8 3598.6 4320.6
GDP growth (annual %)11 11.1 12.6 7.5 1.52 13.0 7.7 7.1
GDP per capita growth (annual %) 8.4 10.4 5.4 -0.7 10.6 5.6 ...
Inflation, consumer prices (annual %) 7.4 1.5 2.86 12.72 9.05 16.78 ...
Source: World Development Indicators 2004
According to the theory, debt reduction will lead to increased economic growth and an increase
in investment flows. As shown in Figure 5, this has been the case in Mozambique: foreign direct
investments have closely followed the development of economic growth.
FIGURE 5 GDP Growth and Foreign Direct Investment
0
2
4
6
8
10
12
14
1995 1996 1997 1998 1999 2000 2001 2002
Foreign direct investment, net inf low s (% of GDP) GDP grow th (annual %)
Source: World Development Indicators 2004
6.3 Expenditure on poverty alleviation A high GDP growth itself however, does not guarantee poverty alleviation, the pattern of growth
is also important. What is interesting is if the growth benefits have been channelled out to classes
with low income and to the priority areas as mentioned in the PRSP and the background papers
leading to the HIPC Initiative. The objectives of the enhanced HIPC imply that expenditures on 11 Annual percentage growth rate of GDP at market prices based on constant local currency. Aggregates are based on constant 2000 U.S. dollars.

25
poverty reducing means should increase as debt service payments go down. Figure 6 illustrates
the development in the PARPA priority sectors as percent of total expenditures. Due to
problems finding comparable data for earlier years, only the years 1999 to 2002 are shown. Since
the data for 2002 only include January to September, it is not possible to say whether the
expenditures have increased or not. However, the data still give an idea how the different sectors
have evolved. During 1999-2001 expenditure on the priority sectors have accounted for over 62
percent of total expenditure, excluding debt interest. Expenditure on education stands for the
largest change during the period, increasing from 16.1 to 23.3 percent between 1999 and 2001.
Expenditure on infrastructure has also increased as has seemed health expenditure to be doing
for 2002. Expenditure on agriculture, government and other priority sectors12 has been more or
less stable throughout the period. Expenditure on HIV/AIDS was non-existent in 1999 and
2000. That could have to do with the floods in 1999 and 2000, claiming all the resources for
primary health care.
FIGURE 6 Expenditures on Priority Areas in percent of Total Expenditure13
0
5
10
15
20
25
1999 2000 2001 2002
Education Health
HIV/AIDS Infrastructure
Agriculture and rural development Governance, security and juridical system
Other priority sectors
Source: PARPA Implementation Evaluation Report 2001
12 “Other sectors” corresponds to expenditure not imputable to sectors, such as transfers, subsidies, etc. excluding interest. 13 Excluding interest on the public debt. The data for 2002 only apply to three quarters of the whole year, meaning that the expenses probably have been larger than here indicated.

26
Between 1996 and 1997 a household survey based on the cost of basic needs, was performed in
Mozambique. The outcome of the survey, showed a poverty incidence of 69.4 percent at the
national level, indicating that poverty was more serious in the rural areas than in the urban areas.
Between 2002 and 2003 a second household survey on consumption was conducted. The
outcome of that survey showed a poverty incidence of 54.1 percent, suggesting a reduction in
national poverty incidence by 15.3 percent between the two surveys. Still poverty is more acute in
the rural areas than in the urban areas, however, poverty reductions have been higher in the rural
areas than in the urban areas. See Figure 7.
FIGURE 7 Poverty Incidence14 by Province in percent
010
2030
4050
6070
8090
100
Mozam
bique
, total
Niassa
Cabo D
elgad
o
Nampu
la
Zambe
zia Tete
Manica
Sofala
Inham
bane
Gaza
Maputo
Prov
ince
Maputo
City
1996-19972002-2003
Source: IMF 2004b
The results may be influenced by the fact that:
• Local floods in Sofala in 1996 and 1997 resulted in particularly low household incomes,
especially in agriculture, while local prices kept increasing.
• During the first household survey, 70 percent of the urban households in Sofala were
interviewed in the famine season, January and February 1997, when the prices were
higher.
14 The incidence of poverty (also called poverty rate or headcount rate) describes the percentage of the population whose per capita incomes, or expenditures spending, are below the poverty line, that is, the population that cannot afford to buy a basic basket of goods.

27
• Sofala and the entire central region, was highly affected by the civil war. Thus it is
probable that the effects of the war continued to make the living standards very low in
1996-97.
As a result, the reduction of poverty incidence in the survey from 2002-2003 seems to be very
high in the central parts of the country. It is the other way around when it comes to the provinces
Cabo Delgado, Maputo Province and Maputo City, where the poverty incidence has increased
during the period. Seeing as Maputo Province and Maputo City are dependant on imports from
South Africa, the rapid appreciation of the Rand against the Metical in 2002-2003, is one
probable cause to the increase in poverty incidence in that area (IMF 2004b).
6.3.1 Education
As argued in the theory, to fight poverty the directing of resources to social sectors as education,
health and infrastructure is essential (Sachs 2002). Education is a major factor in improving of the
quality of life for people since it provides people with the human capacity needed to reduce
poverty. One of the Millennium Development Goals is to meet the universal access to primary
education by 2015. This is also one of the most important goals within the PARPA. In Figure 8
the gross education rates for the primary education is shown. The gross education rate in EP1,
indicates the relation between the total number of students in EP1 and the population aged 6 to
10. In 2003 the gross education rate was 110.3 percent, exceeding the target in the PARPA with 6
percent. In EP2 the same rate was 36 percent, exceeding the targeted rate by 4 percent. Although
EP2 has shown a rapid growth in terms of number of students and increased about 89 percent
between 1999 and 2003, a gross education rate of 36 percent is still considered to be very low
(IMF 2004b).
FIGURE 8 School Coverage Indicators 1999-2002 in percent
0
20
40
60
80
100
120
1999 2000 2001 2002 2003
Gross education rate EP1
Gross education rate EP2
Source: IMF 2004b

28
Looking at the completion rate for pupils in primary school, there has been a positive
development between 2000 and 2002, but still the rate is very low. See Figure 9. Further on, the
completion rate for girls has continued to be lower than the total completion rate.
FIGURE 9 Primary Completion Rates in percent of Relevant Age Group
0
5
10
15
20
25
2000 2001 2002
Primary completion rate, female
Primary completion rate, total
Source: World Development Indicators 2004
6.3.1.2 Gender Equality
One of the Millennium Development Goals is to eliminate gender differences within primary and
secondary education by 2005 and for all levels of education by 2015. The PARPA corresponds to
this objective as it gives special emphasis on increasing girls’ access to education. This is being
done by distributing food kits to girl students and informing parents and adults responsible for
childrens schooling, about the importance of girls' education. Figure 10 shows that the
proportion of girls in EP1 improved from 42.7 percent in 1999 to 45.3 percent in 2003. At EP2
level, the proportion of girls remained relatively stable throughout the period, from 40.1 percent
in 1999 to 40.0 percent in 2003. Both figures were below the PARPA expectations of 46.0
percent for EP1 respectively 42.5 percent for EP2. I terms of the MDG, there is a fair chance of
achieving gender balance in EP1 by 2005. However, for EP2 the millennium goal will most likely
not be reached until later.

29
FIGURE 10 Proportion of Girls in EP1 and EP2 in percent
0
5
10
15
20
25
30
35
40
45
50
1999 2000 2001 2002 2003
Proportion girls in EP1
Proportion girls in EP2
Source: IMF 2004b
6.3.2 Health Alongside education, the health sector also has an important place in government policy. In
Table 9 some useful indicators in the living standard of the population are shown.
One of the MDGs is to reduce the mortality of children under the age of 5 by two thirds by
2015. This means that Mozambique needs to reduce the mortality rate to 82 per 1000 living
births. The mortality rate of children under 5 in 2002 was 147 of 1000 as shown in Table 9. Since
there has been a considerable reduction in mortality rate between 2000 and 2002, from 167 to
147, the MDG is possible to achieve presuming that the progress is kept (IMF 2004b).
Further, life expectancy at birth has been reduced more than 4 years from 1997 to 2002. Since the
HIV/AIDS prevalence among adults has kept on escalating over the years, it is not surprising
that the average length of life has been shortened. In the fight against HIV/AIDS the
Mozambican government has adopted programmes of action to ensure control in blood
transfusion, increase counselling and voluntary testing. What still needs to be done is to
incorporate information about HIV/AIDS related themes and sexual and reproductive health in
the basic education (IMF 2004b).

30
TABLE 9 Measures of Human Development
1996 1997 1998 1999 2000 2001 2002
Life expectancy at birth, total (years)
..
45.47
..
43.07
42.40
..
41.08
Mortality rate, under five (per 1000 live births)
..
... ..
..
167
..
147
HIV/AIDS prevalence (% of adults ages 15-49) .. .. 8.2 9.4 10.6 11.8 13.0
Source: World Development Indicators 2004 and IMF 2004b and PARPA Implementation Evaluation Report 2001
The objectives in the PARPA from 1998 was to maintain the national coverage of 98 percent
immunization of children under one against tuberculosis, to achieve 98 percent national
immunization coverage against DTP for children aged 0-23 months and to achieve 95 percent
national immunization coverage against measles for children aged 9-23 months. As shown in
Table 10, substantial progress has been made.
TABLE 10 Official Country Estimates of Population Vaccinated
(in percent)
1995 1996 1997 1998 1999 2000 2001 2002 2003
BCG15 78 83 84 99 99 99 97 99 90
DTP116 ... ... ... ... ... 99 95 97 99
MCV17 71 67 70 87 90 97 92 94 96
Source: WHO 2005
6.3.3 Sanitation and Water
Access to potable water is of vital importance for improving the living standards of the
population and for the social and economic development of a country. Three key targets set
out in the PARPA, to be achieved by 2004. These were to ensure that 50 percent of the urban
population and 40 percent of the rural population has access to water supplies and to increase
low cost sanitation coverage in urban areas to 50 percent (IMF and IDA 2000b). These targets
are in line with the millennium target to reduce the percentage of people without sustainable
access to potable water by half, until 2015. By 2003 the coverage rate of water supply in the rural
areas was 39.4 percent and 33.3 percent in the urban areas. By that the percentage of total
population with access to potable water was 38.5 percent. In relation with the situation of
15 Baccille Calmette Guérin vaccine (BCG) is vaccine against tuberculosis 16 First dose of diphtheria toxoid, tetanus toxoid and pertussis vaccine (DTP1) 17 Measles-containing vaccine (MCV)

31
coverage of basic sanitation services, 46.8 percent of the population living in rural areas had
access to adequate sanitation services in 2003 (IMF 2004b). It is thus probable that the PARPA
target of providing 40 percent of the rural population with potable water, can have been
achieved. When it comes to the other two targets it is less certain that they were reached by 2004.
7. SUMMARIZING CONCLUSION
Looking at the present value of total debt, it has decreased from year 2000 up until 2003 when it
started increasing again. How this has affected debt service payments I couldn’t say due to the
lack of data for that year. The size of debt service payments has gone down between 1997 and
2002, but depending on type of measurement, to various extents. Looking at the debt-to-GNI
and debt-to-export ratios in terms of present value, it seems Mozambique’s debt stock is now on
to the side of the debt “Laffer curve”, where increased debt has a positive effect on economic
growth. When it comes to aid, the inflow has been rather stable over time, which was a condition
for the E-HIPC initiative to be able to lead to poverty reduction. Consequently, the foreign
assistance and the reduction of debt service payments, have built a ground for potential poverty
alleviation.
Concerning the economic measures set out in the PARPA for achieving reduction in absolute
poverty, Mozambique’s average economic growth has been high despite natural disasters as
floods and droughts. The average GDP growth rate of 7.4 percent between 1999 and 2003 has so
far made it within the targeted interval while inflation, on the other hand, has not yet evolved
satisfactory. As argued in theory and in the literature, as the GDP growth has increased, foreign
direct investments have increased, which provides a positive ground for further economic
development.
The expenditures directed at priority sectors for reducing poverty have been about 62 percent of
total expenditures since 1999. There were no comparable data available for earlier years, which
was very unfortunate since it would have given an indication of the size of the expenditure before
the HIPC initiative. The indications given by the available data is that all in all, the expenditures
have not increased much. The sectors education and infrastructure have got a little more
resources over the years, while the others (health, agriculture, government etc.) have stayed more
or less the same. Expenditure on HIV/AIDS were initially non-existent and then seemingly low.
Looking at the growth rate of the HIV/AIDS prevalence among adults, it is clear that is has not
slowed down indicating that the government spending on this sector is far from sufficient.

32
The key objective set out in the PARPA, was to reduce absolute poverty by 15 percent by 2004.
Judging from the two household surveys performed in 1997-97 and 2002-03, measuring the
poverty incidence in different the provinces of the country, it seems that the goal had already
been achieved in 2003. This is a very positive and important base for achieving the goal of a 30
percent reduction of poverty by 2009.
Trends in education outcomes have been mixed. The targeted gross education rate in the PARPA
for 2003 has been met in both EP1 and EP2. However a gross education rate of 36 percent in
EP2 is not satisfactory. Despite a positive development of the the completion rate for pupils in
primary school, the rate in general is still very low and even lower for girls. The aim of the
government to promote girls access to education has not yet been reached. There has been a
slight increase in the proportion of girls in EP1 and no progress at all for EP2, but both figures
were below the PARPA expectations.
The performance in the health sector has been mostly negative due to the HIV/AIDS endemic.
The growth in HIV/AIDS prevalence has increased rapidly over the last years. 13 percent of all
adults aged 15 -49 were infected in 2002. The high prevalence rate is probably the main reason
that the life expectancy has decreased more than 5 years between 1997 and 2002. A positive
development is indicated by the very sparse data for the mortality rate for children under five.
Furthermore the vaccination rates targeted in the PARPA for tuberculosis, measles and DTP
have all been fulfilled and by the look of it can be maintained as well.
When it comes to the water and sanitation sector, the PARPA had set out different targets for
the rural and urban sectors. By 2003 the part of the population living in urban areas with access
to potable water summed up to 33.3 percent, probably too low to achieve the target of 50 percent
by 2004. The related number for the rural areas was 39.4 percent, which was close to the target of
40 percent. For sanitation, the target was that 50 percent of the urban population would have
access by 2004. In 2003 the access rate was 46.8 percent.
To sum up, the evidence presented in this paper indicates that the expenditures on priority
sectors for poverty alleviation have not increased much over the years, indicating that the
authorities have not provided the best circumstances for achieving the objectives set in the
PARPA. However, the incidence of poverty has been reduced in accordance with the mid-term
target of the PARPA. Furthermore the development concerning poverty reduction has gone in

33
the right direction for several of the sectors examined, which gives the country a fair chance to
fulfil some of the MDGs by 2015. Still there is a lot to be done in Mozambique, concerning
education, gender equity and especially health and HIV/AIDS.
It is evident that the debt burden has been relieved, at least for some years, thanks to the HIPC
initiative. Whether the poverty alleviating progress made in Mozambique is all due to the
enhanced HIPC initiative is less evident. There is of course a possibility that Mozambique would
have used the resources freed up through the debt relief to reduce poverty without the pressure
from the IFIs. Still, what is important is that a poverty reduction strategy has been written and
efforts have been made to go through with it. My personal view is that stressing the importance
of poverty reduction, is a step in the right direction, both for the IFIs and for the countries in
question.
It has not been many years since Mozambique started to benefit under the HIPC initiative, which
has made it difficult to collect data for the most recent years. Hence more certain conclusions will
be possible to draw in a few years. There are also some objectives in the PARPA that I have not
investigated, which of course would be interesting to examine and that could give another
perspective to the big picture of the poverty situation in Mozambique

34
8. REFERENCES
Afrikagrupperna (2005) http://www.afrikagrupperna.se/fakta/mocambique/mockarta.htm (2005-05-02)
Bhattacharya, Rina and Benedict Clements (2004). Calculating the Benefits of Debt Relief. Finance &
Development December 2004, v. 41, no. 4, pp. 48 – 50.
CIA World Fact Book http://www.cia.gov/cia/publications/factbook/geos/mz.html#Intro
(2005-05-05)
Danielsson, Anders and Godwin Mjema (2002). Country Economic Report. Tanzania 2001: New
strategies for Poverty Reduction and Debt Relief. Sida.
http://www.sida.se/Sida/jsp/polopoly.jsp?d=1250&a=28392 (2005-04-28)
ECA, Economic Commission for Africa (2003) Mozambique: The elusive quest for pro-poor growth.
http://www.uneca.org/era2003/chap4.pdf (2005-05-15)
Elagöz, Fatma and Fatma Güven Lisaniler (2004) “Issues in International Borrowing and
Management of External Debt“ in Ghosh, B.N. Contemporary Issues in Macroeconomic Management.
Wisdom House Publications Ltd, Leeds, England.
Elbadawi, Ibrahim A., Benno J. Ndulu and Njuguna Ndung’u (1997) “Debt Overhang and
Economic Growth in Sub-Saharan Africa” in Iqbal, Zubair and Ravi Kanbur. External finance for
low-income countries, International Monetary Fund, Washington, D.C., USA.
Gautam, Madhur (2003). Debt Relief for the Poorest. An OED Review of the HIPC Initiative.
The World Bank, Washington D.C.
Gupta, S., B. Clements, M. T. Guin-sui and L. Leruth. (2001). Debt Relief and Public Spending in
Heavily Indebted Poor Countries. Finance & Development September 2001, v. 38, no. 3, pp. 10 – 13.
Human Development Report (2005) http://hdr.undp.org (2005-04-19)

35
IMF (1999) Enhanced HIPC-initiative.
http://www.imf.org/external/pubs/ft/pam/pam51/contents.htm#initial.tab1 (2005-04-14)
IMF and IDA (2000a) Decision Point Document for the Enhanced Heavily Indebted Poor Countries (HIPC)
Initiative http://www.imf.org/external/np/hipc/2000/moz.pdf (2005-05-02)
IMF and IDA (2000b) Assessment of the Interim Poverty Reduction Strategy Paper
http://www.imf.org/external/NP/prsp/2000/moz/01/INDEX.HTM (2005-04-14)
IMF (2004a) A fact sheet – September 2004. Debt relief under the Highly Indebted Poor Countries
(HIPC) Initiative http://www.imf.org/external/np/exr/facts/hipc.htm (2005-04-14)
IMF (2004b) Republic of Mozambique: Poverty Reduction Strategy Paper Progress Report (Review of the
Economic and Social Plan for 2003) http://www.imf.org/external/pubs/ft/scr/2004/cr04135.pdf
(2005-04-12)
Omole, D.A. (2004), in Mulinge, Munyae and Pempelani Mufane. Debt Relief Initiatives and Poverty
Alleviation. Lessons from Africa. Africa Institute of South Africa, Pretoria.
Oxfam Community Aid Abroad (2005) http://www.oxfam.org.au/world/africa/mozambique/
(2005-05-23)
Pattillo, C., H. Poirson and L. Ricci. (2002). External Debt and Growth. Finance & Development
June 2002, v. 39, no. 2, pp. 32-35.
PRSP Implementation Evaluation Report 2001
http://poverty2.forumone.com/files/Mozambique_PRSP_APR.pdf (2005-05-17)
Sachs, Jeffrey D (2002). Resolving the Debt Crisis of Low-Income Countries. Brooking Papers of
Economic Activity 2002, v. 0, iss. 1, pp. 257-86.

36
UNAIDS Mozambique Epidemiological Fact Sheets on HIV/AIDS and sexually transmitted infections
www.unaids.org (2005-04-27)
USAID Mozambique 1999-2000 Floods Impact Evaluation: Resettlement Grant Activity
http://www.sarpn.org.za/documents/d0000811/P907-Mozambique_floods_1999-
2000_USAID_072002.pdf (2005-05-11)
UNDP (2005) www.undp.se/mdg (2005-05-16)
World Bank Africa Database 2003 CD-ROM
World Bank (2004): 2004 World Development Indicators CD-ROM
http://devdata.worldbank.org/data-query/ (2005-04-28)
World Bank (2005) Heavily Indebted Poor Countries
http://web.worldbank.org/WBSITE/EXTERNAL/TOPICS/EXTDEBTDEPT/0,,contentMD
K:20260049~menuPK:528655~pagePK:64166689~piPK:64166646~theSitePK:469043,00.html
(2005-04-24)
WHO (2005)
http://www.who.int/vaccines/globalsummary/immunization/countryprofileresult.cfm?C='moz
(2005-04-22)

37
APPENDIX 1
Mozambique Source: Afrikagrupperna
APPENDIX 2
Factsheet
Land Area 784,090 sq km
Coastline 2,470 km
Population 19,403,703
Religion Indigenous beliefs 50%, Christian 30%, Muslim 20%
Languages Indigenous languages and Portuguese (official)
Government Type Republic
Main Exports aluminum, prawns, cashews, cotton, sugar, citrus, timber and bulk
electricity
Main Imports machinery and equipment, vehicles, fuel, chemicals, metal products,
foodstuffs and textiles
Source: CIA World Factbook

38
APPENDIX 3
External Public and Publicly-Guaranteed Debt in terms of NPV, end-December 1998
(in millions of US dollars)
O-HIPC E-HIPC
Multilateral Creditors 395 300
IDA 237 184
African Development Bank 83 64
IMF 43 27
Other18 32 25
Bilateral Creditors 647 487
Paris Club19 511 385
Non-Paris Club20 112 84
Commercial Creditors21 24 18
Source: IMF andc IDA 2000a
APPENDIX 4
By 2015, the UN Millennium Goals aim to: 1. Eradicate poverty and food insecurity
2. Attain universal primary education
3. Promote gender equality
4. Reduce infant mortality
5. Improve maternal health
6. Fight HIV/AIDS, malaria and other diseases
7. Guarantee environmental sustainability
8. Develop a global partnership for development
(UNDP 2005)
18 Other include EU, IFAD, BADEA, OPEC Fund and Nordic Development Fund. 19 Main creditors are France, Russia, Italy and Portugal. 20 Main creditor is Algeria. 21 Main creditor is Brazil.