the hidden disparity: lung infections in indigenous american children aug 25, 2015 webinar rosalyn...
TRANSCRIPT
The Hidden Disparity: Lung Infections in Indigenous American Children
Aug 25, 2015 WebinarRosalyn Singleton MD, MPH
Alaska Native Tribal Health Consortium
Learning Objectives:
1. Recognize higher morbidity for respiratory infections and chronic lung disease among American Indian / Alaska Native (AI/AN) children
2. Recognize modifiable risk factors for lower respiratory tract infections in AI/AN children
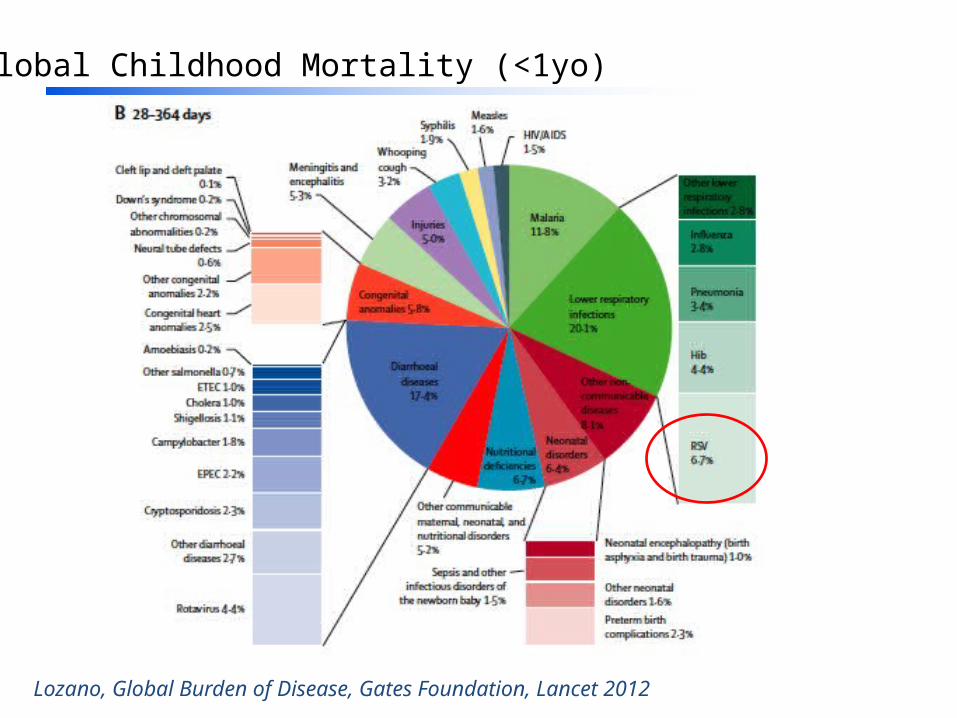
Global Childhood Mortality (<1yo)
Lozano, Global Burden of Disease, Gates Foundation, Lancet 2012
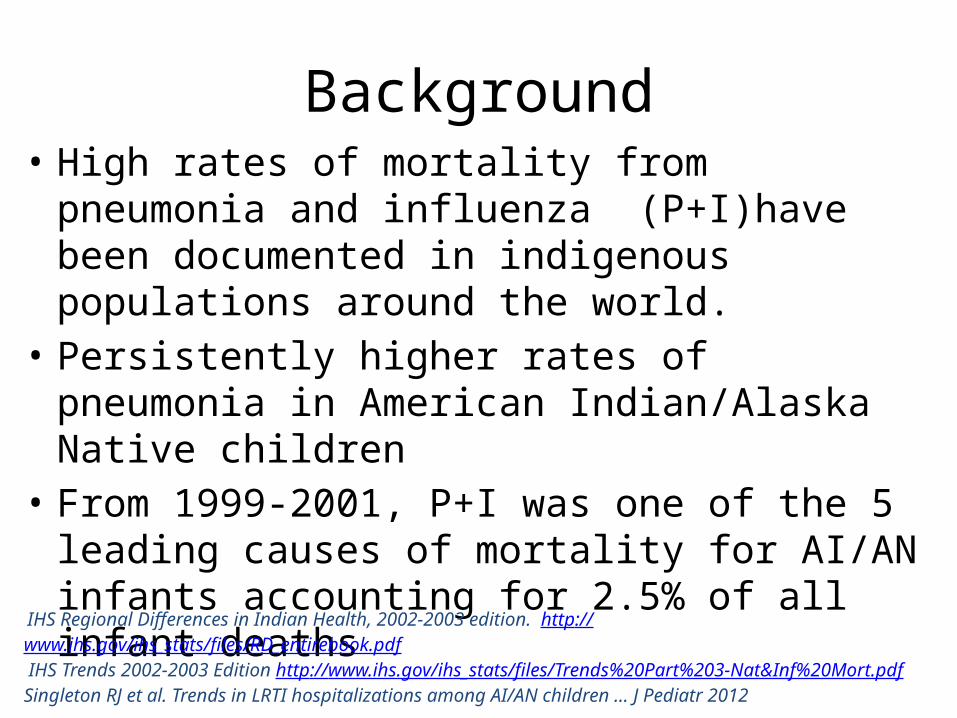
Background• High rates of mortality from pneumonia and
influenza (P+I)have been documented in indigenous populations around the world.
• Persistently higher rates of pneumonia in American Indian/Alaska Native children
• From 1999-2001, P+I was one of the 5 leading causes of mortality for AI/AN infants accounting for 2.5% of all infant deaths
IHS Regional Differences in Indian Health, 2002-2003 edition. http://www.ihs.gov/ihs_stats/files/RD_entirebook.pdf IHS Trends 2002-2003 Edition http://www.ihs.gov/ihs_stats/files/Trends%20Part%203-Nat&Inf%20Mort.pdfSingleton RJ et al. Trends in LRTI hospitalizations among AI/AN children ... J Pediatr 2012
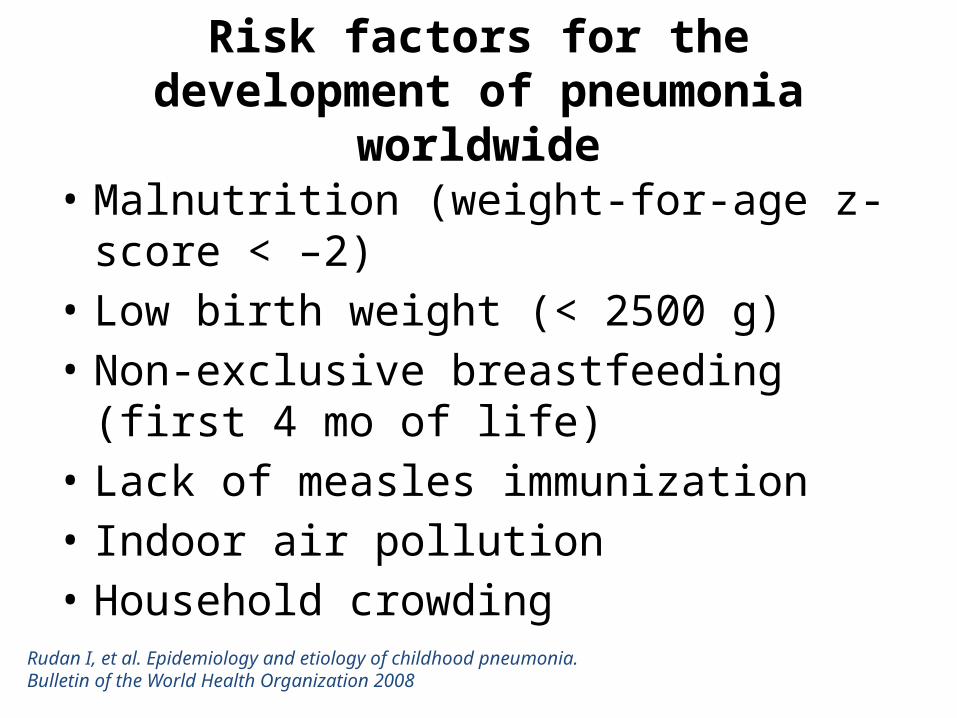
Risk factors for the development of pneumonia worldwide
• Malnutrition (weight-for-age z-score < –2)• Low birth weight (< 2500 g)• Non-exclusive breastfeeding (first 4 mo of life)• Lack of measles immunization• Indoor air pollution• Household crowding
Rudan I, et al. Epidemiology and etiology of childhood pneumonia. Bulletin of the World Health Organization 2008

AI/AN Demographics
AI/AN US average
Median Income 35000 50000
Poverty 28% 15%
Completed High School 77% 86%
Completed College 13% 28%Crowding
(>1 person per room) 19% 6%
No safe water or sanitation 12% 0.6%
US Census data from 2000 and 2010
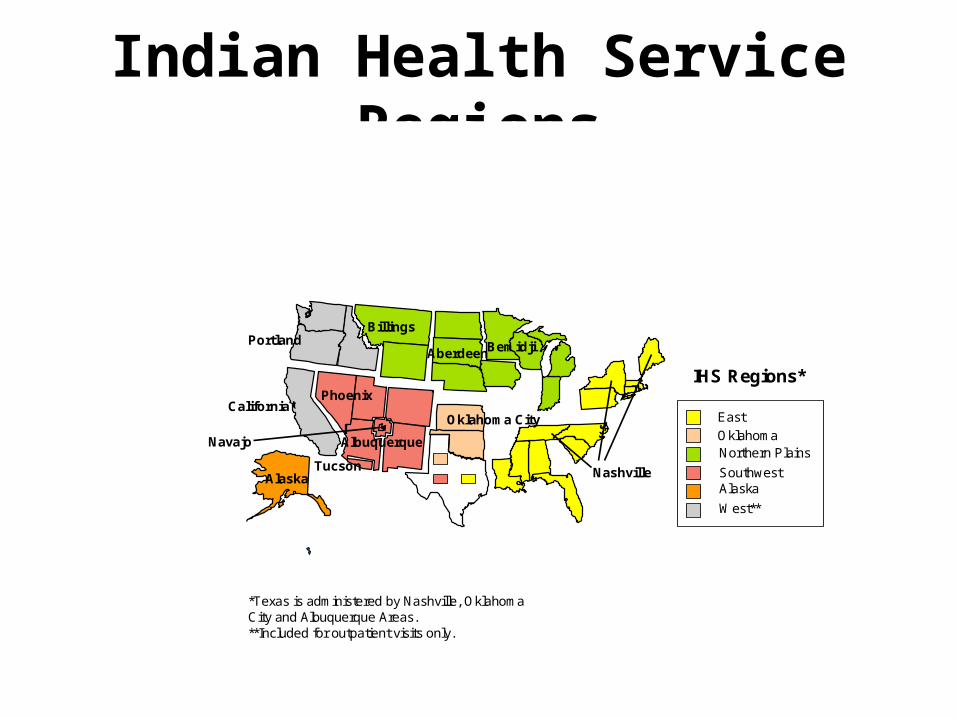
Indian Health Service Regions
*Texas is administered by Nashville, Oklahoma City and Albuquerque Areas.**Included for outpatient visits only.
MA
East
OklahomaNorthern Plains
SouthwestAlaska
West**
IHS Regions*
California
Alaska
Oklahoma City
Phoenix
Navajo
Tucson
Albuquerque
PortlandBillings
AberdeenBemidji
Nashville
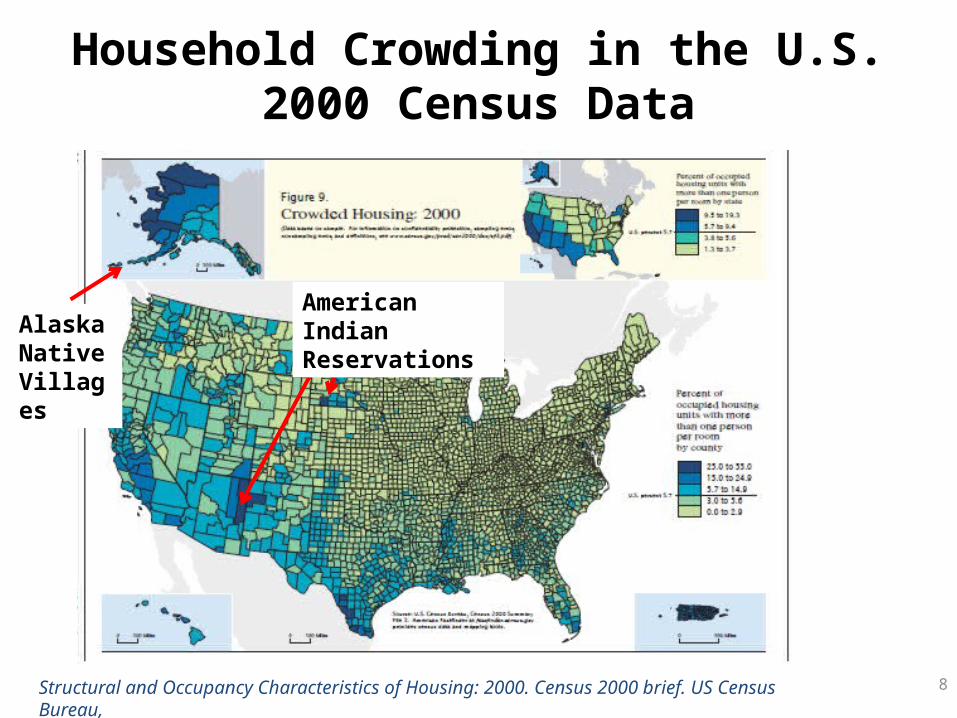
Household Crowding in the U.S.2000 Census Data
8Structural and Occupancy Characteristics of Housing: 2000. Census 2000 brief. US Census Bureau,
Alaska Native Villages
American Indian Reservations

Tobacco smoke exposure in AI/AN children
• 21% AI/AN prenatal exposure vs. 9-17% for general US population
• 75% AI/AN children exposed to passive tobacco smoke vs. 40% for general US population
• 21-38% of AI/AN youth smoke tobacco vs. 23% for general US youth
Redding GJ et al. Chronic respiratory symptoms .. among indigenous children. Pediatric Clinics of North America 2009.MMWR September 2010

Indoor Air Pollution and AI/AN Children
• High rates of indoor smoke exposure due to wood burning stoves
• Any wood burning stove in the home increased odds of childhood LRTI by 4.9 times in Navajo children
• Household particulate matter concentration >65 μg/m3 resulted in an increase of odds of childhood LRTI by 7 times in Navajo children
Robin LF et al. Wood-burning stoves and lower respiratory illness in Navajo children. Pediatr Infect Dis J 1996.Morris K, et al. Wood-burning stoves and LRTI in American Indian children. Am J Dis Child 1990.
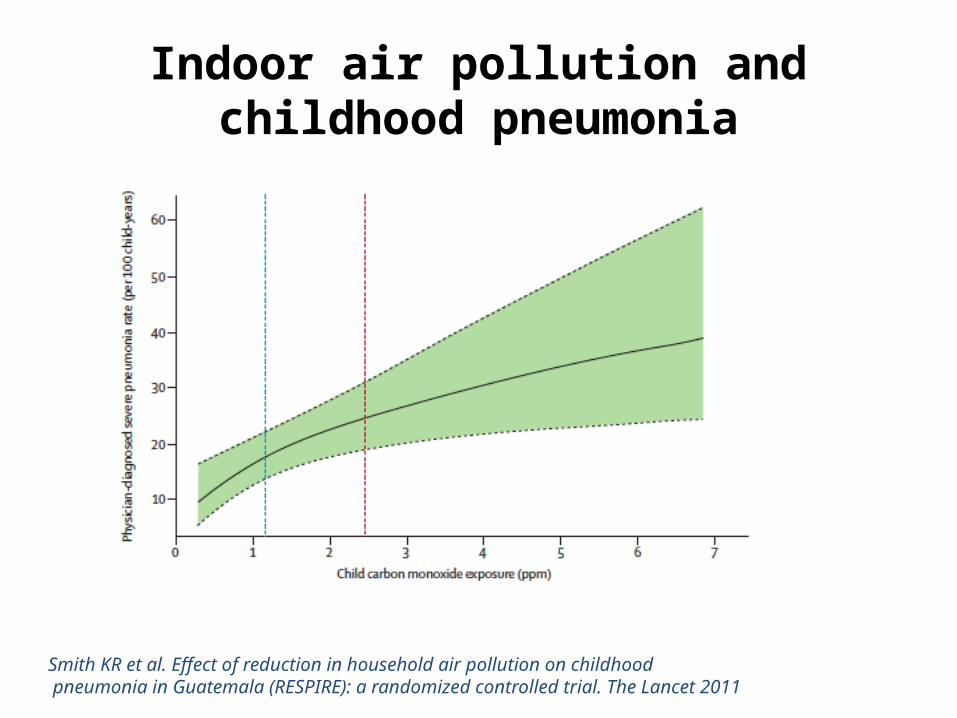
Indoor air pollution and childhood pneumonia
Smith KR et al. Effect of reduction in household air pollution on childhood pneumonia in Guatemala (RESPIRE): a randomized controlled trial. The Lancet 2011

Rural Alaska Household Characteristics
• Household crowding• 20% have no piped water• Many use outhouses or “honeybuckets” for sanitation• High rates of tobacco smoke exposure• Many use wood burning stoves• Poor ventilation
Hennessy TW et al. The relationship between in-home water service and the risk of respiratory tract, skin, and gastrointestinal tract infections among rural Alaska Natives. AJPH 2008.

Risk Factors for LRTI and RSV Hospitalizations, Rural Alaska
• Medically high-risk status (<35 weeks gestation, congenital heart disease, or chronic lung disease)
• Absence of breastfeeding• Household crowding• <2 rooms with sinks • No piped water• Woodstove in the house• Vomiting after feeding
Bulkow LR et al. Risk Factors for Hospitalization With LRTIs in Children in Rural Alaska. Pediatrics 2012Bulkow LR et al. Risk factors for severe RSV infection among Alaska native children. Pediatrics 2002
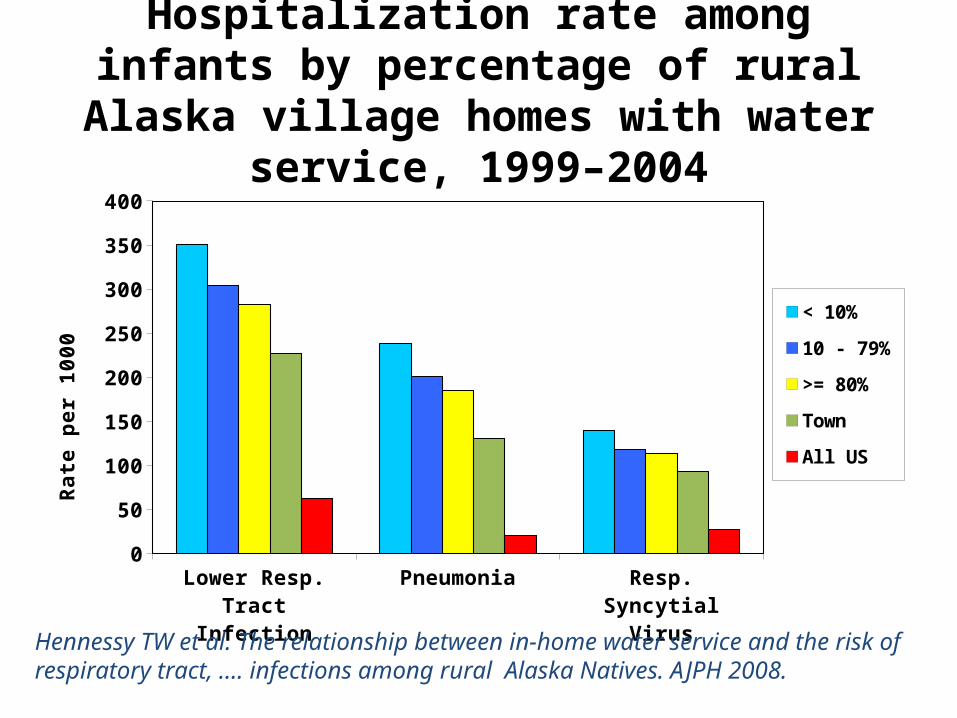
Hospitalization rate among infants by percentage of rural Alaska village homes with
water service, 1999–2004
Lower Resp. Tract Infection
Pneumonia Resp. Syncytial Virus
0
50
100
150
200
250
300
350
400
< 10%
10 - 79%
>= 80%
Town
All USRa
te p
er
10
00
Hennessy TW et al. The relationship between in-home water service and the risk of respiratory tract, …. infections among rural Alaska Natives. AJPH 2008.
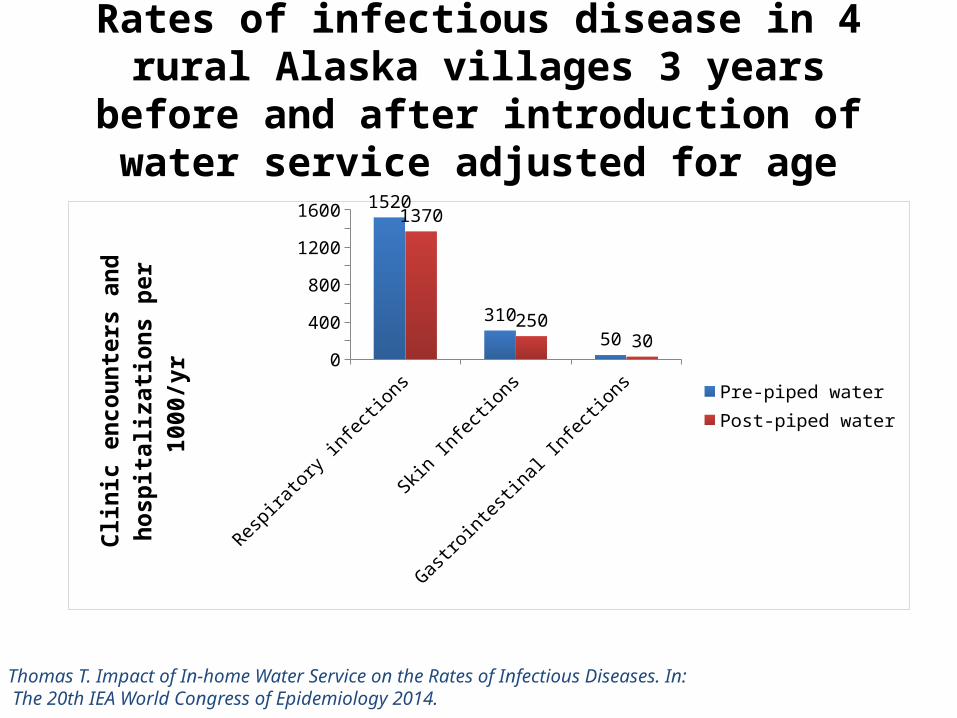
Rates of infectious disease in 4 rural Alaska villages 3 years before and after introduction of water
service adjusted for age
Respira
tory infecti
ons
Skin Infecti
ons
Gastrointesti
nal Infecti
ons0
200
400
600
800
1000
1200
1400
1600 1520
310
50
1370
250
30
Pre-piped waterPost-piped water
Clin
ic e
ncou
nter
s an
d ho
spita
l-iz
ation
s pe
r 100
0/yr
Thomas T. Impact of In-home Water Service on the Rates of Infectious Diseases. In: The 20th IEA World Congress of Epidemiology 2014.
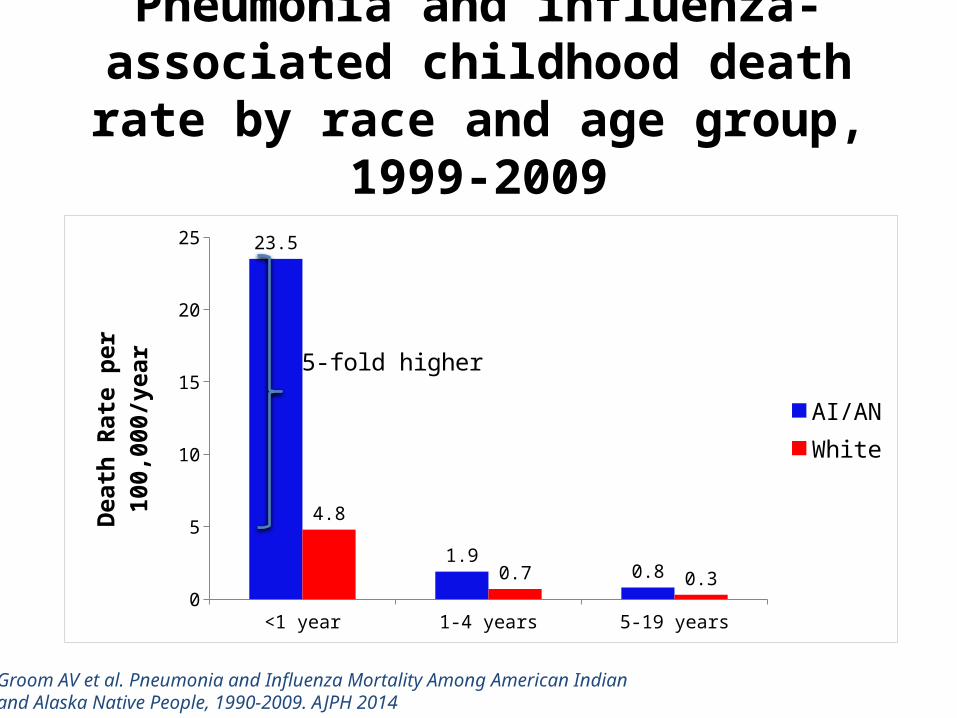
Pneumonia and influenza-associated childhood death rate by race and age
group, 1999-2009
<1 year 1-4 years 5-19 years0
5
10
15
20
25 23.5
1.90.8
4.8
0.7 0.3
AI/ANWhite
Dea
th R
ate
per 1
00,0
00/y
ear
5-fold higher
Groom AV et al. Pneumonia and Influenza Mortality Among American Indian and Alaska Native People, 1990-2009. AJPH 2014

Influenza-associated hospitalizations in infants <1 year of age from April 2008-
March 2011
US AI/AN AN0
5
10
15
20
25
30
35
40
45
1.5
9.8
38.9Apr08-Mar09
APR09-MAR10
APR10-MAR11
Influ
enza
-ass
ocia
ted
Hos
pita
liza-
tions
/100
0 pe
r yea
r
Unpublished data from KIDS and NIPRS datasets, Arctic Investigations Program- CDC, Indian Health Service

Influenza Hospitalizations AI/AN and comparison US population
Indian Health Service hospital discharge data (2001–2011) for AI/AN people and 13 State Inpatient Databases for the general U.S. population.
Gounder PP et al. Influenza hospitalizations among AI/AN .OpenForumID 2014
All ages Infants0
200
400
600
800
1000
1200
98
1070
58
210
AI/ANU.S. population
Hos
pita
lizati
ons/
1000
00

Annual influenza-associated hospitalization rate, AI/AN and US child population <5 years, 1998-2011
1998 1999 2000 2001 2002 2003 2004 2005 2006 2007 2008 2009 2010 20110
2
4
6
8
10
12
AI/AN < 1 Year AI/AN 1-4 Years US < 1 Year US 1-4 Years
Year of Discharge
Influ
enza
-ass
ocia
ted
Hosp
italiz
ation
s(p
er 1
000)
2009 H1N1 pandemic
Foote E, et al. Unpublished data from IHS and Nationwide Inpatient Survey
20
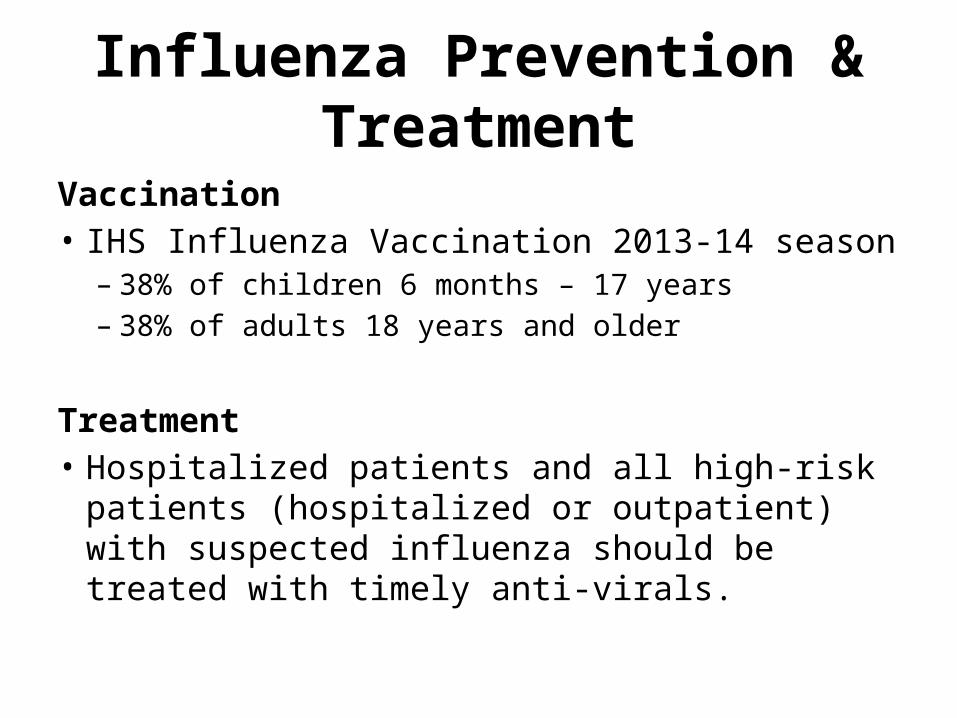
Influenza Prevention & Treatment
Vaccination• IHS Influenza Vaccination 2013-14 season
– 38% of children 6 months – 17 years – 38% of adults 18 years and older
Treatment• Hospitalized patients and all high-risk patients
(hospitalized or outpatient) with suspected influenza should be treated with timely anti-virals.
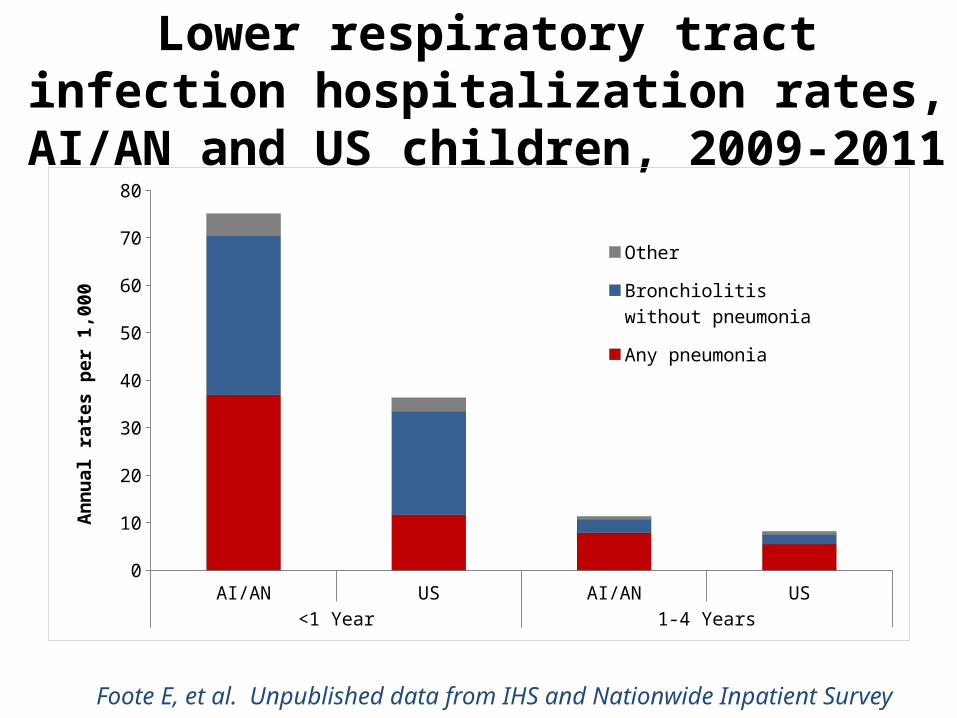
Lower respiratory tract infection hospitalization rates, AI/AN and US children,
2009-2011
AI/AN US AI/AN US<1 Year 1-4 Years
0
10
20
30
40
50
60
70
80
Other
Bronchiolitis without pneumonia
Any pneumonia
Ann
ual r
ates
per
1,0
00
Foote E, et al. Unpublished data from IHS and Nationwide Inpatient Survey
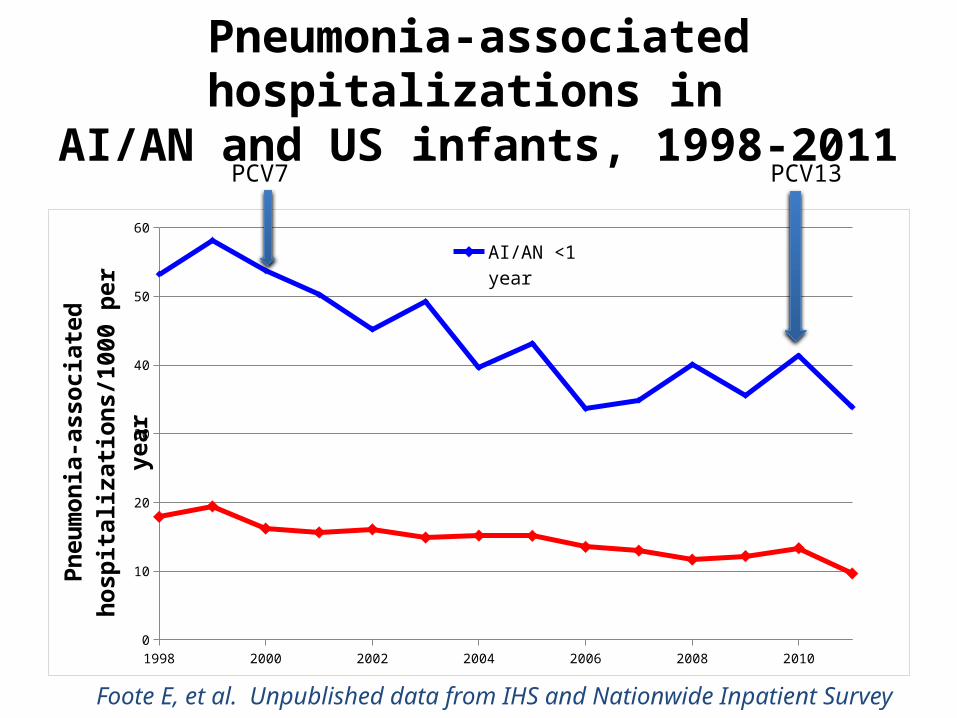
Pneumonia-associated hospitalizations in AI/AN and US infants, 1998-2011
1998 2000 2002 2004 2006 2008 20100
10
20
30
40
50
60
AI/AN <1 year
US <1 year
Pneu
mon
ia-a
ssoc
iate
d ho
spita
liza-
tions
/100
0 pe
r yea
r
PCV7 PCV13
Foote E, et al. Unpublished data from IHS and Nationwide Inpatient Survey

Pneumonia-associated hospitalization rate in AI/AN and general US infants,
1998-99 to 2009-11
1998-1999 2009-2011 1998-1999 2009-2011AI/AN US
0.0
10.0
20.0
30.0
40.0
50.0
60.0 55.7
36.9
18.7
11.7
Infa
nt p
neum
onia
-ass
ocia
ted
hosp
italiz
ation
s pe
r 100
0/ye
ar
34% decline
37% decline
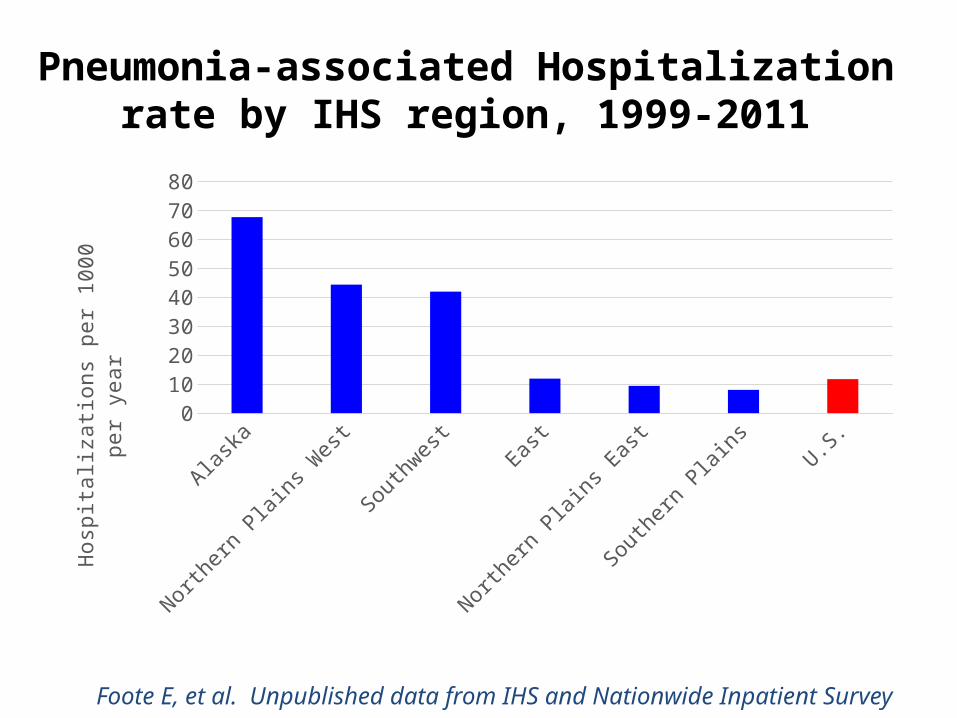
Pneumonia-associated Hospitalization rate by IHS region, 1999-2011
Alaska Northern Plains West
Southwest East Northern Plains East
Southern Plains
U.S.0
10
20
30
40
50
60
70
80
Hosp
italiz
ation
s per
100
0 pe
r yea
r
Foote E, et al. Unpublished data from IHS and Nationwide Inpatient Survey
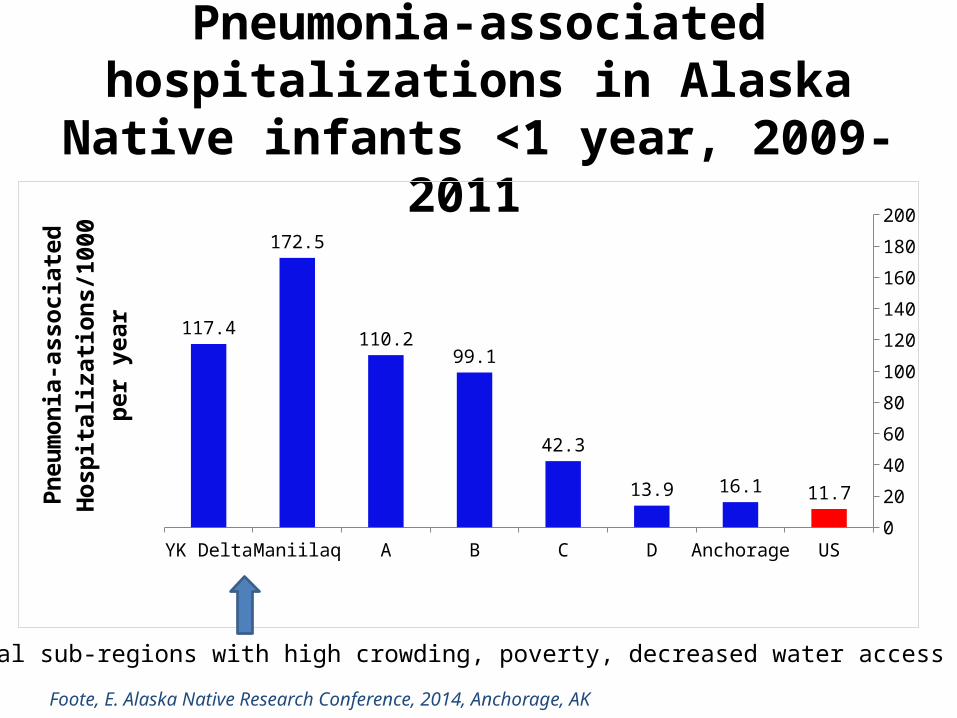
Pneumonia-associated hospitalizations in Alaska Native infants <1 year, 2009-2011
YK Delta Maniilaq A B C D Anchorage US0
20
40
60
80
100
120
140
160
180
200
117.4
172.5
110.299.1
42.3
13.9 16.1 11.7
Pneu
mon
ia-a
ssoc
iate
d H
ospi
tal-
izati
ons/
1000
per
yea
r
Two rural sub-regions with high crowding, poverty, decreased water access
Foote, E. Alaska Native Research Conference, 2014, Anchorage, AK

Invasive Pneumococcal Disease (IPD) in AI/AN and general US Children less than 2 years prior to PCV7 introduction
AN White Mountain Apache
Navajo US0
200
400
600
800
1000
1200
1400
1600
1800
2000
403
1820
537
167
Rate
per
100
,000
AN = Alaska Native
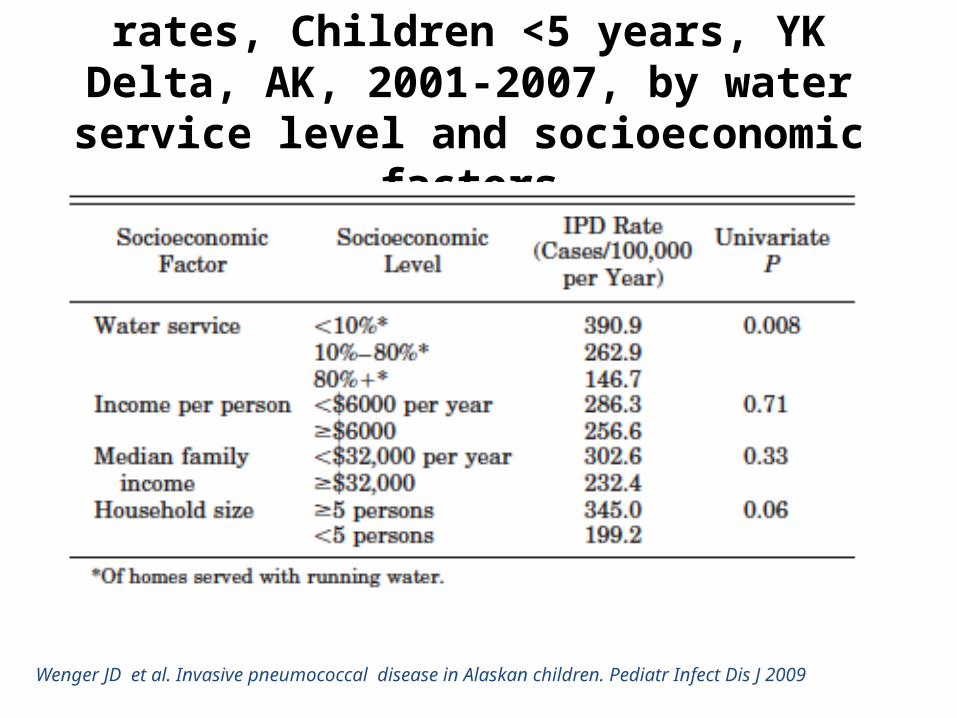
Invasive Pneumococcal Disease rates, Children <5 years, YK Delta, AK, 2001-2007, by water
service level and socioeconomic factors
Wenger JD et al. Invasive pneumococcal disease in Alaskan children. Pediatr Infect Dis J 2009
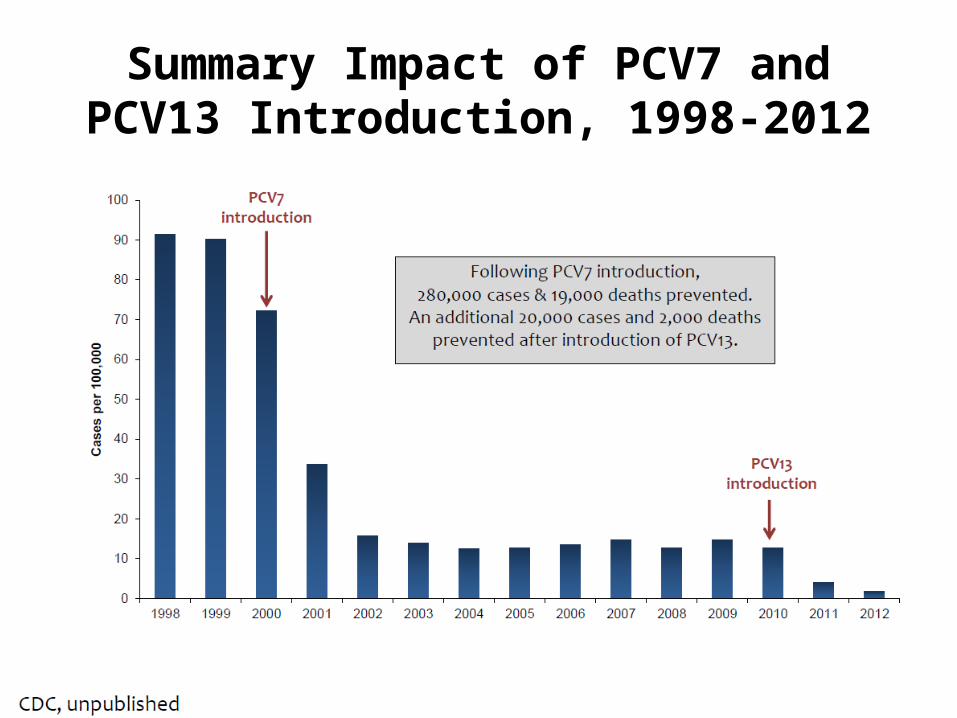
Summary Impact of PCV7 and PCV13 Introduction, 1998-2012
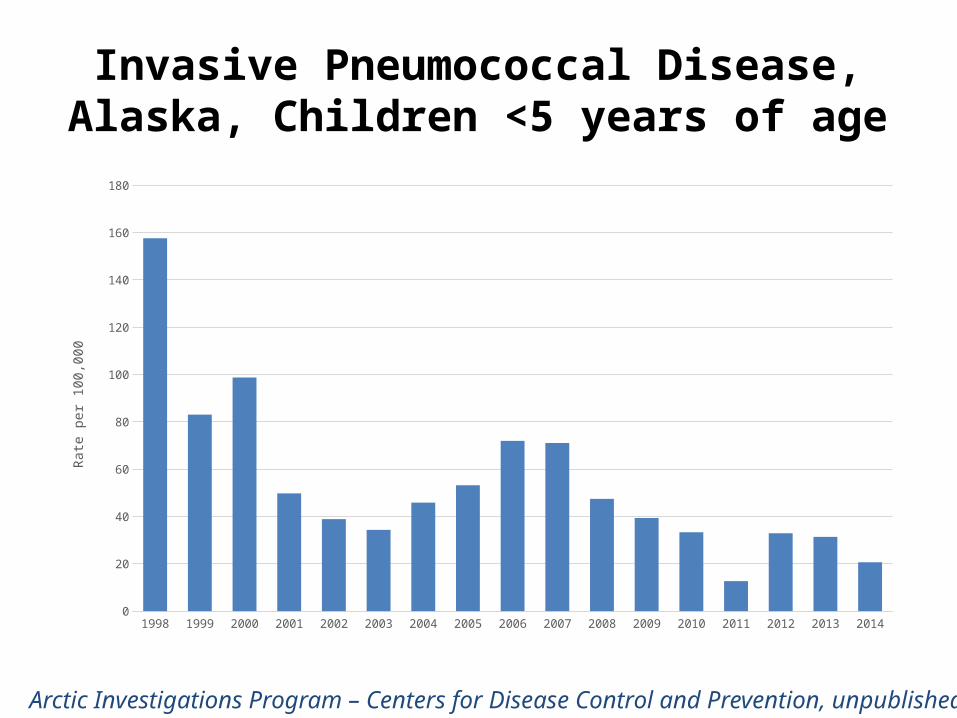
Invasive Pneumococcal Disease,Alaska, Children <5 years of age
1998 1999 2000 2001 2002 2003 2004 2005 2006 2007 2008 2009 2010 2011 2012 2013 20140
20
40
60
80
100
120
140
160
180
Rate
per
100
,000
Arctic Investigations Program – Centers for Disease Control and Prevention, unpublished

IPD Rates Pre- and Post PCV13 Introduction Children < 5 Years of Age, Alaska
Alaska Native, PCV13 Alaska Native, Non-PCV13 Non-Native, PCV13 Non-Native, Non-PCV130
10
20
30
40
50
60
70
80
90
100
Pre (2005-2008)
Post (4/2010-2014)
Rate
per
100
,000
* P<0.05Number of Cases shown at top of bars
Arctic Investigations Program – Centers for Disease Control and Prevention, unpublished

RSV
RSV hospitalization rates around the globe RSV hospitalization rates in AI/AN and Alaska Native
children Risk factors for RSV hospitalization Changes in RSV hospitalization rates over time
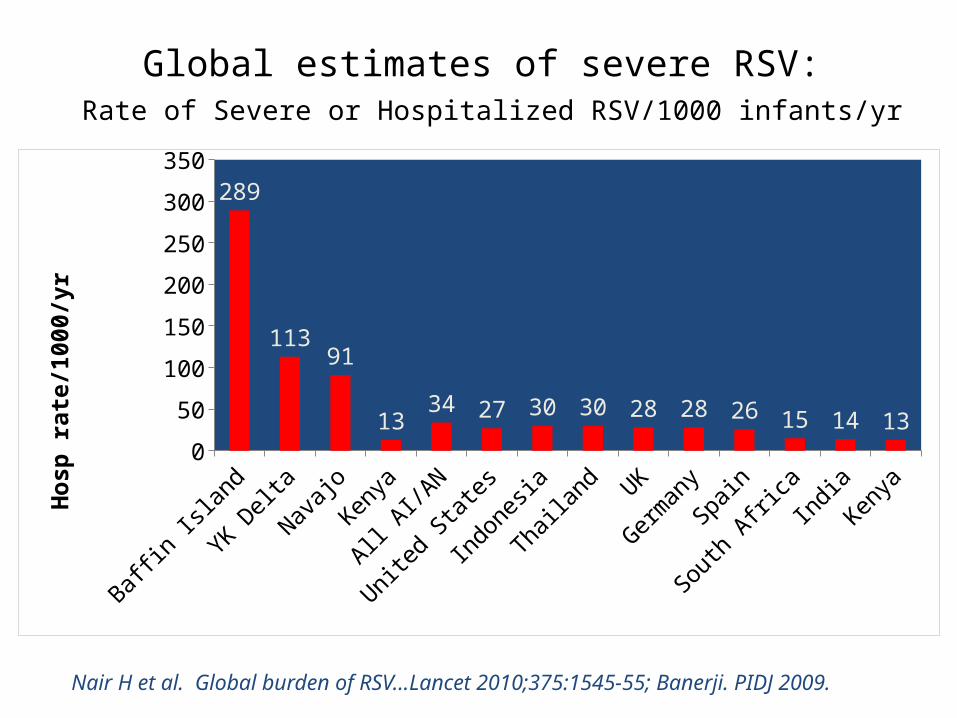
Global estimates of severe RSV: Rate of Severe or Hospitalized RSV/1000 infants/yr
Baffin Isl
and
YK Delta
Navajo
Kenya
All AI/A
N
United St
ates
Indonesia
Thailan
d UK
German
ySp
ain
South
Africa
IndiaKenya
0
50
100
150
200
250
300
350
289
11391
1334 27 30 30 28 28 26 15 14 13H
osp
rat
e/10
00/y
r
Nair H et al. Global burden of RSV…Lancet 2010;375:1545-55; Banerji. PIDJ 2009.
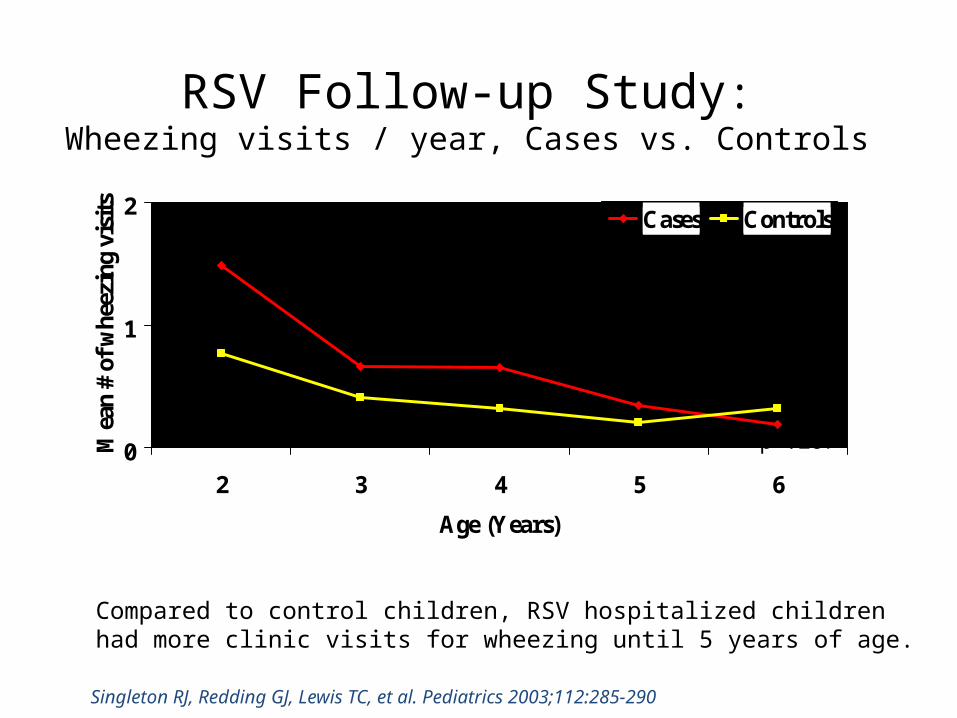
RSV Follow-up Study:Wheezing visits / year, Cases vs. Controls
0
1
2
2 3 4 5 6
Age (Years)
Mea
n #
of w
heez
ing
visi
ts
Cases Controls
p<.004
p=.07p=.024
p=.140 p=.287
Compared to control children, RSV hospitalized children had more clinic visits for wheezing until 5 years of age.
Singleton RJ, Redding GJ, Lewis TC, et al. Pediatrics 2003;112:285-290

RSV Hospitalization Rates in the YK Delta, Alaska
285
223177
65
RSV hospitalization rates fell by 3-fold, despite stable overall ARI rates

Village-level factors associated with LRTI and RSV rates in children <1 year of age in YK Delta villages during 1995-2005 and 2005-2012
LRTI Multivariate RR P-value Time Period (2005-2012 vs. 1995-2005) 0.88 [0.81, 0.95] 0.001
Large Community (>500 persons) 1.18 [1.09, 1.28] <0.0001
% of Families Below Poverty Line 1.15 [1.05, 1.26] 0.003
% of Households > 1.5 persons/room 1.20 [1.13, 1.28] <0.0001
Lack Plumbing 1.25 [1.05, 1.26] <0.0001
36Bruden et al, 18 years of RSV Surveillance. Ped Infect Dis J, 2015, In press.
RSV Multivariate RR P-value Time Period (2005-2012 vs. 1995-2005) 0.51 [0.45, 0.59] <0.0001
Large Community (>500 persons) 1.14 [1.01, 1.30] 0.04
% of Families Below Poverty Line 1.25 [1.08, 1.45] 0.003
% of Households > 1.5 persons/room 1.17 [1.07, 1.28] 0.0005
Lack Plumbing 1.45 [1.19, 1.78] 0.0003

RSV Rate and Household Crowding(< 1 Year Olds)
37
1995-2005 2005-20120
20
40
60
80
100
120
140
160
180
200
More Crowded CommunitiesLess Crowded Communities
Time Period
Hos
pita
lizati
on R
ate/
1000
Bir
ths
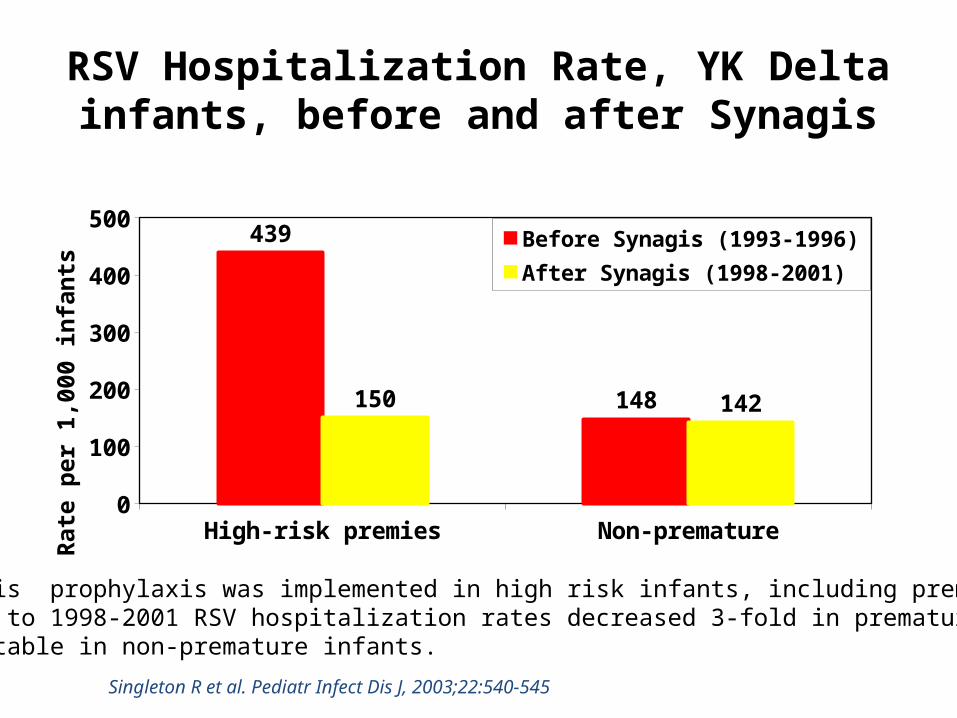
RSV Hospitalization Rate, YK Delta infants, before and after Synagis
High-risk premies Non-premature0
50100150200250300350400450500
439
148150 142
Before Synagis (1993-1996)
After Synagis (1998-2001)
Rat
e pe
r 1,
000
infa
nts
Singleton R et al. Pediatr Infect Dis J, 2003;22:540-545
In 1997, Synagis prophylaxis was implemented in high risk infants, including premature infants.From 1993-1996 to 1998-2001 RSV hospitalization rates decreased 3-fold in premature infants ,But remained stable in non-premature infants.
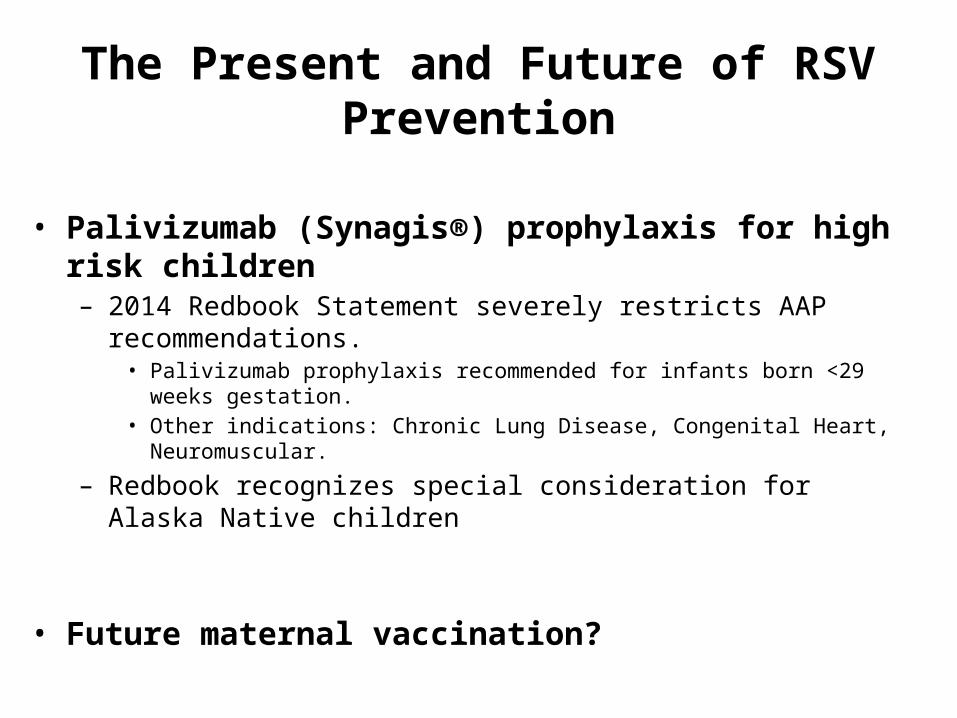
The Present and Future of RSV Prevention
• Palivizumab (Synagis®) prophylaxis for high risk children– 2014 Redbook Statement severely restricts AAP recommendations.
• Palivizumab prophylaxis recommended for infants born <29 weeks gestation.• Other indications: Chronic Lung Disease, Congenital Heart, Neuromuscular.
– Redbook recognizes special consideration for Alaska Native children
• Future maternal vaccination?

Conclusions
• Rates of RSV hospitalization in Alaska’s YK Delta have declined but remain > 3-fold higher than the US national average.
• Average length of RSV season has decreased by > 4 months and season onset is most recently not until January.
• We did not find that colder winters were associated with more severe seasons.
• Household factors, especially crowding, are associated with higher RSV and LRTI hospitalization rates.

We are not Alone….
Respiratory Infections in Indigenous children from Canada, Australia,
New ZealandGina Rempel, MD and Kent Saylor MD, CanadaAnne Chang MD and Kerry O’Grady, Australia ;
Elizabeth Edwards and Cass Byrnes, New Zealand.

Indigenous Canadians: Housing
• 67% people report their houses are in need of repair
• 18% have no phone• 3.5% have no flush toilets• 3.7% have no hot running water• 118 First Nations communities in Canada need
to boil their water
http://www.hc-sc.gc.ca/fniah-spnia/promotion/public-publique/water-eau.php#how_many
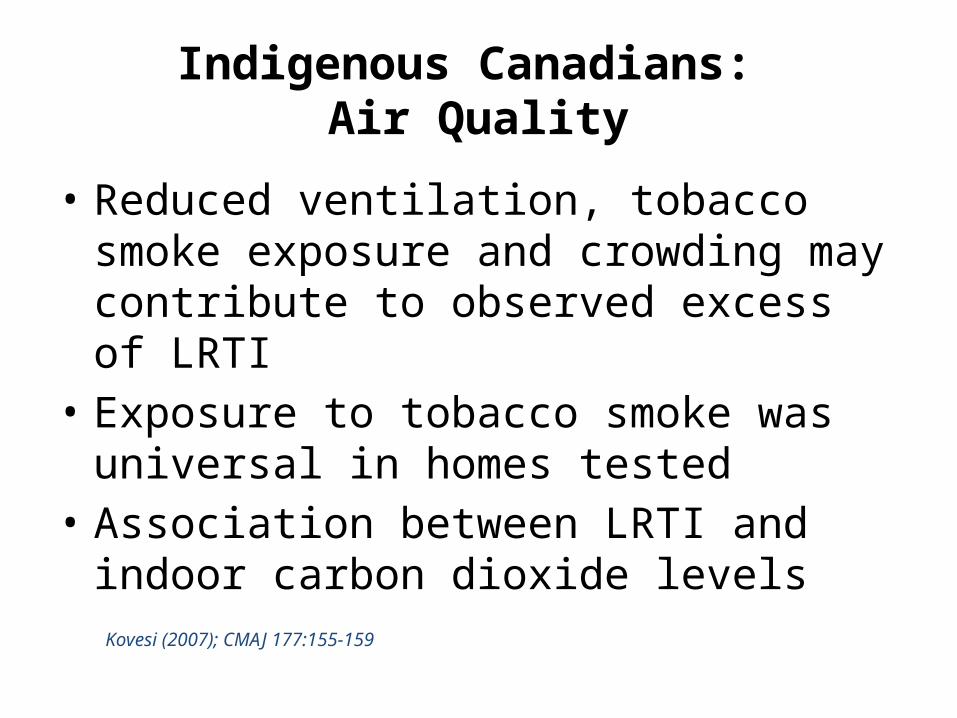
Indigenous Canadians: Air Quality
• Reduced ventilation, tobacco smoke exposure and crowding may contribute to observed excess of LRTI
• Exposure to tobacco smoke was universal in homes tested
• Association between LRTI and indoor carbon dioxide levels
Kovesi (2007); CMAJ 177:155-159
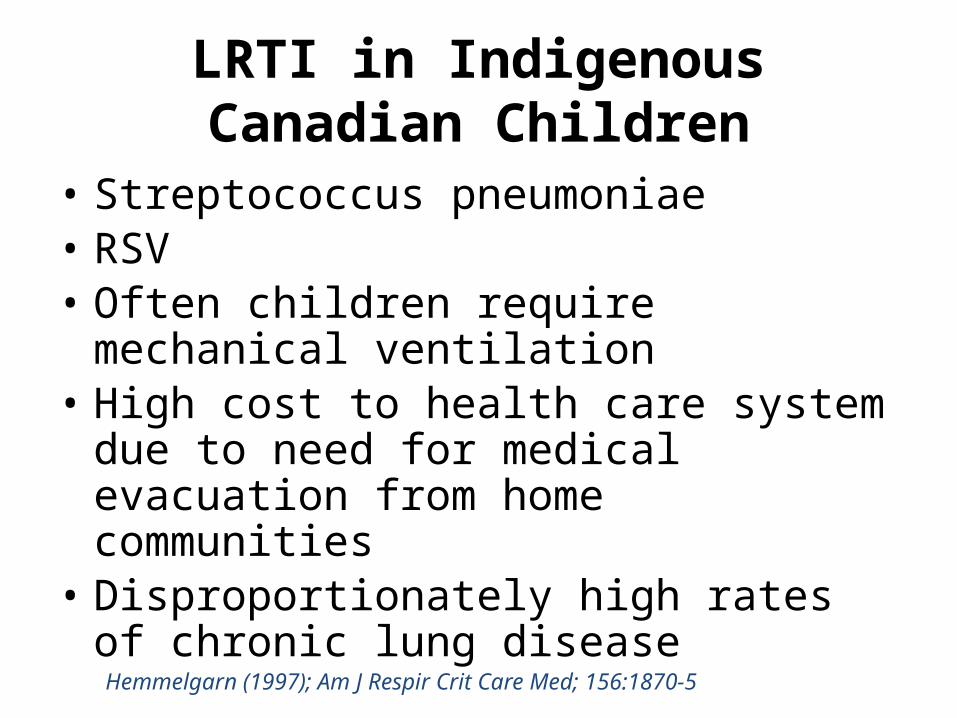
LRTI in Indigenous Canadian Children
• Streptococcus pneumoniae• RSV• Often children require mechanical ventilation• High cost to health care system due to need
for medical evacuation from home communities
• Disproportionately high rates of chronic lung disease
Hemmelgarn (1997); Am J Respir Crit Care Med; 156:1870-5
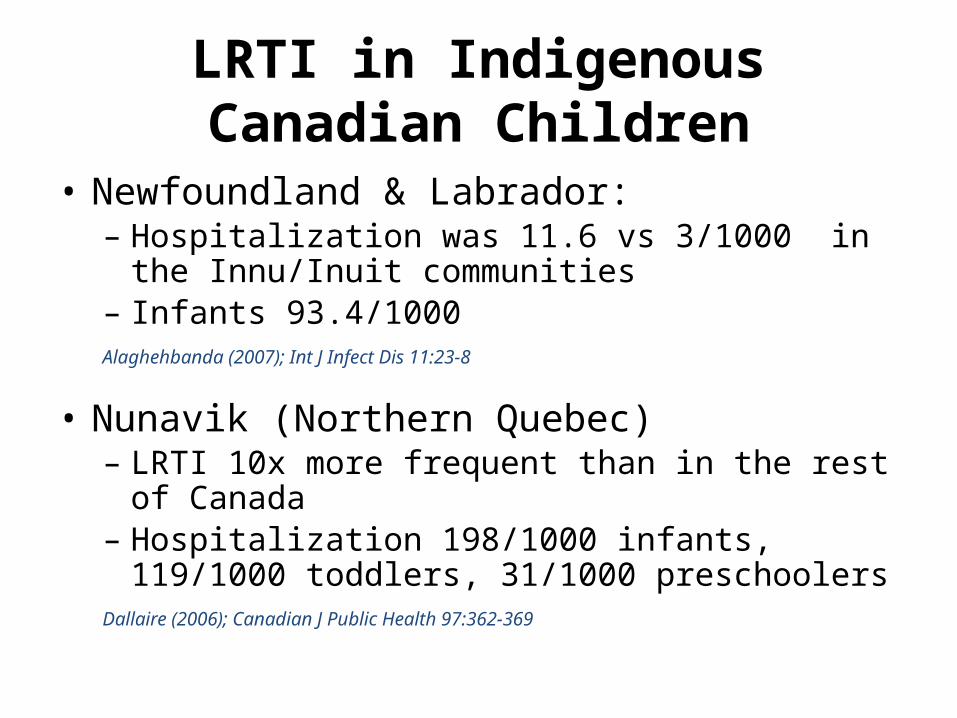
LRTI in Indigenous Canadian Children
• Newfoundland & Labrador:– Hospitalization was 11.6 vs 3/1000 in the Innu/Inuit
communities– Infants 93.4/1000
Alaghehbanda (2007); Int J Infect Dis 11:23-8
• Nunavik (Northern Quebec)– LRTI 10x more frequent than in the rest of Canada– Hospitalization 198/1000 infants, 119/1000 toddlers,
31/1000 preschoolersDallaire (2006); Canadian J Public Health 97:362-369

LRTI’s in Aboriginal Australians
• Despite Australia being one of the wealthiest countries of the world, Australian Indigenous children have a health status and social circumstance comparable to developing countries.
• Indigenous infants have 10 times the mortality rate for respiratory conditions.
• The LRTI rate in Australian Indigenous children is as high as that of children in developing countries.
• The frequency of LRTI hospitalizations of Indigenous infants is triple that of non-Indigenous Australian infants (201.7 vs. 62.6/1000, respectively).
O’Grady KA. J Paediatr Child Health 2010;46:461-465
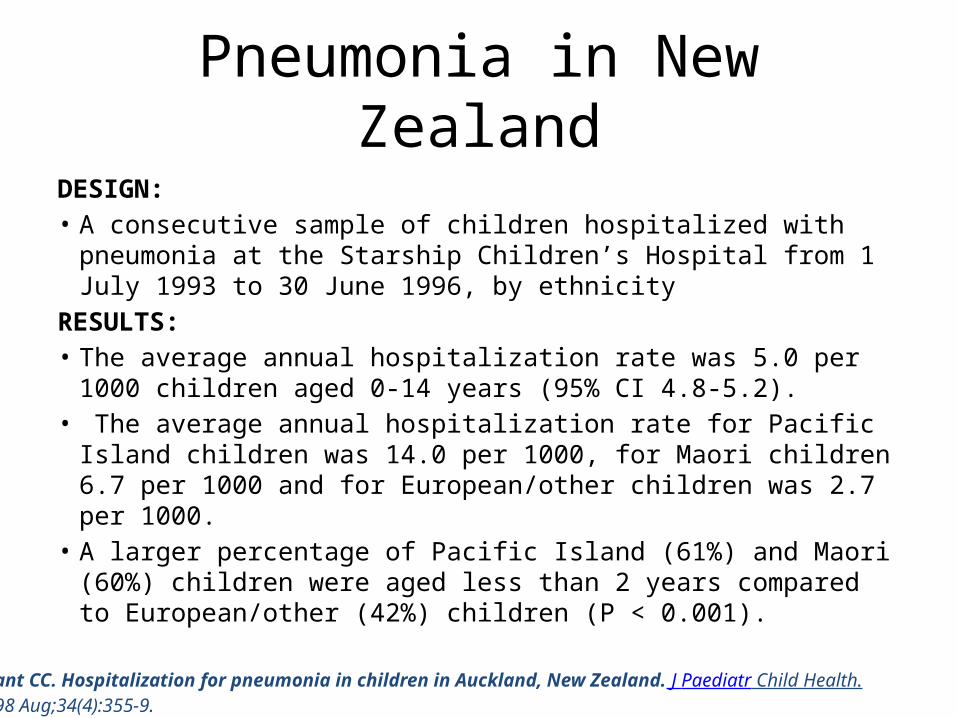
Pneumonia in New ZealandDESIGN: • A consecutive sample of children hospitalized with pneumonia at the
Starship Children’s Hospital from 1 July 1993 to 30 June 1996, by ethnicity
RESULTS: • The average annual hospitalization rate was 5.0 per 1000 children
aged 0-14 years (95% CI 4.8-5.2).• The average annual hospitalization rate for Pacific Island children was
14.0 per 1000, for Maori children 6.7 per 1000 and for European/other children was 2.7 per 1000.
• A larger percentage of Pacific Island (61%) and Maori (60%) children were aged less than 2 years compared to European/other (42%) children (P < 0.001).
Grant CC. Hospitalization for pneumonia in children in Auckland, New Zealand. J Paediatr Child Health. 1998 Aug;34(4):355-9.

Pneumonia in Childhood and Impaired Lung Function in Adults
• Prospective Tucson Children’s Respiratory Study• Early pneumonia cases had impaired lung function (FEV1:FVC
ratio) compared with those without LRI and those with other LRI at 11-26 years
• Early pneumonia associated with double the risk of asthma and wheeze up to age 29 years.
Chan J et al. Pediatrics 2015;135:607-615
FEV1:FVC ratio % P-value
No LRI ref
Pneumonia -3.9 <0.001
Other LRIs -1.1 0.010
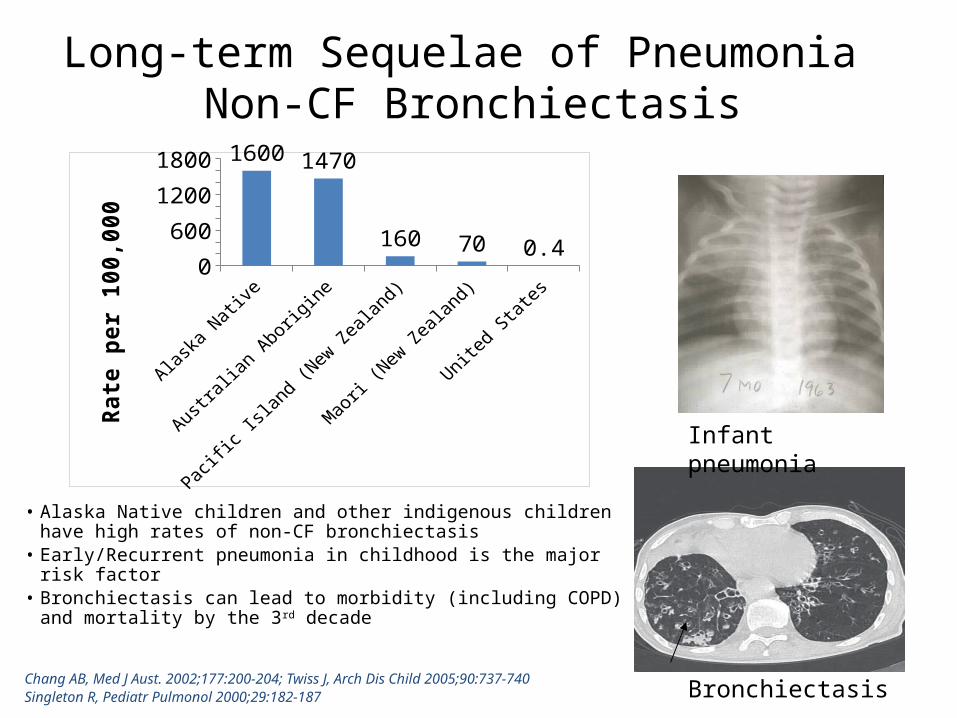
Long-term Sequelae of Pneumonia Non-CF Bronchiectasis
• Alaska Native children and other indigenous children have high rates of non-CF bronchiectasis
• Early/Recurrent pneumonia in childhood is the major risk factor• Bronchiectasis can lead to morbidity (including COPD) and
mortality by the 3rd decade
Chang AB, Med J Aust. 2002;177:200-204; Twiss J, Arch Dis Child 2005;90:737-740Singleton R, Pediatr Pulmonol 2000;29:182-187
Bronchiectasis
Infant pneumonia
0
400
800
1200
16001600 1470
160 70 0.4
Rate
per
100
,000

Demographic features in children with bronchiectasis compared with local and national population: YK/Australia
Overcr
owding
No running w
ater
Woodburn
ing
Tobacco
exposu
re
Premature
0
20
40
60
80
100
120Bronchiec-tasisYK Delta
Overcr
owding
High Sc
hool grad LB
W
Tobacco
exposu
re
Premature
0
20
40
60
80
100
120 BronchiectasisN TerritoriesAustralia
50Singleton RJ et al. Indigenous children from three countries with non-cystic fibrosis chronic suppurative lung disease/bronchiectasis. Pediatr Pulmonol 2014
Alaska – YK Delta Australia – N. Territories
Conclusion
AI/AN children, similar to indigenous children from Canada, Australia and New Zealand, experience higher morbidity and mortality and long-term sequelae due to pneumonia.
AI/AN and US child pneumonia hospitalizations have decreased over the past decade; however, hospitalization rates remain higher.
Improving access to piped water and quality housing, reducing household crowding, maximizing breastfeeding and immunization rates, and improving parent education can help in closing this disparity