the hiawatha line: social and economic implications of
TRANSCRIPT

THE HIAWATHA LINE: SOCIAL AND
ECONOMIC IMPLICATIONS OF LIGHT RAIL
TRANSIT IN MINNEAPOLIS, MN ON SINGLE-
FAMILY DWELLINGS.
A RESEARCH PAPER SUBMITTED TO THE
GRADUATE SCHOOL IN PARTIAL
FULFILLMENT OF THE REQUIREMENTS
FOR THE DEGREE
MASTER OF URBAN AND REGIONAL
PLANNING
BY
ROBERT H. WERTMAN
DR. FRANCIS PARKER- ADVISOR
BALL STATE UNIVERSITY
MUNCIE, INDIANA
MAY 2013

Table of contents
Introduction ......................................................................................................................... 6
Literature review ................................................................................................................. 8
Context: The Hiawatha Light Rail .................................................................................... 24
Methodology ..................................................................................................................... 34
Findings............................................................................................................................. 42
Discussion and conclusion ................................................................................................ 54
Bibliography ..................................................................................................................... 61
Appendix A: CSI histogram.............................................................................................. 65
Appendix B: CSI OLS regression diagnostics .................................................................. 66
Appendix C: CSI standard residuals plot .......................................................................... 67
Appendix D: CSI standard deviation map ........................................................................ 68

List of figures
Figure 1. Population, 1900-2010...................................................................................... 30
Figure 2. Hiawatha ridership 2004-2011 (thousands) ...................................................... 31
Figure 3. Temporal analysis of educational attainment ................................................... 44
Figure 4. Spatial analysis of education ............................................................................ 45
Figure 5. Spatial analysis of occupation (left) and income (center and right) ................. 45
Figure 6. Spatial analysis of Hiawatha Corridor composite socioeconomic index ......... 47

List of tables
Table 1. Model summary of regression on Composite Socioeconomic Index................. 48
Table 2. Parameter estimates of regression on Composite Socioeconomic Index ........... 49
Table 3. Single-family homes regression of the natural log of total estimated value ...... 53

List of maps
Map 1. The Hiawatha Corridor with study area neighborhoods and stations .................. 25
Map 2. Hiawatha line study area single-family dwellings ............................................... 33
Map 3. Composite SEP of neighborhoods along the Hiawatha Corridor ........................ 43

Introduction
The Midwest has seen widespread planning for the implementation of various
rapid transit systems throughout the last decade. It has become increasingly clear to
municipalities in large metropolitan areas that transit options other than highway and the
outdated standard bus systems of the last half-century are desperately needed.
Light rail transit has existed in several different variations throughout the history
of the United States, and has become the dominate form of urban rail transit since the
expansion of subway and commuter rail systems in the 1970’s. In the Midwest, cities are
increasingly turning to urban rapid transit systems as a source of economic and social
revitalization.
This paper builds on the overwhelming significant works that have been
conducted throughout the last several decades on economic impact of rapid transit
systems, and contributes to the emerging analysis of social impacts of transportation in
the social and transportation related sciences. This paper will expand on other works by
including estimates of alternative transportation facilities, comparing the influence of
rail-based infrastructure to the familiar Midwest highway infrastructure. Building on
these existing works, regression models formulated to estimate the extent of the impact
that LRT has on social and economic forces. These issues are explored in an area

7
of the country that is relatively new to rail-based transit, and lacking published research-
Minneapolis, MN. The findings from this research largely confirm other research,
demonstrating an observed increase in property values of single-family dwellings in
relation to proximity to LRT stations, as well as the temporal effect of these impacts.
However, an even higher observed increase in relation to critical highway infrastructure
was found. This research also indicated that LRT infrastructure in Minneapolis, MN does
not play a significant role in impacting socioeconomic position of neighborhoods that
surround rail stations. This is in contrast to highway infrastructure, which continued to
play a significant role in influencing socioeconomic position in study area neighborhoods
after LRT was built in Minneapolis.
This paper is structured in the following manner. First, an introduction to existing
literature is presented, followed by a brief overview and description of the study area. For
the social implications, a generalized linear regression model is formulated and the
results are presented. For the economic implications, a semi-logarithmic hedonic
regression model is formulated, and the findings are presented to the reader. The results
of the social implications regression model show built-environment influences on
socioeconomic position in relation to distance to properties within proximity to light rail
transit stations on the Hiawatha line. The results of the economic implications hedonic
regression model show price and distance influence on single-family residential
properties between the first year of operation in 2005, and after 5 successive years of
operation in 2010. The paper finishes with a discussion of the results, and the
implications to future transportation planning and public policy decisions.

Literature review
Analyzing the impact of rapid transit stations is not a new concept in urban
planning. Since the 1970’s, many studies have emerged that analyze various
transportation systems in several different cities using a variety of different methods to
understand the influence that transportation systems have on their immediate
neighborhoods, as well as the underlying causes. This paper has focused on two
dynamics within transit neighborhoods: social and economic. These two dynamics are not
mutually exclusive, there are some similarities in how they can both be described. The
economic impact of transit stations describes a relationship in which the transportation
system is influencing residential property values, as described in terms of monetary
value. The social impact of transit stations is more abstract, and is best summarized as the
relationship in how the transportation system is influencing the socio-demographic
characteristics (income, education, employment, etc.) and is described in terms of the
impact on the sum total of these characteristics. The later of these two dynamics has been
researched in various levels of details, while the former has attracted less interest from
researchers.
One of the oldest, and oft cited, works in research which analyzes the various
impacts that transit stations have on surrounding neighborhoods is the Evidence of Land
9
Use Impacts of Rapid Transit Systems by Robert L. Knight and Lisa L. Trygg (1977).
This study sought to understand the evidence behind the transit planning agencies
rationale that the high initial costs of transit systems would be offset by the large amount
of public benefits they created. At this time in the history of U.S. transit planning
(1970’s), many agencies advocated that the construction of new transit systems would
create, reorder, and enhance existing neighborhoods above and beyond what would have
normally occurred had the transit system not been built. However, Knight and Tyrgg
thought that these statements brought more questions than answers:
Will a transit system promote an attraction of wealth or population from other
regions?
Do different transit technologies have different land use impacts?
What different physical and policy settings have a significant bearing on these
impacts?
Can a regions development be focused or its average density increased by transit?
Will declining central business districts be strengthened, or will suburbanization
be increased by a new transit system?
How quickly will any purported impacts appear?
Knight and Tyrgg found, through examining existing literature, that despite
detailed reviews of various transit systems such as BART and Toronto, little transfer of
wealth from other regions was occurring. In addition, in Toronto where a $15 billion
increase in tax assessment occurred over a 10 year period, $10 billion was directly
attributed to the transit system that was built. However, the studies failed to identify other
factors that may influence the development within central business districts. When
10
compared to other Canadian cities within the same time period, many of them with no
transit or plans for developing transit in the future, experienced similar or larger growth
rates within their central business districts. At the time of Knight and Tyrgg’s study, they
found no studies examining the impacts between alternative modes of transit. The authors
called for an increase in the amount of research that should be devoted to identifying the
impact differences between commuter rail, subway, light rail, and express bus. However,
the authors acknowledged that there were not enough cases present in (1970’s) North
America to compare the impact advantages of various transit system types. In many
respects, the United States today is in a similar position, surface based rail transit (light
rail) is the predominate method of new transit systems being developed in the United
States, there are very few examples of its alternative, Bus Rapid Transit, that exist in a
pure and complete form.
Knight and Tyrgg found that there were four factors that are important
determinants of the degree of impacts that new transit systems exhibit:
Local government policies that encourage the desired development must
exist for success.
Regional development trends will continue to influence the extent of
impact.
There must be sufficient amount of available land for infill development.
The development of the site will be constrained to local environmental
factors (river, slope, etc.).
Knight and Tyrgg end their paper with a warning to planners to avoid claiming
that transit systems will provide massive gains in property tax revenue, or will
11
significantly improve regional growth. While rapid transit will not automatically
revitalize and reshape our existing cities and neighborhoods, rapid transit can provide
many benefits, but planners must be willing to learn the true role of the transit system and
the other factors that must be in place to ensure a successful community transformation
(Knight and Tyrgg, 1977).
Another paper, The Blue Line Blues: Why the Vision of Transit Village May Not
Materialize Despite Impressive Growth in Transit Ridership by Loukaitou-Sideris (2000)
and Banerjee, sought to understand the real barriers to growth around transit stations on
the blue-line corridor in Los Angeles, CA. The authors sought to demonstrate that social,
economic, and institutional barriers can continue to inhibit Transit Oriented Development
(TOD) despite strong ridership growth within the corridor. Loukaitou-Sideris and
Bangerjee found that the Blue line was placed in an area of non-functional land in Los
Angeles County, and prior to construction had no positive physical characteristics to help
promote the desired change. The line avoided connecting existing commercial centers
and weaved between the back lots of industrial areas, an exception was two bus terminals
in downtown Los Angeles and Long Beach. The Blue Line had violated two of the
fundamental rules of mass transit: connect people and activities. The authors also found
that there was not sufficient density within close proximity of transit stations. Typically,
the land surrounding the stations was left undeveloped, and density increased as the
distance from the transit station increased.
The stations were highly inaccessible for neighborhoods where blue-line transit
stations were located, lacking any type of feeder or shuttle bus transit service to bring
potential riders to the station. Additionally, many stations were only accessible by vehicle

12
and once arrived, lacked any type of sufficient park and ride or kiss and ride capability.
The absence of viable methods of accessing the transit line in general, contributed to the
failure of this particular line. Despite 10 years of operation, the line had not contributed
to any significant new development near or around transit stations within the inner city of
Los Angeles.
Like Knight and Tyrgg, they found that despite the planner’s best efforts, little in
the way of significant community changes will occur unless changes to local policy
occur. Among these include:
Regional planning that links various communities, rather than one
attraction to another attraction.
An urban design plan that treats the transit station as a part of the
community.
Identification of assets or the promotion of enterprise zones to stimulate
developments.
Community involvement.
Powerful economic incentives to attract new development.
A public agency that leads and coordinates several different agencies to
achieve these goals (Loukaitou-Sideris and Banerjee, (2000).
Much of the literature has been in agreement that transit systems alone cannot
influence enough impact, by themselves, to significantly improve communities or
transform the economic and social vitality of the entire region. How we measure the
social and economic effects of transit stations is important to understanding how planners
and researchers are determining the success of a given transit corridor.

13
When it comes to understanding the social impact of transit corridors, the
literature is relatively scarce, and much of the research has focused on the analysis of
independent, tract-level socio-demographic data to analyze these changes. While these
methods are ideal for determining the change in individual attributes of socioeconomic
position, they fail to capture the holistic nature of what socioeconomic position is: a
combination of several different attributes that determine a neighborhoods position
relative to the region. Similar to a scenic view, it is difficult to gain an appreciation of the
totality of the scene if the viewer only focuses on the individual tree, and ignores the
mountain in the background and the stream running through the forest.
Determining the social impact of transportation is an increasingly emerging field
of study in transportation related research, and is constantly evolving. However, social
impact analysis takes a back seat when compared to the abundance of information on
economic and environmental impacts of transportation, and transit specifically. In
assessing the social impacts, there is no definitive agreement in the academic or public
policy world about what is considered a social impact. Additionally, there has been no
agreement in the academic world as to what are the most appropriate ways to assess
social impacts. Many qualitative and quantitative methods that have been used
academically, and the analysis scale has involved macro and micro level analysis, while
overlapping with approaches that have commonly been used in the assessment of
economic, health, and environmental impacts of transportation.
In the United States, the social impact of transportation is of relatively minor
consideration. It is of no surprise that, when compared to the United Kingdom and
Europe, there has been more volume in this area of study, especially with public policy
14
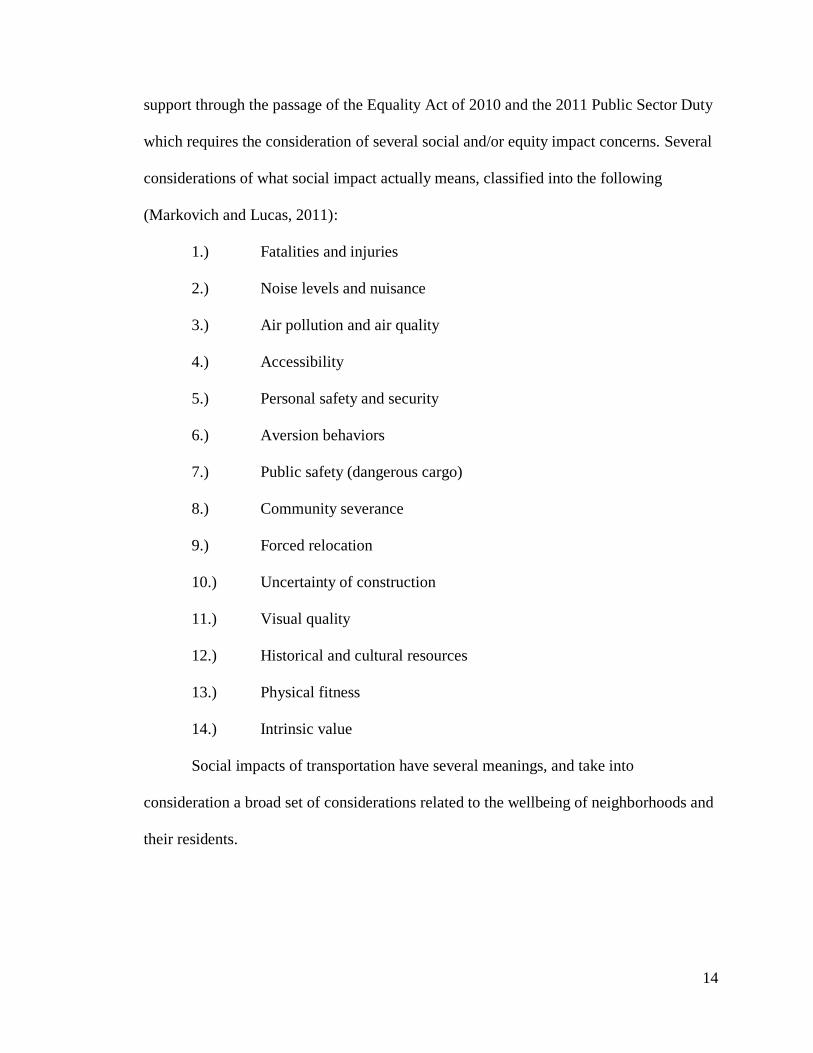
support through the passage of the Equality Act of 2010 and the 2011 Public Sector Duty
which requires the consideration of several social and/or equity impact concerns. Several
considerations of what social impact actually means, classified into the following
(Markovich and Lucas, 2011):
1.) Fatalities and injuries
2.) Noise levels and nuisance
3.) Air pollution and air quality
4.) Accessibility
5.) Personal safety and security
6.) Aversion behaviors
7.) Public safety (dangerous cargo)
8.) Community severance
9.) Forced relocation
10.) Uncertainty of construction
11.) Visual quality
12.) Historical and cultural resources
13.) Physical fitness
14.) Intrinsic value
Social impacts of transportation have several meanings, and take into
consideration a broad set of considerations related to the wellbeing of neighborhoods and
their residents.
15
This paper will focus on the accessibility and noise-related nuisance/health
impacts of the transportation because these have had a clear place in transportation
planning, geography, and research.
The notion of transportation accessibility, moreover, the physical access to
transportation facilities may be the most highly researched component of social impact of
transportation. In the United Kingdom, transportation has largely been regarded as a
social policy issue, and there have been clearly established links between lack of access
to transportation and the exclusion of those people from various social capital (i.e. jobs)
(Farrington, 2007).
Other research has noted that social impact is much more than income-based
measures and that if income was purely associated with social impact, then the impacts of
transportation would be relatively modest. In this sense, someone who is of high income
can still be social impacted through exclusion. Social exclusion by transportation is
defined as a person’s access to work, education, healthcare, shops, recreation facilities,
welfare, finance, and housing- access to (effective) transportation play’s a dominate role
in determining a person’s access to the social resources above. Transportation planners
should try to reduce social exclusion, by increasing social inclusion and ensuring equal
opportunity to engage and integrate into society (Preston and Rajé, 2007).
Other research has focused on health related quality of life issues, which blur the
line between social impact and health impact. One can easily construe that benefits to
health impact a person’s social well-being. Studies have found that transportation related
noise has been perceived as a nuisance and increases the stress found in one’s life
(Bundesamt für Umwelt, 2007). Several studies linked the environmental exposure of

16
transportation related noise to the development of adverse health outcomes, and leads to
severe social impacts on neighborhoods which are adjacent to or within close proximity
of transportation facilities (Standsfeld and Matheson, 2000).
Noise and proximity are easily quantifiable, many studies have used a
combination of survey data with established databases on health and transportation. A
significant portion of the population reported noise annoyance with traffic. When
comparing traffic-noise annoyance with health status, negative associations were found to
be present with all health-related measures except for general health. In addition,
composite health scores indicated that high traffic-noise resulted in a lower composite
health score. This was present in males and females, but more prevalent in women than
men. The evidence that the impacts of environmental exposure to transportation related
noise can have significant impacts on clinical outcomes of health and as a result impact a
person’s overall quality of life (Dratva, et al., 2009).
Several studies have analyzed the economic impact of transit stations. This impact
has been primarily expressed in terms of the total impact on the price of residential or
commercial property values. Questions arise as to the appropriate methods for
determining this and the necessary attributes modeled to determine the extent to which
various hedonic principles influence the value of a homes or business that surround the
transit station.
Gatzlaff and Smith (1993) studied the value of residences near Miami Metrorail
stations over the current lifetime of the system. The system had been experiencing a 15%
lower ridership than projected prior to the system being built. In their review of existing
literature, they found two major issues with the method of analysis:

17
1. Many factors, in addition to transit, may be occurring simultaneously.
2. Effects on localized properties near transportation enhancements develop over a
long period of time.
Other studies indicated that transit service may increase the value of adjacent
properties by providing better access and visibility, or could negatively affect adjacent
properties because of associated or perceived nuisances of noise, pollution, construction
disruption, property isolation, etc.
Gatzlaff and Smith utilized a hedonic methodology to control for some of the other
land use factors, and were able to quantify price changes as a result of the announcement
of the development of the Miami Metrorail system. The model assumed the property
value is a function of local and property specific characteristics and attributes. Gatzlaff
and Smith used eight hedonic variables to describe these characteristics:
Total living area of residence in square feet.
The parcel lot size.
Age of the property in years at the time of sale.
Index of residential property appreciation.
Distance from the Miami MetroRail transit station.
A dummy variable that describes if the property was built prior to 1980 or not.
The distance of properties selling before and after the announcement of the
Metrorail expansion.
They found weak evidence of any effect on residential values that were due to the
announcement of the development of the Miami Metrorail system. A similar weak

18
influence on residential property values was also demonstrated, however the impact
varied depending on more affluent neighborhoods.
Finally, Gatzlaff and Smith found that the entire system appears to have only had
a marginal impact on overall residential property values. They further concluded that the
system had little effect on increasing the accessibility of residents to goods and resources
demanded at the time (Gatzlaff and Smith, 1993).
Chen et al. (1997) studied the proximity effect of transit stations using Portland’s
MAX light rail transit system in their study Measuring the Impact of Light Rail Systems
on Single Family Home Values: A Hedonic Approach with GIS Application. They, like
multiple studies before them, acknowledged that the physical attributes of the house
itself, neighborhood attributes, locational attributes, and fiscal and economic externalities
played an important role in the determination of housing prices. In addition, they also
acknowledge that existing literature has found inconsistent results in how rapid transit
systems are affecting residential property values, with some studies finding positive
results, others negative, and several which were inconclusive (including Gatzlaff and
Smith). Chen et al used a dummy variable to indicate if the property was within or
outside a 700 meter distance of a MAX LRT station, but was excluded from the final
results because the attribute lacked any statistical significance. Final attributes used in
Chen et al’s study were age of house, lot size, house size in square feet, house size
squared, number of bedrooms, number of bathrooms, number of fireplaces, corner lot,
presence of basement, presence of attached garage, median household value for census,
single family zoning, distance to nearest park, distance to central business district,
distance to LRT line, distance to nearest LRT, located in Portland, built in 1993, and built
19
in 1994. Their study utilized significantly more variables then the previous study in
Miami. The more statistically significant variables they modeled will have resulted in
better predictions of the influence that proximity to transit stations has on residential
property values.
Chen et al. found that the MAX LRT system in Portland had a positive effect on
accessibility factors, and a negative effect on single-family home values as a result of
noise nuisances associated with mass transit systems. This study suggested that planners
should find ways to decrease the nuisance affect by finding creative solutions to mitigate
noise, increased pedestrian and automobile traffic, attraction of “undesirable groups”, and
the physical division of neighborhoods by the LRT line itself (Chen and Deuker, 1997).
Sherry Ryan in her report Property Values and Transportation Facilities-
Finding the Transportation- Land Use Connection (1993) analyzes many of the previous
literature and seeks to understand why there is so much variation between the results of
empirical research using regression modeling of land-use effects near transit-station
properties differs and the theoretical expectations of transportation systems. Ryan
summarizes that when transportation facilities provide travel time savings, and are
accurately measured, the expected property values tend to be consistent with the
perceived transportation access relationship. However, many researchers do not
adequately capture the changes in travel time because too many properties that are too far
away are included in the sample, and the results thus indicate no significant change in
property values. Ryan indicates that property value changes as a result of the
implementation of transportation systems should be more directly correlated with

20
changes in travel time, rather than the distance of residents and employers from the
respective transportation facility.
Ryan warns future researchers that the distance from a transportation facility may
not accurately estimate property value changes, and suggest that the proximity effect for
rail based transit is within 0.33 miles of the station, and within 1 mile from highway
facilities. She suggests that properties near transportation facilities that have accrued
significant travel time savings will force the land-market to appropriately buy up these
properties. Ryan asserts that planners need to have a clear understanding of the
relationship between transportation facilities and travel time changes. She concludes that
this is imperative in the design of transportation systems as rail solutions should link
existing activity centers rather than to expect these systems to attract concentrations of
activity (Ryan, 1993).
Despite warnings from Sherry Ryan’s paper that transportation researchers should
focus on travel time reductions as the basis for independent variables when measuring the
impact on area property values, existing literature following her report has continued to
focus on the proximity effect of transportation systems. However, some variations in the
type of independent variables have been enhanced.
Hess and Almeida, in their report, the Impact of Proximity to Light Rail Rapid
Transit on Station-area Property Values in Buffalo, New York (2007) attempt to show
how accessibility benefits have accrued for transit station properties in a declining,
rustbelt city. In their study, they assumed that as distance increased from the transit
station, accessibility benefits decreased. Hess and Almeida have introduced a new
variable which they describe as the walking distance to the transit station, versus the
21
“straight line” distance. The primary difference between these distance measures the
walking distance from the transit station requires the calculated distance using the street
network, versus the straight line distance assumes a fixed radii around the transit station.
They conclude that the street network distance has less of an impact on property
value than the straight line distance. According to the authors, this indicates that the local
market forces favor general proximity to transit, rather than actual walking distance, or
driving distance (the network assumes that sidewalks follow the street network). In
absence of the street network versus the straight line distance measure, the Hess and
Almeida study only added to the growing body of research which has indicated that there
is a relatively weak, but generally positive influence on residential property values near
transit stations. The authors found that in general, proximity to transit stations can
increase the value of homes in Buffalo, NY by $1,300 to $3,000, or 2-5 percent of the
median home value. Like previous literature, the authors indicate that planners cannot
claim that transit systems will unequivocally increase property values and automatically
lead to the revitalization of depressed neighborhoods (Hess and Almeida. 2007).
In the Impact of Railway Stations on Residential and Commercial Property Value
(2007) Debrezion et al. used two different methods of determine proximity to rail and bus
based transit systems. This study presented an analysis of 4 different types of rapid transit
systems: heavy rail, commuter rail, light rail, and bus rapid transit. The researchers
utilized three different types of models, linear, semi-log, and log-linear specifications.
Like previous reports, the authors followed hedonic principles and included parcel, local,
and regional characteristics that would impact the property values near the transit station.
The authors conclude that in general, railway stations can expect to have the highest

22
degree of influence of property values, and of all the transit stations commuter rail
stations exhibited a significantly higher impact on property values than any of the other
transit stations included in the study. This study used two measures of distance, a ¼ mile
buffer from the station, and in departing from the existing literature, a more global effect
by analyzing a continuous measure of distance from the transit station. The authors
found that on average, commercial properties sell or rent 12.2 percent higher than
residential properties in the same distance range, with a gap of 4.2 percent for residential
properties and 16.4 for other commercial properties.
When utilizing the continuous measure, the impact from the transit station is 2.3
percent higher for residential properties than it is for commercial properties. The authors
of this study also included proximity to highway infrastructure, and stated that if these
measures are omitted from the study that significant variable bias will occur. The
exclusion of highway accessibility as a variable in the model will cause the researcher to
overestimate the impact that transit stations have on area property value (Debrezion, et
al., 2007).
The final study by Cervero and Kang, Bus Rapid Transit Impacts on Land Uses
and Land Values in Seoul, Korea (2009), is unique in that it analyzed only BRT, and
sought to understand how the system was changing land-use factors within the transit
corridor. Like Debrezion, Cervero and Kang analyzed the impact on the commercial and
residential property values. Cervero and Kang noted that the results of the BRT-only
study were consistent with rail-based transit improvement studies, and noted that it is not
transit “hardware” that will influence land use, but rather quality of service and (like
Ryan) the travel-time savings of taking transit versus a personal automobile.

23
The authors found that within 300 meters, there was a significantly higher impact
on commercial and property value, but also found that outside of 30 meters from the
transit system, no nuisance effects could be empirically detected. The authors note that
this is most likely due to the BRT design enhancements that were integrated into the
system during development (Cervero and Kang, 2009).
The proximity effect of transit stations has had a long history in transportation
research, and planning of various systems. The empirical results of transit across the
world has varies from study to study, and most likely is attributed to individual planning
mistakes that occurred during the development of transit systems that performed poorly.
Regardless, several researchers have indicated that the straight line distance and
proximity only measures will result in significant attribute bias, and the exclusion of
accessibility to other transportation accessibility will almost certainly result in inflated
values for localized station proximity impacts. Multiple studies indicate there is
significance between the type of transit system and the extent of impact, overall the same
trends are present regardless of the type of transit system.
This study will attempt to replicate existing literature by using appropriate local,
neighborhood, and regional attributes that have been shown to influence residential
property values the most, but also heed researchers warning and include other
transportation facility accessibility independent variables to reduce the station proximity
bias effect.
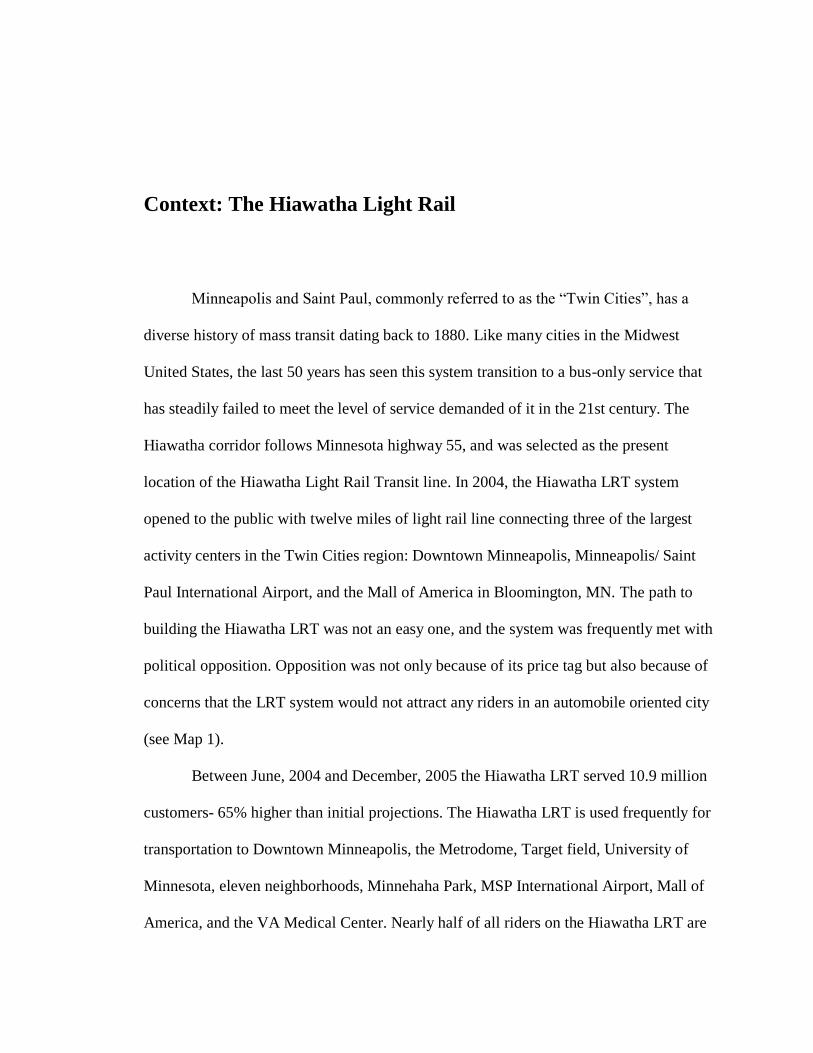
Context: The Hiawatha Light Rail
Minneapolis and Saint Paul, commonly referred to as the “Twin Cities”, has a
diverse history of mass transit dating back to 1880. Like many cities in the Midwest
United States, the last 50 years has seen this system transition to a bus-only service that
has steadily failed to meet the level of service demanded of it in the 21st century. The
Hiawatha corridor follows Minnesota highway 55, and was selected as the present
location of the Hiawatha Light Rail Transit line. In 2004, the Hiawatha LRT system
opened to the public with twelve miles of light rail line connecting three of the largest
activity centers in the Twin Cities region: Downtown Minneapolis, Minneapolis/ Saint
Paul International Airport, and the Mall of America in Bloomington, MN. The path to
building the Hiawatha LRT was not an easy one, and the system was frequently met with
political opposition. Opposition was not only because of its price tag but also because of
concerns that the LRT system would not attract any riders in an automobile oriented city
(see Map 1).
Between June, 2004 and December, 2005 the Hiawatha LRT served 10.9 million
customers- 65% higher than initial projections. The Hiawatha LRT is used frequently for
transportation to Downtown Minneapolis, the Metrodome, Target field, University of
Minnesota, eleven neighborhoods, Minnehaha Park, MSP International Airport, Mall of
America, and the VA Medical Center. Nearly half of all riders on the Hiawatha LRT are

25
Map 1. The Hiawatha Corridor with study area neighborhoods and stations

26
new to transit - an indication that the population is willing to use mass transit and
abandon their automobile.
Prior to 1985, the original plans along the Hiawatha corridor called for an 8-lane,
below grade highway that would connect into Downtown Minneapolis and the existing
highway network. With the passage of the 1969 National Environmental Policy Act,
residents of neighborhoods that would be affected halted the construction of the eight
lane highway. When the Environmental Impact Study was presented in final form in
1985, the proposed plan included a scaled down highway with restricted 40 MPH speeds
and a LRT line running alongside it. The 1985 plan called for the LRT system to connect
Downtown Minneapolis to MSP International Airport and recommended a further
extension to the Met Stadium (now Mall of America).
From 1985 to 1999, the proposed Hiawatha LRT line running along state route 55
was stalled and threatened in various ways. While the original Environmental Impact
Statement recommended the construction of LRT, it did not provide any answers on how
a proposed rail line would be funded. One of the most significant steps taken during this
period to fund the LRT line was the formation of the Hennepin County Regional Rail
Authority’s LRT plan, which included several lines beyond the Hiawatha LRT route.
While a Draft Environmental Impact Statement was prepared, it led to no record of
decision and the report was shelved.
In 1997, the Minnesota Department of Transportation began studying the concept
of creating a dedicated right of way bus lane in the space reserved for the Hiawatha LRT.
While Minnesota DOT had the money available to spend on dedicated bus ways, it did
not have the funding to begin construction of rail-based transit. Before plans for bus ways

27
were complete, an infusion of funding from the federal government made possible the
LRT portion of the project, and was followed by the first installment of state funding
in1998. In 1998, Minnesota DOT amended the original 1985 Environmental Impact
Statement, which would cover the extension of the line to the Mall of America, originally
not included in the final 1985 Environmental Impact Statement.
From 1999 to 2001, the Minnesota Department of Transportation began its
preliminary engineering phase of the project. Minnesota DOT was designated as the
project management firm, and in a unique twist would become the designer and the
builder, which increased the importance of preliminary design documents. Between 2001
and 2004, construction began on the Hiawatha LRT corridor before the final design was
completed. In the middle of summer 2004, the Hiawatha LRT line opened to the public
with great fanfare.
The organization of the implementation of the Hiawatha corridor was a major
challenge for several agencies within Minnesota, and represented the largest megaproject
that the State of Minnesota had ever undertaken. The Metropolitan Council served as the
federal grantee, the owner of the system, and the final decision maker. MetroTransit, the
existing operator of the Twin Cities bus service, would become the operator of the new
Hiawatha LRT. The Minnesota Department of Transportation was the constructor, and
served as the owner of the right of way (along with Hennepin County). The Metropolitan
Airports Commission was placed in charge of the tunnel and airport stations. The
Hiawatha Project Office served as the primary coordinator for the project and as well as
project management for the system. The corridor management committee and community
advisory committee was tasked with coordinating policy and public input. The Cities of
28
Minneapolis and Bloomington provided support and coordination for land use, downtown
utilities, and contra-flow bus lanes.
The Hiawatha LRT lane had several estimates of operating and maintenance costs
throughout the several iterations of the environmental impact statements. In 1985, the
estimates for operation and maintenance were $6,980,000, or approximately $14,500,000
in 2000 dollars. The newly adjusted operations and maintenance costs were adjusted to
reflect $15.127 million in 2004, $15.581 million in 2005, and $16.049 million in 2006. In
2004, MetroTransit adjusted the operating costs to reflect $11.544 million in 2004,
$16.570 million in 2005, and $17.437 million in 2006. T
The source of funding these costs came from: fare revenue, state funding,
Hennepin county funding, and air quality funding.
In 1999, the Minneapolis Community Development Agency initiated the
Hiawatha LRT Corridor Transit-Oriented Development Market Study, which identified 4
catalyst stations (with recommendations on where to focus initial investments for
neighborhood development): Downtown East, Lake Street, 46th
Street, and Bloomington
stations.
At the Downtown East station, the study indicated 2.7 million square feet of
commercial space and up to 1,500 new residential units that could be absorbed in a 20
year period. At the Lake Street station, 150,000 square feet commercial space and 1,250
new residential townhouses and apartments were identified. At the 46th
Street station, the
reconfiguration of 160,000 square feet of commercial and industrial could be transformed
into 149,000 square feet of new commercial and up to 1,000 new residential units.

29
The study also indicated that the light rail transit improvements would enhance
property values and help spur new community development activity, but this
development might take longer to occur. Of the 7,000 new housing units that were
envisioned to be built prior to 2020 near the 4 catalyst stations, more than 5,400 units
were completed or under construction, and the City of Minneapolis was in the process of
permitting 7,000 additional units (it is unclear how many are vacant, or if the new
housing units were attracting residents from outside the metropolitan area).
The “Hiawatha Before and After” indicated nearly 850 new housing units to be
completed between 2007 and 2009 near the Downtown East station, between 50,000 and
150,000 square feet of retail, and 150-450 new housing units to be completed near the
Lake Street station. At the 46th
Street station construction had started on over 500 new
residential units and the expansion of over 145,000 square feet of retail. The
Bloomington Central Station recorded the largest impact with the construction of a 5-
phase project that would see 1,100 new housing units, 9,000 jobs, 2 million square feet of
office, a hotel, and 75,000 square feet of new retail.
While the study indicates that community transformations and additions to
employment have occurred, it was unclear as to the level of displacement of lower
socioeconomic position residents and how much new employment the region added, as
opposed to shifting employment from one area in the region to another (MetroTransit,
2010). This paper will seek to help identify the level of impact in social and economic
realms that has occurred as a result of the Hiawatha Light Rail Transit corridor.
30
0
200,000
400,000
600,000
800,000
1,000,000
1,200,000
1,400,000
19
00
19
10
19
20
19
30
19
40
19
50
19
60
19
70
19
80
19
90
20
00
20
10
Po
pu
lati
on
Year
Minneapolis City
Hennepin County
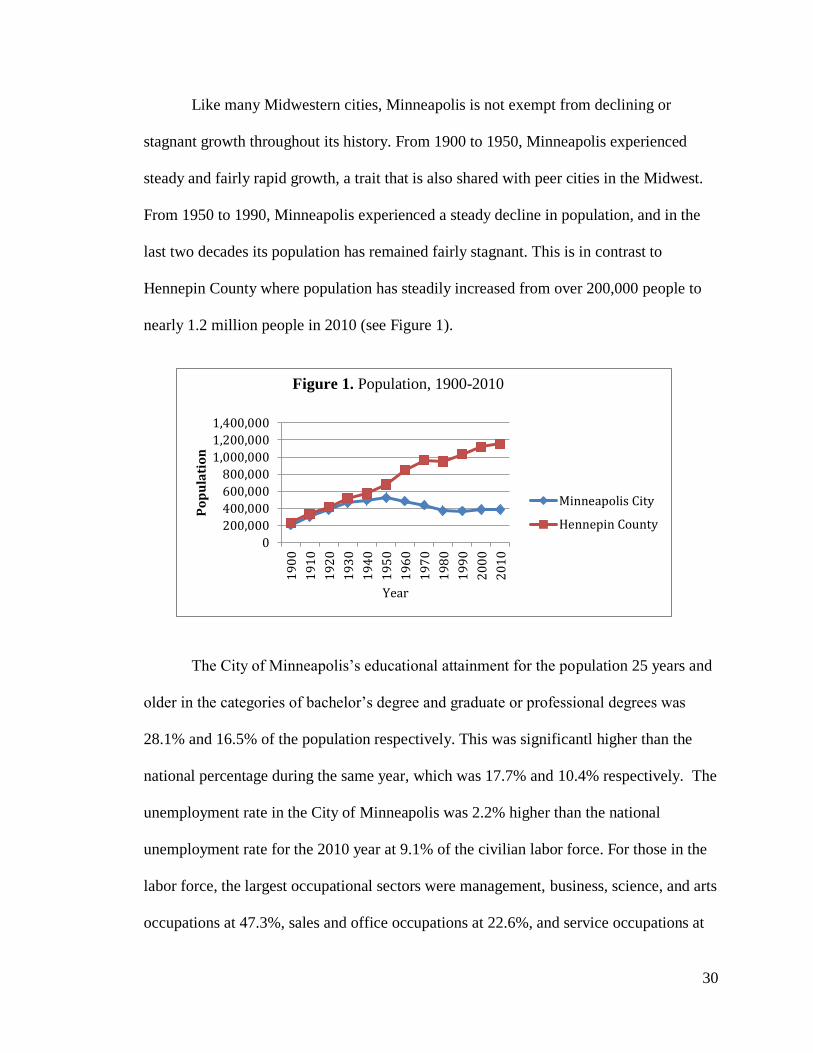
Like many Midwestern cities, Minneapolis is not exempt from declining or
stagnant growth throughout its history. From 1900 to 1950, Minneapolis experienced
steady and fairly rapid growth, a trait that is also shared with peer cities in the Midwest.
From 1950 to 1990, Minneapolis experienced a steady decline in population, and in the
last two decades its population has remained fairly stagnant. This is in contrast to
Hennepin County where population has steadily increased from over 200,000 people to
nearly 1.2 million people in 2010 (see Figure 1).
The City of Minneapolis’s educational attainment for the population 25 years and
older in the categories of bachelor’s degree and graduate or professional degrees was
28.1% and 16.5% of the population respectively. This was significantl higher than the
national percentage during the same year, which was 17.7% and 10.4% respectively. The
unemployment rate in the City of Minneapolis was 2.2% higher than the national
unemployment rate for the 2010 year at 9.1% of the civilian labor force. For those in the
labor force, the largest occupational sectors were management, business, science, and arts
occupations at 47.3%, sales and office occupations at 22.6%, and service occupations at
Figure 1. Population, 1900-2010

31
17.6%. Minneapolis’s management, business, science, and arts occupations were 11.9%
higher than the national average is this category. However, Minneapolis lagged behind
the nation in sales and office occupations by 0.4% and service occupations by 7.4%. In
2010, the median household income in Minneapolis was $46,508, which was just under
the national median household income of $50,046.
In 2010, 16.9% of all families in Minneapolis were below the poverty level, this
was higher than national estimates for the same year at 11.3% of all families.
Minneapolis displayed a relatively impressive 15.2% of workers commuting to work
using public transportation, in contrast to the national estimate where only 4.9% of
workers used public transportation to get to work (U.S. Bureau of the Census).
Both the Hiawatha and Healthline rapid transit systems have enjoyed reasonable
amounts of success in terms of pure ridership. In 2005 (first full year of operation), the
Hiawatha line had a total ridership of 7,901,668, by 2011 the number has increased to
10,400,864 (see Figure 2).
0
2,000
4,000
6,000
8,000
10,000
12,000
2004 2005 2006 2007 2008 2009 2010 2011
Ridership
Figure 2. Hiawatha ridership 2004-2011 (thousands)
32
The Hiawatha LRT route connects two major destinations in Minneapolis: the
Mall of America and Downtown. In addition, Minneapolis- St. Paul International Airport
is another major destination between these two points, with two stations at Lindbergh
Terminal and Humphrey Terminal. Fare between these two airport terminal destinations
is provided free of charge to those needing to make connecting flights while inside of the
airport.
The Hiawatha line serves major residential neighborhoods between Fort Snelling
Station and Cedar-Riverside Station, this area will be the focus this paper on the social
and economic impacts of the Hiawatha line (Map 2).

33
Map 2. Hiawatha line study area single-family dwellings

Methodology
This paper presents two different sets of methods for assessing the social and
economic impact that light rail transit stations have on surrounding neighborhoods. This
section of the paper will be broken down into the two respective elements that constitute
this paper for the greater sense of logic in its presentation.
The data for this study is provided from the following:
U.S. Bureau of the Census, 2000 Decennial Census of Housing and Population
U.S. Bureau of the Census, 2005-2009 American Community Survey
U.S. Bureau of the Census, 2006-2010 American Community Survey
U.S. Bureau of the Census, Topologically Integrated Geographic Encoding
and Referencing products
City of Minneapolis Assessors Office
City of Minneapolis Geographic Information Systems Business Service
Minneapolis Metropolitan Council MetroGIS
Assessing the Social Impact
Previous research has used single socioeconomic measures, such as income or
poverty level, to describe transit stations proximity effect on surrounding neighborhoods.
Evaluation of the transit station impacts has utilized census tracts as the primary scale

35
of analysis in statistical studies. While the use of census tracts as surrogates for
neighborhoods has had a history in the social sciences (Park, 1916 and Suttles, 1972) the
use of block-group can provide researchers with a more detailed statistical picture of the
effects of proximity to transit stations. The uses of single-variable measures do not
provide a comprehensive picture of the socioeconomic characteristics of a particular area.
The goal of this paper was not to develop a new index of measuring the
socioeconomic conditions, but to use an existing composite socioeconomic index to
better determine the impact a transit station has on the surrounding areas social
characteristics. This study selected the Modified Darden-Kamel Composite
Socioeconomic Index as the measure of socioeconomic conditions in a neighborhood
because of index’s performance in evaluating disparities between neighborhoods
(Darden, et al., 2009). The Darden-Kamel Composite Index was modified to be used at
the block-group level instead of the tract level, and variables were changed slightly to
match new variable definitions the U.S. Census Bureau enacted in 2010.
The modified Darden-Kamel Composite Index used in this study incorporates nine
variables to calculate a Composite Socioeconomic Index (CSI) which are defined as
follows:
Percentage of residents with university degrees. This is the percentage of the
population 25 years and older with at least a bachelor’s degree.
Median household income. This is the median household income of the total
family members.
Percentage of managerial and professional positions. This is the percentage of
workers sixteen years and older at the top of the occupational hierarchy based on

36
the occupational classification system used by the U.S. Bureau of the Census in
2000 and 2009. In 2010, the percentage of management, business, science, and
arts occupations was used to reflect the change in the occupational classification
system.
Median value of dwelling. This is the median value of the specific owner-
occupied housing units.
Median gross rent of dwelling. Median rent is the contract rent plus estimated
average monthly costs of utilities.
Percentage of homeownership. This is the percentage of all housing units that are
owner occupied.
Percentage below poverty. This is the percentage of all individuals below the U.S.
poverty threshold at the time the time recorded.
Unemployment rate. This is the percentage of all civilians sixteen years and older
who were looking for work. For the 2005-2009 and 2006-2010 American
Community survey, the unemployment rate for census tracts were coded for each
block-group due the unavailability of this data at this scale.
Percentage of households with vehicles. This is the percentage of households with
a vehicle available.
The modified Darden-Kamel Composite Index sorts and ranks respective Urban
Rapid Transit Area’s block groups according to their overall socioeconomic position
(SEP). The Composite Socioeconomic Z-score Index was calculated using the following
formula:

37
∑
where represents the composite socioeconomic Z-score index for block group i, the
sum of Z scales for the SEP variables j, relative to the Urban Rapid Transit Area SEP;
URTA represents Hennepin County, Minnesota; k represents the number of variables in
the index; represents the j th SEP variable for a given block group I; represents
the mean of the j th variable in the Urban Rapid Transit Area; and represents the
standard deviation of the j th variable in the Urban Rapid Transit Area.
The z-scores for the original variables that characterized the block groups were
calculated to standardize the contribution of each variable to the Composite
Socioeconomic Index. This was calculated by subtracting the mean value of the variable
for the block group from the mean value of the variable for the entire Urban Rapid
Transit Area. Then This value is divided by the standard deviation of the specific variable
for Urban Rapid Transit Area. To ensure that percentage below poverty and
unemployment rate captured a depreciating effect on the composite score for each block
group, these values were multiplied by -1 before being added to the composite index.
Block groups which did not include values for all of the variables were eliminated from
inclusion, with the exception of when median gross rent was $0 where owner-occupied
housing for the same block group equaled 100%.
These values were then aligned with the appropriate Federal Information
Processing System (FIPS) number where they were input into GIS for spatial analysis.
Around each transit station within the respective Urban Rapid Transit Area, 0.25, 0.5, and

38
1.0 mile buffers were drawn around them to intersect the appropriate data at the correct
time and space (i.e., represents 2000, represents 2005-2009, and represent
2006-2010). Using a spatial-temporal analysis technique, a one-way ANOVA test was
then performed to determine the extent of the change of the mean values across time
(2000, 2005-2009, and 2006-2010) and across space (0.25, 0.5, and 1.0 miles). This
analysis is presented in the following hypothesis:
H0: The proximity to transit stations does not influence the socioeconomic position of
transit neighborhoods.
H1: The proximity to transit stations does influence the socioeconomic position of transit
neighborhoods.
However, using this type of analysis will only help the researcher determine if
there is a statistical significant relationship occurring that is beyond random chance. If the
spatial-temporal analysis confirms a significant relationship, an analysis using the 2006-
2010 Composite Socioeconomic Index will be used to build a generalized linear
regression model.
Using ordinary least squares regression, the following function will be used:
S = f (Pr, H, L, N)
Where the dependent variable S is the Composite Socioeconomic Index value using the
2006-2010 American Community Survey. There are 4 vectors in the function, which are:
Pr, the vector of variables that measure the proximity of properties to the transit stations;
H, the vector of variables that describe property characteristics; L, the vectors that
measure location amenities; and N, a vector of variables that describe neighborhood
characteristics.

39
Station Proximity (Pr). This measures the distance (in feet) from each residential
parcel to the nearest transit station. This measure consists of two methods: straight
line and network distance. The straight line distance is the “crow-flight” distance
from the parcel to the transit station, while the network distance is the distance
using the existing street grid to the transit station.
Property characteristics (H). These are the attributes to single-family residential
type dwellings within the study area. This includes lot area, age of house, number
of bedrooms, number of bathrooms, and number of fireplaces. Dichotomous
variables indicate presence of a basement, detached or attached garages. Parcels
which did not contain values for all of these attributes were eliminated from the
study.
Location amenities (L). These attributes include variables that describe city-wide
access, and the parcels proximity to these. This includes the proximity to the
central business district, proximity to the nearest park, and distance to limited-
access highway facilities.
Neighborhood characteristics (N). These variables include neighborhood
characteristics, including property crime rate, and violent crime rate.
Because the independent variables possess various units of measurement, to assess
their collective impact on the dependent variable, the standardized partial regression
coefficient was used for each independent variable to assess their impact on the
dependent variable.
40
Assessing the Economic Impact
In order to assess transit station influence on surrounding property values alone,
the following semi-logarithmic hedonic regression model is used:
Where the dependent variable P is the natural log of the assessed property value in U.S.
Dollars. There are four vectors in the function, which are: Pr, the vector of variable that
measure the proximity of properties to the transit stations; H, the vector of variable that
describe property characteristics; L, the vectors that measure location amenities; and N, a
vector of variables that describe neighborhood characteristics.
Station Proximity (Pr). This measures the distance (in feet) from each residential
parcel to the nearest transit station. This measure consists of two methods: straight
line and network distance. The straight line distance is the “crow-flight” distance
from the parcel to the transit station, while the network distance is the distance
using the existing street grid to the transit station.
Property characteristics (H). These are the attributes to single-family residential
type dwellings within the study area. This includes lot area, age of house, number
of bedrooms, number of bathrooms, and number of fireplaces. Dichotomous
variables indicate presence of a basement, detached or attached garages. Parcels
which did not contain values for all of these attributes were eliminated from the
study.
Location amenities (L). These attributes include variables that describe city-wide
access, and the parcels proximity to these. This includes the proximity to the

41
central business district, proximity to the nearest park, and distance to limited-
access highway facilities.
Neighborhood characteristics (N). These variables include neighborhood
characteristics, including property crime rate, and violent crime rate.
Because the independent variables possess various units of measurement, to assess
their collective impact on the dependent variable, the standardized partial regress
coefficient was used for each independent variable to assess their impact on the
dependent variable.

Findings
The social impact of proximity to Hiawatha light rail transit stations
The initial results of converting several independent measures of social
characteristics to a composite index showed that a majority of the higher SEP
neighborhoods resided in the southeastern section of the study area near the 38th
and 46th
Street stations. Most of the lower SEP neighborhoods resided in the northwest section of
the study area near the Franklin Avenue and Lake Street stations. Most of the higher SEP
neighborhoods surround the southern section of the study area and the eastern section of
the study area, which are comprised of several local and regional parks to the south, and
the Mississippi River to the east. Many of the lower SEP neighborhoods of the northwest
section of the study area, which reside closer to the I-35W corridor t forms a physical
boundary to the west of the study area (see Map 3).
Initial analysis of the spatial and temporal socioeconomic characteristics of
neighborhoods within close proximity of transit stations was performed using 3 common
variables that describe social characteristics: education (percent of the population 25
years or older with a bachelor degree of higher), occupation (percent of workers 16 years
and older in management and professional positions), and income (median household
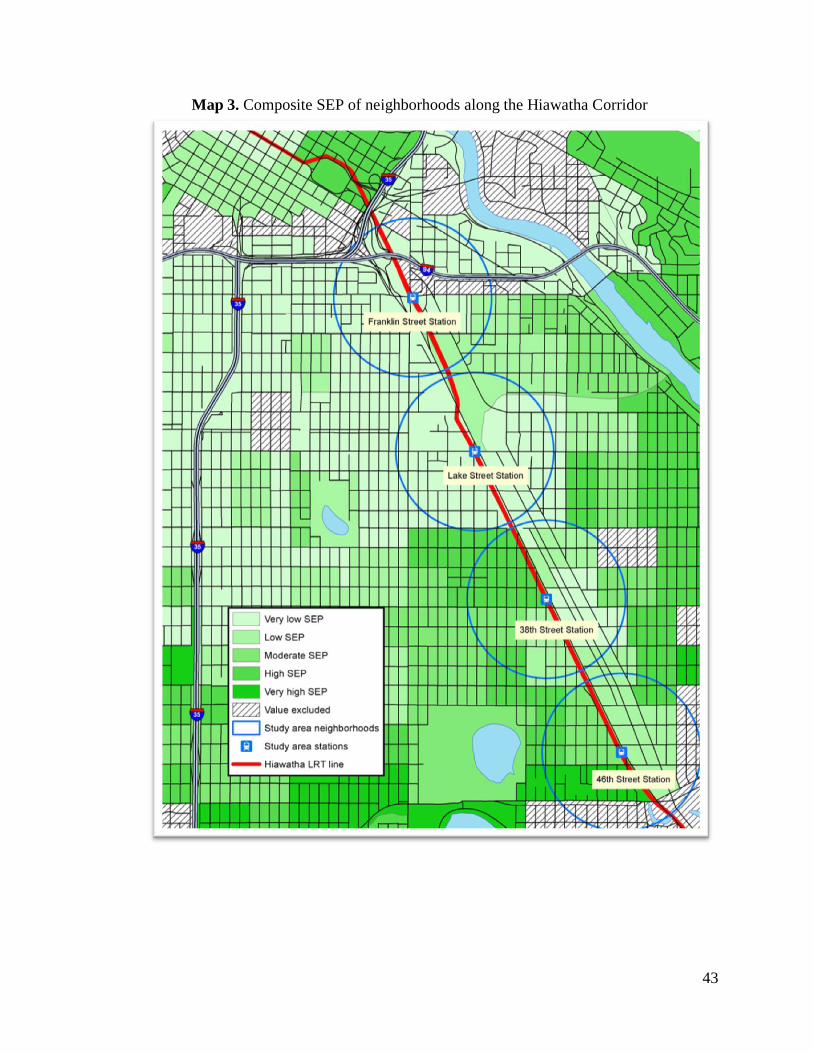
43
Map 3. Composite SEP of neighborhoods along the Hiawatha Corridor

44
income). When analyzing education, no statistical significance was found at the 0.25 and
0.5 mile factors. However a statistically significant score of 0.011 was found at 1.0 mile.
At 1.0 mile, educational attainment was found to increase from 2000 to 2010
(Figure 3). When analyzing occupation and income, no statistical significance was found
to be present at any of the 0.25, 0.5 or 1.0 mile factor levels.
Figure 3. Temporal analysis of educational attainment
Education, occupation, and income were also analyzed spatially using time as
factors. The spatial analysis was found to be more statistical significance than the
temporal analysis.
In Minneapolis, when analyzing education, statistical significance was revealed
between education and proximity to light rail transit (LRT) stations at the p < 0.05 level
for the respective factor of 2000, 2005-2009, and 2006-2010. In addition, the author
found that as the distance to the LRT stations increased the percentage of residents with
bachelor degrees or higher decreased (Figure 4).
When analyzing the percentage of managerial and professional occupational
within proximity to LRT stations, with factor levels of 2000 and 2005-2009, there was no
statistical significance spatially, however at the 2006-2010 factor levels, there was a

45
Figure 4. Spatial analysis of education
statistical significance of p < 0.05. Additionally, the author found that as distance
increased from the LRT station, the percentage of population in managerial and
professional occupations decreased (Figure 5).
When analyzing income at the 2000 factor level, there was no statistical
significance when ran against distance from transit stations. However, at the 2005-2009
and 2006-2010 factor levels, statistical significance of p < 0.05 was found. In addition,
the author found that income decreased as proximity from the LRT stations increased
(Figure 5).
Figure 5. Spatial analysis of occupation (left) and income (center and right)
Social characteristics are the sum of a several different variables, and individual
attributes such as income alone or education alone often do not realistically represent the

46
population’s socioeconomic position. This study utilized a composite socioeconomic
index score to spatially and temporally analyze social conditions in the same method used
to compare baseline socioeconomic conditions previously.
When analyzing the changes across time and using distances of 0.25, 0.5, and 1.0
miles as factors, the analysis found that no statistical significance when using a composite
measure of socioeconomic position. This was in contrast to some marginally statistical
significance that was found when utilizing base socioeconomic position characteristics at
the p < 0.10 level. However, research should continue to analyze temporal changes in
socioeconomic position as not enough time may have passed since construction was
finished on the Hiawatha line in late 2004.
Statistical significance was found when analyzing the spatial changes of
proximity to transit stations using the three time periods as factors (2000, 2005-2009, and
2006-2010).
The author found encouraging results using spatial analysis, where statistical
significance of p < 0.05 for all factors was discovered. The spatial analysis found an
identical appreciating SEP as distance to LRT stations increased (see Figure 6). This was
in sharp contrast to baseline socioeconomic characteristics analyzed previously for
Minneapolis.
With encouraging results in hand, a regression model of the 2006-2010
Composite Socioeconomic Index was built with several built environment characteristics.
Because the American Community Survey collects data over a 5-year period, it was
impossible for the author to get data that was collected at the same time period for
explanatory model characteristics. Because of this, 2010 data collected by the
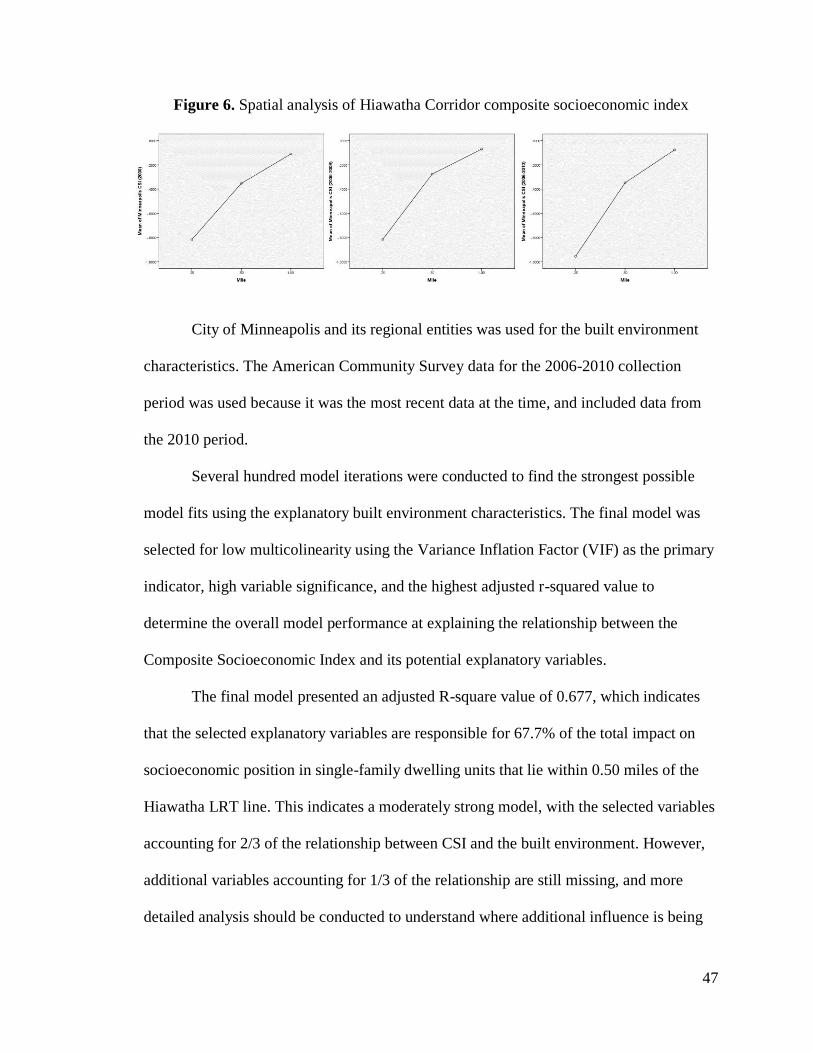
47
Figure 6. Spatial analysis of Hiawatha Corridor composite socioeconomic index
City of Minneapolis and its regional entities was used for the built environment
characteristics. The American Community Survey data for the 2006-2010 collection
period was used because it was the most recent data at the time, and included data from
the 2010 period.
Several hundred model iterations were conducted to find the strongest possible
model fits using the explanatory built environment characteristics. The final model was
selected for low multicolinearity using the Variance Inflation Factor (VIF) as the primary
indicator, high variable significance, and the highest adjusted r-squared value to
determine the overall model performance at explaining the relationship between the
Composite Socioeconomic Index and its potential explanatory variables.
The final model presented an adjusted R-square value of 0.677, which indicates
that the selected explanatory variables are responsible for 67.7% of the total impact on
socioeconomic position in single-family dwelling units that lie within 0.50 miles of the
Hiawatha LRT line. This indicates a moderately strong model, with the selected variables
accounting for 2/3 of the relationship between CSI and the built environment. However,
additional variables accounting for 1/3 of the relationship are still missing, and more
detailed analysis should be conducted to understand where additional influence is being

48
generated in the study area (Table 1).
When comparing the standard residuals of the model to the model probability, the
fitted curve was normal (see Appendix A: CSI histogram of standard residuals). This
indicates that the model is not biased in any particular direction. This was further
confirmed by analyzing the Jarque-bera statistics which did not indicate statistical
significance (see Appendix B: CSI Generalized regression model diagnostics). As a final
test, the standard residuals were plotted, which revealed some structure, but no structure
suggesting that a non-linear model was ideal over a generalized linear model (see
Appendix C: CSI residuals plot and Appendix D: CSI Standard deviation map).
The final model indicated that parcel lot size, land-value, violent crime, and
access to transportation were important variables. However, neither this model, nor any
of the model iterations returned any statistical significance in the relationship between the
straight-line or network distance to Hiawatha LRT stations in the study area. The parcel
level variables, lot size and land value, indicated significant associations with composite
socioeconomic index. The size of the parcel lot had a negative contribution to
socioeconomic position, indicating for every square foot decrease in lot size was
associated with a decrease of .000957 to the composite socioeconomic index.
Violent crime, specifically instances of aggregated assault in neighborhoods, had
the most influencing effect on composite socioeconomic index. The negative relationship
indicates instances of violent crime, specifically aggravated assault, in neighborhoods can
decrease the CSI value for the area by -0.18. .
Table 1. Model summary of regression on Composite Socioeconomic Index
Model R-square Adj. R-square Observations
2010 CSI Model 0.677 0.677 3,698

49
The final variable that returned significant results was the relationship between
composite socioeconomic index and distance to limited-access highway facilities that
surround the study area. Several distance measures to multiple limited-access highway
facilities were analyzed, with the 45th
and 47th
street ramps to I-35W generating the most
significance (Table 2).This revelation indicates that there is some relationship between
socioeconomic position and transportation access, with proximity to highway facilities
negatively affecting socioeconomic position. Land-value was the only positive
contribution to socioeconomic position, with increases in land-value resulting in
increases in socioeconomic position. All variables reported a variance inflation factor less
than 7.5, indicating low levels of multicolinearity between each of the independent
variables.
The economic impact of proximity to Hiawatha light rail transit stations
The economic impact of the Hiawatha light rail transit line focuses on the impact
to single-family dwelling total estimated values that are within 0.50 miles of a station.
The total estimated value consists of the land and building value of the individual parcel.
The actual figures used in the hedonic regression model are the natural log of the total
estimated value, which will help reduce the bias associated with large values in
Table 2. Parameter estimates of regression on Composite Socioeconomic Index
Variable Coefficient Std. error Sig. VIF
Lot size (ft ) -0.000957 0.000040 0.000 1.4895
Land value 0.000118 0.000004 0.000 1.8170
Neighborhood aggravated assaults -0.182840 0.004300 0.000 1.3210
Distance to I-35W- 45th
& 47th
Street ramps -0.003496 0.000085 0.000 1.0207

50
regression modeling. This analysis provides an insight into the temporal changes in
economic influence that the Hiawatha line has had on single-family residences within the
study area. The analysis looked at two time periods: 2005 and 2010. The year 2005 is
significant in that it represents the first full year of operation of the Hiawatha light rail
line. The total estimated value of the property is the assessed value of the property for the
analysis year. This is the expected value of the property in a fair-market, as opposed to
the sale value being a snap-shot of the value at the time the property was sold. The
hedonic properties of this analysis focused on station proximity values (straight-line and
network distances), property characteristics, location amenities, and neighborhood
characteristics. The first step in the modeling process was to identify the base-model
characteristics. These characteristics are composed of individual property components
that are expected to have the most influence on the total estimated value of the property.
This statistical technique only highlights the relationships and extent of the relationship
between variables, and does not necessarily prove causation. This study indicates that
specific characteristics of properties, such as the network distance to the Hiawatha line,
has a strong association with the total estimated value of the single-family properties. The
results from this regression can be interpreted to mean that the market, en mass, has
responded to the Hiawatha line by awarding higher values to properties within close
proximity to a transit station. Furthermore, it can be demonstrated that the economic
value of the Hiawatha line has continued to increase as evidenced by an increasing
association between 2005 and 2010, even though the process of causation is uncertain.
The network distance was chosen as the final measure of transit station proximity.
The study area consists mostly of the traditional street grid pattern of the early 1900’s,

51
and the author assumed that the sidewalk network was adjacent to the street network.
Two model types were run, one with straight distance measures to transit stations and one
with network distance measures to transit stations. In all model iterations when using the
two distance measures independently of each other, higher overall model results were
found (and the standardized parameter estimates) of network distance to transit stations
were higher in 100% of cases.
In 2005, as expected, the model indicated that property characteristics had the
most influence on the total value of the structure. The square feet of the first floor, and
especially the second floor, contributed the most value to the structure. The total lot size
was the third highest parameter estimate that contributed positively to total value, with
the number fireplaces, finished basement square feet, and number of ¾ bathrooms
contributing to total value respectively. The age of the structure contributed negatively to
the total value of the home.
Neighborhood amenities appeared to also contribute to the total value of the
structure, with instances of all violent crimes and the number of arsons in respective
neighborhoods contributing negatively to the total value of the property.
While this report spatially defined the study area neighborhoods as within 0.50
miles of a transit station, it recorded two transportation access options. Several model
iterations using various limited-access freeways access within the region were analyzed.
After eliminating variables due to multicolinearity, the 45th
and 47th
street on-ramps to I-
35W recorded significant contribution to the total value of the home. This finding is
significant, as it indicates that vehicular access to the interstate system is valued higher in
the market, than access to the Hiawatha light rail (Table 3).

52
In 2010, the model returned many of the same associations that were indicated in
2005, with a few notable exceptions. Minnehaha park reported a significant increase in
positive contribution to total estimated value, a difference from the contribution reported
in 2005. More value was placed on proximity to the Minneapolis Central Business
District, but this contribution was still negative in nature to total estimate value. Of
significant interest to this paper is the revelation that from 2005 to 2010, the market value
of proximity to Hiawatha light rail transit stations increased slightly, indicating that the
market is placing more value on access to rapid transit. However, the access to 45th
and
47th
street on-ramps of I-35W more than doubled during this timeframe, highlighting the
ever increasing importance of vehicular access to the I-35W corridor in Minneapolis
(Table 3).

53
Table 3. Single-family homes regression of the natural log of total estimated value
2005
Variable name
Standard
Coefficients
Sig. beta
Constant 0.000
Network distance to nearest Hiawatha LRT station 0.080 0.000
Structure age -0.191 0.000
Ground floor square feet 0.285 0.000
Second floor square feet 0.521 0.000
Finished basement square feet 0.095 0.000
Number of ¾ bathrooms 0.037 0.000
Number of fireplaces 0.132 0.000
Parcel lot square feet 0.103 0.000
Total number of all violent crimes -0.046 0.003
Total number of arsons -0.069 0.000
Straight distance to Minnehaha park -0.512 0.000
Straight distance to Minneapolis Central Business District -0.491 0.000
Straight distance to I-35W 45th
and 47th
Streets ramp 0.167 0.000
Adjusted R² 0.637
2010
Constant 0.000
Network distance to nearest Hiawatha LRT station 0.085 0.000
Structure age -0.132 0.000
Ground floor square feet 0.281 0.000
Second floor square feet 0.467 0.000
Finished basement square feet 0.115 0.000
Number of ¾ bathrooms 0.051 0.000
Number of fireplaces 0.106 0.000
Parcel lot square feet 0.104 0.000
Total number of all violent crimes -0.354 0.000
Total number of arsons -0.067 0.000
Straight distance to Minnehaha park 0.204 0.000
Straight distance to Minneapolis Central Business District -0.263 0.000
Straight distance to I-35W 45th
and 47th
Streets ramp 0.380 0.000
Adjusted R² 0.680

Discussion and conclusion
The utilization of Analysis of Variance (ANOVA) in the study is significant only
in that it will determine if a pattern has developed that could not be attributed to random
chance. Results were also consistent in that when using a distance of 1.0 mile as the
factor against all time periods for the variable education, the ANOVA test determined
that there was a marginally significant pattern occurring. As time increased, the
percentage of residents with bachelor degree’s increased as well within a 1.0 proximity of
transit stations. With the type of analysis performed, it is impossible to determine if this
was a result of the transit station proximity impacts, or other neighborhood improvements
that may have caused a shift in education concentration.
The spatial analysis of transit neighborhoods provided much more encouraging
results than the temporal analysis of transit neighborhoods. Each of the neighborhoods
recorded decreasing values as distance increased from the transit station before
construction, but also in the years following the completion of the Hiawatha LRT.
Hiawatha line neighborhoods saw decreasing percentages of education,
managerial and professional occupations, and median household income were found as
distance increased from transit stations, only the percentage of residents with bachelor
degrees or higher saw increases in concentrations within the 0.25 mile buffer from the
transit station. Managerial and occupational positions were only significant for the 2006-
55
2010 factor, and household income showed a slight decrease between 2005-2009 and
2006-2010 factors, suggesting that other regional and local forces may be contributing to
a change in neighborhood socioeconomic position. Additionally, concentrations of
managerial and professional positions suggest a more skilled workforce is residing within
close proximity to transit stations.
When utilizing a composite socioeconomic index (CSI) of socioeconomic
position, the social impact analysis found results that were largely different than using
basic characteristics of socioeconomic position independently. There was no statistical
significance when conducting a temporal analysis using distance as the factor. This may
be attributed to the relatively short period in time that has passed since the completion of
Hiawatha line, when this is coupled with the worst economic recession in U.S. history,
residents may be unwilling to relocate with so much market uncertainty.
Results were found that were largely opposite of utilizing basic characteristics of
socioeconomic position independently. The social impact analysis found a positive
correlation when using CSI as the method of determining neighborhood socioeconomic
position in that as distance increased from the transit station, the CSI value also
increased. This was found to have occurred regardless of the time factor that was used to
run the ANOVA test against.
The relationship between socioeconomic position and the built environment
factors raise several interesting points about the emerging analysis of social impacts and
transportation. While it is not surprising to see that land value provides a net benefit to
socioeconomic position, the revelation that access to high infrastructure provides a net
negative to socioeconomic position. Additionally, the fact that there was no observed

56
significance between proximity to LRT stations and socioeconomic position raises an
interesting question proposed in the beginning of this paper. Does access to transportation
provide an increase in social position? This research finds that transportation access
cannot provide immediate benefits to socioeconomic position, and the observed results
from this research cannot confirm Farrington’s premises that lack of transportation access
excludes those of a lower SEP from important life chances. This is further demonstrated
by the fact that the highway accessibility measure returned a negative contribution to the
composite index, indicating that closer access to this I-35W was contributing to a decline
in socioeconomic position.
This leads to the second question proposed in the determination of the social
impacts of transportation facilities. Are nuisance factors from transportation facilities
effecting social position? This research finds support in this area of transportation and
social impact. Previous research has confirmed that highway noise can lead to significant
health related quality of life reductions (Dratva, et al., 2010). While further data may be
necessary to confirm the presence of significant nuisance effects, this would seem a
logical hypothesis as to the reason why this transportation facility is having a negative
contribution to socioeconomic position. It should be noted that this study area included
parcels that were within close proximity to LRT facilities, and the highway transportation
measure was taken as an alternative transportation accessibility measure.
Further research is recommended to include more health and nuisance related
measures to determine the extent that these factors could be affecting socioeconomic
position.

57
This research is by no means a closed book on the social impact effects of
transportation facilities. This area of analysis is still very much evolving within the
academic and professional body. Changes in social dynamics are much more difficult and
complex to change than economic dynamics. There could be significant temporal effects
of transportation facilities on social dynamics, and the 5 year study period this research
analyzed may simply not have been enough time to determine if there is an impact
actually occurring or not. Minneapolis may not be an ideal candidate location to analyze
the socioeconomic impacts of transportation, and a city with a robust, more established
transportation system may be a better candidate to perform a significant longitudinal
study. Nevertheless, this research has demonstrated that there is an association between
the built environment and socioeconomic position occurring, and there is evidence that
transportation may be a factor in the social justice debate.
There are several interesting results from the analysis of the economic impact of
the Hiawatha LRT on single-family dwelling units along this specific corridor. This
research found that in 2005, for every meter closer to a LRT station within 0.50 miles the
value of the dwelling increased by $1.08. This was found to have increased slightly by
$0.01 in 2010, accounting for a $1.09 increase for every meter closer to an LRT station
for single-family dwelling units within 0.50 miles. The effect of Hiawatha LRT stations
confirms existing literature that there is indeed an economic impact occurring between
LRT and property-values, however, this impact remains small, accounting for just under
$1,000 for properties within the closest proximity to the LRT station.
It is interesting to note that the impact of limited-access highway facilities
accounted for a greater impact. For 2005, for every meter closer to the I-35W 45th
& 47th

58
street on-ramps, there was a $1.18 increase in property value, up to 0.50 miles from an
LRT station. In 2010, this impact increased significantly to $1.46. It is generally difficult
to assess what construction projects may have influenced the dramatic rise in economic
impact on the I-35W corridor from 2005 to 2010. One possible source of this greater
influence is the completion of the Saint Anthony Falls Bridge that had collapsed in 2007
and was subsequently rebuilt in 2008. Another sharp increase in economic impact was the
distance to Minnehaha Park, the location of the Minnehaha Falls and a popular recreation
area in the Twin-cities. In 2005, for every meter closer to the park, there was a rise of
$0.60 for properties within the LRT neighborhood study areas. This impact increased
greatly to $1.23 in 2010 for every meter within the LRT neighborhood study areas. It is
difficult to assess a particular reason why this occurred, and there could be several factors
from crime to construction that could possibly effect this.
Other research has acknowledged that there are significant background effects
that have taken place over the last decade as they pertain to LRT implementation (Golub,
et al., 2012). One major background effect is the financial crisis that occurred between
2007 and 2012, and the associated housing bubble bursting in the years leading up to and
beyond the financial crisis. The placement of the corridor itself is of particular interest,
and in Minneapolis it appears that the intent was to link the Downtown with major
attractions and productions in the area (i.e. VA Hospital, MSP International Airport, and
the Mall of America).
Does LRT have an economic impact on surrounding neighborhoods, and if so
what is the extent of impact? This research found that the presence of LRT has a net
benefit on surrounding single-family dwelling units, and this was found to occur

59
regardless of significant background effects. Although it should be noted that the increase
between 2005 and 2010 was very slight, and this could have been caused by a multitude
of reasons. One the reason of interest why the net increase from 2005 to 2010 is small is a
limitation in the scope of this research. LRT has been found to have significant effects on
commercial properties and spawning Transit Oriented Development projects (Golub et
al., 2012). Single-family dwelling unit are usually not what is envisioned in the standard
typology of TOD development, and the scope of this project, along with the longitudinal
considerations should be expanded to assess the impact on high-density residential,
commercial, and mixed-use properties, along with their new development on vacant land
and land that was of a previous use.
Nonetheless, the results of this study indicated significant public policy benefits in
areas that have a large number of single-family dwellings. The results from this study
indicate that there was a net benefit to single-family dwellings, and that as a result it can
be interpreted that the real-estate market places value on proximity to Light Rail Transit.
As a result, planners should understand the effect that this might have in neighborhoods
that have a large degree of single-family dwellings considering new LRT construction.
By understanding the influence of LRT on neighborhoods, planners can better understand
and take advantage of valuation increases as a result of transit expansion. Increases in
land-valuation in new-LRT corridors can have significant impacts on property
acquisitions for public projects, as well as significant impacts on affordable housing and
future transportation projects.
The impact of LRT has significant effects on affordable housing, as indicated in
the social impact analysis. The initial social impact analysis indicated that land-value had
60
a significant association with socioeconomic position, and it is unlikely that transit alone
provided an increase in SEP. It is much more plausible that any benefits to SEP are the
result of displacement of lower SEP individuals by higher SEP individuals. As a result,
this knowledge underscores the importance for those involved in community
development and affordable housing to become engaged in the process early before land-
valuation results in significant displacement of lower SEP persons.

Bibliography
Bundesamt für Umwelt (BAFU), Bundesamt für Statisik (BFS). Umwelt Report 2007.
Neuchatel und Bern; 2007.
Cervero, R. and Kang, C.D. (2009). Bus Rapid Transit Impacts on Land Uses and Land
Values in Seoul, Korea. U.C. Berkely Center for Future Urban Transport: A Volvo
Center of Excellence, Institute of Transportation Studies, U.C. Berkely.
Chen, H., Rufolo, A., and Deuker, K.J. (1997). Measuring the Impact of Light Rail
systems on Single Family Home Values: A Hedonic Approach with GIS Application.
Center for Urban Studies, Portland State University, Discussion Paper 97-3.
Darden, J., Rahbar, M., Jezierski, L., Li, M., and Velie, E. (2009). The Measurement of
Neighborhood Socioeconomic Characteristics and Black and White Residential
Segregation in Metropolitan Detroit: Implications for the Study of Social Disparities in
Health. Annals of the Association of American Geographers, 100(1), 137-158.

62
Debrezion, G., Pels, E., Rietveld, P. (2007). The Impact of Railway Stations on
Residential and Commercial Property Value: A Meta-Analysis. Journal of Real Estate
Finance Economics, 35, 161-180.
Dratva, J., Zemp, E., Dietrich, D.F., Bridevaux, P., Rochat, T., Schindler, C., Gerbase,
M.W. (2010). Impact of road traffic noise annoyance on health-relate quality of life:
Results from a population-based study. Quality of Life Research, 19(1), 37-46.
Farrington, J.H. (2007). The new narrative of accessibility: its potential contribution to
discourse in (transport) geography. Journal of Transport Geography, 15, 319-330.
Gatzlaff, D.H. and Smith, M.T. (1993). The Impact of the Miami Metrorail on the Value
of Residences near Station Locations. Land Economics, 69(1), 54-66.
Golub, A., Guhathakurta, S., and Sollapuram, B. (2012). Spatial and Temporal
Capitalization Effects of Light Rail in Phoenix: From Conception, Planning, and
Construction to Operation. Journal of Planning Education and Research, 32(4), 415-429.
Hess, D.B. and Almeida, T.M. (2007). Impact of Proximity to Light Rail Rapid Transit
on Station-Area Property Values in Buffalo, New York. Urban Studies, 44(5/6), 1041-
1068.

63
Knight, R.L. and Trygg, L.L. (1977). Evidence of Land Use Impacts of Rapid Transit
Systems. Transportation, 6, 231-247
Loukaitou-Sideris, A. and Banerjee, T. (2000). The Blue Line Blues: Why the Vision of
Transit Village May Not Materialize Despite Impressive Growth in Transit Ridership.
Journal of Urban Design, 5(2), 101-125.
Markovich, J. and Lucas, K. (2011). The Social and Distributional Impacts of Transport:
A Literature Review. University of Oxford, Transport Studies Unit, School of Geography
and the Environment.
Minneapolis MetroTransit. (2010). Before and After Study Hiawatha Light Rail Transit
Line. Metropolitan Council.
Park, R. (1916). Suggestions for the investigations of human behavior in the urban
environment. American Journal of Sociology, 20, 577-612.
Preston, J. and Rajé, F. (2007). Accesibility, mobility and transport-related social
exclusion. Journal of Transport Geography, 15, 151-160.
Ryan, S. (1993). Property Values and Transportation Facilities: Finding the
Transportation-Land Use Connection. Journal of Planning Literature, 13(4), 412-427.

64
Standsfeld, S. Haines, M. and Brown, B. (2000). Noise and health in the urban
environment. Reviews on Environmental Health, 15(1-2), 43-82.
Suttles, G.D. (1972). The social construction of communities. Chicago: University of
Chicago Press.

Appendix A: CSI histogram
CSI Standard Residuals Plot

Appendix B: CSI OLS regression diagnostics

Appendix C: CSI standard residuals plot

Appendix D: CSI standard deviation map