the henry fund - tippie college of businesstippie.biz.uiowa.edu › henry › reports ›...
TRANSCRIPT

THE HENRY FUND
2007 Annual Report November 30, 2007

2
TABLE OF CONTENTS
Letter From the Investment Team 3
Fund Overview 4
Acknowledgments 5
Fund Performance 6
Summary of Transactions 8
Economic Overview 10
Basic Materials 11
Consumer Discretionary 13
Consumer Staples 17
Energy 20
Financials 22
Healthcare 29
Industrials 35
Technology 37
Utilities 43
Telecommunications 44
Statement of Security Holdings 46
Income Statement 47

3
LETTER FROM THE INVESTMENT TEAM DEAR STAKEHOLDERS, To begin, we would like to thank everyone for their continued support of the Henry Fund.
Because of your support, we are able to keep the program successful. In particular, we would like to thank Dr. Todd Houge for his time and
teaching that are so critical to the success of the fund overall. The course is very time consuming and without the countless hours he spent
reviewing our reports and financial models outside of the classroom. We truly appreciate your efforts.
The investment team is also indebted to the Henry Fund’s Advisory Board, a group of
successful alumni who are committed to enhancing the overall experience of the analysts. Your challenging questions and different point of
views create a real world environment when presenting our investment research that makes this a truly unique experience. We very much
appreciate the time taken out of your busy schedules to help us enhance our abilities. Your guidance has continually helped to shape the
direction of the Henry Fund. Marshall Bridges, CFA
Mihail Dobrinov, CFA John Everhart Scott Hassenstab, CFA Dirk Laschanzky, CFA
Kevin Laub, CFA, CPA Keith Mitchell, CFA Marty Nevshemal
Daniela Spassova, CFA We would also like to extend our sincere
gratitude to both Henry B. Tippie and Henry Royer for starting the Henry Fund years ago. You have already made a tremendous impact on
the MBA program and the experiences of the students here, and will continue to do so in the future.
Despite a volatile market, the Henry Fund was able once again to beat the S&P 500. Th is year
was particularly notable, as the Henry Fund returned 11.48% compared with the 6.23% of the S&P, for an outperformance of 525 basis points.
In addition, the Henry Fund was invited to once
again present our investment strategy at the RISE (Redefin ing Investment Strategy Education) Symposium in Dayton, Ohio. The
Henry Fund was again recognized as the number one student run large cap blend portfolio in the nation. This was the second year in a row, and
we believe we have a great chance to win for a third consecutive time at the meeting in 2008.
Once again, we would like to thank everyone who contributed to our success in 2007. Thank you very much! Regards,
THE HENRY FUND CLASS OF 2007 Swapnil Kadu Materials/Industrials
Zhendong Wang Industrials/Discretionary Joel Zehr Consumer Discretionary Justin Steinbruchel Consumer Staples
Clint Hays Energy Frank Fischer Financial Zac McQuistan Financial Brian Perry Healthcare
Brian Douglas Healthcare Chuck Mersch Technology Sridip Mukhopadhyaya Technology
Barkha Punjab i Utilit ies & Telecom

4
Fund Overview
The Henry Fund, named for its two founding benefactors, was established in the spring of 1994 to provide University of Iowa MBA students with a forum to blend academic rigor with real-world portfolio management experience. Henry Royer, Henry Tippie, and the University of Iowa Foundation contributed the initial $50,000 investment that established the Henry Fund.
The Henry Fund is an equity portfolio listed as an outside investment by The University of Iowa Foundation. The Fund is required to meet the same basic performance guidelines as equity accounts in the long-term investment pool of The University of Iowa Foundation. In keeping with these requirements, managers of the Henry Fund seek to achieve the highest level of return while assuming risks similar to those of the S&P 500 index. The Henry Fund team, therefore, recommends a targeted portfolio of stocks from a broad set of industries, investing in well-managed, profitable businesses without unnecessarily exposing the fund to economic or industry risks.
The Fund is divided into three separate accounts: active, passive, and cash. The active account, comprising approximately 95% of the Fund’s assets, currently consists of equity positions in 32 companies. This account represents the primary measurement of the manager’s stock selection ability. The passive account (5%) consists of holdings in the Capital Markets ETF and S&P Index SPDR. The SPDR account is maintained to provide liquidity and minimize cash holdings until a suitable investment can be found. Historically, this account represents approximately 3-4% of the Fund assets. The Henry Fund scholarship payments necessitate that The Fund keep cash in a money market account in order to meet its annual commitment. This account also receives dividends and is used to pay brokerage fees and other expenses incurred during the year.
The managers of The Henry Fund are students in the Applied Securities Management course (6F: 221 and 6F: 222) at The University of Iowa, Henry B. Tippie College of Business. The two-semester course is limited to twelve students. Students are selected by blind review based on a research report application at the end of the fall semester of the first year of the MBA program. The 12 analysts are assigned to one of 10 economic sectors: basic materials; consumer cyclical; consumer services; consumer non-cyclical; energy and utilities; financial services; healthcare; industrials and transportation; technology; and telecommunications. Because of the growing importance of financial services and technology, two analysts are assigned to each of these areas to promote expanded coverage and wider diversification of our holdings. Each manager develops a fully integrated investment review, based on a top-down approach that incorporates an extensive economic, industry, and company-specific analysis. Once the analyst evaluates the value drivers of each industry, he or she researches specific companies for potential investment. Each security is modeled using a variety of valuation techniques including: discounted cash flow analysis (DCF), economic value added (EVA), fundamental multiple analysis, and relative multiple valuation. Fund managers are expected to act as both sector analysts and portfolio managers, providing basic industry research, proposing investment ideas and evaluating the ideas of the other managers. Investment recommendations are presented to the Investment Advisory Committee for review and then voted on by The Henry Fund managers. In addition, the managers perform the administrative tasks of portfolio management, including marketing the fund to outside donors and producing an annual report.
THE HENRY SCHOLAR
A portion of the Henry Fund dividend income supports annual scholarships to MBA students, the recipient of which is called The Henry Scholar. It is approximately $1000 per $100,000 of the value of the portfolio. The scholarship is renewable for a second year based on the student’s academic performance. Thus, $2,000 in scholarship money is transferred annually to the university cash account designated for Henry Scholars. The goals of The Henry Scholar Program are to encourage and prepare students for careers in investments as well as to attract outstanding Henry Fund candidates.

5
Acknowledgments
FOUNDERS Henry Royer Henry B. Tippie Henry Royer attended Colorado College, where he received a BA in 1953. Following college graduation, he became a grain merchandiser with Pillsbury Mills. He joined the Peavey Company in 1957, became Treasurer and a board member of Lehigh Sewer Pipe and Tile in 1961, where he remained until 1965. From 1965 to 1983 Mr. Royer held various positions with First National Bank (Norwest), Duluth, Minnesota. In 1983, he joined Merchants National Bank of Cedar Rapids (Firstar), where he served as chairman and president until August 1994. He subsequently served as president and CEO of River City Bank in Sacramento, California. He is now executive vice president of Berthel Fisher & Company Planning, Inc., Cedar Rapids, Iowa. Wherever he has been, Henry Royer has been active in both business and civic organizations. While in Iowa he served on the Board of Visitors of the College of Business Administration. Currently, he is on the boards of IES Industries, CRST International, Inc., Berthel Growth & Investment Trust, River City Bank, Families First, Inc., United Way, the Sacramento Symphony, the Sacramento Tree Foundation and the Sacramento Commerce and Trade Organization. Henry B. Tippie grew up in Belle Plaine, Iowa, and, after serving in the Army Air Force, earned a BSC in accounting from The University of Iowa in 1949. He began his forty-nine year professional involvement with Rollins in 1953, starting by balancing the small firm’s checkbook. Today, four Rollins companies trade on the NYSE and one on the Amex. In addition, Tippie is still involved with Rollins enterprises, serving on the board of directors for all five publicly traded companies and as chairman of the board for two companies. He runs several of his own ventures from his offices in Austin, Texas. Tippie has been a tremendous asset to The University of Iowa, endowing a chair in business administration, and several professorships in the business school. He also has endowed two two-year accounting scholarships, and, for graduates of Belle Plaine Community Schools, two four-year scholarships. To help fund the completion of the Pappajohn Business Administration Building, he donated funds to build a 175-seat auditorium, a student lounge and Pat’s Diner, named for his wife, Patricia. For his numerous contributions, Tippie received The University of Iowa’s Distinguished Service Alumni Award and Outstanding Accounting Alumni Award. In 1996 he was a recipient of the nationally prestigious Horatio Alger Award. In February 1999, Tippie made a major commitment to the College of Business to support its students and faculty. In recognition of his past, present, and future support that will exceed $30 million, the college was named the Henry B. Tippie College of Business. Mr. Tippie was awarded the Hancher-Finkbine Alumni Medallion in 2002.
ACADEMIC ADVISORS Todd Houge, Ph.D., CFA
BROKERAGE SERVICES E*Trade
INVESTMENT ADVISORY COMMITTEE
John Everhart Baird Investment Management Scott Hassenstab, CFA AEGON USA Investment Management, Inc. Dirk Laschanzky, CFA Principal Global Investors Daniela Spassova, CFA Principal Global Investors Mihail Dobrinov, CFA Principal Global Investors

6
Kevin Laub, CFA, CPA Dean Investment Management Keith Mitchell, CFA Embarq Marty Nevshemal Sprint Nextel Marshall Bridges, CFA HNI Corp.
Fund Performance All together, our fund returned 10.67% in 2007 compared to a dividend adjusted return in the S&P 500 index of 5.13%. Within the portfolio we had 14 securities (average return of 33.90%) that outperformed the market and 19 securities which underperformed versus the benchmark (average return of -13.21%). The fund surpassed the $550,000 mark and will soon receive and extra $1,000,000 from the University of Iowa Foundation. Following this section is a brief narrative summary of individual sector performance. An expanded look at each sector can be found later on in the report. It is important to note that the majority of the content in this report was written following the November month end close. Therefore, any
reference to YTD or annual performance shall represent the time period January 1, 2007 through
November 30, 2007. Additionally, the “Key Stock Statistics” data that is shown in the detailed sector
sections has been prepared as of November 30, 2006 with the exception of the sector and security portfolio
positions which are based on closing prices as of December 31, 2007.
0.0%
20.0%
40.0%
60.0%
80.0%
100.0%
CEDC BHP CRL SLB FPL
2007 Top Performers
-30.0%
-25.0%
-20.0%
-15.0%
-10.0%
-5.0%
0.0%
ACAS LOW AKAM CMCSA BAC
2007 Worst Performers

7
Basic Materials:
The materials sector has a 4.66% weight in our portfolio as compared to 3.20% in the S&P 500 Index, representing a relative overweight position of 45.62%. The S&P Materials Index was up 22.22% outperforming the S&P 500. The Fund’s sector holdings Alcoa and BHP Billiton returned 1.0% and 78.8% respectively. Strong performance from BHP Billiton lead to the significant overweight position in the sector. We maintained our positions in the securities as no trades were conducted.
Consumer Discretionary:
The consumer discretionary sector has a 8.15% weight in our portfolio as compared to 9.20% in the S&P 500 Index, representing a relative underweight position of -11.91%. The S&P Discretionary Index was down -3.45% underperforming the S&P 500 Index. The Fund’s sector holdings Target, Lowe’s, Walgreen’s, Citadel Broadcasting and Walt Disney returned -9.6%, -27.1%, -20.3%, -66.6% and -3.3% respectively. Underperformance in the sector can be attributed to a weakening economy and soft sales results. As a team we decided that underweighting the discretionary sector was prudent in order to minimize losses arising from poor consumer trends. We sold 200 shares of Walt Disney Company and this transaction has returned 8.8% since the trade.
Consumer Staples:
The consumer staples sector accounts for 12.36% of our portfolio as compared to 9.50% in the S&P 500 Index. As a team we decided that the overweight position of 30.10% was appropriate given weakening consumer specific economic indicators. We view our overweight position in the sector as a defensive move to counter a weakening economy. The overall return for the S&P Consumer Staples Index was 8.92% which was below the S&P 500 return. However, all of our securities, Central European Distribution Corp, PepsiCo and Procter & Gamble have outperformed the index returning 80.1%, 24.2% and 15.1% respectively. In May, we purchased an additional 65 PepsiCo shares and this transaction has resulted in a return of 16.3%.
Energy/Utilities:
For the 2nd year in a row the energy sector was the top performer in the S&P 500 Index, with a return of 28.70%. The current weight of the energy sector in the S&P 500 Index is 11.70% and we hold a position of 12.83% which represents relative overweight of 9.66%. The utilities sector in the S&P 500 Index has returned 10.46% outperforming the benchmark. Currently we hold a 4.75% position in utilities, whereas the S&P 500 index weight for utilities is 3.40%, representing a relative overweight of 39.81%. As a whole our energy holdings have performed well with Exxon, Peabody and Schlumberger posting returns of 18.9%, 23.0% and 49.7%. Patriot was the only energy holding which underperformed the benchmark. In the utilities sector FPL Group posted a return of 27.5% outperforming both the S&P 500 index and the sector index. There were two transactions in the sector as we purchased 330 shares of Peabody Energy and sold off 100 shares of Exxon Mobile. The Peabody transaction has provided a return of 23.0% and the Exxon Mobile trade has resulted in a -13.8% return. As a team we felt diversifying our energy holdings to include coal would allow us to tap into growing demand in China.
Financials
Our holdings in the financial sector currently represent 16.1% of the entire portfolio, which is underweighted compared to the S&P index weight of 19.8%. The sector was hit hard this year by the credit crisis with the S&P Financials index having a negative return of 5.0%. Travelers Insurance was our only company holding the outperformed in the sector with a negative return of 1.9%. Meanwhile, American Capital Strategies (-23.3%), Bank of America (-21.7%) and Union Bank of Switzerland (-21.5%) all performed poorly. The fund was also invested in a StreetTracks Capital Market certificate (KCE) that had a negative return of only 0.6%. Lastly, we decided to sell our StreetTracks Regional Banks (KRE) holding in May after a negative return of 5.1%.
HealthCare
The healthcare sector of the fund is slightly overweighted at 12.9% of the portfolio. The sector performed well compared to the S&P Healthcare index return of 6.9%. Leading the way was Charles River Labs with a total return of 47.4%. Johnson & Johnson was the other company that was held through the entire year and had a modest return of 2.5%. The fund decided to sell Pfizer and Community Health Systems in May,

8
with both having slightly positive holding returns of 3.6% and 1.2%. Both transactions have been successful with Pfizer returning 11.5% and Community Health Systems returning 9.6%. They were replaced by Stryker Corporation and Endo Pharmaceuticals. Stryker has performed well with a holding return of 14.0% for its six months in the portfolio. Meanwhile, Endo struggled and has had a negative return of 15.1%.
Industrials
The Henry Fund currently has a relative underweighting of 11.9% in the industrials sector. Our holdings represent 10.1% of the portfolio, compared to the 11.5% weight in the S&P index. The S&P Industrial index was up 18.5% for the year. Eaton Corporation was the best performing stock in the sector with a total return of 19.7%. Federal Express and Norfolk Southern were also in the fund for the entire year. Both companies struggled for the year with Federal Express having a negative return of 11.6% and Norfolk Southern only returning 0.7%. The fund added Hexcel Corporation in May and the stock has performed well. Since the transaction, shares of Hexcel have returned 13.6%.
Technology
The information technology sector had a good year as the S&P Technology index had a total return of 16.3%. The Henry Fund is currently slightly underweighted in the sector with a 15.8% weight. The two companies that the fund held throughout the entire year both performed well. Intel generated a holding return of 29.8%, while Microsoft had an 18.3% return. In May, the fund decided to replace Emulex Corporation with Akami Technologies. The decision to sell Emulex after a holding return of 9.5% has benefited the fund; the stock is down 21.7% since we sold it. However, the decision to buy Akami has not worked out as well, as it has a negative holding return of 20.7%. The fund also exchanged two technology names in early November. After a strong holding return of 24.1%, we decided to sell Logitech International. We replaced it with Oracle Corporation and have seen a negative return of 3.8% since its purchase.
Telecom
The telecom sector had a good year with the S&P telecom index up 11.2% for the year. At the beginning of the year, the only stock we were holding in the sector was Alltel. After a holding return of 12.0%, we decided to sell Alltel in mid June. The stock has increased an additional 5.4% since we sold it. In mid October, we added our only current holding in the sector, Comcast Corporation. Unfortunately the timing wasn’t the best and the stock has had a negative holding return of 23.8%.
Summary of Transactions
# Of Shares owned as of
30-Dec-06 30-Nov-07 Net Transactions Executed
Basic Materials
Sygenta AG 350 0 (350)
BHP Billiton 250 250 - Alcoa 0 220 220
Energy Exxon-Mobil 350 350 - Patriot Coal Corp - 33 33 Peabody Energy Corporation 330 330 Schlumberger 280 280 -
Industrials Eaton Corp 250 175 (75) FedEx 125 175 50

9
Norfolk Southern 190 190 - Hexcel Corporation - 540 540
Consumer Staples PepsiCo, Inc. 255 320 65 Central European Distribution 450 450 - Procter & Gamble 250 250 -
Consumer Discretionary Target 240 240 - The Walt Disney Company 525 325 (200) Lowe’s Companies Inc. 300 300 - Walgreen Company 400 400 - Citadel Broadcasting Corp - 24 24
Health Care Charles River Labs 250 325 75 Endo Pharmaceuticals - 515 515 Johnson & Johnson 330 250 (80) Stryker Corporation - 245 245 Community Health Systems 425 - (425)
Financials American Capital Strategies 340 340 - Bank of America 390 465 75 Union Bank of Switzerland 360 360 - St. Paul Travelers 240 240 - Street Tracks KBW Capital ETF 275 275 -
Information Technology Akamai Technologies - 360 360 Intel 850 850 - Oracle Corp. - 975 975 Microsoft 875 875 - Logitech 600 - (600) Emulex 500 - (500)
Telecommunications
Comcast Corp - 705 705
Alltel 200 - (200)
Utilities
FPL Group 375 375
* During the course of the year, we added and then removed these positions from our
portfolio.

10
Economic Overview
Real GDP Growth Rate
Real GDP grew at an annualized rate of 3.8% in Q2 2007 and 4.9% in Q3 2007. We expect the rate of growth to slow in the fourth quarter and in 2008. Numerous factors are likely to weigh on the economy in the next year, overpowering some of the recent resiliency. The housing slump will continue and lower residential spending is expected along with a related decrease in overall consumer spending. Turmoil in the credit markets and high oil prices should also negatively affect the consumer. Businesses may begin to show some of the negative effects of high energy prices as well. However, we believe corporations are currently in a good position to weather the less favorable conditions. Along with expected Fed loosening, we expect the economy to avoid a recession. For the full year of 2008, we forecast a 2.5% growth rate for real GDP.
Inflation
For the first three quarters of 2007, consumer prices advanced at a rate of 2-3% on a year-over-year basis. In November 2007, the Consumer Price Index was up 4.3% over its level at the same point in 2006. The core CPI grew at just 2.3% over the same period indicating that much of recent inflation can be attributed to soaring energy and food costs. Recent Fed releases indicate that policymakers believe moderate core inflation is likely to persist. We expect overall CPI growth to average around 2.5% in 2008 as growth in the price of oil slows and the economy cools.
Unemployment
For the period from September through November 2007, the unemployment rate has held at 4.7%, up from 4.5% at the beginning of the year. Despite weaker expected business prospects in 2008, corporations have not cut payrolls to a significant degree and job growth continues in the service sector. In 2008, we do not foresee slower GDP growth leading to widespread job losses. We expect the unemployment rate to remain at 4.7 – 4.9% over the next several quarters.
Interest Rates
With both moderate growth expectations and moderate inflation expectations, we believe that interest rates will move little over the next 3-12 months. On Tuesday, December 11th the Fed cut the federal funds target rate by 0.25% to 4.25%. We expect two or three more 0.25% rate cuts before the end of this loosening cycle. We expect mild steepening at the long end of the yield curve to accompany the end of the current cycle in mid 2008. The Fed may begin tightening by early to mid 2009 as certain economic pressures subside.
Oil Prices
Oil prices have surged in 2007. Oil was trading at a level of $60 per barrel at the start of the year and is recently trading close to $90 per barrel. This increase in oil prices has increased the production and transportation costs reducing margins for corporations. With reduced margins, corporations are increasing their prices leading to an increase in inflation. We expect oil prices to remain high around the current $90 per barrel level through the forecast period. We expect oil consumption to outpace the oil supply reducing inventory. Other factors contributing to high oil prices are geopolitical risks and worldwide refining bottlenecks.
Consumer Confidence
Consumer confidence is an indicator of future spending, as increases in confidence about the current and future state of economy usually trigger increases in borrowing and spending. Consumer spending accounts for more than two-thirds of the economy, so it is very important to know how consumers might behave in

11
the near future. The more confident consumers are about the economy and their own personal finances, the more likely they are to spend. With oil prices surging at a very rapid pace, we expect consumer spending to reduce in the short term. However, in long term, owing to a continually low unemployment rate, consumers will regain their confidence.
Foreign Exchange Rates
Foreign exchange rates have great impact on both the operating and financial performance of U.S. export-oriented companies, companies that have significant operations overseas and foreign companies that are currently listed on the U.S. stock market. Imports are becoming more and more expensive reducing margins for U.S. corporations. The recent reduction in interest rates weakened the dollar further. With more reductions in interest rates expected in the future we expect the US dollar to continue to weaken.
Basic Materials 4.67% of the Active Portfolio Analyst: Swapnil Kadu 3.20% of the S&P 500 Index
The current holdings in the basic materials sector are BHP Billiton and Alcoa. Entering 2008 we expect the global economy to be strong and growing at 4.5% and hence we expect the demand for raw materials to be high especially in high growing economies of India and China. BHP has operations in 25 different countries and has a very diverse product portfolio helping to reduce risk and produce stable cash flows. Alcoa is also benefiting from high aluminum prices and consolidation in aluminum industry. The pace with which companies in basic material sector are consolidating would prove to be beneficial for sector as production in hands of few financially stable companies will help industry during troughs and gain full advantage during peaks. Since we expect the US economy to slow down, we have chosen companies with considerable international exposure. We estimate the raw material prices to increase in near future and hence we expect that this sector would outperform the market.
Aluminum prices have increased in near past and we expect aluminum prices to increase owing to increased demand from China, consolidation in the aluminum industry and high prices for aluminum substitutes. Hence, we added Alcoa Inc. to our portfolio during this year. Alcoa Inc. has 75% of revenues from primary and secondary aluminum and remaining 25% from consumer sector where it sells its brands like Reynolds wrap. It also has considerable international exposure and have recently unsuccessfully tried to acquire Canadian aluminum giant Alcan Inc. However, after the unsuccessful bid for Alcan, Alcoa Inc. has now itself become a target for other companies. This makes it a very good holding for our portfolio with medium risk. Alcoa Inc. (AA) 1.42% of Active Portfolio Hold Recommendation
Key Stock Statistics
Price as of November 30,2007 $36.37 Price/Earnings (ttm) 13.49
52-Week Price Range $28.09 - $48.77 Price/Book 1.94
52-Week Return 18.97% Price/Sales 0.99
Market Capitalization (B) $29.85 ROA (ttm) 6.56%
Shares Outstanding (M) 848.15 ROE (ttm) 14.40%
Institutional Ownership 79.40% 2006 EPS $2.59
Beta 1.28 2007 EPS (est.) $2.92
Dividend Yield 1.90% 2008 EPS (est.) $3.07

12
Alcoa Inc., based in New York, New York, is the top producer of primary aluminum, fabricated aluminum and alumina facilities in the world and provides aluminum to the aerospace, packaging, and industrial markets. It also manufactures and markets Reynolds Wrap, Alcoa wheels, and Baco household wraps and supplies closures, fastening systems, precision castings, and electrical distribution systems for cars and trucks. With an employee base of 123,000 in 44 different countries, Alcoa mines bauxite and coal, refines alumina, smelts aluminum, recycles aluminum, produces closures for beverage and food containers, assembles wire harnesses, and generates electricity for its internal use. This Company also produces non-aluminum products such as fiber-optic cables, food service and flexible packaging products and plastic closures. Alcoa also bought two fabricating facilities in Russia in 2005 to enter European and Asian markets. Alcoa sold its automotive fastener unit and specialty chemicals unit in 2004, and its rail unit in 2005, as a part of its divestment strategy. Alcoa operates in 6 business sectors: Flat Rolled Products, Primary Metals, Engineered Solutions, Extruded and End Products, Packaging and Consumer, and Alumina. Twenty Nine percent of Alcoa Inc. revenues come from the alumina and aluminum supply, 23% from packaging and consumer industry, 14% from industrial products, 10% from Aerospace, 9% from automotive, 8% from Building and Construction and 7% from commercial transportation.
Alcoa is expected to over-perform the market based on higher aluminum prices, high demand from aerospace and power generation sectors as well as increased demand for alumina and primary aluminum in the commodity market. Alcoa is taking steps to expand its facilities to meet increased demand; this would help them to tap markets.
BHP Billiton (BHP) 3.20% of Active Portfolio Hold Recommendation
Key Stock Statistics
Price as of November 30,2007 $75.83 Price/Earnings (ttm) 15.52
52-Week Price Range $36.37 - $87.43 Price/Book 7.09
52-Week Return 83.03% Price/Sales 5.35
Market Capitalization (B) $202.04 ROA (ttm) 15.59%
Shares Outstanding (M) 2840 ROE (ttm) 49.77%
Institutional Ownership 5.80% 2007 EPS $4.58
Beta 1.16 2008 EPS (est.) $5.11
Dividend Yield 1.30% 2009 EPS (est.) $5.48
BHP Billiton Ltd is one part of the dual listed BHP Billiton Group based in Melbourne, Australia; the other part BHP Billiton Plc is based in UK. The two firms BHP (Australia) and Billiton (UK) merged in 2001 to create one of the world’s largest diversified resource groups. The group produces petroleum products, aluminum, base metals, diamonds, nickel, iron ore, manganese and coal with operations in Australia, Europe, America, and Africa. The diverse product portfolio accompanied with diverse geographical operations helps BHP to reduce risk and stabilize cash flows. BHP has produced excellent results in the past with a compounded annual growth rate (CAGR) of 27% in revenues in last four years. In the same period, the profits have increased a disproportionate 68% CAGR. For the FY07, BHP recorded revenues of over $47 billion, a 21% growth over FY06 revenues of $39 billion. The profits after taxes have increased to $13.5 billion, a 28% increase from FY06 profits after taxes. BHP has four projects under development in Petroleum sector. Three out of the four are expected to start production in CY07 and one in early CY08. These projects would increase BHP’s oil capacity by 60 million barrels per year. With increasing oil prices this sector is expected to produce good revenues and higher profits. New projects in Nickel, Iron Ore, Diamond in early 2008 and expansion project in Alumina in 2009 are also expected to increase capacity. The steel consumption is expected to increase resulting in higher demands of nickel, iron ore, manganese and metallurgical coal.

13
Consolidation in the Global mining industry and rising base metal demand would benefit BHP in long term. BHP is very active in repurchasing its stock in recent history and has allocated funds for more repurchases signaling that the stock is undervalued.
Consumer Discretionary 7.45% of the Active Portfolio Analyst: Joel Zehr (TGT, WAG, DIS, GPS, ATVI) 8.18% of the S&P 500 Index
Zhendong Wang (LOW)
The Consumer Discretionary Sector includes the following industries: Apparel/Accessories; Appliance & Tools; Audio & Video Equipment; Auto & Truck Manufacturers; Auto & Truck Parts; Footwear; Furniture & Fixture; Jewelry & Silverware; Recreational products; Textile-Non Apparel; Tires and Retail Services. The current Henry Fund Holdings in this sector as of November 30, 2007 are Target (TGT; Discount Retailing), Lowe’s (LOW; Specialty Retailing); Walgreen Company (WAG; Retail Drugstores) and Walt Disney Holdings Co. (DIS; Media Broadcasting & Entertainment). The Consumer Discretionary sector performance is highly dependent on consumer spending, consumer confidence and disposable income. Year-to-date the Fund performance in this segment was mixed, as record oil prices and the emergence of a “credit crunch” reduced discretionary spending power.
Given our projections of high oil prices, continued turmoil in the credit markets, and fears of recession, we anticipate spending to slow down in the first half of the coming year. As such, we have decided to reduce our position in the Consumer Discretionary from market-weight to under-weight. After executing the trades, we expect the following holdings: Target, Walgreens, and Walt Disney.
Target Corp. (TGT) 2.88% of the Active Portfolio HOLD Recommendation
Key Stock Statistics
Price as of November 30, 2007 $60.06 Price/Earnings (ttm) 15.11
52-Week Price Range $50.25 - $70.75 Price/Book 2.75
52-Week Return 3.39% Price/Sales 0.69
Market Capitalization (B) $42.84 ROA (ttm) 8.30%
Shares Outstanding (M) 830.8 ROE (ttm) 18.99%
Institutional Ownership 88.5% 2006 EPS $3.24
Beta 1.05 2007 EPS (est.) $3.66
Dividend Yield 1.10% 2008 EPS (est.) $4.69
Target Corporation (TGT) is the second largest discounter in the U.S., after Wal-Mart, and as of August 04, 2007 it operates 1,537 stores in 50 states. Target is perceived as a middle to up-scale discounter, focusing on middle to high-end consumers, while Wal-Mart’s core customers are more likely to be affected by high gas prices and modest income growth. We believe Target’s fundamentals are attractive, as it has continued to diversify its product line into consumables and commodities. We feel this move positions Target to defend against a stagnant economy. Year-to-date, Target clearly has outperformed Wal-Mart in terms of same-store sales growth rate. After a rally in the stock price, which reached an all-time high of $70.75 per share, Target is currently trading around $60, which implies a 52-week return of 3.39%. We believe Target is a strong holding for several reasons: Target has a unique approach to design which differentiates itself from its peers. The company continues to invest in technology & operations, which keeps it on pace to improve its margins
14
YoY. Its core competency is developing stores within the U.S. and Target has stated it will not look to expand outside of the U.S. for another five years. We believe that Target is positioned well from a macroeconomic standpoint and its strong fundamentals make it a stable holding in our portfolio.
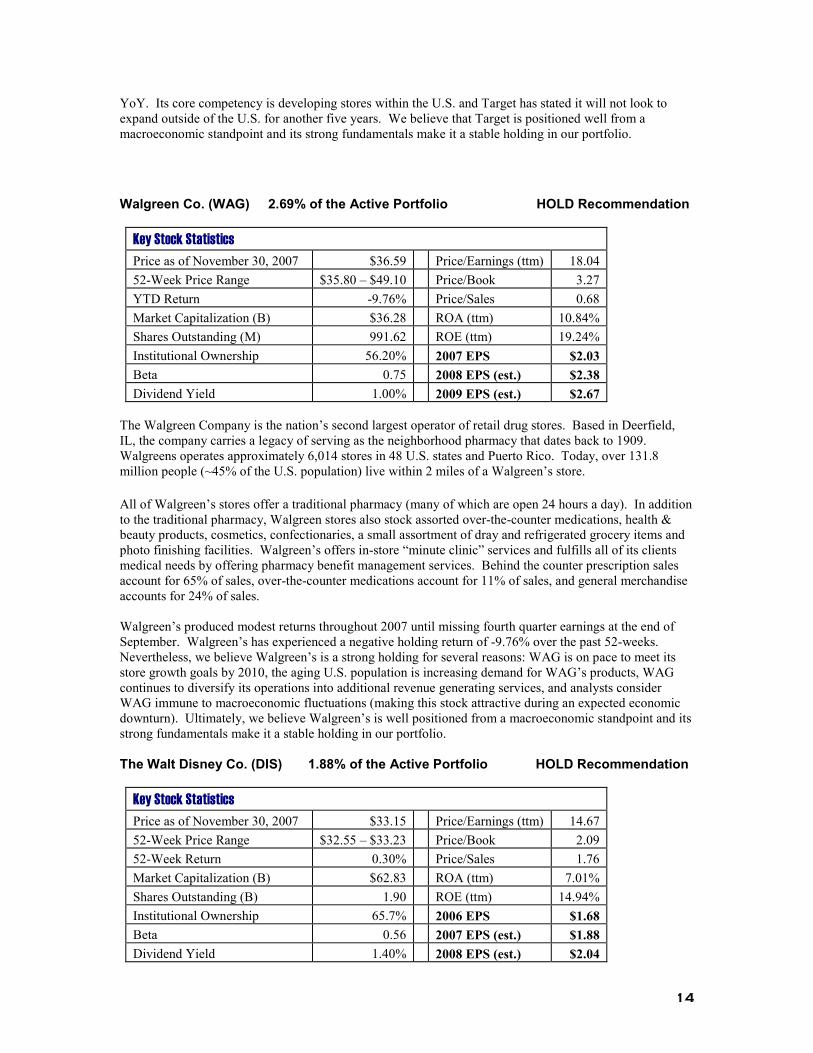
Walgreen Co. (WAG) 2.69% of the Active Portfolio HOLD Recommendation
Key Stock Statistics
Price as of November 30, 2007 $36.59 Price/Earnings (ttm) 18.04
52-Week Price Range $35.80 – $49.10 Price/Book 3.27
YTD Return -9.76% Price/Sales 0.68
Market Capitalization (B) $36.28 ROA (ttm) 10.84%
Shares Outstanding (M) 991.62 ROE (ttm) 19.24%
Institutional Ownership 56.20% 2007 EPS $2.03
Beta 0.75 2008 EPS (est.) $2.38
Dividend Yield 1.00% 2009 EPS (est.) $2.67
The Walgreen Company is the nation’s second largest operator of retail drug stores. Based in Deerfield, IL, the company carries a legacy of serving as the neighborhood pharmacy that dates back to 1909. Walgreens operates approximately 6,014 stores in 48 U.S. states and Puerto Rico. Today, over 131.8 million people (~45% of the U.S. population) live within 2 miles of a Walgreen’s store.
All of Walgreen’s stores offer a traditional pharmacy (many of which are open 24 hours a day). In addition to the traditional pharmacy, Walgreen stores also stock assorted over-the-counter medications, health & beauty products, cosmetics, confectionaries, a small assortment of dray and refrigerated grocery items and photo finishing facilities. Walgreen’s offers in-store “minute clinic” services and fulfills all of its clients medical needs by offering pharmacy benefit management services. Behind the counter prescription sales account for 65% of sales, over-the-counter medications account for 11% of sales, and general merchandise accounts for 24% of sales. Walgreen’s produced modest returns throughout 2007 until missing fourth quarter earnings at the end of September. Walgreen’s has experienced a negative holding return of -9.76% over the past 52-weeks. Nevertheless, we believe Walgreen’s is a strong holding for several reasons: WAG is on pace to meet its store growth goals by 2010, the aging U.S. population is increasing demand for WAG’s products, WAG continues to diversify its operations into additional revenue generating services, and analysts consider WAG immune to macroeconomic fluctuations (making this stock attractive during an expected economic downturn). Ultimately, we believe Walgreen’s is well positioned from a macroeconomic standpoint and its strong fundamentals make it a stable holding in our portfolio.
The Walt Disney Co. (DIS) 1.88% of the Active Portfolio HOLD Recommendation
Key Stock Statistics
Price as of November 30, 2007 $33.15 Price/Earnings (ttm) 14.67
52-Week Price Range $32.55 – $33.23 Price/Book 2.09
52-Week Return 0.30% Price/Sales 1.76
Market Capitalization (B) $62.83 ROA (ttm) 7.01%
Shares Outstanding (B) 1.90 ROE (ttm) 14.94%
Institutional Ownership 65.7% 2006 EPS $1.68
Beta 0.56 2007 EPS (est.) $1.88
Dividend Yield 1.40% 2008 EPS (est.) $2.04

15
The Walt Disney Company, based out of Burbank, California, operates through its subsidiaries as a diversified entertainment company worldwide. Its key operations include Media Networks (43% of Sales), Parks & Resorts (29% of sales), Studio Entertainment (22% of sales), and Consumer Products (6% of sales).
We believe Disney is well diversified and arguably the best positioned player in the industry. Disney has a portfolio of strong brands such as ESPN, ABC, Disney Theme Parks, Pixar, and Disney Movie Studios. Over the last several years the media industry has experienced a shift from print and television content moving to the internet. Disney’s commitment to customers’ needs and wants by producing and distributing content using cutting edge technology helps it maintain its market status.
Disney produced positive returns throughout 2007, and finished the 52-week period with a modestly positive holding return of 0.30%. Nevertheless, we believe Disney is a strong holding for several reasons: DIS has a large scale of operations and is well diversified, DIS is ahead of the curve when gauging shifts in technologies and consumer interests, DIS has aggressive plans to take its strong brand name internationally, and its studio entertainment division is projecting robust growth in the near term. We believe Disney’s fundamentals are strong and that it has the resilience to stand up against harsh macroeconomic conditions. Thus, we believe Disney is a stable holding and will continue to maintain it in the portfolio.
Lowe’s (LOW) Sold Position SELL Recommendation
Key Stock Statistics
Price as of November 30, 2007 $24.41 Price/Earnings (ttm) 11.50
52-Week Price Range $21.76 - $35.74 Price/Book 2.11
52-Week Return -19.06% Price/Sales 0.70
Market Capitalization (B) $33.40 ROA (ttm) 10.91%
Shares Outstanding (B) 1.47 ROE (ttm) 19.36%
Institutional Ownership 82.2% 2006 EPS $2.02
Beta 1.47 2007 EPS (est.) $2.12
Dividend Yield 1.40% 2008 EPS (est.) $2.68
Lowe's is the world's second largest home improvement retailer. The company operates a chain of approximately 1,385 building materials and home improvement superstores in 49 states. A typical Lowe’s home improvement store averages 117,000 square feet and boasts more than 40,000 items.
Lowe’s caters to two main groups of customers: do-it-yourself (D-I-Y) and commercial business customers. Retail customers include D-I-Y homeowners and others buying for personal and family use. Professional customers include repair and remodeling contractors, electricians, plumbers, landscapers, painters, and commercial and residential building maintenance professionals. The professional segment is a key target for sales growth as the company continues to focus on building strong relationships with professional and business customers. The “burst” of the housing bubble and the results of the credit crunch have severely affected Lowe’s. The 52-week return for Lowe’s is –19.06%. The consecutive home sales drops over the past months forced Lowe’s to lower its outlook for 2007 and 2008. As a key indicator of the negative impact, the sales per store dropped 1% in August, slipped 5% in September and declined 6% in October. In addition Lowe’s delayed its expansion activity regarding the new distribution center and new stores addition. With existing home inventories reaching an all time high, decreasing housing prices leading to reduced spending on home improvement, and a tough macroeconomic environment, we believe it is necessary to remove Lowe’s from the portfolio. Thus, we maintain a sell rating and have decided to liquidate Lowe’s.

16
Gap Inc. (GPS) Not Currently Held BUY Recommendation
Key Stock Statistics
Price as of November 30, 2007 $20.40 Price/Earnings (ttm) 21.77
52-Week Price Range $15.20 - $21.93 Price/Book 3.66
YTD Return NA Price/Sales 1.05
Market Capitalization (B) $16.69 ROA (ttm) 8.52%
Shares Outstanding (M) 788.0 ROE (ttm) 16.34%
Institutional Ownership 58.2% 2006 EPS $0.93
Beta .37 2007 EPS (est.) $0.91
Dividend Yield 1.50% 2008 EPS (est.) $1.15
Headquartered in San Francisco, California, Gap, Inc. is a specialty retailer which operates retail and outlet stores specializing in casual apparel, accessories, and personal care products for men, women, and children. Its brands include Gap, Old Navy, and Banana Republic. The company provides a range of products, including denim, khakis, and T-shirts, fashion apparel, shoes, accessories, intimate apparel, and personal care products. It also offers products through gap.com, bananarepublic.com, and oldnavy.com.
We have a BUY rating on Gap Inc. Gap is in the process of a rigorous turn-around after experiencing declining EPS in 2006. It has made successful strides to revamp and revive its core business. With over $2 billion in cash on its balance sheet it has the means to push forward with profit seeking initiatives. Also, E-commerce is continuing to trend upward, and Gap is taking advantage of several platforms in order to exploit this trend. Finally, Gap’s Banana Republic line continues to produce robust growth as it has been successful in catering to customer wants and tastes year-over-year. However, we have decided not to pursue Gap Inc. from a portfolio perspective because of the potential risk of overweighting our retail exposure. Henry Fund analysts projected the economy and consumer spending to slow in the latter half of 2007, thus we feel it is necessary to not purchase Gap at this time.
Activision Inc. (ATVI) Not Currently Held HOLD Recommendation
Key Stock Statistics
Price as of November 30, 2007 $22.15 Price/Earnings (ttm) 54.75
52-Week Price Range $16.05 - $27.18 Price/Book 5.01
52-Week Return NA Price/Sales 3.96
Market Capitalization (B) $7.78 ROA (ttm) 5.89%
Shares Outstanding (M) 291.31 ROE (ttm) 11.34%
Institutional Ownership 83.5% 2007 EPS $0.28
Beta 1.91 2008 EPS (est.) $0.68
Dividend Yield NA 2009 EPS (est.) $0.86
Activision is an international publisher of interactive entertainment software products. The company operates in two business segments: publishing and distribution of interactive entertainment software and hardware products. The company’s products cover diverse game categories, including action\adventure, action sports racing, role playing, simulation first-person action and strategy. Activision’s target customer base ranges from casual players to game enthusiasts, children to adults and mass-market consumers to value buyers. The company offers its products for use on all “next generation” gaming consoles. Some of its most notable FY2007 titles include: Call of Duty 3, Guitar Hero 2, Marvel: Ultimate Alliance, Tony
Hawk’s Project 8, Over the Hedge, X-Men: Official Game, Shrek Smash N’ Crash, Tony Hawk’s Downhill
Jam, and Series of Poker Tournament of Champion.

17
We have a BUY rating on Activision Inc. Activision has a great portfolio of brands such as Guitar Hero and Call of Duty which are featured across multiple gaming platforms. We feel that these brands will be continued drivers of sales growth over the next 3 years. With over 50% of sales occurring outside of North America, Activision is well protected against a potentially weak U.S. economy. Improved operating margins from 1.2% in 2006 to 4.8% in 2007 indicate improved fundamentals. We expect Guitar Hero 3 and Call of Duty 4 to be key drivers behind projected operating margin improvement to 8.6% in 2008. Another potential revenue driver is in-game advertising as it has the potential to open up new revenue streams with little to no cost for Activision. Finally, Activision has demonstrated the ability to produce hits through in-house development and through acquisition (i.e. RedOctane). However, we have decided not to pursue Activision Inc. because we feel it is currently valued fairly in the market. At the time of our initial coverage, Activision was trading at a discount, but on November 25, 2007, Vivendi, a French media & game publisher, announced its intent to acquire a major position in Activision. This announcement created a spike in the stock price, which exceed our intrinsic value of the security. Thus, we have decided to not to hold a position in our portfolio.
Consumer Staples 12.36% of the Active Portfolio
Analyst: Justin Steinbruchel 9.50% of the S&P 500 Index
The current Henry Fund Holdings in this sector as of November 30, 2007 are Central European Distribution Corporation (CEDC), PepsiCo (PEP) and Procter & Gamble (PG). The Consumer Staples Sector in the S&P 500 Index has returned 8.92% while our holdings have returned 80.1%, 24.2% and 15.2% respectively. Many consumer staples companies are viewed as defensive holdings in a weakening or down economy. The Henry Fund team feels that the Discretionary sector would be weak and thus we have a significant overweight in the Staples sector. Decreasing consumer confidence, high energy prices and fears of inflation of combined to give us a somewhat gloomy view of the economy over the next 6 months. In order to insulate the portfolio from a soft economy we have positioned the portfolio with PepsiCo and Procter & Gamble to focus on products that consumers will continue to purchase regardless of the economic condition. With Central European Distribution Corporation we are looking for some international diversification and to capture positive impact from the U.S. Dollar deprecation.
Central European Distribution Corp. (CEDC) 4.40% of the Active Portfolio HOLD Recommendation
Key Stock Statistics
Price as of November 30,2007 $53.50 Price/Earnings (ttm) 23.57
52-Week Price Range $24.71 - $55.20 Price/Book 3.47
52-Week Return 80.1% Price/Sales 1.97
Market Capitalization (B) $2.16B ROA (ttm) 5.06%
Shares Outstanding (M) 40.40M ROE (ttm) 12.51%
Institutional Ownership 66.30% 2005 EPS $0.71
Beta 0.98 2006 EPS $1.55
Dividend Yield N/A 2007 EPS (est.) $1.27
Central European Distribution Corporation (CEDC) is Poland’s largest integrated spirit beverage company. Vodka is produced at two distilleries in Poland and distributes the spirits through a country wide network.

18
Shipments are made on a next-day delivery basis to retail outlets through its 16 distribution centers and 76 satellite branches in the country. The company distributes over 700 brands of alcoholic beverages consisting of spirits, wine and beer as well as non-alcoholic drinks. Products are available in approximately 39,000 outlets, including off-trade establishments, such as small and medium-size retail outlets, gas stations, duty free stores, supermarkets, and on-trade locations, such as bars, nightclubs, hotels and restaurants. CEDC has been focused on expanding its presence in Hungary and Russia and management has hinted that a move into the Ukraine should be expected in the next one to two years.
We like the strategic moves to establish a presence in countries with growing economies and increasing demand for premium vodka. Also, the company’s focus on developing a strong distribution network in Eastern Europe is also an astute move. We are also pleased to see that throughout all of the acquisitions, sales growth has been above 25%, and both gross and operating margins have growing in the last two years.
However, we are concerned about the low rate of organic sales growth at 3%. A strategy centered around acquisitions is risky and a unsuccessful move could severely hurt CEDC’s financial performance. We would like to see organic sales growth above 5% as this confirms the fundamental demand for the products. Ultimately, we believe that CEDC’s strong presence in growing markets and aggressive strategy is sound and we recommend a Buy.
PepsiCo (PEP) 4.59% of the Active Portfolio BUY Recommendation
Key Stock Statistics
Price as of November 30,2007 $78.46 Price/Earnings (ttm) N/A
52-Week Price Range $61.89 - $79.00 Price/Book 7.76
52-Week Return 24.2% Price/Sales 3.36
Market Capitalization (B) $126.30B ROA (ttm) N/A
Shares Outstanding (M) 1.61B ROE (ttm) N/A
Institutional Ownership N/A 2005 EPS $2.44
Beta N/A 2006 EPS $2.80
Dividend Yield 1.8% 2007 EPS (est.) $3.20
PepsiCo is a global food and beverage company with an operating presence in over 200 countries. PepsiCo manufactures, markets and sells a range of salty and sweet grain-based snacks and carbonated/noncarbonated beverages. Through Quaker Foods North America, PepsiCo produces cereals, rice, pasta and other branded products. PepsiCo is organized into four divisions. We recommend a BUY for PepsiCo. PepsiCo holds a commanding position in the North American salty snacks and carbonated soft drinks (CSD) markets. Internationally PepsiCo has achieved strong revenue growth through key acquisitions and market specific product offerings. However, we are bearish on PepsiCo’s North American prospects due to PepsiCo’s continued revenue reliance on CSD’s and salty snacks. Market emphasis has shifted to healthy foods and noncarbonated drinks an area that PepsiCo is trying to break into. We feel that strong international revenue growth will offset declines in North American sales.

19
Procter & Gamble (PG) 3.37% of the Active Portfolio HOLD Recommendation
Procter & Gamble (PG) is a diversified consumer goods company that offers beauty, health, household care, grooming and food products. In the 1990s, two businesses accounted for 85% of all the value created by P&G. Today PG competes in over 22 different product categories. Together with its subsidiaries PG manufactures and sells products worldwide. PG’s products are sold in more than 180 countries, primarily through mass merchandisers, grocery stores, membership club stores and drug stores. Its principal markets include North America, Western Europe, northeast Asia, Latin America, central and eastern Europe/Middle East and Africa, Greater China, and ASEAN/Australia/India. We recommend a BUY position for Procter & Gamble (PG). PG is the number one household products company in the United States. Over the past five years PG has achieved average revenue growth of 13.8% through savvy acquisitions and improved product mix. From high end cosmetics, fragrances, anti-aging products, to paper towels, PG has a well diversified product portfolio. The beauty division houses most of PG’s higher price point items and also accounts for the majority of PG’s sales. We expect the beauty division to continue strong revenue growth with projected rates of 8.5% and 8.0% in 2008 and 2009. A factor for growth is that the U.S. anti-aging market is no longer limited to crèmes and eye products. The market is evolving into total body care, and we view PG’s strong presence in this area as a strong plus.
However, we are concerned that PG still relies on a majority of its sales from traditional staples products. In addition PG also derives almost 70% of sales from Western Europe and the U.S, which are mature markets. We would like to see the sales mix shift more towards international and focus on growth areas such as beauty, health and shaving. Even though a number of PG’s compete in mature markets, we feel there is substantial growth potential in targeted areas and internationally to warrant a BUY.
Cal-Maine Foods (CALM) Initiated Coverage - Not in Portfolio SELL Recommendation
Key Stock Statistics
Price as of November 30,2007 $73.90 Price/Earnings (ttm) 18.85
52-Week Price Range $60.42 – $75.18 Price/Book 3.49
52-Week Return 15.2% Price/Sales 2.97
Market Capitalization (B) $229.51B ROA (ttm) 7.09%
Shares Outstanding (M) 3.11B ROE (ttm) 16.32%
Institutional Ownership 59.10% 2006 EPS $2.64
Beta 0.61 2007 EPS $3.04
Dividend Yield 1.80% 2008 EPS (est.) $3.46
Key Stock Statistics
Price as of November 30,2007 $23.46 Price/Earnings (ttm) N/A
52-Week Price Range $8.52 – $28.75 Price/Book 3.23
52-Week Return N/A Price/Sales 0.85
Market Capitalization (B) $553.20M ROA (ttm) N/A
Shares Outstanding (M) 23.63M ROE (ttm) N/A
Institutional Ownership N/A 2005 EPS -$0.43
Beta N/A 2006 EPS -$0.04
Dividend Yield 0.20% 2006 EPS (est.) $0.31
20
Cal-Maine Foods Inc. is the largest producer and marketer of fresh shell eggs in the United States. Cal-Maine’s primary business is the production, grading, packaging, marketing and distribution of shell eggs. The company sells eggs in 29 states, primarily in the southwestern, southeastern, mid-western and mid-atlantic regions of the United States. Cal-Maine markets its eggs through an extensive distribution network to a diverse group of customers. Customers include national and regional grocery store chains, club stores, foodservice distributors and egg product manufacturers. We recommend a SELL position for Cal-Maine Foods. Cal-Maine is the number one producer of fresh shell eggs in the United States. Cal-Maine has achieved 5 year average revenue growth of approximately 12% through acquisitions and improved product mix. Specialty eggs accounted for approximately 14% of total revenue in 2006 and are counted on to drive future revenue growth. The ordinary shell egg market is growing slowly at around 1% annually, while the specialty egg market is enjoying double digit growth that is projected through the end of the decade. The revenue growth and pricing potential of specialty eggs are strong positives for Cal-Maine. However, we are bearish on the commodities cost pressures that the egg industry faces. Corn and soybean prices, key feed components, are expected to rise in 2007. The egg industry is also highly cyclical. Small increases in production, or decreases in consumer demand can have sharp adverse impact on egg prices and thus we reiterate our SELL position.
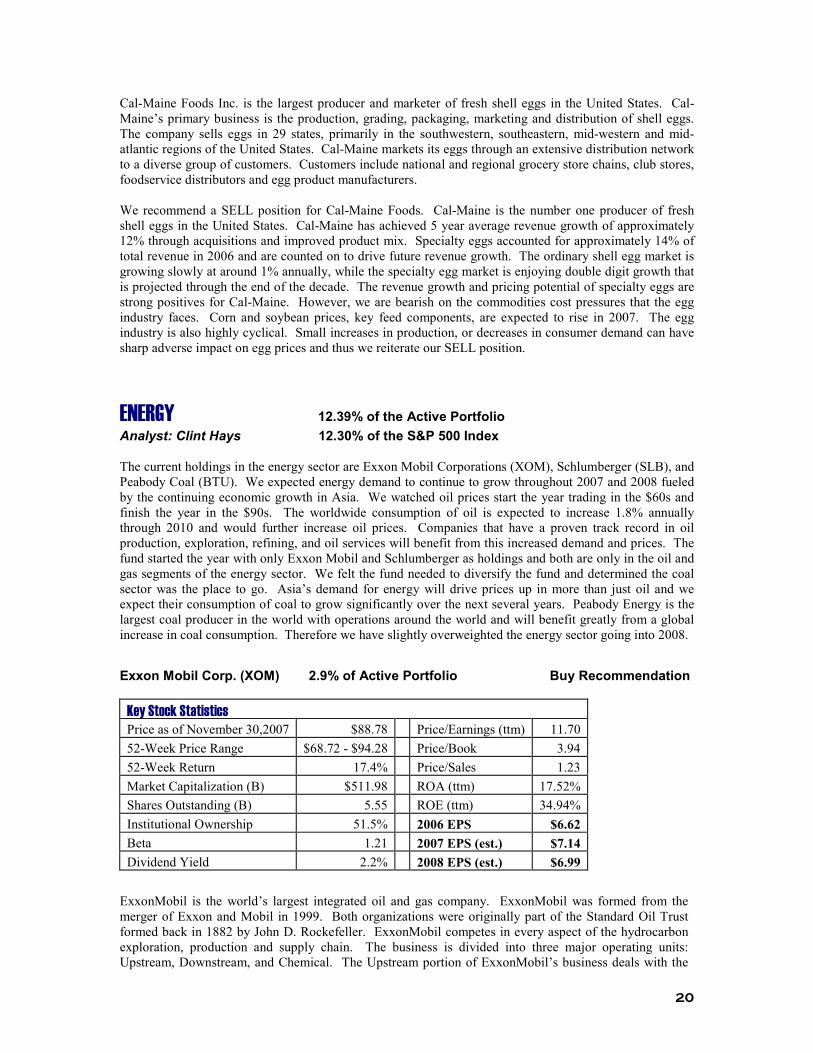
ENERGY 12.39% of the Active Portfolio Analyst: Clint Hays 12.30% of the S&P 500 Index The current holdings in the energy sector are Exxon Mobil Corporations (XOM), Schlumberger (SLB), and Peabody Coal (BTU). We expected energy demand to continue to grow throughout 2007 and 2008 fueled by the continuing economic growth in Asia. We watched oil prices start the year trading in the $60s and finish the year in the $90s. The worldwide consumption of oil is expected to increase 1.8% annually through 2010 and would further increase oil prices. Companies that have a proven track record in oil production, exploration, refining, and oil services will benefit from this increased demand and prices. The fund started the year with only Exxon Mobil and Schlumberger as holdings and both are only in the oil and gas segments of the energy sector. We felt the fund needed to diversify the fund and determined the coal sector was the place to go. Asia’s demand for energy will drive prices up in more than just oil and we expect their consumption of coal to grow significantly over the next several years. Peabody Energy is the largest coal producer in the world with operations around the world and will benefit greatly from a global increase in coal consumption. Therefore we have slightly overweighted the energy sector going into 2008.
Exxon Mobil Corp. (XOM) 2.9% of Active Portfolio Buy Recommendation
Key Stock Statistics
Price as of November 30,2007 $88.78 Price/Earnings (ttm) 11.70
52-Week Price Range $68.72 - $94.28 Price/Book 3.94
52-Week Return 17.4% Price/Sales 1.23
Market Capitalization (B) $511.98 ROA (ttm) 17.52%
Shares Outstanding (B) 5.55 ROE (ttm) 34.94%
Institutional Ownership 51.5% 2006 EPS $6.62
Beta 1.21 2007 EPS (est.) $7.14
Dividend Yield 2.2% 2008 EPS (est.) $6.99
ExxonMobil is the world’s largest integrated oil and gas company. ExxonMobil was formed from the merger of Exxon and Mobil in 1999. Both organizations were originally part of the Standard Oil Trust formed back in 1882 by John D. Rockefeller. ExxonMobil competes in every aspect of the hydrocarbon exploration, production and supply chain. The business is divided into three major operating units: Upstream, Downstream, and Chemical. The Upstream portion of ExxonMobil’s business deals with the

21
exploration, development, production, and gas and power marketing. Downstream refers to the refining and marketing of petroleum products such as motor fuels and lubricants. The Chemical business unit holds leadership positions for some of the largest-volume and highest-growth petrochemicals in the world. Exxon Mobil is expected to out-perform the market based on higher oil prices, increased global demand, and its ability to increase reserves at a rate higher than production and most of its competitors. Exxon Mobil is also doing significant work towards reducing its costs, especially in its refinery business, to help its margins as oil prices have risen more than that of its finished products.
Schlumberger (SLB) 3.5% of Active Portfolio Buy Recommendation
Key Stock Statistics
Price as of November 30,2007 $84.08 Price/Earnings (ttm) 14.70
52-Week Price Range $55.89-111.60 Price/Book 8.85
52-Week Return 37.9% Price/Sales 3.38
Market Capitalization (B) $100.4 ROA (ttm) 15.95%
Shares Outstanding (B) 1.18 ROE (ttm) 40.93%
Institutional Ownership 76.8% 2006 EPS $3.14
Beta 1.56 2007 EPS (est.) $3.46
Dividend Yield 1.0% 2008 EPS (est.) $3.74
Schlumberger was founded in 1916 and is the world’s leading oilfield services company supplying technology, project management and information solutions to optimize performance in the oil and gas industry. Schlumberger Oilfield Services is the world’s premiere oilfield services company providing technology services and solutions to the petroleum industry. WesternGeco is the largest and most technologically advanced surface seismic company. Schlumberger Oilfield Services is run through its 29 oilfield services geomarket regions that are grouped into 4 geographic areas: North America, Latin America, Europe/CIS/Africa and Middle East & Asia. WesternGeco is the world’s leading seismic company providing comprehensive reservoir imaging, monitoring, and development services. Schlumberger’s geographic diversification and superior technologies will continue to make it a leader in the oilfield services. The increase in global oil demand will continue to drive up the demand for Schlumberger’s services. Oil is becoming more difficult to find and recover. Oil companies need to replace their reserves and Schlumberger is the largest oilfield services company. We expect Schlumberger to have a very strong 2008.
Peabody Energy Corp. (BTU) 3.5% of Active Portfolio Buy Recommendation
Key Stock Statistics
Price as of November 30,2007 $55.58 Price/Earnings (ttm) 18.1
52-Week Price Range $33.96-56.22 Price/Book 4.6
52-Week Return 27.1% Price/Sales 2.07
Market Capitalization (B) $13.8 ROA (ttm) 3.78%
Shares Outstanding (M) 263.5 ROE (ttm) 26.60%
Institutional Ownership 81.2% 2006 EPS $2.28
Beta 2.14 2007 EPS (est.) $2.50
Dividend Yield .4% 2008 EPS (est.) $3.40

22
Peabody Energy Corporation is the largest coal company in the world. The company was founded in 1883 as a retail coal suppler and entered the mining business in 1888. Peabody sold 247.6 million tons of coal to over 400 electricity generating and industrial plants in 20 countries during 2006. Their coal products fuel about 10% of all U.S. electricity generation and 2% of worldwide electricity generation. The company has 10.2 billion tons of proven and probable coal reserves. China become a net importer of coal during 2007 and will further help the largest coal producer in the world. Peabody’s mines in Australia are perfectly positioned to benefit the company as Asia’s demand for coal continues to grow. The company is also investing money in the development of coal-to-gas and coal-to-liquid technologies that will further benefit its stockholders.
FINANCIAL SERVICES 15.98% of the Active Portfolio Analysts: Frank Fischer and Zac McQuistan 19.80% of the S&P 500 Index Recent troubles, especially in the credit market, resulted in underperformance of financial stocks. Currently, the sub prime problem and hedge fund troubles are seen as a problem within the industry. However, we may see a different picture when the analyzed problems start to have an impact on other industries. Since the entire industry has recently experienced significant downgrades, one may consider whether the current market prices are attractive enough for investors to get into the industry. The financial sector team approached 2007with an eye to several economic factors such as a challenging interest rate environment and a weak housing market. Later in the year, the team had to evaluate the sector under the recent sub prime fallout. These significant unfavorable conditions made us decide to underweight the sector as compared to our S&P 500 benchmark. Within the sector, we increased our exposure to diversified money center banks that do not solely rely on interest rate based income.
American Capital Strategies (ACAS) 2.32% of Active Portfolio HOLD Recommendation
Key Stock Statistics
Price as of November 30,2007 $37.61 Price/Earnings (ttm) 4.4
52-Week Price Range $32.50 – 49.96 Price/Book 0.98
52-Week Return -23.97% Price/Sales 5.70
Market Capitalization (B) $6.25 ROA (ttm) 13.00%
Shares Outstanding (M) 187.73 ROE (ttm) 23.73%
Institutional Ownership 83.70% 2006 EPS $ 3.19
Beta 1.41 2007 EPS (est.) $ 3.33
Dividend Yield 12.03% 2008 EPS (est.) $ 4.35
American Capital Strategies, Ltd is the second largest publicly traded alternative asset management firm with approximately $11 billion in assets and the end of 2006. Their business consists of two primary segments, their investment portfolio and their alternative asset management business. American Capital, both directly and through its global asset management business, is an investor in management and employee buyouts, private equity buyouts, and early stage and mature private and public companies. American Capital provides senior debt, mezzanine debt and equity to fund growth, acquisitions, recapitalizations and securitizations.1 Primarily, American Capital provides its investment capital to middle market companies, which they consider as companies with sales between $10-750 million. There are two primary positives that resulted in a buy recommendation. First, American capital has the lowest cost of capital for firms competing in their market segment, which we believe is a major competitive advantage moving forward in a fragmented marketplace. They have potential to pickup a larger portion of the market and could see phenomenal growth. The second key positive is the structure of the business. Because they are classified as a business development corporation, American Capital does not pay taxes on their income if they pay out 90% of it as a dividend, which the Henry Fund then also receives tax-free.

23
However, we do believe the incoming analyst should look at this position. Because of the classification as a BDC, American Capital is unable to effectively retain earnings and must finance growth through seasoned equity offerings, often not at the optimal time. Also, with increased funds chasing private equity transactions, it will remain to be seen if returns on the deals suffer over time.
Franklin Resources (BEN) not in portfolio BUY Recommendation
Key Stock Statistics
Price as of November 30,2007 $123.18 Price/Earnings (ttm) 15.54
52-Week Price Range $108.68 – 145.59 Price/Book 3.71
52-Week Return -0.78% Price/Sales 4.38
Market Capitalization (B) $26.78 ROA (ttm) 13.29%
Shares Outstanding (M) 245.02 ROE (ttm) 25.30%
Institutional Ownership 49.30% 2006 EPS $ 4.97
Beta 1.15 2007 EPS (est.) $ 5.37
Dividend Yield 0.70% 2008 EPS (est.) $ 6.35
Franklin Resources, Inc. is the holding company for various subsidiaries that collectively are known as Franklin Templeton Investments, a global investment management organization. Franklin operates in two segments of the financial industry, Investment Management and Related Services and Banking/Finance. The Investment Management Segment is their main line of business, providing such services as investment management, fund administration, shareholder services, transfer agency, underwriting, distribution, custodial, trustee, and other fiduciary services to its sponsored investment products. The Banking/Finance segment provides retail banking and consumer lending services, including automotive lending related to the purchase, securitizations, and servicing of retail debt instruments. The company has offices in 29 countries, and is headquartered in San Mateo, CA. Franklin Resources has been able to overcome margin pressures by building a strong reputation. Over the last 10 years, 93% of their funds have beaten their Lipper peer averages, compared to 76% for key competitor T. Rowe Price. With the Pension Protection Act of 2006 making employees opt out rather than opting in to their 401(k), contributions have been expected to increase 31% per year. Franklin increased advertising and has beaten expectations for assets under management, one of the two key drivers to profitability. However, the incoming analyst needs to monitor this holding. We feel we received a great price on it, as we forecasted a recession into our model and still received a much higher price. But if markets turn south greater than anticipated, asset managers tend to receive the worst of it.
Equifax (EFX) not in portfolio BUY Recommendation
Key Stock Statistics
Price as of November 30,2007 $37.23 Price/Earnings (ttm) 18.04
52-Week Price Range $35.22 - $46.30 Price/Book 3.65
52-Week Return -10.29% Price/Sales 2.80
Market Capitalization (B) $4.81 ROA (ttm) 11.22%
Shares Outstanding (M) 131.84 ROE (ttm) 23.53%
Institutional Ownership 73.10% 2006 EPS $ 2.16
Beta 1.21 2007 EPS (est.) $ 2.05
Dividend Yield 0.40% 2008 EPS (est.) $ 2.53
24
Equifax is a global provider of consumer and commercial credit information. Equifax provides credit, financial, demographic and marketing information about individuals and businesses. It uses financial or credit granting institutions, government organizations, and consumers among its sources of information. Equifax has amassed a database containing information on approximately 400 million consumers and businesses worldwide. Equifax serves 18 of the top 20 banks, 4 of the top 6 telecom companies, and 6 of the top 6 cable/satellite companies in the United States. Equifax is a nice fit for the portfolio for a variety of reasons. Mostly, with concerns rising about an economic downturn, it provides diversification from the other financial services, as it may see an increase in revenues when interest rates fall. Second, consumers are becoming more and more aware of the importance of understanding and monitoring their credit scores over time. These two key points as well as a phenomenal price with conservative growth assumptions has caused us to place a BUY on Equifax.
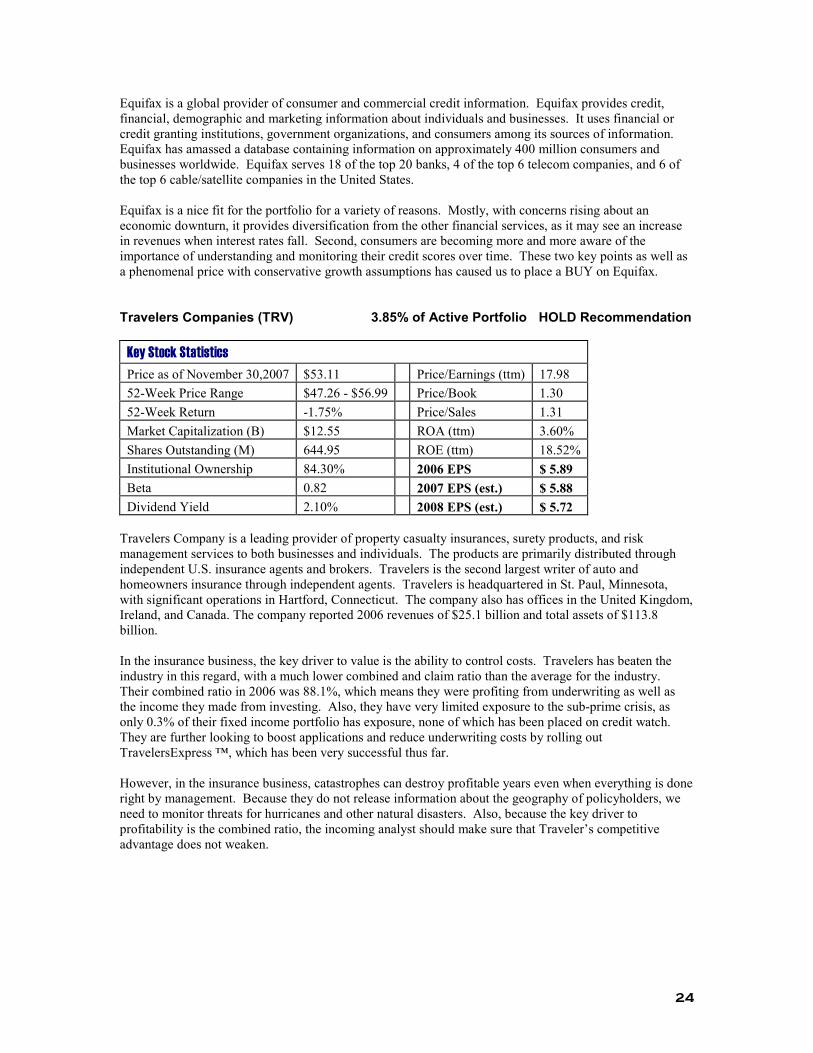
Travelers Companies (TRV) 3.85% of Active Portfolio HOLD Recommendation
Key Stock Statistics
Price as of November 30,2007 $53.11 Price/Earnings (ttm) 17.98
52-Week Price Range $47.26 - $56.99 Price/Book 1.30
52-Week Return -1.75% Price/Sales 1.31
Market Capitalization (B) $12.55 ROA (ttm) 3.60%
Shares Outstanding (M) 644.95 ROE (ttm) 18.52%
Institutional Ownership 84.30% 2006 EPS $ 5.89
Beta 0.82 2007 EPS (est.) $ 5.88
Dividend Yield 2.10% 2008 EPS (est.) $ 5.72
Travelers Company is a leading provider of property casualty insurances, surety products, and risk management services to both businesses and individuals. The products are primarily distributed through independent U.S. insurance agents and brokers. Travelers is the second largest writer of auto and homeowners insurance through independent agents. Travelers is headquartered in St. Paul, Minnesota, with significant operations in Hartford, Connecticut. The company also has offices in the United Kingdom, Ireland, and Canada. The company reported 2006 revenues of $25.1 billion and total assets of $113.8 billion. In the insurance business, the key driver to value is the ability to control costs. Travelers has beaten the industry in this regard, with a much lower combined and claim ratio than the average for the industry. Their combined ratio in 2006 was 88.1%, which means they were profiting from underwriting as well as the income they made from investing. Also, they have very limited exposure to the sub-prime crisis, as only 0.3% of their fixed income portfolio has exposure, none of which has been placed on credit watch. They are further looking to boost applications and reduce underwriting costs by rolling out TravelersExpress ™, which has been very successful thus far. However, in the insurance business, catastrophes can destroy profitable years even when everything is done right by management. Because they do not release information about the geography of policyholders, we need to monitor threats for hurricanes and other natural disasters. Also, because the key driver to profitability is the combined ratio, the incoming analyst should make sure that Traveler’s competitive advantage does not weaken.

25
Ameriprise Financial (AMP) not in the portfolio Buy Recommendation
Key Stock Statistics
Price as of November 30,2007 $58.69 Price/Earnings (ttm) 17.98
52-Week Price Range $51.31 - $69.25 Price/Book 1.62
52-Week Return 9.50% Price/Sales 1.46
Market Capitalization (B) $12.55 ROA (ttm) 0.83%
Shares Outstanding (M) 231.90 ROE (ttm) 9.41%
Institutional Ownership 83.70% 2006 EPS $2.72
Beta 1.41 2007 EPS (est.) $3.65
Dividend Yield 1.00% 2008 EPS (est.) $5.92
Headquartered in Minneapolis, Minnesota, Ameriprise Financial (AMP) is a financial holding company that operates through 14 subsidiaries and provides financial planning products and services. At the end of 2006, AMP had more than 12,000 registered advisors and representatives and more than 8,600 employees, who support clients and advisors. The Asset accumulation and income segment serves institutional and retail clients to meet their financial objectives with tailored products and services. Through Threadneedle Investments, AMP offers a wide array of investment management products and services for institutional and retail clients outside of the US. It is also engaged in 401(k) and other types of retirement plans as well as serving the needs of individuals, small and medium sized businesses. Part of this segment is also the RiverSource family of mutual funds, which consists of two groups of funds, the RiverSource Funds and the RiverSource Variable Portfolio Funds (RSVPF). The first ones are classic retail mutual funds, the RSVPFs are tailored as investment option for variable insurance and annuity products. The Protection segment offers a variety of insurance products, targeting risk management and protection needs of its retail clients. Products range from life, disability income, brokered life, and health insurance to personal auto and home insurances. While the latter are offered directly primarily through co-branded marketing alliances, the remainder is offered to clients with financial plans through branded advisors such as RiverLife and Property Casualty. The asset management industry has outperformed the S&P500 over the last year. In times of sub prime and a lot of uncertainty, this industry may be an interesting investment. We see Ameriprise Financial in a favorable position. In our opinion, its recent spin-off from American Express opens opportunities for future growth. Management and marketing efforts have been successful so far as well as brand management. We feel that the fundamentals for this stock are favorable and feel that the current price environment is an attractive one to make an investment. Therefore, our investment recommendation for Ameriprise is “Buy”.
Deutsche Bank (DB) not in the portfolio Buy Recommendation
Key Stock Statistics
Price as of November 30,2007 $131.75 Price/Earnings (ttm) 5.96
52-Week Price Range $120.02 - $159.76 Price/Book 1.19
52-Week Return 1.85% Price/Sales 1.47
Market Capitalization (B) $62.71 ROA (ttm) 0.49%
Shares Outstanding (M) 499.20 ROE (ttm) 21.32%
Institutional Ownership 18.50% 2006 EPS $11.97
Beta 1.54 2007 EPS (est.) $10.66
Dividend Yield 5.30% 2008 EPS (est.) $13.05

26
Serving 14 million customers in 73 countries, Deutsche Bank AG (DB) is one of the world’s leading financial services institutions. It operates through 1,717 branches worldwide and currently employs 68,849 employees. The bank operates primarily in Germany, Europe, North America, and the Asia-Pacific. During the last decade, Deutsche Bank significantly increased its global presence. With the acquisition of Banker’s Trust by the end of 1998 (beginning of 1999), Deutsche Bank significantly increased its market position in the US. In 2001, Deutsche Bank set up an agreement with Zurich Financial that included the purchase of US asset manager Scudder, as well as asset managers in Germany, Italy, and Spain. Corporate and Investment Bank (CIB) consists of corporate banking and transaction banking activities. Most of CIB’s operations are in the world’s financial centers, including London, Frankfurt, New York, Tokyo, Singapore, and Hong Kong. Main client groups in this division are institutional clients that range from medium to large businesses. Private Clients and Asset Management (PCAM)’s main operations are asset management as well as private and institutional wealth management. While asset management and institutional wealth management are focused on services for institutional clients like classic asset management, pension fund management, insurance solutions, and other investment vehicles, the private wealth management group is focused on high-net worth clients, providing solutions and services like financial advice, brokerage, and portfolio management services. The Corporate Investments division consists primarily of Deutsche Bank’s institutional holdings, private equity, and venture capital investments. The financial services sector has been very volatile over the last two months. The recent credit crunch, hedge fund collapses, a weak US housing market, sub prime lending, and a challenging interest rate environment made the sector less favorable. Like other financial institutions, Deutsche Bank had to disclose to the market their exposure to sub prime in order to appease investors. However, Deutsche Bank’s risk with respect to sub prime exposure seems calculable. We feel that the fundamentals for this stock are still favorable and that the current price environment for financials is conducive to investment. Therefore, our investment recommendation for Deutsche Bank is “Buy.”
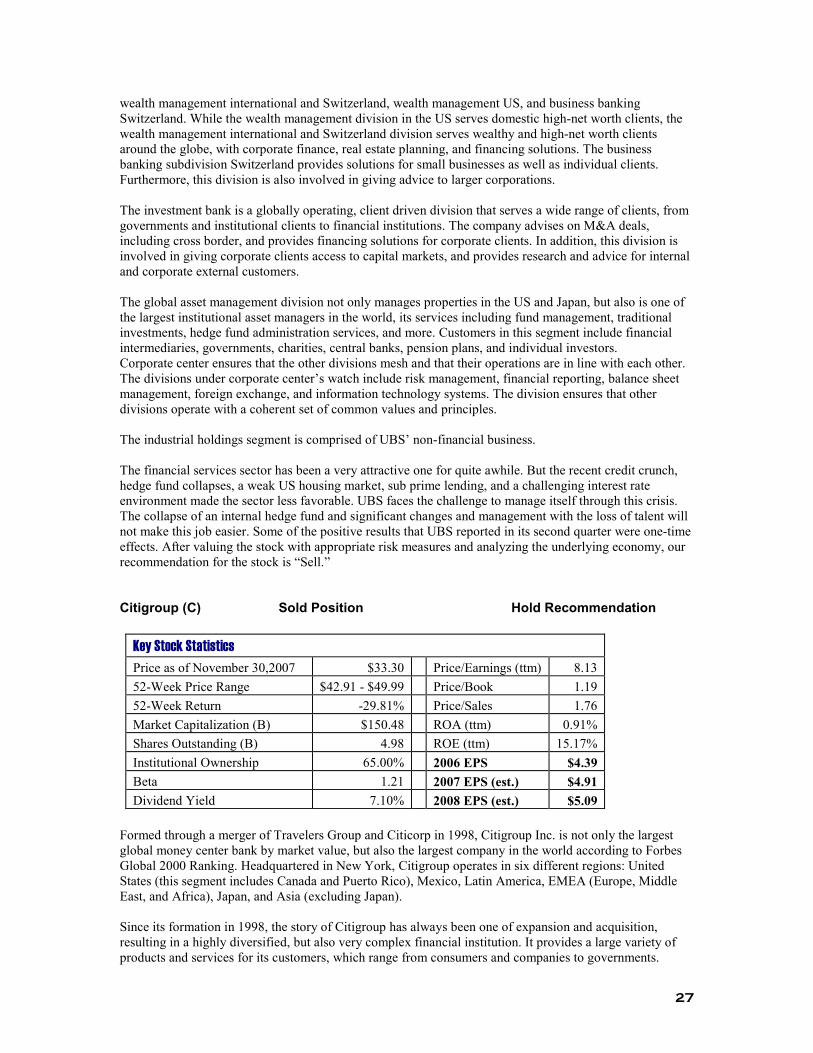
Union Bank of Switzerland (UBS) 3.02% of Active Portfolio Sell Recommendation
Key Stock Statistics
Price as of November 30,2007 $50.48 Price/Earnings (ttm) 9.16
52-Week Price Range $42.58 - $60.46 Price/Book 2.13
52-Week Return -16.17% Price/Sales 2.10
Market Capitalization (B) $86.94 ROA (ttm) 0.45%
Shares Outstanding (M) 1,910.00 ROE (ttm) 22.47%
Institutional Ownership 19.60% 2006 EPS $6.20
Beta 1.52 2007 EPS (est.) $(0.41)
Dividend Yield 2.50% 2008 EPS (est.) $2.10
With a history dating back to the 1860s, Union Bank of Switzerland Aktiengesellschaft (UBS) is a diversified financial services institution. The company is headquartered in Zürich, Switzerland and operates in 50 countries, primarily in Europe and the Americas, and employs more than 80,000 people. Its services range from advisory service and underwriting over market making, to asset management and brokerage, to financing and retail banking. UBS reports and operates its business through the following divisions: global wealth management and business banking, investment bank, global asset management, corporate center, and industrial holdings. The global wealth management and business banking division is basically divided into three subdivisions:
27
wealth management international and Switzerland, wealth management US, and business banking Switzerland. While the wealth management division in the US serves domestic high-net worth clients, the wealth management international and Switzerland division serves wealthy and high-net worth clients around the globe, with corporate finance, real estate planning, and financing solutions. The business banking subdivision Switzerland provides solutions for small businesses as well as individual clients. Furthermore, this division is also involved in giving advice to larger corporations. The investment bank is a globally operating, client driven division that serves a wide range of clients, from governments and institutional clients to financial institutions. The company advises on M&A deals, including cross border, and provides financing solutions for corporate clients. In addition, this division is involved in giving corporate clients access to capital markets, and provides research and advice for internal and corporate external customers. The global asset management division not only manages properties in the US and Japan, but also is one of the largest institutional asset managers in the world, its services including fund management, traditional investments, hedge fund administration services, and more. Customers in this segment include financial intermediaries, governments, charities, central banks, pension plans, and individual investors. Corporate center ensures that the other divisions mesh and that their operations are in line with each other. The divisions under corporate center’s watch include risk management, financial reporting, balance sheet management, foreign exchange, and information technology systems. The division ensures that other divisions operate with a coherent set of common values and principles. The industrial holdings segment is comprised of UBS’ non-financial business. The financial services sector has been a very attractive one for quite awhile. But the recent credit crunch, hedge fund collapses, a weak US housing market, sub prime lending, and a challenging interest rate environment made the sector less favorable. UBS faces the challenge to manage itself through this crisis. The collapse of an internal hedge fund and significant changes and management with the loss of talent will not make this job easier. Some of the positive results that UBS reported in its second quarter were one-time effects. After valuing the stock with appropriate risk measures and analyzing the underlying economy, our recommendation for the stock is “Sell.”
Citigroup (C) Sold Position Hold Recommendation
Key Stock Statistics
Price as of November 30,2007 $33.30 Price/Earnings (ttm) 8.13
52-Week Price Range $42.91 - $49.99 Price/Book 1.19
52-Week Return -29.81% Price/Sales 1.76
Market Capitalization (B) $150.48 ROA (ttm) 0.91%
Shares Outstanding (B) 4.98 ROE (ttm) 15.17%
Institutional Ownership 65.00% 2006 EPS $4.39
Beta 1.21 2007 EPS (est.) $4.91
Dividend Yield 7.10% 2008 EPS (est.) $5.09
Formed through a merger of Travelers Group and Citicorp in 1998, Citigroup Inc. is not only the largest global money center bank by market value, but also the largest company in the world according to Forbes Global 2000 Ranking. Headquartered in New York, Citigroup operates in six different regions: United States (this segment includes Canada and Puerto Rico), Mexico, Latin America, EMEA (Europe, Middle East, and Africa), Japan, and Asia (excluding Japan). Since its formation in 1998, the story of Citigroup has always been one of expansion and acquisition, resulting in a highly diversified, but also very complex financial institution. It provides a large variety of products and services for its customers, which range from consumers and companies to governments.

28
The Global Consumer Group segment is the most complex one of the holding. It provides a wide array of services ranging from banking and lending to investments for domestic and international customers. Global Consumer serves more than 200 million customer accounts through a network of about 8,110 branches, 18,800 ATMs worldwide, 809 automated lending machines, internet, telephone, mail, and the Primerica Sales force. Corporate and Investment Banking (CIB) provides a wide range of products and services in over 100 countries. Core customers are corporations, governments, institutions and investors. CIB is separated in two main sub segments, Capital Markets & Banking and Transaction Services. Citigroup’s Global Wealth Management consists of three main sub segments, Smith Barney Private Clients, the Private Bank, and Citigroup Investment Research. While Smith Barney is focused on advisory, financial planning, and brokerage, the Private Bank offers Wealth Management services for high-net-worth clients in 33 countries and territories. The Citigroup Investment Research unit provides independent research services in equities and fixed income for institutions and individuals around the globe. The Alternative Investments group manages not only capital from Citigroup, but also capital from third party investors. AI manages a wide range of products across five main asset classes: private equity, hedge funds, structured products, real estate, and managed futures. The remainder of Citigroup’s operations is pooled in this segment. It consists basically of treasury operations, discontinued operations management as well as operations and technology. Citigroup Inc. has to face the challenge of how to cut costs and restructure its business without cutting too deep into the revenue stream. While strategies like reducing work force, identifying cost saving opportunities, and possible strategic acquisitions will work in the companies favor, its main competitors currently seem to do a better job in generating revenues even in a flat yield curve environment. We feel that the new Chief Financial Officer Gary Crittenden can introduce a turnaround in Citigroup’s future performance. We feel that Citigroup is going to continue to grow mostly by acquisition and not organically, our overall recommendation for the stock is “Hold”. Please note that by the time we evaluated Citigroup, the credit markets were still intact for the most part. Including sub prime charges into our valuation may negatively impact Citigroup’s fair market value.
Bank of America (BAC) 3.57% of Active Portfolio Buy Recommendation
Key Stock Statistics
Price as of November 30, 2007 $45.47 Price/Earnings (ttm) 9.43
52-Week Price Range $40.78 - $54.21 Price/Book 1.36
52-Week Return -11.31% Price/Sales 2.81
Market Capitalization (B) $184.59 ROA (ttm) 1.32%
Shares Outstanding (B) 4.44 ROE (ttm) 14.68%
Institutional Ownership 59.80% 2006 EPS $4.66
Beta 0.44 2007 EPS (est.) $4.59
Dividend Yield 5.80% 2008 EPS (est.) $4.59
Headquartered in Charlotte, North Carolina, Bank of America operates primarily in the US and Canada, but has some international business and cooperates with international financial institutions in particular business areas. Through its subsidiaries, the company offers a wide range of banking and some non-banking financial services. Bank of America has business operations in 30 states, the District of Columbia, and 44 foreign countries. By the end of 2006, the company operated 17,079 ATM’s, 5,747 banking centers and counted more than 21 million active online in the US.

29
Global Consumer & Small Business Banking provides a wide range of products and services in the US, relying on its infrastructure in 30 states and the District of Columbia with 5,747 banking centers, 17,079 ATM’s as well as telephone and internet channels. In addition, the Global Consumer & Small Business Banking segment offers credit card service and consumer finance in Canada, the United Kingdom, Ireland and Spain. Within this segment key product groups are card services, consumer real estate, insurance, small business, and consumer deposit and debit products. Because of the MBNA merger, the company acquired among others interests in credit card. In 2006, the corporation reported to have securitized $23.7 billion in credit card receivables and a resulting gain of $104 million. The company expects credit card losses in 2006 in a range of 3.8 to 5.8% (compared to a range in 2005 of 4.0 to 4.3%). With a relatively stable economy we do not see significant changes in these spreads. However, unexpected changes in economic variables may have a significant impact on credit card losses. Global Corporate & Investment Banking provides a large variety of products and services not only to the issuer, but also to the investor. Core clients are banking clients, international corporate clients and institutional investor clients. Supported through offices in 26 countries worldwide, the company operates in this segment in four geographic regions: United States and Canada, Europe, Middle East and Africa, and Latin America. Global Wealth & Investment Management offers in this segment customized banking and investment services, where clients have access to a variety of services through three businesses: The Private Bank, Columbia Management, and Premier Banking and Investments. The customer base using these integrated wealth management services consists of wealthy individuals, charitable organizations and middle-market institutions with assets to invest greater than three million dollars. Our recommendation for Bank of America is “Hold”. Our last valuation in March made us decide to increase our exposure to Bank of America, because we saw good upside potential at the time. But with the ongoing sub prime crisis, our fair market value may be lower. Because Bank of America has a strong weight in the S&P 500, we decided to maintain exposure in this position. We see opportunities for organic growth in a flat yield curve environment.
HEALTHCARE 12.9% of the Active Portfolio
Analysts: Brian Douglas and Brian Perry 12.3% of the S&P 500 Index
Certain subsectors of the healthcare industry have outperformed the market over the past year, including biotechnology, research organizations and medical devices while pharmaceuticals continue to lag. We investigated names in the sectors we expect to outperform in 2008, based on key drivers of stock performance. Due to ongoing declines in stocks with upcoming patent troubles, we looked at Endo Pharmaceuticals, a mid-cap drug company with a well-protected portfolio and a pipeline of moderate strength. Later in the year, under the thesis that investors will continue to favor growing biotech companies over stagnant pharmaceutical giants, we researched Celgene Corporation. Ultimately, Celgene’s volatility due to its reliance on a single drug proved unappealing and we stayed away. We also looked at Forest Laboratories, a mid-size pharmaceutical firm with a unique licensing and marketing strategy which has attractive pricing and potential drivers for out performance. Finally, we analyzed industry giant Johnson & Johnson, a name we have held in the portfolio for some time now. In the research organization space, we continue to believe that Charles River Laboratories is the dominant player and will post above-market gains. We also looked at Pharmaceutical Product Development, but with a value less than its current trading range, along with some management uncertainty, we chose to stay away from the stock. Earlier in the year, we replaced Community Health Systems with Stryker Corporation. After Community Health announced its acquisition of Triad, we did not see much upside in the stock and

30
felt that Styker was the better play for our portfolio. Stryker was a hot stock during 2006 and continued to perform well after we purchased it in May. Finally, we analyzed Pediatrix Medical Group and believe that with its growing margins and strategic acquisitions, it offers a lot upside.
Pfizer (PFE) Sold March 9th Recommendation: Sell
Key Stock Statistics
Price as of November 30, 2007 $23.76 Price/Earnings (ttm) 9.42
52-Week Price Range $22.24-$27.73 Price/Book 2.43
52-Week Price Return -9.6% Price/Sales 3.35
Market Capitalization (B) $157.8 ROA (ttm) 8.09%
Shares Outstanding (B) 6.83 ROE (ttm) 13.81%
Institutional Ownership 67.9% 2006 EPS $2.66
Beta 1.04 2007 EPS (est.) $2.15
Dividend Yield 4.90% 2008 EPS (est.) $2.35
In order to see share price gains, Pfizer must improve its pipeline and find lasting success with its cost cutting effort. We believe it to be unlikely that the company will be particularly successful on either count over the near term. Recent patent expirations on Zithromax and Zoloft cut approximately $2.5B from sales in 2006. Expirations late in 2007 include Norvasc ($4.8B in sales in 2006) and Zyrtec ($1.6B). Lipitor, which represents over one quarter of Pfizer’s sales, will lose patent protection in 2010. We believe that Pfizer is just at the beginning of a multi-year adjustment process with a highly uncertain outcome. In the spring, Pfizer was trading at a premium to the calculated DCF value. We sold all shares and have been pleased with that decision, as the stock has continued to falter.
Endo Pharma (ENDP) Purchased/Expect to Sell April 4th Recommendation: Buy
Key Stock Statistics
Price as of November 30, 2007 $27.41 Price/Earnings (ttm) 19.0
52-Week Price Range $26.04-$35.85 Price/Book 2.96
52-Week Price Return -3.9% Price/Sales 3.52
Market Capitalization (B) $3.7 ROA (ttm) 13.67%
Shares Outstanding (M) 134.1 ROE (ttm) 16.93%
Institutional Ownership 86.8% 2006 EPS $1.03
Beta 0.73 2007 EPS (est.) $1.79
Dividend Yield 0.0% 2008 EPS (est.) $2.11
We took a position in Endo Pharmaceuticals in the spring on the basis of the company’s strong and growing presence in the pain management field. We believed that Endo’s increasingly popular portfolio of drugs and strong cash flow generation would provide a base upon which the pipeline could be developed. However, negative results for pipeline drugs and FDA decisions damaged share prices mid-summer, and the stock has yet to recover. Strong sales growth for the company’s top drugs and solid financial results overall have not lifted the price. Our experience with Endo has revealed the difficulty of predicting clinical trial results and FDA decisions, and we will seek a more substantial margin of safety on future pharmaceutical holdings.
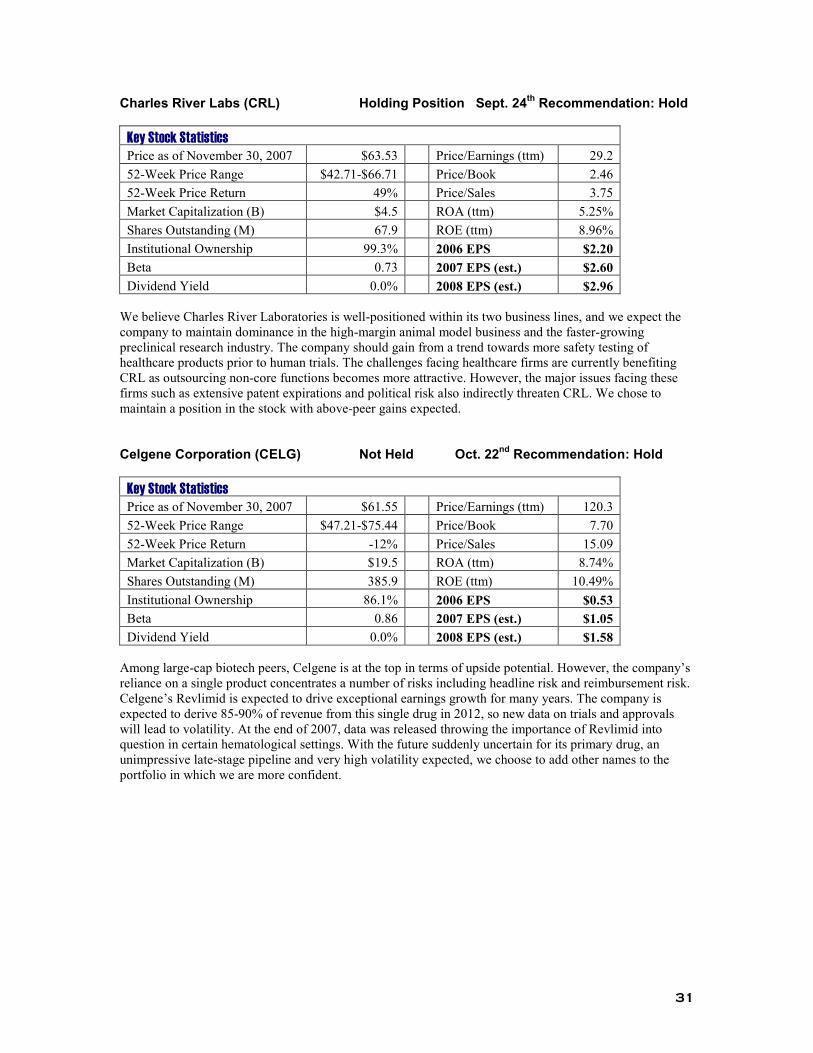
31
Charles River Labs (CRL) Holding Position Sept. 24th Recommendation: Hold
Key Stock Statistics
Price as of November 30, 2007 $63.53 Price/Earnings (ttm) 29.2
52-Week Price Range $42.71-$66.71 Price/Book 2.46
52-Week Price Return 49% Price/Sales 3.75
Market Capitalization (B) $4.5 ROA (ttm) 5.25%
Shares Outstanding (M) 67.9 ROE (ttm) 8.96%
Institutional Ownership 99.3% 2006 EPS $2.20
Beta 0.73 2007 EPS (est.) $2.60
Dividend Yield 0.0% 2008 EPS (est.) $2.96
We believe Charles River Laboratories is well-positioned within its two business lines, and we expect the company to maintain dominance in the high-margin animal model business and the faster-growing preclinical research industry. The company should gain from a trend towards more safety testing of healthcare products prior to human trials. The challenges facing healthcare firms are currently benefiting CRL as outsourcing non-core functions becomes more attractive. However, the major issues facing these firms such as extensive patent expirations and political risk also indirectly threaten CRL. We chose to maintain a position in the stock with above-peer gains expected. Celgene Corporation (CELG) Not Held Oct. 22
nd Recommendation: Hold
Key Stock Statistics
Price as of November 30, 2007 $61.55 Price/Earnings (ttm) 120.3
52-Week Price Range $47.21-$75.44 Price/Book 7.70
52-Week Price Return -12% Price/Sales 15.09
Market Capitalization (B) $19.5 ROA (ttm) 8.74%
Shares Outstanding (M) 385.9 ROE (ttm) 10.49%
Institutional Ownership 86.1% 2006 EPS $0.53
Beta 0.86 2007 EPS (est.) $1.05
Dividend Yield 0.0% 2008 EPS (est.) $1.58
Among large-cap biotech peers, Celgene is at the top in terms of upside potential. However, the company’s reliance on a single product concentrates a number of risks including headline risk and reimbursement risk. Celgene’s Revlimid is expected to drive exceptional earnings growth for many years. The company is expected to derive 85-90% of revenue from this single drug in 2012, so new data on trials and approvals will lead to volatility. At the end of 2007, data was released throwing the importance of Revlimid into question in certain hematological settings. With the future suddenly uncertain for its primary drug, an unimpressive late-stage pipeline and very high volatility expected, we choose to add other names to the portfolio in which we are more confident.

32
Forest Laboratories (FRX) Expect to Buy Nov. 19th Recommendation: Buy
Key Stock Statistics
Price as of November 30, 2007 $38.55 Price/Earnings (ttm) 22.8
52-Week Price Range $34.89-$57.97 Price/Book 3.44
52-Week Price Return -29% Price/Sales 3.20
Market Capitalization (B) $11.3 ROA (ttm) 19.4%
Shares Outstanding (M) 311.9 ROE (ttm) 16.5%
Institutional Ownership 93.6% 2006 EPS $2.88
Beta 1.56 2007 EPS (est.) $3.06
Dividend Yield 0.0% 2008 EPS (est.) $3.43
We believe FRX is attractively valued – especially compared to peers with moderately higher growth profiles. Company news has been mixed, but the market appears fixated on the items with negative implications. A rebound for FRX may be ignited by strong launches of two new drugs in 2008. Forest is a skilled development partner and chooses its projects well; intelligent licensing activity should demonstrate an ability to prepare for patent expirations that are still four to five years away. The company has a good record of bringing drugs to the U.S. that are already approved and in use elsewhere in the world. Comparable multiple analysis and DCF analysis using rather conservative assumptions both indicate the share price trades at a discount to intrinsic value of over 25%. We plan to add Forest to the healthcare portfolio at the end of the calendar year, believing it to be a compelling way to rebuild pharmaceutical exposure.
Community Health Systems Sold March 10th Recommendation: Hold
Key Stock Statistics
Price as of November 30, 2007 $33.42 Price/Earnings (ttm) 19.9
52-Week Price Range $27.70-44.50 Price/Book (mrq) 1..83
52-Week Price Return 0.11% Price/Sales (ttm) 0.56
Market Capitalization (B) $3.45 ROA (ttm) 3.8%
Shares Outstanding (M) 95.6 ROE (ttm) 9.9%
sInstitutional Ownership 99.0% 2006 EPS $1.77
Beta 0.53 2007 EPS (est.) $1.91
Dividend Yield N/A 2008 EPS (est.) $2.31
Community Health Systems has been one of the better performing for-profit hospital networks. However, since it’s acquisition of Triad Hospitals was announced in late March of this year, the stock has been suffering. Adding Triad essentially doubled the size of Community Health, but analysts questioned the rationale behind the acquisition. We agreed that the merger would not create substantial synergies and that the two companied had different operating procedures. Therefore, because we saw additional risks and very little upside to the stock, we chose to sell Community Health. We have been pleased with the decision as it has continually traded below are selling price.

33
Stryker Corporation (SYK) Purchased April 4th Recommendation: Hold
Key Stock Statistics
Price as of November 30, 2007 $72.63 Price/Earnings (ttm) 31.88
52-Week Price Range $54.62-76.02 Price/Book (mrq) 5.96
52-Week Price Return 35.4% Price/Sales (ttm) 5.13
Market Capitalization (B) $30.5 ROA (ttm) 13.0%
Shares Outstanding (M) 410.5 ROE (ttm) 20.6%
Institutional Ownership 49.3% 2006 EPS $1.91
Beta 0.99 2007 EPS (est.) $2.40
Dividend Yield 0.40% 2008 EPS (est.) $2.88
Stryker Corporation is a leading medical product company that continues to maintain strong growth. The consistent growth, along with the product diversification and the favorable demographic changes, has the company positioned well for the future. Shares were trading near our intrinsic value at the time of the report and a hold recommendation was initiated. However, the stock declined throughout April and provided an opportunity to buy shares when it was trading more than 10% below our intrinsic value. We decided to replace Community Health Systems with Stryker Coropation in early May and have been pleased with the decision. Shares of Stryker have returned over 15% for the fund during its holding period.
Pharmaceutical Product Development (PPDI) Not Held Sept. 24th Recommendation: Sell
Key Stock Statistics
Price as of November 30, 2007 $42.34 Price/Earnings (ttm) 30.5
52-Week Price Range $30.52-43.14 Price/Book (mrq) 4.53
52-Week Price Return 30.6% Price/Sales (ttm) 3.68
Market Capitalization (B) $4.99 ROA (ttm) 9.8%
Shares Outstanding (M) 118.9 ROE (ttm) 16.4%
Institutional Ownership 87.1% 2006 EPS $1.34
Beta 0.91 2007 EPS (est.) $1.36
Dividend Yield 0.90% 2008 EPS (est.) $1.70
Pharmaceutical Product Development, Inc. is a leading research services company that continues to produce strong financial results. The company is a global contract research organization (CRO) that provides discovery, development and post-approval services. Although there are significant prospects for its Discovery Sciences segment during 2008, a recent guidance reduction, along with management uncertainty, lowered the appeal of investing in the company. Additionally, our intrinsic value is approximately 10% below where shares of PPDI are trading and we do feel the stock is slightly overvalued. We have chosen to stay away from the company at this time, but to continue monitoring its results as it may be a good fit for the portfolio in the future.

34
Johnson & Johnson (JNJ) Holding Position October 22th Recommendation: Hold
Key Stock Statistics
Price as of November 30, 2007 $67.59 Price/Earnings (ttm) 19.0
52-Week Price Range $59.72-68.75 Price/Book (mrq) 4.48
52-Week Price Return 1.96% Price/Sales (ttm) 3.3
Market Capitalization (B) $193.4 ROA (ttm) 13.4%
Shares Outstanding (B) 2.86 ROE (ttm) 24.7%
Institutional Ownership 63.5% 2006 EPS $3.76
Beta 0.79 2007 EPS (est.) $4.12
Dividend Yield 2.4% 2008 EPS (est.) $4.42
Johnson & Johnson is a large healthcare company that continues to grow and diversify its product offerings. It should continue to produce strong bottom line results even during a difficult period of patent expirations and slower overall revenue growth. The company is under taking the necessary cost savings initiatives while maintaining its strategy of growing through its R&D and strategic acquisitions. A mature company that pays a high dividend, Johnson & Johnson is a suitable holding for the long term investor. Thus, the Henry Fund believes it is a good fit for the portfolio and will continue to hold shares of the company. In a slower economy and changing political environment, we believe Johnson & Johnson is a necessary holding within the current healthcare sector of the fund.
Pediatrix Medical Group (PDX) Expected to Buy November 19
th
Recommendation: Buy
Key Stock Statistics
Price as of November 30, 2007 $62.79 Price/Earnings (ttm) 23.46
52-Week Price Range $48.24-67.27 Price/Book (mrq) 3.31
52-Week Price Return 25.4% Price/Sales (ttm) 3.48
Market Capitalization (B) $3.04 ROA (ttm) 11.5%
Shares Outstanding (M) 48.4 ROE (ttm) 15.2%
Institutional Ownership 89.7% 2006 EPS $2.60
Beta 0.69 2007 EPS (est.) $2.93
Dividend Yield N/A 2008 EPS (est.) $3.42
Pediatrix Medical Group, Inc. is a leading health services company that is producing improved margins while it continues to expand its core services through strategic acquisitions. The company is focused on neonatal, maternal fetal, pediatric cardiology and other pediatric subspecialty care. Additionally, it recently launched into the anesthesiology practice that will help diversify the company and provides an opportunity for further growth. The company is in a good position to further expand its network of physicians and services through strategic acquisitions as its balance sheet carries lots of cash and zero debt. Our intrinsic value is 15% above where shares of PDX are trading and we feel it is an opportune time to add the name to the Henry Fund.

35
INDUSTRIALS 10.33% of the Active Portfolio
Analyst:Zhendong Wang & Swapnil Kadu 11.6% of the S&P 500 Index Throughout the first half of 2007, the macroeconomic data are pretty positive accompanying DJIA’s 10% plus increase through July 2007. While over the last five month in 2007, the performance of stock market was dominated by either the worsen credit crunch or the Fed positive responses to stabilize the market. As to the industry sector, we saw it underperformed by the DJIA. However, we noticed a divergent performance among the sub-industries. For example, equipment manufacturers that have large presence in international markets win rewards from the investors. Looking ahead, we estimate this divergent trends continue for the coming 2008, but overall the industry sector will under perform the market.
Eaton Corporation (ETN) 2.90% of Active Portfolio Hold Recommendation
Key Stock Statistics
Price as of December 11,2007 $92.43 Price/Earnings (ttm) 14.21
52-Week Price Range $71.91-$104.12 Price/Book 2.94
52-Week Return 20.05% Price/Sales 1.09
Market Capitalization (B) $13.48 ROA (ttm) 6.22%
Shares Outstanding (M) 145.08 ROE (ttm) 21.11%
Institutional Ownership 78.6% 2006 EPS $6.15
Beta 1.35 2007 EPS (est.) $6.45
Dividend Yield 1.80% 2008 EPS (est.) $7.01
Eaton is a large diversified manufacturer in the world. The company has four business segments, electrical systems and components serving for power quality, distribution and control; fluid power systems serving industrial, mobile, and aircraft equipment; intelligent truck drive train for safety and fuel economy; and automotive engine air management systems. The downside factors of Eaton’s stock are mainly related with its truck business. The pre-buys of trucks in 2006 which were incurred by the new emission regulation of highway heavy-duty trucks have materially affected the heavy-duty truck industry in 2007, resulting in recording only one third sales as that of 2006. However, we estimate truck market weakness has bottomed as of December, 2007, which is supported by the newly released dada that orders for class 5 to class 8 trucks in November, 2007 increased 12% compared with same period last year. The estimated truck market recovery in 2008 will help Eaton outperform the industry sector. So our recommendation for the company is HOLD.
Hexcel Corporation (HXL) 2.40% of Active Portfolio Hold Recommendation
Key Stock Statistics
Price as of December 11,2007 $25.4 Price/Earnings (ttm) 36.13
52-Week Price Range $16.20-$27.91 Price/Book 6.54
52-Week Return 39.03% Price/Sales 2.00
Market Capitalization (B) $2.43 ROA (ttm) 8.26%
Shares Outstanding (M) 95.59 ROE (ttm) 19.77%
Institutional Ownership 93.60% 2006 EPS $0.71
Beta 1.29 2007 EPS (est.) $0.81
Dividend Yield NM 2008 EPS (est.) $1.02
Hexcel Corporation is the producer of advanced structural materials for the manufacturing of aircrafts, wind turbine blades, and body armor, etc. To focus its resources on the core business of aerospace, Hexcel divested its business units and facilities serving electronics and industrial customers. Meanwhile, the

36
company actively expanded its manufacturing capacity in European and other international markets to capitalize the booming demands, especially the demands from commercial aircrafts and wind energy markets. On December 6, 2007, the company expected fiscal 2008 earnings of 90 cents to 95 cents per share, which is in line of slightly above Wall Street estimates of 91 cents per share. However, there are a few risks inherent in this company like the strong cyclical nature of the commercial aerospace markets, strong competitors from Japan who might erodes Hexcel’s profit margin. Since we bought Hexcel early 2007, the holding return has reached 16.6% versus S&P 5.81% as of December 11. Our recommendation for the company is HOLD since we believe Hexcel will continue to outperform the market for 2008.
Fedex (FDX) 3.07% of Active Portfolio Hold Recommendation
Key Stock Statistics
Price as of November 30,2007 $98.47 Price/Earnings (ttm) 14.68
52-Week Price Range $91.10 - $121.42 Price/Book 2.27
52-Week Return -14.69% Price/Sales 0.84
Market Capitalization (B) $29.66 ROA (ttm) 8.65%
Shares Outstanding (M) 309.27 ROE (ttm) 16.12%
Institutional Ownership 74.20% 2006 EPS $5.94
Beta 0.88 2007 EPS (est.) $6.97
Dividend Yield 0.40% 2008 EPS (est.) $7.64
FedEx Corporation provides transportation, e-commerce and business services to customers and business around the world. These include providing global time-definite air express services for packages, documents and freight, ground based delivery of small packages in North America, expedited critical shipment delivery, customs brokerage solutions, less-than-truckload freight transportation, and customized logistics. FedEx acquired Kinko’s in February 2004, which operates about 1200 copy centers and also provide business services. FedEx Corporation has annual revenues of above $32 billion and operates in 220 countries worldwide. The company operates in four different segments: FedEx Express, FedEx Ground, FedEx Freight and FedEx Kinko’s. FedEx is expected to improve operating margins, which should help drive strong net income and free cash flow growth. Its strong international network developed through acquisitions is expected to increase revenues for FedEx despite slow economic growth in the US. The Ground segment is also expected to grow in double digits as FedEx continues to grab UPS’s market share. We also feel that FedEx has an untapped potential for bundling multiple services as it solves existing customer’s logistics challenges. Norfolk Southern (NSC) 1.76% of Active Portfolio Hold Recommendation
Key Stock Statistics
Price as of November 30,2007 $51.21 Price/Earnings (ttm) 14.02
52-Week Price Range $45.38 - $59.77 Price/Book 2.02
52-Week Return 3.97% Price/Sales 2.15
Market Capitalization (B) $19.61 ROA (ttm) 6.06%
Shares Outstanding (M) 387.24 ROE (ttm) 14.90%
Institutional Ownership 67.90% 2006 EPS $3.73
Beta 1.12 2007 EPS (est.) $3.80
Dividend Yield 1.90% 2008 EPS (est.) $4.38

37
Norfolk Southern Corporation is based in Norfolk, Virginia. It is primarily engaged in the rail transportation of raw materials, intermediate products and finished goods with major operations in the Southeast, East and Midwest and, via interchange with rail carriers, to and from the United States and parts of Canada. The company is also engaged in transporting overseas freight through several Atlantic and Gulf Coast ports. Norfolk southern also has the most extensive intermodal network in the eastern half of the United States and provides comprehensive logistics services. As of December 31, 2006, Norfolk Southern railroads operated 21,000 miles of road in 22 eastern states, the District of Columbia and Ontario, Canada. Norfolk Southern operates in three major sectors - Coal, General merchandise and Intermodal. General merchandise is further divided into sub sectors – Metals/construction, Chemicals, Agriculture/consumer products/government, Automotive, and paper/clay/ forest products. Coal generates 24.8% of Norfolk revenues and 22.6% of its volume whereas the intermodal sector generates 20.5% of its revenues and 41.0% volume for Norfolk Southern suggesting the low yield nature of Intermodal shipments. The General merchandise sector generates the remaining 55% of Norfolk’s revenues distributed evenly (9% to 12%) among automotive, chemicals, paper/clay/forest, metal/construction and agriculture We expect 2007 revenues to grow at a slow pace of 1.54% compared to 2006 revenues owing to reduced shipment volumes. However, in the medium term we expect the shipping volumes and price per unit to increase although at a slower pace than that achieved in recent past (7% as against 13% in 2004-2006). The growth is expected to come from the profitable coal sector and the growing intermodal sector. This growth in coal and intermodal sector is offsetted by sluggish growth in general merchandise sector specifically Automotive. We expect Norfolk to reduce its operating ratio driven by solid pricing and impressive cost management and offsetted by higher fuel prices and declining fuel hedge benefit. Risk to our recommendation include weaker than expected coal shipments, unfavorable fuel price fluctuations, weaker than expected economic growth and severe weather conditions.
TECHNOLOGY 15.77% of the Active Portfolio Analysts: Charles Mersch and Sridip Mukhopadhyaya 16.30% of the S&P 500 Index The Technology Sector performed very well in 2007 in spite of a year plagued with high level of uncertainty about the economy growth rate, the value of the dollar and oil prices. Year to date through November 23rd 2007, the S&P Information Technology Sector posted a 12.2% rise as compared to a 1.6% gain by the S&P 500 itself. This is a reversal in the trend seen in previous years wherein the overall market was outperforming the IT sector quite substantially. This year, a good part of the GDP growth was fueled through growth in spending in the Technology sector particularly enterprise spending. When we inherited the Fund from the class of 2006, the portfolio included four technology holdings: Microsoft (MSFT), Intel (INTC), Emulex (ELX), and Logitech (LOGI). As the year progressed, our investment philosophy was to move away from businesses dependent on consumer spending in general and get more into enterprise spending dependent companies. Also we want to have a balanced tech portfolio with holdings in its major segments – Operating system software, database, semiconductor and internet. The former would allow us to remain somewhat immune to a possible slowdown in the economy while the latter would add breadth and possibly reduce tracking error. Accordingly, we analyzed various companies that fit this investment philosophy and ended up adding Akamai and Oracle and selling off Emulex and Logitech. Microsoft and Intel continue to be held in the portfolio.

38
Microsoft Corp. (MSFT) 5.62% of Active Portfolio Hold Recommendation
Key Stock Statistics
Price as of December 20, 2007 $34.98 Price/Earnings (ttm) 22.83
52-Week Price Range $26.60-37.50 Price/Book 10.11
52-Week Return 15.84% Price/Sales 6.01
Market Capitalization (B) $325.48 ROA (ttm) 19.54%
Shares Outstanding (B) 9.36 ROE (ttm) 43.60%
Institutional Ownership 58.40% 2007 EPS $1.56
Beta 1.35 2008 EPS (est.) $1.81
Dividend Yield 1.20% 2009 EPS (est.) $2.05
Microsoft is the world’s largest technology based company, and has a dominant market share in the computer Operating System and the Office Productivity markets. Most well known for their Windows operating system, the Redmond, WA based company operates in seven segments; Information Worker, Microsoft for Business, Mobile and Embedded, Home and Entertainment, MSN, Client, and Server and Tools. It has a great amount of diversification inherent in the company, and is protected from a protracted downside slide by all their operating units. In 2007 Microsoft had a number of new products lined up for launch and we felt that this would boost its profits and would bolster its stock price. Microsoft launched its much awaited Vista operating system along with the Office 2007. These products were a significant leap over their predecessors and were well accepted by the market. Initially the market was somewhat slow to adjust the new expectations into their valuation but after Microsoft reported their 2008 first quarter results which significantly beat market expectations, the stock price rose considerably. We felt confident about Microsoft’s strength going forward as it continued to take steps to combat threats like open source software and software piracy particularly in the booming emerging markets. We feel that Microsoft will evolve with the environment and will deliver solid returns in the future. Dell Inc. (DELL) Not in the Portfolio Sell Recommendation
Key Stock Statistics
Price as of December 20, 2007 $24.36 Price/Earnings (ttm) 18.38
52-Week Price Range $21.61-30.77 Price/Book 7.83
52-Week Return (8.07)% Price/Sales 0.90
Market Capitalization (B) $54.59 ROA (ttm) 8.11%
Shares Outstanding (B) 2.24 ROE (ttm) 58.50%
Institutional Ownership 64.50% 2007 EPS $1.33
Beta 1.70 2008 EPS (est.) $1.37
Dividend Yield N/A 2009 EPS (est.) $1.61
Dell is a Delaware based corporation founded in 1984 by Michael Dell. Dell Inc. is a premier provider of products and services worldwide that enable customers to build their information technology and internet infrastructures. Dell offers a wide range of product categories including desktop computer systems, mobility products, software and peripherals, servers and networking products, etc. Dell operates in three geographic segments, namely North America, Europe and EAFE (Europe, Africa and the Far East). Dell had been constantly losing market share to rival Hewlett-Packard (HPQ) which reflected in their performance wherein they were underperforming the broad index over all time horizons up to 5 years. This led to founder Michael Dell coming back to the CEO position and making substantial changes to the top

39
management. It even changed its business model from a “Build-to-Order” system to retail marketing wherein it made its computers available at large retail superstores such as Wal-Mart. In spite of the several changes and efforts that appeared to be in the right direction, there did not seem to be any positive upside to this stock and there was considerable risk built into the uncertainty about its near term performance. It has since continued to struggle with its performance slightly missing street earnings estimates last quarter.
Google Inc. (DELL) Not in the Portfolio Buy Recommendation
Key Stock Statistics
Price as of December 20, 2007 $680 Price/Earnings (ttm) 52.70
52-Week Price Range $437- 747.24 Price/Book 9.99
52-Week Return 43.68% Price/Sales 14.07
Market Capitalization (B) $211.91 ROA (ttm) 17.61%
Shares Outstanding (Mil) 312.84 ROE (ttm) 22.74%
Institutional Ownership 80.46% 2007 EPS $12.78
Beta 1.23 2008 EPS (est.) $13.41
Dividend Yield N/A 2009 EPS (est.) $18.24
In essence, Google is a search-engine and it maintains an online index of websites and other content. This is made freely available to all users who can access a computer via the internet. While this activity by itself does not generate revenues, Google earns its revenues from businesses that utilize Google’s portal for online advertising to access millions of customers across the globe. By charging advertisers only when people click on their ads, Google has made large-scale advertising affordable to small businesses that found it difficult to afford the print or television media at this scale.
Incorporated in California in 1998, Google Inc. was reincorporated in August 2003 as a publicly traded company. Since then Google has acquired several companies like Pyra Labs, Applied Semantics Inc., Urchin Software and more recently in November 2006, YouTube. The “Cost-per-Click” business model increases customer satisfaction and value added and therefore the customer will be loyal. We feel this will stand Google in good stead against its competitors. With search technologies like “PageRank” (developed at Stanford) and text-matching techniques, Google is able to provide the best search results which in turn ensure that advertising online pays off well to the advertisers.
Given Google’s emphasis on innovation, growth and its presence in emerging markets, we felt that Google was well poised to perform extremely well in both the short and the long term. It was easy to see that Google would not be restricted to just internet based services but would foray into other products as it matured in its business. Based on the prospects of growth latent in the company, we proposed a Buy rating on this stock.
Oracle Corp. (ORCL) 3.74% of Active Portfolio Buy Recommendation
Key Stock Statistics
Price as of December 20, 2007 $22.11 Price/Earnings (ttm) 24.50
52-Week Price Range $437- 747.24 Price/Book 6.11
52-Week Return 24.27% Price/Sales 5.75
Market Capitalization (B) $106.32 ROA (ttm) 12.66%
Shares Outstanding (B) 5.12 ROE (ttm) 27.19%
Institutional Ownership 54.90% 2007 EPS $1.22
Beta 1.04 2008 EPS (est.) $1.38
Dividend Yield N/A 2009 EPS (est.) $1.87

40
Oracle Corporation is the leading enterprise software company. The company develops, manufactures, markets, distributes and services database, middleware software and application software. The company’s technology operates on a variety of server configurations and supports a choice of operating systems including Linux, UNIX and Windows. The company has operations in various countries including the US, the UK, France, Germany and Canada. The company operates through two business segments: software and services.
Oracle has grown inorganically through numerous acquisitions over the last 3 years being able to continue selling the products of the acquired companies and gain market share. We feel that Oracle has an organization structure that allows for easy and successful integration of companies at a rate which few other companies can parallel. This gives Oracle not only greater market share and market access but also allows it to buy-out innovation reducing the pressure to innovate organically. This makes the company low risk in spite of its high growth since it is not dependent in-house for its growth or innovation. The company recently announced its 2008 second quarter results in which it has beaten analyst estimates of revenues, earnings and growth in license revenues. For the three months ended November 30th 2007, Oracle posted earnings of 25cents per share which is up 35% from last year. We feel that Oracle has a strong suite of products which are stackable and support a multi-vendor and multi-operating system environments. Thus it is in a stronger position than its immediate rivals S.A.P., IBM and Microsoft. Given its enterprise orientation, we felt it would be a good stock to bring into the portfolio.
Intel Corp. (INTC) 4.11% of Active Portfolio Hold Recommendation
Key Stock Statistics
Price as of December 20, 2007 $26.32 Price/Earnings (ttm) 24.92
52-Week Price Range $18.75-27.99 Price/Book 3.70
52-Week Return 25.41% Price/Sales 4.06
Market Capitalization (B) $153.13 ROA (ttm) 9.40%
Shares Outstanding (B) 5.85 ROE (ttm) 16.35%
Institutional Ownership 62.50% 2006 EPS $1.05
Beta 1.47 2007 EPS (est.) $1.21
Dividend Yield 1.70% 2008 EPS (est.) $1.51
Headquartered in Santa Clara, California, Intel Corporation was established in 1968. Intel is the world's largest semiconductor chip maker, developing advanced integrated digital technology platforms for the computing and communications industries. The company is best known for its Pentium, Celeron and Xeon microprocessors. Over the last one year, the company has introduced a slew of new products which use frontier technology and meet the highest standards for processing speeds and energy efficiency. The company plans to launch its next generation 45nanometer technology through its Penryn family of processors. Intel’s technology leadership gives it a head-start over other players in the industry.
At the time of our analysis, we felt that given the various steps that Intel had taken to revamp its product line and to reduce costs, the stock would experience further upside and therefore decided to continue to hold it in the portfolio.

41
Apple Inc. (AAPL) Not in the Portfolio Buy Recommendation
Key Stock Statistics
Price as of December 20, 2007 $184 Price/Earnings (ttm) 46.58
52-Week Price Range $76.77- 196.83 Price/Book 10.98
52-Week Return 115.88% Price/Sales 6.67
Market Capitalization (B) $160.33 ROA (ttm) 12.95%
Shares Outstanding (Mil) 875.54 ROE (ttm) 28.52%
Institutional Ownership 67.6% 2007 EPS $4.07
Beta 1.87 2008 EPS (est.) $5.05
Dividend Yield N/A 2009 EPS (est.) $6.23
Apple Inc. established in 1976, is a developer, manufacturer and marketer of hardware, software, portable devices and services. Apple engages in the design, manufacture and marketing of personal computers and related software, services, peripherals, and networking solutions. The Company also designs, develops, and markets a line of portable digital music players along with related accessories and services, including the online distribution of third-party music, audio books, music videos, short films, and television shows. Apple is differentiated through its ownership of the computing value chain (software, hardware, content, distribution). Best known for its iPods and Mac laptops and desktops Apple possesses a strong global brand and fiercely loyal customer base, supported by its retail store network (now at 197 with 32 new stores opened in 2007). Owing to innovative designs and marketing, hardware reliability, customer service, strong execution and competitive advantage, Apple has captured 2.4% share of the PC market (7.9% of >$1000 PC market) with its Mac desktop and portables which have seen a resurgence in sales in the last 4 years. Apple also commands a 69% share of US MP3 player market with 118M iPods shipped till end of fiscal 2007 and 67% of US online music market with over 300M iTunes Stores installations which now serves 22 countries.
Apple’s performance has been solid over the last few years with strong Quarter IV results and higher guidance for first quarter of 2008. With the launch of new products like iPhones, new brands of iPods and a new version of its operating system called OS X Leopard, we felt that Apple will continue to experience high growth which will reflect in its stock price. Hence we recommended a Buy rating for this stock.
Akamai (AKAM) 2.44% of Active Portfolio Buy Recommendation
Key Stock Statistics
Price as of December 1, 2007 $38.06 Price/Earnings (ttm) 72.93
52-Week Price Range $27.75-$59.69 Price/Book 4.63
Price/Sales 10.20
Market Capitalization (B) $5.88 ROA (ttm) 5.77%
Shares Outstanding (M) 166.16 ROE (ttm) 8.51%
Institutional Ownership 89.60% 2006 EPS $..37
Beta 1.4 2007 EPS (est.) $1.30
Dividend Yield 0.00% 2008 EPS (est.) $1.70
Akamai Technologies Inc. is the worlds leading Content Delivery Network and Application Delivery Network provider, with an estimated 70% of the market share. The company had revenues of $427 million during the fiscal year ending December 31st, 2006, with net income of $57 million or $0.37 per share. The company was founded in 1999 by Tom Leighton an MIT Professor of Applied Mathematics and graduate student Danny Lewin along with students from the Sloan School of Business.

42
Akamai’s Content Delivery Network optimizes the speed and reliability of data transfer over the internet. Akamai’s revenue comes from committed traffic agreements and “bursting” (bandwidth usages above the contracted amount). As of fiscal year 2006, 70% of revenues came from committed traffic volumes, while 30% came from bursting. A large portion of Akamai’s customers are on 12-month committed traffic contracts, although the average contract is 18-months. While new companies are beginning to enter the marketplace, the Henry Fund believes that Akamai’s patents, early entry, size of its network, and financial stability will allow Akamai to continue to flourish over the next couple of years.
Emulex (ELX) Sold Position Sell Recommendation
Key Stock Statistics
Price as of December 1, 2007 $16.75 Price/Earnings (ttm) 125
52-Week Price Range $16.05-$23.80 Price/Book 2.58
Price/Sales 3.78
Market Capitalization (B) $1.38 ROA (ttm) 7.11%
Shares Outstanding (M) 83.57 ROE (ttm) 2.08%
Institutional Ownership 88.00% 2006 EPS $0.48
Beta 2.73 2007 EPS (est.) $1.03
Dividend Yield 0.00% 2008 EPS (est.) $1.16
Emulex Corporation is a leading provider of advanced storage networking infrastructure solutions. Emulex’s products supplement the infrastructure that houses data. Its products provide the line of communication from the servers that store the data to the servers that process the data. A majority of Emulex’s sales are to original equipment manufacturers.
Emulex’s products include Host Bus Adapters (HBAs), embedded storage switches, and input/output controllers. Emulex’s products improve the access to and storage of electronic data and applications. The total projected market for Emulex’s products is estimated to be close to $2.7B in 2009. The majority of this growth is expected to come from embedded storage products and intelligent network products. Macro economic conditions combined with the growth in the computer storage devices sector will enable Emulex to grow. However, the continuing growth of Emulex’s primary competitor, Qlogic, and its successful market share gain of Host Bus Adapters will hamper Emulex’s rate of growth.
Logitech (LOGI) Sold Position Sell Recommendation
Key Stock Statistics
Price as of December 1, 2007 $34.03 Price/Earnings (ttm) 35.14
52-Week Price Range $25.05-$37.23 Price/Book 7.47
Price/Sales 2.89
Market Capitalization (B) $6.31 ROA (ttm) 12.15%
Shares Outstanding (M) 181.29 ROE (ttm) 23.59%
Institutional Ownership 3.4% 2007 EPS $.1.26
Beta 1.4 2008 EPS (est.) $1.32
Dividend Yield 0.00% 2009 EPS (est.) $1.84

43
Logitech International is an Apples, Switzerland based company that designs and manufactures computer and electronic peripherals. Logitech International currently employs over 7,500 employees throughout the world, with over 5,500 employees in Asia. The end of fiscal year 2007 was marked by record revenue and profits for the firm. Revenue increased for the ninth consecutive year to just over $2 billion, while earnings per share went from $0.99 to $1.26. The company was founded by current Chairman Dr. Daniel Borel in 1981.
Logitech International primarily sells through retail channels but has expanded its OEM sales in recent years. The largest portion of Logitech’s sales has come from the corded and cordless computer peripherals. This segment is made up of computer mice and keyboards and accounted for 41% of sales in 2007. The fastest growth, in terms of percentages, was in the remote control segment, which saw 60% year over year growth. The success in remote controls was driven by the expanded acceptance of the Harmony brand of remote controls.
However, we believe that the current sub-prime crisis and the continued high price of oil will stymie consumer confidence in the short term, and limits the upside potential of Logitech’s sales.
UTILITIES 4.81% of Active Portfolio Analyst: Barkha Punjabi 3.60% of S&P 500 Index For 2007, the utility sector has performed very well compared to the broader market with the S&P 500 Utilities Index delivering a year-to-date return of 17.22% compared to the 2.59% return of the S&P 500 Index. For our current holding of FPL Group, we believe the company has strong fundamentals and a favorable growth outlook. We have rated the stock a HOLD until we find a suitable utility to replace it in the Henry Fund portfolio.
FPL Group (FPL) 4.81% of Active Portfolio Hold Recommendation
Key Stock Statistics as of November 30, 2007
Price as of November 30, 2007 $69.76 Price/Earnings(ttm) 20.32
52-Week Price Range $52.72-$70.14 Price/Book 2.64
52-Week Return 32.2% Price/Sales 1.84
Market Capitalization(B) $28.52 ROA(ttm) 3.64%
Shares Outstanding (M) 407.08 ROE(ttm) 13.43%
Institutional Ownership 63.54% 2006 EPS $3.26
Beta 0.49 2007 EPS $3.40
Dividend Yield 2.38% 2008 EPS (est.) $3.75
FPL Group is the holding company for Florida Power and Light Co., the nation’s largest investor-owned regulated electric utility company, and FPL Energy, a wholesale energy provider with operations in 25 states. The company is also the nation’s largest supplier of wind generated power with its 4000 megawatts of wind power accounting for nearly 35% of total installed U.S. wind power capacity. FPL has a diverse fuel mix with more than 40% of its generational capacity coming from wind and nuclear power plants. This fuel diversity enables the company to manage its power generation business more efficiently and economically, even when energy markets are volatile. For 2007, steady growth in its regulated Florida business and significant increase in profits from its unregulated wholesale energy subsidiary have led to higher earnings growth. We expect FPL to continue to enjoy favorable customer growth in its regulated business primarily due to the forecasted 35% increase in Florida’s population by 2030 and due to favorable rate hikes. For the period 2007 to 2012, the company’s unregulated subsidiary hopes to add total wind capacity of approximately 8,000 to 10,000 megawatts, at an annual rate of 1,500 to 2,000 megawatts. We expect this increase in its wind energy portfolio to be good for earnings growth in the coming years.

44
During the past twelve months, FPL delivered a total return of 32.2%, largely outperforming the industry and the S&P 500 index. Based on the company’s strong balance sheet and sustainable growth in the near term, we continue to view FPL Group as a viable holding for the portfolio.
TELECOMMUNICATIONS 2.35% of Active Portfolio Analyst: Barkha Punjabi 3.50% of S&P 500 Index For 2007, the telecommunications sector has provided a return of 7.36%, versus a 2.59% increase in the S&P 500 Index. We expect the telecommunication sector to continue to outperform the S&P 500 in 2008 as we believe some of the stocks in the sector are undervalued and have good return potential. In the last quarter, there has been some uncertainty in the broadcasting and cable TV sector with the market reacting strongly to a decrease in basic cable subscribers, which has affected the stock price of major cable TV players like Comcast and Time Werner. In the near term, we recommend reevaluating Comcast’s positing in the Henry Fund.
AllTel Corp. (AT) Sold Position in 2007 Hold Recommendation
Key Stock Statistics as of November 30, 2007
Price as of November 30, 2007 $71.46 Price/Earnings(ttm) 27.1
52-Week Price Range $55.69-$71.53 Price/Book 2.1
52-Week Return 18.8% Price/Sales 3.0
Market Capitalization(B) $24.61 ROA(ttm) 5.22%
Shares Outstanding (M) 344.28 ROE(ttm) 7.74%
Institutional Ownership 72.00% 2006 EPS $2.95
Beta 0.85 2007 EPS $2.60
Dividend Yield 0.7% 2008 EPS (est.) N/A
Alltel Corporation is the largest regional wireless company in the U.S. and the fifth largest overall in terms of revenues and number of subscribers. In July 2006, the company spun off its wireline business to Valor Communications Group of Irving, Texas, in a $4.9 billion deal that created Windstream Corp. Its emergence as a stand-alone wireless company with a vast rural footprint made the company a very attractive acquisition target. In late 2006, Alltel management confirmed that the company was reviewing a wide span of strategic options, including a potential sale to private equity or a strategic takeover. On May 21, 2007, the company agreed to a merger agreement with TPG Capital and GS Capital Partners (GSCP) in a transaction valued at $24.7 billion. Based on our valuation, we did not expect any further bids and closed our position with Alltel on June 18, 2007 with year-to-date returns of 12.0%.
Comcast Corp. (CMCSA) 2.35% of Active Portfolio Hold Recommendation
Key Stock Statistics as of November 30, 2007
Price as of November 30, 2007 $20.54 Price/Earnings(ttm) 23.60
52-Week Price Range $21.26-$39.82 Price/Book 1.33
52-Week Return -35.9% Price/Sales 1.86
Market Capitalization(B) $55.56 ROA(ttm) 2.16%
Shares Outstanding (B) 3.07 ROE(ttm) 5.84%
Institutional Ownership 75.80% 2006 EPS $0.80
Beta 1.08 2007 EPS $0.65
Dividend Yield 0.0% 2008 EPS (est.) $1.03

45
Serving over 24.1 million customers, Comcast Corp. is the largest U.S. multi-channel television operator, as well as a provider of cable programming content. With a 26% market share, the company dominates the U.S. multi-channel television market. The Henry Fund portfolio purchased Comcast in September 2007; however, since then the company reported a decrease in revenue generating units for 3Q2007 citing tough economic conditions and increased competition from satellite operators and telecommunication companies. Further, the company recently provided lower 2007 guidance cutting its target for cable revenue growth to 11% from 12%, on growth of revenue generating units of 6 million, down from its earlier forecasted 6.5 million. In light on this recent news, we recommend the Fund to reevaluate this position.

46
Statement Of Security Holdings
Shares Price Value Weight Shares Price Value Weight
Akamai Technologies AKAM 360 38.06 13,702$ 2.4%
Alcoa AA 220 36.37 8,001$ 1.4%
American Capital Strategies ACAS 340 37.61 12,787$ 2.3%
Bank of America BAC 390 53.85 21,002$ 4.2% 465 46.13 21,450$ 3.8%
BHP Billiton Limited (ADR) BHP 250 41.43 10,358$ 2.1% 250 75.83 18,958$ 3.4%
Central European Distribution CEDC 450 28.65 12,893$ 2.6% 450 50.00 22,500$ 4.0%
Charles River Labs CRL 250 41.75 10,438$ 2.1% 325 63.53 20,647$ 3.7%
Citadel Broadcasting Corp CDL 24 2.30 55$ 0.0%
Comcast Corp CMCSA 705 20.54 14,481$ 2.6%
Eaton Corporation ETN 175 89.31 15,629$ 2.8%
Endo Pharmaceuticals ENDP 515 27.41 14,116$ 2.5%
Exxon-Mobil Corp. XOM 350 76.81 26,884$ 5.3% 250 89.16 22,290$ 4.0%
FedEx FDX 125 115.43 14,429$ 2.9% 175 98.47 17,232$ 3.1%
FPL Group FPL 375 53.30 19,988$ 4.0% 375 69.76 26,160$ 4.7%
Hexcel Corporation HXL 540 25.47 13,754$ 2.4%
Intel INTC 850 26.08 22,168$ 3.9%
Johnson & Johnson JNJ 330 65.91 21,750$ 4.3% 250 67.74 16,935$ 3.0%
Lowe's Companies, Inc. LOW 300 30.16 9,048$ 1.8% 300 24.41 7,323$ 1.3%
Microsoft MSFT 875 29.36 25,690$ 5.1% 875 33.60 29,400$ 5.2%
Norfolk Southern NSC 190 49.25 9,358$ 1.9% 190 51.21 9,730$ 1.7%
Oracle Corp. ORCL 975 20.18 19,676$ 3.5%
Patriot Coal Corp PCX 33 33.81 1,116$ 0.2%
Peabody Energy Corporation BTU 330 55.64 18,361$ 3.3%
Pepsico Inc. PEP 255 61.97 15,802$ 3.1% 320 77.18 24,698$ 4.4%
Procter & Gamble PG 250 62.79 15,698$ 3.1% 250 74.00 18,500$ 3.3%
Schlumberger SLB 280 93.45 26,166$ 4.7%
Stryker Corporation SYK 245 72.63 17,794$ 3.2%
Travelers Companies TRV 400 51.81 20,724$ 4.1% 400 53.11 21,244$ 3.8%
Target Corp. TGT 240 58.09 13,942$ 2.8% 240 60.06 14,414$ 2.6%
Union Bank of Switzerland UBS 360 60.22 21,679$ 4.3% 360 50.48 18,173$ 3.2%
Walgreen Company WAG 400 36.59 14,636$ 2.6%
Walt Disney Holdings Co. DIS 525 33.05 17,351$ 3.5% 325 33.15 10,774$ 1.9%
StreetTracks Capital Markets KCE 275 65.92 18,128$ 3.6% 275 66.42 18,266$ 3.2%
S&P 500 Index SPDR SPY 205 140.53 28,809$ 5.7% 75 148.66 11,150$ 2.0%
Logitech Intl. LOGI 600 29.56 17,736$ 3.5%
Alladin Knowledge Systems ALDN 650 17.90 11,635$ 2.3%
Citigroup C 400 49.59 19,836$ 3.9%
International Speedway Corp. ISCA 220 51.83 11,403$ 2.3%
Patterson-UTI Energy PTEN 500 27.71 13,855$ 2.8%
SanDisk SNDK 250 44.40 11,100$ 2.2%
ValueClick VCLK 400 24.87 9,948$ 2.0%
Vanguard Industrials ETF VIS 250 65.65 16,413$ 3.3%
Windstream WIN 206 13.94 2,872$ 0.6%
Alltel AT 200 56.74 11,348$ 2.3%
Community Health Systems CYH 425 35.00 14,875$ 3.2%
Emulex Corporation ELX 500 20.87 10,435$ 2.1%
Pfizer PFE 620 27.49 17,044$ 3.3%
Total Equity Portfolio 502,466$ 99.9% 562,285$ 100.0%
Money Market/Cash Account 304$ 0.1% 239$ 0.0%
Effective Portfolio Value 502,769$ 562,524$
S&P500 (index change) $SPX.X 1,418.30 1,481.14
Security TickerNovember 30, 2006 November 30, 2007
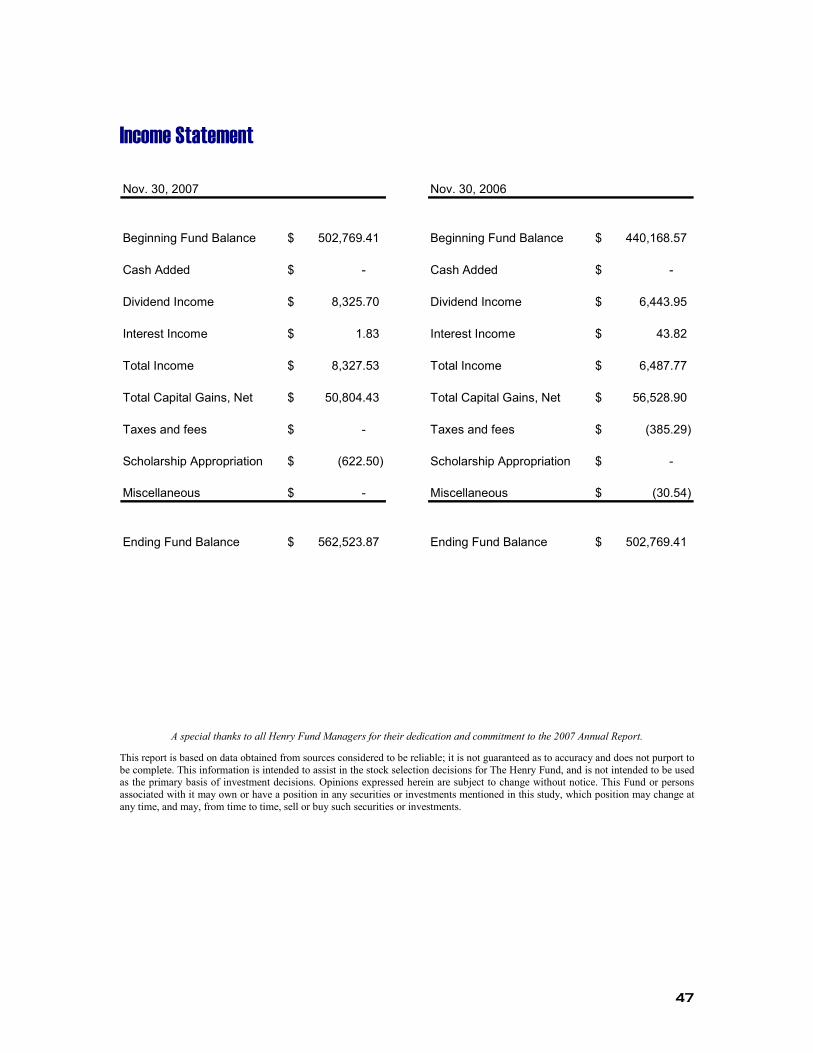
47
Income Statement
Nov. 30, 2007 Nov. 30, 2006
Beginning Fund Balance 502,769.41$ Beginning Fund Balance 440,168.57$
Cash Added -$ Cash Added -$
Dividend Income 8,325.70$ Dividend Income 6,443.95$
Interest Income 1.83$ Interest Income 43.82$
Total Income 8,327.53$ Total Income 6,487.77$
Total Capital Gains, Net 50,804.43$ Total Capital Gains, Net 56,528.90$
Taxes and fees -$ Taxes and fees (385.29)$
Scholarship Appropriation (622.50)$ Scholarship Appropriation -$
Miscellaneous -$ Miscellaneous (30.54)$
Ending Fund Balance 562,523.87$ Ending Fund Balance 502,769.41$
A special thanks to all Henry Fund Managers for their dedication and commitment to the 2007 Annual Report.
This report is based on data obtained from sources considered to be reliable; it is not guaranteed as to accuracy and does not purport to be complete. This information is intended to assist in the stock selection decisions for The Henry Fund, and is not intended to be used as the primary basis of investment decisions. Opinions expressed herein are subject to change without notice. This Fund or persons associated with it may own or have a position in any securities or investments mentioned in this study, which position may change at any time, and may, from time to time, sell or buy such securities or investments.