the health of older workers – implications for future labour participation 11 th global conference...
TRANSCRIPT

The Health of Older Workers – Implications for Future Labour Participation
11th Global Conference of the International Federation of Aging28 May to 1st June, 2012
Dr Jennifer BuckleyDr Lisel O’Dwyer
Professor Graeme Hugo
University of Adelaide, Australian Population and Migration Research Centre

Overview
• Rationale for the study
• Project overview
• Methods
• Baby boomers’ labour participation in context
• Health and workforce attachment
• Workplace environments
• Implications for Policy and Research

Population Ageing in Australia
Projected Population Aged Under 15 Years, Australia, 2002-2101
Projected Population Aged 65 Years and Over, Australia, 2002-
2101
Source: ABS, Catalogue No. 3222.0, 2003, p85

Rationale for the Study
• Fewer new entrants to labour market
• Increase and extend labour participation in older age groups
• Health – underpins labour market capacity
• Health research – disease/disability/burden on health system
• Work-related research – skills training and workplace management
• Need for more research on the health/work

Project Overview
• ‘Australia’s Baby Boomer Generation: Obesity and Work – Patterns, Causes and Implications’
• Key objective – explore interactions between health and work
• Aim – provide a health perspective for work-related policies on older workers
• Baby boomers– A distinct policy group– Amplify the effects of population ageing– Significant impact as they exit the workforce
• Today’s presentation – preliminary exploration of data
Methods
Labour Participation Data - Census data 1981 and 2006; ABS Labour Force Surveys
Health & Work Data - North West Adelaide Health Study (NWAHS) (n=4060)

Geographical Context
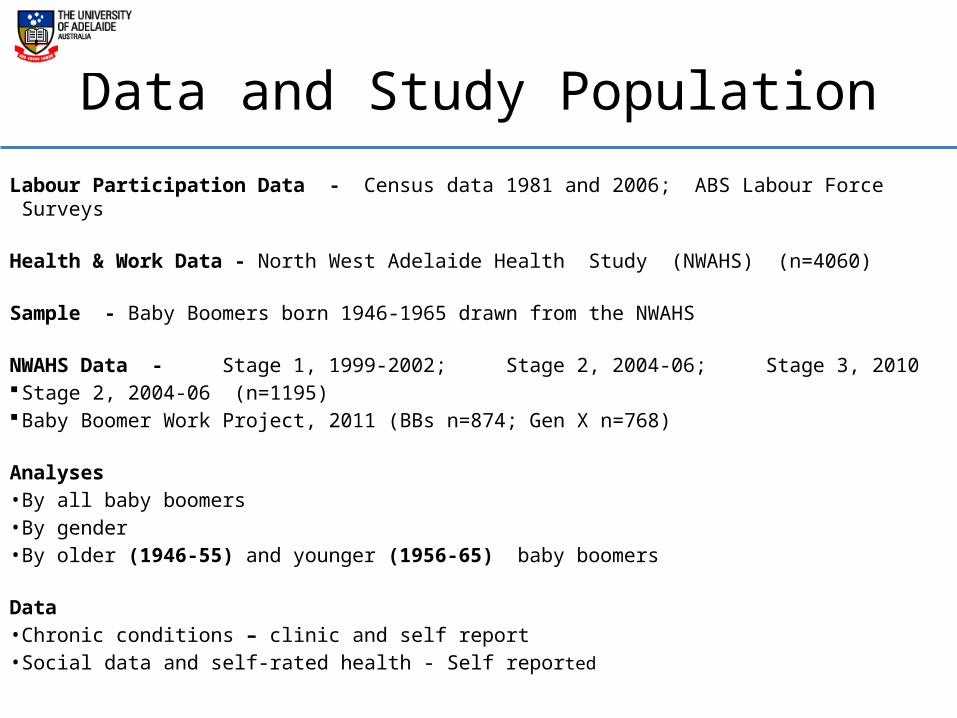
Data and Study Population
Labour Participation Data - Census data 1981 and 2006; ABS Labour Force Surveys
Health & Work Data - North West Adelaide Health Study (NWAHS) (n=4060)
Sample - Baby Boomers born 1946-1965 drawn from the NWAHS
NWAHS Data - Stage 1, 1999-2002; Stage 2, 2004-06; Stage 3, 2010 Stage 2, 2004-06 (n=1195) Baby Boomer Work Project, 2011 (BBs n=874; Gen X n=768)
Analyses• By all baby boomers • By gender• By older (1946-55) and younger (1956-65) baby boomers
Data• Chronic conditions – clinic and self report• Social data and self-rated health - Self reported

Contextualising
Baby Boomers’ Labour Participation

Trends in Participation of Older Workers
Age Groups: 55-59; 60-64; 65+
May-70 Jun-99 Jan-06 Jul-10 May-70 Jun-99 Jan-06 Jul-10Males Females
0
10
20
30
40
50
60
70
80
90
100
55-59 60-64 65+
Perc
enta
ge %
Source: ABS Labour Force Surveys

Employment Status45-54 Year Olds in 1981 and 2006
Pre-war Cohort
Baby Boomers
Pre-war Cohort
Baby Boomers
Pre-war Cohort
Baby Boomers
Persons Males Females
0
10
20
30
40
50
60
70
80
90
100
Employed Unemployed/NILF
Perc
enta
ge %
Source: ABS Census, 1981; 2006b

Employment StatusBaby Boomers 1946-1965
Volunteering
Unemployed
Unable to work
Home Duties
Casual
Retired
Part time
Full time
0 10 20 30 40 50 60
Percentage %
Source: NWAHS TFU Survey 2 (CATI), 2007

Factors Influencing Labour Participation in Older Workers
• Age discrimination
• Lack of access to re-training
• Personal commitments
• Financial security
• Desire for more leisure
• Low education levels

Education by Age Cohort and Gender in Baby Boomers 1946-55 and 1956-65
1946-55 1956-65 1946-55 1956-65Males Females
0
5
10
15
20
25
Left school at 15 years
Perc
enta
ge %
Source: NWAHS Stage 2, 2004-06
13.7%
5.4%
20.2%
8.8 %

Employment StatusFemales by Age Cohort and Education Level – NWAHS
Baby Boomers 1946-55 and 1956-65
1946-55 1956-65 1946-55 1956-65 1946-55 1956-65Secondary Certificate/Diploma Tertiary
0
10
20
30
40
50
60
70
Full-time Part-time/casual Home Duties
Perc
enta
ge %
Note: Retired, unemployed and ‘other’ categories excluded.Source: NWAHS Stage 2, 2004-06

Employment StatusFemales by Education Level – Census Baby Boomers - 1946-55 and 1956-
65
0
10
20
30
40
50
60
1946-55 1956-65 1946-55 1956-65 1946-55 1956-65
Secondary Certificate/Diploma Tertiary
Pe
rce
nta
ge %
Full-time Part-time/casual Home Duties
Source: ABS 2006 Census (Australia) (ABS 2006c)

Health and Work

Employment by Self-Rated HealthBaby Boomers 1946-1965
Unable to work: 4.1%
Retired: 7.5%
Unemployed: 2.6%
Casual: 7.3%
Home Duties: 5.3%
Part-time: 16.6%
Full-time: 56.3%
0% 10% 20% 30% 40% 50% 60% 70% 80% 90% 100%
Good-Excellent SR Health Poor-Fair SR Health
*p<.05; **p<.001Source: NWAHS TFU Survey 2 (CATI), 2007
**
*
**
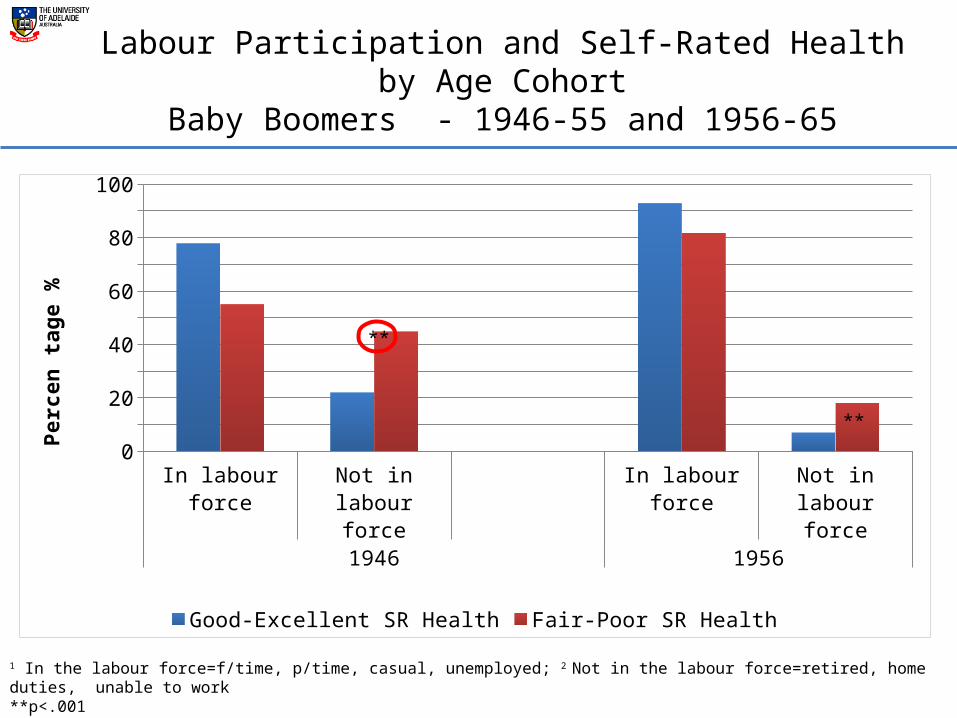
Labour Participation and Self-Rated Health by Age Cohort
Baby Boomers - 1946-55 and 1956-65
1 In the labour force=f/time, p/time, casual, unemployed; 2 Not in the labour force=retired, home duties, unable to work**p<.001Source: NWAHS TFU Survey 2 (CATI), 2007
In labour force Not in labour force
In labour force Not in labour force
1946 1956
0
10
20
30
40
50
60
70
80
90
100
Good-Excellent SR Health Fair-Poor SR Health
Perc
en ta
ge %
**
**

Percentage of Each Employment Category with Selected Chronic Conditions
Baby Boomers 1946-64
% of sample with CC Full-time Casual Un-employed Retired Unable to work0
5
10
15
20
25
30
35
40
45
Arthritis Depression COPD Diabetes Cardio
Perc
enta
ge %
Source: NWAHS Stage 2, 2004-06; NWAHS TFU Survey 2 (CATI), 2007

Odds Ratios for Reporting Not In the Labour Force by Chronic Condition and Age Cohort
Baby Boomers - 1946-55 and 1956-65
*p<.05; Source: NWAHS TFU Survey 2 (CATI), 2007
ILF NILF ILF NILF1946-55 1956-65
0
5
10
15
20
25
30
35
40
45
Arthritis Depress Diabetes COPD
Perc
enta
ge %
**5.4
*2.1
*2.4
*2.2
*3.3 *
2.6

Odds Ratios for Reporting Not in the Labour Force by Chronic Condition and Gender
Baby Boomers 1946-1965
ILF NILF ILF NILFMales Females
0
5
10
15
20
25
30
35
40
Arthritis Depress Diabetes COPD
Perc
enta
ge %
*p<.05; **p<.001Source: NWAHS TFU Survey 2 (CATI), 2007
**3.1
*2.8
*3.7
*2.8
*2.0
**4.4
*2.7
14.4%
8.8%

Variable Work Conditions &Self-Rated Health
Baby Boomers 1946-1965
*p<.05;Source: NWAHS TFU Survey 2 (CATI), 2007
**3.1
*2.8
*3.7
*2.8
*2.0
**4.4
*2.7
No Variability Partial Variability High Variability0
10
20
30
40
50
60
70
80
90
Good-Excellent SRH Poor-Fair SRH
Perc
enta
ge %
*


Self-Rated Health and Job StrainBaby Boomers - 1946-1965
**p<.001Source: NWAHS Work Data (CATI), 2011
Low Strain Active Job Passive Job High Strain0
10
20
30
40
50
60
70
80
90
Good-Ex SRH Poor-Fair SRH
Perc
enta
ge %
**

Job Satisfaction and Self-Rated HealthBaby Boomers 1946-1965
*p<.05;Source: NWAHS Work Data (CATI), 2011
Dissatisfied/Very Dissatisfied Not Sure Satisfied/Very Satisfied0
10
20
30
40
50
60
70
80
90
Good-Ex SRH Poor-Fair SRH
Perc
enta
ge %
*
*

Flexibility and Job SatisfactionBaby Boomers - 1946-1965
**p<.05Source: NWAHS Work Data (CATI), 2011
High Flexibility Partial Flexibility No flexibility0
10
20
30
40
50
60
70
80
90
100
Satisfied Not sure Dissatisfied
Perc
enta
ge %
*

Variability and Job SatisfactionBaby Boomers - 1946-1965
^ p=<.1Source: NWAHS Work Data (CATI), 2011
No Variability Partial Variability High Variability0
10
20
30
40
50
60
70
80
90
Satisfied Not sure Dissatisfied
Perc
enta
ge %
^


Satisfaction with Work-Life Balance by Self-Rated Health
Baby Boomers - 1946-1965
Very Dissatisfied Dissatisfied Neutral Satisfied Very Satisfied0
10
20
30
40
50
60
70
80
90
100
Good-Excellent SRH Poor-Fair SRH
Perc
enta
ge % **
**
**
*p<.001;Source: NWAHS Work Data (CATI), 2011


Co-worker Support in the Workplace – ‘People I work with are helpful in getting the job
done’Baby Boomers 1946-1965
*p<.001;Source: NWAHS Work Data (CATI), 2011
Disagree/Strongly Disagree Agree/Strongly Agree0
10
20
30
40
50
60
70
80
90
Good-Ex SRH Poor-Fair SRH
Perc
enta
ge %
**
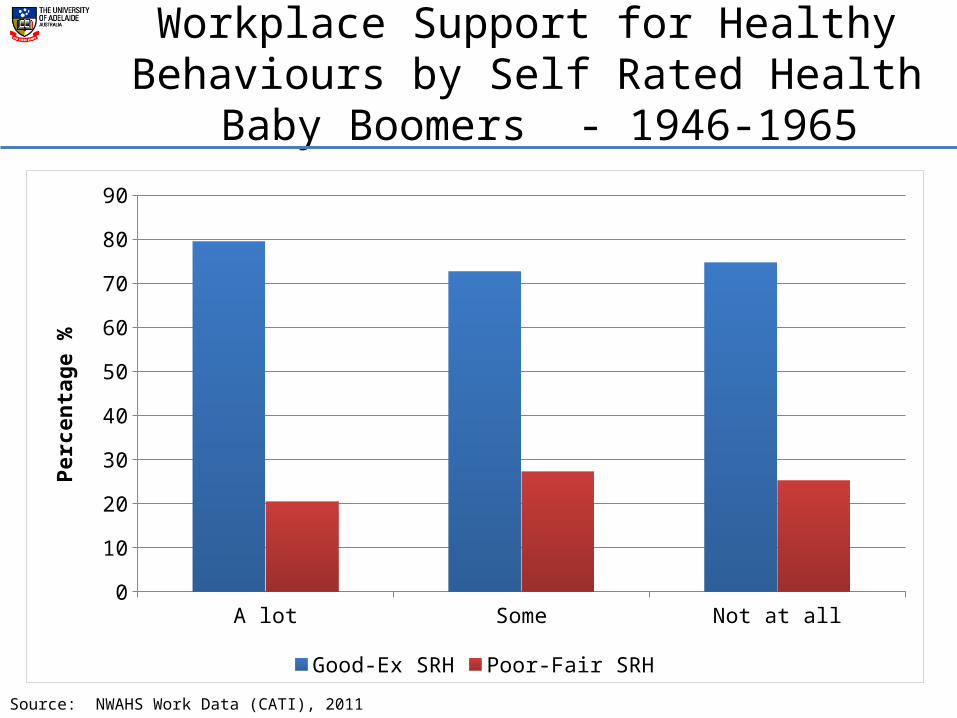
Workplace Support for Healthy Behaviours by Self Rated Health
Baby Boomers - 1946-1965
Source: NWAHS Work Data (CATI), 2011
A lot Some Not at all0
10
20
30
40
50
60
70
80
90
Good-Ex SRH Poor-Fair SRH
Perc
enta
ge %

Future Research
• Interface between depression and employment status
• Workforce exit decisions of older workers with chronic conditions
• Workplace Interventions to facilitate better health

Implications for Policy
• Impact of poor health on workforce exits
– 44% of older boomers with poor SRH NILF = 9.9% of this sub-cohort
– 18.2% of younger boomers with poor/fair SRH NILF = 3.4% of this sub-cohort
• Primary and secondary prevention strategies
• Workplace policies and culture
• Labour market conditions


Contact Details and Acknowledgments
AcknowledgementsThis project was funded by an Australian Council Research Linkage Grant
Contact DetailsJennifer BuckleyEmail: [email protected]

• Australia’s GDP per capita in 2009 was around $924.84 billion