the health impact of coal: the responsibility that coal ... the health impact... · groundwork the...
TRANSCRIPT

The Health Impact of Coal
The responsibility that coal-fired power stations bear for
ambient air quality associated health impacts
20 May 2014
Researcher: Liziwe McDaid

groundWork The Health Impact of Coal 20 May 2014
The Health Impact of Coal
The responsibility that coal-fired power stations bear for ambient air quality
associated health impacts
20 May 2014
Contents Introduction .................................................................................................................................................................. 2
How much pollution is produced? ................................................................................................................................ 4
Ground level ambient air quality in the HPA ................................................................................................................ 7
How polluted is the Mpumalanga Highveld compared to other parts of the country? ............................................... 9
Health burden of coal related emissions .................................................................................................................... 10
Health impacts due to poor ambient air quality on the Mpumalanga Highveld ........................................................ 12
Cardiovascular impacts ............................................................................................................................................... 14
Life expectancy ........................................................................................................................................................... 17
Health and wellbeing .................................................................................................................................................. 17
Mercury ....................................................................................................................................................................... 18
Water .......................................................................................................................................................................... 18
Solving the problem, reducing the health burden ...................................................................................................... 19
Overall health burden for the Mpumalanga Highveld person .................................................................................... 21
Economic impacts ....................................................................................................................................................... 22
Environmental justice - Who is paying the cost right now? ....................................................................................... 24
References ...................................................................................................................................................................... 27
Introduction Within the Mpumalanga Highveld, reportedly one of the worst air quality areas in the world, there are 22 collieries
concentrated around eMalahleni (formerly known as Witbank), and over the last 100 years of coal mining, a
complicated “coal dynamic” has been imposed on the area (Munnik et al 2009). “This dynamic includes the mining
itself, the generation of electricity in 14 coal-fired power stations, some of which are serviced by captive collieries,
heavy industry using coal to produce steel and alloyed products, coal hauling by truck, and a culture of indoor coal
burning for heating and cooking in seasonally cold areas, now recognised as a major health hazard” (Munnik et al
2009).
Local studies on health impacts of pollution indicate that poor communities reliant on burning coal or other fuels in
their homes, experience increased disease burden with 24% of childhood (under five years old) deaths due to acute
respiratory infections were estimated to be from indoor air pollution (Norman 2007b). However, more recently, with
an increase in industrial activity, mining, coal-fired power stations returning to service and new ones being built and

groundWork The Health Impact of Coal 20 May 2014
the related increase in transport vehicles (emitting various pollutants into the air) the health of people living in the
Mpumalanga Highved has significantly deteriorated (Scorgie 2012, Myllyvirta 2014, Centre for Environmental Rights
(CER) 2014, Burt et al 2013). Environmental health studies in urban areas of South Africa have estimated that outdoor
or ambient air pollution caused 1.1% of child (under five years old) mortality due to acute lower respiratory infections
(Norman et al 2007a). For this study, our main focus is on ambient air quality.
The recognition of part of the Highveld as an Air Priority Area for air quality (HPA) by government in 2007 should have
galvanised action to reduce emissions in this area. However, in 2013, Eskom applied to the Department of
Environmental Affairs (DEA) for exemptions for a number of its coal-fired power stations from air pollution standards
meant to reduce pollution levels and improve the people’s health. (CER 2014, Strategic Environmental Management
Solutions 2013).
Drawing on available academic peer reviewed literature, government statistics1 and other reports, this desktop study
attempts to understand the contribution that the coal industry and Eskom make to the health risk of the people of the
Mpumalanga Highveld, to highlight the costs of such a health burden and to compare health risks with other South
African cities, namely Tshwane and Cape Town.
Figure 1: Positions of the monitoring stations (in orange) relative to the power stations (in purple) for the Highveld2.
1 Although international literature provides clear linkages between pollution and health impacts, there is a considerable challenge in assigning responsibility for health impacts to particular source emitters. This report used peer reviewed South African research which had attributed proportions of emissions to particular sources, and then used this model with recent mortality statistics and emissions data to derive illustrative health impacts. The report looked at particular health impacts for example, respiratory mortality of children under 5 and at cardiovascular related deaths as illustrative of the health impacts. The report is therefore necessarily conservative and indicative, and considerable detailed health measurement and monitoring is necessary to ascertain the full impact of Eskom and associated coal industrial processes on ambient quality, and the people’ health. 2 From Strategic Environmental Solutions 2013 pg 7

groundWork The Health Impact of Coal 20 May 2014
How much pollution is produced? Table 1 provides an estimate of the amount of pollutants emitted into the air in South Africa in 2002 (Scorgie 2012),
and the proportion attributed to Eskom.
Pollutant Total emissions tons/annum
% due to electricity generation, industrial processes and domestic fuel
% due to electricity generation only (Eskom)
PM10 98901 81% 65%
SO2 2153917 98% 71%
NO2 1253229 78% 55%
More than ten years later, the amount of pollution that Eskom is emitting has increased considerably due to the
additional coal-fired power stations that have been returned to service (Myllyvirta 2014). Figure 2a shows the annual
tons of pollutants, nitrogen dioxide (NO2), and sulphur dioxide (SO2) emitted from Eskom’s coal power generation fleet
(Myllyvirta 2014) today (in orange) compared with the emissions if the RTS power plants had not been re-
commissioned (in blue). Figure 2b compares the PM10 emissions over the same timeframe.
Figure 2and 2b: The increase in emissions from NO2, SO2 and PM10 over an approximate ten year timeframe
(tons/annum).
As can be seen from the graph, Eskom has increased its emissions of NO2, SO2 and particulates (PM10)3 by 44%, 22%
and 74% respectively, and the trend is likely to continue upwards as those new coal-fired power stations under
construction and the proposal of a third new coal-fired power station will further add to the pollution load of the
country (derived from the figures above).
Within the Mpumalanga Highveld, the estimated increase in emissions for different pollutants is shown in Figure 3,
and of these emissions, 12% of PM10, 73% of NO2 and 82% of SO2 are respectively attributed to power generation in
the area4.
3 a mixture of very small particles and liquid droplets less than 10 micro-millimetres 4 DEA (undated). Highveld Priority Area Air Quality Management Plan Executive Summary. DEA. Pretoria.[document is undated but it was released for public comment in 2011]

groundWork The Health Impact of Coal 20 May 2014
Figure 3: The increase in PM10 SO2, and NO2 emissions over the last 10 years5 in the Highveld6.
In addition, it is estimated that during 2010, 19.8 tons of mercury was emitted by Eskom’s coal-fired power stations,
estimated at 77% of total mercury emissions in the country (Roos 2011). Figure 4 shows the historical estimates of
mercury emissions (Roos 20117). However, Roos’s estimates are at variance with Leaner et al (2008) estimating a total
of 30 tons for the year 2008, and Myllyvirta (20148) estimates of 26973 kg, and Scott (2011) estimating 39.4 tons for
2009, which he estimates to be a 45% increase from 2000. The mercury emissions estimates for the coal power stations
need to be considered as having a low degree of confidence and further work is needed to quantify the mercury
emissions with a fair degree of accuracy.
Figure 4: Mercury emissions from Eskom coal-fired power stations 2006-2012 (Roos 2011).
5 One of the limitations of this report is the difficult of aligning different sets of data in time. Population data, health data and pollution data are not necessarily captured over the same timeframes, and conclusions drawn from such data must necessarily be regarded as indicative rather than absolute. The quality of the available data also adds to this uncertainty. 6 Data for this figure taken from HPA air quality plan and Scorgie 2012. 7 Roos. B. 2011. Mercury Emissions from Coal-fired Power stations in South Africa,. University of Johannesburg, 8 Myllyvirta 2014

groundWork The Health Impact of Coal 20 May 2014
The DEA ground level monitoring in HPA includes mercury and results indicate it is <0.00005 µg/m3 (DEA 2012)9, well
below the World Health Organisation (WHO) guideline of 0.02 µg/m3. However, mercury emissions from coal-fired
power stations are estimated to account for about 75% of anthropogenic sources in South Africa (Scott 2011), and
reducing mercury emissions in this sector will therefore improve the environmental health nationally. With 12 Eskom
power stations located within the HPA, mercury reductions in the power sector will benefit HPA communities,
redressing some of the injustices they bear due to their heavy environmental burden from other pollutants.
Air currents, wind speed and the height of the power station stacks are all complicating factors which researchers need
to take into account when attempting to understand the extent to which power station emissions contribute to ground
level pollution. Various studies (Barnes 2014, Norman 2007, Qasim et al 2014) have shown that while life style, wealth
and energy poverty (e.g. people forced to use polluting fuels because they are unable to afford access to clean energy)
contribute to individual health risk from indoor pollutants. However, when it comes to outdoor air quality, in South
Africa, one’s location is also an important determinant of health risk.
Air quality is impacted by a range of pollution sources, and emissions interact with local weather conditions, including
the diurnal air flows that can result in stack emissions being brought to ground level during certain times of the day
(Bhugwandin 201310). SO2 diurnal variation graphs at all Eskom monitoring stations show a build-up of SO2 in the early
morning, climbing from 07h00, peaking just before midday, and dropping off sharply to back ground levels by 22h00.
There is also a smaller peak in the afternoon around 18h00 associated with household coal fires for cooking and
heating. The day time high concentrations are typical of high level stack emissions that are brought to the ground due
to strong daytime convective turbulence experienced in the Mpumalanga Highveld (Bhughwandin 2013). An example
is depicted in Figure 5.
Figure 5: The SO2 emissions diurnal variation for August 2012 (data from DEA air quality report 2012).
Complex modelling that includes such diurnal variations enables an apportionment of pollution levels to particular
sources (Scorgie 2012).
9 DEA monitoring data report for June 2012 - http://www.deat.sianalytics.co.za/index.php?id=reports EMISSIONS
2008 to 2013 (accessed 5th April 2014)
10 Bhugwandin K., 2013. The integration of measured, modelled and remotely sensed air quality data and its’impact on the Highveld. Thesis submitted. School of Geography, Archaeology and Environmental Studies, University of the Witwatersrand, Johannesburg.

groundWork The Health Impact of Coal 20 May 2014
Ground level ambient air quality in the HPA The industrial, mining, power generation and domestic coal-fired heating activities on the Mpumalanga Highveld have
significantly altered the atmospheric sulphur budget (Bhugwandin 2013). In a study that aimed to improve the air
quality predictions for air quality models, Bhugwandin (2013) described how atmospheric dispersion models can be
used to determine if proposed or existing industrial plants will comply with air quality standards.
In most countries around the world, governments regulate ambient air quality, through ambient air quality standards,
set to protect human health, and the broader ecosystem, and air quality management plans are put in place to manage
this. Based on epidemiological studies, the World Health Organisation (WHO) has amended its recommended air
quality guidelines, over time, in order to reduce the risk to human health. South Africa air quality standards were
gazetted in 2009 with relevant standards for SO2 and NO2 and PM10 (DEA 2009), and are shown in Appendix A, together
with the WHO recommended standards for comparison. South African air quality standards for PM2.5 were gazetted
in 2012.
The DEA has implemented monitoring of air quality at ground level, with a focus on areas estimated to be a high health
risk. In 2007, the DEA declared the Highveld Priority Area (HPA), and relevant air quality data are released to the public
on a monthly basis from the DEA.
Over the last five years, pollution levels appear to be increasing for PM10, while for SO2, some improvement appears
to have taken place for most areas except Secunda. Also of note is that while the annual average for PM10 was above
the legal standard for three monitoring stations in 2012, South African legal standards also lag behind the WHO
recommendation of 20 µg/m3. The implication is that South Africans in the HPA are experiencing extremely poor air
quality, with pollution levels above even the weak South African air quality standards for PM10.
Figure 6a-b: The annual average pollution level trends from 2008 to 2012 for SO2 and PM10 in the HPA.
However, annual averages do not necessarily reveal the whole picture as there are particular seasonal variations due
to atmospheric changes. The HPA pollutant levels are higher in winter because of atmospheric diurnal patterns as
mentioned earlier.

groundWork The Health Impact of Coal 20 May 2014
Figure 7: The winter pollution levels for the Witbank and Ermelo monitoring station, from 2008 to 2012.
Using the HPA data for years 2010, 2011, 2012 (DEA), Figure 8 shows the average daily concentrations of three
pollutants, SO2, NO2, and PM10, for three months of summer (December, January and February), compared to winter
(June, July and August) for Witbank and Ermelo monitoring stations. As can be clearly seen in the graphs, winter
pollution levels are much higher than summer levels, and there is no overall improvement that is clearly discernible.
For example, apart from 2011, it appears that pollution levels are dropping for Witbank winter SO2, whereas summer
SO2 levels are increasing. Further analysis is necessary to understand the cause of this.

groundWork The Health Impact of Coal 20 May 2014
South African air quality standards are weaker than the WHO recommendations, and are exceeded regularly, further
adding to the health burden of the people of the HPA. . For example, the annual average of PM10 and SO2 appear to
be within the guidelines, yet Table 2 shows that people are exposed to increased levels of pollutants, well in excess of
the approved exceedances standards. Appendix A provides a summary of the air quality standards and number of
allowed exceedances.
Table 2 below provides an indication of the number of actual exceedances per pollutant compared to the air quality
standard in the HPA (drawn directly from the HPA Air Quality Management Plan (AQMP).
How polluted is the Mpumalanga Highveld compared to other parts of the country? In a detailed study Scorgie (2012) examined and compared the amount of three different pollutants in different parts
of the country. This comparison of the amounts of pollutants emitted for different conurbations is shown in Figure 9,
showing that Mpumalanga emits disproportionate amounts of polluting emissions, namely 79% of the PM10 emissions,
84% of the SO2 and 83% of the NO2, while a city like Tshwane contributes only 7% of the PM10, 1% of the SO2 and 2%
of the NO2.
Figure 9: The proportion of different pollutants attributed to different conurbations in the country (Scorgie 2012).
%PM10
johburg Cape Town
Vaal Triangle Tshwane
Mpumalanga
%SO2
johburg Cape Town
Vaal Triangle Tshwane
Mpumalanga
%NO2
johburg Cape Town
Vaal Triangle Tshwane
Mpumalanga

groundWork The Health Impact of Coal 20 May 2014
The large proportion of the emissions in Mpumalanga are due to coal related pollutants, particularly Eskom’s coal fleet
(Scorgie 2012). Refer to Figure 1 showing the location of Eskom’s coal-fired power stations within the Mpumalanga
area.
Health burden of coal related emissions Indoor air quality is impacted by burning of fuels inside the home. Many electrified households continue to burn
paraffin, coal or wood indoors at times (DoE 2012), placing an unacceptable burden on these households. Government
programmes of electrification and the introduction of cleaner coal burning techniques can reduce indoor air pollution
and associated health impacts. It is then commonly understood that ambient air quality will then improve. However,
such programmes fail to address the underlying cause of this indoor pollution, namely that people have no access to
clean affordable energy.
However, air quality derives from various industrial, transport and other processes in addition to indoor fuel use and
attributing health risk to particular pollutants is complex (Bhugwandin 2013). This report examined the sources of
ambient air pollution and how they further increase the health burden of communities in the HPA.
Modelled ambient air quality and associated health impacts were used to calculate the proportion of health impacts
that could be attributed to particular sources, for example, domestic coal burning, power generation and coal use in
the industrial sector (Scorgie 2012).
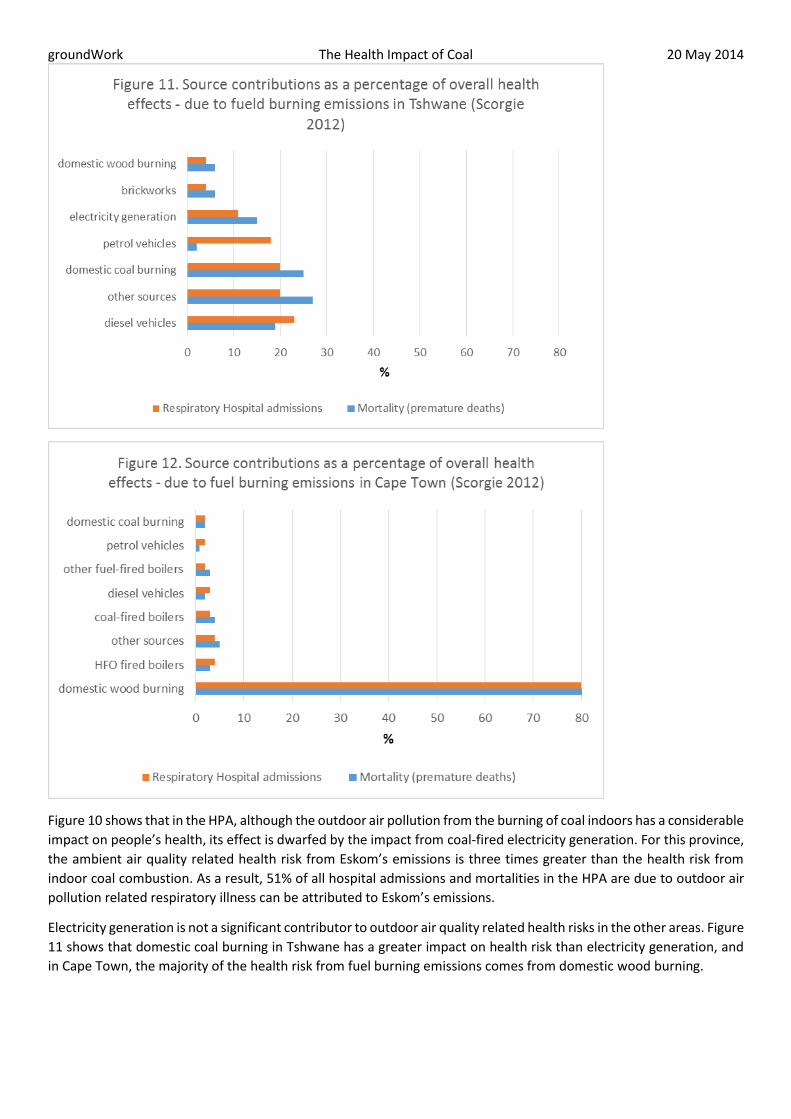
Figures 10, 11 and 12 show the proportion of health impacts attributed to particular sectors for Mpumalanga Highveld,
Tshwane and Cape Town. The health impact includes the impact of NO2, SO2, PM10 pollutants.
groundWork The Health Impact of Coal 20 May 2014
Figure 10 shows that in the HPA, although the outdoor air pollution from the burning of coal indoors has a considerable
impact on people’s health, its effect is dwarfed by the impact from coal-fired electricity generation. For this province,
the ambient air quality related health risk from Eskom’s emissions is three times greater than the health risk from
indoor coal combustion. As a result, 51% of all hospital admissions and mortalities in the HPA are due to outdoor air
pollution related respiratory illness can be attributed to Eskom’s emissions.
Electricity generation is not a significant contributor to outdoor air quality related health risks in the other areas. Figure
11 shows that domestic coal burning in Tshwane has a greater impact on health risk than electricity generation, and
in Cape Town, the majority of the health risk from fuel burning emissions comes from domestic wood burning.

groundWork The Health Impact of Coal 20 May 2014
This study has concentrated on children’s respiratory health risk. Children and infants are among the most susceptible
to outdoor air pollution, as their lungs continue to develop in childhood, and because children play outdoors more
than adults, they are more susceptible to the health impacts of ambient air pollution. (Kim et al 2004)
Many households use multiple sources of energy, particularly for cooking and spatial heating (DoE 2012). In
Mpumalanga, 26% of households rely on coal as an energy source. This is nearly four times the national average of 7%
(DoE 2012). So the children of Mpumalanga not only face the outdoor health burden from Eskom’s electricity
generation but they are also four times more likely to suffer from indoor air pollution caused by burning coal.
Health impacts due to poor ambient air quality on the Mpumalanga Highveld The population within the HPA for 2013 was estimated at 3.9 million, based on 2007 estimates11 12 and extrapolations
from population census data (Statistics South Africa 201113). In 2010, respiratory diseases were responsible for 5249
deaths14 in Mpumalanga (Stats SA 201015, DEA 2011), and for the HPA, in the years 2006 to 2009 the total number of
children who died prematurely of respiratory diseases was 2656 (StatsSA 2012a16).
Using this data, and applying the disease attribution percentages from Figures 10,11 and 12 it is possible to estimate
the childhood mortality that can be attributed to coal, and specifically to coal-fired power stations. Figures 13, 14 and
15 provide the estimated numbers of childhood deaths for the Mpumalanga HPA, compared to Tshwane and Cape
Town17.
11 Mid-year population estimates for Mpumalanga are 4 128 000 (2013) [total popn. 5298 million], (statistics South Africa 2013. Statistical release PO302. Mid-term population estimates 2013). 12 DEA media statement of August 2008 claimed that the HPA population is 3.6 million people https://www.environment.gov.za/mediastatement/mabudafhasi_airquality_monitoringstations 13 Statistics South Africa 2011. Census 2011, provinces at a glance (calculated popn. of Mpumalanga as 3,78 mill in 2007) http://www.statssa.gov.za/Census2011/Products/Provinces%20at%20a%20glance%2016%20Nov%202012%20corrected.pdf 14 2010 Deaths per district municipality Ehlanzeni 1809, Ger Sibande 1861, Nkangala 1579 (excluding TB) - 15 Stats SA 2010. Statistical release P0309.3. Mortality and causes of death in South Africa, 2010: findings from death notification. 16 STATSA 2010 – childhood mortality report pg 65 17 An urban factor has been applied to the data to align the provincial child health burden numbers with the conurbation pollution data.

groundWork The Health Impact of Coal 20 May 2014
The results shown in Figure 13, 14 and 15 follow those of Figure 10, 11 and 12. For Cape Town, with almost no coal
sourced emissions, domestic wood burning contributes most to poor ambient air quality and poses the highest health
risk to children (Figure 15). In Tshwane, although coal-fired electricity generation contributes to poor air quality and
childhood mortality, children face a higher health risk from domestic coal use that causes poor ambient air quality.
However, Figure 13 indicates that in Mpumalanga, while domestic coal burning does contribute to outdoor air
pollution and related childhood deaths, this is considerably less than that from coal-fired electricity generation.
Extrapolating from Figure 13, for every child that might die from outdoor air pollution related diseases due to
household coal use and industrial coal-fired boilers, more than three children each year would die from Eskom
produced pollution in the HPA.

groundWork The Health Impact of Coal 20 May 2014
Applying these percentages to the number of deaths for 2006 to 2009 for the different regions, Figure 16 clearly shows
that Eskom’s electricity generation is responsible for proportionally more premature child deaths due to respiratory
illness in Mpumalanga than in Tshwane or Cape Town.
Cardiovascular impacts The levels of PM10 in eMalahleni in winter have remained about 80 µg/m3 from 2009 to 2012, about 30 µg/m3 above
the South African ambient air quality standard. Applying a USA Environmental Protection Agency (EPA) report’s (Burt
2013) findings to South Africa, this would mean that an additional 1.5% to 7.2% increase in cardiovascular disease for
the HPA due to air pollution. Diseases of the circulatory system were given as the cause of death for 82906 South
Africans in 2010, and various forms of cardiovascular disease caused 5256 deaths in Mpumalanga in 2010 (StatsSA
201018).
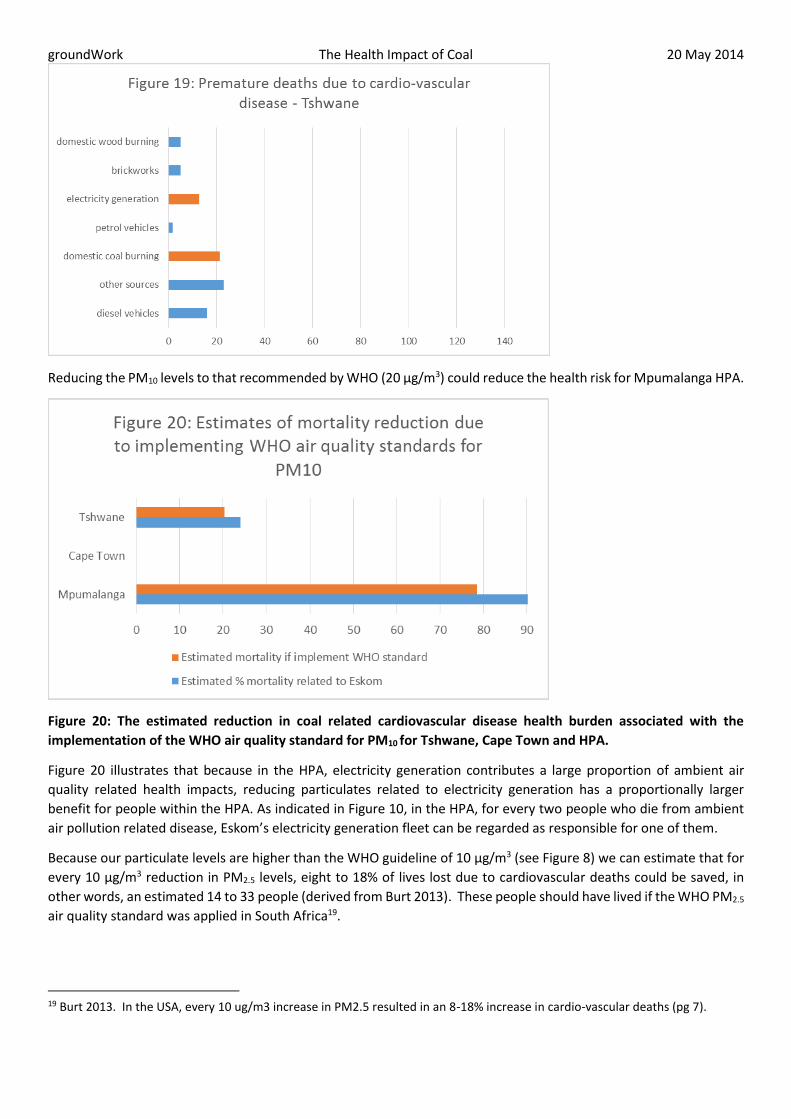
Assuming that 3.7% of those deaths were due to air pollution (CSIR 2009), with 65% of ambient air pollution deaths
associated with coal (Scorgie 2012), Figure 17, 18 and 19 shows the proportion of cardiovascular disease attributed to
the coal industry, and to Eskom, for the HPA compared to Tshwane and Cape Town. A significant proportion of air
pollution related cardiovascular diseases can be attributed to Eskom in the HPA.
18 StatsSA death report appendix K and appendix M8

groundWork The Health Impact of Coal 20 May 2014
groundWork The Health Impact of Coal 20 May 2014
Reducing the PM10 levels to that recommended by WHO (20 µg/m3) could reduce the health risk for Mpumalanga HPA.
Figure 20: The estimated reduction in coal related cardiovascular disease health burden associated with the
implementation of the WHO air quality standard for PM10 for Tshwane, Cape Town and HPA.
Figure 20 illustrates that because in the HPA, electricity generation contributes a large proportion of ambient air
quality related health impacts, reducing particulates related to electricity generation has a proportionally larger
benefit for people within the HPA. As indicated in Figure 10, in the HPA, for every two people who die from ambient
air pollution related disease, Eskom’s electricity generation fleet can be regarded as responsible for one of them.
Because our particulate levels are higher than the WHO guideline of 10 µg/m3 (see Figure 8) we can estimate that for
every 10 µg/m3 reduction in PM2.5 levels, eight to 18% of lives lost due to cardiovascular deaths could be saved, in
other words, an estimated 14 to 33 people (derived from Burt 2013). These people should have lived if the WHO PM2.5
air quality standard was applied in South Africa19.
19 Burt 2013. In the USA, every 10 ug/m3 increase in PM2.5 resulted in an 8-18% increase in cardio-vascular deaths (pg 7).

groundWork The Health Impact of Coal 20 May 2014
Over the last five years, in the HPA, an estimated 70 to 165 people’s lives could have been saved through implementing
the WHO air quality standards.
Life expectancy For those countries with a moderate life expectancy (using 1965 as a baseline year), research indicates that coal
burning reduced life expectancy by 2.5 and 3.5 years in India and China respectively (Burt et al 2013). Evidence from
the Chen (2013) study supports this.
In South Africa, life expectancy in Mpumalanga is 50.3 for males, and 51.6 for females, below the national life
expectancy of 53.3 for males and 55.2 for females20. According to the Mpumalanga health budget of 2012, although
HIV/AIDS still remains the major cause of death, with 770 deaths per day during the 2010/2011 financial year, one of
the causes of a decline in life expectancy was cardiovascular disease21. Although ambient air quality due to coal
emissions no doubt contributes to the reduced life expectancy, it is not possible to show the exact extent in this short
study.
Health and wellbeing Given the multiple stressors that impact on human lives, it is difficult to calculate the contribution of each stressor to
the health and welfare of people, and researchers tend to focus on mortality and its causes. However, some estimates
have been calculated for the impact of air pollution on human wellbeing. Scorgie (2012) calculated how the level of
air pollution might impact on daily activities using a measure called Minor Restricted-Activity Days (MRADs), defined
as occurring “when individuals reduce most usual daily activities and replace them with less-strenuous activities or
rest, but do not miss work or school”(EPA 2009)22.
Figure 21: The three locations and relative MRADs – associated with SO2 exposures (derived from Scorgie 2012).
If we compare the three areas, we see that, as anticipated, lower levels of coal related pollutants in Cape Town and
Tshwane lead to less coal related health impacts. Mpumalanga has 44% of SO2 related MRADs in the country (Scorgie
2012)23, with half of those attributable to coal generation (refer to Figure 10). If we take the total number of incidences
20 http://www.mpumalanga.gov.za/media/speeches/health/budget.htm 21 Mpumalanga Policy and budget speech for the Department of Health 2012/2013 22 EPA 2009. SAB/HES review draft – November 2009. Chapter 2 – Estimation of human health effects and economic benefits. http://www.epa.gov/cleanairactbenefits/dec09/IEc_Second_Prospective_Health_Benefits_Chapter.pdf 23 Scorgie 2012. Pg 129

groundWork The Health Impact of Coal 20 May 2014
of air pollution related MRADs in the country, then one in five (20%) are due to electricity generation activities in
Mpumalanga.
Mercury Long term occupational exposure to mercury may affect the kidney and the central nervous system negatively.
Mercury is emitted from coal combustion, and is then deposited into the environment (for example through leaching
from fly ash dumps), finding its way into the water system, and from there, it is concentrated up the food chain, finding
its way into crops and livestock, or into humans through for example, people eating fish contaminated with mercury
(WHO 2007). The health impacts can include development effects such as low intelligence levels and delayed
neurodevelopment in children. (Burt et al 2013.) According to the WHO (2013), a guideline value for ambient air would
be 0.2µg/m3 24 for inhalation by the general public.
Estimates for mercury related health impacts related to coal burning in South Africa have suggested that current
emissions are associated with the loss of 45000 IQ points each year (Myllyvirta 2014).
According to an EPA study, mercury toxicity in the USA could affect 10 to 15% of children born each year, and the EPA
states that when there have been outbreaks of methyl mercury poisoning, “some mothers with no symptoms of
nervous system damage gave birth to infants with severe disabilities, it becomes clear that the developing nervous
system of the foetus may be more vulnerable to methyl mercury than in the adult nervous system”25.
American studies estimate that a 1.6 point drop in IQ could cost US $31 800 in a person’s lifetime earnings (Trasande
et al 2005)26. The application of this equation to the estimated 45000 IQ points lost each year (2014) could potentially
lead to lost earnings of R894 million impacting the earning potential of 28125 people.
Water The use of water in pollution abatement technologies on coal-fired power stations raises additional challenges for
water quality. Removing mercury and other pollutants from the power station emissions, means that there is an
increase of mercury in by products such as fly ash and waste from coal washing and this raises the risk that the mercury
could potentially leach back into the environment, rendering the pollution abatement mechanisms futile (Roos 2011).
In a water scarce country, Eskom’s electricity generation uses large amounts of water. Human basic water allocation
is 25 litres per day and Eskom uses about 1.38 litres of water to produce 1 kWh of electricity (EMG 2011). Eskom would
use one citizen’s allocation of water to produce sufficient electricity (about 18kWh) to light a 100 watt bulb for 180
hours.
Acid mine drainage (AMD) from coal mines amounts to 62Ml/d, with estimated costs of clean up for the eMalahleni
area minimally at R126 million (Munnik 2009)27, and estimates are that this would raise the price of water to between
24 WHO European Centre for environment and Health, Bonn. 2013. Review of evidence on health aspects of air pollution – REVIHAAP Project: Technical Report Page 127. http://www.euro.who.int/__data/assets/pdf_file/0004/193108/REVIHAAP-Final-technical-report-final-version.pdf 25 http://www.epa.gov/mercury/effects.htm. 26 http://www.cbsnews.com/news/study-iq-loss-from-mercury-costly/). And http://www-ncbi-nlm-nih-gov.ezproxy.uct.ac.za/pmc/articles/PMC1257552/ 27 Clean up costs for AMD are much more for the country but this is an illustrative example

groundWork The Health Impact of Coal 20 May 2014
40 and 50c/m3(28), while other reports indicate a threefold increase in water pricing, and capital outlay of R300 million
for one water purifying plant (McCarthy 201129).
Solving the problem, reducing the health burden For the HPA, in the years 2006 to 2009 the total number of children who died prematurely of respiratory diseases was
2656 (StatsSA 2012a30), 29 due to outdoor air pollution, with a conservative estimate that at least 15 of those children’s
deaths would be attributable to Eskom coal power stations.
A recent study in China highlighted significant differences between two communities that were of comparable socio-
economic status but one was exposed to high levels of airborne particulate matter through the use of coal-fired boilers
in town, whereas the other was not. Researchers (Chen et al 2014) found that exposure to high levels of particulates
184 µg/m3 led to an increase in cardiorespiratory causes of death (resulting in a 14% increase in overall mortality) and
a reduced life expectancy at birth of about three years. While the HPA area experiences high PM10 and PM2.5 levels
(refer to Figure 8), for example, in winter in eMalahleni the PM10 levels almost double the South African air quality
standard of 50 µg/m3 (DEA 2011 air quality data). However, overall, the levels of particulates are much less than that
found in the China case study.
Although not necessarily at a level that demonstrably increases mortality at the same rate as in the China case study,
particulates that are smaller than 2.5 microns travel deeper into the bronchial passages and lungs causing increased
negative heath impacts. These can include decreased lung function, asthma, for example, every 10 µg/m3 increase in
PM 2.5 is associated with a 1 to 3.5% decrease in measured lung function (Burt et al 2013). The USA EPA also found a
0.5 to 2.4% increase in cardiovascular disease (evidenced by an increase in emergency department visits and hospital
admissions) for each 10 µg/m3 increase in PM2.5 (Burt et al 2013). The WHO has estimated that reducing annual
average PM10 levels from around 70 µg/m3 to 20 µg/m3 would reduce the air pollution related mortality by around
15%31.
For sulphur dioxide emissions, research indicates that even at low concentrations (less than 10ppb 24 hour average),
there is an increased risk of death from heart and lung conditions. For every 10 ppb decrease, the risk of death could
be reduced by 0.4 to 2% (Burt et al 2013). Implementing flue-gas desulfurization in the HPA, particularly to reduce
winter pollution, could potentially save many lives. Nationally, Eskom is estimated to be responsible for 6% of the
overall coal related health risk (relating to ambient air quality), but in Mpumalanga, 50% of the ambient air quality
related health risk is attributed to Eskom (Scorgie 2012). Extrapolating from this, it would appear that Mpumalanga
bears eight times the health related pollution risk than the national average.
Although this study did not assess the health risk of ozone, it is important to note that nitrogen oxides from fossil fuel
combustion (vehicles and power stations contribute) undergo chemical reactions, producing pollutants such as ozone,
nitrous oxide and nitrogen dioxide. These pollutants increase respiratory disease, increase susceptibility to viral and
bacterial infections, and potential lead to emergency hospital visits particularly asthma (Burt et al 2013).
Table 3 indicates the numbers of reductions in health burden that are potentially achievable Using an example of two
interventions, the reductions in health impact are, measured in reduced number of people affected (Scorgie 2012).
28 The Impact of Acid Mine Drainage in the Witwatersrand on the Mining Industry in Mpumalanga, Free State, Limpopo, North West and Northern Cape Provinces (undated), Richard Holden - TCTA). For more AMD information - http://archive.constantcontact.com/fs106/1101623328228/archive/1114670814995.html 29 McCarthy TS. The impact of acid mine drainage in South Africa. S Afr J Sci. 107(5/6), Art. #712, 7 pages. doi:10.4102/sajs.v107i5/6.712 30 STATSA 2010 – childhood mortality report pg 65 31 WHO, 2014. Ambient (outdoor) Air quality and Health factsheet No 313, updated March 2014.

groundWork The Health Impact of Coal 20 May 2014
intervention Respiratory hospital
admissions due to
PM10, SO2, NO2
Cardiovascular hospital
admissions due to PM10
exposure
Chronic
Bronchitis (PM20
related)
Total number of
people
Desulphurisation of all
power stations
-1520 1.9 301 -1217
Electrification -7946 -65.5 -8405 -16416
Assuming that the ultimate goal is zero pollution, and acknowledging that an incremental approach to improving
health would logically adopt the most cost effective measures first, Leiman (2007) identified the reduction of indoor
domestic fuel emissions as having the greatest impact on the health of people at the least cost to the economy.
However, the relative contribution of domestic fuel burning towards ambient air quality also needs to be taken into
account.
The proportional contributions to human health from domestic fuel emissions varies from area to area, as indicated
in Figure 10 and 11 above. Improving ambient air quality through removing the use of domestic coal in both Tshwane
and Mpumalanga could reduce health impacts by 20%. However, in Mpumalanga, closing down power station and
stopping their emissions would improve ambient air quality and result in a health improvement of more than twice as
much as addressing domestic coal burning32. But doing the same actions in Tshwane would only yield a 15% health
improvement.
An illustrative example would be if 100 children were likely to die prematurely due to poor ambient air quality in
Tshwane, you could potentially save 15 lives through addressing coal-fired power station emissions, but you could
save 20 lives if you addressed domestic coal related ambient air pollution. However, if there are a similar potential 100
premature children’s deaths in Mpumalanga due to ambient air quality, 20 could be saved through addressing
domestic coal but 50 deaths could be prevented through addressing coal-fired power station emissions. The extent of
exposure to health risks is thus dependent on location.
A Department of Energy (DoE) residential energy survey found that many households are reliant on multiple energy
use, particularly the poorer households, and Figure 23 shows the provincial distribution of coal for household energy
use (DoE 2012).
32 Please note that these results apply to ambient air quality health impacts and are in addition to the significant and obvious health benefits from improving indoor air quality.

groundWork The Health Impact of Coal 20 May 2014
Figure 22: The percentage of households in each province using coal for domestic use (DoE 2012).
If you are in Mpumalanga, the health risk from coal-fired power stations is three times that of ambient air quality risk
of burning domestic coal, while in Tshwane, ambient air quality impacts from household coal burning pose a greater
risk to health than emissions from power station stacks.
Overall health burden for the Mpumalanga Highveld person Throughout this report different environmental factors have been assessed for the estimated impact on the health
and wellbeing of the people of Mpumalanga HPA, and compared with Tshwane and Cape Town. Figure 23 provides
an indication of how Mpumalanga experiences a disproportional burden of negative health impacts, due to coal
related air pollution.

groundWork The Health Impact of Coal 20 May 2014
Economic impacts In theory, a conventional cost benefit analysis can be used to determine the pollution reduction measures that the
state should implement, but often, the key question posed by economists is how to determine how much pollution
should be endured.
In Figure 24 (Leiman et al 2007), the level of emissions decrease from the left side of the diagram while the abatement
measures increase from the right hand side.
Figure 24: A diagrammatic representation of the optimal level of pollution abatement.
At the beginning of such a pollution abatement programme, the emissions will be high and the marginal cost of
abatement (MAB) will be correspondingly high. As emissions levels decline, it should cost less per unit of abatement.
On the right hand side, similarly, the benefits (quantified as the avoided health costs due to cleaner air) will be high
when pollution levels are high, and will reduce as the air gets cleaner. At some point E, the cost of implementing a
further unit reduction of pollutants, will cost more than the health care costs that would be incurred due to the
emission related ill health. For economists, this is known as the optimal level of pollution (Leiman 2007).
Environmental health advocates and affected people would lobby for E to move to the right, while governments and
polluting industries would argue that limited financial resources or technical limitations would restrict such a right
movement, often citing that the health benefit does not justify the cost involved.
The financial quantification of the abatement costs appears a relatively less complex exercise. For example, Eskom
claimed that to implement pollution abatement across all its power stations would cost between R105 and R404
billion. However, this was contested by CER who argued for a figure of R146 billion (CER 2013).
The marginal benefit costs are complex and also difficult to quantify. Conventionally, lives in developing countries are
regarded as of less financial worth (Leiman et al 2007) (using the value of life insurance policies for example). With a
knowledge of salaries, it would be possible to determine the cost of a day off work due to illness for those employed.
However, given that workers earn less than management, this type of calculation would suggest that management’s
health is more valuable than ordinary workers due to the differential in their salaries. Those that are involved in
providing unpaid services (cooking, cleaning, child care, looking after the aged and sick – mainly women) must also be
costed. The cost of medical care provided by hospitals and clinics can also be calculated. However, again, taking the
current South African public health services budgets as a proxy is likely to underestimate those air pollution costs as it
is generally accepted that public health services are inadequate to meet patients’ needs.

groundWork The Health Impact of Coal 20 May 2014
Scorgie (2012) estimated that external health related costs associated with coal across her study sites was about R3.5
billion with power generation responsible for only 6% of external costs overall, whereas Myllyvirta (2014) estimated
that the cost to society is R230 billion including premature deaths from exposure to pollutants such as PM2.5 and
mercury.
External costs of coal-fired electricity in the USA were calculated at 17.8 US cents per kWh cost production, while in
Europe, studies indicated 1.6 to 5.8 euro cents/kwh, with an acknowledgement that 95% of external costs are regarded
as health related (Burt et al 2013).
A 2003 study estimated that the costs of externalities for Eskom power were 4.4 cents/kWh, and totalled R7.3bn, of
which air pollution and health were about 16% (Spalding-Fechter 200333). Interestingly, this study calculated the cost
of benefits from electrification would be R958 million (13% of net externality costs) and subtracted this benefit cost
from the overall externalities costs.
Depending on methodologies (largely contentious), a range of external cost values have been calculated related to
health impacts. This report has not reviewed the acceptability of different methodologies but has included a range of
estimates derived from international studies. The rationale for taking this approach is to illustrate the diversity of
estimates, and to hopefully take into account best practice and healthiest air quality standards.
This study therefore drew accepted a principled position that health should be improved and pollution reduced and
narrowly examined the cost of implementing pollution abatement technologies, contrasting this with internationally
referenced external cost estimates.
Table 4: A range of estimates of benefit and costs, calculated using the various approached outlined by different
reports.
USA EPA (2010)
Myllyvirta (2014)
Eskom Burt et al (2013)
Munnik (2009)
Scorgie (2012)
Method Electricity generation direct costs to 2020
FGD for whole fleet
Ratio of 1:25 of abatement costs
10% increase on elec. cost
Eskom 6.5% of R3.5bn
Calculated cost R 100 bn R30 billion R200 bn34 R 150 billion33
R 21 billion35
R 210 million
In the USA, the EPA calculated that for every dollar spent on reducing air pollution, US $25 were saved in health care
costs due to the reduction in premature deaths, and respiratory diseases (Burt et al 201336). An EPA study that found
33 Spalding Fechter R., Matibe 2003 34 Eskom estimation for whole fleet – 2007 prices - http://mg.co.za/article/2014-03-13-eskom-spurns-air-quality-controls 35 Author’s calculation 36 Burt E., Orris P., Buchanan S. 2013. Scientific Evidence of Health Effects from Coal Use in Energy Generation – Health care Research Collaborative. University of Illinois at Chicago School of Public Health, Chicago, Illinois, USA

groundWork The Health Impact of Coal 20 May 2014
direct costs of cleaning up air pollution related to coal-fired electricity would be $10bn and that the benefits of clean
air programmes could be an equivalent value of US $6000 per person (EPA 2010)
For South Africa, Eskom claims that retrofitting their entire fleet to reduce pollution would cost R200bn37. Applying a
1:25 ratio, this would mean that government would save R5000 billion in health care costs – money that could be
directed towards early childhood development for example or increasing rates of electrification.
This study is necessarily illustrative in nature and figures presented here are indicative, based on available data. This
study was not able to include additional health costs due to ozone related to power station emissions, for example.
Overall a conservative approach has been adopted in estimating numbers of affected people whose health could be
directly linked to coal-fired power station emissions, and the gaps in available data indicate an urgent need for further
research on the ground.
Environmental justice - Who is paying the cost right now? The benefit of Eskom’s electricity is largely not experienced by those that are suffering from the pollution emitted
from the coal-fired power stations. Nationally, the residential share of total electricity demand is 20% and is
concentrated in the hands of the wealthy. As shown in Figure 24, Low income households make up 25% of the
population, but only use 2.4 % of the electricity, whereas high income households are less than half in number but use
14 times as much (adapted from Tait & Winkler, 2012). Many of those poorer people live in Mpumalanga.
37 Eskom estimation for its whole fleet – 2007 prices - http://mg.co.za/article/2014-03-13-eskom-spurns-air-quality-controls

groundWork The Health Impact of Coal 20 May 2014
58% of South African households earn less than R2300 per month, and in Mpumalanga, approximately 580 000
households earn less than R1600 per month (Stats SA 201138).
Indoor pollution due to coal use imposes a health burden on many HPA people, and in addition, the large contribution
that Eskom’s coal-fired power stations make towards worsening ambient air quality imposes increased health risks
(Figure 8). Mpumalanga children are paying for Eskom’s refusal to implement pollution abatement measures.
In order to effect a just transition away from dirty, unhealthy and expensive fossil fuels, our electricity mix needs to
shift from coal-fired electricity towards renewable energy39, while existing coal-fired power stations must implement
pollution abatement measures. Implementing 10000GWh of renewable energy would reduce Eskom’s coal-fired
power generation emissions by 6.4%, while implementing 37000GWh would reduce emissions by 19% (Scorgie 2012),
implementing sulphur reduction technologies would reduce sulphur emissions by 5.2% (Scorgie 2012). With no
intervention, increasing numbers of children risk premature death, whereas direct action to address pollution due to
coal-fired power station emissions would result in a healthier generation of Highveld children.
In conclusion, government programmes of electrification, and fuel efficient stoves40 are addressing indoor pollution
to some degree, and logically, this will then address outdoor pollution in affected areas. However, as this report
demonstrates, in areas like the HPA, at least 50% of the outdoor air pollution is due to Eskom power stations, and
addressing indoor pollution will have little impact on the ambient air quality health risk borne by affected communities.
Conservative estimates indicate that investing in reducing pollution, improving ambient air quality, leading to an
improvement in people’s health, is economically a more sustainable development choice, and leads to additional jobs
that are part of a just transition towards a healthier society.
Liziwe McDaid
38 Stats SA 2011. Copy of Households by income band by metro and province, Stats Sa 39 Various job studies (IDC, Institute for Security Studies) indicate that renewable energy could create an estimated
130 023 long-term jobs, with an additional 67 977 long-term jobs in energy efficiency and resource efficiency (Borel-
Saladin 2013).
40 For example, Basa Njengo Magogo

groundWork The Health Impact of Coal 20 May 2014
Appendix A
Appendix A. Ambient Air Quality national standards for criteria pollutants – South Africa compared to WHO (WHO
2005).
Averaging Period Concentration Frequency of Exceedance
Compliance Date
National Ambient Air Quality Standards for Sulphur Dioxide SO2
24 hours 125 µg/m3 (48ppb) 4 immediate
1 year 50 µg/m3 (19ppb) 0 immediate
WHO 2005
24 hours 20 µg/m3
National Ambient Air Quality Standards for Nitrogen Dioxide NO2
1 hour 200 µg/m3 (106ppb) 88 immediate
1 year 40 µg/m3 (21ppb) 0 immediate
WHO
National Ambient Air Quality Standards for Particulate matter (PM10)
24 hours 120 µg/m3 4 Immediate 31 Dec. 2014
24 hours 75 µg/m3 4 1 January 2015
1 year 50 µg/m3 0 Immediate 31 Dec. 2014
1 year 40 µg/m3 0 1 January 2015
WHO41
24 hour 50 µg/m3
1 year 20 µg/m3
National Ambient Air Quality Standards for Particulate Matter (PM2.5)42
24 hours 65 µg/m3 4 Immediate – 31 Dec 2012
24 hours 40 µg/m3 4 1 Jan. 2016- 31 Dec. 2029
24 hours 25 µg/m3 4 1 January 2030
1 year 25 µg/m3 0 Immediate – 31 Dec 2012
1 year 20 µg/m3 0 1 Jan. 2016- 31 Dec. 2029
1 year 15 µg/m3 0 1 January 2030
WHO
24 hour 25 µg/m3
1 year 10 µg/m3
41 The new WHO guidelines (World Health Organization, 2005) are documented primarily for the protection of human health. The 10-minute guideline of 500 μg/m³ published in 2000 remains unchanged, but the daily guideline is significantly reduced from 125 μg/m³ to 20 μg/m³ (in line with the precautionary principle). An annual guideline is not deemed necessary, since “compliance with the 24-hour level will assure lower levels for the annual average 42 Department of Environment Affairs 2012. NEM: AQA 2004. National Ambient Air Quality Standard for Particulate Matter with Aerodynamic Diameter less than 2.5 micron metres (PM2.5). Government Gazette 29 June 2012 no.35463 pg 7

groundWork The Health Impact of Coal 20 May 2014
References Barnes 2014. Behavioural Change, Indoor Air Pollution and Child Respiratory Health in Developing Countries: A Review.
Int. J. Environ. Res. Public Health 2014, 11(5), 4607-4618; doi:10.3390/ijerph110504607
Bhugwandin K., 2013. The integration of measured, modelled and remotely sensed air quality data and its impact on
the Highveld. Thesis submitted. School of Geography, Archaeology and Environmental Studies, University of the
Witwatersrand, Johannesburg
Borel-Saladin JM, Turok IN. The impact of the green economy on jobs in South Africa. S Afr J Sci. 2013;109(9/10), Art.
#a0033, 4 pages. http://dx.doi.org/10.1590/ sajs.2013/a0033
Bradshaw D., Nannan N., Laubscher R., Groenewald P., Joubert J., Nojilana B., Norman R., Pieterse D., and Schneider
M. 2000a. SA National Burden of Disease Study 2000. Estimates of provincial mortality Mpumalanga Province, MRC
Burden of Disease Research Unit.
Bradshaw D., Nannan N., Laubscher R., Groenewald P., Joubert J., Nojilana B., Norman R., Pieterse D., and Schneider
M. 2000b. SA National Burden of Disease Study 2000. Estimates of provincial mortality Gauteng Province, MRC Burden
of Disease Research Unit1
Burt E., Orris P., Buchanan S. 2013. Scientific Evidence of Health Effects from Coal Use in Energy Generation – Health
care Research Collaborative. University of Illinois at Chicago School of Public Health, Chicago, Illinois, USA
Centre for Environmental Rights 2014. Submissions on Eskom’s applications for postponement of compliance with the
minimum emission standards in terms of the national environmental management: air quality act, 2004. Ref.
CER/33.5/RH/SK 12 February 2014.
Chen Y., Ebenstein A., Greenstone M., and Hongbin L. 2014. Evidence of the impact of sustained exposure to air
pollution on life expectancy from China’s Huai River policy. PNAS vol. 110 no 32 12936-12941.
www.pnas.org/cgi/doi/10.1073/pnas.1300018110
Coetzee, A.M., 1986: Die invloed van lugbesoedeling op gesondheid in die Sasolburg gebied, SAMT 70/6, 339-343.
Department of Environment Affairs 2012. NEM:AQA 2004. National Ambient Air Quality Standard for Particulate
Matter with Aerodynamic Diameter less than 2.5 micron metres (PM2.5). Government Gazette 29 June 2012 no.35463
pg 7
DoE 2012. A survey of energy-related behaviour and perceptions in South Africa. The residential sector 2012.
Department of Energy.
DEA (undated). Highveld Priority Area Air Quality Management Plan Executive Summary. DEA. Pretoria
DEA 2011. Environmental Sustainability Indicators. Technical report 2011. Department of Pretoria
EPA 2009. SAB/HES review draft – November 2009. Chapter 2 – Estimation of human health effects and economic
benefits. http://www.epa.gov/cleanairactbenefits/dec09/IEc_Second_Prospective_Health_Benefits_Chapter.pdf
EPA 2010. The Benefits and Costs of the Clean Air Act: 1990 to 2020 – Summary Report. August 16, 2010 External
Review Draft. US Environmental Protection Agency.
Kim JJ, American Academy of Pediatrics Committee on Environmental Health, 2003-2004. Ambient Air Pollution:
Health Hazards to Children. American Academy of Pediatrics,
http://pediatrics.aappublications.org/content/114/6/1699.full.html (accessed 10/5/2014)

groundWork The Health Impact of Coal 20 May 2014
Leiman A., Standish B., Boting A., van Zyl H. 2007. Reducing the healthcare costs of urban air pollution: The South
African experience. Journal of Environmental Management. Vol. 84.pg 27-37
McCarthy TS. The impact of acid mine drainage in South Africa. S Afr J Sci. 107(5/6), Art. #712, 7 pages.
doi:10.4102/sajs.v107i5/6.712
Munnik V., Hochmann G., Hlabane M. 2009. The Social and environmental consequences of coal mining South African
case study. EMG
Kings S. 2014. Eskom Spurns air quality controls. Article in Mail and Guardian 14 March 2014.
http://mg.co.za/article/2014-03-13-eskom-spurns-air-quality-controls
Mpumalanga Policy and budget speech for the Department of Health 2012/2013.
http://www.mpumalanga.gov.za/media/speeches/health/budget.htm
Myllyvirta L., 2014. Health Impacts and Social Costs of Eskom’s proposed non-compliance with South Africa’s air
emission standards. Greenpeace International.
Norman R., Cairncross E., Witi J., Bradshaw D., and the South African Comparative Risk Assessment Collaborating
Group, 2007a. Estimating the burden of disease attributable to urban outdoor air pollution in South Africa in 2000,
SAMJ vol. 97. No.7. August 2007. http://www.ncbi.nlm.nih.gov/pubmed/17952237
NormanR., Barnes B., Mathee A., Bradshaw D., and the South aFrican Coparative Risk Assessment Collaborating Group.
2007b. Estimating the burden of disease attributable to indoor air pollution from household use of solid fuels in South
Africa in 2000. S. afr. Med. Journal 2007: vol 97, no 8: 764-771.
Qasim M., Bashir A., Anees M., Ghani M., Khalid M., Malik J., Kokab., A. Health Risk Assessment of Indoor Air Quality
in Developing Countries. Asian Journal of Management Sciences & Education Vol. 3(2) April 2014
Roos B. 2011. Mercury Emissions from Coal-fired Power stations in South Africa. University of Johannesburg
Scott 2011. Reducing Mercury Emissions from Coal Combustion in the Energy Sectors in South Africa. United Nations
Environment Programme, Department of Environmental Affairs.
Scorgie 2012. Urban Air Quality Management and Planning in South Africa. Masters Thesis. University of Johannesburg
Spalding-Fechter R., Matibe D. 2003. Electricity and externalities in South Africa. Energy Policy 31 (pg 721-734)
StatsSA. 2012a. Report-03-09-10 - Levels and trends of morbidity and mortality among children aged under-five years
in South Africa, 2006-2010
Stats SA 2010. Statistical release P0309.3. Mortality and causes of death in South Africa, 2010: findings from death
notification.
Strategic Environmental Management Solutions 2013. Summary Atmospheric Impact Report Applications for
postponement of the Minimum Emissions Standards for Eskom’s coal and liquid fuel-fired power stations – 18
November 2013 (Final Draft).
Tait L., Winkler H. 2012. Estimating greenhouse gas emissions associated with achieving universal access to electricity
in South Africa. Energy Research Centre. UCT.
Trasande L., Landrigan P., and Schechter C. 2005. Public Health and Economic Consequences of Methyl Mercury
Toxicity to the Developing Brain. Environment Health Perspectives volume 113. Number 5. Pg 590-596
WHO, 2014. Ambient (outdoor) Air quality and Health factsheet No 313, updated March 2014

groundWork The Health Impact of Coal 20 May 2014
WHO 2005. WHO Air quality guidelines for particulate matter, ozone, nitrogen dioxide and sulfur dioxide. Global
update 2005. Summary of risk assessment.
WHO European Centre for environment and Health, Bonn. 2013. Review of evidence on health aspects of air pollution
– REVIHAAP Project: Technical Report Page 127.
http://www.euro.who.int/__data/assets/pdf_file/0004/193108/REVIHAAP-Final-technical-report-final-version.pdf