the hazard from earthquakes in the boston area
TRANSCRIPT
Boston Geology
The Hazard From Earthquakes in the Boston Area
The varied underground conditions in the area result in a range of effects that can be expected from a seismic event.
PATRICKJ. BAROSH
Northeastern Massachusetts is one of the relatively more seismically active areas in New England and where the
greatest earthquake recorded for New England occurred in 1755. Boston was damaged by this earthquake and an earlier nearby one in 1727. The city also suffered, in 1638 and 1669, from earthquakes at La Malbaie in Quebec. The recurrence of earthquakes of these magnitudes, and the possibility of an even larger one, is of considerable concern due to the large population in the region, the larger number of buildings with poorer foundation conditions than in the past, and potential affects on power plants, dams and tall structures.
Several pioneering earthquake studies were made in the area. The investigation of the 1755 earthquake by Winthrop is one of the first earthquakes studied in a modern descriptive manner without a strong religious bias of God's
punishment of sinners.1 A masterful study of the regional control of earthquakes in the region was made by Hobbs in 1907.2The effect of the varying ground conditions on the hazard from earthguakes was investigated in Boston by Crosby.3,4,5 Despite these excellent studies, Boston was later placed in an unwarranted high hazard category on a national map6 due to an error that placed the 1755 earthquake within metropolitan Boston.
. The need to determine the actual hazard for nuclear power plant safety in the region ushered in a series of evaluations of the seismic hazard for specific sites such as at Seabrook, New Hampshire? The New England Seismotectonic Study was formed by the U.S. Nuclear Regulatory Commission in 1976 to investigate the cause of seismicity and formulate an earthquake zonation map of the northeast United States.8'
9 The results of this study, plus an analysis of the tectonic stability of the region for the purpose of locating storage sites for highlevel radioactive waste10 and additional studies for the U.S. Army Cor~s of Engineers to evaluate dam safety,11,12,1 ,l4 have now produced reliable earthquake zonation for the region. Unfortunately, some earthquake building codes in the region follow a simplified probabilistic study that is used by the Applied Technology Council that is based largely on
CIVIL ENGINEERING PRACTICE SPRING 1989 65

TABLE 1 Modified Mercalli Intensity Scale of 1931 (Abridged Version)
I. Not felt except by very few people under especially favorable circumstances.
II. Felt only by a few persons at rest, especially on the upper floors of buildings. Delicately suspended objects may swing.
Ill. Felt quite noticeably indoors, especially on the upper floors of buildings, but many people do not recognize it as an earthquake. Standing cars may rock slightly. There are vibrations like that of a passing truck. Duration estimated.
IV. During the day it is felt indoors by many, outdoors by few. At night some are awakened. Dishes, windows and doors are disturbed; walls will make cracking sounds. It will create a sensation like a heavy truck striking a building. Standing cars rocked noticeably.
V. Felt by nearly everyone; many are awakened. Some dishes, windows, etc., are broken; a few instances of cracked plaster; unstable objects are overturned. Trees are disturbed, as well as poles and other tall objects. Pendulum clocks may.stop.
VI. Felt by all; many are frightened and run outdoors. Some heavy furniture is nioved; a few instances of fallen plaster or damaged chimneys. Damage slight.
VII. Everybody runs outdoors. Damage is negligible in buildings with good design and construction; slight to moderate damage in well-built ordinary structures; considerable damage in poorly built or badly designed structures; some chimneys broken. Noticed by persons driving cars.
assumptions and may not be accurately relied on.15 Thus, again local knowledge is not utilized in producing a national zoning map. More detail on the earthquake hazard in Boston and the regional movements and cause can be found in other studies.9114116117 All earthquake intensities are given in the Modified Mercalli Scale (see Table 1).18
Seismicity of Eastern Massachusetts New England is a region of moderate earthquake hazard that experiences an earthquake every couple of days (see Figure 1). This rate of activity is, at least, an order of magnitude less than that for Southern Califor-
66 CIVIL ENGINEERING PRACTICE SPRING 1989
VIII. Damage is slight in specially designed structures; considerable in ordinary substantial buildings with partial collapse; great in poorly built structures. Panel walls are thrown out of frame structures. Chimneys, factory stacks, columns, monuments and walls will fall. Heavy furniture is overturned. Sand and mud are ejected in small amounts. Changes in well water. It will disturb persons driving cars.
IX. Damage is considerable in specially designed structures; well designed frame structures are thrown out of plumb; great damage in substantial buildings, with partial collapse. Buildings are shifted off foundations. Ground cracks conspicuously. Underground pipes break.
X. Some well-built wooden structures are destroyed; most masonry and frame structures are destroyed; the ground is badly cracked. Rails bend. Landslides are considerable from river banks and steep slopes. Sand and mud shifts. Water splashes (slops) over banks.
XI. Few, if any, masonry structures remain standing. Bridges are destroyed. Broad fissures develop in the ground. Underground pipe lines are put completely out of service. Earth slumps and land slips in soft ground. Rails bend greatly.
XII. Damage is total. Waves are seen on ground surfaces. Lines of sight and level are distorted. Objects are thrown upward into the air.
From Ref. 18
nia. These earth1uakes, as shown by the 400 year-long record, 9 are concentrated in certain areas
8 whereas other areas remain very
quiet. 120 The general areas of relatively high activity now appear well defined. The earthquakes whose depths have been determined, generally have depths less than 10 kilometers and many have a depth of only a few kilometers.
Most of the seismic activity in eastern Massachusetts is concentrated in the Cape Ann seismic area in a great arc around Cape Ann that extends from the south side of Boston to southern Maine (see Figures 2 and 3). The two largest recorded earthquakes . in the area oc-

Time Period 1534-1977 MM Intensity:
0 :'>Ill • VII A IV • VIII o V
FIGURE 1. Map showing seismicity of the northeastern United States and adjacent Canada from 1534 to 1977.
curred offshore of the north side of Cape Ann. The earthquakes in the area tend to decrease in size away from this site towards Boston.
The two principal historic seismic events are the 1755 earthquake of probable epicentral in~ tensity VIII and the 1727 event of intensity vn.7 The earthquake of November 18, 1755 was located about 80 km (50 mi) offshore of Boston. It came 17 days after the Great Lisbon earthquake and was felt from Halifax, Nova Scotia, to Annapolis, Maryland (see Figure 4).1 It caused damage across eastern Massachusetts and thoroughly frightened the inhabitants. In Boston it reached a high intensity VII. In the city the tops of up to 1,500 chimneys were demolished and others cracked and received some sort of damage. Bricks, tiles and slates were scattered in the streets, and large quan-
tities of mortar and rubbish spread almost everywhere. Several houses suffered large cracks and breaches in their foundations. In some places, especially on the low, loose ground made by filling in around the harbor, the streets were almost covered with fallen bricks.
The smaller earthquake of November 9, 1727 that was similarly located offshore north · of Cape Ann caused minor damage along the coast near Newbury, Massachusetts, and adjacent areas in New Hampshire.7 It greatly startled the residents of Boston, but caused little damage (intensity VI).
Cause of Seismicity The New England Seismotectonic Study showed that the earthquakes are occurring at
CIVIL ENGINEERING PRACTICE SPRING 1989 67

Note: Boundaries shown are very approximate.
0 100
0 100
1 a Raritan Bay
1 b Northern Fall Line
2 Champlain-Hudson
Adirondack Mtns.
Connecticut Valley
Moodus
Narragansett
Cape Ann
Merrimack ValleyWhite Mtns.
9 Southern Maine
10 Passamaquoddy
11 La Malbie
12 Southwest Quebec
200mi
200km
FIGURE 2. Map showing the areas of relatively higher seismicity in the northeastern United States and adjacent Canada. ·
several local areas of subsidence along the Atlantic Coast of the United States. This subsidence takes place along basement faults whose movements produce earth-
68 CIVIL ENGINEERING PRACTICE SPRING 1989
quakes.9,14,16,17 The New Hampshire embayment, centered on the New Hampshire coast north of Cape Ann, is one of these subsiding areas and its resulting seismicity appears to be

1963 1641 39 1727
1737
1111755 -
0 25 0 Intensity (MM) 0 6. 18
Ill 0 06. .1963
IV D. 0 V □
b:. 0 VI • 0 0 A
Oo~ □ 1860 6.
VII A VIII ■ 00 0
From Ref. 19 Illustration by Evelyne Whitney
FIGURE 3. Epicentral map of Massachusetts 1534 to 1980 (courtesy the Worcester Telegram).
associated with a major structural intersection along a northwest-trending zone of active fractures. The peripheral earthquakes may be caused by local adjustments on various other faults due to the subsidence (see Figure 5).13,14
Seismic Hazard Once the source areas of potentially damaging earthquakes have been located, the seismic hazard to specific sites from activity at these source areas· can then be evaluated. This evaluation is achieved by investigating the largest earthquake that is recorded at each source area, determining the maximum credible earthquake that is likely to occur at these areas, establish the rate for attenuating the effects of earthquakes between these areas and the site of concern, and identifying ground conditions at the site that may amplify or dampen these effects. 21
The time element, or how frequently such a maximum credible event will occur, is not
taken into account in this approach. It merely assumes that the maximum credible earthquake may occur "sometime.". It thus presents the potential hazard and not the risk. Determining risk involves determining the reasonable return times, a process that has yet to be achieved. The frequency rate is not important for critical structures such as nuclear power plants, dams, hospitals and certain storage tanks that need be built to withstand the maximum credible earthquake, but it may be in non-critical short-term facilities.
The maximum recorded earthquakes for seismic areas in southern New England and La Malbaie, Quebec, are shown in Table 2. The maximum credible earthquakes for those areas that might be a threat to the Boston region are shown in Table 3.13 The results indicate the maximum expected earthquake for the offshore Cape Ann area is IX and that in the southern part of the area, within the greater Boston metropolitan area, the maximum ex-
CIVIL ENGINEERING PRACTICE SPRING 1989 69

Canada '111? f .' ~
ME
\ --- •.·---~ 'r { Halifax IV • _/"" ---~· \\ _ j' ._,, / "weak but perceivable"
/' l . , • __./. ~ . -~.'-·'-'/'\ l"A 1· R I ~ -,111:J ~ ,c-' nnapo IS- oya e V
,.S-l/ A~/>
,·t.~,V / \1 1-f:;l'
/
' (' \ )1J;; ,_, ' Assumed Limit - ) \ 1 • '
~ . ,t&t.ffl Intensity IV (MM\ , ' / \ /(f\~6-
\ X ;, \ 1Portland VI-VII
,6Ft. Oswego ,✓ "Not felt."
,:'
I PA
MD\
VA
Y 4 Ft Crown Pt. IV / , ~ ' \. I( NH ·, I \ VT \ /Bedford V . \'._Portsmouth V \! ) .-:' ~ Ipswich VI-VII
' .. _ Chelmsford VI , ( Boston VII
( · - Westborough V ~ ~,tuate VI-VII r-- ___ _
Northampton V-VI .. \. w .. ,;rcester VI .,i Plymouth V-VI I · • Dover IV-V
I , - -y- ·:;v1_ Yarmouth•..- >1 t ~pringfield: · · · ✓I fol "f".1.~ye earthquake" N
~ York VII
• Por~mouth V I
1 :'ane be_nt' . Exeter V-VI .~'/J,V 'i,). ,,,.',-; i \ Newport V v ! • Bedford V I CT l ,,, ...
.J
• Hampton VI-VII " '{
\
'.• New Hav1an.Y-VI i )·~ .4:"f
¼},),./'. _.//./,/' ·········s~,/-
Nfw York IV-) .'..-,,d;-{,
\. NJ•-·•\ '-, J
'--. '
J a
Legend o = Not felt
./"
/
• Chelmsford VI
' I "..I "\
, Ipswich VI-VII •-; Essex VI-VII
12' Gloucester VII
Woburn VI ,\ Salem VI • (, Lynn IV-V
Boston VII el:N-b h V Cr '''
WeSt oroug · .. <i,IWeymouth IV-V Braintree VII• ,
'!) Scituate VI-VII
•Marshfield VI . • ~';';!broke Vi-VII '¼:'.\
-~Plymouth V-VI
Detail of Reporting Localities, for Immediate Coastal Area 1
\ 0 Yarmouth
"felt ye earthquake"•
>,, ('
?:t" • = Felt report, intensity unassigned
ll• = Felt report, intensity (MM) ' ,,:')' ·1. :,: - = lsoseismal line 0 SO mi
.0
.' Williamsburg .,,. - - = Estimated isoseismal line frl\,,repa~
~ . '' o so km
FIGURE 4. Isoseismal map of the November 18, 1755 Cape Ann earthquake.
70 CIVIL ENGINEERING PRACTICE SPRING 1989

II' •
• •
• PQ
•
• • • • •
FIGURE 5. Map of New England and adjacent areas showing earthquakes for the period October 1975 to March 1984, the generalized fault and probable fault zones spatially related to earthquakes (solid lines) and the border of the coastal plain deposits (dashed line).
pected is VII. (see Figure 6). The intensity X earthquakes experienced in the La Malbaie area are probably near their maximum size.
A maximum credible earthquake in the greater Boston area would produce very local moderate damage. One near Cape Ann off the Massachusetts coast would produce considerable damage in parts of Boston and in select areas of eastern Massachusetts. One in the Ossipee area would cause only very minor damage and one from La Malbaie would cause
minor damage with perhaps some moderate damage in structures that are very sensitive to long period waves (see Table 4).
Local Foundation Conditions The intensity at a site may increase or decrease from the average by as much as two intensity units for extreme variations in ground conditions. 22,23 The different responses to earthquakes depend on the type, density and thickness of the surface layer, degree of water
CIVIL ENGINEERING PRACTICE SPRING 1989 71

TABLE 2 Maximum Epicentral Intensities Recorded for Source Areas Near Boston & La Malbaie
Epicentral Magnitude Area Earthquake Intensity (estimate)
Cape Ann Greater Boston Woburn, October 5, 1817 V-VI MbLg 4.0
Salem, June 14, 1744 VI MbLg 4.7 Offshore Cape Ann Cape Ann, November 18, 1755 VIII mb5.8
Merrimack Valley- Ossipee, December 20 & 24, 1940 VII mb5.4 White Mountains
Narragansett Bay Wareham, December 25, 1800 VI
Moodus East Haddam, May i 6, 1791 VI-VII
La Malbaie La Malbaie, February 5, 1663 X
saturation and other factors. A wide variety of foundation conditions ex
ists in eastern Massachusetts. The Boston metropolitan region. contains areas of filled land, marine clay, stratified drift, drumlin till, beach deposits, lake deposits, bedrock and other types of surficial materiaI.24 If stratified drift or ground moraine is assumed to represent the average foundation conditions with average intensities, then the variation in intensity due to the other material may be approximately as shown in Table 5 which was developed from the general observations found in some other studies.22
,23
The average intensities from a potential
earthquake would be adjusted according to such changes as indicated in Table 5 to approximate the expected local intensities. However, the listing in Table 5 is still too approximate and simplified for an accurate value. It does not indicate thickness, degree of compaction, underlying material, groundwater condition and slope - all of which are all important in ascertaining a reasonably accurate value. Nor does the listing take into account possible liquefaction of sands and clays. Liquefaction of unconsolidated material due to an earthquake load may occur in the area and is addressed in the Massachusetts seismic code.25 Sand blows, apparently from liquefac-
TABLE 3 Maximum Credible Earthquake for Source Areas Posing the Greatest Hazard to Boston
Epicentral Magnitude Distance Area Intensity (mb) (for event & range)
Cape Ann Greater Boston VII 5.1 0 Offshore Cape Ann IX 6.6 80 km (50 mi)
(48-112 km; 30-70 mi)
Merrimack Valley- VIII 5.8 176 km (110 mi) White Mountains (128-184 km; 80-11 5 mi)
La Malbaie X 7.3 600 km (375 mi) (536-632 km; 335-395 mi)
72 CIVIL ENGINEERING PRACTICE SPRING 1989

80° 78° 76° 74° 720 70°
v\ Zones_of Maximum MM Intensity VI
VI
Note: Explanation of the values used in describing the maximum epicentral intensity expected on firm ground for seismic source zones in the eastern United States is as follows:
V. Areas of no known earthquakes, generalized boundaries that avoid large known or suspected fracture zones, but otherwise not drawn on geologic basis. The level is chosen at V since rapid freezing may produce this intensity locally.
VI. Areas that have only experienced scattered intensity V earthquakes. Most of the area is considered to rate at intensity V level, but it contains more active local areas with potential for intensityVI (might separate with more detailed zonation).
VII. Areas with identifiable clusters of earthquakes forming a seismic zone that has only experienced intensity VI and probably has potential for intensity VII in the general vicinity of intensity VI or areas where an experienced intensity VII is the estimated maximum. Boundaries are related to geologic features and are
48°
46°
42°
generally drawn on them, bu.t modified locally to conform to earthquake distribution.
VIII. Areas with clusters of epicenters within a seismic zone with an experienced intensity at, or near, VII, or areas where an experienced intensity VIII is the estimated maximum. Related to geologic source zone and boundaries generalized around source zone and related earthquakes.
IX. Areas with clusters of epicenters within a seismic zone with an experienced intensity of VIII. Probably approaching the limit of strain build-up in areas of shallow earthquakes. Related to the geologic source zone and boundaries generalized around source zone and related earthquakes.
X. Areas with clusters of numerous epicenters within a seismic zone with an experienced intensity of IX or X. Probable limit of strain build-up on the east coast of the United States. Related to the geologic source zone and boundaries generalized around source zone and related earthquakes.
From Ref. 12
FIGURE 6. Map of the northeastern United States and adjacent Canada showing the maximum expected epicentral intensity.
CIVIL ENGINEERING PRACTICE SPRING 1989 73
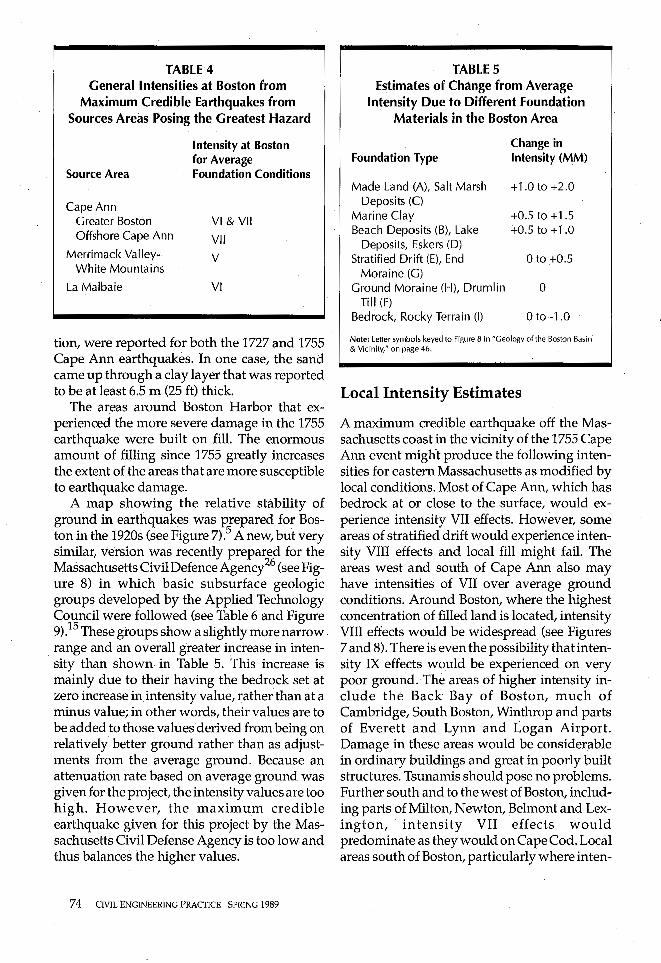
TABLE 4 General Intensities at Boston from
Maximum Credible Earthquakes from Sources Areas Posing the Greatest Hazard
Intensity at Boston for Average
Source Area Foundation Conditions
Cape Ann Greater Boston VI & VII Offshore Cape Ann VII
Merrimack Valley- v White Mountains
La Malbaie VI
tion, were reported for both the 1727 and 1755 Cape Ann earthquakes. In one case, the sand came up through a clay layer that was reported to be at least 6.5 m (25 ft) thick.
The ar.eas around Boston Harbor that experienced the more severe damage in the 1755 earthquake were built on fill. The enormous amount of filling since 1755 greatly increases the extent of the areas that are more susceptible to earthquake damage.
A map showing the relative stability of ground in earthquakes was P,repared for Boston in the 1920s (see Figure 7).5 A new, but very similar, version was recently prepared for the Massachusetts Civil Defence Agency26 (see Figure 8) in which basic subsurface geologic groups developed by the Applied Technology Council were followed (see Table 6 and Figure 9) .15 These groups show a slightly more narrow.
. range and an overall greater increase in intensity than shown in Table 5. This increase is mainly due to their having the bedrock set at zero increase in. intensity value, rather than at a minus value; in other words, their values are to be added to those values derived from being on relatively better ground rather than as adjustments from the average ground. Because an attenuation rate based on average ground was given for the project, the intensity values are too high. However, the maximum credible earthquake given for this project by the Massachusetts Civil Defense Agency is too low and thus balances the higher values.
7 4 CIVIL ENGINEERING PRACTICE SPRING 1989
TABLE 5 Estimates of Change from Average
Intensity Due to Different Foundation Materials in the Boston Area
Change in Foundation Type Intensity (MM)
Made Land (A), Salt Marsh + 1.0 to +2 .0 Deposits (C)
Marine Clay +0.5 to+ 1 .5 Beach Deposits (B), Lake +0.5 to + 1 .0
Deposits, Eskers (D) Stratified Drift (E), End Oto +0.5
Moraine (G) Ground Moraine (H), Drumlin 0
Till (F) Bedrock, Rocky Terrain (I) 0 to -1 .0
Note: Letter symbols keyed to Figure 8 in "Geology of the Boston Basin & Vicinity," on page 46.
Local Intensity Estimates
A maximum credible earthquake off the Massachusetts coast in the vicinity of the 1755 Cape Ann event might produce the following intensities for eastern Massachusetts as modified by local conditions. Most of Cape Ann, which has bedrock at or close to the surface, would experience intensity VII effects. However, some areas of stratified drift would experience intensity VIII effects and local fill might fail. The areas west and south of Cape Ann also may have intensities of VII over average ground conditions. Around Boston, where the highest concentration of filled land is located, intensity VIII effects would be widespread (see Figures 7 and 8). There is even the possibility that intensity IX effects wo.uld be experienced on very poor ground. The areas of higher intensity include the Back Bay of Boston, much of Cambridge, South Boston, Winthrop and parts of Everett and Lynn and Logan Airport. Damage in these areas would be considerable in ordinary buildings and great in poorly built structures. Tsunamis should pose no problems. Further south and to the west of Boston, including parts of Milton, Newton, Belmont and Lexington, in tensity VII effects would predominate as they would on Cape Cod. Local areas south of Boston, particularly where in ten-

-i -l-- - --- --- .
Legend
~ ~ Most Stable: Bedrock Irntt8 at or near the surface.
-
Very Stable: "Bewider cla. y," "glacial till" or "hardpan" at or near the surface.
~~~ Somewhat Stable: Not I , more than 1 0 ft of silt,
1 1 ! 1 j ! equiv. of clay or sand
above bedrock. Structures stable with rigid foundations.
Iii Very Unstable: Ten ft to 30 ft of silt or fill. Reinforced concrete foundations on piles required.
Most Unstable: More than 30 ft of silt or equiv. Reinforced concrete foundations on deep piles required for stability.
FIGURE 7. Map of Boston and vicinity showing the probable relative stability of the ground during an earthquake.
CIVIL ENGINEERING PRACTICE SPRING 1989 75

FIGURE 8.Map of the metropolitan Boston area showing numbered areas where the overburden may result in a site intensity of +2. The number (and letter if present) indicates generalized subsurface geologic conditions as shown on the figure. Such areas have the potential to experience ground shaking corresponding to Modified Mercalli intensity VIII for an earthquake magnitude 4.25 mb from a source off Cape Ann. ·
TABLE 6 Estimates of Unit Increase in Intensity Due to Different Foundation Materials
Foundation Type Changes in Intensity (MM)
Geologic conditions where combined thick- +2 ness of non-engineered fills, organic soils, soft silts or clays, & loose granular soils ex-ceeds a 30 to 50 ft (9.1 to 15.2 m) range in thickness.
Organic soils less than 30 ft (9.1 m) in thick- + 1 ness overlying glacial till or bedrock.
Material at all sites not included in other + 1 groups of this list.
Bedrock, glacial till (exclusive of ablation 0 till) & deposits of other dense or stiff soils less than a 30 to 50 ft (9.1 to 15.2 m) range in thickness & overlying bedrock.
From Ref. 26
76 CIVIL ENGINEERING PRACTICE SPRING 1989
sity VII was recorded in 1755, should expect intensity VIII. Intensity VIII effects would also occur very locally to the west of Boston and locally on the very thick outwash deposits forming Cape Cod.
Ground Motion The actual ground motion arising from a maximum credible earthquake affecting the Boston area can be estimated by applying desired ground motion-intensity relations to the expected intensities. Relations for acceleration, velocity and duration can be used as a guide in designing construction to withstand a potential earthquake. Such relations have been formulated for the central United States.27 Krinitzsky and Chang reviewed such strong motion data and produced a series of curves using some
1A 1B lC
T Fill Fill
Loose Soft Fill >30-50 ft Gran- Clay
l ular or Silt
2
2A 2B
r Loose Soft
>30-50 ft Gran-· Clay
l ular or
Silt
3
3A 3B 3C 3D 3E
T Org. Org. Fil.I. Soil Soil Org. Org. >30- Org. ·so ft Loose Loose. Soil
1 Gran- Gran-· ular or
ular or
Silt Silt
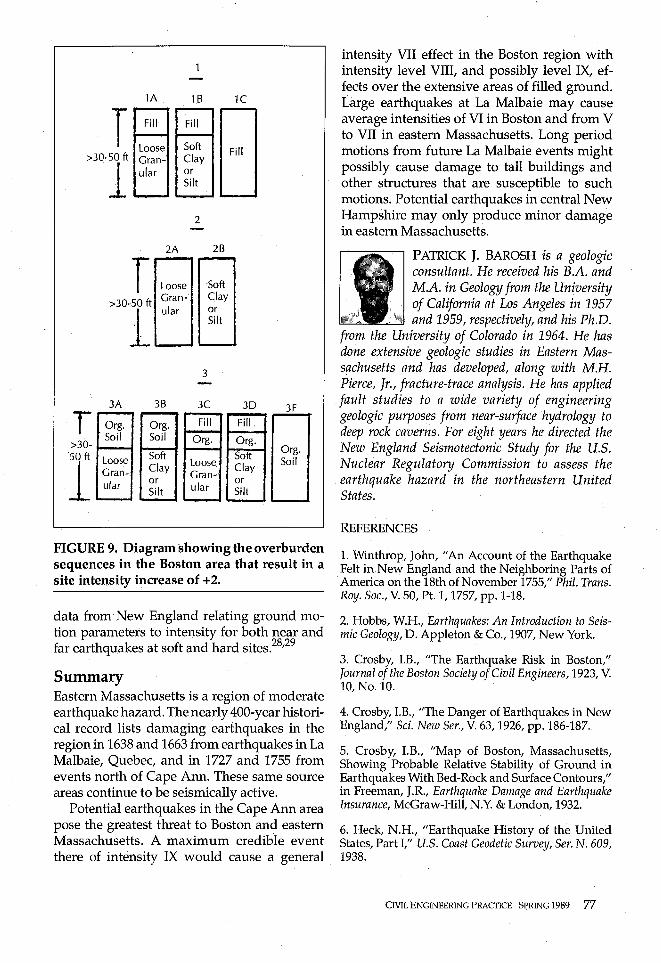
FIGURE 9. Diagram showing the overburden sequences in the Boston area that result in a site intensity increase of +2.
data from New England relating ground motion parameters to intensity for both near and far earthquakes at soft and hard sites.28
,29
Summary Eastern Massachusetts is a region of moderate earthquake hazard. The nearly 400-year historical record lists damaging earthquakes in the region in 1638 and 1663 from earthquakes in La Malbaie, Quebec, and in 1727 and 1755 from events north of Cape Ann. These same source areas continue to be seismically active.
Potential earthquakes in the Cape Ann area pose the greatest threat to Boston and eastern Massachusetts. A maximum credible event there of intensity IX would cause a general
intensity VII effect in the Boston region with intensity level VIII, and possibly level IX, effects over the extensive areas of filled ground. Large earthquakes at La Malbaie may cause average intensities of VI in Boston and from V to VII in eastern Massachusetts. Long period motions from future La Malbaie events might possibly cause damage to tall buildings and other structures that are susceptible to such motions. Potential earthquakes in central New Hampshire may only produce minor damage in eastern Massachusetts.
PATRICK J. BAROSH is a geologic consultant. He received his B.A. and M.A. in Geology from the University of California at Los Angeles in 1957 and 1959, respectively, and his Ph.D.
from the University of Colorado in 1964. He has done extensive geologic studies in Eastern Massachusetts and has developed, along with M.H. Pierce, Jr., fracture-trace analysis. He has applied
. fault studies to a wide variety of engineering geologic purposes from near-surface hydrology to deep rock caverns. For eight years he directed the New England Seismotectonic Study for the U.S. Nuclear Regulatory Commission to assess the earthquake hazard in the northeastern United States.
REFERENCES
1. Winthrop, John, "An Account of the Earthquake Felt inNew England and the Neighboring Parts of America on the 18th of November 1755," Phil. Trans. Roy. Soc., V. 50, Pt. 1, 1757, pp. 1-18.
2. Hobbs, W.H., Earthquakes: An Introduction to Seismic Geology, D. Appleton & Co., 1907, New York.
3. Crosby, LB., "The Earthquake Risk in Boston," Journal of the Boston Society of Civil Engineers, 1923, V. 10,No.10.
4. Crosby, I.B., "The Danger of Earthquakes in New England," Sci. New Ser., V. 63, 1926, pp. 186-187.
5. Crosby, LB., "Map of Boston, Massachusetts, Showing Probable Relative Stability of Ground in Earthquakes With Bed-Rock and Surface Contours," in Freeman, J.R., Earthquake Damage and Earthquake Insurance, McGraw-Hill, N.Y. & London, 1932.
6. Heck, N.H., "Earthquake History of the United States, Part I," U.S. Coast Geodetic Survey, Ser. N. 609, 1938.
CIVIL ENGINEERING PRACTICE SPRING 1989 77

7. Boston Edison Company, "Historical Seismicity of New England, Boston Edison Co., Preliminary Safety Analysis Rept. Pilgrim Unit No. 2, BESG7601," U.S. Nuclear Regulatory Commission Docket No. 50-471, 1976, 641 pp.
8. Barosh, P.J., "Earthquake Zonation in the Northeastern United States," in Hatheway, AW., ed., Engineering Geology in New England, ASCE Ann. Meeting, Boston, MA, Preprint 3602, 1979, 22 pp.
9. Barosh, P.J., "Cause of Seismicity in Eastern United States: A Preliminary Appraisal," in Beavers, J.E., ed., Earthquakes and Earthquake Engineering: The Eastern United States, Ann Arbor Science, Ann Arbor, Mich., V. 1, 1981, pp. 397-417.
10. Harrison, W., et al., "Geology, Hydrology, and Mineral Resources of Crystalline Rock Areas of the Northeastern United States," Argonne Nat'l Lab., Rept. ANL/ES-136, Parts 1 and 2, 1983, 413 pp.
11. Krinitzsky, E.L., & Dunbar, J.B., "Geological-Seismological Evaluation of Earthquake Hazards at Franklin Falls Damsite, New Hampshire," U.S. Army Corps of Engrs., Waterways Experiment Station Tech. Rept. GL-86-16, 1986, 50 pp. & appendices.
12. Barosh, P.J., "Seismic Source Zones of the Eastern U.S. and Seismic Zoning of the Atlantic Seaboard and Appalachian Regions," U.S.Army Corps. of Engineers, Waterways Experiment Stations, Misc. Paper S-73-1, State-of-the-Art for Assessing Earthquake Hazards in the United States, Rept. 21, 1986, 302 pp.
13. Barosh, P.J., "Summary and Analysis of the 1982 Gaza, New Hampshire, Earthquake," in Krinitzsky, E.L., and Dunbar, J., Geological-Seismological Evaluation of Earthquake Hazards at Franklin Falls Damsite, New Hampshire, US Army Corps of Engineers, Waterways Experiment Station Tech. Rept. GL-86-16, 1986, Appendix C, pp. Cl-C75.
14. Barosh, P.J., "Neotectonic Movement, Earthquakes and Stress State in the Eastern United States," Tectonophysics, V. 132, 1986, pp. 117-152.
15. Applied Technology Council, "Tentative Provisions for the Development of Seismic Regulations for Buildings," Applied Tech. Council Rept. ATC 3-06, NBS Spec. Pub. 510, NSF Pub. 78-8, 1978.
16. Barosh, P.J., "Seismicity and Earthquake Hazard of Boston and Adjacent Eastern Massachusetts," Association of Engineering Geologist, Bull., in press.
17. Barosh, P.J., "Neotectonic Movement and Earthquake Assessment in the Eastern United States," Geolog. Society of America, Special Paper, E. L. Krinitzsky and D. B. Slemmons, eds., in press.
18. Wood, H.O., & Neumann, F., "Modified :tvrercalli
78 CIVIL ENGINEERING PRACTICE SPRING 1989
Intensity Scale of 1931," Seismal. Soc. America Bull., V. 21, N. 4, 1931, pp. 277-283.
19. Nottis,G.N.,ed., "Epicenter Map of Northeastern United States and Southeastern Canada, Onshore and Offshore; Time Period 1534-1980," New York Geol. Survey, N.Y. State Museum Map and Chart Ser. N. 38, 1983, 2 sheets, scale 1:1,000,000.
20. Chiburis, E.F., "Seismicity, Recurrence Rates and Regionalization of the Northeastern United States and Adjacent Southeastern Canada," U.S. Nuclear Reg. Comm. Rept. NUREG/CR-2309, 1981, 76 pp.
21. Barosh, P.J., "Use of Seismic Intensity Data to Predict the Effects of Earthquakes and Underground Nuclear Explosions in Various Geological Settings," U.S. Geo/. Survey Bull. 1279, 1969, 93 pp.
22. Popov, V.V., "Engineering-Geologic Criteria of Detailed Seismic Regionalization," in Problems in Eng. Seismology, No. 2, Akad. Nauk SSSR Inst. Fiziki Zemli Trudy 5 (172), 1959, pp. 81-93; also in Ref. 21.
23. Medvedev, S.V., "Determination of the Intensity Scale (Number) of Earthquakes in the USSR," Moscow, Akad. Nauk SSSR Council on Seismology, 1961, pp. 103-138; translation, Nov. 1962, U.S. Atomic Energy Comm. Transl. Ser. AEC-tr-5424, p. 124-156.
24. Kaye, C.A., "Surficial Geologic Map of the Boston Area, Massachusetts," U.S. Geol. Survey Open-File Rept. 78-111, 1978, approx. scale 1:1,000,000.
25. Soydemir, C., & LeCount, P.L., "Massachusetts Building Code on Liquefaction: A Design Engineer's Overview," in Beavers, J.E., ed., Earthquakes and Earthquake Engineering: The Eastern United States,Ann Arbor Sci., Ann Arbor, Mich., V. 2, 1981, pp. 665-681.
26. Haley and Aldrich, Inc., "Isoseismal/Geologic Conditions Maps for Eastern Massachusetts," unpublished report for the Mass. Civil Defense Agency, 1983, scales 1:2,500 and 1:24,000, 6 pp.
27. Nuttli, O.W., "The Relation of Sustained Maximum Ground Acceleration and Velocity to Earthquake Intensity and Magnitude," U.S. Army Corps of Engrs., Waterways Exper. Sta., Misc. Paper. S-73-1, Rept. 16, 1979, 100 pp.
28. Krinitzsky, E.L., & Chang, F.K., "Parameters for Specifying Intensity-Related Earthquake Ground Motions," Dept. of the Army, U.S. Army Corps of Engineers, Waterways Experiment Station Misc. Paper S-73-1, State-of-the-Art for Assessing Earthquake Hazards in the United States, Rept. 25, 1987, 43 pp., Appendix 41 pp.
29. Krinitzsky, E.L., & Marcuson, W.F., III, "Principles for Selecting Earthquake Motions in Engineering Design," Assa. Eng. Geo/., V. 20, 1983, pp. 253-265.