the hackett group overview - ncsdp.com€¦ · the hackett group 2008 supplier diversity study...
TRANSCRIPT

The Hackett Group 2008 Supplier Diversity Study Results: Insights into Program Performance and Practices
Kurt Albertson
Director of Advisory Services
January 09, 2009
Results for Participating Organizations

Page 2
2008 Supplier Diversity Study Results© 2009 The Hackett Group. All rights reserved. Reproduction of this document or any portion thereof without prior written consent is prohibited.
Statement of Confidentiality and Usage Restrictions
This document contains trade secrets and other information that is company sensitive, proprietary, and confidential, the disclosure of which would provide a
competitive advantage to others. As a result, the reproduction, copying, or redistribution of this document or the contents contained herein, in whole or in part, for
any purpose is strictly prohibited without the prior written consent of The Hackett Group. If a contract is awarded to The Hackett Group, as a result of, or in
connection with the submission of this document, any right to duplicate, use, or disclose all or any part of the contents contained herein will be subject to the terms
and conditions of a separate agreement.
Copyright © 2009 The Hackett Group, World-Class Defined. All rights reserved.
Page 3
2008 Supplier Diversity Study Results© 2009 The Hackett Group. All rights reserved. Reproduction of this document or any portion thereof without prior written consent is prohibited.
Table of Content
Supplier Diversity Study Overview
Supplier Diversity Objectives
Supplier Diversity Spend Analysis
Measuring Supplier Diversity Performance
Keys to a Successful Supplier Diversity Program
Supplier Diversity Program Governance
The Impact of Global Sourcing on Supplier Diversity
Looking Ahead

Page 4
2008 Supplier Diversity Study Results© 2009 The Hackett Group. All rights reserved. Reproduction of this document or any portion thereof without prior written consent is prohibited.
Continuing Economic Instability and Global Markets will Challenge Supplier Diversity Managers to Create Real Value and Rethink Program Scope
A complex set of objectives drive supplier diversity programs with direct to consumer organizations stressing
brand recognition and non-direct to consumer organizations emphasizing customer and government
requirements. ..both objectives can be directly tied to revenue which is critical to success
Nearly three quarters of diversity suppliers have less than $100k in annual spend with any one participant
and account for less than six percent of the total supplier diversity spend reported. An organization’s
objectives should dictate the optimal approach for their diverse supplier adoption strategy
Temporary staffing, facilities mgmt, construction services, contract manufacturing, and IT consulting were
identified by participants as the categories with the highest opportunity for diversity suppliers
While percent of spend with diverse suppliers is tracked by most participants there are a broad range of
metrics measured depending on an organization’s objectives and we are seeing more organization
quantifying the value delivered from these programs
Participation in supplier diversity associations, embedding practices within existing processes, and
executive level support were identified as having the highest positive impact on supplier diversity success
while availability of resources and acquisitions of diverse suppliers had the greatest negative impact
Procurement is typically responsible and accountable for supplier diversity programs although a broad array
of functions are consulted and informed with the CEO most often reviewing program performance
Global sourcing is critically/very important for more than two-thirds of participants and over half believe
global sourcing will have a negative impact on supplier diversity programs

Page 5
2008 Supplier Diversity Study Results© 2009 The Hackett Group. All rights reserved. Reproduction of this document or any portion thereof without prior written consent is prohibited.
Supplier Diversity Study Objectives and Scope
The Supplier Diversity Study was conducted to better understand…
The objectives of organizations related to their supplier diversity programs
The measurements that organizations use to gauge success against these objectives
The factors that drive and hinder supplier diversity success
The impact of globalization on supplier diversity programs
The Supplier Diversity Study focused on…
Supplier Diversity performance within the United States
In many instances supplier diversity was defined broadly and based on the scope of the
study participants

Page 6
2008 Supplier Diversity Study Results© 2009 The Hackett Group. All rights reserved. Reproduction of this document or any portion thereof without prior written consent is prohibited.
Participants Ranged Across a Broad Types of Industries with an Even Split Between Service and Manufacturing Segments
Industry Demographics
Financial, Insurance, and Professional Services
Pharmaceuticals & Biotechnology
Utilities and Chemicals
Consumer Products and Retail
Healthcare Equipment & Services
Telecommunication and Transportation Services
Technology and Automotive
Transportation
$4,797
$17,747
$22,578
US Spend US Revenue Global Revenue
Average Participant Size(million)

Page 7
2008 Supplier Diversity Study Results© 2009 The Hackett Group. All rights reserved. Reproduction of this document or any portion thereof without prior written consent is prohibited.
Nearly All Participants Reported Metrics based on Suppliers in the United States Although 78% of the Participants were Global Companies
Participant Geographic Presence
Global Presence
Regional presence within U.S.
National presence within U.S.
North American presence
Scope of Supplier Diversity Program
Spend with suppliers both within and outside the U.S. and they are tracked as part of the same metrics
No plans to include spend with non-U.S. suppliers within the next 3 years
Plans to include spend with non-U.S. suppliers within the next 3 years
Spend with suppliers in the U.S. and also track separately spend for non-U.S. suppliers

Page 8
2008 Supplier Diversity Study Results© 2009 The Hackett Group. All rights reserved. Reproduction of this document or any portion thereof without prior written consent is prohibited.
Table of Content
Supplier Diversity Study Overview
Supplier Diversity Objectives
Supplier Diversity Spend Analysis
Measuring Supplier Diversity Performance
Keys to a Successful Supplier Diversity Program
Supplier Diversity Program Governance
The Impact of Global Sourcing on Supplier Diversity
Looking Ahead

Page 9
2008 Supplier Diversity Study Results© 2009 The Hackett Group. All rights reserved. Reproduction of this document or any portion thereof without prior written consent is prohibited.
While the Need to Tie Supplier Diversity Objectives to Tangible Benefits is Critical Particularly in Today’s Economic Environment, Intangible Benefits Still Rank High on the Priority List
9%
13%
16%
16%
38%
13%
28%
31%
31%
31%
34%
28%
47%
38%
31%
38%
28%
28%
13%
34%
31%
19%
19%
16%
22%
22%
6%
3%
3%
9%
13%
0% 25% 50% 75% 100%
Improve service/ quality through local supply
Achieve social recognition by industry and supplier diversity associations
Increase market penetration/ recognition in targeted diversity markets
Drive social and economic benefits within targeted communities
Meet supplier diversity requirements of customers/ government contracts
Drive corporate image through supplier diversity initiatives
Support corporate culture around diversity and social responsibility
Critically Important Very Important Important Somewhat Important Not Important
Tangible Benefit Intangible Benefit

Page 10
2008 Supplier Diversity Study Results© 2009 The Hackett Group. All rights reserved. Reproduction of this document or any portion thereof without prior written consent is prohibited.
There Does Appear to be A Strong Correlation Between the Level of Importance Organizations Place on Tangible and Intangible Objectives and Supplier Diversity Performance
5
2.5
High Importance Lower Importance
Intangible Objectives
Times Recognized or Cited versus Importance of Intangible
Objectives (median)
19%
5%
High Importance Lower Importance
Tangible Objectives
Percent of Spend with Diverse Supplier versus Importance of Tangible Objectives (median)
Page 11
2008 Supplier Diversity Study Results© 2009 The Hackett Group. All rights reserved. Reproduction of this document or any portion thereof without prior written consent is prohibited.
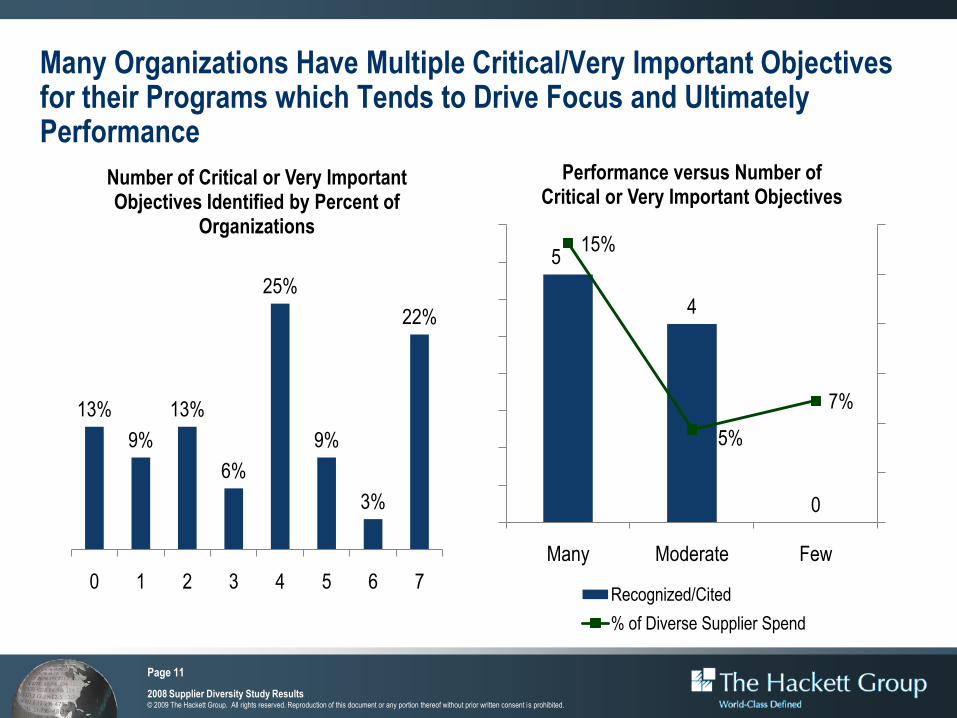
Many Organizations Have Multiple Critical/Very Important Objectives for their Programs which Tends to Drive Focus and Ultimately Performance
13%
9%
13%
6%
25%
9%
3%
22%
0 1 2 3 4 5 6 7
Number of Critical or Very Important Objectives Identified by Percent of
Organizations
5
4
0
15%
5%
7%
Many Moderate Few
Performance versus Number of Critical or Very Important Objectives
Recognized/Cited
% of Diverse Supplier Spend

Page 12
2008 Supplier Diversity Study Results© 2009 The Hackett Group. All rights reserved. Reproduction of this document or any portion thereof without prior written consent is prohibited.
Direct to Consumer Organizations Tend to Put Greater Importance on Objectives Tied to Brand Recognition within Target Markets While Non-Direct to Consumer Organizations Emphasized Requirements of Customers and Government
3.93.7 3.8
3.4
3.9
3.4 3.4
2.6
3.23.5
3.1
3.9
3.4
4.0
Increase market penetration/
recognition in targeted diversity
markets
Drive social and economic benefits
within targeted communities
Drive corporate image through
supplier diversity initiatives
Improve service/ quality through local
supply
Support corporate culture around
diversity and social responsibility
Achieve social recognition by
industry and supplier diversity
associations
Meet supplier diversity
requirements of customers/ government
contracts
Importance of Objectives for Supplier Diversity Program
Direct to Consumer Non-Direct to Consumer
Importance of Supplier Diversity Objectives
5 – Critically Important 3 – Important 1 – Not Important
4 – Very Important 2 – Somewhat Important
Page 13
2008 Supplier Diversity Study Results© 2009 The Hackett Group. All rights reserved. Reproduction of this document or any portion thereof without prior written consent is prohibited.
Table of Content
Supplier Diversity Study Overview
Supplier Diversity Objectives
Supplier Diversity Spend Analysis
Measuring Supplier Diversity Performance
Keys to a Successful Supplier Diversity Program
Supplier Diversity Program Governance
The Impact of Global Sourcing on Supplier Diversity
Looking Ahead
Page 14
2008 Supplier Diversity Study Results© 2009 The Hackett Group. All rights reserved. Reproduction of this document or any portion thereof without prior written consent is prohibited.
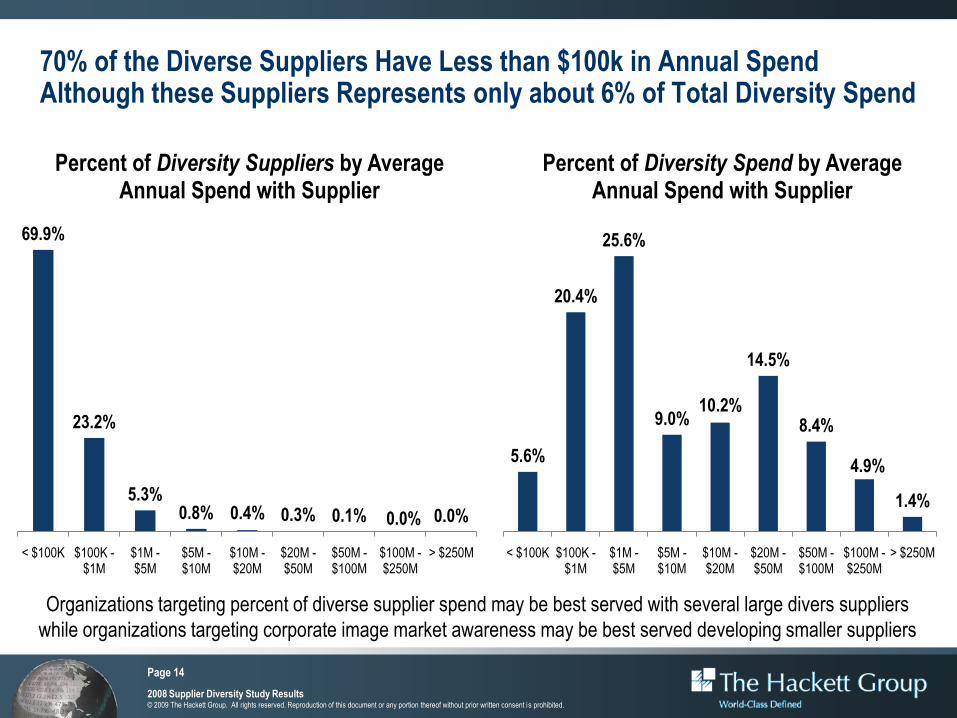
70% of the Diverse Suppliers Have Less than $100k in Annual Spend Although these Suppliers Represents only about 6% of Total Diversity Spend
69.9%
23.2%
5.3%0.8% 0.4% 0.3% 0.1% 0.0% 0.0%
< $100K $100K -$1M
$1M -$5M
$5M -$10M
$10M -$20M
$20M -$50M
$50M -$100M
$100M -$250M
> $250M
Percent of Diversity Suppliers by Average Annual Spend with Supplier
5.6%
20.4%
25.6%
9.0%10.2%
14.5%
8.4%
4.9%
1.4%
< $100K $100K -$1M
$1M -$5M
$5M -$10M
$10M -$20M
$20M -$50M
$50M -$100M
$100M -$250M
> $250M
Percent of Diversity Spend by Average Annual Spend with Supplier
Organizations targeting percent of diverse supplier spend may be best served with several large divers suppliers
while organizations targeting corporate image market awareness may be best served developing smaller suppliers

Page 15
2008 Supplier Diversity Study Results© 2009 The Hackett Group. All rights reserved. Reproduction of this document or any portion thereof without prior written consent is prohibited.
There Tends to be a Correlation with Average Spend per Diverse Supplier and Percent of Total Spend with Diverse Suppliers
$592,089
$288,705
$116,390
1st Quartile Median 3rd Quartile
Avearge Spend per Diverse Supplier
11%
5%
Top Half for Average Spend per Supplier
Lower Half for Average Spend per Supplier
Supplier Diversity Spend as a Percent of Total Spend

Page 16
2008 Supplier Diversity Study Results© 2009 The Hackett Group. All rights reserved. Reproduction of this document or any portion thereof without prior written consent is prohibited.
Category Ranking Across Multiple Metrics Shows the Categories with the Highest Supplier Diversity Opportunity (slide 1 of 2)
Category of Spend
Percent of Participants
Indicating Some Diversity
Spend
Average Diversity Spend
per Participant Reporting
Diversity Spend for
Category
Average Diversity Spend
as a Percent of
Participant Total Spend
Category Diversity Spend
as a % of Total Study
Diversity Spend
Contract Manufacturing Services
Temporary Staffing/ Contract Services
Construction Services
IT - Consulting Services
Facility Management and Maintenance Services
Engineering Services (non-IT)
Other Direct Materials
Packaging Materials
Facility Maintenance Supplies (e.g. MRO)
Other Professional Services
Other Services
Legal Services
Research & Development Services
Logistics Services
Capital Assets (e.g. mfg equipment)
IT - Software
Marketing - Professional Agency
Supply Chain Services
Consulting/Audit/Tax Services
IT - Other Services
Parts and Assemblies
LowestRanking by Spend CategoryHighest Note: Definitions for calculations are
included at the end of this report

Page 17
2008 Supplier Diversity Study Results© 2009 The Hackett Group. All rights reserved. Reproduction of this document or any portion thereof without prior written consent is prohibited.
Category Ranking Across Multiple Metrics Shows the Categories with the Highest Supplier Diversity Opportunity (slide 2 of 2)
Category of Spend
Percent of Participants
Indicating Some Diversity
Spend
Average Diversity Spend
per Participant Reporting
Diversity Spend for
Category
Average Diversity Spend
as a Percent of
Participant Total Spend
Category Diversity Spend
as a % of Total Study
Diversity Spend
Commercial Print
Warehousing and Distribution Services
IT - Hardware (e.g. computers and servers)
Office Furniture and Equipment
Training and Development Services
Executive Search/Staffing Services
Telecom Services (voice and data)
HR Services
Purchased Finished Goods for Resale
Office Supplies
IT - Maintenance Services
Telecom Equipment
Other Materials
Bulk Commodities
Airlines, Car rentals, Lodging
Subscription and Memberships
Catering and Food
Real Estate
IT - Peripherals and Consumables
Other T&E Expenses
Travel Agency
LowestRanking by Spend CategoryHighest Note: Definitions for calculations are
included at the end of this report

Page 18
2008 Supplier Diversity Study Results© 2009 The Hackett Group. All rights reserved. Reproduction of this document or any portion thereof without prior written consent is prohibited.
Percent of Participants Indicating Some Diversity Spend by Category
0% 20% 40% 60% 80% 100%
Other Materials
Bulk Commodities
Supply Chain Services
Travel Agency
Parts and Assemblies
Purchased Finished Goods for Resale
Capital Assets (e.g. mfg equipment)
IT - Peripherals and Consumables
Telecom Equipment
Other T&E Expenses
Other Direct Materials
Warehousing and Distribution Services
Real Estate
Other Services
Airlines, Car rentals, Lodging
Executive Search/Staffing Services
Subscription and Memberships
Packaging Materials
Contract Manufacturing Services
Logistics Services
Research & Development Services
IT - Maintenance Services
IT - Other Services
Engineering Services (non-IT)
Office Furniture and Equipment
Catering and Food
Construction Services
HR Services
Consulting/Audit/Tax Services
IT - Software
IT - Consulting Services
Commercial Print
Training and Development Services
Legal Services
Other Professional Services
Facility Maintenance Supplies (e.g. MRO)
Telecom Services (voice and data)
Office Supplies
IT - Hardware (e.g. computers and servers)
Temporary Staffing/ Contract Services
Marketing - Professsonal Agency
Facility Management and Maintenance Services

Page 19
2008 Supplier Diversity Study Results© 2009 The Hackett Group. All rights reserved. Reproduction of this document or any portion thereof without prior written consent is prohibited.
Average Diversity Spend per Participant Reporting Diversity Spend for Category
$0 $20,000,000 $40,000,000 $60,000,000 $80,000,000 $100,000,000
Travel Agency
Other Materials
Other T&E Expenses
Real Estate
Bulk Commodities
IT - Peripherals and Consumables
Catering and Food
Subscription and Memberships
Office Supplies
Telecom Equipment
IT - Maintenance Services
Office Furniture and Equipment
Training and Development Services
HR Services
Executive Search/Staffing Services
Purchased Finished Goods for Resale
Airlines, Car rentals, Lodging
Telecom Services (voice and data)
Commercial Print
IT - Hardware (e.g. computers and servers)
Parts and Assemblies
Marketing - Professsonal Agency
Warehousing and Distribution Services
Logistics Services
Research & Development Services
IT - Software
Consulting/Audit/Tax Services
Facility Maintenance Supplies (e.g. MRO)
IT - Other Services
Legal Services
Engineering Services (non-IT)
Other Professional Services
Capital Assets (e.g. mfg equipment)
IT - Consulting Services
Facility Management and Maintenance Services
Temporary Staffing/ Contract Services
Other Direct Materials
Packaging Materials
Construction Services
Other Services
Supply Chain Services
Contract Manufacturing Services
Average includes
participants reporting
spend for a category

Page 20
2008 Supplier Diversity Study Results© 2009 The Hackett Group. All rights reserved. Reproduction of this document or any portion thereof without prior written consent is prohibited.
Average Diversity Spend as a Percent of Participant Total Spend by Category
0% 1% 2% 3% 4% 5%
Other T&E Expenses
Travel Agency
Catering and Food
IT - Peripherals and Consumables
Airlines, Car rentals, Lodging
Real Estate
Office Supplies
Telecom Services (voice and data)
Subscription and Memberships
IT - Maintenance Services
HR Services
Telecom Equipment
Purchased Finished Goods for Resale
Training and Development Services
IT - Hardware (e.g. computers and servers)
Bulk Commodities
IT - Other Services
Other Materials
Executive Search/Staffing Services
Warehousing and Distribution Services
Commercial Print
Office Furniture and Equipment
Consulting/Audit/Tax Services
Supply Chain Services
Legal Services
Other Professional Services
IT - Software
Marketing - Professsonal Agency
Other Services
Parts and Assemblies
Capital Assets (e.g. mfg equipment)
Facility Management and Maintenance Services
Logistics Services
Facility Maintenance Supplies (e.g. MRO)
Research & Development Services
Engineering Services (non-IT)
IT - Consulting Services
Packaging Materials
Construction Services
Temporary Staffing/ Contract Services
Other Direct Materials
Contract Manufacturing Services
Average includes
participants reporting
spend for a category

Page 21
2008 Supplier Diversity Study Results© 2009 The Hackett Group. All rights reserved. Reproduction of this document or any portion thereof without prior written consent is prohibited.
Category Diversity Spend as a Percent of Total Study Diversity Spend
0% 1% 2% 3% 4% 5% 6% 7% 8% 9% 10%
Other Materials
Travel Agency
Bulk Commodities
Other T&E Expenses
Real Estate
IT - Peripherals and Consumables
Subscription and Memberships
Telecom Equipment
Catering and Food
Purchased Finished Goods for Resale
IT - Maintenance Services
Executive Search/Staffing Services
Airlines, Car rentals, Lodging
Office Supplies
Office Furniture and Equipment
HR Services
Parts and Assemblies
Training and Development Services
Telecom Services (voice and data)
Commercial Print
Warehousing and Distribution Services
IT - Hardware (e.g. computers and servers)
Logistics Services
Research & Development Services
Capital Assets (e.g. mfg equipment)
Marketing - Professsonal Agency
IT - Software
Consulting/Audit/Tax Services
Supply Chain Services
IT - Other Services
Other Direct Materials
Other Services
Facility Maintenance Supplies (e.g. MRO)
Packaging Materials
Legal Services
Engineering Services (non-IT)
Other Professional Services
IT - Consulting Services
Contract Manufacturing Services
Construction Services
Temporary Staffing/ Contract Services
Facility Management and Maintenance Services

Page 22
2008 Supplier Diversity Study Results© 2009 The Hackett Group. All rights reserved. Reproduction of this document or any portion thereof without prior written consent is prohibited.
Woman-Owned Businesses Represented on Average 2.4 Percent of Total Spend for Those Reporting Spend within Diversity Group
2.35%
2.01%
1.30%
1.01%0.86%
0.72%
0.28%0.21% 0.15%
Woman Owned Other Asian-Pacific Owned
Hispanic Owned Asian-Indian Owned
Black Owned Service-disabled, Veteran
Owned
Native American Owned
HUB Zone Owned
Average Diversity Spend as a Percent of Total Spend by Diversity Category
Percentages include participants
reported spend for diversity category
79% of total reported supplier diversity spend was from 1st tier suppliers while 21% from sub-tier suppliers
1Other includes both diversity groups not identified as well as minority spend that participants were unable to allocate across specific diversity groups

Page 23
2008 Supplier Diversity Study Results© 2009 The Hackett Group. All rights reserved. Reproduction of this document or any portion thereof without prior written consent is prohibited.
Table of Content
Supplier Diversity Study Overview
Supplier Diversity Objectives
Supplier Diversity Spend Analysis
Measuring Supplier Diversity Performance
Keys to a Successful Supplier Diversity Program
Supplier Diversity Program Governance
The Impact of Global Sourcing on Supplier Diversity
Looking Ahead

Page 24
2008 Supplier Diversity Study Results© 2009 The Hackett Group. All rights reserved. Reproduction of this document or any portion thereof without prior written consent is prohibited.
Percent of Spend with Diverse Suppliers is Tracked by Most Participants but there are Also a Broad Range of Other Metrics Measured Depending on an Organization’s Objectives
93%
46%50%
32%
11%7%
32%
18%14%
4% 4%
89%
Percent spend with diverse
suppliers
Diverse suppliers as a percent of total
suppliers
Percent of spend with
small businesses
Small business suppliers as a percent of total
suppliers
Percent increase in
revenue associated with
program
Percent increase in
market share associated with
program
Percent of RFPs for which
diversity suppliers
participated
Dollar value of RFPs for which
diversity suppliers
participated
Percent customer
proposals won for which your
diversity program was a
criteria
Dollar value of customer
proposals won for which diversity
program was a criteria
Dollar value of economic impact on targeted
communities
Number of times diversity
program recognized by
industry
Percent of Participants Reporting Metrics
Page 25
2008 Supplier Diversity Study Results© 2009 The Hackett Group. All rights reserved. Reproduction of this document or any portion thereof without prior written consent is prohibited.
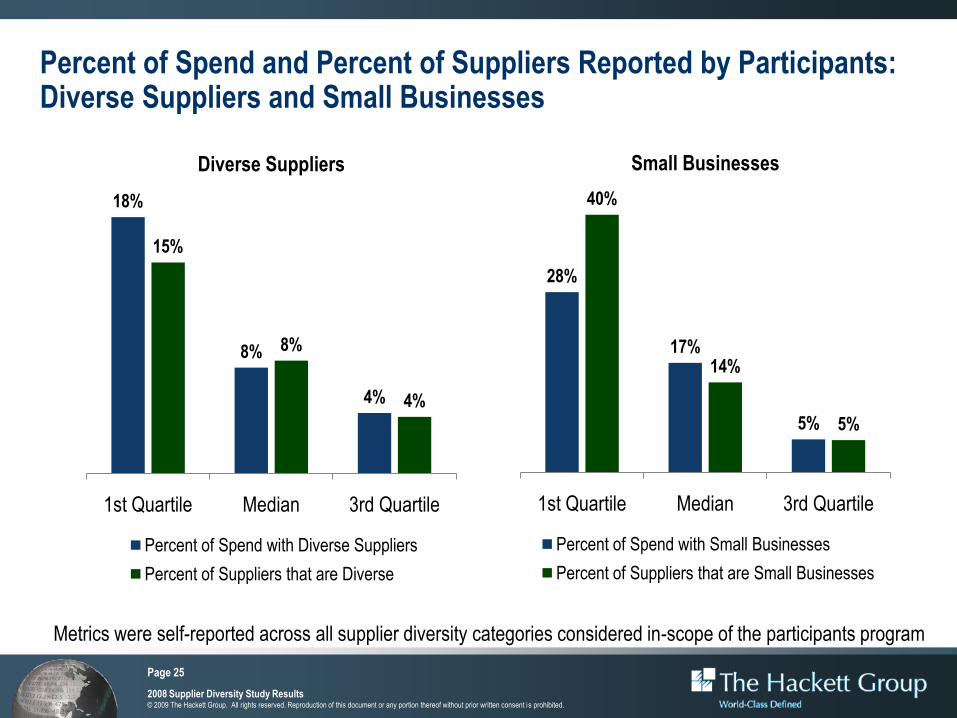
Percent of Spend and Percent of Suppliers Reported by Participants: Diverse Suppliers and Small Businesses
18%
8%
4%
15%
8%
4%
1st Quartile Median 3rd Quartile
Diverse Suppliers
Percent of Spend with Diverse Suppliers
Percent of Suppliers that are Diverse
28%
17%
5%
40%
14%
5%
1st Quartile Median 3rd Quartile
Small Businesses
Percent of Spend with Small Businesses
Percent of Suppliers that are Small Businesses
Metrics were self-reported across all supplier diversity categories considered in-scope of the participants program

Page 26
2008 Supplier Diversity Study Results© 2009 The Hackett Group. All rights reserved. Reproduction of this document or any portion thereof without prior written consent is prohibited.
Organizations Also Commonly Measured Percentage of RFPs Diverse Suppliers Participated and Recognition Received by Industry Groups
50%
20%
10%
1st Quartile Median 3rd Quarile
RFPS for which Diversity Suppliers Participate
5
4
2
1st Quartile Median 3rd Quarile
Number of Times Recognized or Cited by Industry (annual)

Page 27
2008 Supplier Diversity Study Results© 2009 The Hackett Group. All rights reserved. Reproduction of this document or any portion thereof without prior written consent is prohibited.
Table of Content
Supplier Diversity Study Overview
Supplier Diversity Objectives
Supplier Diversity Spend Analysis
Measuring Supplier Diversity Performance
Keys to a Successful Supplier Diversity Program
Supplier Diversity Program Governance
The Impact of Global Sourcing on Supplier Diversity
Looking Ahead

Page 28
2008 Supplier Diversity Study Results© 2009 The Hackett Group. All rights reserved. Reproduction of this document or any portion thereof without prior written consent is prohibited.
Participants were Asked the Level of Impact that a Variety of Factors Have Had on the Success of the Supplier Diversity Programs
The factors that most negatively impact success tend to be those around the availability of diverse suppliers and internal resources
to while some of the factors that most drive success are around internal and external networking. Executive support and embedding
supplier diversity practices into existing processes has the highest level of positive impact.
0% 25% 50% 75% 100%
Recent acquisition(s) involving your diverse supplier(s)
Business Process Outsourcing Initiatives
Recent acquisition(s) involving your organization
Support from existing suppliers for driving 2nd tier diverse supplier participation
Tying diversity objectives with higher level company objectives (e.g. revenue, market share)
Availability of internal resources to support program
Supplier development and mentoring programs
Availability of qualified diverse suppliers
Aligning Supplier Diversity Program with Corporate Social Responsibility Initiative
Acceptance by Business Units/ Operations
Level of engagement with internal stakeholders
Networking with other organizations within your industry
Level of support from Executives of your organization
Embedding supplier diversity practices within existing Procurement processes
Participation in diverse supplier associations
Significant Positive Impact Moderate Positive Impact Minimal or No Impact Moderate Negative Impact Significant Negative Impact

Page 29
2008 Supplier Diversity Study Results© 2009 The Hackett Group. All rights reserved. Reproduction of this document or any portion thereof without prior written consent is prohibited.
Participation in Associations, Embedding Practices within Existing Processes, Executive Level Support and Networking Had the Highest Positive Impact on Program Success
87%
83%
79%77%
Participation in diverse supplier associations
Embedding supplier diversity practices within
existing Procurement processes
Level of support from Executives of your
organization
Networking with other organizations within your
industry
Percent of Participants Stating the Factor Had a Positive Impact on Supplier Diversity Program
• Participating in diverse supplier associations provides access to diverse supplier, networking opportunities, information on
diversity events, and best practices
• Embedding supplier diversity requirements into existing sourcing, purchasing, and supplier management processes helps
insure that supplier diversity objectives are aligned with the overall objectives of Procurement
• Executive level support for supplier diversity programs is critical as program objectives are most commonly aligned with high-
level business objectives like revenue growth and corporate image
• Many organizations noted that networking with industry peers has been helpful in exchanging best practices, identifying new
sources of supply, and driving adoption of 2nd tier divers supplier adoption

Page 30
2008 Supplier Diversity Study Results© 2009 The Hackett Group. All rights reserved. Reproduction of this document or any portion thereof without prior written consent is prohibited.
Availability of Resources and Acquisitions of Diverse Suppliers were Factors Most Stated as Having a Negative Impact on Supplier Diversity Programs
43%
26% 23% 21%
Availability of internal resources to support
program
Recent acquisition(s) involving your diverse
supplier(s)
Availability of qualified diverse suppliers
Business Process Outsourcing Initiatives
Percent of Participants Stating the Factor Had a Negative Impact on Supplier Diversity Program
• There was a broad range of available resources allocated to support supplier diversity programs among participants but an
unclear ROI that may exist within some programs likely drives an under allocation of resources
• As diverse suppliers become larger and more successful they are often acquired losing their diverse supplier status and
having a significant impact on an organization’s supplier diversity metrics
• The availability of qualified diverse supplier is hindering success, however, only half of the participants identified supplier
development and mentoring programs as a driver of success and some organizations identified the availability of qualified
diverse suppliers as an enabler of their program’s success
• Outsourcing initiatives can impact diverse suppliers by reallocating services to an outsource provider

Page 31
2008 Supplier Diversity Study Results© 2009 The Hackett Group. All rights reserved. Reproduction of this document or any portion thereof without prior written consent is prohibited.
Table of Content
Supplier Diversity Study Overview
Supplier Diversity Objectives
Supplier Diversity Spend Analysis
Measuring Supplier Diversity Performance
Keys to a Successful Supplier Diversity Program
Supplier Diversity Program Governance
The Impact of Global Sourcing on Supplier Diversity
Looking Ahead

Page 32
2008 Supplier Diversity Study Results© 2009 The Hackett Group. All rights reserved. Reproduction of this document or any portion thereof without prior written consent is prohibited.
We Also Looked at the Level of Investment that Organizations Make into Supplier Diversity Programs from a Resourcing and Budgeting Perspective
$4,004
$1,642
$808
1st Q Median 3rd Q
Level of Supplier Diversity Spend per Dollar of Supplier
Diversity Budget1
1Training, sponsorships, tradeshows, advertising,
memberships, promotions, etc. related to
supplier diversity program
$137
$60
$27
1st Q Median 3rd Q
Supplier Diversity Spend ($millions) per Supplier
Diversity FTE
53%38%
6%
3%
Source of Supplier Diversity Budget
Separate budget maintained for supplier diversity related expenses
Functional budget (e.g. Procurement) supports supplier diversity expenses
Funding approved on a per request basis
No funds allocated for supplier diversity expenses

Page 33
2008 Supplier Diversity Study Results© 2009 The Hackett Group. All rights reserved. Reproduction of this document or any portion thereof without prior written consent is prohibited.
Procurement is Most Typically the Responsible and Accountable Function for Supplier Diversity Programs Although A Broad Array of Functions are Consulted and Informed
Responsible Accountable Consults Informed
Procurement 53% 41% 6% 0%
Sales & Marketing 16% 0% 31% 28%
Human Resources 3% 3% 38% 38%
Communications 6% 3% 31% 44%
Finance 6% 13% 25% 25%
Businesses/ Operations 16% 0% 25% 47%
CEO 3% 9% 13% 53%
Board of Director 0% 0% 6% 59%
Responsible –This is the person or group responsible for performing the activities associated with the supplier diversity program.
Accountable – To whom the responsible person is accountable; this is the person who is held accountable for the supplier
diversity program.
Consults - Provides input and advice to the responsible group or person; these are the people communicated with prior to
actions being taken or decision made.
Informed – Must be notified of results, but need not be consulted; these are the parties who are notified about an action after it
has been performed.

Page 34
2008 Supplier Diversity Study Results© 2009 The Hackett Group. All rights reserved. Reproduction of this document or any portion thereof without prior written consent is prohibited.
Multiple Executives Typically Review Supplier Diversity Status on an Annual Basis with CEOs Leading the Way at Most Organizations
78%
69%
38% 38%
31%
9%6%
CEO Procurement Leader
COO HR Leader Marketing/ Sales Leader
Chief Diversity Officer/ Council
Board of Directors
Review Supplier Diversity Status At Least Annually
5
3
2
1st Quartile Median 3rd Quarile
Number of Executives reviewing supplier diversity performance at
least once per year

Page 35
2008 Supplier Diversity Study Results© 2009 The Hackett Group. All rights reserved. Reproduction of this document or any portion thereof without prior written consent is prohibited.
A Centralized Procurement Structure was Predominate and Participants Most Often Positioned Supplier Diversity as a Stand-Alone Initiative
29%
61%
10%
Procurement Governance Structure
Centrally led (coordinated centrally but executed de-centrally)
Predominately centralized
Predominately decentralized
63%
34%
22%
16%13%
Stand-alone initiative focused solely on supplier diversity
Part of a broader corporate social
responsibility initiative
Part of a broader initiative around
building/maintaining organization's culture
Part of a broader initiative focused on improving corporate
image
Other
Positioning of Supplier Diversity Program
Page 36
2008 Supplier Diversity Study Results© 2009 The Hackett Group. All rights reserved. Reproduction of this document or any portion thereof without prior written consent is prohibited.
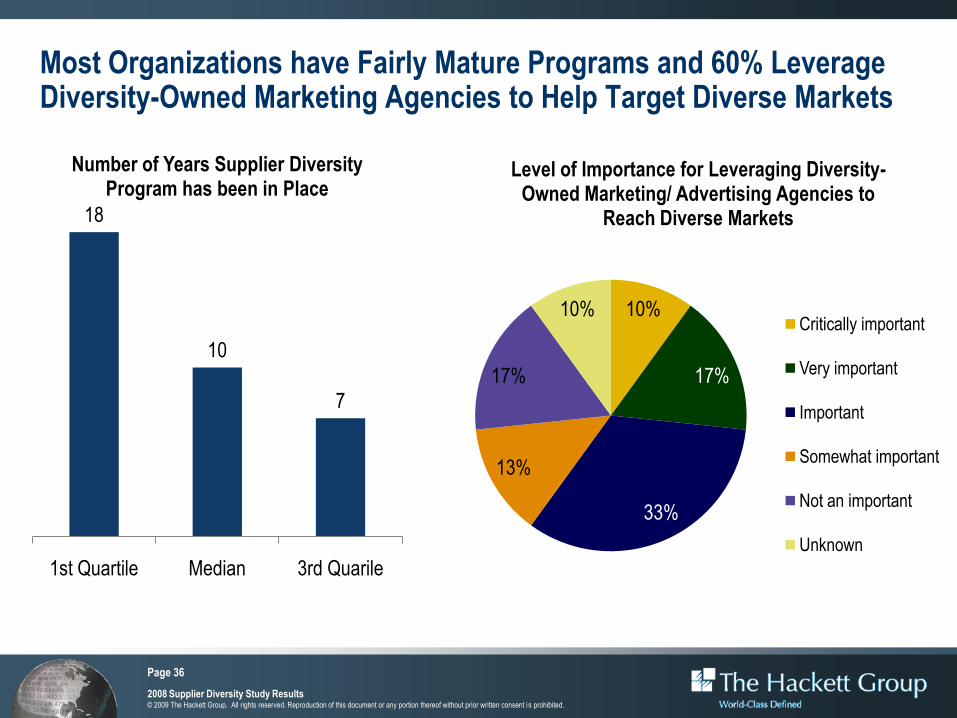
Most Organizations have Fairly Mature Programs and 60% Leverage Diversity-Owned Marketing Agencies to Help Target Diverse Markets
18
10
7
1st Quartile Median 3rd Quarile
Number of Years Supplier Diversity Program has been in Place
10%
17%
33%
13%
17%
10%
Level of Importance for Leveraging Diversity-Owned Marketing/ Advertising Agencies to
Reach Diverse Markets
Critically important
Very important
Important
Somewhat important
Not an important
Unknown

Page 37
2008 Supplier Diversity Study Results© 2009 The Hackett Group. All rights reserved. Reproduction of this document or any portion thereof without prior written consent is prohibited.
Table of Content
Supplier Diversity Study Overview
Supplier Diversity Objectives
Supplier Diversity Spend Analysis
Measuring Supplier Diversity Performance
Keys to a Successful Supplier Diversity Program
Supplier Diversity Program Governance
The Impact of Global Sourcing on Supplier Diversity
Looking Ahead

Page 38
2008 Supplier Diversity Study Results© 2009 The Hackett Group. All rights reserved. Reproduction of this document or any portion thereof without prior written consent is prohibited.
Global Sourcing is Critically/Very Important for 68% of Participants and 55% of Participants Believe It will Have a Negative Impact on Domestic Supplier Diversity Programs
39%
29%
13%
6%
10%
3%
Importance of Global Sourcing
Critically important Very important
Important Somewhat important
Not important Unclear
3%
14%
14%
21%
34%
14%
Impact on Spend with US-based Diverse Suppliers due to Global Sourcing
Significant positive impact Moderate positive impact
Minimal impact Significant negative impact
Moderate negative impact Have not considered
As organizations look globally for new sources of supply domestic diverse suppliers face greater cost
and scope of service pressures resulting in increase competition and fewer opportunities

Page 39
2008 Supplier Diversity Study Results© 2009 The Hackett Group. All rights reserved. Reproduction of this document or any portion thereof without prior written consent is prohibited.
More than Half the Participants Have No Plans to Help US-based Diverse Supplier Compete Globally and 80% Have No Time Frame Established to Expand Supplier Diversity Program Outside the US
3%
17%
21%
28%
52%
Taking US diverse suppliers on global missions to look at opportunities and
meet global diverse suppliers
We are establishing targets under which a portion of our globally sourced
spend will be awarded to US-based diverse suppliers
Our supplier development program is aimed at helping our US-based diverse
suppliers compete on a global scale
We are establishing policies to insure that US-based diverse suppliers are
included in the bidding process for all globally sourced spend
No action is being taken or is planned over the next year
Plan to Support US-based Diverse Suppliers Competing in Global Markets
10%
3%
7%
24%
55%
Currently included
We plan include within 3 years
Plan to include within next year
Plan to include but no timeframe
No plans to include
Plans for Including Diverse Suppliers Outside the United States

Page 40
2008 Supplier Diversity Study Results© 2009 The Hackett Group. All rights reserved. Reproduction of this document or any portion thereof without prior written consent is prohibited.
There Are Numerous Hurdles Facing Organizations for Including Suppliers Outside the US within Their Supplier Diversity Programs
3%
10%
42%
45%
45%
61%
Resources and funding hurdles
There are no major hurdles that I am aware
We currently do include non-U.S. supplier spend in the scope of our diversity program
Certification of diverse supplier status outside the United States is not well established
Non-U.S. diverse supplier spend is not currently recognized by government institutions, associations or customers
Identifying and defining diversity categories outside the United States is not clear
Hurdles to Including Diverse Suppliers Outside the United States within Scope of Supplier Diversity Program
Page 41
2008 Supplier Diversity Study Results© 2009 The Hackett Group. All rights reserved. Reproduction of this document or any portion thereof without prior written consent is prohibited.
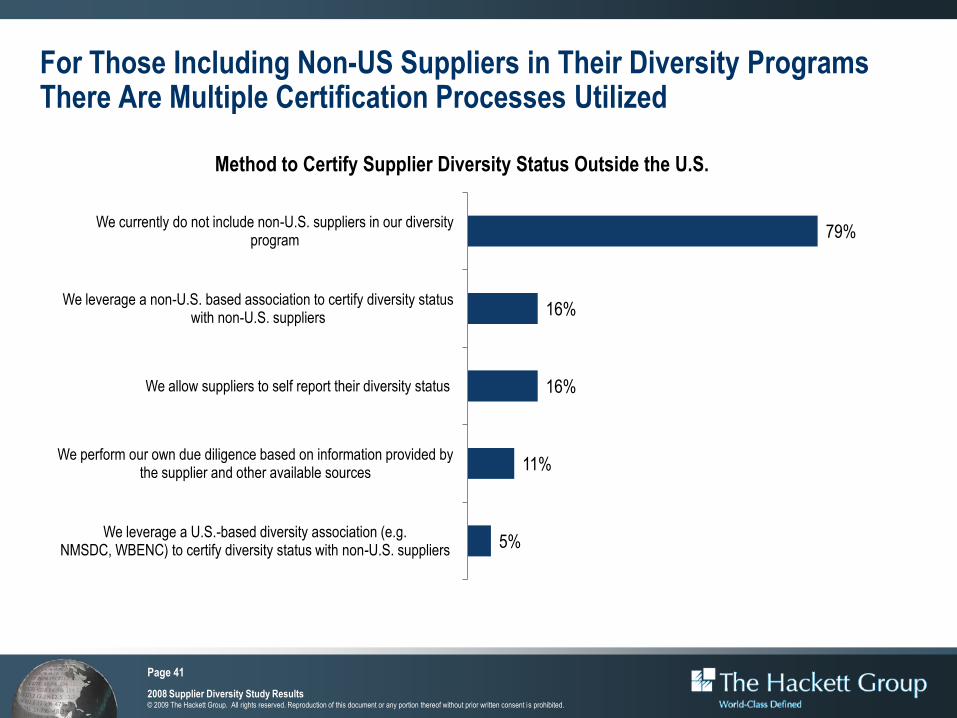
For Those Including Non-US Suppliers in Their Diversity Programs There Are Multiple Certification Processes Utilized
5%
11%
16%
16%
79%
We leverage a U.S.-based diversity association (e.g. NMSDC, WBENC) to certify diversity status with non-U.S. suppliers
We perform our own due diligence based on information provided by the supplier and other available sources
We allow suppliers to self report their diversity status
We leverage a non-U.S. based association to certify diversity status with non-U.S. suppliers
We currently do not include non-U.S. suppliers in our diversity program
Method to Certify Supplier Diversity Status Outside the U.S.
Page 42
2008 Supplier Diversity Study Results© 2009 The Hackett Group. All rights reserved. Reproduction of this document or any portion thereof without prior written consent is prohibited.
Table of Content
Supplier Diversity Study Overview
Supplier Diversity Objectives
Supplier Diversity Spend Analysis
Measuring Supplier Diversity Performance
Keys to a Successful Supplier Diversity Program
Supplier Diversity Program Governance
The Impact of Global Sourcing on Supplier Diversity
Looking Ahead

Page 43
2008 Supplier Diversity Study Results© 2009 The Hackett Group. All rights reserved. Reproduction of this document or any portion thereof without prior written consent is prohibited.
Looking Ahead…It will be a Turbulent Time
Economic instability will continue and supplier diversity managers will need to insure alignment with
changing corporate objectives and that performance reflects the real value created. Wrapping supplier
diversity around higher level initiatives like social responsibility will drive greater visibility and support
Globalization will continue and organizations will focus on policies and practices to support their domestic
diverse suppliers while rethinking how they define diversity taking into account the broader notion of
“responsible supply” and such factors as localization
Business line managers will focus on operational efficiency so embedding diversity requirements within
standard procurement processes and effectively communicating objectives will be as important as ever
Acquisitions and financial problems will continue within the diverse supplier community driving the need for
robust supplier management and development programs identifying diverse sources of supply and nurturing
diverse supplier growth and financial stability
Networking with peers and industry groups will continue to provide valuable insight for supplier diversity
managers and help drive support for second tier supplier diversity targets
Efficiency will be the focus of most organizations in 2009 and supplier diversity mangers will be asked to do
more with less
Advanced sourcing optimization techniques will be leveraged to include diversity status as a parameter in
complex and global sourcing events resulting in multiple suppliers and closer alignment with requirements

Page 44
2008 Supplier Diversity Study Results© 2009 The Hackett Group. All rights reserved. Reproduction of this document or any portion thereof without prior written consent is prohibited.
Definitions for Spend Analysis
Percent of Participants Indicating Some Diversity Spend
Calculated by taking the number of participants indicating some supplier diversity spend for the particular
category as a percent of the total number of participants
Average Diversity Spend per Participant Reporting Diversity Spend for Category
Calculated by taking the average dollar value of spend reported by participants by category including
those participants that indicated some supplier diversity spend for the particular category
Average Diversity Spend as a Percent of Participant Total Spend
Calculated by taking the average reported supplier diversity spend by category as a percent of
participant’s total spend including those participants that indicated some supplier diversity spend for the
particular category
Category Diversity Spend as a % of Total Study Diversity Spend
Calculated by taking the total supplier diversity spend reported across all participant for a particular
category as a percent of the total supplier diversity spend reported across all participants

Page 45
2008 Supplier Diversity Study Results© 2009 The Hackett Group. All rights reserved. Reproduction of this document or any portion thereof without prior written consent is prohibited.
The Hackett Group2008 Supplier Diversity Study Results
Kurt Albertson
TEL: 770.225.7570