the growth of asia (1) - pasca.ugm.ac.id 2014 human... · share of firms identifying the task of...
TRANSCRIPT

The Growth of Asia (1)
Asia Era: Asia’s rising as a late comers with catching up strategy.
Source: “Australia in the Asian Century White Paper”, 2012
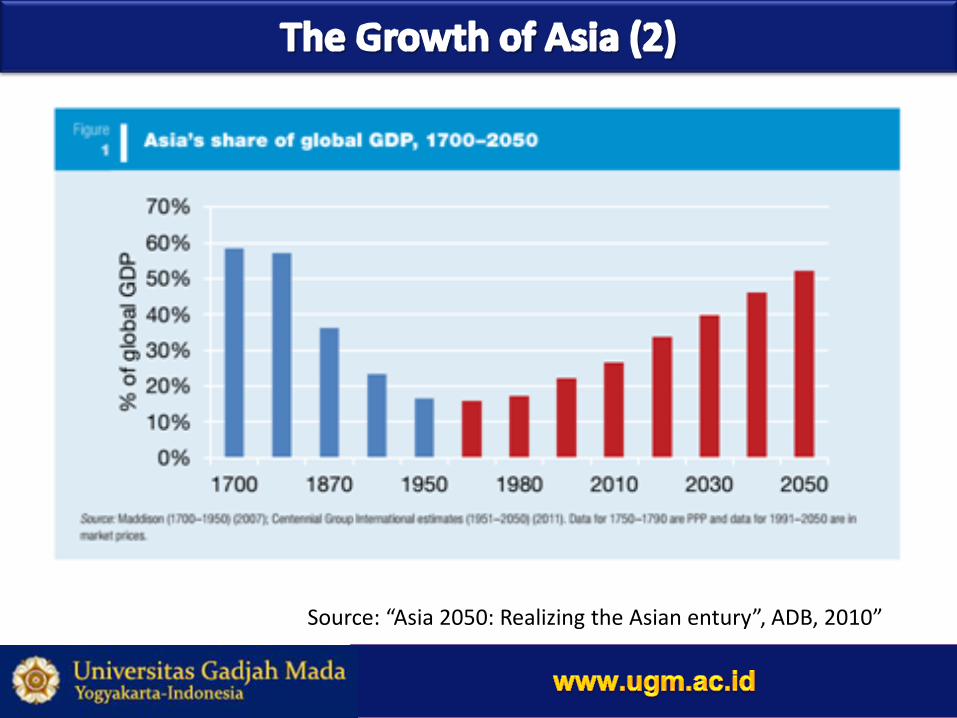
Source: “Asia 2050: Realizing the Asian entury”, ADB, 2010”

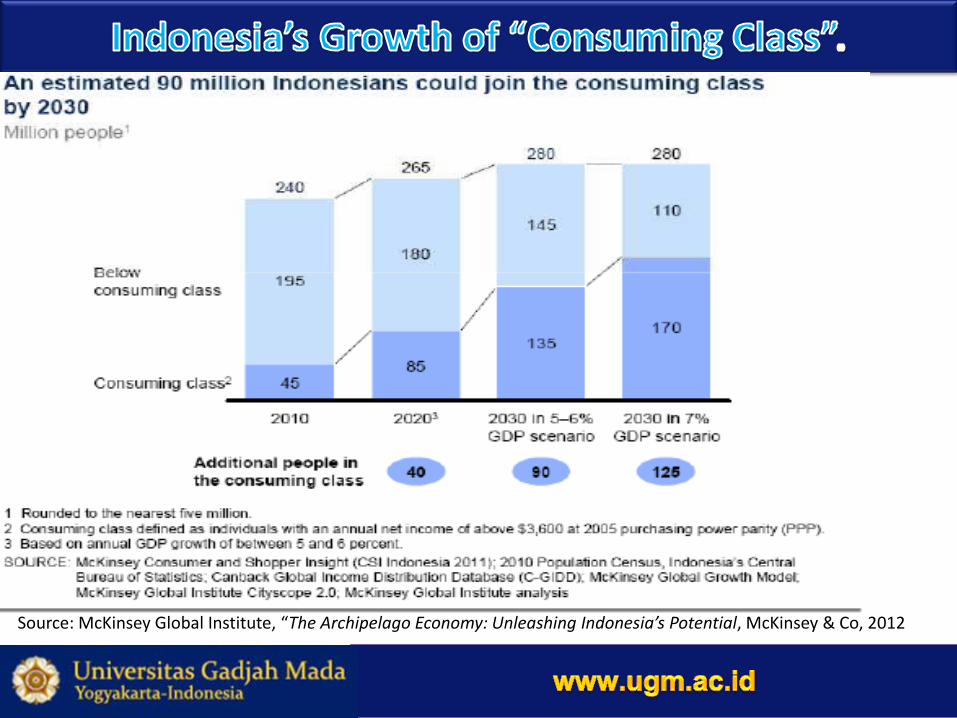
Source: McKinsey Global Institute, “The Archipelago Economy: Unleashing Indonesia’s Potential, McKinsey & Co, 2012
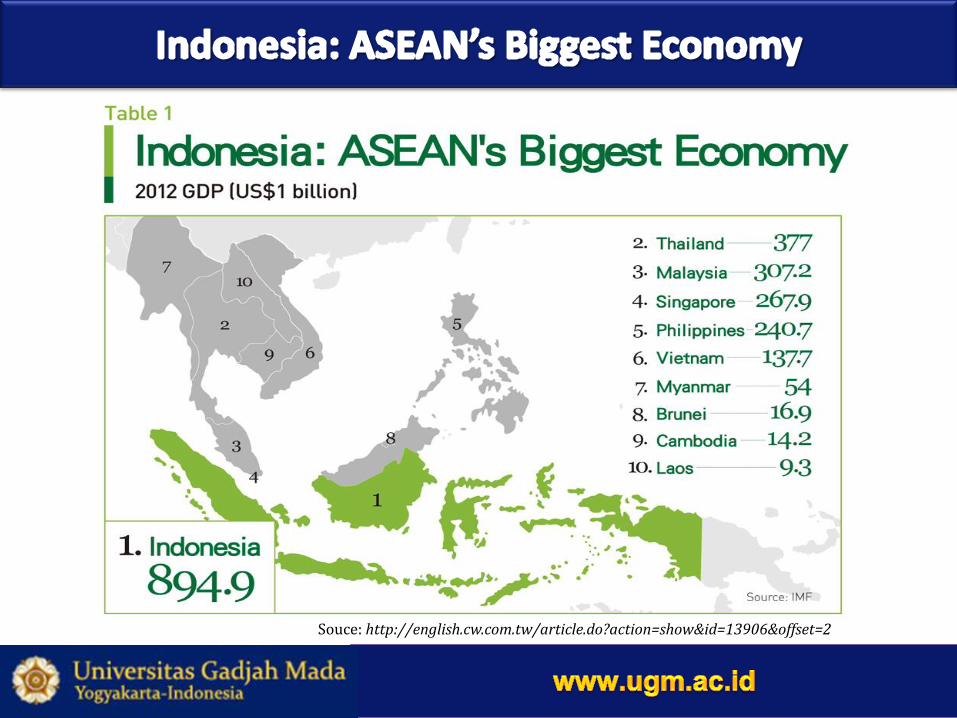
Souce: http://english.cw.com.tw/article.do?action=show&id=13906&offset=2
Kebangkitan Ekonomi Indonesia
Source: McKinsey Global Institute, “The Archipelago Economy: Unleashing Indonesia’s Potential, McKinsey & Co, 2012
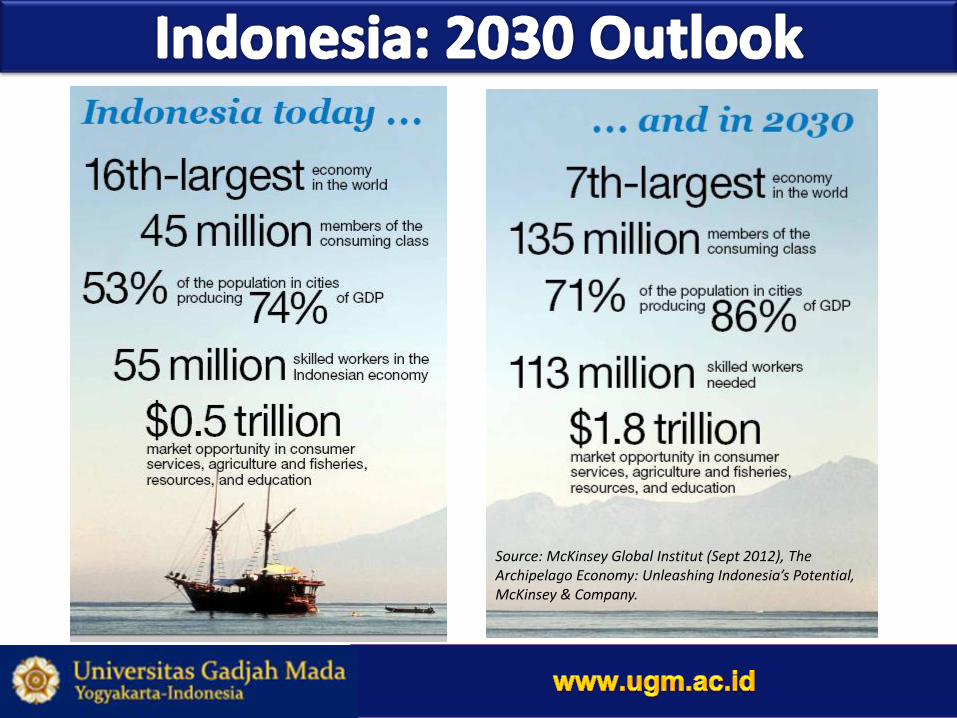
Source: McKinsey Global Institut (Sept 2012), The Archipelago Economy: Unleashing Indonesia’s Potential, McKinsey & Company.
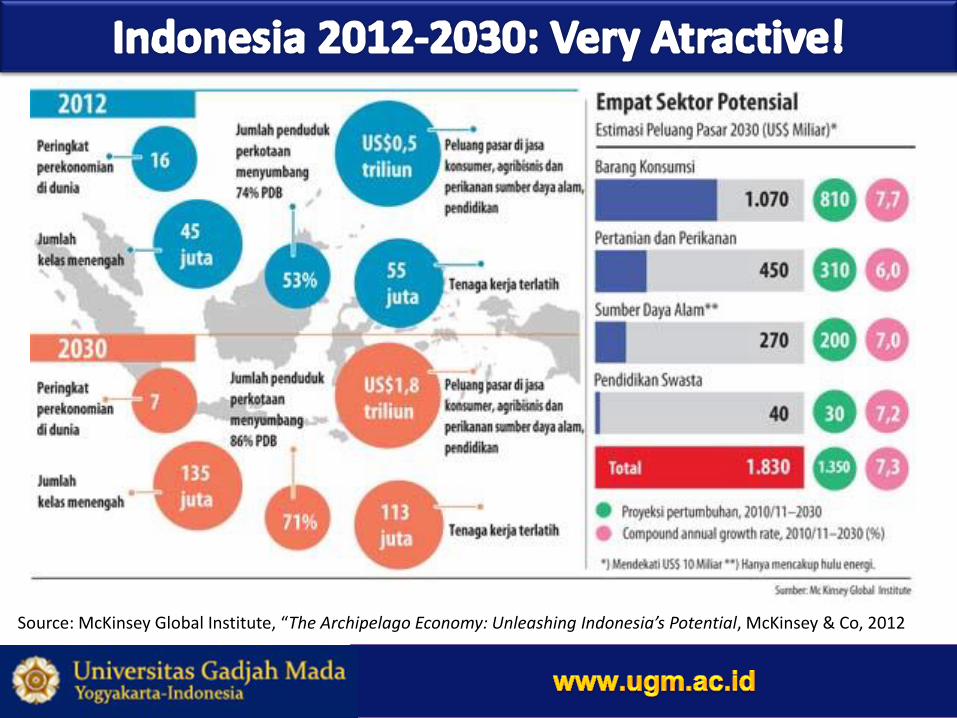
Kebangkitan Ekonomi Indonesia
Source: McKinsey Global Institute, “The Archipelago Economy: Unleashing Indonesia’s Potential, McKinsey & Co, 2012
• Globalization and labor market are unavoidable.
• No domestic market anymore. All are global market (including Kaki 5).
• “sovereignity” means winning the global competition.
• Ha-Joon Chang (2003), Kicking Away the Ladder: Development Strategy in Historical Perspective.
• The strategic role of higher education in human development, science, technology & arts !!!
Source: Lampiran Laporan Rektor berjudul “Tegakkan Kembali Kedaulatan Bangsa” dibacakan pada Dies Natalis UGM 19 Desember 2013.
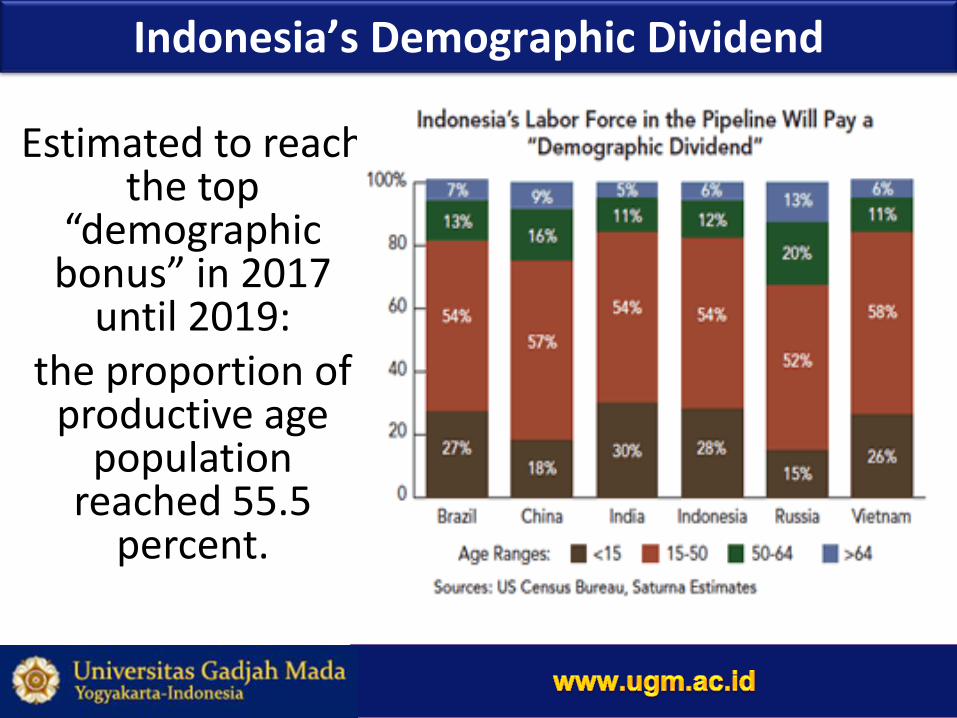
Indonesia’s Demographic Dividend
Estimated to reach the top
“demographic bonus” in 2017
until 2019: the proportion of
productive age population
reached 55.5 percent.
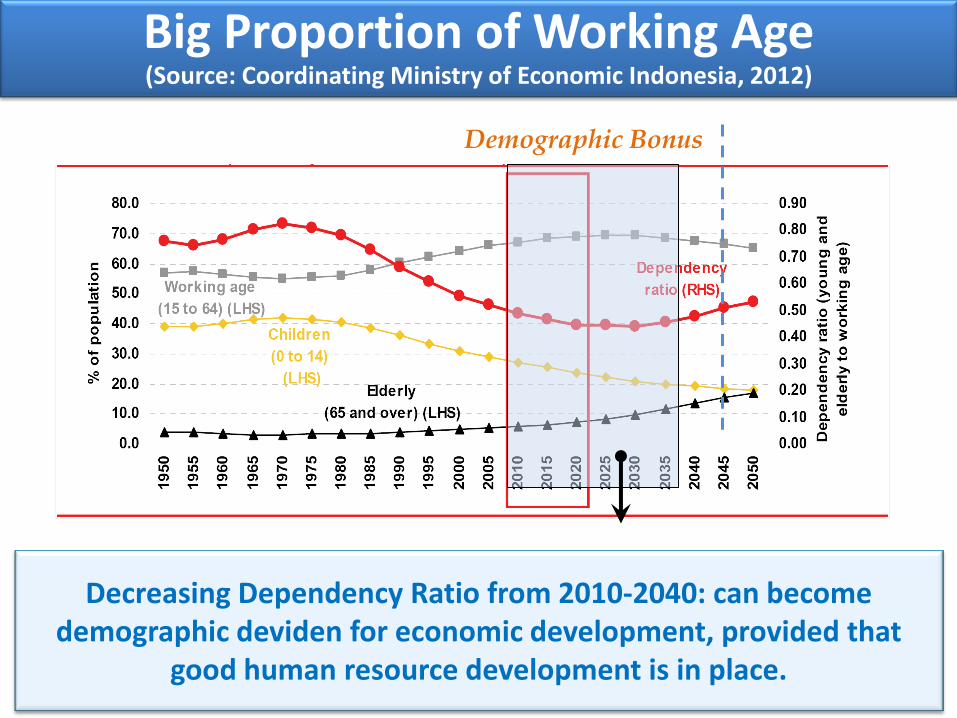
Demographic Bonus
Big Proportion of Working Age (Source: Coordinating Ministry of Economic Indonesia, 2012)
11
Decreasing Dependency Ratio from 2010-2040: can become demographic deviden for economic development, provided that
good human resource development is in place.

Skills Most Needed In
creasin
g De
man
d fo
r Skille
d Lab
ou
r
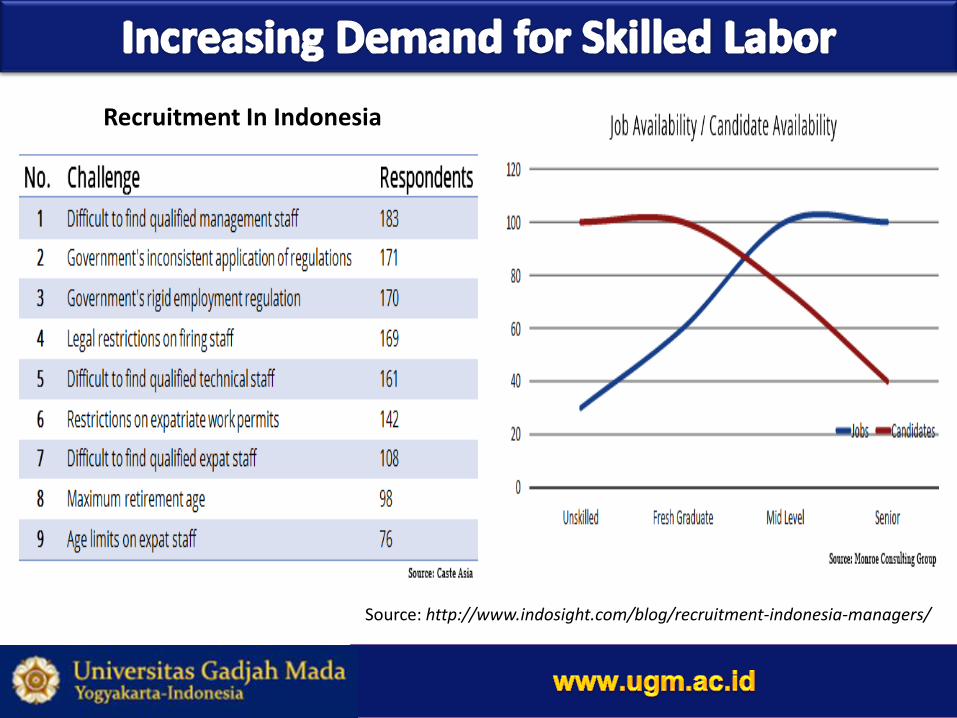
Source: http://www.indosight.com/blog/recruitment-indonesia-managers/
Recruitment In Indonesia
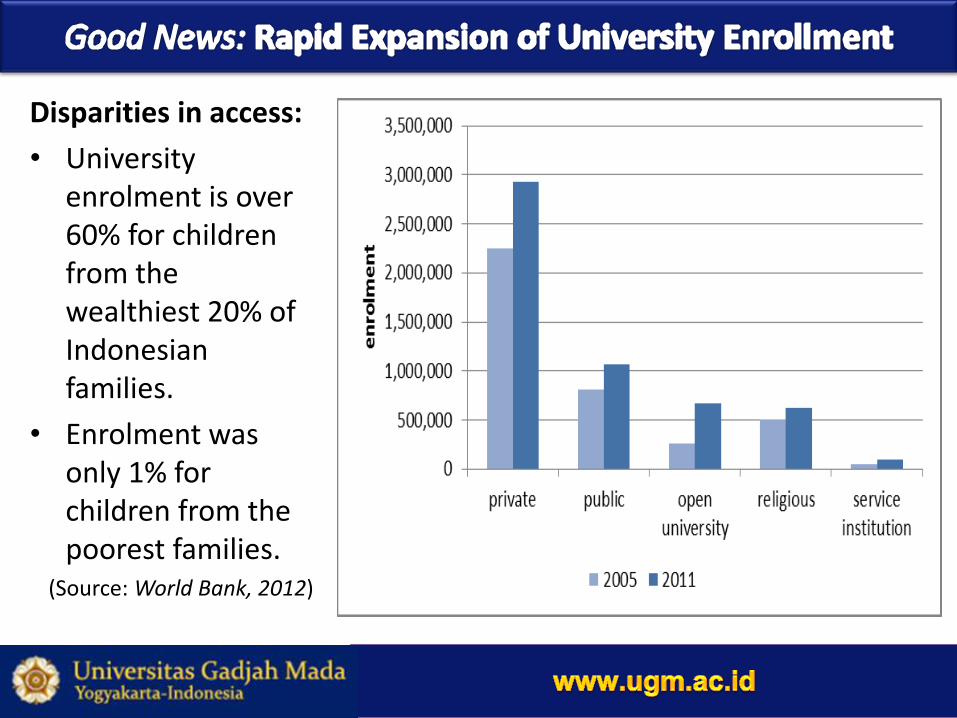
Disparities in access:
• University enrolment is over 60% for children from the wealthiest 20% of Indonesian families.
• Enrolment was only 1% for children from the poorest families.
(Source: World Bank, 2012)

Source: Universities by accreditation status, 2009
Problems: • Survey of firms reveal:
– Weak linkages with industry. – Relevance and coverage of
curriculum. – Relevance to the labor market.
• Employees also highlighted concerns about: – Length of study. – Quality of teaching and
learning. – Specific skills etc.
Source: World Bank, 2012
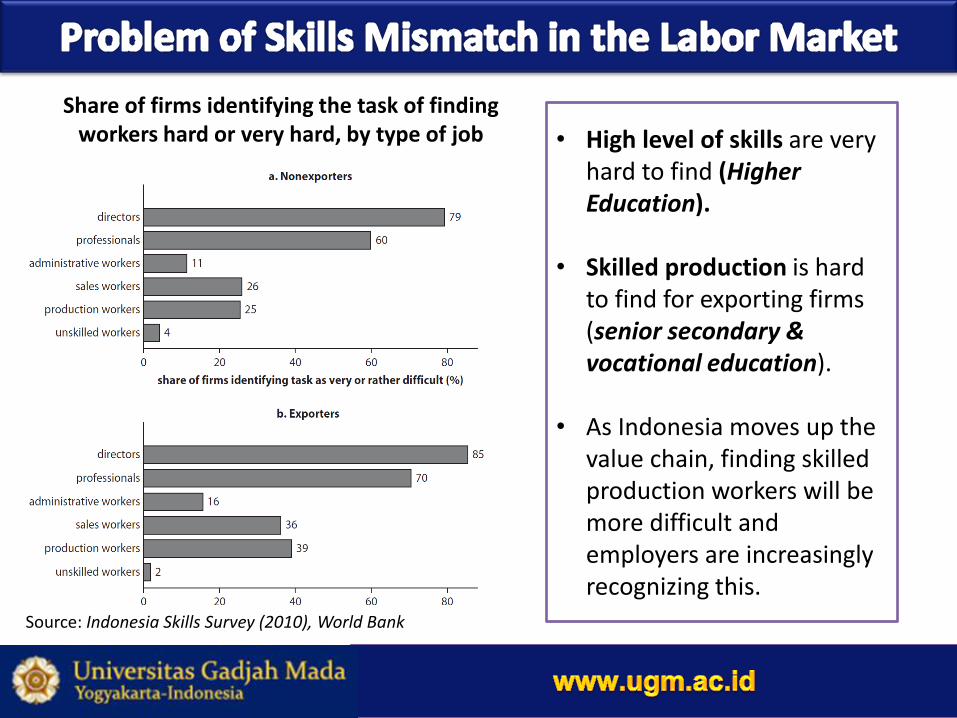
Share of firms identifying the task of finding workers hard or very hard, by type of job
Source: Indonesia Skills Survey (2010), World Bank
• High level of skills are very hard to find (Higher Education).
• Skilled production is hard to find for exporting firms (senior secondary & vocational education).
• As Indonesia moves up the value chain, finding skilled production workers will be more difficult and employers are increasingly recognizing this.
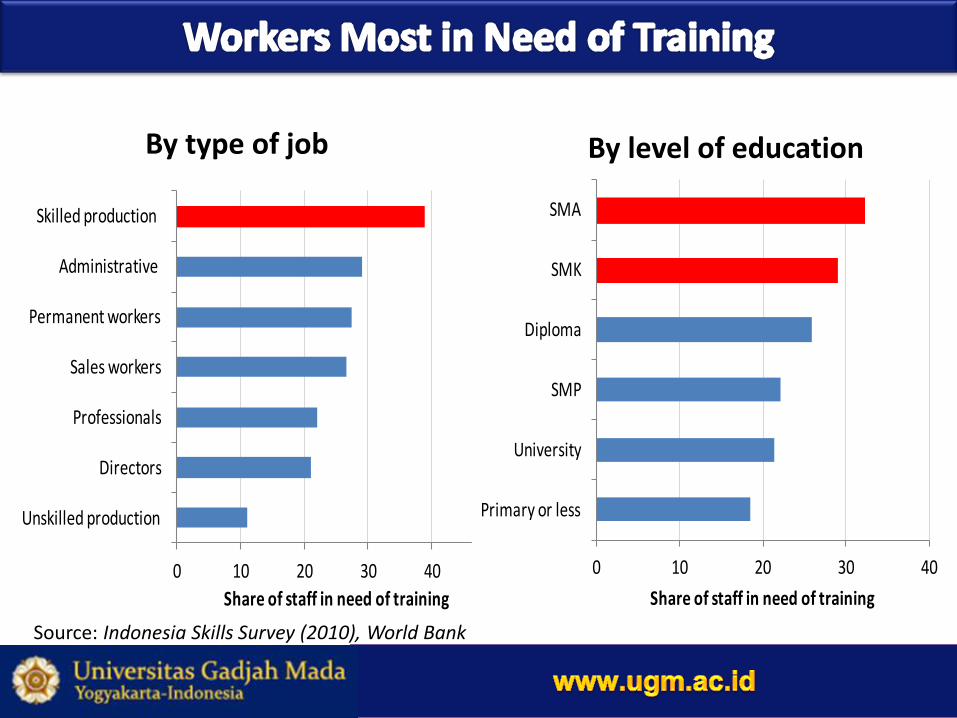
By type of job
0 10 20 30 40 50
Unskilled production
Directors
Professionals
Sales workers
Permanent workers
Administrative
Skilled production
Share of staff in need of training
0 10 20 30 40
Primary or less
University
SMP
Diploma
SMK
SMA
Share of staff in need of training
By level of education
Source: Indonesia Skills Survey (2010), World Bank
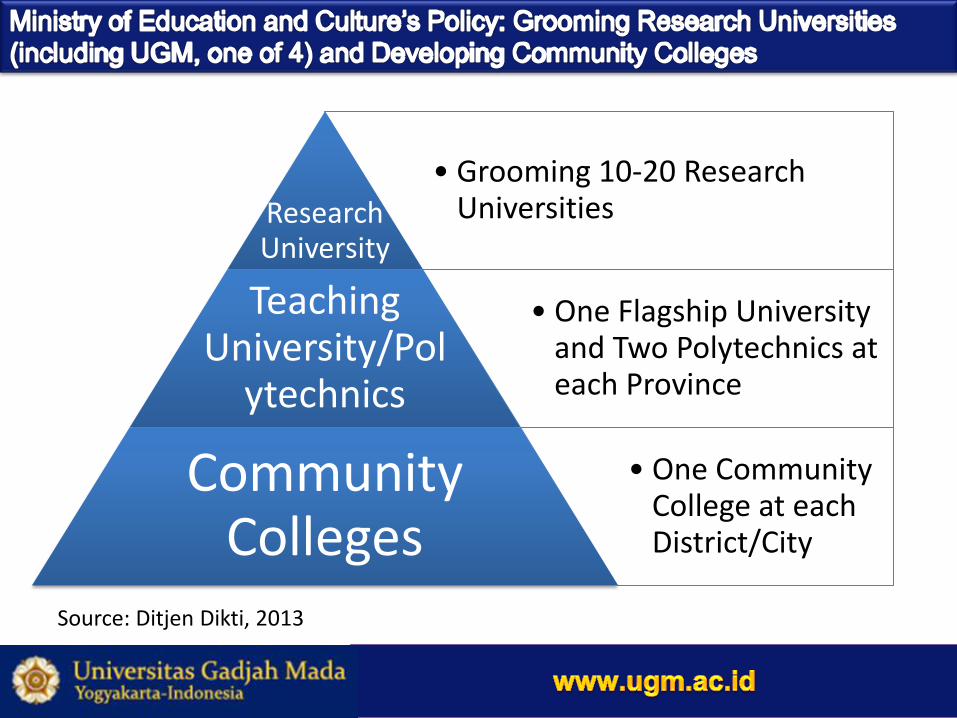
• Grooming 10-20 Research Universities Research
University
• One Flagship University and Two Polytechnics at each Province
Teaching University/Pol
ytechnics
• One Community College at each District/City
Community Colleges
Source: Ditjen Dikti, 2013
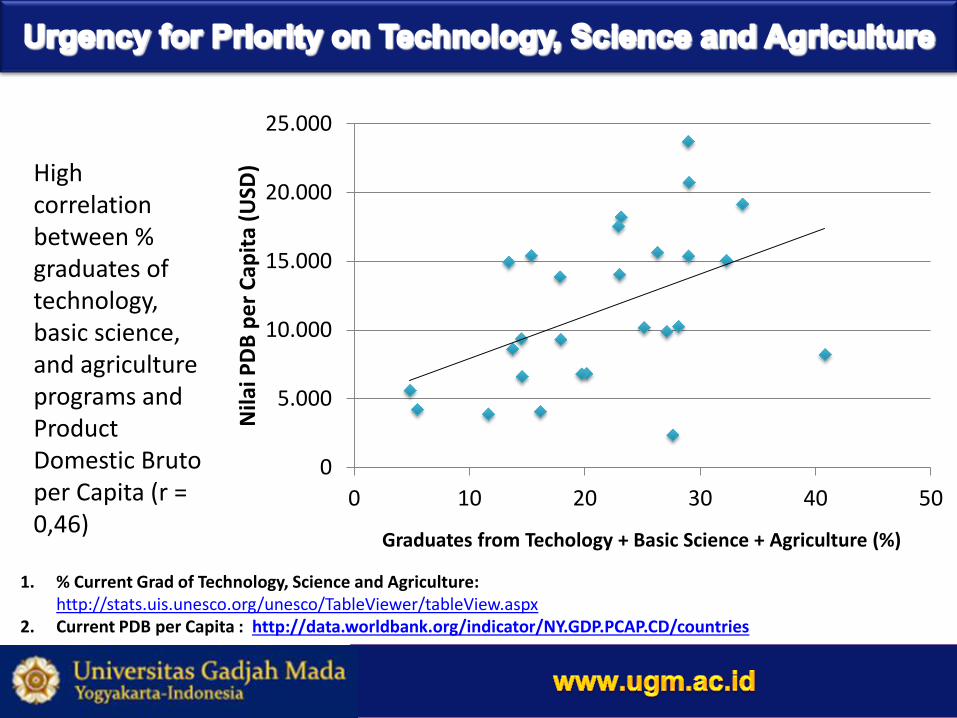
High correlation between % graduates of technology, basic science, and agriculture programs and Product Domestic Bruto per Capita (r = 0,46)
0
5.000
10.000
15.000
20.000
25.000
0 10 20 30 40 50
Nila
i PD
B p
er
Cap
ita
(USD
)
Graduates from Techology + Basic Science + Agriculture (%)
1. % Current Grad of Technology, Science and Agriculture: http://stats.uis.unesco.org/unesco/TableViewer/tableView.aspx
2. Current PDB per Capita : http://data.worldbank.org/indicator/NY.GDP.PCAP.CD/countries
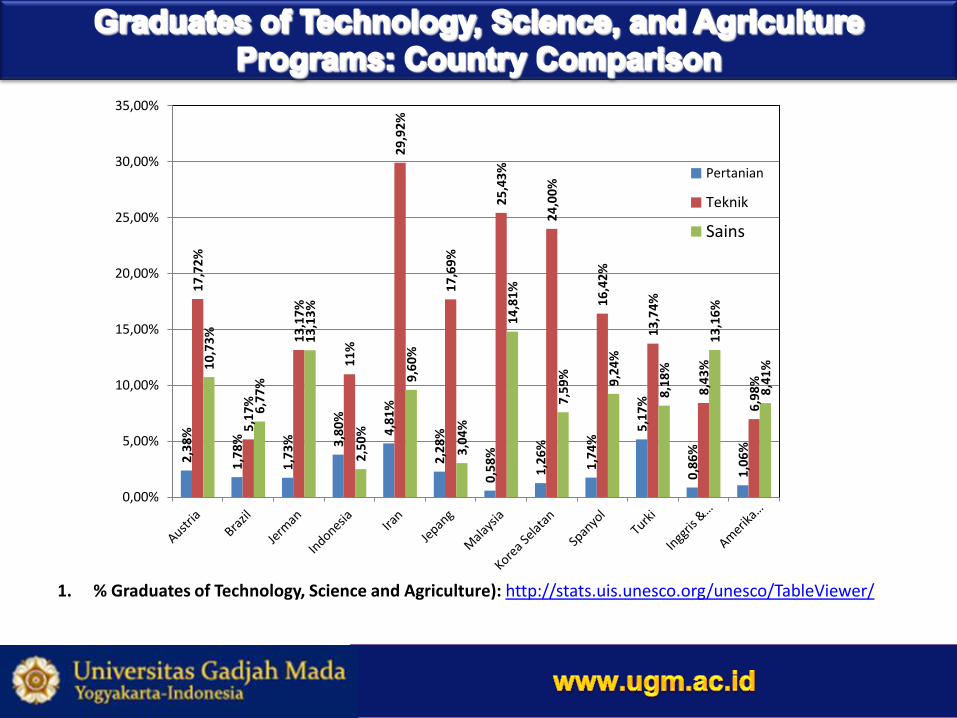
2,3
8%
1,7
8%
1,7
3%
3,8
0%
4,8
1%
2,2
8%
0,5
8%
1,2
6%
1,7
4%
5,1
7%
0,8
6%
1,0
6%
17
,72
%
5,1
7%
13
,17
%
11
%
29
,92
%
17
,69
%
25
,43
%
24
,00
%
16
,42
%
13
,74
%
8,4
3%
6,9
8%
10
,73
%
6,7
7%
13
,13
%
2,5
0%
9,6
0%
3,0
4%
14
,81
%
7,5
9%
9,2
4%
8,1
8%
13
,16
%
8,4
1%
0,00%
5,00%
10,00%
15,00%
20,00%
25,00%
30,00%
35,00%
Pertanian
Teknik
Sains
1. % Graduates of Technology, Science and Agriculture): http://stats.uis.unesco.org/unesco/TableViewer/
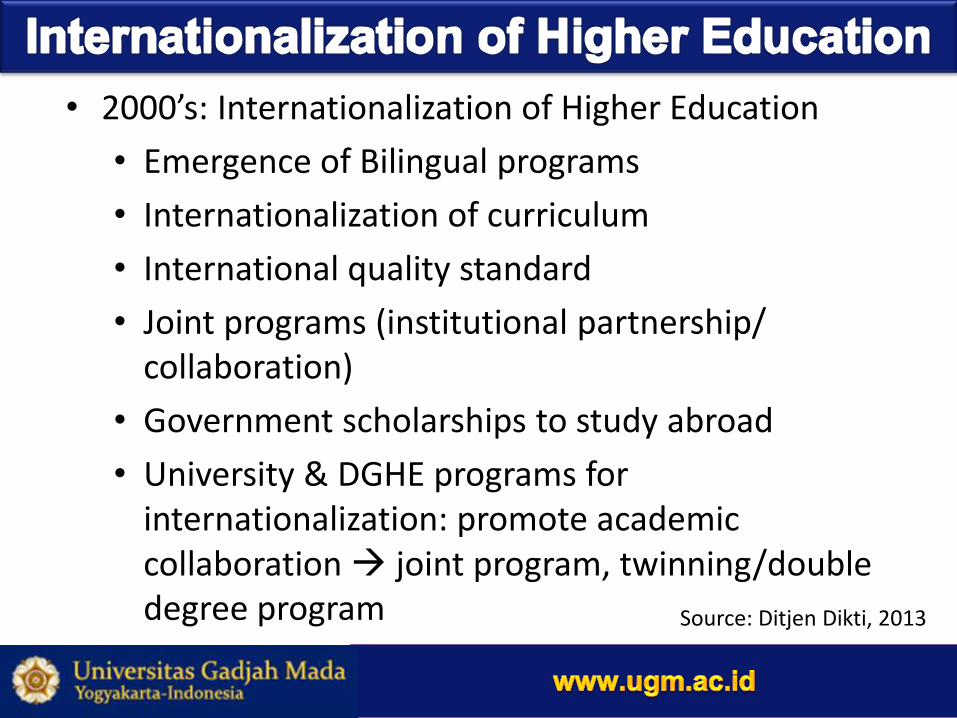
• 2000’s: Internationalization of Higher Education
• Emergence of Bilingual programs
• Internationalization of curriculum
• International quality standard
• Joint programs (institutional partnership/ collaboration)
• Government scholarships to study abroad
• University & DGHE programs for internationalization: promote academic collaboration joint program, twinning/double degree program Source: Ditjen Dikti, 2013