the growth imperative - innosight...the extreme power of granularity source: granularity of growth;...
TRANSCRIPT

THE GROWTH IMPERATIVECHOOSI NG T O L EAD T RANSFORMATI ONAL GROWT H
Patrick Viguerie, Managing Partner, Innosight

“THE COLLECTIVE POWER OF THOSE
INDEPENDENT ENOUGH NOT TO FOLLOW WILL
MOVE THE WORLD FORWARD”
Malala Yousafzai
Florence Nightingale
Little Rock Nine
Quentin TarantinoReed HastingsEd Catmull
Blake Mycoskie Mark Bertolini
Amelia EarhartLady Gaga Dick Fosbury
Andy WarholJackie Robinson

© 2018 Innosight Consulting, LLC and/or its affiliates 3
3
Creative destruction is alive and well
0
10
20
30
40
1965 1970 1975 1980 1985 1990 1995 2000 2005 2010 2015 2020 2025 2030
AVERAGE LIFESPAN ON S&P 500 IN YEARSRolling 7-year averages
PROJECTED
Source: “Corporate Longevity: Turbulence Ahead for Large Organizations,” Innosight briefing, Spring 2018, Dual Transformation

© 2018 Innosight Consulting, LLC and/or its affiliates 4
4
Choosing to grow – five key messages
Source: Granularity of Growth
Apply granularity to sharpen insights and decisions about
markets, opportunities, and your growth portfolio
Recognize that where-to-play choices will enable – or limit – your growth
Decide whether to grow or go ... Nothing else works over the long term
Determine whether to build a transformative growth platform or focus on the core …and either way, prepare to make some curve-bending moves
Anchor innovation in customer “jobs-to-be-done
1
2
3
4
5

© 2018 Innosight Consulting, LLC and/or its affiliates 5
Long-term value creation associated withrevenue growth, not margin expansion
Annualized TRS,May11 to May19
Diameter reflects
LFY Revenue
8-YEAR TRS, MARGIN EXPANSION & REVENUE GROWTHEstimate
5
10
15
20
25
30
-1500 -1000 -500 0 500 1000
Chg in Operating Margin, bps – Last 8 Fiscal YearsRevenue CAGR, % – Last 8 Fiscal Years
35
0
5 10 15 20 25 35 4530 40 50-5 0
R2 = 0.00R2 = 0.53
1Grow or go
Top 20 market cap S&P 500 companies, ex-financials
Note: Facebook on 7-year basis
Apple
United
Health
Amazon
HomeDepot
CiscoDisney
Merck
PfizerJNJ
Walmart
P&GVerizon
Coca-
Cola
AT&TChevron
XOM
Microsoft
Alphabet

© 2018 Innosight Consulting, LLC and/or its affiliates 6
40
30
25
20
15
10
5
Example of growth/return relationship across TMT sector
Annualized TRS,Apr 2011 to Apr 2019
Diameter reflects
LFY Revenue
Source: Company financials
10-YEAR TRS, MARGIN EXPANSION & REVENUE GROWTH (TMT)Estimate
-15 -10 -5 0 5 10 15
Op Margin Chg in bps
R2 = 0.14R2 = 0.56
Revenue CAGR
0
35
5 10 15 20 25 35 45 5530 40 500
1Grow or go

© 2018 Innosight Consulting, LLC and/or its affiliates 7
7
10.1
6.6
3.1
All growth comes from three growth cylinders – Where-to-play choices dominate
The revenue growth your company
achieves through growth of the
segments in your portfolio
Growth achieved through gaining
or losing share from competitors
Net revenue growth achieved when
making acquisitions or divestments
1 Includes companies analyzed during the period within 1999 and 2011 for various timeframes 2 Based on the average of 834 companies
Total
revenue
growth
Growth
cylinders
Market
momentum
Market out-
execution
M&A
Company average2
Average revenue growth disaggregation, percent, 1999-2006
0.4
Source: Granularity of Growth
2WTP choices

© 2018 Innosight Consulting, LLC and/or its affiliates 8
8
Where to play example: Almost no way to grow as an auto OEM early 2000s without a position in China or Luxury
$50
$140
$40
$25
$25
2000 China Luxury Exc. China Other 2014
OEM AUTOMOTIVE EBIT 2000-2014 (Billions)
Luxury $15
$90
2WTP choices
© 2018 Innosight Consulting, LLC and/or its affiliates 9
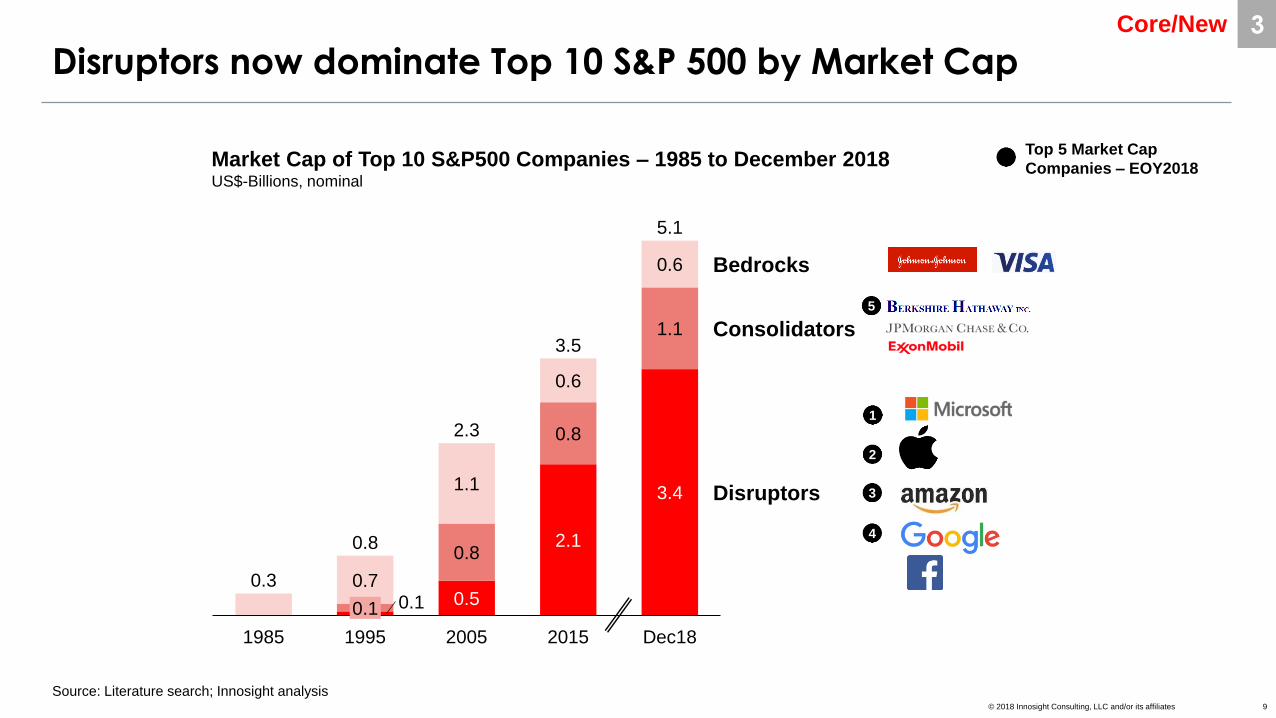
Disruptors now dominate Top 10 S&P 500 by Market Cap
0.8
1995
0.7
1985
0.1
Consolidators
Dec18
0.8
1.1
0.1 0.5
2005
0.6
2.1
2015
0.6
1.1
3.4
3.5
Bedrocks
Disruptors
0.8
0.3
2.3
5.1
Market Cap of Top 10 S&P500 Companies – 1985 to December 2018 US$-Billions, nominal
Source: Literature search; Innosight analysis
1
2
3
4
5
Top 5 Market Cap
Companies – EOY2018
3Core/New

© 2018 Innosight Consulting, LLC and/or its affiliates 10
Sustaining innovations power incumbent growth
Source: Richard N. Foster; Creative Destruction
3Core/New
© 2018 Innosight Consulting, LLC and/or its affiliates 11
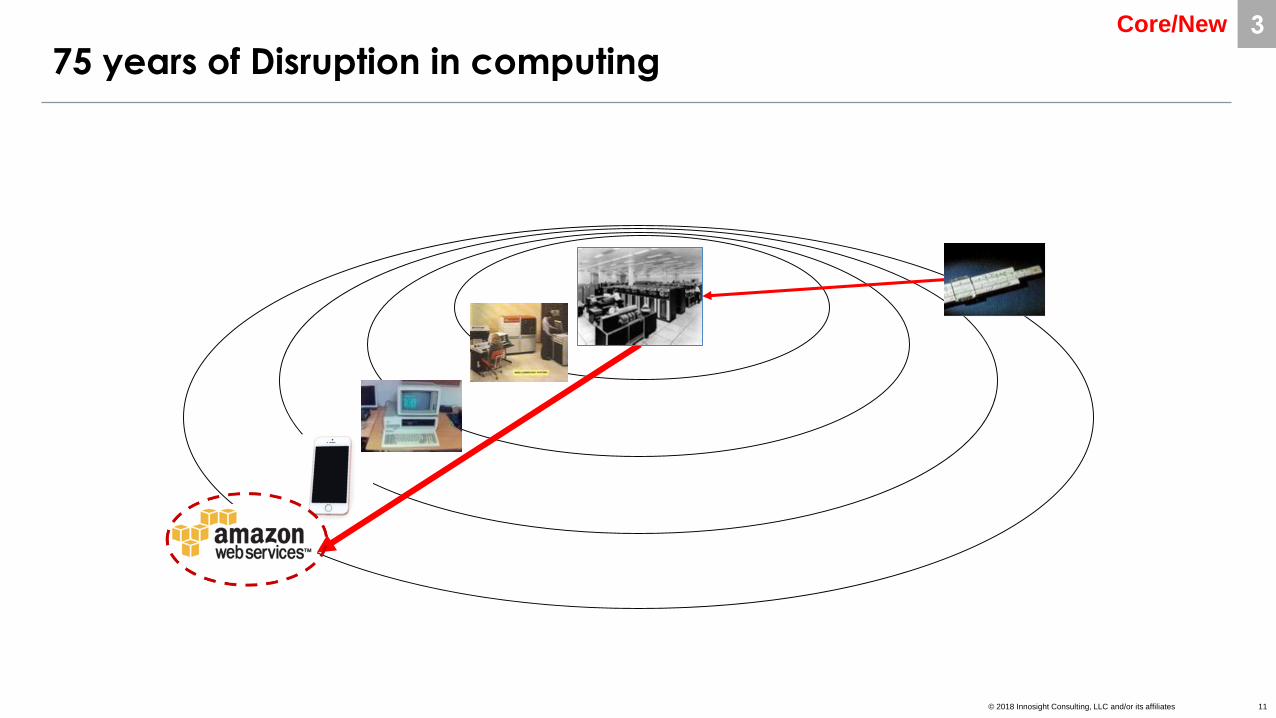
75 years of Disruption in computing3Core/New

© 2018 Innosight Consulting, LLC and/or its affiliates 12
NO ONE HAS EVER BEATEN DISRUPTION
JUST BY TRYING TO DO
WHAT THEY CURRENTLY DO BETTER

© 2018 Innosight Consulting, LLC and/or its affiliates 13
Successful transformative platforms receive considerably higher revenue multiples vs. core / legacy players
Estimate
Core / Legacy
Transformative
EV-to-Revenue Multiples in Select Sectors
– April 2019
LFY EBITA Margin, %
Automotive / MobilityChemicals Healthcare
1.4
2.5
6.5
10
22
30
4.6
4.9
15.1
0.4
2.4
~8.0
1 Based on $90B expected public Valuation, $11b in 2018 Net Revenue
1
3Core/New

© 2018 Innosight Consulting, LLC and/or its affiliates 14
Microsoft and Adobe enjoyed significant Multiple Expansion based on “Where to Play” Choices
Source: Company financials, websites
ENTERPRISE VALUE-TO-REVENUE MULTIPLE Dec12 v Apr19, x
Estimate
Enterprise Value 172 950 14417
74 110 94LFY Revenue
$-Billions
38 34 3328LFY EBITA Margin, %
2.3
8.6
Dec12 Apr19
3.9
15.9
Dec12 Apr19
3Core/New

© 2018 Innosight Consulting, LLC and/or its affiliates 15
Revenue multiples show relative value of Core, Adjacent and Transformative innovation
2 3 4
24 2.6 2.8 2.9
28 3.1 3.4 3.6
32 3.6 4.0 4.2
EBITA
Margin Percent
Organic Revenue Growth – First 10 YearsPercent
EV-to-Revenue
Multiple1
Valuation Sensitivity based on Platform Type
Core / Adjacent
Transformative
Moderate, GDP Growth
Asset-Intensive2
High Growth
Asset-Light3
5 10 15
4.2 6.2 9.0
5.0 7.3 10.6
5.7 8.3 12.2
1 Global assumptions: WACC = 8%, Tax Rate = 25%
2 Operating Invested Capital [i.e., OIC] / Revenue = 1.6x,
3 OIC / Revenue = 0.2x
3Core/New
© 2018 Innosight Consulting, LLC and/or its affiliates 16
16
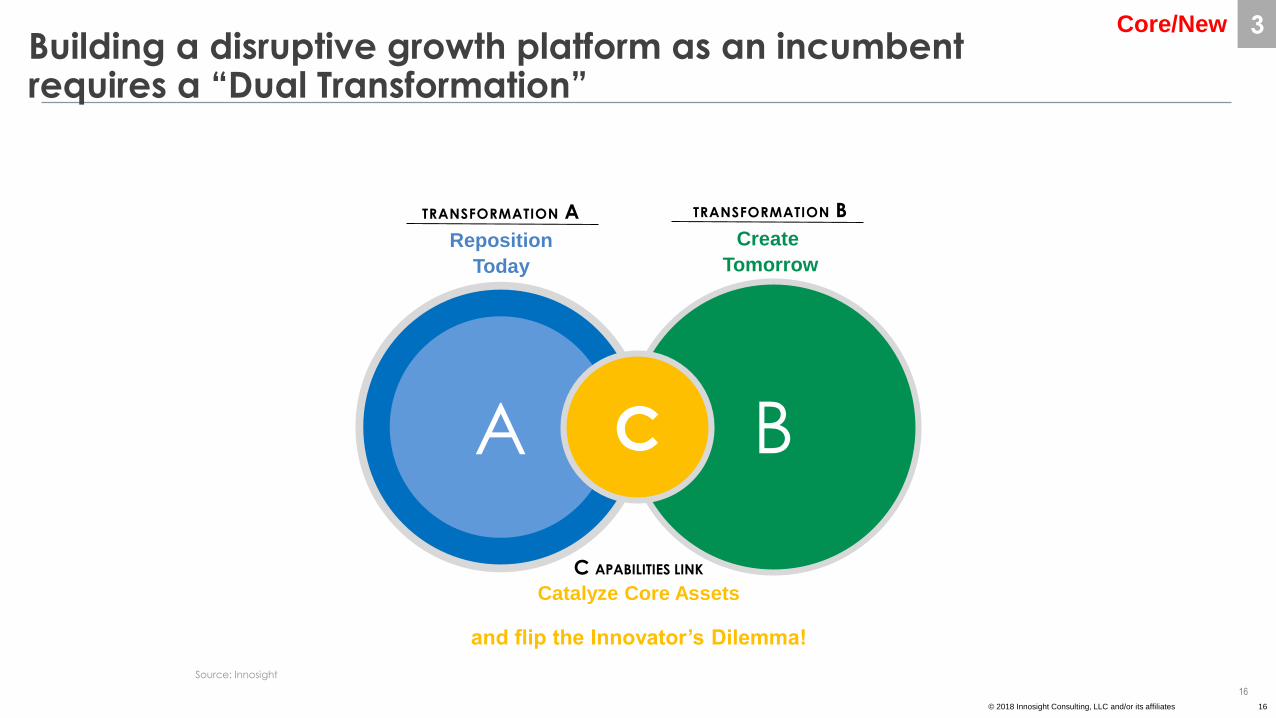
Building a disruptive growth platform as an incumbent requires a “Dual Transformation”
TRANSFORMATION A
Reposition
Today
TRANSFORMATION B
Create
Tomorrow
C APABILITIES LINK
Catalyze Core Assets
A BC
Source: Innosight
and flip the Innovator’s Dilemma!
3Core/New

© 2018 Innosight Consulting, LLC and/or its affiliates 17
17
Big moves; big difference – what are your “curve benders?”
Source: Strategy Beyond the Hockey Stick
Productivity transformation
Significant resource reallocation
Sustained capital investment program
Programmatic M&A
Major business model differentiation improvement
1
2
3
4
5
3Core/New

© 2018 Innosight Consulting, LLC and/or its affiliates 18
Changing consumer expectations accelerate disruption
“When people say that an
entrant is disruptive in an
industry, what they really mean
is that customers are adopting
that new way. At Amazon, we’ve
had a lot of inventions that we
were very excited about, and
customers didn’t care at all. And
believe me, those inventions
were not disruptive in any way.
The only thing that’s
disruptive is customer
adoption. If you can invent a
better way, and if customers
agree that it’s a
better way, then they will
use that.”
4Jobs-to-be-done

© 2018 Innosight Consulting, LLC and/or its affiliates 19
Innovation should solve a customer’sJOBS-TO-BE-DONE
Enabling Access and Affordability
4Jobs-to-be-done

© 2018 Innosight Consulting, LLC and/or its affiliates 20
What is a JOB-TO-BE-DONE?
“People don’t want to buy a quarter-inch drill, they want a quarter-inch hole!” – Ted Levitt
VS.
The fundamental task (or problem) the consumer (or stakeholder) is trying to get done (or solve) in a particular circumstance
4Jobs-to-be-done

© 2018 Innosight Consulting, LLC and/or its affiliates 21
21
The extreme power of granularity
Source: Granularity of Growth; Google Earth
• Originally a scientific and engineering term, now a “household word” in business
• Refers to the size of the components of a larger system
• Cuts through the tyranny of the “averaged view”
5Granularity

© 2018 Innosight Consulting, LLC and/or its affiliates 22
22
Applying granularity to portfolio management can sharpen resource allocation choices …
Growth and ROIC
together drive value….
…Value is created AT
the granular level….
…Improvements “cascade
up” when made broadly
Company
BU
Geographies
Products
Customers
Value─30 +100
∑ = +70
Source: Granularity of Growth; Innosight
5Granularity

© 2018 Innosight Consulting, LLC and/or its affiliates 23
23
… across the portfolio
Source: McKinsey Granularity of Growth Initiative; Corporate Finance Practice
Revenue
Generating Units
Business Model
InnovationM&A
Legacy
Emerging
HEAT MAP ILLUSTRATION
Source: Granularity of Growth; Innosight
5Granularity

© 2018 Innosight Consulting, LLC and/or its affiliates 24
24
Choosing to grow – five key messages
Source: Granularity of Growth
Apply granularity to sharpen insights and decisions about
markets, opportunities, and your growth portfolio
Recognize that where-to-play choices will enable – or limit – your growth
Decide whether to grow or go ... Nothing else works over the long term
Determine whether to build a transformative growth platform or focus on the core …and either way, prepare to make some curve-bending moves
Anchor innovation in customer “jobs-to-be-done
1
2
3
4
5

© 2018 Innosight Consulting, LLC and/or its affiliates 25
The pieces of the puzzle – toward an integrated growth architecture
Future-back
growth strategy (ambition and
growth direction)
Granular
Strategies
Granular resource
allocation and
organization
Macro
Micro
Strategy Organization
(Dual?)
Transformation
architecture
Operating
Model
© 2018 Innosight Consulting, LLC and/or its affiliates 26
Future-back
growth strategy (ambition and
growth direction)
(Dual?)
Transformation
architecture
Granular
Strategies
Granular resource
allocation and
organization
Operating
Model
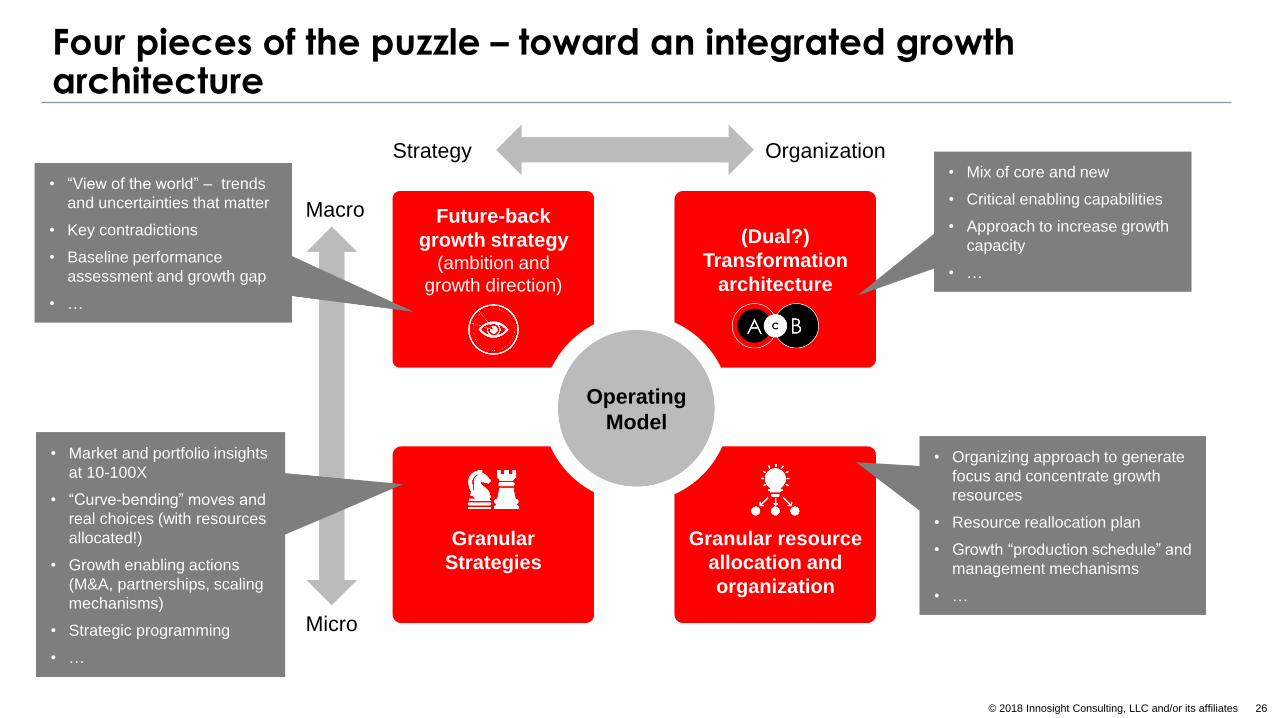
Four pieces of the puzzle – toward an integrated growth architecture
• Mix of core and new
• Critical enabling capabilities
• Approach to increase growth
capacity
• …
• Organizing approach to generate
focus and concentrate growth
resources
• Resource reallocation plan
• Growth “production schedule” and
management mechanisms
• …
Strategy Organization
Macro
Micro
• “View of the world” – trends
and uncertainties that matter
• Key contradictions
• Baseline performance
assessment and growth gap
• …
• Market and portfolio insights
at 10-100X
• “Curve-bending” moves and
real choices (with resources
allocated!)
• Growth enabling actions
(M&A, partnerships, scaling
mechanisms)
• Strategic programming
• …

© Copyright 2013 Innosight LLC© 2018 Innosight Consulting, LLC and/or its affiliates
THANK YOU!