the growth and development of women-owned …...the growth and development of women-owned...
TRANSCRIPT

The Growth and Development of Women-Owned Enterprises
in the United States, 2002 - 2012
An Analysis of Trends From the U.S. Census Bureau’s
Survey of Business Owners
Prepared by Womenable
for the National Women’s Business Council
Under
SBAHQ-15-M-0136/req. 521300EQ0012A
The statements, findings, conclusions, and recommendations found in this study are those of the authors and do not necessarily reflect the views of the
National Women’s Business Council, the United States Small Business Administration, or the United States Government.

The Growth and Development of Women-Owned Enterprises in the U.S.: 2002-2012 a
Executive Summary
Women continue to enter into the ranks of business ownership at rates exceeding
the national average. Indeed, the rate at which women are launching businesses
is on the rise.
As of 2012, there are nearly 10 million women-owned businesses1 in the United
States. These enterprises employ over eight million workers and generate over
$1.4 trillion in revenues.
Between 2002 and 2012, the number of women-owned firms increased at a rate
2-1/2 times the national average (52% vs. 20%), employment in women-owned
firms grew at a rate 4-1/2 times that of all firms (18% vs. just 4%), and the growth
in revenues generated by women-owned firms paralleled that of all firms (up 51%
compared to 48%).
The pace of business formation among women is on the rise. Between 1997 and
2002, the number of women-owned firms grew by 20%, as it did between 2002
and 2007. Then, between 2007 and 2012, the number of women-owned firms
increased by 27% – a significant uptick in business start-ups.
On average, between 2002 and 2012, women launched an average of 928 net
new firms each and every day. Within that ten-year period, there were an
average of 714 net new women-owned firms per day between 2002 and 2007,
and 1,143 per day between 2007 and 2012.
1 Throughout this report, the term “women-owned” refers to enterprises that are at least 51% owned and
operated by a woman or group of women. Businesses equally-owned by a man and a woman (or equal numbers of men and women) are not included – primarily because the way that equally-owned firms have been identified has differed in each of the past four business census years, thus precluding accurate trend analysis.

The Growth and Development of Women-Owned Enterprises in the U.S.: 2002-2012 b
While more and more women are starting businesses, those businesses remain
significantly smaller than average.
Women-owned businesses comprise 36% of the country’s businesses, employ
7% of the private-sector workforce, and contribute 4% of business revenues.
Ten years prior, women-owned firms represented a smaller 28% of the country’s
businesses, but contributed a similar share of employment (7%) and revenues
(4%).
In terms of employment, fully 91% of women-owned firms have no employees
other than the owner, and just 2% have 10 or more employees. Women-owned
firms with 10 or more employees provide three-quarters of the jobs provided by
women-owned firms. While most women-owned firms remain small in terms of
employment, it should be pointed out that the number of women-owned
employer firms (which now numbers over one million) has increased by 13%
between 2002 and 2012, while overall the number of U.S. employer firms has
declined by 1.8% over the same period.
With respect to revenue size, 82% of women-owned firms generate less than
$100,000 in annual revenues, and just 3% generate $500,000 or more in
revenues. This top 3% of women-owned firms accounts for three-quarters of the
revenues generated by women-owned businesses. Further, it should be noted
that – while less than 2% of women-owned firms generate $1 million or more in
revenues – the number of those firms increased by 47% between 2002 and
2012, compared to an 18% increase among all million-dollar enterprises.

The Growth and Development of Women-Owned Enterprises in the U.S.: 2002-2012 c
The average revenue per woman-owned firm is $143,731. This compares to
average revenues of $440,190 among all privately-held firms and $1,213,944
among all firms – which includes large, publicly-traded firms (which average
$48.2 million in per-firm revenues).
Perhaps the most remarkable trend in women’s entrepreneurship seen over the
past decade is the phenomenal growth in business ownership among women of
color.
In 2002, there were fewer than one million (909,321) minority women-owned
firms in the U.S., representing 14% of women-owned firms. As of 2012, there are
nearly 3.8 million firms owned by women of color, comprising 38% of women-
owned businesses.
Between 2002 and 2012, when the number of women-owned firms overall
increased by 52%, the number of non-minority women-owned firms grew by just
9%, while the number of minority women-owned firms overall grew by 315% – a
quadrupling in numbers. Specifically, the number of Native American/Alaska
Native women-owned businesses increased by 67%, the number of Asian
American women-owned businesses more than doubled (up 121%), the number
of Native Hawaiian/Pacific Islander women-owned businesses increased by
136%, and the number of Latina-owned businesses nearly tripled (up 172%) – as
did the number of African American women-owned businesses (up 178%).
As of 2012, there are 1,521,494 African American women-owned firms in the
U.S., 1,469,991 Latina-owned firms, 749,197 Asian American women-owned

The Growth and Development of Women-Owned Enterprises in the U.S.: 2002-2012 d
firms, 131,064 Native American/Alaska Native women-owned firms, and 24,982
Native Hawaiian/Pacific Islander women-owned firms in the U.S.
As the number of women serving in the military has grown, so has the number of
female veteran-owned enterprises – at a rate exceeding even that of minority
women-owned businesses.
In 2007, there were 97,114 veteran women-owned firms in the U.S., representing
4% of all veteran-owned firms. As of 2012, there are 383,302 veteran women-
owned firms, comprising 15% of all veteran-owned firms.
Between 2007 and 2012, when the number of all veteran-owned businesses
increased by 3% – from 2.4 to 2.5 million – the number of female veteran-owned
businesses increased by a phenomenal 295%, a near quadrupling in numbers in
just five years.
Regionally, the sharpest rise in the number of women-owned firms has been seen
in the southern region of the U.S., where overall population growth has been the
strongest. However, women-owned firms in the central part of the country have
bounced back most strongly from the 2007-2009 recession.
Between 2002 and 2012, the greatest growth in the number of women-owned
firms has been seen in Georgia (+92%), Mississippi (+89%), Texas (+85%),
Florida (+85%), and Louisiana (+74%) – all Southern states. Indeed, all of the
states where women-owned firm growth exceeds the national average by more
than 10 points are in the South, except for Arizona and Nevada.

The Growth and Development of Women-Owned Enterprises in the U.S.: 2002-2012 e
Four out of the five fastest-growing metropolitan areas for women-owned firms
are also in the South: Memphis (+160%), Charlotte (+138%), Orlando (+127%),
Las Vegas (+101%), and San Antonio (+101%).
While states in the South lead the way in business growth over the entire ten-
year period, Central states are home to the most positive trends when comparing
growth during the 2007-2012 post-recession period to the 2002-2007 pre-
recession period. There are 19 states in which post-recession growth in the
number of women-owned firms is at least 10 points higher than pre-recession
growth; most are in the North Central or Midwest regions of the U.S. The leading
“bounce back” states are Louisiana, Nebraska, Iowa, North Dakota, Indiana, and
Mississippi. At the other end of the spectrum, ten states currently lag pre-
recession growth rates – including Maine, Georgia, Hawaii, and New Hampshire,
where post-recession growth is more than 5% lower than pre-recession growth.
As women business owners themselves are growing more diverse, so are the
businesses that they are starting. Despite growing industry diversification,
however, the largest concentration of women-owned firms is still seen in the
most traditional areas of business ownership for women – sectors that have
lower than average revenues per firm.
Women-owned firms are found in every industry. In fact, 2% or more of the
nearly 10 million women-owned firms are found in 13 of the 19 major industries –
including over 260,000 women-owned construction firms, over 200,000 women-

The Growth and Development of Women-Owned Enterprises in the U.S.: 2002-2012 f
owned finance and insurance firms, and nearly 160,000 women-owned
transportation and warehousing enterprises.
Despite the growing diversity in the types of businesses that women own, nearly
half (49%) of women-owned firms are found in three sectors: other services (1.9
million firms, within which there are nearly 1 million beauty and nail salons),
health care and social assistance (1.6 million firms, within which there are over
600,000 child day care service businesses), and professional/scientific/technical
services (1.3 million firms, within which there are a cornucopia of such firms as
management and human resources consultancies, translation services, and
veterinarians).
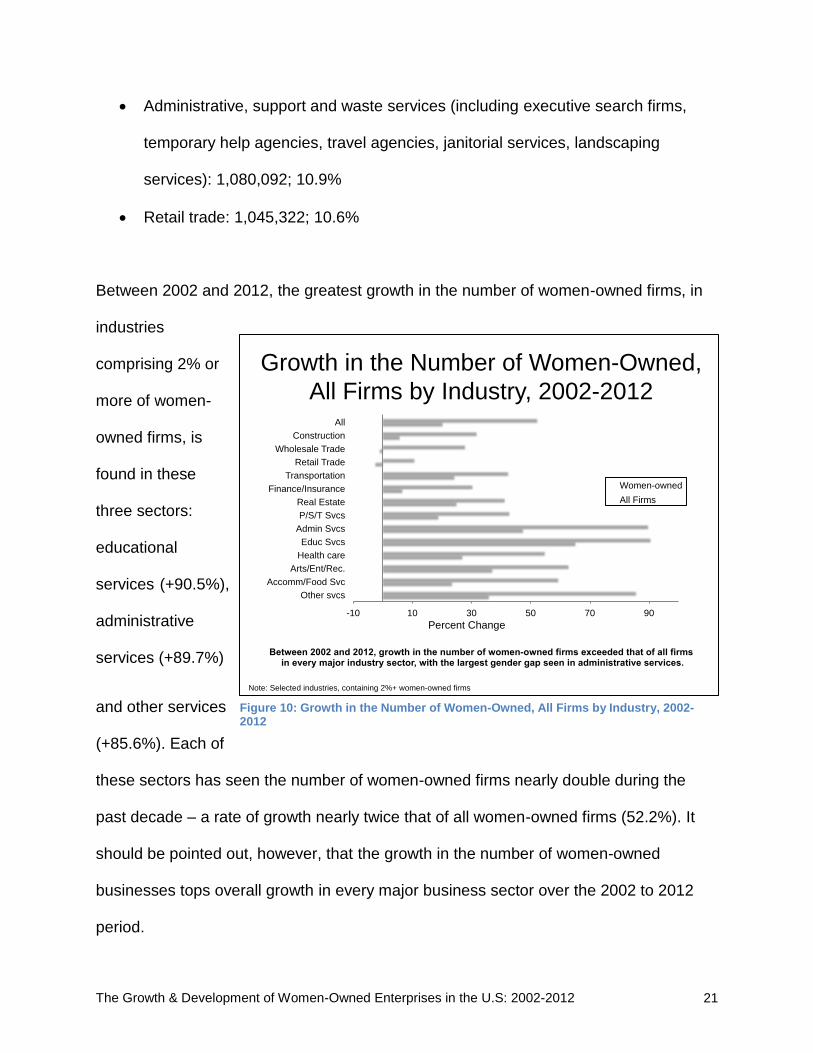
Between 2002 and 2012, the greatest growth in the number of women-owned
firms has been in educational services (+91%), administrative services (+90%)
and other services (+86%) – growth rates nearly double the overall 52% increase
during the period. However, even within slower-growing industries, the rate of
growth in the number of women-owned firms outpaces overall growth in every
single industry sector.
Women-owned businesses are more likely than average to have achieved
revenues of $500,000 or more in five industries: wholesale trade, manufacturing,
accommodation and food services, construction, and transportation and
warehousing. However, women-owned firms in these industries comprise only
11% of all women-owned firms.
Conversely, among some of the most populous sectors for women-owned
businesses – most especially other services, administrative, support and waste

The Growth and Development of Women-Owned Enterprises in the U.S.: 2002-2012 g
management services and health care and social assistance, average revenues
are well under $100,000 per firm. Raising the overall economic clout of women-
owned businesses would then require a two-pronged approach:
1. Assist women in the more populous, lower per-firm revenue sectors in
scaling-up their enterprises, and
2. Encourage more women to start businesses in the less populous but more
likely to scale sectors.

The Growth & Development of Women-Owned Enterprises in the U.S: 2002-2012 i
Table of Contents
Table of Contents ............................................................................................................. i Introduction ..................................................................................................................... 1 The National Picture ........................................................................................................ 3 The Economic Clout of Women-Owned Firms ................................................................ 8
Employment ................................................................................................................. 8 Payroll ........................................................................................................................ 10 Revenues .................................................................................................................. 11
Growing Ethnic Diversity ............................................................................................... 13 Female Veteran-Owned Firms ...................................................................................... 17 Industry Trends ............................................................................................................. 20
Distribution ................................................................................................................. 20 Detailed Industry Trends ............................................................................................ 22 Scalability .................................................................................................................. 25 Concentration ............................................................................................................ 27
Geographic Trends........................................................................................................ 29 Pre-Post Recession Growth .......................................................................................... 33 Implications ................................................................................................................... 37 Summary Tables ........................................................................................................... 40
Table 1: Trend in Number, Employment and Revenue of U.S. Firms, 2002-2012 ..... 40 Table 2: Number of Net New Women-Owned Firms per Day, 2002-2012 ................. 41 Table 3: Trend in Number, Employment, Revenues of Women-Owned Firms by Employment Size Class, 2002-2012 .......................................................................... 44 Table 4: Trend in Number, Employment, Revenues of Women-Owned Firms by Revenue Size Class, 2002-2012 ............................................................................... 45 Table 5: Trend in Number, Employment, Revenues of Minority Women-Owned Firms, 2002-2012 ................................................................................................................. 46 Table 6: Trend in Number, Employment, Revenues of Female Veteran-Owned Firms in the United States by Industry, 2007-2012 .............................................................. 47 Table 7: Trend in Number, Employment, Revenues of Women-Owned Firms by Industry, 2002-2012 ................................................................................................... 50 Table 8: Trend in Number of Women-Owned Firms Within Industry by Revenue Size of Firm, 2002-2012 .................................................................................................... 53 Table 9: Trend in Number, Employment, Revenues of Women-Owned Firms by Selected Detailed Industry, 2002-2012 ...................................................................... 56 Table 10: Trend in Number, Employment, Revenues of Women-Owned Firms by State, 2002-2012 ....................................................................................................... 62 Table 11: Trend in Number, Employment, Revenues of Women-Owned Firms in 50 Most Populous Metropolitan Areas, 2002-2012 ......................................................... 68 Table 12: Metropolitan Area Boundary Changes Between 2002/07 & 2012 .............. 74 Table 13: Comparison of Growth in Number of Women-Owned Firms Pre- and Post-Recession .................................................................................................................. 76

The Growth & Development of Women-Owned Enterprises in the U.S: 2002-2012 1
Introduction
When the National Women’s Business Council (NWBC) was established – after the
passage of the Women’s Business Ownership Act of 1988 – there was not a full
accounting of the economic contributions of women-owned firms. Indeed, lack of
knowledge about the role that women-owned businesses were playing in fueling the
country’s economic well-being – and the resulting lack of seriousness with which
women business owners were being treated – was one of the important drivers behind
the strong advocacy efforts by the group of women business owners who lobbied for,
helped to craft, and can take credit for the passage of the Act.
One of the four main tenets of the Act, in addition to establishing the NWBC, directed
the U.S. Census Bureau to count all women-owned businesses in its quinquennial
business census.2 The first census following the Act (the 1992 Census, published in
1995) included women-owned C corporations for the first time. And, while the number of
women-owned firms increased by only 9%, the employment provided by women-owned
firms more than doubled, increasing by 111%, and revenues generated by women-
owned enterprises increased by an even greater 145%.
2 The other pillars of the Act, also known as House Resolution (H.R.) 5050, extended equal access to
capital granted in the 1974 Equal Credit Opportunity Act – which focused on personal credit – to business credit, and established the Women’s Business Center program.

The Growth & Development of Women-Owned Enterprises in the U.S: 2002-2012 2
Counting the economic contributions of all women-owned businesses matters. The full
accounting of the economic contributions being made by women-owned businesses
awakened support for women’s enterprise development, fueled an explosion of
women’s business associations, and led to women business owners being taken much
more seriously.
Women’s business advocates, policy makers, and women business owners themselves
have all grown to rely on the information provided by the Census Bureau’s Survey of
Business Owners (SBO) program to assess the progress being made by women-owned
firms, and to note where growth lags. These data have fueled federal, state and local
policy efforts, programmatic support for women-owned businesses by corporations and
other women’s enterprise supporters, and provided the proof required to enable women
entrepreneurs to be taken more seriously.
This report provides an accounting of the key trends and findings seen in the most
recent Survey of Business Owners, the 2012 SBO published in December 2015 –
comparing current figures with SBO data collected in 2002 and 2007. Special attention
is paid to comparing the growth seen in the 2002-2007 period with that seen in the
2007-2012 period, to ascertain where women-owned firms have “bounced back” from
the 2007-09 recession and where growth has not yet reached pre-recession levels.
It is hoped that this report will be a useful reference for policy makers, program
managers, and women’s business advocates everywhere.

The Growth & Development of Women-Owned Enterprises in the U.S: 2002-2012 3
The National Picture
As of 2012, there are nearly 10 million women-owned businesses in the United States
(9,878,397). These enterprises employ over eight million workers (8,431,614) and
generate over $1.4 trillion in revenues ($1,419,834,295,000).
Between 2002 and
2012, the number
of women-owned
firms increased by
52.2%, employment
in women-owned
firms grew by 18%,
and revenues
generated by
women-owned
firms increased
50.9%. In comparison, the number of all U.S. businesses increased by 20.2%,
employment grew 4%, and revenues increased 48.2%. Therefore, the number of
women-owned firms is increasing at a rate 2-1/2 times the national average,
employment in women-owned firms is increasing at a rate 4-1/2 times that of all U.S.
businesses, and revenue growth is keeping pace at the same rate as all firms in the
country.
Percent Change Among
Women-Owned Firms, 2002-2012
Number of Firms Employment
Revenues
20.2
4
48.2
52.2
18
50.9
Perc
en
t C
han
ge
All Firms Women-Owned
Women-owned firms are increasing in number at a rate 2-1/2 times the national average; employment is growing at nearly 5 times the rate, and revenues are increasing at a similar rate.
Figure 1: Percent Change Among Women-Owned Firms, 2002-2012

The Growth & Development of Women-Owned Enterprises in the U.S: 2002-2012 4
Women-owned businesses comprise 35.8% of the country’s businesses, employ 7.3%
of the private-sector workforce, and contribute 4.2% of business revenues.
Ten years prior,
women-owned firms
represented 28.2%
of the country’s
businesses and
contributed a similar
6.5% of
employment and
4.2% of revenues.
Thus, while growing
in number at a
faster than average
pace, the relative
economic clout of
women-owned
businesses has
remained
unchanged.
Growth in Share of Firms That Are
Women-Owned, 2002-2012
2002 2007
All other Women-owned
2012
28.2% 28.7% 35.8%
The share of U.S. businesses that are women-owned has risen strongly, especially since 2007, and now stands at nearly 36%.
Growth in Share of
Women-Owned Firms, 2002-2012
2002 2007 2012
4.2 4.2 4.2
6.5 6.4 7.3
28.2 28.7
35.8
% S
ha
re, W
OB
vs. A
ll F
irm
s
Revenues Employment Number of Firms
While the share of firms that are women-owned has risen strongly, The share of revenues and employment contributed by women-owned firms has not.
Figure 2: Growth in Share of Firms That are Women-Owned, 2002-2012
Figure 3: Growth in Share of Women-Owned Firms, 2002-2012

The Growth & Development of Women-Owned Enterprises in the U.S: 2002-2012 5
However, when the economic contributions of women-owned firms are compared with
all privately-held firms – excluding large publicly-traded firms – there has been an
increase in the employment and revenue contributions of women-owned firms. Between
2002 and 2012, women-owned firms increased from comprising 28.9% to 36.3% of all
privately-held firms, and now contribute 15% of employment in privately-held firms (up
from 12.9% in 2002) and 11.9% of revenue (up from 10.7%).
It should be noted here that the data in this report focus only on majority women-owned
firms – that is, enterprises in which a woman or women own 51% or more of the
business. Equally-owned firms (those in which a man and a woman split ownership of
an enterprise 50-50) are excluded – not only because equally-owned firms are a
separate category of businesses, but because the way that equally-owned firms have
been identified by the U.S. Census Bureau has changed in each SBO since 1997,3
making it virtually impossible to analyze trends over time or to combine the population of
these firms with majority women-owned firms to look at the population of women- and
equally-owned firms.
3 In 1997, gender share of ownership was determined at the company level through administrative
records. Starting in 2002, ownership was determined at the personal (owner) level by asking the gender of the top three owners of a company (virtually all firms have three or fewer owners). This methodological improvement resulted in a drop in the number of equally-owned firms. In 2007, gender of the top four owners was used to determine gender status of ownership, resulting in an increase in the number of equally-owned firms. Then in 2012, equal ownership was again determined through administrative records rather than by surveying owners, resulting in a drop in the number to a level on a par with the 2002 number.

The Growth & Development of Women-Owned Enterprises in the U.S: 2002-2012 6
It is also worth
noting that the
pace of business
formation among
women is on the
rise. Indeed,
between 1997
and 2002, the
number of
women-owned
firms grew by
19.8%, and between 2002 and 2007 the number increased by a similar 20.1%. Then,
between 2007 and 2012, the number of women-owned firms increased by 26.8% – a
significant uptick in business start-ups.
Looking at this trend to determine the average number of net new women-owned firms
per day finds that, between 2002 and 2007, an average of 714 net new women-owned
firms were launched each day. Business starts are now well above that mark. Between
2007 and 2012, an average of 1,143 net new women-owned businesses were launched
each day. Over the entire ten-year period, women launched an average of 928 net new
firms each and every day.
Trend in the Number of Net New
Women-Owned Firms Per Day, 2002-2012
2002-2007 2007-2012 2002-2012
714
1,143
928
# N
et
Ne
w W
OB
s p
er
Da
y
Nearly 1,000 women-owned firms are launched each day, and the pace has picked up since the recession, with 1,143 net new women-owned firms per day in the 2007-2012 period.
Figure 4: Trend in the Number of Net New Women-Owned Firms Per Day, 2002-2012

The Growth & Development of Women-Owned Enterprises in the U.S: 2002-2012 7
Table 2 in the Summary Tables section contains the average number of net new
women-owned firms launched per day by state, top metropolitan area, and among
minority women-owned firms for the full ten-year period of 2002 to 2012 as well as for
the 2002-2007 and 2007-2012 periods.

The Growth & Development of Women-Owned Enterprises in the U.S: 2002-2012 8
The Economic Clout of Women-Owned Firms
Employment Most U.S. businesses, whether or not they are women-owned, are quite small. With
respect to employment, 81% of all firms, and 91% of women-owned firms, have no paid
employees in addition to the owner, and this has been the case for decades. The
number of non-employer women-owned firms is growing faster than the number of
women-owned employers, however. Compared to an overall increase of 52% in the
number of women-owned firms between 2002 and 2012, the number of non-employer
women-owned firms is up 57% while the number of employer firms has increased by
13%.
Less than 1% of
all U.S.
businesses, as
well as less than
1% of women-
owned firms,
employ 50 or
more workers.
Distribution of the Number and
Employment of Women-Owned Firms
Share of Firms Share of Jobs
10+
1-9
0 employees
91% of firms provide 0 jobs
in addition to owner
2% of firms provide
¾ of jobs
Less than 2% of women-owned firms employ 10 or more people; those firms account for nearly ¾ of the jobs provided by women-owned firms.
Figure 5: Distribution of the Number and Employment of Women-Owned Firms

The Growth & Development of Women-Owned Enterprises in the U.S: 2002-2012 9
Indeed, only 2% of women-owned firms employ 10 or more workers. However, while
representing a small share of the women-owned firm population, these businesses
employ fully three-quarters (74%) of the people employed in women-owned firms.
At the higher end of the employment size spectrum, 50+-employee firms represent less
than 1% of the woman-owned firm population. However, it is important to point out that
these firms are currently growing in number at rates greater than the national average.
Between 2002 and 2012, the number of women-owned firms employing 50 or more
workers increased by 19%, compared to just a 1% increase among all 50+-employee
firms.
Indeed, given the fact that the number of women-owned firms overall is growing at a
rate 2-1/2 times the national average (52% compared to 20%), the number of women-
owned firms in nearly every employment size category is increasing at a faster rate than
the national average. Only among businesses employing between 10 and 19 workers
(3% of the overall business population) is the rate of firm growth overall (+60%) greater
than firm growth among women-owned firms (16%).
As previously mentioned, the number of women-owned employer firms (which now
numbers over one million) has increased by 13% between 2002 and 2012. And while
this is much less than the 57% increase in the number of women-owned non-employer
firms, it is much stronger than the 1.8% decline seen in the number of all U.S. employer
firms over the same period.

The Growth & Development of Women-Owned Enterprises in the U.S: 2002-2012 10
Payroll Payroll in women-owned employer firms now stands at $263.7 billion, up 52% between
2002 and 2012. In contrast, U.S. enterprise payroll overall is up a lesser 37% over the
same period.
Comparing the
growth in payroll
in women-owned
employer firms
with that of all
U.S. employers
finds women-
owned employers
increasing payroll
at a faster rate in
every industry sector with at least 2% of the women-owned firm population. The largest
gender gap in payroll growth is seen in professional/ scientific/technical services, where
payroll has increased 24% among women-owned employers but only 6% overall.
With respect to owner ethnicity, minority women-owned employers have boosted payroll
by 135% between 2002 and 2012, whereas payroll in minority employers overall has
only grown by 12%. Only among Native American/Alaska Native-owned firms does
Growth in Payroll in Women-Owned
and All Employer Firms, 2002-2012
37
52
All firms
Women-owned
Percent Change
Payroll in women-owned employer firms increased at a rate nearly 50% higher than among all employer firms between 2002 and 2012.
Figure 6: Growth in Payroll in Women-Owned and All Employer Firms, 2002-2012

The Growth & Development of Women-Owned Enterprises in the U.S: 2002-2012 11
payroll growth among women employers lag overall payroll growth. Among every other
minority group, women employers are boosting payroll at faster than average rates.
Revenues As it is with employment, most U.S. businesses are small with respect to revenues.
Fully 82% of all enterprises in the U.S. generate less than $100,000 in annual revenues,
as do 89% of
women-owned
firms. At the other
end of the size
spectrum, just 8%
of all firms and 3%
of women-owned
firms generate
$500,000 or more
in annual revenues
– including the 5%
of all U.S. firms and
just under 2% (1.7%) of women-owned firms that generate $1 million or more in
revenues annually.
Distribution of the Number and
Revenues of Women-Owned Firms
Share of Firms Share of Revenues
$500K+
$100-499K
<$100,000
3% of firms generate
¾ of revenues
Just 3% of women-owned firms generate $500,000 or more in revenues; those firms account for over ¾ of the revenues contributed by women-owned firms.
Figure 7: Distribution of the Number and Revenues of Women-Owned Firms

The Growth & Development of Women-Owned Enterprises in the U.S: 2002-2012 12
As with employment, the small share (3%) of women-owned firms with $500,000 or
more in revenues is contributing three-quarters (77%) of total revenues accounted for
by women-owned enterprises.
Further, over the 2002-2012 period, the number of women-owned businesses with $1
million or more in revenues has increased by 46.9%, compared to a 17.7% increase
among all million-dollar enterprises.
Despite this positive relative growth in the number of women-owned firms at the high
end of the revenue spectrum, the average revenue per firm of $1 million+ women-
owned firms is up only slightly from 2002 to 2012, from $5.4 to $5.7 million. Among all
women-owned firms, average revenue per firm has declined slightly over the same
period, from $144,969 in 2002 to $143,731 in 2012. This compares to average revenues
of $440,190 among all privately-held firms and $1,213,944 among all firms (including
large, publicly-traded firms – which average $48.2 million in per-firm revenues).
Among the 1 million women-owned employer firms, average revenues per firm stand at
$1,149,598, up from $875,847 per firm in 2002. Average revenues per firm among all
U.S. employer businesses stand at $5,990,509. Thus, average per-firm revenues
among women-owned employers stand at 19% of the overall average, while per-firm
revenues among all women-owned businesses are 12% of that among all U.S.
businesses.

The Growth & Development of Women-Owned Enterprises in the U.S: 2002-2012 13
Tables 3 and 4 detail the growth in number, employment and revenues of women-
owned firms by employment size class and revenue size class.
Growing Ethnic Diversity
One of the most remarkable trends in women’s entrepreneurship in recent years is the
phenomenal growth in the number of firms owned by women of color. In 2002, there
were fewer than one million (909,097) minority women-owned firms in the U.S.,
representing one in seven (14%) women-owned firms. As of the 2012 Survey of
Business Owners,
there are nearly
3.8 million
(3,777,279) firms
owned by women
of color,
comprising nearly
four in ten (38%)
women-owned
businesses.
Put another way,
over the 2002 to 2012 period, when the number of women-owned firms overall
increased by 52%, the number of non-minority women-owned firms grew by just 9%
Women of Color are Leading the Wave
in Entrepreneurship Among Women
52.2
9.2
67.4
120.6 136.1
171.8 178.1
All
Non
-minor
ity
Nat
ive
Am
erican
/Ala
ska
Asian
Am
erican
Nat
ive
Haw
aiia
n/Pac
ific
Latin
a
Afri
can Am
erican
% C
hang
e in #
Fir
ms, 2
00
2-1
2
The growth in the number of minority women-owned firms exceeds that of all women-owned firms by wide margins – at rates from 2 to nearly 4 times the overall growth rate.
Figure 8: Women of Color are Leading the Wave in Entrepreneurship Among Women

The Growth & Development of Women-Owned Enterprises in the U.S: 2002-2012 14
while increases in the number of women-owned firms in each minority group exceed the
overall average significantly – meaning that women of color are leading the wave of new
business starts among women.
There are 1,521,494 African American women-owned firms in the U.S., employing
316,977 workers and generating over $42 billion ($42,225,349,000) in revenues.
Between 2002 and 2012, when the number of all women-owned businesses increased
by 52.2%, the number of African American women-owned firms skyrocketed by 178.1%.
Further, employment in those firms grew by 79.7% and revenues rose 104.3%. Women
own fully 58.9% of all African American-owned firms, employ 32.5% of the workers
employed in African American-owned firms, and generate 28.1% of the revenues of
these firms.
There are 1,469,991 Latina-owned firms in the U.S., employing 470,726 workers and
generating nearly $79 billion ($78,679,717,000) in revenues. Between 2002 and 2012,
when the number of all women-owned businesses increased by 52.2%, the number of
Latina-owned firms skyrocketed by 171.8%. Further, employment in those firms grew by
66.5% and revenues rose 123.1%. Women own 44.5% of all Latino-owned firms,
employ 20.2% of the workers employed in Latino-owned firms, and generate 16.6% of
the revenues of these firms.
There are three-quarters of a million (749,197) Asian American women-owned firms in
the U.S., employing 804,276 workers and generating $136 billion ($135,676,380,000) in

The Growth & Development of Women-Owned Enterprises in the U.S: 2002-2012 15
revenues. Between 2002 and 2012, the number of Asian American women-owned firms
grew at more than twice the pace (120.6%) of all women-owned businesses (52.2%).
Further, employment in those firms grew by 89.2% and revenues rose 152.9%. Women
own 39.1% of all Asian American-owned firms, employ 22.5% of the workers employed
in Asian American-owned firms, and generate 19.4% of the revenues of these firms.
There are 131,064 Native American/Alaska Native women-owned firms in the U.S.,
employing 55,011 workers and generating $9 billion ($9,057,458,000) in revenues.
Between 2002 and 2012, the number of Native American/Alaska Native women-owned
firms grew by 67.4%, employment in those firms grew by 11.3% and revenues rose
57.2% - all not too dissimilar than the rates among all women-owned firms. Women own
48% of all Native American/Alaska Native-owned firms, employ 26.4% of the workers
employed in Native American/Alaska Native-owned firms, and generate 23.3% of the
revenues of these firms.
There are 24,982 Native Hawaiian/Pacific Islander women-owned firms in the U.S.,
employing 11,701 workers and generating nearly $2 billion ($1,879,024,000) in
revenues. Between 2002 and 2012, the number of Native Hawaiian/Pacific Islander
women-owned firms grew by 89.1%, employment in those firms grew by 33% and
revenues rose 90.1%. Women own 45.6% of all Native Hawaiian/Pacific Islander-owned
firms, employ 30% of the workers employed in Native Hawaiian/Pacific Islander-owned
firms, and generate 23.1% of the revenues of these firms.

The Growth & Development of Women-Owned Enterprises in the U.S: 2002-2012 16
All told, women are playing a greater role in minority-owned than in non minority-owned
businesses – owning 48% of minority-owned businesses (versus 32% of non minority-
owned firms), employing nearly one in four (22.4%) workers (as opposed to 14%) and
generating 19.2% of minority-owned firm revenue (compared to just 11%).
Table 5 details the trends in growth among minority women-owned firms between 2002
and 2012.

The Growth & Development of Women-Owned Enterprises in the U.S: 2002-2012 17
Female Veteran-Owned Firms
As the number of women serving in the military increases, it stands to reason that the
number of female veterans who launch businesses would rise as well. In 2009, there
were 1.5 million female veterans, 8% of all veterans. Just four years later, as of 2013,
there were 2.2 million female veterans, 10% of all veterans. This represents a 47%
increase in the number of female veterans in just four years, and that number is
expected to grow. One projection estimates that the veteran population will be over 16%
female by the
year 2043.4
In 2007, there
were 97,114
veteran women-
owned firms in
the U.S.,
representing 4%
of all veteran-
owned firms. As
of 2012 there are
now 383,302 veteran women-owned firms, comprising 15% of all veteran-owned firms.
4 Source: U.S. Department of Veterans Affairs, Center for Women Veterans
Percent Growth of Female, All
Veteran-Owned Firms, 2007-2012
3
-13.2 -6.4
294.7
46.9
13.6
Number of Firms Employment Revenues
Pe
rce
nt
Ch
ange
All Veteran-Owned Female Veteran-Owned
The number of female veteran-owned firms nearly quadrupled between 2007 and 2012; growth in number, employment and revenues far outpaced that of all veteran-owned firms.
Figure 9: Percent Growth of Female, All Veteran-Owned Firms, 2007-2012

The Growth & Development of Women-Owned Enterprises in the U.S: 2002-2012 18
Between 2007 and 2012, when the number of all veteran-owned businesses increased
by 3% – from 2.4 to 2.5 million – the number of female veteran-owned businesses
increased by a phenomenal 295%, a near quadrupling in numbers in just five years.
These 383,302 female veteran-owned businesses employ 102,662 workers and
generate nearly $18 billion ($17,950,613,000) in revenues. Over the past five years,
employment in veteran women-owned firms has increased 46.9%, compared to an
11.2% increase in employment among all women-owned firms. Revenues among
veteran women-owned firms have grown less strongly than among all women-owned
firms, however: 13.6% between 2007 and 2012 compared to 18.1% revenue growth
overall.
Firms owned by female veterans are smaller than the average woman-owned firm. They
employ 0.27 employees per firm on average, compared to 0.85 among all women-
owned firms (meaning, of course, that the vast majority of these firms have no
employees other than the owner). The average revenues per veteran woman-owned
firm are $46,832, compared to $143,731 among all women-owned firms.
Veteran women-owned firms may be smaller than the average woman-owned firm not
only because of their relative newness to business ownership, but by virtue of their
industry composition. Looking at the most populous industry sectors finds that veteran
women-owned firms are more likely than the average woman-owned firm to be found in
the other services sector (22% versus 19%) – a sector that includes personal care

The Growth & Development of Women-Owned Enterprises in the U.S: 2002-2012 19
services such as beauty and nail salons, drycleaners, automotive and appliance repair,
and pet-sitting companies. They are just as likely as average to own firms in health care
and social assistance (16% and 16%), administrative support and waste management
services (12% versus 11%), or in retail trade (10% and 11%). Female veteran-owned
firms are less likely than the average woman-owned business (11% versus 14%) to be
in professional/scientific/technical services, which includes such higher-paying
professions as attorneys, accountants, and management consultants.
Table 6 details the trend in growth in the number, employment and revenues of female
veteran-owned businesses nationally and by industry sector.

The Growth & Development of Women-Owned Enterprises in the U.S: 2002-2012 20
Industry Trends
Distribution The types of businesses owned and operated by women are diverse – and have
become much more so over the past 20 years. In fact, 2% or more of the nearly 10
million women-owned firms are found in 13 of the 19 major industries – including over
260,000 women-owned construction firms, over 200,000 women-owned finance and
insurance firms, and nearly 160,000 women-owned transportation and warehousing
enterprises.
Despite this growing diversity, however, nearly half (49%) of women-owned firms are
found in three sectors, and nearly three-quarters (70%) are found in the five most
populous industries – all home to one million or more women-owned firms. They are:
Other services (including auto/equipment repair, beauty salons, dry cleaning,
funeral homes, pet care): 1,885,222 women-owned firms comprising 19.1% of all
women-owned firms
Health care and social assistance (including dentists, doctors, diagnostic labs,
home health care, nursing homes, child day care): 1,603,094; 16.2%
Professional/scientific/technical services (including accountants, architects,
engineering services, interior design, management consulting, public relations
agencies): 1,334,561; 13.5%
The Growth & Development of Women-Owned Enterprises in the U.S: 2002-2012 21
Administrative, support and waste services (including executive search firms,
temporary help agencies, travel agencies, janitorial services, landscaping
services): 1,080,092; 10.9%
Retail trade: 1,045,322; 10.6%
Between 2002 and 2012, the greatest growth in the number of women-owned firms, in
industries
comprising 2% or
more of women-
owned firms, is
found in these
three sectors:
educational
services (+90.5%),
administrative
services (+89.7%)
and other services
(+85.6%). Each of
these sectors has seen the number of women-owned firms nearly double during the
past decade – a rate of growth nearly twice that of all women-owned firms (52.2%). It
should be pointed out, however, that the growth in the number of women-owned
businesses tops overall growth in every major business sector over the 2002 to 2012
period.
Growth in the Number of Women-Owned,
All Firms by Industry, 2002-2012
-10 10 30 50 70 90
Other svcs
Accomm/Food Svc
Arts/Ent/Rec.
Health care
Educ Svcs
Admin Svcs
P/S/T Svcs
Real Estate
Finance/Insurance
Transportation
Retail Trade
Wholesale Trade
Construction
All
Percent Change
Women-owned
All Firms
Note: Selected industries, containing 2%+ women-owned firms
Between 2002 and 2012, growth in the number of women-owned firms exceeded that of all firms in every major industry sector, with the largest gender gap seen in administrative services.
Figure 10: Growth in the Number of Women-Owned, All Firms by Industry, 2002-2012

The Growth & Development of Women-Owned Enterprises in the U.S: 2002-2012 22
Detailed Industry Trends Given the fact that several industry sectors – administrative support services,
professional/scientific/technical services, health care and social assistance and other
services most particularly – are home to a large or fast-growing share of the women-
owned business population, it is useful to investigate what types of businesses within
each of these sectors are growing most significantly. So within these four sectors,
trends within the top 4-digit NAICS codes were investigated.5
In other services, home to the greatest number of women-owned businesses and the
third fastest-growing sector, two detailed industries comprise nearly all women-owned
firms in this sector:
Personal care services (nearly 1 million firms, 53% of the women-owned firms in
other services) and
Other personal services (over 700,000 women-owned firms, 39% of the women-
owned firms in the sector).
Between 2007 and 2012, when the number of women-owned firms on other services
increased by 51%, the number of women-owned personal care services firms (home to
such businesses as beauty and nail salons and weight-loss centers) increased by 65%,
while the number of women-owned firms in other personal services (home to a diverse
5 NAICS is the abbreviation for the North American Industrial Classification System. Educational services
was included initially, but detailed 4-digit breakouts were not available for 2002 or 2007. In addition, detailed 2002 4-digit data were only available by gender within professional/scientific/technical services, so only 2007 to 2012 trend analysis was possible for the other sectors.

The Growth & Development of Women-Owned Enterprises in the U.S: 2002-2012 23
array of businesses such as pet-sitting services, photo finishing labs and parking lots)
grew by 40% - lower than the sector average but still greater than the national average
of 27% over the 5-year period.
Over eight in ten of the 1.6 million
women-owned firms in the health care
and social assistance sector are found
in three detailed industries:
Child day care services (over
600,000 firms, 41% of the
women-owned firms in the
sector);
Professional health care
providers (doctors, dentists,
other health practitioners such as optometrists, physical therapists and mental
health practitioners: over 400,000, comprising 26% of women-owned firms in the
sector); and
Home health care service providers (nearly 300,000, 17% of the sector).
Among those three detailed industry sectors, home health care services is the fastest-
growing by far: an 84% increase in the number of women-owned firms in this sector
since 2007, compared to a 25% increase among professional medical professionals and
19% among child day care providers.
Growth in Number of Women-Owned Firms by Detailed Industry Sector, 2007-2012
Industry Percent Growth,
2007-2012
All industries 27%
Other Services Personal care services Other personal services
51 65 40
Health Care & Social Assistance Home health care services Health care providers Child day care services
30 84 25 19
Professional/Scientific/Technical Services Legal services Other p/s/t services Accounting, tax preparation, payroll services Management, scientific, technical consulting
22
29 28 24
19
Administrative, Support and Waste Management Services Services to buildings and dwellings Office administrative services
37
52
36

The Growth & Development of Women-Owned Enterprises in the U.S: 2002-2012 24
Four industries in the professional/scientific/technical services sector account for three-
quarters (76%) of the firms in the sector:
Other professional/scientific/technical services (nearly 400,000 firms, 30% of the
sector, including market research, professional photography, translation services
and veterinarians);
Management, scientific and technical consulting services (over 250,000 firms,
19% of the sector, including administrative and human resources consulting,
management consulting and environmental consulting);
Accounting, tax preparation and payroll services (nearly 230,000 firms, 17% of
the sector, including certified public accountants and bookkeepers); and
Legal services (over 130,000 firms, 10% of the total, including attorneys, notaries
and title companies).
Among these four detailed industries, the legal services sector is the fastest-growing,
with a 29% increase between 2007 and 2012, close to the national average of 27%.
Finally, there are two detailed industry sectors that comprise three-quarters (74%) of the
women-owned firms in the administrative, support and waste management services
sector:
Services to buildings and dwellings (over 650,000 firms, 61% of women-owned
firms in the sector, including such businesses as janitorial and landscaping
services, pest control, and carpet cleaning); and

The Growth & Development of Women-Owned Enterprises in the U.S: 2002-2012 25
Office administrative services (147,000 firms, 13% of the sector).
Both of these sectors are growing in number at rates exceeding the national average;
with a 52% increase in services to buildings and dwellings and a 36% increase in office
administrative services.
All told, then, the fastest-growing sectors for women-owned businesses, in terms of the
number of firms being launched since 2007, are:
Home health care services (+84%);
Personal care services (hair and nail salons, +65%); and
Services to buildings and dwellings (janitorial and landscaping services, +52%).
Thus, despite the growing diversity of women-owned businesses, some of the
foundational sectors that were home to women-owned businesses in earlier generations
remain popular today.
Scalability As previously discussed, the vast majority of businesses – whether or not they are
women-owned – are quite small, employing no one in addition to the owner and
generating less than $100,000 in revenue. However, it can be seen from the data that
some industries are more scalable than others.

The Growth & Development of Women-Owned Enterprises in the U.S: 2002-2012 26
Overall, just 3% of women-owned firms (and 9% of all U.S. businesses) generate
$500,000 or more in revenues. Women-owned firms in the following five industries are
significantly more likely than average to have achieved revenues of $500,000 or more,
and have higher than average revenues ($143,731 among all women-owned firms).
They are:
Wholesale trade: 18% of women-owned firms top $500,000 in revenues, with
average revenues per firm of $1.8 million;
Manufacturing: 13%, $890,000;
Accommodation and food services: 12%, $260,000;
Construction: 10%, $350,000; and
Transportation and warehousing: 6%, $279,000.
Among these five “most likely to scale” sectors, women-owned firms stand toe-to-toe
with their peers – in terms of the share that have achieved $500,000 or more in
revenues – in two industries. Ten percent of both women-owned and all construction
businesses exceed the $500,000 revenue mark, as do 6% of women-owned and all
transportation and warehousing firms.
However, it is important to note that the women-owned firms in these five most likely to
scale sectors comprise just over one in ten (11%) of all women-owned firms. Within the
other services sector, home to 19% of women-owned firms, average revenues stand at
just $32,000 per firm.

The Growth & Development of Women-Owned Enterprises in the U.S: 2002-2012 27
Other sectors with lower than average revenues per firm include:
Educational services: 4% of women-owned businesses, average revenues of
$39,000 per firm;
Arts, entertainment and recreation: 5%, $43,000;
Administrative, support and waste management services: 11%, $74,000; and
Health care and social assistance: 16%, $82,000.
Thus, some of the most highly populated sectors for women-owned businesses are also
among the smallest in terms of annual revenues. Raising the overall economic clout of
women-owned businesses would then require a two-pronged approach: 1) assist
women in the more populous, lower per-firm revenue sectors in scaling-up their
enterprises, and 2) attract more women to start businesses in the less populous but
more likely to scale sectors.
Concentration Overall, as stated previously, 36% of all businesses in the country are majority women-
owned. In three industry sectors, however, women own the majority of firms. Over six in
ten (62.5%) businesses in health care and social assistance are women-owned, as are
54.2% of educational services firms and 50.6% of firms in other services. Women are
also more likely than average to own businesses in administrative, support and waste
services (46.7%) and retail trade (41.5%).

The Growth & Development of Women-Owned Enterprises in the U.S: 2002-2012 28
At the other end of the concentration spectrum, women own just 13% of firms in the
transportation and warehousing sector and 9% of construction businesses.
Tables 7, 8, and 9 provide detailed information on trends in the growth of women-owned
businesses by industry sector.

The Growth & Development of Women-Owned Enterprises in the U.S: 2002-2012 29
Geographic Trends
The ten states home to the greatest number of women-owned firms are:
California: 1,320,085
Texas: 866,678
Florida: 807,817
New York: 725,709
Illinois: 417,500
Georgia: 376,506
Michigan: 306,986
Ohio: 306,824
Pennsylvania: 304,803
North Carolina: 287,058
Nationally, the
number of
women-owned
firms increased
by 52.2%
between 2002
and 2012. The
ten states with
the greatest
percent growth in
the number of
State Comparison of Growth in Number of Women-Owned Firms, 2002-2012
Alaska
District of Columbia
Hawaii
Growth >10 pts above average (63%+)
Growth w/in 10 pts of avg (42-62%)
Growth 10+ pts below avg (<42%)
Southern states have seen the strongest growth in the number of
women-owned firms between 2002
and 2012; GA is fastest-growing, MA
slowest-growing.
Figure 11: State Comparison of Growth in Number of Women-Owned Firms, 2002-2012

The Growth & Development of Women-Owned Enterprises in the U.S: 2002-2012 30
women-owned firms over that period are listed below. Nearly all are located in the
South:
Georgia: 91.9%
Mississippi: 89.3%
Texas: 84.9%
Florida: 84.7%
Louisiana: 73.9%
Nevada: 73.1%
District of Columbia: 72.7%
South Carolina: 71.6%
Alabama: 68.2%
Arizona: 66.2%
Conversely, the ten states with the lowest rates of growth in the number of women-
owned firms are listed below, and are depicted in black in the map on the previous page.
Most are located in New England or the Midwest:
Massachusetts: 23.0%
Vermont: 23.3%
New Hampshire: 24.2%
West Virginia: 24.8%
Minnesota: 27.4%
Wisconsin: 28.5%
Iowa: 29.0%
Kansas: 29.4%
Maine: 29.4%
Connecticut: 29.9%
While business growth is, generally speaking, positively correlated with overall
population growth, other factors (such as population demographics and
economic/business development policy support) enter into the picture as well. Six of the
top ten fastest-growing states for women-owned firms (Georgia, Texas, Florida, Nevada,

The Growth & Development of Women-Owned Enterprises in the U.S: 2002-2012 31
South Carolina, Arizona) are also among the ten fastest growing states in terms of
overall population (between the two most recent decennial censuses – 2000 to 2010),
so women’s entrepreneurship there could be said to be supported by a growing
population of would-be entrepreneurs.
In comparison, the growth in the number of women-owned firms in Mississippi,
Louisiana, the District of Columbia and Alabama is outpacing overall population growth,
so other factors, such as entrepreneurship policy or the age or educational distribution
of the population, may be playing a greater role in those areas.
Bucking population trends in the other direction, population growth in Utah, Idaho, North
Carolina and Colorado puts these states in the top ten fastest-growing states. However,
growth in the number of women-owned firms in those states does not put them in the
top ten – so these states could be said to be underperforming relative to overall
population growth trends. The growth in the number of women-owned firms is above the
national average in Utah, Idaho and North Carolina, however, but is below the national
average in Colorado.
Looking within state-level growth at trends in the 50 most populous metropolitan areas
finds that these ten metro areas are home to the greatest number of women-owned
firms:

The Growth & Development of Women-Owned Enterprises in the U.S: 2002-2012 32
New York City: 783,597
Los Angeles: 558,831
Miami: 355,762
Chicago: 340,336
Atlanta: 242,721
Dallas: 235,520
Houston: 234,450
Washington, DC: 221,974
San Francisco: 173,702
Detroit: 157,090
Between 2002 and 2012, these ten metropolitan areas have experienced the greatest
growth in the number of women-owned firms:
Memphis: 160.4%
Charlotte: 138.4%
Orlando: 126.7%
Las Vegas: 101.2%
San Antonio: 101.2%
Houston: 99.5%
Miami: 96.8%
Atlanta: 95.6%
Austin: 91.4%
Dallas: 85.0%
All of these fast-growing metro areas are located in the South or West, and four out of
ten are located within the state of Texas. It is important to note, however, that
metropolitan boundaries often change in the wake of each decennial census. The 2012
SBO reflects those changes, which have altered the boundaries of 19 of the top 50
metropolitan areas.6
Important geographic trends in the growth of women-owned businesses are found in
Tables 10, 11, and 12.
6 Four metro areas (Charlotte, Louisville, Minneapolis, Richmond) saw the addition or deletion of three or more
counties.

The Growth & Development of Women-Owned Enterprises in the U.S: 2002-2012 33
Pre-Post Recession Growth
Nationally, business starts – like annual Gross Domestic Product growth – have picked
up in the wake of the 2007-2009 recession. Between 2007 and 2012, the number of all
U.S. firms increased by 6.7%, compared to a 5.2% increase during the pre-recession
2002-07 period. Among women-owned firms, the post-recession growth has been even
stronger: a 26.8% increase in the number of women-owned firms between 2007 and
2012, compared to a 20.1% increase from 2002 to 2007 – a difference of nearly 7
percentage points.
Comparing the
growth rates in
the number of
women-owned
firms between
these two five-
year periods can
be an instructive
way to ascertain
where women-
owned firms have
“bounced back” from the recession and where they have not. Geographically, 19 states
(shaded blue in the map above) are seeing the growth in the number of women-owned
Comparison of Growth in Number of Women-Owned Firms,
2007-12 vs. 2002-07
Alaska
District of Columbia
Hawaii
2007-12 growth 10+ pts above 2002-07
2007-12 growth 0-9 pts of 02-07 growth
2007-12 growth < 2002-07 growth
Women-owned firms in the Central U.S. have bounced back most strongly from
the recession; growth in 10 states
remains below 2002-07 levels.
Figure 12: Comparison of Growth in Number of Women-Owned Firms, 2007-12 vs. 2002-07

The Growth & Development of Women-Owned Enterprises in the U.S: 2002-2012 34
businesses in the most recent 2007-2012 period at least 10 points higher than the
growth during the pre-recession 2002-2007 period, including six states (Louisiana,
Nebraska, Iowa, North Dakota, Indiana, and Mississippi) and the District of Columbia
which are enjoying 2007-12 growth rates more than 15 points higher than 2002-07 rates.
In 22 states (shaded light grey) post-recession growth rates are even or up less than 10
points than pre-recession rates, and in 10 states (shaded in black) the growth in the
number of women-owned businesses currently is below the 2002-2007 growth rate.
These 10 states are not geographically concentrated.
Among the 50 most populous metropolitan areas, 20 are seeing women-owned firm
growth in the 2007-12 period 10 points or higher than in the 2002-07 period, 16 are
even or up less than 10%, and in 14 metro areas the growth in the number of women-
owned firms from 2007 to 2012 is less than the growth rates seen between 2002 and
2007.
Nine of the metro areas that have not “bounced back” are underperforming the recovery
of their states. They are:
Birmingham, AL
Chicago, IL
Oklahoma City, OK
Orlando, FL
Richmond, VA
Riverside, CA
Sacramento, CA
San Antonio, TX
Tampa/St. Petersburg, FL

The Growth & Development of Women-Owned Enterprises in the U.S: 2002-2012 35
On the other hand, 11 metro areas are doing better than their states with respect to the
growth in the number of women-owned firms now compared to prior to the recession:
Buffalo, NY
Charlotte, NC
Denver, CO
Detroit, MI
Hartford, CT
Jacksonville, FL
Los Angeles, CA
Miami, FL
New York, NY
Phoenix, AZ
Portland, OR
In terms of pre-post recession growth in the number of women-owned firms by industry
sector, women-owned firms in other services (+27), accommodation/food services (+23),
and retail trade (+17) are increasing in number faster now than they were prior to the
recession. Conversely, growth in the number of women-owned firms in construction (-
34), real estate (-22) and transportation and warehousing (-17) is lower over the 2007-
12 period than during the 2002-07 period.
Finally, while growth in the number of firms owned by women of color is far outpacing
that among all women-owned firms over the entire 2002-2012 period – among each and
every ethnic group – it is worth noting that growth in the number of Asian American
women-owned firms is 11 points lower in the 2007-12 period than during the 2002-07
period (43% vs. 54%), while Native Hawaiian/Pacific Islander (67% now vs. 41% prior,
for a difference of +26) and Latina-owned firms (87% vs. 46%, +41) are increasing in

The Growth & Development of Women-Owned Enterprises in the U.S: 2002-2012 36
number more strongly now than prior to the recession. These distinctions may be a
function of trends in the states or industries in which they are most likely to be found.
Table 13 details the pre-recession and post-recession change in the number of women-
owned firms by race/ethnicity, state, and major metropolitan area.

The Growth & Development of Women-Owned Enterprises in the U.S: 2002-2012 37
Implications
There is much to celebrate when looking at the recent trends in women’s
entrepreneurship seen in the U.S. Census Bureau’s 2012 Survey of Business Owners.
We see from the data that:
The number of women-owned businesses is growing at an increasing rate,
perhaps indicating an inflection point in women’s enterprise development;
The growing ethnic diversity of women-owned enterprises is nothing short of
phenomenal. Women of color now own nearly four in ten women-owned
businesses;
Industry diversity is also on the rise: the growth in the number of women-owned
firms exceeds sector averages in every major industry category;
The number of veteran women-owned firms has nearly quadrupled over the past
five years, and now comprise 15% of all veteran-owned businesses; and
Across the country, in every single state, the number of women-owned
businesses is growing at a rate faster than all firms in the state. Growth rates are
highest in the South, while a look at post-recession versus pre-recession growth
finds that women-owned firms in the Central U.S. have bounced back more
strongly from the recession.
Yet, despite these positive trends, we continue to see that women-owned firms remain
significantly smaller than the average firm – with the share of women-owned firms with
$1 million or more in revenues or 50 or more employees remaining small, and well
below average.

The Growth & Development of Women-Owned Enterprises in the U.S: 2002-2012 38
Part of this gap is due to industry distribution. While women in some industries are
scaling up and matching the revenue levels of their male peers – most notably in
construction and transportation and warehousing – many more women than average
are found in industry sectors in which businesses are typically smaller in size – owning
such businesses as child day care, beauty and nail salons and home or office cleaning
services.
However, part of the reason for a lack of measured growth at the high end of the
business spectrum lies in the very definition of a woman-owned business – which is a
firm that is 51% or more owned and operated by a woman or women. As a business
grows, especially past the million-dollar mark, ownership is more likely to be shared by
more than one individual – either through shared internal ownership among senior
managers or by virtue of outside equity investment. Identifying and studying women-led
enterprises (firms in which a woman or women own a plurality rather than a majority of
the firm, yet continue to run the day-to-day operations of the firm) would be a fruitful line
of inquiry, whether through additional analysis of Census data or survey research
among growth-oriented businesses.
The population of equally-owned businesses is another under-researched group; partly
because the way that population has been identified in each of the past four SBO
datasets has differed. (See our commentary on page 5 of this report for further detail.)

The Growth & Development of Women-Owned Enterprises in the U.S: 2002-2012 39
Greater consistency in the methodology by which these firms are defined – as well as
greater clarity of these definitional changes for data users – would aid in future analysis.
It is also worth noting that the share of non-employer women-owned firms continues to
rise. Whether this is a temporary phenomenon linked to the increasing rate of women
launching new ventures, or a more permanent issue linked to industry distribution or
entrepreneurial motivation is unclear, but is another area that warrants further
investigation.
And speaking of entrepreneurial motivation, do the reasons for entrepreneurship among
women, particularly opportunity versus necessity as drivers, differ according to ethnicity,
age or other factors?
Finally, is the increasing rate at which women are starting business enterprises a true
inflection point, or a temporary artifact of the recession?
The policy implications of these questions are quite important, as the answers could
impact the nature of support provided by Women’s Business Centers and other
entrepreneurial development providers, and highlight the possible need for targeted
outreach or the value of providing a more nuanced menu of technical assistance and
counseling as a firm grows. Therefore, while the 2012 SBO data give women’s business
advocates much to celebrate, it provides food for thought and raises important
questions.

The Growth & Development of Women-Owned Enterprises in the U.S: 2002-2012 40
Summary Tables
Table 1: Trend in Number, Employment and Revenue of U.S. Firms, 2002-2012
Total U.S.
Women-Owned Firms Percent Change,
2002-2012
% Share of All Firms,
2012 2002 2007 2012
Number of Firms 6,489,483 7,793,139 9,878,397 52.2% 35.8%
Employment 7,146,229 7,579,876 8,431,614 18.0% 7.3%
Sales ($000) $940,774,986 $1,202,115,758 $1,419,834,295 50.9% 4.2%
Men-Owned Firms
Number of Firms 13,184,033 13,906,658 14,844,597 12.6% 53.7%
Employment 42,428,508 41,701,315 41,132,111 -3.1% 35.7%
Sales ($000) $7,061,026,736 $8,574,060,362 $9,466,039,188 34.1% 28.2%
Equally-Owned Firms
Number of Firms 2,693,171 4,603,255 2,456,386 -8.8% 8.9%
Employment 5,663,453 8,152,650 6,494,837 14.7% 5.6%
Sales ($000) $731,447,044 $1,283,401,141 $1,078,204,389 47.4% 3.2%
All Privately-Held Firms
Number of Firms 22,480,432 26,304,486 27,179,380 20.9% 98.4%
Employment 55,427,792 57,260,527 56,058,563 1.1% 48.6%
Sales ($000) $8,793,351,161 $10,979,477,627 $11,964,077,872 36.1% 35.7%
Publicly-Traded/Other Firms
Number of Firms 494,253 805,533 446,980 -9.6% 1.6%
Employment 55,358,624 61,352,899 59,190,444 6.9% 51.4%
Sales ($000) $13,833,816,063 $19,196,411,634 $21,572,770,949 55.9% 64.3%
All Firms
Number of Firms 22,974,685 27,110,019 27,626,360 20.2% 100%
Employment 110,786,416 118,613,426 115,249,007 4.0% 100%
Sales ($000) $22,627,167,224 $30,175,889,261 $33,536,848,821 48.2% 100%

The Growth & Development of Women-Owned Enterprises in the U.S: 2002-2012 41
Table 2: Number of Net New Women-Owned Firms per Day, 2002-2012
2002-2012 2002-2007 2007-2012
Total US 928 714 1,143
Race/Ethnicity
All minority-owned 786 722 849
African American 267 200 334
Asian American 112 101 124
Latina 255 135 374
Native American/Alaska Native 14 10 19
Native Hawaiian/Pacific Islander 4 2 5
Non-minority 140 -8 288
State
Alabama 15 14 17
Alaska 2 1 2
Arizona 20 16 24
Arkansas 7 5 10
California 123 93 154
Colorado 16 14 19
Connecticut 7 6 7
Delaware 2 2 2
District of Columbia 3 2 4
Florida 101 79 124
Georgia 49 45 54
Hawaii 4 4 4
Idaho 4 4 5
Illinois 36 32 41
Indiana 12 6 18
Iowa 5 1 9
Kansas 5 3 7
Kentucky 8 5 11
Louisiana 18 9 26
Maine 3 3 2
Maryland 20 19 20
Massachusetts 10 9 12
Michigan 24 17 32
Minnesota 9 5 13
Mississippi 12 8 16
Missouri 12 6 17
Montana 3 2 4
Nebraska 4 1 6

The Growth & Development of Women-Owned Enterprises in the U.S: 2002-2012 42
Table 2: Number of Net New Women-Owned Firms per Day, 2002-2012
2002-2012 2002-2007 2007-2012
Nevada 10 9 11
New Hampshire 2 2 2
New Jersey 19 15 22
New Mexico 5 4 5
New York 60 49 72
North Carolina 31 28 34
North Dakota 2 1 3
Ohio 21 10 32
Oklahoma 8 5 11
Oregon 10 8 11
Pennsylvania 21 21 22
Rhode Island 2 2 2
South Carolina 15 12 18
South Dakota 2 1 4
Tennessee 21 13 29
Texas 109 77 141
Utah 8 7 8
Vermont 1 1 2
Virginia 22 19 24
Washington 14 11 16
West Virginia 2 1 3
Wisconsin 8 5 12
Wyoming 2 1 2
Top 50 Metro Areas Areas
Atlanta GA 33 28 37
Austin TX 8 7 10
Baltimore MD 9 9 9
Birmingham AL 4 4 3
Boston MA/NH 8 7 9
Buffalo NY 1 0 2
Charlotte NC/SC 12 8 16
Chicago IL/IN/WI 34 31 38
Cincinnati OH/KY/IN 4 4 4
Cleveland OH 5 2 9
Columbus OH 6 4 7
Dallas TX 30 23 36
Denver CO 9 6 12
Detroit MI 17 11 23

The Growth & Development of Women-Owned Enterprises in the U.S: 2002-2012 43
Table 2: Number of Net New Women-Owned Firms per Day, 2002-2012
2002-2012 2002-2007 2007-2012
Hartford CT 2 1 3
Houston TX 32 19 45
Indianapolis IN 7 4 9
Jacksonville FL 5 3 7
Kansas City MO/KS 4 3 5
Las Vegas NV 9 7 10
Los Angeles CA 58 35 82
Louisville KY/IN 2 1 3
Memphis TN/MS/AR 10 5 14
Miami FL 48 28 67
Milwaukee WI 3 2 4
Minneapolis/St. Paul MN/WI 8 5 10
Nashville TN 6 4 8
New Orleans LA 5 0 11
New York NY/NJ/PA 75 51 98
Oklahoma City OK 4 4 4
Orlando FL 14 12 16
Philadelphia PA/NJ/DE/MD 13 14 12
Phoenix AZ 14 7 21
Pittsburgh PA 3 2 4
Portland OR/WA 7 4 9
Providence RI/MA 2 2 3
Raleigh NC 4 4 5
Richmond VA 4 3 4
Riverside CA 16 14 18
Sacramento CA 4 5 3
St. Louis MO/IL 6 2 11
Salt Lake City UT 3 3 2
San Antonio TX 9 8 11
San Diego CA 9 7 10
San Francisco CA 13 9 17
San Jose CA 6 5 7
Seattle WA 8 6 11
Tampa/St. Petersburg FL 12 12 12
Virginia Beach VA/NC 4 4 5
Washington DC/VA/MD/WV 22 19 25

The Growth & Development of Women-Owned Enterprises in the U.S: 2002-2012 44
Table 3: Trend in Number, Employment, Revenues of Women-Owned Firms by Employment Size Class, 2002-2012
Women-Owned Firms % Change, 2002-2012
% Share 2012 2002 2007 2012
Total US
Number of Firms 6,489,483 7,793,139 9,878,397 52.2% 100.0%
Employment 7,146,229 7,579,876 8,431,614 18.0% 100.0%
Sales ($000) $940,774,986 $1,202,115,758 $1,419,834,295 50.9% 100.0%
No employees
Number of Firms 5,734,025 6,992,932 8,976,227 56.5% 90.9%
Employment - - - - 0.0%
Sales ($000) $160,244,074 $202,483,064 $252,832,626 57.8% 17.8%
1 to 4 employees
Number of Firms 461,896 499,625 562,451 21.8% 5.7%
Employment 939,479 978,484 1,116,714 18.9% 13.2%
Sales ($000) $113,455,460 $136,863,702 $167,857,339 47.9% 11.8%
5 to 9 employees
Number of Firms 149,063 151,544 170,715 14.5% 1.7%
Employment 970,986 988,001 1,117,915 15.1% 13.3%
Sales ($000) $96,553,311 $116,479,023 $142,299,740 47.4% 10.0%
10 to 19 employees
Number of Firms 82,942 85,462 96,241 16.0% 1.0%
Employment 1,105,339 1,138,798 1,282,913 16.1% 15.2%
Sales ($000) $103,155,850 $128,994,789 $155,442,173 50.7% 10.9%
20 to 49 employees
Number of Firms 43,244 44,694 51,036 18.0% 0.5%
Employment 1,269,752 1,322,941 1,510,231 18.9% 17.9%
Sales ($000) $118,005,642 $153,029,727 $190,060,871 61.1% 13.4%
50 to 99 employees
Number of Firms 11,072 11,413 13,324 20.3% 0.1%
Employment 750,562 770,967 909,264 21.1% 10.8%
Sales ($000) $74,405,956 $94,226,425 $120,696,785 62.2% 8.5%
100 to 499 employees
Number of Firms 6,578 6,918 7,583 15.3% 0.1%
Employment 1,195,043 1,290,103 1,410,068 18.0% 16.7%
Sales ($000) $114,737,129 $161,038,049 $193,651,299 68.8% 13.6%
500+ employees
Number of Firms 662 722 820 23.9% 0.0%
Employment 915,068 1,090,584 1,084,510 18.5% 12.9%
Sales ($000) $160,217,565 $209,051,547 $196,993,462 23.0% 13.9%

The Growth & Development of Women-Owned Enterprises in the U.S: 2002-2012 45
Table 4: Trend in Number, Employment, Revenues of Women-Owned Firms by Revenue Size Class, 2002-2012
Women-Owned Firms % Change, 2002-2012
% Share 2012 2002 2007 2012
Total US
Number of Firms 6,489,483 7,793,139 9,878,397 52.2% 100.0%
Employment 7,146,229 7,579,876 8,431,614 18.0% 100.0%
Sales ($000) $940,774,986 $1,202,115,758 $1,419,834,295 50.9% 100.0%
Less than $5,000
Number of Firms 1,831,186 2,217,918 2,497,048 36.4% 25.3%
Employment 30,666 86,288 5,959 -80.6% 0.1%
Sales ($000) $4,371,682 $5,084,937 $5,988,757 37.0% 0.4%
$5,000 to $9,999
Number of Firms 1,167,913 1,414,860 1,776,343 52.1% 18.0%
Employment 6,387 11,685 11,231 75.8% 0.1%
Sales ($000) $7,876,084 $9,588,410 $12,042,699 52.9% 0.8%
$10,000 to $24,999
Number of Firms 1,405,378 1,773,429 2,722,295 93.7% 27.6%
Employment 33,520 49,201 43,434 29.6% 0.5%
Sales ($000) $21,641,615 $27,241,168 $41,044,596 89.7% 2.9%
$25,000 to $49,999
Number of Firms 730,947 913,154 1,052,900 44.0% 10.7%
Employment 85,623 93,154 85,118 -0.6% 1.0%
Sales ($000) $25,408,298 $31,710,627 $36,476,822 43.6% 2.6%
$50,000 to $99,999
Number of Firms 495,516 591,823 681,243 37.5% 6.9%
Employment 237,803 212,717 211,841 -10.9% 2.5%
Sales ($000) $34,579,993 $41,252,436 $47,530,809 37.5% 3.3%
$100,000 to $249,999
Number of Firms 422,531 475,458 553,503 31.0% 5.6%
Employment 709,701 640,421 679,604 -4.2% 8.1%
Sales ($000) $66,287,067 $74,396,099 $86,885,447 31.1% 6.1%
$250,000 to $499,999
Number of Firms 197,249 218,598 258,398 31.0% 2.6%
Employment 838,312 804,222 875,027 4.4% 10.4%
Sales ($000) $68,982,476 $76,728,816 $90,745,311 31.5% 6.4%
$500,000 to $999,999
Number of Firms 121,553 135,989 164,824 35.6% 1.7%
Employment 986,237 923,323 1,096,087 11.1% 13.0%
Sales ($000) $84,728,761 $95,050,961 $115,120,229 35.9% 8.1%
$1,000,000 or more
Number of Firms 116,985 141,908 171,842 46.9% 1.7%
Employment 4,213,120 4,758,865 5,423,313 28.7% 64.3%
Sales ($000) $625,662,232 $841,062,304 $983,999,625 57.3% 69.3%

The Growth & Development of Women-Owned Enterprises in the U.S: 2002-2012 46
Table 5: Trend in Number, Employment, Revenues of Minority Women-Owned Firms, 2002-2012
Women-Owned Firms % Change, 2002-2012 2002 2007 2012
Total US-All Firms
Number of Firms 6,489,483 7,793,139 9,878,397 52.2%
Employment 7,146,229 7,579,876 8,431,614 18.0%
Sales ($000) $940,774,986 $1,202,115,758 $1,419,834,295 50.9%
African American
Number of Firms 547,032 911,728 1,521,494 178.1%
Employment 176,436 245,474 316,977 79.7%
Sales ($000) $20,670,616 $36,804,059 $42,225,349 104.3%
Asian American
Number of Firms 339,554 522,969 749,197 120.6%
Employment 425,024 561,031 804,276 89.2%
Sales ($000) $53,652,929 $87,678,029 $135,676,380 152.9%
Hispanic
Number of Firms 540,745 787,914 1,469,991 171.8%
Employment 282,683 363,430 470,726 66.5%
Sales ($000) $35,265,399 $55,653,289 $78,679,717 123.1%
Native American-Alaska Native
Number of Firms 78,292 96,543 131,064 67.4%
Employment 49,406 52,432 55,011 11.3%
Sales ($000) $5,763,268 $8,862,208 $9,057,458 57.2%
Native Hawaiian-Pacific Islander
Number of Firms 10,582 14,963 24,982 136.1%
Employment 7,395 12,074 11,701 58.2%
Sales ($000) $795,963 $1,509,366 $1,879,024 136.1%
Non-Minority
Number of Firms 5,580,162 5,565,615 6,091,716 9.2%
Employment 6,513,446 6,281,878 6,754,361 3.7%
Sales ($000) $862,590,849 $1,007,509,999 $1,151,560,159 33.5%
Minority
Number of Firms 909,097 2,212,777 3,777,279 315.5%
Employment 627,923 1,211,151 1,643,197 161.7%
Sales ($000) $76,947,359 $186,180,130 $264,799,352 244.1%

The Growth & Development of Women-Owned Enterprises in the U.S: 2002-2012 47
Table 6: Trend in Number, Employment, Revenues of Female Veteran-Owned Firms in the United States by Industry, 2007-2012
Female Veteran-Owned Firms
% Change 2007-2012
% Share, 2012 2007 2012
Total US
Number of Firms 97,114 383,302 294.7% 100%
Employment 69,875 102,662 46.9% 100%
Sales ($000) $15,806,492 $17,950,613 13.6% 100%
Agriculture, Forestry, Fishing, Hunting (11)
Number of Firms 408 2,134 423.0% 0.6%
Employment 42 D -- --
Sales ($000) $24,046 $51,303 113.4% 0.3%
Mining (21)
Number of Firms D 1,024 -- 0.3%
Employment D 52 -- 0.1%
Sales ($000) D $52,266 -- 0.3%
Utilities (22)
Number of Firms 59 252 327.1% 0.1%
Employment D -- -- 0.0%
Sales ($000) D $3,235 -- 0.0%
Construction (23)
Number of Firms 3,763 10,202 171.1% 2.7%
Employment 3,635 5,082 39.8% 5.0%
Sales ($000) $753,492 $1,039,893 38.0% 5.8%
Manufacturing (31-33)
Number of Firms 1,414 4,968 251.3% 1.3%
Employment 3,794 2,875 -24.2% 2.8%
Sales ($000) $619,021 $546,298 -11.7% 3.0%
Wholesale Trade (42)
Number of Firms 1,229 5,436 342.3% 1.4%
Employment 2,297 D -- --
Sales ($000) $6,784,294 $1,977,732 -70.8% 11.0%
Retail Trade (44-45)
Number of Firms 12,475 39,656 217.9% 10.3%
Employment 7,430 5,352 -28.0% 5.2%
Sales ($000) $1,481,963 $1,430,387 -3.5% 8.0%

The Growth & Development of Women-Owned Enterprises in the U.S: 2002-2012 48
Table 6: Trend in Number, Employment, Revenues of Female Veteran-Owned Firms in the United States by Industry, 2007-2012
Female Veteran-Owned Firms
% Change 2007-2012
% Share, 2012 2007 2012
Transportation & Warehousing (48-49)
Number of Firms 2,444 9,223 277.4% 2.4%
Employment 1,472 10,460 610.6% 10.2%
Sales ($000) $229,976 $1,661,185 622.3% 9.3%
Information (51)
Number of Firms 1,245 4,163 234.4% 1.1%
Employment D 790 -- 0.8%
Sales ($000) $182,629 $148,711 -18.6% 0.8%
Finance & Insurance (52)
Number of Firms 2,182 8,663 297.0% 2.3%
Employment 946 789 -16.6% 0.8%
Sales ($000) $246,864 $339,046 37.3% 1.9%
Real Estate, Rental, Leasing (53)
Number of Firms 8,921 20,849 133.7% 5.4%
Employment D 1,923 -- 1.9%
Sales ($000) $765,886 $898,119 17.3% 5.0%
Prof/Sci/Tech Svcs. (54)
Number of Firms 13,540 43,400 220.5% 11.3%
Employment 9,019 14,233 57.8% 13.9%
Sales ($000) $1,368,040 $2,805,502 105.1% 15.6%
Mgmnt of Companies (55)
Number of Firms 27 6 -77.8% 0.0%
Employment 457 303 -33.7% 0.3%
Sales ($000) $102,143 $11,469 -88.8% 0.1%
Admin, Support, Waste Svcs (56)
Number of Firms 9,559 46,587 387.4% 12.2%
Employment 11,342 6,659 -41.3% 6.5%
Sales ($000) $689,298 $1,202,265 74.4% 6.7%
Educational Svcs (61)
Number of Firms 2,663 11,657 337.7% 3.0%
Employment 1,441 603 -58.2% 0.6%
Sales ($000) $60,565 $194,859 221.7% 1.1%

The Growth & Development of Women-Owned Enterprises in the U.S: 2002-2012 49
Table 6: Trend in Number, Employment, Revenues of Female Veteran-Owned Firms in the United States by Industry, 2007-2012
Female Veteran-Owned Firms
% Change 2007-2012
% Share, 2012 2007 2012
Health Care & Social Assistance (62)
Number of Firms 17,627 62,417 254.1% 16.3%
Employment 13,334 41,695 212.7% 40.6%
Sales ($000) $1,463,615 $3,395,489 132.0% 18.9%
Arts, Entertainment & Recreation (71)
Number of Firms 3,707 17,898 382.8% 4.7%
Employment 1,712 1,171 -31.6% 1.1%
Sales ($000) $104,553 $336,530 221.9% 1.9%
Accommodation & Food Svc (72)
Number of Firms 1,836 10,175 454.2% 2.7%
Employment 8,034 5,756 -28.4% 5.6%
Sales ($000) $400,813 $415,972 3.8% 2.3%
Other Services (81)
Number of Firms 13,903 84,596 508.5% 22.1%
Employment 2,718 2,919 7.4% 2.8%
Sales ($000) $381,466 $1,438,924 277.2% 8.0%
Industries Not Classified (99)
Number of Firms D 14 -- 0.0%
Employment D 9 -- 0.0%
Sales ($000) D $1,427 -- 0.0%
D=Number not disclosed.

The Growth & Development of Women-Owned Enterprises in the U.S: 2002-2012 50
Table 7: Trend in Number, Employment, Revenues of Women-Owned Firms by Industry, 2002-2012
Women-Owned Firms
% Change, 2002-2012 2002 2007 2012
Total US
Number of Firms 6,489,483 7,793,139 9,878,397 52.2%
Employment 7,146,229 7,579,876 8,431,614 18.0%
Sales ($000) $940,774,986 $1,202,115,758 $1,419,834,295 50.9%
Agriculture, Forestry, Fishing, Hunting (11)
Number of Firms 24,458 26,783 37,021 51.4%
Employment 24,296 9,740 19,705 -18.9%
Sales ($000) $2,050,461 $2,037,592 $2,917,508 42.3%
Mining (21)
Number of Firms 13,231 18,317 22,388 69.2%
Employment 15,910 23,378 27,251 71.3%
Sales ($000) $3,127,501 $11,590,597 $12,688,725 305.7%
Utilities (22)
Number of Firms 2,066 3,763 4,111 99.0%
Employment 1,918 1,795 1,738 -9.4%
Sales ($000) $744,575 $1,927,789 $1,172,906 57.5%
Construction (23)
Number of Firms 201,791 268,793 265,733 31.7%
Employment 455,799 495,569 435,718 -4.4%
Sales ($000) $68,424,738 $97,453,812 $93,002,152 35.9%
Manufacturing (31-33)
Number of Firms 110,348 113,481 139,442 26.4%
Employment 637,130 572,170 559,456 -12.2%
Sales ($000) $93,312,296 $113,394,679 $123,983,984 32.9%
Wholesale Trade (42)
Number of Firms 121,421 133,380 155,215 27.8%
Employment 378,857 382,096 373,615 -1.4%
Sales ($000) $210,802,077 $246,515,385 $275,903,159 30.9%
Retail Trade (44-45)
Number of Firms 944,682 918,804 1,045,322 10.7%
Employment 851,401 837,834 792,440 -6.9%
Sales ($000) $149,230,643 $190,411,132 $208,975,626 40.0%
Transportation & Warehousing (48-49)
Number of Firms 111,466 142,595 158,745 42.4%
Employment 187,373 217,060 249,618 33.2%
Sales ($000) $22,446,422 $32,951,928 $44,215,826 97.0%
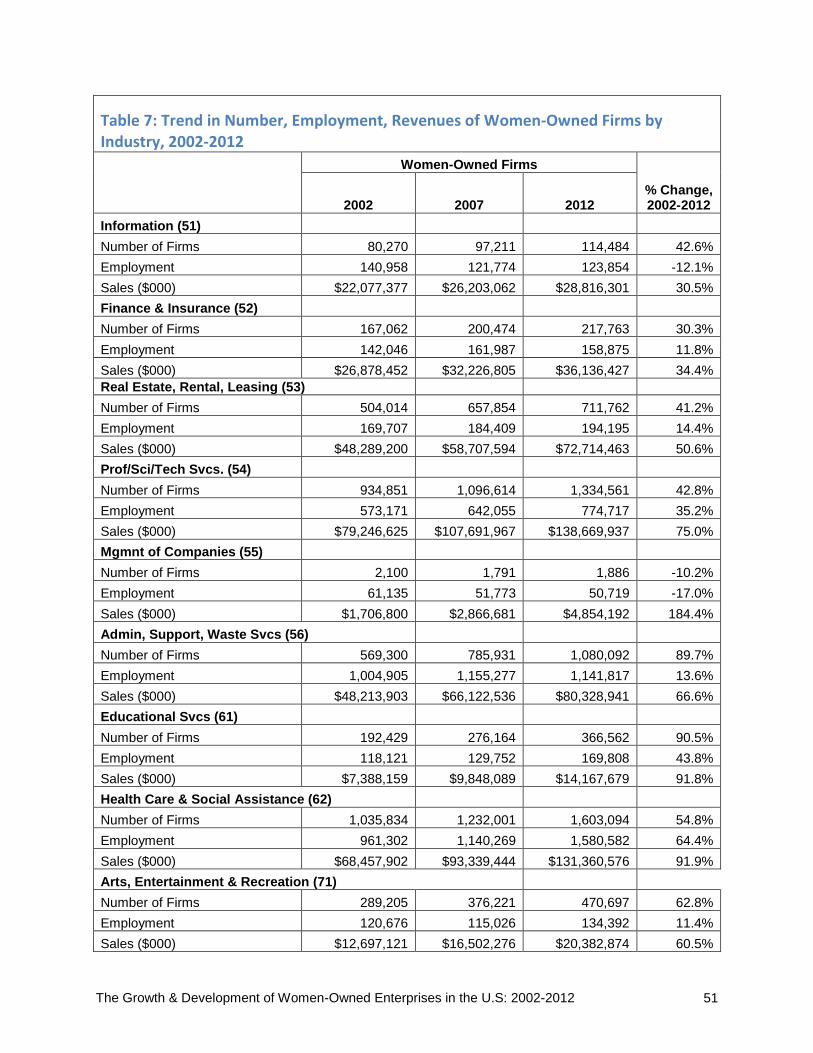
The Growth & Development of Women-Owned Enterprises in the U.S: 2002-2012 51
Table 7: Trend in Number, Employment, Revenues of Women-Owned Firms by Industry, 2002-2012
Women-Owned Firms
% Change, 2002-2012 2002 2007 2012
Information (51)
Number of Firms 80,270 97,211 114,484 42.6%
Employment 140,958 121,774 123,854 -12.1%
Sales ($000) $22,077,377 $26,203,062 $28,816,301 30.5%
Finance & Insurance (52)
Number of Firms 167,062 200,474 217,763 30.3%
Employment 142,046 161,987 158,875 11.8%
Sales ($000) $26,878,452 $32,226,805 $36,136,427 34.4%
Real Estate, Rental, Leasing (53)
Number of Firms 504,014 657,854 711,762 41.2%
Employment 169,707 184,409 194,195 14.4%
Sales ($000) $48,289,200 $58,707,594 $72,714,463 50.6%
Prof/Sci/Tech Svcs. (54)
Number of Firms 934,851 1,096,614 1,334,561 42.8%
Employment 573,171 642,055 774,717 35.2%
Sales ($000) $79,246,625 $107,691,967 $138,669,937 75.0%
Mgmnt of Companies (55)
Number of Firms 2,100 1,791 1,886 -10.2%
Employment 61,135 51,773 50,719 -17.0%
Sales ($000) $1,706,800 $2,866,681 $4,854,192 184.4%
Admin, Support, Waste Svcs (56)
Number of Firms 569,300 785,931 1,080,092 89.7%
Employment 1,004,905 1,155,277 1,141,817 13.6%
Sales ($000) $48,213,903 $66,122,536 $80,328,941 66.6%
Educational Svcs (61)
Number of Firms 192,429 276,164 366,562 90.5%
Employment 118,121 129,752 169,808 43.8%
Sales ($000) $7,388,159 $9,848,089 $14,167,679 91.8%
Health Care & Social Assistance (62)
Number of Firms 1,035,834 1,232,001 1,603,094 54.8%
Employment 961,302 1,140,269 1,580,582 64.4%
Sales ($000) $68,457,902 $93,339,444 $131,360,576 91.9%
Arts, Entertainment & Recreation (71)
Number of Firms 289,205 376,221 470,697 62.8%
Employment 120,676 115,026 134,392 11.4%
Sales ($000) $12,697,121 $16,502,276 $20,382,874 60.5%

The Growth & Development of Women-Owned Enterprises in the U.S: 2002-2012 52
Table 7: Trend in Number, Employment, Revenues of Women-Owned Firms by Industry, 2002-2012
Women-Owned Firms
% Change, 2002-2012 2002 2007 2012
Accommodation & Food Svc (72)
Number of Firms 166,701 191,894 265,547 59.3%
Employment 909,049 965,794 1,203,315 32.4%
Sales ($000) $38,687,859 $47,326,828 $69,029,041 78.4%
Other Services (81)
Number of Firms 1,015,724 1,251,744 1,885,222 85.6%
Employment 386,174 368,090 437,430 13.3%
Sales ($000) $36,215,139 $44,818,781 $60,246,240 66.4%
Industries Not Classified (99)
Number of Firms 6,137 2,774 2,759 -55.0%
Employment 6,302 4,026 2,369 -62.4%
Sales ($000) $777,736 $178,780 $267,737 -65.6%

The Growth & Development of Women-Owned Enterprises in the U.S: 2002-2012 53
Table 8: Trend in Number of Women-Owned Firms Within Industry by Revenue Size of Firm, 2002-2012
Women-Owned Firms
% Change, 2002-2012
% Share w/in Sector,
2012 2002 2007 2012
Total US
Less than $100,000 5,630,998 6,820,706 8,729,829 55.0% 88.4%
$100-$499K 619,905 694,086 811,901 31.0% 8.2%
$500,000+ 238,579 277,323 336,666 41.1% 3.4%
Agriculture, Forestry, Fishing, Hunting (11)
Less than $100,000 21,383 24,124 33,653 57.4% 90.9%
$100-$499K 2,457 2,031 2,546 3.6% 6.9%
$500,000+ 618 621 822 33.0% 2.2%
Mining (21)
Less than $100,000 10,943 14,935 17,932 63.9% 80.1%
$100-$499K 1,564 2,288 3,150 101.4% 14.1%
$500,000+ 723 1,109 1,305 80.5% 5.8%
Utilities (22)
Less than $100,000 1,759 3,523 3,845 118.6% 93.5%
$100-$499K 188 141 136 -27.7% 3.3%
$500,000+ 120 98 130 8.3% 3.2%
Construction (23)
Less than $100,000 147,407 205,064 204,518 38.7% 77.0%
$100-$499K 30,985 35,376 34,170 10.3% 12.9%
$500,000+ 23,399 28,229 27,044 15.6% 10.2%
Manufacturing (31-33)
Less than $100,000 75,407 80,371 102,248 35.6% 73.3%
$100-$499K 17,795 16,176 19,004 6.8% 13.6%
$500,000+ 17,144 16,854 18,190 6.1% 13.0%
Wholesale Trade (42)
Less than $100,000 75,163 87,814 104,714 39.3% 67.5%
$100-$499K 22,302 19,728 22,274 -0.1% 14.4%
$500,000+ 23,955 25,812 28,228 17.8% 18.2%
Retail Trade (44-45)
Less than $100,000 798,996 779,303 891,905 11.6% 85.3%
$100-$499K 100,416 93,107 98,501 -1.9% 9.4%
$500,000+ 45,270 46,291 54,916 21.3% 5.3%
Transportation & Warehousing (48-49)
Less than $100,000 91,634 115,631 129,034 40.8% 81.3%
$100-$499K 13,642 18,905 19,886 45.8% 12.5%
$500,000+ 6,170 8,027 9,825 59.2% 6.2%

The Growth & Development of Women-Owned Enterprises in the U.S: 2002-2012 54
Table 8: Trend in Number of Women-Owned Firms Within Industry by Revenue Size of Firm, 2002-2012
Women-Owned Firms
% Change, 2002-2012
% Share w/in Sector,
2012 2002 2007 2012
Information (51)
Less than $100,000 70,158 87,130 103,318 47.3% 90.2%
$100-$499K 6,533 6,493 7,625 16.7% 6.7%
$500,000+ 3,639 3,549 3,541 -2.7% 3.1%
Finance & Insurance (52)
Less than $100,000 134,495 160,559 175,911 30.8% 80.8%
$100-$499K 26,171 31,887 33,567 28.3% 15.4%
$500,000+ 6,395 7,998 8,285 29.6% 3.8%
Real Estate, Rental, Leasing (53)
Less than $100,000 409,255 550,503 574,420 40.4% 80.7%
$100-$499K 79,373 89,646 113,952 43.6% 16.0%
$500,000+ 15,386 17,434 23,390 52.0% 3.3%
Prof/Sci/Tech Svcs. (54)
Less than $100,000 811,418 941,144 1,150,669 41.8% 86.2%
$100-$499K 98,157 122,295 143,057 45.7% 10.7%
$500,000+ 25,277 33,142 40,835 61.6% 3.1%
Mgmnt of Companies (55)
Less than $100,000 D D 116 - 6.2%
$100-$499K 238 126 159 -33.2% 8.4%
$500,000+ 1,375 1,434 1,611 17.2% 85.4%
Admin, Support, Waste Svcs (56)
Less than $100,000 525,416 731,494 1,021,131 94.3% 94.5%
$100-$499K 29,642 36,847 39,975 34.9% 3.7%
$500,000+ 14,243 17,568 18,986 33.3% 1.8%
Educational Svcs (61)
Less than $100,000 182,141 263,153 348,141 91.1% 95.0%
$100-$499K 7,753 10,213 14,427 86.1% 3.9%
$500,000+ 2,535 2,673 3,995 57.6% 1.1%
Health Care & Social Assistance (62)
Less than $100,000 937,805 1,111,214 1,442,401 53.8% 90.0%
$100-$499K 71,586 86,046 110,471 54.3% 6.9%
$500,000+ 25,442 34,557 50,221 97.4% 3.1%
Arts, Entertainment & Recreation (71)
Less than $100,000 272,144 355,821 448,212 64.7% 95.2%
$100-$499K 13,154 16,126 17,197 30.7% 3.7%
$500,000+ 3,907 4,249 5,288 35.3% 1.1%

The Growth & Development of Women-Owned Enterprises in the U.S: 2002-2012 55
Table 8: Trend in Number of Women-Owned Firms Within Industry by Revenue Size of Firm, 2002-2012
Women-Owned Firms
% Change, 2002-2012
% Share w/in Sector,
2012 2002 2007 2012
Accommodation & Food Svc (72)
Less than $100,000 101,751 122,957 174,991 72.0% 65.9%
$100-$499K 47,113 47,933 60,032 27.4% 22.6%
$500,000+ 17,837 20,908 30,524 71.1% 11.5%
Other Services (81)
Less than $100,000 958,709 1,183,460 1,800,599 87.8% 95.5%
$100-$499K 48,674 58,390 71,294 46.5% 3.8%
$500,000+ 8,339 10,037 13,329 59.8% 0.7%
D=Number not disclosed.

The Growth & Development of Women-Owned Enterprises in the U.S: 2002-2012 56
Table 9: Trend in Number, Employment, Revenues of Women-Owned Firms by Selected Detailed Industry, 2002-2012
Women-Owned Firms % Change, 2002-2012
% Change 2007-2012 2002 2007 2012
Total US
Number of Firms 6,489,483 7,793,139 9,878,397 52.2% 26.8%
Employment 7,146,229 7,579,876 8,431,614 18.0% 11.2%
Sales ($000) $940,774,986 $1,202,115,758 $1,419,834,295 50.9% 18.1%
Prof/Sci/Tech Svcs. (54)
Number of Firms 934,851 1,096,614 1,334,561 42.8% 21.7%
Employment 573,171 642,055 774,717 35.2% 20.7%
Sales ($000) $79,246,625 $107,691,967 $138,669,937 75.0% 28.8%
Legal Services (5411)
Number of Firms 90,571 101,566 131,140 44.8% 29.1%
Employment 61,260 74,104 84,430 37.8% 13.9%
Sales ($000) $9,323,639 $12,383,214 $16,860,866 80.8% 36.2%
Accounting, Tax Preparation, Payroll Services (5412)
Number of Firms 169,256 185,455 229,506 35.6% 23.8%
Employment 115,157 140,956 168,912 46.7% 19.8%
Sales ($000) $7,345,960 $10,866,670 $13,307,247 81.2% 22.5%
Architecture, Engineering and Related Services (5413)
Number of Firms 37,074 44,382 45,675 23.2% 2.9%
Employment 68,201 70,549 83,139 21.9% 17.8%
Sales ($000) $7,671,399 $10,219,056 $13,685,172 78.4% 33.9%
Specialized Design Services (5414)
Number of Firms 83,734 105,705 123,394 47.4% 16.7%
Employment 35,303 35,977 29,310 -17.0% -18.5%
Sales ($000) $7,901,358 $10,115,395 $9,245,691 17.0% -8.6%
Computer Systems Design and Related Services (5415)
Number of Firms 68,506 64,636 71,721 4.7% 11.0%
Employment 73,906 75,936 111,149 50.4% 46.4%
Sales ($000) $11,165,660 $14,394,498 $21,985,069 96.9% 52.7%
Management, Scientific and Technical Consulting Services (5416)
Number of Firms 151,491 211,325 251,528 66.0% 19.0%
Employment 80,804 85,254 124,735 54.4% 46.3%
Sales ($000) $13,039,225 $18,331,378 $26,854,728 106.0% 46.5%
Scientific Research and Development Services (5417)
Number of Firms 7,972 12,690 14,675 84.1% 15.6%
Employment 13,990 11,437 20,674 47.8% 80.8%
Sales ($000) $2,002,527 $1,757,393 $3,383,860 69.0% 92.5%

The Growth & Development of Women-Owned Enterprises in the U.S: 2002-2012 57
Table 9: Trend in Number, Employment, Revenues of Women-Owned Firms by Selected Detailed Industry, 2002-2012
Women-Owned Firms % Change, 2002-2012
% Change 2007-2012 2002 2007 2012
Advertising, Public Relations and Related Services (5418)
Number of Firms 50,553 61,444 70,739 39.9% 15.1%
Employment 53,400 59,906 51,173 -4.2% -14.6%
Sales ($000) $8,430,107 $12,905,193 $12,308,542 46.0% -4.6%
Other Professional/Scientific/Technical Services (5419)
Number of Firms 275,714 309,440 396,267 43.7% 28.1%
Employment 70,633 78,245 101,195 43.3% 29.3%
Sales ($000) $12,253,566 $16,102,668 $21,037,851 71.7% 30.6%
Admin, Support, Waste Svcs (56)
Number of Firms 569,300 785,931 1,080,092 89.7% 37.4%
Employment 1,004,905 1,155,277 1,141,817 13.6% -1.2%
Sales ($000) $48,213,903 $66,122,536 $80,328,941 66.6% 21.5%
Office Administrative Services (5611)
Number of Firms N 108,120 146,794 -- 35.8%
Employment N 39,817 39,793 -- -0.1%
Sales ($000) N $4,760,456 $5,540,445 -- 16.4%
Facilities Support Services (5612)
Number of Firms N 7,435 9,308 -- 25.2%
Employment N 14,311 10,977 -- -23.3%
Sales ($000) N $1,118,801 $1,452,564 -- 29.8%
Employment Services (5613)
Number of Firms N 24,976 23,274 -- -6.8%
Employment N 648,438 547,220 -- -15.6%
Sales ($000) N $21,506,834 $23,635,806 -- 9.9%
Business Support Services (5614)
Number of Firms N 119,834 139,662 -- 16.5%
Employment N 78,219 54,097 -- -30.8%
Sales ($000) N $7,195,473 $7,411,905 -- 3.0%
Travel Arrangement and Reservation Services (5615)
Number of Firms N 26,877 24,400 -- -9.2%
Employment N 29,313 54,010 -- 84.3%
Sales ($000) N $3,699,197 $5,401,303 -- 46.0%
Investigation and Security Services (5616)
Number of Firms N 24,791 26,394 -- 6.5%
Employment N 65,422 86,031 -- 31.5%
Sales ($000) N $2,995,409 $4,359,288 -- 45.5%

The Growth & Development of Women-Owned Enterprises in the U.S: 2002-2012 58
Table 9: Trend in Number, Employment, Revenues of Women-Owned Firms by Selected Detailed Industry, 2002-2012
Women-Owned Firms % Change, 2002-2012
% Change 2007-2012 2002 2007 2012
Services to Buildings and Dwellings (5617)
Number of Firms N 430,835 655,943 -- 52.2%
Employment N 219,286 288,772 -- 31.7%
Sales ($000) N $16,636,948 $22,572,544 -- 35.7%
Other Support Services (5619)
Number of Firms N 38,257 48,114 -- 25.8%
Employment N 29,334 35,054 -- 19.5%
Sales ($000) N $3,867,756 $5,719,212 -- 47.9%
Waste Management and Remediation Services (562)
Number of Firms 3,929 4,828 6,233 58.6% 29.1%
Employment 20,180 26,671 25,863 28.2% -3.0%
Sales ($000) $2,291,175 $3,828,104 $4,235,800 84.9% 10.7%
Educational Svcs (61)
Number of Firms 192,429 276,164 366,562 90.5% 32.7%
Employment 118,121 129,752 169,808 43.8% 30.9%
Sales ($000) $7,388,159 $9,848,089 $14,167,679 91.8% 43.9%
Elementary and Secondary Schools (6111)
Number of Firms N N 1,322 -- --
Employment N 17,464 18,002 -- 3.1%
Sales ($000) N N $963,940 -- --
Junior Colleges (6112)
Number of Firms N N 70 -- --
Employment N 1,802 3,195 -- 77.3%
Sales ($000) N N $316,101 -- --
Colleges, Universities and Professional Schools (6113)
Number of Firms N N 93 -- --
Employment N 2,556 5,773 -- 125.9%
Sales ($000) N N $388,578 -- --
Business Schools and Computer and Management Training (6114)
Number of Firms N N 2,300 -- --
Employment N 9,651 11,692 -- 21.1%
Sales ($000) N N $1,553,525 -- --
Technical and Trade Schools (6115)
Number of Firms N N 1,851 -- --
Employment N 13,123 17,140 -- 30.6%
Sales ($000) N N $1,523,601 -- --

The Growth & Development of Women-Owned Enterprises in the U.S: 2002-2012 59
Table 9: Trend in Number, Employment, Revenues of Women-Owned Firms by Selected Detailed Industry, 2002-2012
Women-Owned Firms % Change, 2002-2012
% Change 2007-2012 2002 2007 2012
Other Schools and Instruction (6116)
Number of Firms N N 15,545 -- --
Employment N 71,875 101,966 -- 41.9%
Sales ($000) N N $4,214,898 -- --
Educational Support Services (6117)
Number of Firms N N 2,182 -- --
Employment N 7,950 12,039 -- 51.4%
Sales ($000) N N $1,188,880 -- --
Health Care & Social Assistance (62)
Number of Firms 1,035,834 1,232,001 1,603,094 54.8% 30.1%
Employment 961,302 1,140,269 1,580,582 64.4% 38.6%
Sales ($000) $68,457,902 $93,339,444 $131,360,576 91.9% 40.7%
Offices of Physicians (6211)
Number of Firms N 88,162 98,589 -- 11.8%
Employment N 153,527 209,103 -- 36.2%
Sales ($000) N $23,628,224 $32,828,774 -- 38.9%
Offices of Dentists (6212)
Number of Firms N 31,207 41,675 -- 33.5%
Employment N 86,480 135,421 -- 56.6%
Sales ($000) N $9,684,908 $16,049,665 -- 65.7%
Offices of Other Health Practitioners (6213)
Number of Firms N 218,158 280,220 -- 28.4%
Employment N 97,570 161,082 -- 65.1%
Sales ($000) N $13,365,456 $20,760,886 -- 55.3%
Outpatient Care Centers (6214)
Number of Firms N 8,508 10,629 -- 24.9%
Employment N 14,769 22,907 -- 55.1%
Sales ($000) N $1,694,446 $2,747,038 -- 62.1%
Medical and Diagnostic Laboratories (6215)
Number of Firms N 9,542 10,376 -- 8.7%
Employment N 9,917 16,041 -- 61.8%
Sales ($000) N $1,585,838 $2,068,804 -- 30.5%
Home Health Care Services (6216)
Number of Firms N 151,921 279,314 -- 83.9%
Employment N 192,047 252,956 -- 31.7%
Sales ($000) N $9,130,674 $14,139,612 -- 54.9%
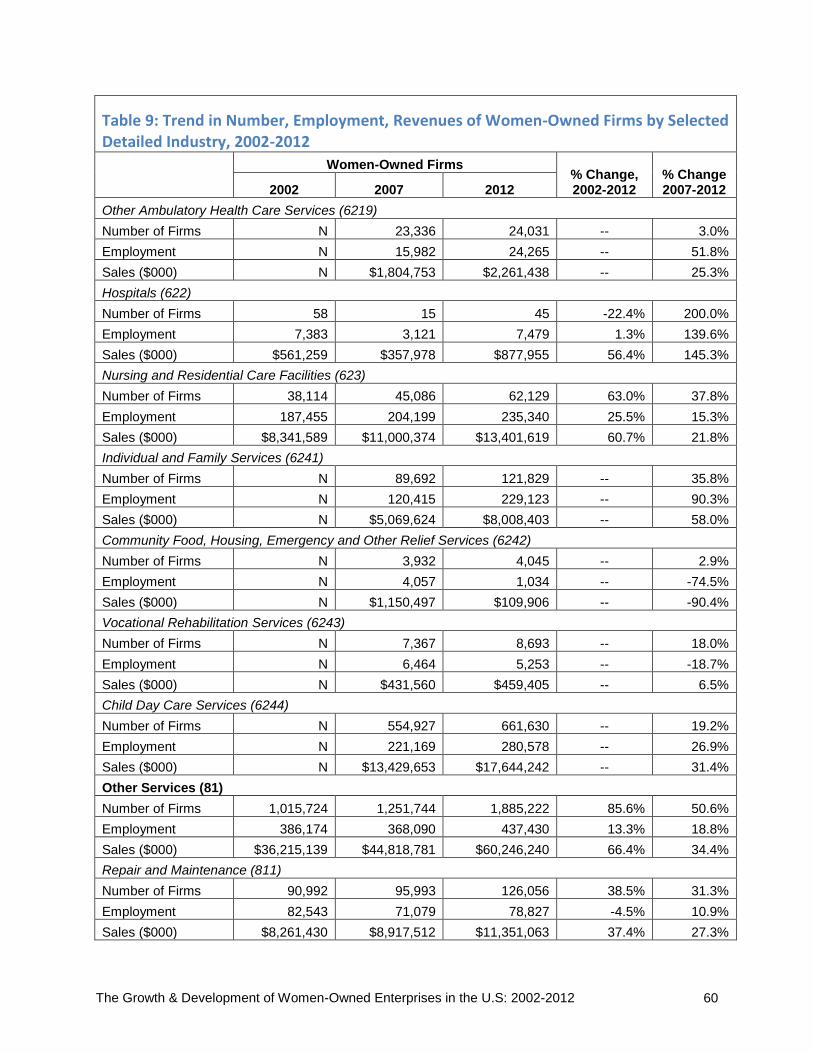
The Growth & Development of Women-Owned Enterprises in the U.S: 2002-2012 60
Table 9: Trend in Number, Employment, Revenues of Women-Owned Firms by Selected Detailed Industry, 2002-2012
Women-Owned Firms % Change, 2002-2012
% Change 2007-2012 2002 2007 2012
Other Ambulatory Health Care Services (6219)
Number of Firms N 23,336 24,031 -- 3.0%
Employment N 15,982 24,265 -- 51.8%
Sales ($000) N $1,804,753 $2,261,438 -- 25.3%
Hospitals (622)
Number of Firms 58 15 45 -22.4% 200.0%
Employment 7,383 3,121 7,479 1.3% 139.6%
Sales ($000) $561,259 $357,978 $877,955 56.4% 145.3%
Nursing and Residential Care Facilities (623)
Number of Firms 38,114 45,086 62,129 63.0% 37.8%
Employment 187,455 204,199 235,340 25.5% 15.3%
Sales ($000) $8,341,589 $11,000,374 $13,401,619 60.7% 21.8%
Individual and Family Services (6241)
Number of Firms N 89,692 121,829 -- 35.8%
Employment N 120,415 229,123 -- 90.3%
Sales ($000) N $5,069,624 $8,008,403 -- 58.0%
Community Food, Housing, Emergency and Other Relief Services (6242)
Number of Firms N 3,932 4,045 -- 2.9%
Employment N 4,057 1,034 -- -74.5%
Sales ($000) N $1,150,497 $109,906 -- -90.4%
Vocational Rehabilitation Services (6243)
Number of Firms N 7,367 8,693 -- 18.0%
Employment N 6,464 5,253 -- -18.7%
Sales ($000) N $431,560 $459,405 -- 6.5%
Child Day Care Services (6244)
Number of Firms N 554,927 661,630 -- 19.2%
Employment N 221,169 280,578 -- 26.9%
Sales ($000) N $13,429,653 $17,644,242 -- 31.4%
Other Services (81)
Number of Firms 1,015,724 1,251,744 1,885,222 85.6% 50.6%
Employment 386,174 368,090 437,430 13.3% 18.8%
Sales ($000) $36,215,139 $44,818,781 $60,246,240 66.4% 34.4%
Repair and Maintenance (811)
Number of Firms 90,992 95,993 126,056 38.5% 31.3%
Employment 82,543 71,079 78,827 -4.5% 10.9%
Sales ($000) $8,261,430 $8,917,512 $11,351,063 37.4% 27.3%

The Growth & Development of Women-Owned Enterprises in the U.S: 2002-2012 61
Table 9: Trend in Number, Employment, Revenues of Women-Owned Firms by Selected Detailed Industry, 2002-2012
Women-Owned Firms % Change, 2002-2012
% Change 2007-2012 2002 2007 2012
Personal Care Services (8121)
Number of Firms N 605,936 997,375 -- 64.6%
Employment N 196,819 245,261 -- 24.6%
Sales ($000) N $19,724,347 $28,949,465 -- 46.8%
Death Care Services (8122)
Number of Firms N 6,362 6,466 -- 1.6%
Employment N 11,346 14,398 -- 26.9%
Sales ($000) N $1,510,042 $1,849,465 -- 22.5%
Drycleaning and Laundry Services (8123)
Number of Firms N 20,621 22,977 -- 11.4%
Employment N 47,429 44,887 -- -5.4%
Sales ($000) N $3,124,328 $3,275,701 -- 4.8%
Other Personal Services (8129)
Number of Firms N 522,977 732,352 -- 40.0%
Employment N 40,386 54,057 -- 33.9%
Sales ($000) N $11,500,120 $14,820,546 -- 28.9%
N=Not available

The Growth & Development of Women-Owned Enterprises in the U.S: 2002-2012 62
Table 10: Trend in Number, Employment, Revenues of Women-Owned Firms by State, 2002-2012
Women-Owned Firms %
Change, 2002-2012 2002 2007 2012
Total US
Number of Firms 6,489,483 7,793,139 9,878,397 52.2%
Employment 7,146,229 7,579,876 8,431,614 18.0%
Sales ($000) $940,774,986 $1,202,115,758 $1,419,834,295 50.9%
Alabama
Number of Firms 81,821 107,481 137,630 68.2%
Employment 96,235 100,695 107,871 12.1%
Sales ($000) $11,435,046 $14,939,027 $17,286,337 51.2%
Alaska
Number of Firms 16,308 17,822 22,141 35.8%
Employment 17,556 18,440 25,955 47.8%
Sales ($000) $2,348,329 $2,931,415 $4,689,411 99.7%
Arizona
Number of Firms 109,748 138,080 182,425 66.2%
Employment 128,926 147,392 144,906 12.4%
Sales ($000) $15,761,202 $21,795,502 $22,692,789 44.0%
Arkansas
Number of Firms 49,618 58,585 75,962 53.1%
Employment 54,969 62,129 55,616 1.2%
Sales ($000) $6,339,427 $9,752,602 $9,151,324 44.4%
California
Number of Firms 870,496 1,039,486 1,320,085 51.6%
Employment 941,136 974,622 1,043,519 10.9%
Sales ($000) $137,692,325 $184,974,809 $201,667,006 46.5%
Colorado
Number of Firms 135,220 160,083 194,508 43.8%
Employment 128,447 138,617 159,311 24.0%
Sales ($000) $16,359,446 $22,618,972 $26,457,199 61.7%
Connecticut
Number of Firms 82,118 93,480 106,678 29.9%
Employment 88,074 89,942 94,121 6.9%
Sales ($000) $12,215,939 $14,409,072 $15,716,136 28.7%
Delaware
Number of Firms 15,344 19,446 23,964 56.2%
Employment 19,359 18,402 25,998 34.3%
Sales ($000) $2,020,973 $3,017,397 $3,229,258 59.8%

The Growth & Development of Women-Owned Enterprises in the U.S: 2002-2012 63
Table 10: Trend in Number, Employment, Revenues of Women-Owned Firms by State, 2002-2012
Women-Owned Firms %
Change, 2002-2012 2002 2007 2012
District of Columbia
Number of Firms 15,675 19,286 27,064 72.7%
Employment 21,649 25,977 26,619 23.0%
Sales ($000) $2,403,019 $3,805,691 $4,397,772 83.0%
Florida
Number of Firms 437,355 581,192 807,817 84.7%
Employment 432,071 470,466 479,203 10.9%
Sales ($000) $61,275,106 $76,867,239 $85,527,046 39.6%
Georgia
Number of Firms 196,195 278,334 376,506 91.9%
Employment 196,810 228,992 249,684 26.9%
Sales ($000) $30,026,706 $40,889,861 $46,064,653 53.4%
Hawaii
Number of Firms 29,943 37,373 44,453 48.5%
Employment 38,569 37,748 39,796 3.2%
Sales ($000) $4,594,306 $4,968,149 $7,086,066 54.2%
Idaho
Number of Firms 28,824 35,594 45,121 56.5%
Employment 26,633 32,873 36,598 37.4%
Sales ($000) $3,216,407 $4,103,736 $4,607,322 43.2%
Illinois
Number of Firms 284,954 343,111 417,500 46.5%
Employment 351,317 339,371 340,077 -3.2%
Sales ($000) $46,861,800 $53,730,382 $60,134,669 28.3%
Indiana
Number of Firms 118,857 129,621 162,798 37.0%
Employment 136,457 150,463 175,081 28.3%
Sales ($000) $16,481,128 $20,637,409 $28,013,254 70.0%
Iowa
Number of Firms 63,821 66,270 82,345 29.0%
Employment 63,324 61,243 84,332 33.2%
Sales ($000) $7,398,962 $7,886,061 $12,640,627 70.8%
Kansas
Number of Firms 59,635 65,180 77,194 29.4%
Employment 61,596 68,098 73,341 19.1%
Sales ($000) $6,948,910 $9,253,112 $13,467,117 93.8%

The Growth & Development of Women-Owned Enterprises in the U.S: 2002-2012 64
Table 10: Trend in Number, Employment, Revenues of Women-Owned Firms by State, 2002-2012
Women-Owned Firms %
Change, 2002-2012 2002 2007 2012
Kentucky
Number of Firms 77,159 86,429 106,011 37.4%
Employment 84,096 89,059 92,529 10.0%
Sales ($000) $9,451,101 $12,381,271 $15,571,038 64.8%
Louisiana
Number of Firms 86,876 102,847 151,114 73.9%
Employment 114,635 110,631 131,804 15.0%
Sales ($000) $12,253,105 $22,092,433 $22,864,139 86.6%
Maine
Number of Firms 32,512 38,490 42,067 29.4%
Employment 26,510 29,648 43,706 64.9%
Sales ($000) $3,282,306 $3,541,893 $9,819,907 199.2%
Maryland
Number of Firms 137,410 172,115 209,119 52.2%
Employment 141,906 165,454 185,516 30.7%
Sales ($000) $17,295,183 $22,307,616 $29,255,875 69.2%
Massachusetts
Number of Firms 161,918 178,114 199,210 23.0%
Employment 173,368 167,928 178,196 2.8%
Sales ($000) $23,133,981 $25,487,227 $28,855,145 24.7%
Michigan
Number of Firms 217,673 248,421 306,986 41.0%
Employment 229,221 244,342 241,158 5.2%
Sales ($000) $29,216,689 $30,928,408 $37,995,011 30.0%
Minnesota
Number of Firms 123,905 133,237 157,821 27.4%
Employment 123,233 140,525 182,229 47.9%
Sales ($000) $16,251,660 $18,635,862 $24,621,142 51.5%
Mississippi
Number of Firms 47,102 60,846 89,159 89.3%
Employment 53,948 56,715 53,163 -1.5%
Sales ($000) $6,728,498 $8,572,422 $8,740,401 29.9%
Missouri
Number of Firms 120,443 130,726 162,616 35.0%
Employment 147,372 140,142 149,741 1.6%
Sales ($000) $18,604,649 $20,217,661 $24,012,343 29.1%

The Growth & Development of Women-Owned Enterprises in the U.S: 2002-2012 65
Table 10: Trend in Number, Employment, Revenues of Women-Owned Firms by State, 2002-2012
Women-Owned Firms %
Change, 2002-2012 2002 2007 2012
Montana
Number of Firms 24,519 28,129 35,449 44.6%
Employment 21,238 28,532 33,077 55.7%
Sales ($000) $2,138,505 $3,397,707 $4,395,426 105.5%
Nebraska
Number of Firms 38,679 41,003 51,936 34.3%
Employment 46,868 46,708 44,915 -4.2%
Sales ($000) $5,765,418 $6,432,875 $6,925,764 20.1%
Nevada
Number of Firms 47,675 63,317 82,508 73.1%
Employment 54,268 64,773 68,636 26.5%
Sales ($000) $8,643,138 $12,579,594 $13,995,046 61.9%
New Hampshire
Number of Firms 31,024 35,586 38,525 24.2%
Employment 37,731 36,984 36,233 -4.0%
Sales ($000) $4,665,353 $6,127,210 $6,198,020 32.9%
New Jersey
Number of Firms 185,197 213,398 252,944 36.6%
Employment 243,020 256,397 261,891 7.8%
Sales ($000) $35,573,077 $41,189,464 $49,535,493 39.2%
New Mexico
Number of Firms 42,254 49,886 59,044 39.7%
Employment 42,037 49,378 54,042 28.6%
Sales ($000) $4,714,288 $6,814,989 $7,955,951 68.8%
New York
Number of Firms 505,077 594,492 725,709 43.7%
Employment 469,207 466,606 560,576 19.5%
Sales ($000) $70,838,360 $84,046,898 $105,158,423 48.4%
North Carolina
Number of Firms 173,874 225,512 287,058 65.1%
Employment 224,736 253,009 267,751 19.1%
Sales ($000) $26,743,381 $32,023,015 $36,745,575 37.4%
North Dakota
Number of Firms 13,203 15,237 20,316 53.9%
Employment 11,651 16,120 23,963 105.7%
Sales ($000) $1,317,510 $1,860,625 $4,080,926 209.7%

The Growth & Development of Women-Owned Enterprises in the U.S: 2002-2012 66
Table 10: Trend in Number, Employment, Revenues of Women-Owned Firms by State, 2002-2012
Women-Owned Firms %
Change, 2002-2012 2002 2007 2012
Ohio
Number of Firms 229,972 249,114 306,824 33.4%
Employment 264,038 289,699 306,352 16.0%
Sales ($000) $32,314,892 $40,985,031 $43,896,112 35.8%
Oklahoma
Number of Firms 75,025 84,427 105,168 40.2%
Employment 92,546 96,698 107,744 16.4%
Sales ($000) $9,254,893 $14,717,185 $18,829,804 103.5%
Oregon
Number of Firms 88,317 103,620 123,015 39.3%
Employment 83,054 97,076 111,907 34.7%
Sales ($000) $10,608,262 $14,035,799 $16,771,680 58.1%
Pennsylvania
Number of Firms 227,117 265,136 304,803 34.2%
Employment 279,970 288,393 320,590 14.5%
Sales ($000) $38,998,092 $46,082,536 $51,459,230 32.0%
Rhode Island
Number of Firms 23,195 26,431 30,484 31.4%
Employment 25,562 22,417 27,423 7.3%
Sales ($000) $3,640,614 $3,339,397 $4,506,014 23.8%
South Carolina
Number of Firms 76,831 99,458 131,856 71.6%
Employment 92,773 100,308 106,174 14.4%
Sales ($000) $10,890,936 $14,149,756 $14,416,533 32.4%
South Dakota
Number of Firms 15,573 17,082 23,722 52.3%
Employment 14,718 17,117 21,840 48.4%
Sales ($000) $1,546,639 $2,052,027 $3,951,610 155.5%
Tennessee
Number of Firms 117,935 142,451 195,694 65.9%
Employment 116,955 126,083 142,983 22.3%
Sales ($000) $17,640,826 $21,387,001 $26,949,565 52.8%
Texas
Number of Firms 468,705 610,007 866,678 84.9%
Employment 553,843 592,308 778,860 40.6%
Sales ($000) $65,817,396 $97,094,681 $125,931,813 91.3%

The Growth & Development of Women-Owned Enterprises in the U.S: 2002-2012 67
Table 10: Trend in Number, Employment, Revenues of Women-Owned Firms by State, 2002-2012
Women-Owned Firms %
Change, 2002-2012 2002 2007 2012
Utah
Number of Firms 48,475 61,468 76,269 57.3%
Employment 53,497 56,739 70,724 32.2%
Sales ($000) $5,920,242 $10,142,709 $12,342,312 108.5%
Vermont
Number of Firms 18,989 20,447 23,417 23.3%
Employment 14,974 13,351 15,540 3.8%
Sales ($000) $1,454,095 $1,724,022 $2,217,470 52.5%
Virginia
Number of Firms 157,030 192,081 236,290 50.5%
Employment 183,468 199,248 253,543 38.2%
Sales ($000) $22,123,426 $30,272,850 $38,308,897 73.2%
Washington
Number of Firms 137,394 157,989 187,677 36.6%
Employment 126,818 149,093 174,866 37.9%
Sales ($000) $17,368,371 $23,103,402 $27,687,142 59.4%
West Virginia
Number of Firms 31,301 33,787 39,065 24.8%
Employment 31,539 36,095 39,788 26.2%
Sales ($000) $3,252,129 $4,777,819 $5,170,590 59.0%
Wisconsin
Number of Firms 104,170 112,418 133,859 28.5%
Employment 149,777 152,833 163,761 9.3%
Sales ($000) $17,582,321 $20,942,535 $24,815,580 41.1%
Wyoming
Number of Firms 12,945 15,610 19,344 49.4%
Employment 12,649 14,001 18,367 45.2%
Sales ($000) $1,129,837 $2,091,402 $3,026,334 167.9%
NOTE: DC and Wyoming 2002 employment among women-owned firms was not published by the Census Bureau, and is estimated based on 1997-2007 employment growth.

The Growth & Development of Women-Owned Enterprises in the U.S: 2002-2012 68
Table 11: Trend in Number, Employment, Revenues of Women-Owned Firms in 50 Most Populous Metropolitan Areas, 2002-2012
Women-Owned Firms
% Change, 2002-2012 2002 2007 2012
Total US
Number of Firms 6,489,483 7,793,139 9,878,397 52.2%
Employment 7,146,229 7,579,876 8,431,614 18.0%
Sales ($000) $940,774,986 $1,202,115,758 $1,419,834,295 50.9%
Atlanta GA
Number of Firms 124,061 175,588 242,721 95.6%
Employment 119,584 145,002 152,326 27.4%
Sales ($000) $21,595,902 $29,381,119 $31,474,751 45.7%
Austin TX
Number of Firms 33,387 45,282 63,918 91.4%
Employment 30,188 42,825 58,254 93.0%
Sales ($000) $4,005,269 $6,532,792 $8,687,378 116.9%
Baltimore MD
Number of Firms 60,089 76,866 93,177 55.1%
Employment 65,850 75,799 88,934 35.1%
Sales ($000) $8,071,993 $10,219,032 $14,316,004 77.4%
Birmingham AL
Number of Firms 20,049 27,563 33,254 65.9%
Employment 20,426 24,455 24,777 21.3%
Sales ($000) $2,969,895 $4,336,932 $4,913,624 65.4%
Boston MA/NH
Number of Firms 117,540 130,614 146,751 24.9%
Employment 127,947 120,670 130,204 1.8%
Sales ($000) $17,327,192 $19,873,085 $22,758,315 31.3%
Buffalo NY
Number of Firms 19,770 19,591 23,372 18.2%
Employment 23,168 20,270 26,732 15.4%
Sales ($000) $2,681,603 $2,526,172 $4,384,624 63.5%
Charlotte NC/SC
Number of Firms 30,932 45,038 73,756 138.4%
Employment 43,411 41,660 61,921 42.6%
Sales ($000) $4,532,647 $6,489,656 $10,654,109 135.1%
Chicago IL/IN/WI
Number of Firms 215,066 271,086 340,336 58.2%
Employment 269,756 266,866 266,192 -1.3%
Sales ($000) $37,378,856 $44,098,876 $47,629,668 27.4%

The Growth & Development of Women-Owned Enterprises in the U.S: 2002-2012 69
Table 11: Trend in Number, Employment, Revenues of Women-Owned Firms in 50 Most Populous Metropolitan Areas, 2002-2012
Women-Owned Firms
% Change, 2002-2012 2002 2007 2012
Cincinnati OH/KY/IN
Number of Firms 40,008 46,757 54,762 36.9%
Employment 48,305 50,979 56,421 16.8%
Sales ($000) $6,253,610 $8,480,250 $8,302,710 32.8%
Cleveland OH
Number of Firms 43,336 47,433 63,378 46.2%
Employment 51,865 62,327 63,967 23.3%
Sales ($000) $5,765,897 $7,026,864 $9,094,208 57.7%
Columbus OH
Number of Firms 38,766 46,749 59,239 52.8%
Employment 41,630 42,031 53,817 29.3%
Sales ($000) $6,917,861 $7,082,959 $8,344,903 20.6%
Dallas TX
Number of Firms 127,339 169,809 235,520 85.0%
Employment 156,263 151,029 197,542 26.4%
Sales ($000) $19,926,616 $28,099,286 $37,430,543 87.8%
Denver CO
Number of Firms 68,110 79,547 101,243 48.6%
Employment 69,053 71,881 86,002 24.5%
Sales ($000) $10,011,841 $13,528,376 $15,252,721 52.3%
Detroit MI
Number of Firms 96,268 115,787 157,090 63.2%
Employment 99,871 121,902 119,594 19.7%
Sales ($000) $14,769,692 $15,334,323 $18,698,444 26.6%
Hartford CT
Number of Firms 26,050 27,066 33,155 27.3%
Employment 28,150 28,400 32,553 15.6%
Sales ($000) $3,279,369 $4,546,050 $4,961,266 51.3%
Houston TX
Number of Firms 117,516 152,221 234,450 99.5%
Employment 142,305 152,928 194,566 36.7%
Sales ($000) $18,312,556 $30,014,828 $32,988,815 80.1%
Indianapolis IN
Number of Firms 33,260 40,056 57,362 72.5%
Employment 38,821 41,763 57,232 47.4%
Sales ($000) $5,294,177 $6,267,315 $9,258,614 74.9%

The Growth & Development of Women-Owned Enterprises in the U.S: 2002-2012 70
Table 11: Trend in Number, Employment, Revenues of Women-Owned Firms in 50 Most Populous Metropolitan Areas, 2002-2012
Women-Owned Firms
% Change, 2002-2012 2002 2007 2012
Jacksonville FL
Number of Firms 26,107 32,392 44,290 69.6%
Employment 26,549 31,560 34,081 28.4%
Sales ($000) $3,505,033 $5,142,837 $4,674,202 33.4%
Kansas City MO/KS
Number of Firms 43,725 49,027 58,155 33.0%
Employment 44,056 51,020 57,624 30.8%
Sales ($000) $5,918,956 $8,395,144 $10,424,554 76.1%
Las Vegas NV
Number of Firms 31,259 44,528 62,885 101.2%
Employment 36,993 46,033 49,727 34.4%
Sales ($000) $6,639,696 $9,347,461 $9,341,515 40.7%
Los Angeles CA
Number of Firms 345,436 409,830 558,831 61.8%
Employment 371,194 388,536 420,927 13.4%
Sales ($000) $59,692,294 $79,797,391 $85,567,333 43.3%
Louisville KY/IN
Number of Firms 26,569 28,586 33,222 25.0%
Employment 32,886 35,092 34,092 3.7%
Sales ($000) $3,882,696 $4,767,482 $5,255,357 35.4%
Memphis TN/MS/AR
Number of Firms 22,102 31,454 57,563 160.4%
Employment 24,931 22,557 28,106 12.7%
Sales ($000) $2,616,314 $3,453,621 $5,211,621 99.2%
Miami FL
Number of Firms 180,797 232,743 355,762 96.8%
Employment 153,586 140,608 173,160 12.7%
Sales ($000) $21,645,539 $26,697,251 $34,384,858 58.9%
Milwaukee WI
Number of Firms 28,720 32,479 40,520 41.1%
Employment 47,789 45,502 49,408 3.4%
Sales ($000) $5,086,040 $5,414,192 $6,242,362 22.7%
Minneapolis/St. Paul MN/WI
Number of Firms 81,607 90,372 109,300 33.9%
Employment 87,843 102,421 131,010 49.1%
Sales ($000) $11,760,385 $14,093,497 $17,841,743 51.7%

The Growth & Development of Women-Owned Enterprises in the U.S: 2002-2012 71
Table 11: Trend in Number, Employment, Revenues of Women-Owned Firms in 50 Most Populous Metropolitan Areas, 2002-2012
Women-Owned Firms
% Change, 2002-2012 2002 2007 2012
Nashville TN
Number of Firms 32,544 40,428 55,389 70.2%
Employment 31,062 36,816 36,186 16.5%
Sales ($000) $7,583,392 $9,553,712 $10,250,554 35.2%
New Orleans LA
Number of Firms 30,546 29,701 48,890 60.1%
Employment 41,938 34,421 43,386 3.5%
Sales ($000) $4,923,470 $6,688,045 $6,655,996 35.2%
New York NY/NJ/PA
Number of Firms 510,692 604,678 783,597 53.4%
Employment 521,585 508,301 623,123 19.5%
Sales ($000) $79,902,753 $94,662,980 $124,681,440 56.0%
Oklahoma City OK
Number of Firms 26,091 32,787 40,126 53.8%
Employment 32,397 32,222 41,095 26.8%
Sales ($000) $2,927,078 $5,547,331 $7,661,494 161.7%
Orlando FL
Number of Firms 40,270 61,699 91,290 126.7%
Employment 42,430 55,663 59,873 41.1%
Sales ($000) $9,951,891 $11,236,372 $11,619,107 16.8%
Philadelphia PA/NJ/DE/MD
Number of Firms 108,384 133,595 155,264 43.3%
Employment 133,675 136,632 151,409 13.3%
Sales ($000) $18,346,100 $24,083,914 $24,477,086 33.4%
Phoenix AZ
Number of Firms 70,816 83,379 121,689 71.8%
Employment 89,408 102,518 102,632 14.8%
Sales ($000) $11,478,738 $15,911,873 $16,545,275 44.1%
Pittsburgh PA
Number of Firms 44,287 48,360 54,959 24.1%
Employment 63,215 62,977 74,038 17.1%
Sales ($000) $8,031,733 $8,739,462 $9,961,399 24.0%
Portland OR/WA
Number of Firms 53,205 60,891 77,097 44.9%
Employment 49,786 58,414 64,901 30.4%
Sales ($000) $6,836,017 $9,847,888 $10,767,471 57.5%

The Growth & Development of Women-Owned Enterprises in the U.S: 2002-2012 72
Table 11: Trend in Number, Employment, Revenues of Women-Owned Firms in 50 Most Populous Metropolitan Areas, 2002-2012
Women-Owned Firms
% Change, 2002-2012 2002 2007 2012
Providence RI/MA
Number of Firms 34,142 37,318 42,559 24.7%
Employment 37,395 32,800 39,924 6.8%
Sales ($000) $6,068,120 $5,088,390 $6,743,782 11.1%
Raleigh NC
Number of Firms 21,996 28,828 38,337 74.3%
Employment 30,393 34,834 40,146 32.1%
Sales ($000) $3,203,091 $4,435,817 $5,559,463 73.6%
Richmond VA
Number of Firms 21,529 27,624 34,814 61.7%
Employment 28,248 30,335 35,649 26.2%
Sales ($000) $2,666,832 $3,384,246 $5,155,733 93.3%
Riverside CA
Number of Firms 70,259 95,982 129,589 84.4%
Employment 59,566 74,064 79,305 33.1%
Sales ($000) $10,678,569 $16,129,306 $17,062,291 59.8%
Sacramento CA
Number of Firms 46,266 55,495 61,073 32.0%
Employment 38,629 48,354 47,418 22.8%
Sales ($000) $4,679,379 $8,063,481 $8,176,003 74.7%
St. Louis MO/IL
Number of Firms 60,207 63,303 83,620 38.9%
Employment 84,251 75,828 80,283 -4.7%
Sales ($000) $10,563,737 $11,743,436 $12,160,979 15.1%
Salt Lake City UT
Number of Firms 21,619 27,673 32,197 48.9%
Employment 21,904 26,513 33,081 51.0%
Sales ($000) $3,011,880 $4,291,776 $6,470,827 114.8%
San Antonio TX
Number of Firms 33,859 48,531 68,128 101.2%
Employment 39,954 50,830 88,907 122.5%
Sales ($000) $5,843,605 $7,217,664 $12,253,430 109.7%
San Diego CA
Number of Firms 73,475 86,939 105,329 43.4%
Employment 85,177 89,648 98,005 15.1%
Sales ($000) $10,561,353 $13,085,211 $16,463,667 55.9%

The Growth & Development of Women-Owned Enterprises in the U.S: 2002-2012 73
Table 11: Trend in Number, Employment, Revenues of Women-Owned Firms in 50 Most Populous Metropolitan Areas, 2002-2012
Women-Owned Firms
% Change, 2002-2012 2002 2007 2012
San Francisco CA
Number of Firms 127,385 143,170 173,702 36.4%
Employment 135,695 119,819 144,831 6.7%
Sales ($000) $20,959,964 $23,103,858 $28,193,873 34.5%
San Jose CA
Number of Firms 38,386 47,498 60,189 56.8%
Employment 61,140 49,213 52,259 -14.5%
Sales ($000) $7,956,266 $10,086,189 $10,624,904 33.5%
Seattle WA
Number of Firms 77,784 88,263 108,033 38.9%
Employment 71,885 88,165 101,636 41.4%
Sales ($000) $10,885,690 $14,925,567 $17,302,486 58.9%
Tampa/St. Petersburg FL
Number of Firms 54,473 76,291 98,387 80.6%
Employment 60,301 78,771 71,419 18.4%
Sales ($000) $8,458,458 $11,546,243 $12,015,335 42.1%
Virginia Beach VA/NC
Number of Firms 29,157 36,445 45,459 55.9%
Employment 36,382 40,327 46,724 28.4%
Sales ($000) $3,976,280 $6,564,864 $6,919,805 74.0%
Washington DC/VA/MD/WV
Number of Firms 140,630 175,869 221,974 57.8%
Employment 150,514 175,301 215,300 43.0%
Sales ($000) $19,680,575 $26,964,072 $35,013,535 77.9%

The Growth & Development of Women-Owned Enterprises in the U.S: 2002-2012 74
Table 12: Metropolitan Area Boundary Changes Between 2002/07 & 2012
Metropolitan Area
MSA Boundary Changes
Counties Added Counties Removed
Atlanta GA Morgan
Austin TX
Baltimore MD
Birmingham AL
Boston MA/NH
Buffalo NY
Charlotte NC/SC Iredell Co. NC, Lincoln Co. NC, Rowan Co. NC, Chester Co. SC, Lancaster Co. SC
Anson Co. NC
Chicago IL/IN/WI
Cincinnati OH/KY/IN Franklin Co. IN
Cleveland OH
Columbus OH Hocking Perry
Dallas TX Hood, Somervell
Denver CO
Detroit MI
Hartford CT
Houston TX San Jacinto
Indianapolis IN Madison
Jacksonville FL
Kansas City MO/KS Franklin Co. KS
Las Vegas NV
Los Angeles CA
Louisville KY/IN Scott Co. IN Meade Co. KY, Nelson Co. KY
Memphis TN/MS/AR Benton Co. MS
Miami FL
Milwaukee WI
Minneapolis/St. Paul MN/WI LeSueur Co. MN, Mille Lacs Co. MN, Sibley Co. MN
Nashville TN Maury
New Orleans LA St. James Parish
New York NY/NJ/PA Dutchess Co. NY, Orange Co. NY
Oklahoma City OK
Orlando FL

The Growth & Development of Women-Owned Enterprises in the U.S: 2002-2012 75
Table 12: Metropolitan Area Boundary Changes Between 2002/07 & 2012
Metropolitan Area
MSA Boundary Changes
Counties Added Counties Removed
Philadelphia PA/NJ/DE/MD
Phoenix AZ
Pittsburgh PA
Portland OR/WA
Providence RI/MA
Raleigh NC
Richmond VA Cumberland, King and Queen, Louisa
Riverside CA
Sacramento CA
St. Louis MO/IL Washington Co. MO
Salt Lake City UT Summit
San Antonio TX
San Diego CA
San Francisco CA
San Jose CA
Seattle WA
Tampa/St. Petersburg FL
Virginia Beach VA/NC Gates Co. NC Surry Co. VA
Washington DC/VA/MD/WV Culpeper Co. VA, Rappahannock Co. VA

The Growth & Development of Women-Owned Enterprises in the U.S: 2002-2012 76
Table 13: Comparison of Growth in Number of Women-Owned Firms Pre- and Post-Recession
% Change, 2002-2007
% Change, 2007-2012
Post- vs. Pre-Recession Growth
1
Total US 20.1% 26.8% 7%
Race/Ethnicity
All minority-owned 145.0% 69.6% -75%
African American 66.7% 66.9% 0%
Asian American 54.0% 43.3% -11%
Latina 45.7% 86.6% 41%
Native American/Alaska Native 23.3% 35.8% 12%
Native Hawaiian/Pacific Islander 41.4% 67.0% 26%
Non-minority -0.3% 9.5% 10%
State
Alabama 31.4% 28.1% -3%
Alaska 9.3% 24.2% 15%
Arizona 25.8% 32.1% 6%
Arkansas 18.1% 29.7% 12%
California 19.4% 27.0% 8%
Colorado 18.4% 21.5% 3%
Connecticut 13.8% 14.1% 0%
Delaware 26.7% 23.2% -4%
District of Columbia 23.0% 40.3% 17%
Florida 32.9% 39.0% 6%
Georgia 41.9% 35.3% -7%
Hawaii 24.8% 18.9% -6%
Idaho 23.5% 26.8% 3%
Illinois 20.4% 21.7% 1%
Indiana 9.1% 25.6% 17%
Iowa 3.8% 24.3% 20%
Kansas 9.3% 18.4% 9%
Kentucky 12.0% 22.7% 11%
Louisiana 18.4% 46.9% 29%
Maine 18.4% 9.3% -9%
Maryland 25.3% 21.5% -4%
Massachusetts 10.0% 11.8% 2%
Michigan 14.1% 23.6% 9%
Minnesota 7.5% 18.5% 11%
Mississippi 29.2% 46.5% 17%
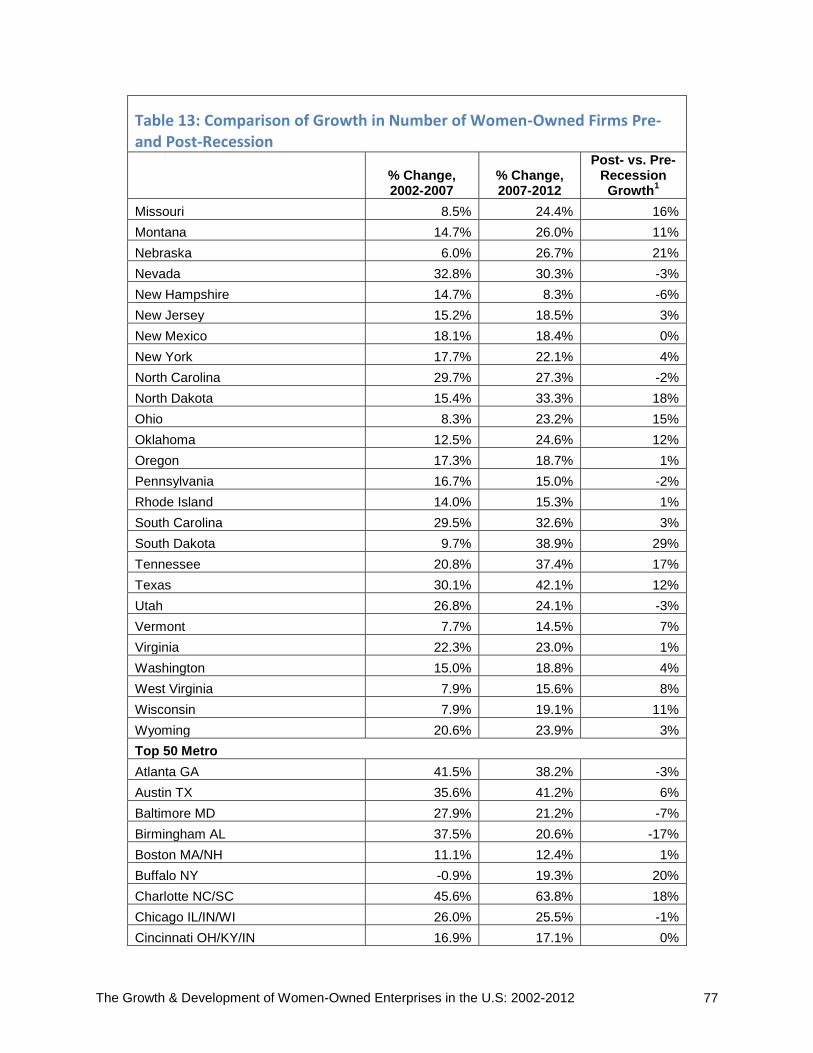
The Growth & Development of Women-Owned Enterprises in the U.S: 2002-2012 77
Table 13: Comparison of Growth in Number of Women-Owned Firms Pre- and Post-Recession
% Change, 2002-2007
% Change, 2007-2012
Post- vs. Pre-Recession Growth
1
Missouri 8.5% 24.4% 16%
Montana 14.7% 26.0% 11%
Nebraska 6.0% 26.7% 21%
Nevada 32.8% 30.3% -3%
New Hampshire 14.7% 8.3% -6%
New Jersey 15.2% 18.5% 3%
New Mexico 18.1% 18.4% 0%
New York 17.7% 22.1% 4%
North Carolina 29.7% 27.3% -2%
North Dakota 15.4% 33.3% 18%
Ohio 8.3% 23.2% 15%
Oklahoma 12.5% 24.6% 12%
Oregon 17.3% 18.7% 1%
Pennsylvania 16.7% 15.0% -2%
Rhode Island 14.0% 15.3% 1%
South Carolina 29.5% 32.6% 3%
South Dakota 9.7% 38.9% 29%
Tennessee 20.8% 37.4% 17%
Texas 30.1% 42.1% 12%
Utah 26.8% 24.1% -3%
Vermont 7.7% 14.5% 7%
Virginia 22.3% 23.0% 1%
Washington 15.0% 18.8% 4%
West Virginia 7.9% 15.6% 8%
Wisconsin 7.9% 19.1% 11%
Wyoming 20.6% 23.9% 3%
Top 50 Metro Areas
Atlanta GA 41.5% 38.2% -3%
Austin TX 35.6% 41.2% 6%
Baltimore MD 27.9% 21.2% -7%
Birmingham AL 37.5% 20.6% -17%
Boston MA/NH 11.1% 12.4% 1%
Buffalo NY -0.9% 19.3% 20%
Charlotte NC/SC 45.6% 63.8% 18%
Chicago IL/IN/WI 26.0% 25.5% -1%
Cincinnati OH/KY/IN 16.9% 17.1% 0%
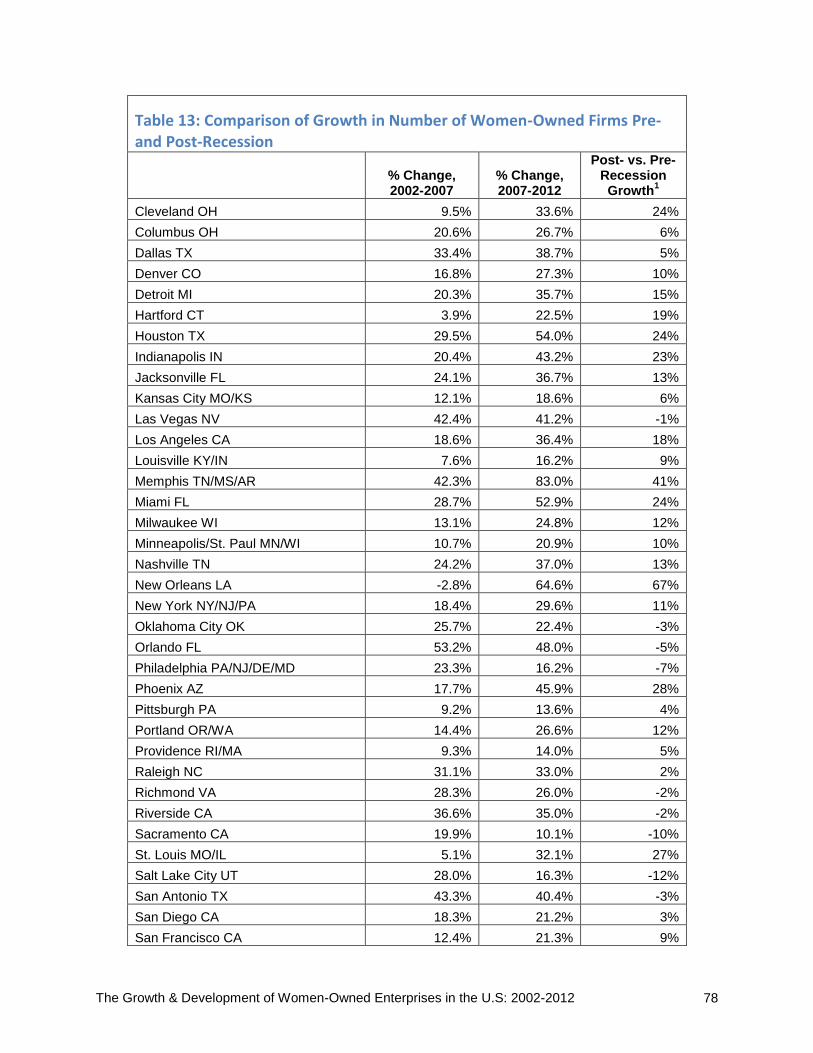
The Growth & Development of Women-Owned Enterprises in the U.S: 2002-2012 78
Table 13: Comparison of Growth in Number of Women-Owned Firms Pre- and Post-Recession
% Change, 2002-2007
% Change, 2007-2012
Post- vs. Pre-Recession Growth
1
Cleveland OH 9.5% 33.6% 24%
Columbus OH 20.6% 26.7% 6%
Dallas TX 33.4% 38.7% 5%
Denver CO 16.8% 27.3% 10%
Detroit MI 20.3% 35.7% 15%
Hartford CT 3.9% 22.5% 19%
Houston TX 29.5% 54.0% 24%
Indianapolis IN 20.4% 43.2% 23%
Jacksonville FL 24.1% 36.7% 13%
Kansas City MO/KS 12.1% 18.6% 6%
Las Vegas NV 42.4% 41.2% -1%
Los Angeles CA 18.6% 36.4% 18%
Louisville KY/IN 7.6% 16.2% 9%
Memphis TN/MS/AR 42.3% 83.0% 41%
Miami FL 28.7% 52.9% 24%
Milwaukee WI 13.1% 24.8% 12%
Minneapolis/St. Paul MN/WI 10.7% 20.9% 10%
Nashville TN 24.2% 37.0% 13%
New Orleans LA -2.8% 64.6% 67%
New York NY/NJ/PA 18.4% 29.6% 11%
Oklahoma City OK 25.7% 22.4% -3%
Orlando FL 53.2% 48.0% -5%
Philadelphia PA/NJ/DE/MD 23.3% 16.2% -7%
Phoenix AZ 17.7% 45.9% 28%
Pittsburgh PA 9.2% 13.6% 4%
Portland OR/WA 14.4% 26.6% 12%
Providence RI/MA 9.3% 14.0% 5%
Raleigh NC 31.1% 33.0% 2%
Richmond VA 28.3% 26.0% -2%
Riverside CA 36.6% 35.0% -2%
Sacramento CA 19.9% 10.1% -10%
St. Louis MO/IL 5.1% 32.1% 27%
Salt Lake City UT 28.0% 16.3% -12%
San Antonio TX 43.3% 40.4% -3%
San Diego CA 18.3% 21.2% 3%
San Francisco CA 12.4% 21.3% 9%

The Growth & Development of Women-Owned Enterprises in the U.S: 2002-2012 79
Table 13: Comparison of Growth in Number of Women-Owned Firms Pre- and Post-Recession
% Change, 2002-2007
% Change, 2007-2012
Post- vs. Pre-Recession Growth
1
San Jose CA 23.7% 26.7% 3%
Seattle WA 13.5% 22.4% 9%
Tampa/St. Petersburg FL 40.1% 29.0% -11%
Virginia Beach VA/NC 25.0% 24.7% 0%
Washington DC/VA/MD/WV 25.1% 26.2% 1%
1 Post- vs. pre-recession growth difference calculated by subtracting pre-recession (2002-2007) growth
rate from post-recession (2007-2012) growth rate. If the number is positive, post-recession growth is greater than pre-recession growth. Conversely, a negative number means that post-recession growth lags pre-recession growth.