the growing and glowing toolbox of fluorescent and photoactive proteinsshulab.ucsf.edu/pub...
TRANSCRIPT

TrendsMonomeric red and far-red FPs andindicators now perform nearly as wellas the best green FPs (and indicators).
Reversible and irreversible photochro-mism in FPs can be exploited toincrease optical resolution and improvecontrast compared with traditionalfluorescence microscopy.
Infrared FPs (IFPs) are becoming evermore useful as labels for various pro-teins that allow correct localization andwhole-animal imaging. IFPs can serveas an additional fluorescent ‘color’ forsimultaneous imaging with visible FP-labeled proteins.
Bacterial phytochrome (BphP)-basedIFPs provide a new scaffold for engi-neering fluorogenic indicators, whichare ideal to visualize spatiotemporaldynamics of cell signaling in vivo.
Small ultra-red FP ([3_TD$DIFF]smURFP) is thebrightest far-red nonprototypical FP(comparable with EGFP) and is extre-mely photostable. [3_TD$DIFF]smURFP may proveparticularlyuseful asaphotostableFP forsuper-resolution imaging and as a FRETacceptor for biosensing applications.
The engineering of new fluorescentindicators that combine features ofprototypical FP-based indicators withphotochromic proteins can reveal thecellular maps of biochemical activitiesin super-resolution.
FPs can be used as optogenetic actua-tors to manipulate cellular and proteinfunctions through chromophore-assisted light inactivation or light-con-trolled protein oligomerization.
Series: Superlative Sequels
Feature Review
The Growing and GlowingToolbox of Fluorescent andPhotoactive ProteinsErik A. Rodriguez,1,* Robert E. Campbell,2,* John Y. Lin,3,*Michael Z. Lin,4,5,* Atsushi Miyawaki,6,* Amy E. Palmer,7,*Xiaokun Shu,8,9,* Jin Zhang,1,* and Roger Y. Tsien1,10,*
Over the past 20 years, protein engineering has been extensively used toimprove and modify the fundamental properties of fluorescent proteins (FPs)with the goal of adapting them for a fantastic range of applications. FPs havebeen modified by a combination of rational design, structure-based mutagene-sis, and countless cycles of directed evolution (gene diversification followed byselection of clones with desired properties) that have collectively pushed theproperties to photophysical and biochemical extremes. In this review, weprovide both a summary of the progress that has been made during the pasttwo decades, and a broad overview of the current state of FP development andapplications in mammalian systems.
Prototypical FPsThe initial demonstration in 1994 that the Aequorea victoria jellyfish (class Hydrozoa) greenfluorescent protein (avGFP; Figure 1A) could function as a genetically encodable fluorescent tag[1] was followed by rapid-fire protein-engineering efforts to fine tune its biochemical andfluorescent properties and expand the color palette to encompass blue, cyan, and yellowvariants [2,3]. Further genomic exploration of marine organisms soon led to the discovery ofadditional prototypical FPs (i.e., homologs of avGFP) from class Anthozoa [4], including theDiscosoma striata mushroom anemone, which gave rise to DsRed and subsequent mFruitprogeny (Figure 1B) [5,6], and the sea anemone Entacmaea quadricolor, which yielded eqFP,TagRFP, mKate, and mRuby derivatives, among others [7–10]. FPs from these speciesextended the color palette into the orange, red, and [15_TD$DIFF]farred. Accompanying this evolution ofprototypical FPs, new classes of nonprototypical FP based on the binding of flavin mononucle-otide (FMN) [11], phycocyanobilin [12], biliverdin [13], or bilirubin [14], have emerged in recentyears. Figure 2A shows the trajectory of FP development, with emphasis on the wild-type rootsof modern variants.
One of the primary goals of FP engineering has been to develop brighter FPs. The brighter an FP,the lower the intracellular concentration that can be reliably imaged with sufficient fluorescentcontrast relative to the autofluorescent background. The intrinsic fluorescent brightness (seeGlossary) of a fluorophore is proportional to the product of the molecular extinction coefficient (e)and the fluorescence quantum yield (F). However, practically speaking, the apparent brightnessin cells is highly dependent on additional environmental factors. Therefore, many mutationalstrategies have targeted improving gene expression by optimizing codon usage, facilitatingprotein folding, promoting the extent and rate of chromophore maturation, and increasing
Trends in Biochemical Sciences, February 2017, Vol. 42, No. 2 http://dx.doi.org/10.1016/j.tibs.2016.09.010 111© 2016 Elsevier Ltd. All rights reserved.

1Department of Pharmacology,University of California, San Diego, LaJolla, CA 92093, USA2Department of Chemistry, Universityof Alberta, Edmonton, AB, T6G 2G2,Canada3School of Medicine, University ofTasmania, Hobart, TAS 7000, Australia4Department of Bioengineering,Stanford University, Stanford, CA,94305, USA5Department of Pediatrics, StanfordUniversity, Stanford, CA, 94305, USA6Laboratory for Cell FunctionDynamics, Brain Science Institute,RIKEN, 2-1 Hirosawa, Wako, Saitama,351-0198, Japan7Department of Chemistry andBiochemistry, BioFrontiers Institute,University of Colorado, Boulder, CO,80303, USA8Department of PharmaceuticalChemistry, University of California,San Francisco, San Francisco, CA,94158, USA9Cardiovascular Research Institute,University of California, San Francisco,San Francisco, CA, 94158, USA10Howard Hughes Medical Institute,University [10_TD$DIFF]of California, [11_TD$DIFF]San Diego, LaJolla, CA, [12_TD$DIFF] 92093, USA
*Correspondence: [email protected](E.A. Rodriguez), [email protected](R.E. Campbell), [email protected](J.Y. Lin), [email protected] (M.Z. Lin),[email protected](A. Miyawaki),[email protected](A.E. Palmer), [email protected](X. Shu), [email protected] (J. Zhang),[email protected] (R.Y. Tsien).
(A)
(C) (D) (E)
(B)
Figure 1. Structural Representations of Fluorescent Proteins (FPs). (A) Aequorea green FP (GFP) with thechromophore represented in green [Protein Data Bank (PDB) ID 1EMA) [160]. (B) The monomeric DsRed-derived RFPknown as mCherry with the chromophore represented in orange (PDB ID 2H5Q) [161]. (C) IFP2.0 derived from abacteriophytochrome with bound biliverdin in purple (PDB ID 4CQH) [32]. (D) A representation of a cyanobacterialallophycocyanin /-subunit that is homologous to small ultra-red FP ([3_TD$DIFF]smURFP), with bound biliverdin shown in red(PDB 4PO5) [162]. (E) Structure of UnaG with bound bilirubin shown in green (PDB ID 4I3B) [14].
protein stability by reducing the influence of environmental perturbations, such as pH and O2.Given that most FPs are naturally dimeric or tetrameric, substantial effort has also been aimed atengineering monomeric variants [5]. Figure 2B provides a summary of FP brightness withrespect to the wavelength of maximum excitation and with reference to commonly availablelaser lines.
Despite 20 years of FP engineering, there remains substantial room for improvement of FPs [16_TD$DIFF] (seeOutstanding Questions). For instance, two new GFPs, mClover3 [15] and mNeonGreen [16],have recently emerged as the new benchmark for brightness (approximately a 2.5-fold increasecompared with mEGFP). mClover3 was engineered from avGFP by combining key insightsaccumulated from years of evolution, including the identification of positions that influenced theH-bonding network surrounding the chromophore, stacking residues that shift the energy ofemission, and residues that influence photostability and folding [15,17]. By contrast, mNeon-Green emerged from an underexplored lineage and was created by incorporating 21 mutationsinto the yellow FP derived from Branchiostoma lanceolatum, LanYFP [16], suggesting that thereremains untapped potential in additional marine species. These examples reveal that there maybe considerable room for improvement of prototypical FPs using approaches such as the meta-analysis of protein-engineering efforts and identifying new lineages of b-barrel FPs. Yet anotherapproach is to discover or engineer nonprototypical classes of FP, such as FMN-bindingproteins, which have the advantage (relative to avGFP homologs) of developing fluorescencein low-oxygen environments [11,18,19].
112 Trends in Biochemical Sciences, February 2017, Vol. 42, No. 2

GlossaryIntensiometric fluorescent signal:a change in fluorescence intensity (i.e., either an increase or decrease) ata single wavelength.Intrinsic fluorescent brightness:the product of the molecularextinction coefficient (e) and thefluorescence quantum yield (F)Optogenetic actuator: a geneticallyencoded protein that undergoes anillumination-dependent change infunction that induces, disrupts, orotherwise changes a cellular function.Photoactivated localizationmicroscopy (PALM) andstochastic optical reconstructionmicroscopy (STORM): super-resolution imaging modality in whichan image is constructed from amultitude of single fluorophorelocalizations, where each localizationis determined to a resolution higherthan the diffraction limit.Ratiometric fluorescent signal: achange in the ratio of fluorescenceintensity at one wavelength relative tothe fluorescent intensity at a secondwavelength.Stimulated emission depletion(STED): a super-resolution imagingmodality in which a first laser beam isused to excite fluorescence and asecond donut-shaped laser beam isused to confine the size of theexcitation spot to smaller than thediffraction limit.
1994199519961997199819992000200120022003200420052006200720082009201020112012201320142015
450 500 550 600 650 700Emission wavelength (nm)
3
2.5
2
1.5
1
0.5
0350 400 450 500
Excita�on wavelength (nm)
Brig
htne
ss (ε
× Φ
) Rel
a�ve
to EGFP
550 600 650 700
(A)
(B)
Year
Figure 2. An Overview of Genetically Encoded Fluorophores Introduced since the Advent of Wild-TypeAequorea victoriaGreen Fluorescent Protein (avGFP) in 1994. (A) This chart includes fluorescent proteins (FPs) thatare 11-stranded b-barrel homologs of avGFP, as well as proteins that are fluorescent when bound to a biliverdin or bilirubinchromophore. Placement along the vertical axis represents the year in which the FP was first introduced, while placementalong the horizontal axis represents the peak emission wavelength. (B) Intrinsic fluorescent brightness (e � F) of selectedFPs is plotted relative to EGFP as a function of peak excitation wavelength. Vertical lines at 405 nm, 440 nm, 488 nm,515 nm, 561 nm, 591 nm, and 647 nm correspond to commonly available laser lines on fluorescence microscopes.
Trends in Biochemical Sciences, February 2017, Vol. 42, No. 2 113

Although FPs are undoubtedly powerful tools for a variety of cell biological applications, asresearchers have pushed the boundaries to longer-term imaging and more specialized subcel-lular compartments, limitations of the existing toolset have been uncovered. For example, long-term expression of red FPs often leads to the accumulation of puncta that colocalize withlysosomes, perhaps due to the resistance of highly stable RFPs to lysosomal proteases [20–23].Many FPs characterized asmonomeric have been shown to interact when expressed as a fusionto membrane proteins [24,25]. Finally, inadvertent glycosylation sites and cysteine residues canlead to the formation of intermolecular disulfide bonds, leading to higher-order oligomers andinterfering with chromophore formation, potentially causing mislocalization, particularly in thecrowded and oxidizing environment of the secretory pathway [23]. Some recent engineeringefforts have attempted to alleviate these limitations. For example, FusionRed was designed frommKate with mutations that reduce toxicity, improve performance in fusions, and enhancemonomericity [22], and cysteine-less blue, cyan, green, and yellow FPs (oxFPs) have beendeveloped for use in oxidizing compartments [23].
Infrared FPs and Indicators: Advantages and CaveatsLong-wavelength light between 650 and 900 nm penetrates the furthest through animal tissuebecause the combined effects of tissue absorbance (i.e., from hemoglobin, water, and lipids)and light scattering are at a minimum [26,27]. Accordingly, infrared FPs (IFPs) are preferred foruse as protein tags and genetically encoded indicators for in vivo imaging applications [13].Given that avGFP homologs with excitation in the near-infrared range have been neitherdiscovered in nature nor engineered in the lab, researchers have turned to bacterial phyto-chromes (BphPs) as templates for engineering IFPs (Figure 1C). BphPs belong to the phyto-chrome red/far-red photoreceptor superfamily [28,29] and typically exhibit maximumabsorbance at approximately 650–700 nm, but are natively not fluorescent. In nature, thechromophore of BphPs is a covalently bound biliverdin (BV), a linear tetrapyrrole that is producedby heme oxygenase 1 (HO-1) as the chief catabolic metabolite of heme. This strategy buildsupon the pioneering work of Lagarias and coworkers, who developed red and near-infraredfluorescent ‘Phytofluors’ from phytochrome proteins [12,30]. In contrast to BV-binding BphPs,the earlier Phytofluor proteins required linear tetrapyrrole molecules, such as phycoerythrobilinand phycocyanobilin, which are not produced by mammalian cells.
The first example of utilizing BphPs in mammalian imaging was IFP1.4, which was engineeredfrom a truncated DrBphP from Deinococcus radiodurans [13]. The utility of IFP1.4 was demon-strated by fluorescence imaging of the liver in intact mice. Since thousands of bacteriophyto-chrome-like sequences have been reported, this work opened a new door in engineering long-wavelength FPs. Indeed, soon after, iRFP was engineered from RpBphP2 from Rhodopseu-domonas palustris and used for imaging of mouse liver with improved brightness [31]. iRFP hassimilar molecular brightness to that of IFP1.4, but is significantly brighter in cells and, thus,appears to utilize endogenous BV better than does IFP1.4. IFP2.0, the improved version ofIFP1.4, was demonstrated to have similar brightness to that of iRFP when imaging brain tumorsin intact mice [32]. Yet other IFPs include:Wi-Phy, derived from truncatedDrBphP [33]; iRFP720,a red-shifted iRFP mutant; iRFP670 and iRFP702, both derived from RpBphP6 [34]; mIFP,engineered fromBrBphP (see below) [35]; and iBlueberry, a rationally designedmIFP variant witha �40-nm blue shift in both excitation and emission [36].
To optimally serve as a protein fusion tag, an IFP should be monomeric so as not to perturb thestoichiometry of the protein of interest, which may affect protein function and/or trafficking.Based on sequence and structural analysis of the dimer interface, a bacteriophytochrome fromBradyrhizobium that is monomeric in its truncated form was identified from a sequence data-base, and was engineered into a naturally monomeric IFP (mIFP) [35]. mIFP can be used to labelvarious proteins in live cells, Drosophila, and zebrafish, and, unlike dimeric iRFP, can be used to
114 Trends in Biochemical Sciences, February 2017, Vol. 42, No. 2

efficiently label the fine structure of dendrites in Drosophila. However, while mIFP is useful fortagging and imaging proteins, it is about five times less photostable compared with iRFP.Generally speaking, this is not a limiting factor for whole-animal imaging since the low-excitationlight intensities typically used [36] permit the acquisition of tens of thousands of images within thephotobleaching half-time of mIFP. However, the relatively low photostability can limit the durationof time-lapse imaging experiments with mIFP-tagged proteins in live cells. Accordingly, inaddition to improving the intrinsic brightness, a future direction for mIFP development shouldfocus on increasing the photostability of monomeric IFPs or engineering a monomeric iRFP forprotein labeling.
One caveat of BphP-derived IFPs is that the fluorescence depends on BV concentration, whichvaries in different cells and organisms. In Drosophila and zebrafish, BV concentration is limited[32,35]. In mammals, neurons appear to have low concentration of BV. Thus, usage of BphP-derived IFPs is limited in these organisms and cell types. However, this may provide anopportunity for inducible fluorescence by delivering exogenous BV, which might open newapplications, such as pulse-chase labeling. Other than the exogenous addition of BV, one way ofovercoming this limitation is co-expression of HO-1, which converts heme into BV. For example,HO-1 co-expression improves IFP2.0 fluorescence in Drosophila, mice brain tumors [32], andzebrafish [35]. HO-1 has been reported to have anti-inflammatory and antioxidative functions viaits products, and its expression is highly induced in response to pathophysiological stress [37].Although HO-1 overexpressionmay introduce biological perturbation, such toxicity has not beenobserved in Drosophila and zebrafish. Nevertheless, an appropriate control is recommendedwhen BphP-derived IFPs are used in cells and animals even without overexpression of HO-1.This is because expression of BV-binding IFPs may perturb the endogenous pool of BV and BV-derived bilirubin, which is lipophilic and has antioxidant and cytoprotective roles in protectinglipids from oxidation, complementing the water-soluble glutathione that protects water-solubleproteins [38].
Since BphP-derived IFPs have a completely different protein structure (Figure 1C) to that of the11-stranded b-barrel coelenterate FPs (Figure 1A,B), IFPs provide new opportunities for engi-neering genetically encoded indicators. An infrared fluorogenic executioner caspase reporter(iCasper) was recently developed, based on the unique interactions between mIFP and itschromophore [39] (Figure 3). iCasper was used in imaging embryonic development inDrosophilaand revealed interesting spatiotemporal coordination between cell apoptosis and embryonicmorphogenesis, as well as dynamics of apoptosis during tumorigenesis in the brain of Dro-sophila [39]. The iCasper technology should be easily adaptable for various protease activities,
C C
G
N
PASGAF
DEVDG
N 00:00 00:18 00:36 00:42
00:54 01:00 01:02 01:10PASGAF
DEVD
Caspase-3
(A) (B)
Figure 3. Design of an Infrared Fluorescent Protein (IFP) Protease Indicator. (A) Cartoon showing the cleavage and activation of iCasper. iCasper enablesimaging of caspase-3 activation during apoptosis, one type of programed cell death. (B) iCasper enables the visualization of the spatiotemporal dynamics of apoptosis invivo. Time-lapse images of neurons in the ventral nerve cord inDrosophila reveal caspase activation and apoptotic cell shape change during central nervous system (CNS)development. The neuron undergoing apoptosis is indicated with the arrow. The number at the top-right corner of each panel refers to time (h:min). Note that the neuronsalso express membrane-targeted green fluorescent protein (GFP), which is brighter than the split GFP fluorescence from iCasper. Scale bar = 10 mm.
Trends in Biochemical Sciences, February 2017, Vol. 42, No. 2 115

enabling the dissection of signaling pathways that regulate protease activity, high-throughputscreening of protease inhibitors for drug development, and in vivo biological studies. Thedevelopment of the iCasper technology demonstrates that BphP-derived IFPs provide anew and promising scaffold for designing fluorogenic indicators (e.g., of kinase activity andmembrane potential) that will be ideal for visualizing the spatiotemporal dynamics of cell signalingin vivo.
A New Class of Far-Red FPs based on the Allophycocyanin a-Subunit fromA Cyanobacterial PhycobiliproteinsIn an effort to further expand the color palette of FPs and improve upon the relatively low quantumyields and poor stability [13,31] of BphP-derived IFPs, a new class of FP was recently developedfrom an allophycocyanin/-subunit (APC/) from the cyanobacterium Trichodesmium erythraeum[40]. Native APC is a highly fluorescent hexamer that requires an auxiliary lyase to incorporatephycocyanobilin (PCB). To develop a useful FP from native APC, the protein was engineered to beself-sufficient (i.e., no lyase required) to covalently incorporate a BV rather than a PCB chromo-phore. The protein was then subjected to 12 rounds of directed evolution for bright fluorescenceand low cytotoxicity to Escherichia coli. This effort ultimately led a bright APC/-derived FP thatwas designated ‘small Ultra-Red FP’ (smURFP) [40] because its light-blue color when viewedunder white light is reminiscent of the ‘Smurf’ cartoon characters (Figure 4A). [3_TD$DIFF]smURFP is ahomodimer of 15-kDa subunits (Figure 1D) and has excitation and emission maxima at 642 nmand 670 nm, respectively. [3_TD$DIFF]smURFP has an exceptionally large extinction coefficient(e = 180 000 M–1
[9_TD$DIFF]cm–1) and a modest quantum yield (F = 0.18), resulting in an intrinsic fluores-cent brightness that is similar to that of EGFP. Accordingly, smURFP is the brightest far-red(conventionally defined as FPs with emission maxima between 633 and 670 nm) or near-infrared(emission maximum greater than 670 nm) FP yet reported (Figure 2B). Due to the limitingconcentration of BV in mammalian cells [41], treatment of transfected cells with 1–5 mM BVdimethyl ester (BVMe2) is typically necessary to obtain the brightest fluorescence. Yet otherfavorable properties of smURFP include extremely good photostability and good expression inneurons (Figure 4B) with no apparent formation of fluorescent puncta.
Using smURFP and IFP2.0, a far-red/near-infrared fluorescent ubiquitination-based cell cycleindicator (FUCCI) [42] was created (Figure 4C). This new indicator could be combined with thepreviously reported visible FP-based FUCCI for imaging cell cycle progression in two distinct celltypes [40]. [3_TD$DIFF]smURFP expressed in HT1080 tumor rodent xenografts showed fluorescence even
(A) (B) (C) (D)
Figure 4. Small Ultra-Red FP ( [3_TD$DIFF]smURFP): A Far-Red, Biliverdin-Binding Fluorescent Protein Derived from the Allophycocyanin /-Subunit from theCyanobacterium Trichodesmium erythraeum. (A) Purified smURFP (left) shows color reminiscent of the cartoon character's (Smurf) skin. (B) [3_TD$DIFF]smURFP expressed inprimary rat neurons. (C) Far-red/near-infrared fluorescent ubiquitination-based cell cycle indicator (FUCCI) expressed in HEK293A cells. Red-tinted fluorescencecorresponds to smURFP, which illuminates the G0/G1 phases, while green-tinted fluorescence corresponds to IFP2.0, which illuminates the S/G2/M phases. (D) HT1080tumor xenografts stably expressing smURFP. Fluorescence is visible without injection of exogenous biliverdin (BV).
116 Trends in Biochemical Sciences, February 2017, Vol. 42, No. 2

without the addition of exogenous BV (Figure 4D), although the fluorescence intensity was lessthan with mCherry or mCardinal under similar conditions.
A Bilirubin-Inducible FP from the Vertebrate SubphylumRecent years have seen the increasing recognition of the prevalence of biological fluorescence invertebrates. One such vertebrate is the Japanese eel, Anguilla japonica [43], which exhibitsgreen fluorescence from its skeletal muscle. The gene responsible for this green fluorescencewas cloned [14] and found to encode a 16.9-kD polypeptide in the fatty-acid binding protein(FABP) family [44–46]. The protein, which was named UnaG (Figure 1E), had no intrinsicfluorescence but showed bright green emission in mammalian cells and biological mixtureseven under anaerobic conditions. Extensive screening revealed the chromophore to be bilirubin,a lipophilic bilin that is the reduction product of BV, a clinical diagnostic for liver function, andresponsible for the diseases jaundice and kernicterus [47–49]. UnaG binds to bilirubin non-covalently with high affinity (Kd = 98 pM) and high specificity. These favorable properties enabledUnaG to be used to quantify serum levels of bilirubin from humans [14].
As an alternative to avGFP for live cell fluorescence imaging, UnaG has the inherent advantagesof a smaller gene size (which may facilitate packaging in viral vectors with limited DNA capacity),and the ability to develop fluorescence in anaerobic conditions when bilirubin is supplied fromserum. Accordingly, UnaG fills an important niche in the toolbox of genetically encodedfluorophores and is likely to serve as the prototype for a growing class of fluorescence-basedindicators [50–52].
Harnessing FP Photochromism for Super-resolution Microscopy orEnhancing ContrastWhile most FP-engineering efforts have focused on making improved tools for traditionalfluorescence microscopy, there has been a parallel effort to develop FPs that switch betweenmolecular states (photochromism). FP photochromism was first demonstrated in 1997 byMoerner, Tsien, and colleagues, who established that single molecules of yellow FPs exhibitedintermittent fluorescence emission (i.e., blinking) and that molecules trapped in a long-lived dark‘off’ state could be converted back into the ‘on’ state by illumination with high-energy (405 nm)light [53]. Subsequent spectroscopic studies have largely reinforced the model of dark-stateconversion proposed by Moerner and colleagues, and have revealed multiple mechanisms forexcited-state and dark-state transitions, including conformational dynamics of the chromo-phore, such as cis-trans isomerization [54,55], excited-state proton transfer, excited-statesolvation dynamics [56–58], and triplet state conversion [59]. However, it was not until 2002that mutagenesis was first used to accentuate this photochromism, leading to the first designedphotoactivatable avGFP (PA-GFP) [60]. The notion that proteins could be engineered forimproved photochromism helped pave the way for the rapid expansion of super-resolutionmicroscopy platforms that exploit transitions between molecular states to localize moleculeswith high precision.
Since the original development of microscopies that rely on the switching of molecules betweendifferent molecular states to improve spatial resolution, such as stimulated emission deple-tion (STED) [61,62], photo-activated localization microscopy (PALM) [63], and stochasticoptical reconstruction microscopy (STORM) [64], there has been a rapid proliferation oftechniques that exploit the complex photochromism of FPs to improve spatial resolution and/orenhance fluorescence contrast (Table 1). Photochromism in FPs can be reversible or irreversible,inducible or spontaneous, and can occur on a range of timescales, from �1-ms recovery fromtriplet states [59] to 10–1000-ms recovery from transient dark states that can be either photo-protective or photoreactive [65], or even much slower recovery from kinetically trapped darkstates from which irradiation can induce transition back to bright state [53]. Not surprisingly,
Trends in Biochemical Sciences, February 2017, Vol. 42, No. 2 117

Table 1. Fluorescence Imaging Modalities that Exploit FP Photochromism
Microscopy Photochromism Commonlyused FPs
Desired [5_TD$DIFF]properties for [6_TD$DIFF]optimal[7_TD$DIFF]performance
Refs
PALM/STORM Photoactivation,photoconversion,reversiblephotoswitching
mEos3.2,mMaple2 or 3,PA-mCherry
High number of photons emitted/switching cycle; ratio of rate constantfor on/off switching
[66–68]
RESOLFT Reversiblephotoswitching
rsEGFP2 Rapid switching kinetics betweenon/off states; high contrast ratiobetween on/off states; number ofswitching cycles before photobleaching
[70]
Stochastic opticalfluctuation imaging(SOFI), pcSOFI
Spontaneous orlight-induceddark-stateconversion
Dronpa,rsTagRFP,Skylan-S
Fluorescence fluctuations that are slowcompared with timescale of acquisitiontime (tens of ms); photostable enoughto allow visualization of fluctuations overduration of experiment
[71,163–165]
SAFIRe Dark-statelifetime
Long-lived dark state with red-shiftedabsorption
[166,167]
OLID, OPIOM Photoswitchingkinetics
Photoswitching dynamics matchedto modulation of excitation light
[168,169]
different modalities exploit different photophysical properties, and have different requirementsfor optimal performance, as outlined in Table 1. While several FPs have been explicitly engi-neered based on irreversible photochromism for PALM/STORM requirements [66–69], only afew FPs have been screened for microscopies that exploit reversible photochromism [70,71].Sophisticated screens could be developed to explore the parameter space [72,73], perhapsleading to greater insight into the mechanism(s) of these processes and probes optimized forspecific imaging modalities.
Resolving Biochemical Activities in Super-resolutionIt has become increasingly clear that biochemical activities within the cell are often spatiallycompartmentalized into regions, with sizes as small as tens of nanometers, known as micro- ornanodomains [74]. While a large number of FP-based indicators have been developed to trackthese biochemical events in living cells using standard fluorescence microscopy [75,76], thereare now a growing number of examples in which fluorescent indicators have been paired withsuper-resolution imaging methods to produce cellular maps of biochemical activities in highresolution.
A typical fluorescent indicator comprises a ‘sensing element’ to detect the target biochemicalactivity and a ‘reporting element’ to translate the biochemical event into a change in thefluorescent readout [77]. Depending on the reporting element, the indicators can be categorizedinto different classes, such as those based on the translocation of fluorescence (Figure 5A),change in Förster resonance energy transfer (FRET) efficiency (Figure 5B), and change in thefluorescence of a single fluorescent protein (Figure 6A).
Our understanding of phosphoinositide (PI) dynamics has benefited from a series of indicatorsdesigned to track the changes in various PI species in individual cells [78]. These probes, whichgenerally comprise a standard FP (the reporting element) fused to a protein domain thatspecifically binds a PI (the sensing element), typically rely upon translocation of the probe tothe specific membrane compartment to report on the generation of the PI species under study.Given the controversial model of lipid rafts and interest in probing lipid nanodomains in theplasma membrane [79], it is tempting to use these PI indicators to map PI distribution in the live
118 Trends in Biochemical Sciences, February 2017, Vol. 42, No. 2

(A)
(B)
Cytosolicfluorescence
Plasmamembrane-localized
fluorescence
Low FRET High FRET
KinaseCFP
Phosphatase P
Substrate
PAABD
YFP
Figure 5. Schematic Representations of Indicators for Imaging of Intracellular Signaling Activity. (A) Transloca-tion-based indicator design. (B) Intramolecular Förster resonance energy transfer (FRET)-based design of a kinase activityindicator.
cell membrane under high resolution, but this task is not trivial. One of the complicating factors isthat direct observation of lipid clusters at a nanometer-length scale is hampered by the diffractionof light. To overcome this limitation, researchers have combined FP-based PI indicators andsuper-resolution imaging to quantify PIs in the plasma membrane and visualize their distribution.In a recent study [80], PALM was used to visualize and quantify phosphatidylinositol 3-phos-phate (PI3P), a lipid involved in endocytosis and membrane transport. A photoswitchable FP,mEos2 [81], was fused to a PI3P-binding domain (a double FYVE domain of EEA1) to construct asuper-resolution compatible PI3P indicator. Although colocalization experiments using differentmarkers suggested that mEos2 did not alter the localization pattern of the FYVE domain in thiscase despite its propensity to dimerize [68], the nondimerizing variant mEos3.2 should provide abetter alternative to eliminate any potential dimerization artifacts. In a separate study, van denBogaart et al. used a phosphatidylinositol 4,5-bisphosphate (PIP2) indicator (the pleckstrinhomology domain of protein lipase C delta fused to [18_TD$DIFF]Citrine) in combination with STED micros-copy, to map PIP2 clusters on the plasma membrane of a cell [82].
Perhaps the most widely used class of indicators is those developed for tracking protein–protein interactions. While many of these indicators are based on FRET, protein fragmentcomplementation [83] is another popular approach. Protein fragment complementationrequires two nonfluorescent FP fragments that do not self-associate on their own, but thatcan recombine to form a functional FP if brought into close proximity with the help of aninteracting pair of proteins. This property, which is the basis for bimolecular fluorescence
Trends in Biochemical Sciences, February 2017, Vol. 42, No. 2 119
Low fluorescence High fluorescence
Ca2+/CaM-bindingpeptide
Ca2+/CaM-bindingpeptide
Ca2+
cp linker cp linker
CaMCa2+/CaM
Ca2+/CaMCa2+/CaM
GFP RFP
Chromophore Chromophore Lys78Arg376 Cterm
Nterm
Cterm
Nterm
(A)
(B) (C)
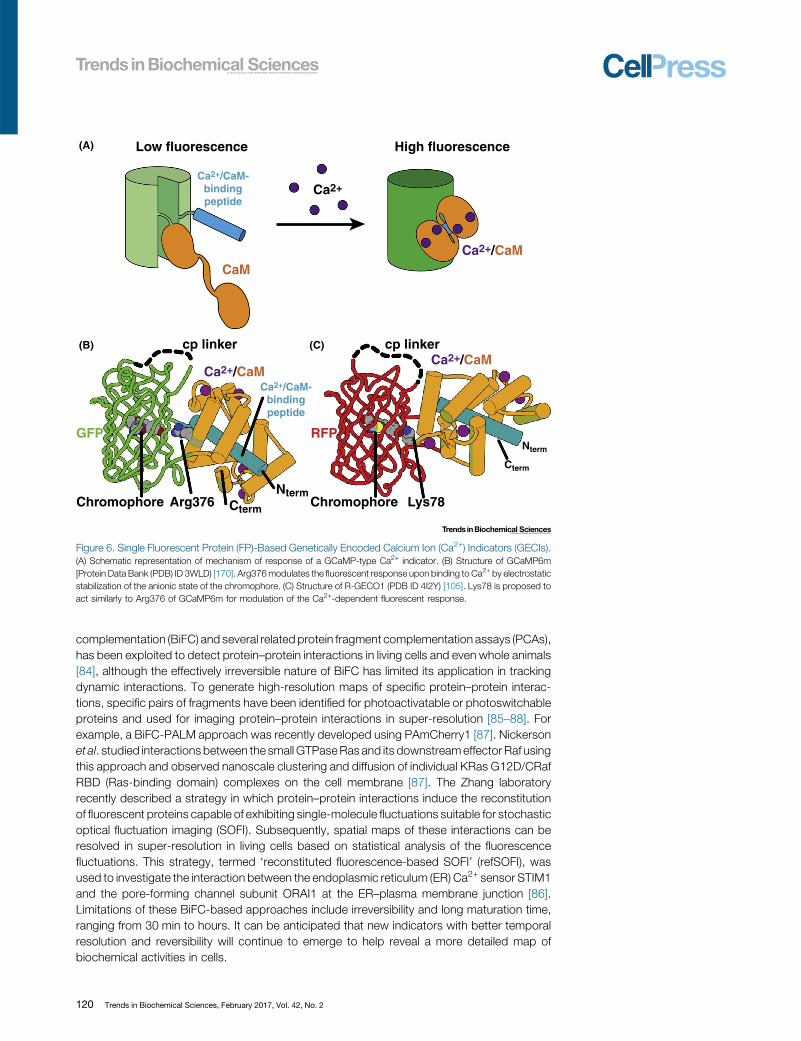
Figure 6. Single Fluorescent Protein (FP)-Based Genetically Encoded Calcium Ion (Ca2+) Indicators (GECIs).(A) Schematic representation of mechanism of response of a GCaMP-type Ca2+ indicator. (B) Structure of GCaMP6m[Protein Data Bank (PDB) ID 3WLD) [170]. Arg376modulates the fluorescent response upon binding to Ca2+ by electrostaticstabilization of the anionic state of the chromophore. (C) Structure of R-GECO1 (PDB ID 4I2Y) [105]. Lys78 is proposed toact similarly to Arg376 of GCaMP6m for modulation of the Ca2+-dependent fluorescent response.
complementation (BiFC) and several related protein fragment complementation assays (PCAs),has been exploited to detect protein–protein interactions in living cells and even whole animals[84], although the effectively irreversible nature of BiFC has limited its application in trackingdynamic interactions. To generate high-resolution maps of specific protein–protein interac-tions, specific pairs of fragments have been identified for photoactivatable or photoswitchableproteins and used for imaging protein–protein interactions in super-resolution [85–88]. Forexample, a BiFC-PALM approach was recently developed using PAmCherry1 [87]. Nickersonet al. studied interactions between the small GTPaseRas and its downstreameffector Raf usingthis approach and observed nanoscale clustering and diffusion of individual KRas G12D/CRafRBD (Ras-binding domain) complexes on the cell membrane [87]. The Zhang laboratoryrecently described a strategy in which protein–protein interactions induce the reconstitutionof fluorescent proteins capable of exhibiting single-molecule fluctuations suitable for stochasticoptical fluctuation imaging (SOFI). Subsequently, spatial maps of these interactions can beresolved in super-resolution in living cells based on statistical analysis of the fluorescencefluctuations. This strategy, termed ‘reconstituted fluorescence-based SOFI’ (refSOFI), wasused to investigate the interaction between the endoplasmic reticulum (ER) Ca2+ [17_TD$DIFF] sensor STIM1and the pore-forming channel subunit ORAI1 at the ER–plasma membrane junction [86].Limitations of these BiFC-based approaches include irreversibility and long maturation time,ranging from 30 min to hours. It can be anticipated that new indicators with better temporalresolution and reversibility will continue to emerge to help reveal a more detailed map ofbiochemical activities in cells.
120 Trends in Biochemical Sciences, February 2017, Vol. 42, No. 2

Genetically Encoded Calcium Ion IndicatorsParalleling the development of improved FPs and indicators of biochemical activities have beenconcerted efforts to develop improved genetically encoded calcium ion (Ca2+) indicators(GECIs). The first examples of single FP-based Ca2+ indicators (Figure 6A) were reported in1999 [89], just 2 years after the debut of the FRET-based ‘cameleon’-type indicators [90].Cameleon-type indicators produce a ratiometric fluorescent signal as a result of Ca2+-dependent changes in the efficiency of FRET from a blue-shifted donor to a red-shiftedacceptor. By contrast, single FP-based indicators produce Ca2+-dependent fluorescentchanges (typically, but not always, an intensiometric fluorescent signal) as a result ofmodulation of the proteinaceous environment of the chromophore. The first-generation singleFP-based indicators (‘camgaroo’ type) were created through the clever insertion of calmodulin atposition 145 of EYFP [89]. In camgaroo, the conformational change associated with the bindingof Ca2+ to calmodulin modulated the chromophore environment such that the pKa shifted to alower value and the fluorescence intensity increased sevenfold. The second generation of singleFP-based Ca2+ indicators, specifically the Pericam construct from Miyawaki [91] and the G-CaMP construct from Nakai [92], exploited a circularly permuted FP topology that had been firstpredicted by Tsien and coworkers [89]. These second-generation indicators comprised an FPthat was circularly permuted such that the new termini were in close proximity to the chromo-phore. Fused to the termini were calmodulin and a calmodulin-binding peptide that underwent aCa2+-dependent interaction and caused the requisite modulation of the chromophoreenvironment.
Early efforts to further improve single FP-based Ca2+ indicators, specifically the G-CaMP design[92], were hampered by the lack of a protein structural model, or even a solid hypothesis aboutthe mechanism by which the indicator functioned [93]. Two independent reports of the X-raycrystal structure of a second-generation variant [94,95] served as a catalyst for future structure-guided engineering efforts, soon facilitating the development of GCaMP3 [96]. GCaMP3 isgenerally considered to be the ‘breakthrough’ version that was practically useful for routineneuronal activity imaging in a variety of contexts, including transgenic mice [97]. A series ofadditional improved versions have since been reported [98–101]. The current state-of-the-artvariants are the GCaMP6 (Figure 6B) series produced by the Genetically-Encoded NeuronalIndicator and Effector (GENIE) project at the Howard Hughes Medical Institute (HHMI) JaneliaResearch Campus [102]. Transgenicmice expressing fast and slow variants of GCaMP6 under aneuron-specific Thy-1 promoter are now available [103].
In addition to serving as the catalyst for rapid improvements in the GCaMP series, the X-raycrystal structures of GCaMP2 [94,95] also helped accelerate the development of variants withaltered fluorescent hues. In 2011, the Campbell lab reported a series of new indicators, includingblue, blue-green emission ratiometric, and red fluorescent variants, which they designated theGECO-series [104]. Parallel efforts from the GENIE project also led to a series of color variantsthat included blue, cyan, yellow, and red Ca2+ indicators [105]. The most promising newindicators to arise from these efforts were the two red fluorescent variants: mApple-derivedR-GECO1 from the Campbell lab (Figure 6C), and mRuby-derived RCaMP from the GENIEproject. Generally speaking, red fluorescent indicators are preferable to green ones due to theirlower autofluorescence, lower phototoxicity, and greater tissue penetration associated withlonger wavelength excitation. As with the GCaMP series, the red indicators have continued to beimproved [106,107], with the latest variants (i.e., the R-GECO1-derived R-CaMP2 [108], andjRCaMP1a,b and jRGECO1a variants from the GENIE project [109]) offering performance thatapproaches that of GCaMP6.
The toolbox of single FP-based indicators continues to expand in several directions, with otherengineering efforts focused on making improved yellow indicators [110], a long Stokes-shift
Trends in Biochemical Sciences, February 2017, Vol. 42, No. 2 121
indicator [111], variants with lower Kd values that are suited for imaging Ca2+ in the ER [112,113],and photoconvertible variants that can be selectively ‘highlighted’ by spatially defined conversionto a spectrally distinct fluorescence hue [114,115]. Interestingly, it was recently reported thatGCaMP6 itself can be ‘highlighted’ by photoconversion to a red state that retains Ca2+
responsiveness [116]. An exciting twist on the utility of photoconvertible Ca2+ indicators isthe recently reported CaMPARI variant [117]. CaMPARI is a GCaMP-type indicator that exhibitsCa2+-dependent photoconversion to a red state and, thus, acts as an integrator of neuronalactivity during a period of illumination.
FP-Based Indicators of Transmembrane VoltageWhile GECIs are the current workhorse of neuronal activity imaging, neuroscientists have longrecognized the need for effective genetically encoded voltage indicators (GEVIs). Neuronsprocess and transmit signals (an action potential) via changes in their transmembrane voltage.A negative-inside transmembrane voltage is established across the membrane by ion pumpsand transporters, and can be modulated with millisecond kinetics by the action of neurotrans-mitter- and voltage-gated ion channels [118]. If voltage changes could be visualized in real timewith a fluorescent indicator, then neuroscientists would be able to study questions such as howinputs at different synapses are integrated to induce action potential firing, and how neurons in acircuit fire in a coordinated manner. One major challenge for optical imaging of voltage changesis that a single action potential is complete within a few milliseconds and so image acquisitionrates in the range of 100 to 1000 Hz are essential [118]. The correspondingly short imageacquisition times and high-intensity excitation light sources necessitate that practically usefulvoltage indicators be particularly bright and photostable. Further complicating the use of voltageindicators is the fact that an indicator of membrane potential must be confined to the 2D surfaceof the plasma membrane, rather than the 3D volume of the cytoplasm. By contrast, elevatedcytoplasmic Ca2+ levels persist for hundreds of milliseconds following an action potential [119],which enables relatively facile detection of these changes with much higher signal:noise ratiosthan are typically achievable for voltage indicators.
The field of GEVI development is as old as the field of GECI development, but has matured at aslower rate due to the more challenging nature of GEVI design (Figure 7) and optimization. Thefirst GEVI, FlaSh, comprising a GFP domain inserted in an intracellular segment of a voltage-gated potassium channel, was published in 1997 [120], the same year as the first GECI,Cameleon [90]. FlaSh exhibits a 5% decrease in GFP fluorescence upon membrane depolari-zation in the physiological range of –70 to +30 mV, but with rather slow kinetics. Subsequently,SPARC, a GFP insertion in an intracellular loop of a voltage-gated sodium channel, was found toshow small (<0.5%) changes in fluorescence upon depolarization but with fast kinetics (0.8-msactivation time-constant) [121]. In both FlaSh and SPARC, the mechanism of voltage sensing bythe GFP is unknown. In addition, a GEVI named VSFP1 was created by fusion of CFP and YFP intandem at the C terminus of an isolated voltage-sensing domain (VSD) from a voltage-gatedpotassium channel [122]. VSFP1 shows a 2% increase in YFP fluorescence upon depolarizationwith fast kinetics (0.7-ms activation time-constant), presumably because changes in the distri-bution of FP orientations upon voltage-induced VSD movements induce an increase in FRET.However, poor membrane expression of FlaSh, a FlaSh derivative named Flare, and VSFP1 inmammalian neurons prevented their actual use in neuroscience applications [123].
The discovery of voltage-sensing phosphatases in 2005 [124] provided a VSD that was wellexpressed at the membrane and also generated larger changes in the fluorescence of attachedFP domains, serving as the basis for a series of increasingly effective voltage indicators ofdifferent architectures [125]. Fusion of this new VSD to CFP and YFP at the C terminus (VSFP2),or to one FP at the N terminus and another at the C terminus (VSFP-Butterfly), gave �10%fluorescence changes with fast (1–3 ms) kinetics [126,127]. In addition, fusions of single FP
122 Trends in Biochemical Sciences, February 2017, Vol. 42, No. 2

(A) FlaSh/Flare/SPARC
VSFP-Bu�erfly
ASAP1
VSFP3/ArcLight
VSFP1/VSFP2
(C)
(E)
(B)
(D)
out (+)
(+)in (–)
out (+)
in (–)
out (+)
in (–)
out (+)
in (–)
out (+)
in (–)
(–)
(+)
(–)
(+)
(–)
(+)
(–)
(+)
(–)
GFP GFP
CFP YFPCFP YFP
FRET
+++
+++
+++
+++
+++
+++
+++
+++
+++
+++
YFP RFP YFP RFP XFPXFP
cpGFPcpGFP
FRET
Figure 7. Designs of Fluorescent Protein (FP)-Based Genetically Encoded Voltage Indicators (GEVIs). (A) In FlaSh/Flare/SPARC, green fluorescent protein(GFP) is inserted in an intracellular segment of a homotetrameric potassium channel (FlaSh/Flare) or of a pseudotetrameric sodium channel (SPARC). Only one repeat ofthe six-helix transmembrane motif is shown for clarity. (B) In VSFP1/2, a FRET pair is fused to the intracellular segment following a four-helix voltage-sensing domain(VSD). (C) VSFP-Butterfly comprises a FRET pair of FPs (YFP and RFP) fused to the termini of the VSD. (D) In VSFP3/ArcLight, a single FP is fused following the VSD. (E) InASAP1, a circularly permuted GFP (cpGFP) is inserted into an extracellular loop of the VSD.
domains at the C terminus (VSFP3s) showed small (1.6–3.5%) and fast (1.8–3.8 ms) fluores-cence decreases upon depolarization [128]. ArcLight, a fusion of VSD and a pH-sensitive FPwithan Ala-to-Asp mutation on the b-barrel surface, shows a larger (�35%) but slower (�10 ms)fluorescence decrease [129]. ASAP1, an insertion of a circularly permuted GFP in an extracellularloop of the VSD, shows both large (�25%) and fast (2 ms) fluorescence decreases upondepolarization [130]. Finally, Abdelfattah et al. recently reported FlicR1, a bright and fast redfluorescent voltage indicator based on fusion of a circularly permuted RFP to the C terminus of aVSD, that exhibits fluorescence increases of �3% for a single action potential [131].
Yet another GEVI design is based on the genetic fusion of an FP to an opsin protein. Here, the FPserves as a FRET donor to the opsin [132]. Depolarization increases opsin absorption at orangewavelengths, increasing FRET from the FP, and decreasing FP brightness [133,134]. Amongthese ‘FRET-opsin’ GEVIs, the brightest and fastest are the Ace-mNeon series [135].
Trends in Biochemical Sciences, February 2017, Vol. 42, No. 2 123
The utilization of FP-based GEVIs is still in its infancy. VSFP-Butterfly was used to visualize rapidsynchronized voltage responses in neuronal populations in the mouse sensory cortex [127].ArcLight detected odorant-induced depolarizations and hyperpolarizing responses (which areundetectable with calcium sensors) in living flies [136]. ASAP2f was used to deduce differencesin voltage-calcium coupling in the fly visual system [137]. Ace-mNeon has been used to visualizesubcellular voltage changes in mouse cortex and to measure voltage propagation rates in flyolfactory neurons [135]. A remaining challenge is to use FP-based GEVIs for temporally precisemonitoring of voltage transients in individual neurons in the mammalian brain, where two-photonexcitation would be helpful for background suppression and fast-scanning approaches will berequired for temporal resolution.
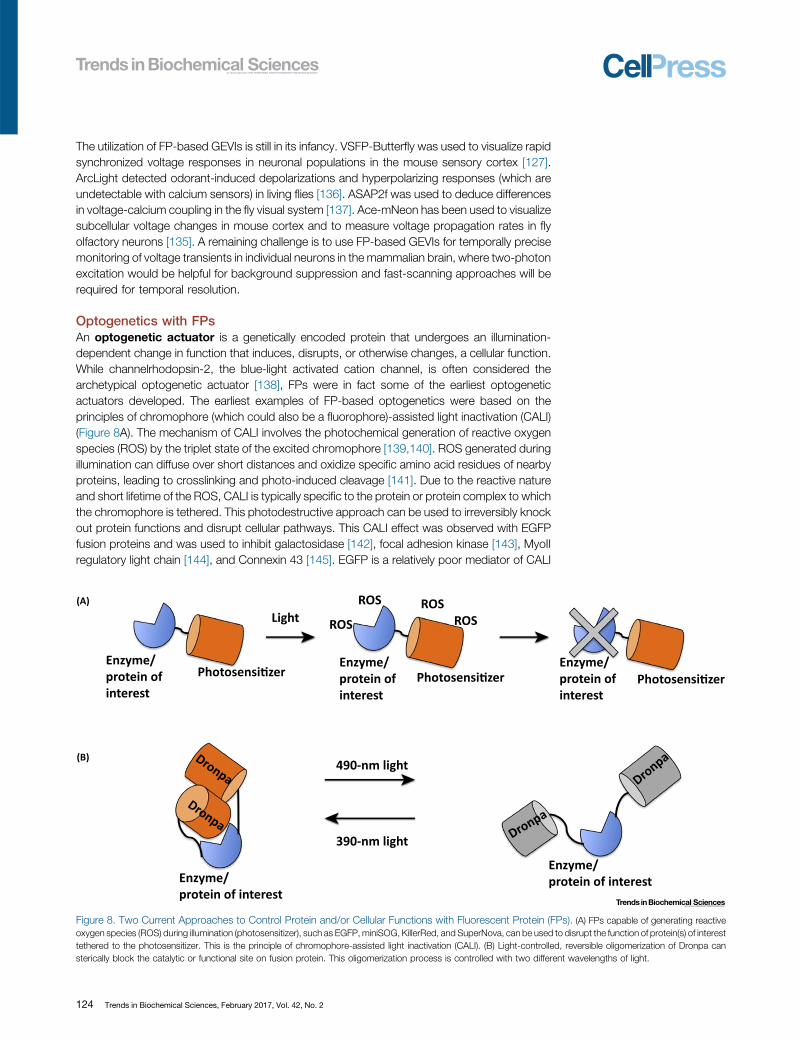
Optogenetics with FPsAn optogenetic actuator is a genetically encoded protein that undergoes an illumination-dependent change in function that induces, disrupts, or otherwise changes, a cellular function.While channelrhodopsin-2, the blue-light activated cation channel, is often considered thearchetypical optogenetic actuator [138], FPs were in fact some of the earliest optogeneticactuators developed. The earliest examples of FP-based optogenetics were based on theprinciples of chromophore (which could also be a fluorophore)-assisted light inactivation (CALI)(Figure 8A). The mechanism of CALI involves the photochemical generation of reactive oxygenspecies (ROS) by the triplet state of the excited chromophore [139,140]. ROS generated duringillumination can diffuse over short distances and oxidize specific amino acid residues of nearbyproteins, leading to crosslinking and photo-induced cleavage [141]. Due to the reactive natureand short lifetime of the ROS, CALI is typically specific to the protein or protein complex to whichthe chromophore is tethered. This photodestructive approach can be used to irreversibly knockout protein functions and disrupt cellular pathways. This CALI effect was observed with EGFPfusion proteins and was used to inhibit galactosidase [142], focal adhesion kinase [143], MyoIIregulatory light chain [144], and Connexin 43 [145]. EGFP is a relatively poor mediator of CALI
Enzyme/protein ofinterest
Enzyme/protein ofinterest
Enzyme/protein of interest
Enzyme/protein of interest
490-nm light
390-nm light
Enzyme/protein ofinterest
Photosensi�zer Photosensi�zer Photosensi�zer
Light ROS
ROS(A)
(B)
ROSROS
Dronpa
Dronpa
Dronpa
Dronpa
Figure 8. Two Current Approaches to Control Protein and/or Cellular Functions with Fluorescent Protein (FPs). (A) FPs capable of generating reactiveoxygen species (ROS) during illumination (photosensitizer), such as EGFP,miniSOG, KillerRed, and SuperNova, can be used to disrupt the function of protein(s) of interesttethered to the photosensitizer. This is the principle of chromophore-assisted light inactivation (CALI). (B) Light-controlled, reversible oligomerization of Dronpa cansterically block the catalytic or functional site on fusion protein. This oligomerization process is controlled with two different wavelengths of light.
124 Trends in Biochemical Sciences, February 2017, Vol. 42, No. 2
Outstanding QuestionsWhat are the molecular features thatcontrol photophysical properties, suchas photobleaching and photochro-mism, and how can we engineer FPsin which we can precisely control theseproperties?
Can we engineer BphP-derived IFPs tohave brightness in cells that is similar orgreater than GFP? How far can IFPs bered-shifted? Can we develop IFP-based indicators for Ca2+, membranepotential, and other biochemicalactivities?
Can monomeric and spectrally uniquesmURFP variants, that retain highbrightness and stability, be engi-neered? Can photostability be furtherenhanced?
How might a transgenic animal betreated or genetically modified toincrease the amount of available BV?Can an optimal BV analog be createdto penetrate both the cellular mem-brane and/or the blood–brain barrierwhile remaining in the blood for longperiods of time?
Are there naturally occurring FPs,homologous to avGFP or otherwise,with properties that have not yet beenobserved in nature or in the lab?
What are the limits in terms of bright-ness, fluorescent response, and kinet-ics for single FP-based GECIs andGEVIs? Can the lessons learned duringthe optimization of GCaMP be appliedto the GEVIs and other indicators?
Can new designs of FP-based biosen-sors increase the range of biochemicalevents that are amenable to fluores-cence monitoring and visualization?
Can we develop FPs variants to bothobserve and manipulate cellular func-tions simultaneously in the cell usingfully optical approaches?
due to the protected environment of the chromophore embedded within the b-barrel, and thefact that EGFP was evolved to have high fluorescence quantum yield and a limited triplet state[142]. Efforts to increase the ROS generation by FP under illumination has produced KillerRed[146,147], a dimeric red FP that is capable of generating superoxide radical anion during greenlight illumination [148,149]. Given that the dimeric nature of KillerRed complicates its use in CALIexperiments as a fusion protein, Takemoto et al. developed a monomerized version of KillerRed,named SuperNova, which can be used for CALI and is less likely to perturb the localization of afusion protein [150].
MiniSOG is an engineered variant of a FMN-binding light, oxygen, voltage (LOV) domain fromArabidopsis thaliana that generates ROS during blue light illumination [151]. CALI with miniSOGwas used to inhibit synaptic proteins [152,153], disrupt the CaMKII analog UNC-43 in Caeno-rhabditis elegans [154], and in experiments to ablate cells [155]. SOPP, a newer variantengineered from miniSOG, is reported to have �eightfold improved singlet oxygen quantumyield, but is yet to be tested in living cells [156]. A newly discovered LOV domain fromPseudomonas putida (Pp2FbFP L30 M) is reported to have singlet oxygen quantum yield thatis threefold higher than that of miniSOG [157], which may be a suitable template for futuredevelopment of flavin-binding FPs as optogenetic tools to alter cellular function.
Other than utilizing FPs for CALI and cell ablation experiments, the utilization of FPs to control theactivities of intracellular enzymes and proteins has been demonstrated [158]. For example, anengineered variant of the photoswitchable Dronpa FP enables switching between a tetramericand monomeric state by illumination with different wavelengths of light (Figure 8B). By using lightto control the oligomerization state of this Dronpa mutant, it is possible to block the active site ofattached enzymes and proteases, leading to the optogenetic control of protein functions.Currently, its use may be limited due to the concentration-dependent nature of the association;however, the light-induced oligomerization and dissociation of Dronpa can be further exploitedto develop novel methods of optogenetic control of intracellular pathways.
With the rapid adoption of optogenetic approaches and recent advances towards achieving alloptical observation and manipulation of biological pathways [159], the potential utilization of FPsfor simultaneous observation and manipulation may further revolutionize the way intracellularevents are studied in the coming decades.
Concluding RemarksThe authors of this review are enthusiastic developers and users of FP technology, and one of us(R.Y.T.) was among the first researchers to recognize the utility of engineered FPs as tools forfluorescence imaging. During the mid-1990s, it was surprising and gratifying that color variantsof avGFP could be created. We have been astounded by the myriad applications that have beenenabled by FP technology over the past two decades. We have no reason to fear that FPs haveyet given up all their secrets, and it is a safe bet that the coming years will see further advances.While some of the general directions for these advances are apparent (e.g., FPs from neworganisms, near-infrared fluorescence, new classes of indicator, and new interactions withphotons), history has taught us to expect the unexpected.
References
1. Chalfie, M. et al. (1994) Green fluorescent protein as a marker forgene-expression. Science 263, 802–805
2. Cubitt, A.B. et al. (1995) Understanding, improving and usinggreen fluorescent proteins. Trends Biochem. Sci. 20, 448–455
3. Heim, R. and Tsien, R.Y. (1996) Engineering green fluorescentprotein for improved brightness, longer wavelengths and fluo-rescence resonance energy transfer. Curr. Biol. 6, 178–182
4. Matz, M.V. et al. (1999) Fluorescent proteins from nonbiolumi-nescent Anthozoa species. Nat. Biotechnol. 17, 969–973
5. Campbell, R.E. et al. (2002) Amonomeric red fluorescent protein.Proc. Natl. Acad. Sci. U.S.A. 99, 7877–7882
6. Shaner, N.C. et al. (2004) Improved monomeric red, orange andyellow fluorescent proteins derived from Discosoma sp. redfluorescent protein. Nat. Biotechnol. 22, 1567–1572
Trends in Biochemical Sciences, February 2017, Vol. 42, No. 2 125

7. Wiedenmann, J. et al. (2002) A far-red fluorescent protein withfast maturation and reduced oligomerization tendency fromEntacmaea quadricolor (Anthozoa, Actinaria). Proc. Natl. Acad.Sci. U.S.A. 99, 11646–11651
8. Merzlyak, E.M. et al. (2007) Bright monomeric red fluorescentprotein with an extended fluorescence lifetime. Nat. Methods 4,555–557
9. Shcherbo, D. et al. (2007) Bright far-red fluorescent protein forwhole-body imaging. Nat. Methods 4, 741–746
10. Kredel, S. et al. (2009) mRuby, a bright monomeric red fluores-cent protein for labeling of subcellular structures. PLoS One 4,e4391
11. Drepper, T. et al. (2007) Reporter proteins for in vivo fluorescencewithout oxygen. Nat. Biotechnol. 25, 443–445
12. Fischer, A.J. and Lagarias, J.C. (2004) Harnessing phytochro-me's glowing potential. Proc. Natl. Acad. Sci. U.S.A. 101,17334–17339
13. Shu, X. et al. (2009) Mammalian expression of infrared fluores-cent proteins engineered from a bacterial phytochrome. Science324, 804–807
14. Kumagai, A. et al. (2013) A bilirubin-inducible fluorescent proteinfrom eel muscle. Cell 153, 1602–1611
15. Bajar, B.T. et al. (2016) Improving brightness and photostabilityof green and red fluorescent proteins for live cell imaging andFRET reporting. Sci. Rep. 6, 20889
16. Shaner, N.C. et al. (2013) A bright monomeric green fluorescentprotein derived from Branchiostoma lanceolatum. Nat. Methods10, 407–409
17. Lam, A.J. et al. (2012) Improving FRET dynamic range with brightgreen and red fluorescent proteins. Nat. Methods 9, 1005–1012
18. Chapman, S. et al. (2008) The photoreversible fluorescent proteiniLOV outperforms GFP as a reporter of plant virus infection. Proc.Natl. Acad. Sci. U.S.A. 105, 20038–20043
19. Mukherjee, A. et al. (2015) Engineering and characterization ofnew LOV-based fluorescent proteins fromChlamydomonas rein-hardtii and Vaucheria frigida. ACS Synth. Biol. 4, 371–377
20. Kimura, S. et al. (2007) Dissection of the autophagosome matu-ration process by a novel reporter protein, tandem fluorescent-tagged LC3. Autophagy 3, 452–460
21. Katayama, H. et al. (2008) GFP-like proteins stably accumulate inlysosomes. Cell Struct. Funct. 33, 1–12
22. Shemiakina, I.I. et al. (2012) A monomeric red fluorescent proteinwith low cytotoxicity. Nat. Commun. 3, 1204
23. Costantini, L.M. et al. (2015) A palette of fluorescent proteinsoptimized for diverse cellular environments. Nat. Commun. 6,7670
24. Costantini, L.M. et al. (2012) Assessing the tendency of fluores-cent proteins to oligomerize under physiologic conditions. Traffic13, 643–649
25. Cranfill, P.J. et al. (2016) Quantitative assessment of fluorescentproteins. Nat. Methods 13, 557–562
26. Weissleder, R. and Ntziachristos, V. (2003) Shedding light ontolive molecular targets. Nat. Med. 9, 123–128
27. Jöbsis, F.F. (1977) Noninvasive, infrared monitoring of cerebraland myocardial oxygen sufficiency and circulatory parameters.Science 198, 1264–1267
28. Karniol, B. et al. (2005) Phylogenetic analysis of the phytochromesuperfamily reveals distinct microbial subfamilies of photorecep-tors. Biochem. J. 392, 103–116
29. Auldridge, M.E. and Forest, K.T. (2011) Bacterial phytochromes:more thanmeets the light.Crit. Rev. Biochem.Mol. Biol. 46, 67–88
30. Murphy, J.T. and Lagarias, J.C. (1997) The phytofluors: a newclass of fluorescent protein probes. Curr. Biol. 7, 870–876
31. Filonov, G.S. et al. (2011) Bright and stable near-infrared fluo-rescent protein for in vivo imaging. Nat. Biotechnol. 29, 757–761
32. Yu, D. et al. (2014) An improved monomeric infrared fluorescentprotein for neuronal and tumour brain imaging. Nat. Commun. 5,3626
33. Auldridge, M.E. et al. (2012) Structure-guided engineeringenhances a phytochrome-based infrared fluorescent protein.J. Biol. Chem. 287, 7000–7009
126 Trends in Biochemical Sciences, February 2017, Vol. 42, No.
34. Shcherbakova, D.M. and Verkhusha, V.V. (2013) Near-infraredfluorescent proteins for multicolor in vivo imaging. Nat. Methods10, 751–754
35. Yu, D. et al. (2015) A naturally monomeric infrared fluorescentprotein for protein labeling in vivo. Nat. Methods 12, 763–765
36. Yu, D. et al. (2016) Rational design of a monomeric and photo-stable far-red fluorescent protein for fluorescence imaging in vivo.Protein Sci. 25, 308–315
37. Wu, M.L. et al. (2011) Heme oxygenase-1 in inflammation andcardiovascular disease. Am. J. Cardiovasc. Dis. 1, 150–158
38. Sedlak, T.W. et al. (2009) Bilirubin and glutathione have comple-mentary antioxidant and cytoprotective roles. Proc. Natl. Acad.Sci. U.S.A. 106, 5171–5176
39. To, T.L. et al. (2015) Rationally designed fluorogenic proteasereporter visualizes spatiotemporal dynamics of apoptosisin vivo. Proc. Natl. Acad. Sci. U.S.A. 112, 3338–3343
40. Rodriguez, E.A. et al. (2016) A far-red fluorescent protein evolvedfrom a cyanobacterial phycobiliprotein. Nat. Methods 13, 763–769
41. Marx, V. (2014) Probes: seeing in the near infrared.Nat. Methods11, 717–720
42. Sakaue-Sawano, A. et al. (2008) Visualizing spatiotemporaldynamics of multicellular cell-cycle progression. Cell 132,487–498
43. Hayashi, S. and Toda, Y. (2009) A novel fluorescent proteinpurified from eel muscle. Fish. Sci. 75, 1461–1469
44. Storch, J. and Thumser, A.E. (2000) The fatty acid transportfunction of fatty acid-binding proteins. Biochim. Biophys. Acta1486, 28–44
45. Schaap, F.G. et al. (2002) Evolution of the family of intracellularlipid binding proteins in vertebrates. Mol. Cell. Biochem. 239,69–77
46. Zimmerman, A.W. and Veerkamp, J.H. (2002) New insights intothe structure and function of fatty acid-binding proteins.Cell. Mol.Life Sci. 59, 1096–1116
47. Kapitulnik, J. (2004) Bilirubin: an endogenous product of hemedegradation with both cytotoxic and cytoprotective properties.Mol. Pharmacol. 66, 773–779
48. Notter, M.F. and Kendig, J.W. (1986) Differential sensitivity ofneural cells to bilirubin toxicity. Exp. Neurol. 94, 670–682
49. Wennberg, R.P. et al. (2006) Toward understanding kernicterus:a challenge to improve the management of jaundiced newborns.Pediatrics 117, 474–485
50. Erapaneedi, R. et al. (2016) A novel family of fluorescent hypoxiasensors reveal strong heterogeneity in tumor hypoxia at thecellular level. EMBO J. 35, 102–113
51. To, T.L. et al. (2016) Structure-guided design of a reversiblefluorogenic reporter of protein-protein interactions. Protein Sci.25, 748–753
52. Navarro, R. et al. (2016) A novel destabilizing domain based on asmall-molecule dependent fluorophore. ACS Chem. Biol. 11,2101–2104
53. Dickson, R.M. et al. (1997) On/off blinking and switching behav-iour of single molecules of green fluorescent protein. Nature 388,355–358
54. Habuchi, S. et al. (2005) Evidence for the isomerization anddecarboxylation in the photoconversion of the red fluorescentprotein DsRed. J. Am. Chem. Soc. 127, 8977–8984
55. Andresen, M. et al. (2005) Structure and mechanism of thereversible photoswitch of a fluorescent protein. Proc. Natl. Acad.Sci. U.S.A. 102, 13070–13074
56. Shi, X. et al. (2007) Ultrafast excited-state dynamics in the greenfluorescent protein variant S65T/H148D. 2. Unusual photophys-ical properties. Biochemistry 46, 12014–12025
57. Haupts, U. et al. (1998) Dynamics of fluorescence fluctuationsin green fluorescent protein observed by fluorescence correla-tion spectroscopy. Proc. Natl. Acad. Sci. U.S.A. 95, 13573–13578
58. Konold, P. et al. (2014) Hydrogen bond flexibility correlates withStokes shift in mPlum variants. J. Phys. Chem. B 118, 2940–2948
2

59. Donnert, G. et al. (2007) Major signal increase in fluorescencemicroscopy through dark-state relaxation. Nat. Methods 4,81–86
60. Patterson, G.H. and Lippincott-Schwartz, J. (2002) A photo-activatable GFP for selective photolabeling of proteins and cells.Science 297, 1873–1877
61. Hell, S.W. and Wichmann, J. (1994) Breaking the diffractionresolution limit by stimulated emission: stimulated-emission-depletion fluorescence microscopy. Opt. Lett. 19, 780–782
62. Willig, K.I. et al. (2006) Nanoscale resolution in GFP-basedmicroscopy. Nat. Methods 3, 721–723
63. Betzig, E. et al. (2006) Imaging intracellular fluorescent proteins atnanometer resolution. Science 313, 1642–1645
64. Rust, M.J. et al. (2006) Sub-diffraction-limit imaging by stochasticoptical reconstruction microscopy (STORM). Nat. Methods 3,793–796
65. Dean, K.M. et al. (2011) Analysis of red-fluorescent proteinsprovides insight into dark-state conversion and photodegrada-tion. Biophys. J. 101, 961–969
66. Subach, F.V. et al. (2009) Photoactivatable mCherry for high-resolution two-color fluorescence microscopy. Nat. Methods 6,153–159
67. Zhang, M. et al. (2012) Rational design of true monomeric andbright photoactivatable fluorescent proteins. Nat. Methods 9,727–729
68. Wang, S. et al. (2014) Characterization and development ofphotoactivatable fluorescent proteins for single-molecule-basedsuperresolution imaging. Proc. Natl. Acad. Sci. U.S.A. 111,8452–8457
69. Nienhaus, K. and Nienhaus, G.U. (2014) Fluorescent proteins forlive-cell imaging with super-resolution. Chem. Soc. Rev. 43,1088–1106
70. Grotjohann, T. et al. (2012) rsEGFP2 enables fast RESOLFTnanoscopy of living cells. Elife 1, e00248
71. Zhang, X. et al. (2015) Development of a reversibly switchablefluorescent protein for super-resolution optical fluctuation imag-ing (SOFI). ACS Nano. 9, 2659–2667
72. Subach, F.V. et al. (2011) Directed molecular evolution to designadvanced red fluorescent proteins. Nat. Methods 8, 1019–1026
73. Dean, K.M. et al. (2015) High-speed multiparameter photophys-ical analyses of fluorophore libraries. Anal. Chem. 87, 5026–5030
74. Cambi, A. and Lidke, D.S. (2012) Nanoscale membrane organi-zation: where biochemistry meets advanced microscopy. ACSChem. Biol. 7, 139–149
75. Miyawaki, A. and Niino, Y. (2015) Molecular spies for bioimaging–fluorescent protein-based probes. Mol. Cell 58, 632–643
76. Newman, R.H. et al. (2011) Genetically encodable fluorescentbiosensors for tracking signaling dynamics in living cells. Chem.Rev. 111, 3614–3666
77. Sample, V. et al. (2014) Genetically encoded molecular probes tovisualize and perturb signaling dynamics in living biological sys-tems. J. Cell Sci. 127, 1151–1160
78. Halet, G. (2005) Imaging phosphoinositide dynamics using GFP-tagged protein domains. Biol. Cell 97, 501–518
79. Owen, D.M. et al. (2012) The lipid raft hypothesis revisited–newinsights on raft composition and function from super-resolutionfluorescence microscopy. Bioessays 34, 739–747
80. Puchner, E.M. et al. (2013) Counting molecules in single organ-elles with superresolution microscopy allows tracking of theendosome maturation trajectory. Proc. Natl. Acad. Sci. U.S.A.110, 16015–16020
81. McKinney, S.A. et al. (2009) A bright and photostable photo-convertible fluorescent protein. Nat. Methods 6, 131–133
82. van den Bogaart, G. et al. (2011) Membrane protein sequesteringby ionic protein-lipid interactions. Nature 479, 552–555
83. Miller, K.E. et al. (2015) Bimolecular fluorescence complementa-tion (BiFC) analysis: advances and recent applications forgenome-wide interaction studies. J. Mol. Biol. 427, 2039–2055
84. Han, Y. et al. (2014) In vivo imaging of protein-protein and RNA-protein interactions using novel far-red fluorescence comple-mentation systems. Nucleic Acids Res. 42, e103
85. Liu, Z. et al. (2014) Super-resolution imaging and tracking ofprotein-protein interactions in sub-diffraction cellular space. Nat.Commun. 5, 4443
86. Hertel, F. et al. (2016) RefSOFI for mapping nanoscale organiza-tion of protein-protein interactions in living cells. Cell Rep. 14,390–400
87. Nickerson, A. et al. (2014) Photoactivated localization micros-copy with bimolecular fluorescence complementation (BiFC-PALM) for nanoscale imaging of protein–protein interactions incells. PLoS One 9, e100589
88. Xia, P. et al. (2014) Superresolution imaging reveals structuralfeatures of EB1 in microtubule plus-end tracking. Mol. Biol. Cell25, 4166–4173
89. Baird, G.S. et al. (1999) Circular permutation and receptor inser-tion within green fluorescent proteins. Proc. Natl. Acad. Sci. U.S.A. 96, 11241–11246
90. Miyawaki, A. et al. (1997) Fluorescent indicators for Ca2+ basedon green fluorescent proteins and calmodulin. Nature 388,882–887
91. Nagai, T. et al. (2001) Circularly permuted green fluorescentproteins engineered to sense Ca2+. Proc. Natl. Acad. Sci.U.S.A. 98, 3197–3202
92. Nakai, J. et al. (2001) A high signal-to-noise Ca2+ probe com-posed of a single green fluorescent protein. Nat. Biotechnol. 19,137–141
93. Tallini, Y.N. et al. (2006) Imaging cellular signals in the heart invivo: cardiac expression of the high-signal Ca2+ indicatorGCaMP2. Proc. Natl. Acad. Sci. U.S.A. 103, 4753–4758
94. Wang, Q. et al. (2008) Structural basis for calcium sensing byGCaMP2. Structure 16, 1817–1827
95. Akerboom, J. et al. (2009) Crystal structures of the GCaMPcalcium sensor reveal the mechanism of fluorescence signalchange and aid rational design. J. Biol. Chem. 284, 6455–6464
96. Tian, L. et al. (2009) Imaging neural activity in worms, flies andmice with improved GCaMP calcium indicators. Nat. Methods 6,875–881
97. Zariwala, H.A. et al. (2012) A Cre-dependent GCaMP3 reportermouse for neuronal imaging in vivo. J. Neurosci. 32, 3131–3141
98. Muto, A. et al. (2011) Genetic visualization with an improvedGCaMP calcium indicator reveals spatiotemporal activation ofthe spinal motor neurons in zebrafish. Proc. Natl. Acad. Sci. U.S.A. 108, 5425–5430
99. Akerboom, J. et al. (2012) Optimization of a GCaMP calciumindicator for neural activity imaging. J. Neurosci. 32, 13819–13840
100. Sun, X.R. et al. (2013) Fast GCaMPs for improved tracking ofneuronal activity. Nat. Commun. 4, 2170
101. Muto, A. et al. (2013) Real-time visualization of neuronal activityduring perception. Curr. Biol. 23, 307–311
102. Chen, T.W. et al. (2013) Ultrasensitive fluorescent proteins forimaging neuronal activity. Nature 499, 295–300
103. Dana, H. et al. (2014) Thy1-GCaMP6 transgenic mice for neuro-nal population imaging in vivo. PLoS One 9, e108697
104. Zhao, Y. et al. (2011) An expanded palette of genetically encodedCa2+ indicators. Science 333, 1888–1891
105. Akerboom, J. et al. (2013) Genetically encoded calcium indica-tors for multi-color neural activity imaging and combination withoptogenetics. Front. Mol. Neurosci. 6, 2
106. Ohkura, M. et al. (2012) An improved genetically encoded redfluorescent Ca2+ indicator for detecting optically evoked actionpotentials. PLoS One 7, e39933
107. Wu, J. et al. (2013) Improved orange and red Ca2+ indicators andphotophysical considerations for optogenetic applications. ACSChem. Neurosci. 4, 963–972
108. Inoue, M. et al. (2015) Rational design of a high-affinity, fast, redcalcium indicator R-CaMP2. Nat. Methods 12, 64–70
109. Dana, H. et al. (2016) Sensitive red protein calcium indicators forimaging neural activity. Elife 5, e12727
110. Zhao, Y. et al. (2014) Microfluidic cell sorter-aided directed evo-lution of a protein-based calcium ion indicator with an invertedfluorescent response. Integr. Biol. (Camb.) 6, 714–725
Trends in Biochemical Sciences, February 2017, Vol. 42, No. 2 127

111. Wu, J. et al. (2014) A long Stokes shift red fluorescent Ca2+
indicator protein for two–photon and ratiometric imaging. Nat.Commun. 5, 5262
112. Wu, J. et al. (2014) Red fluorescent genetically encoded Ca2+
indicators for use in mitochondria and endoplasmic reticulum.Biochem. J. 464, 13–22
113. Suzuki, J. et al. (2014) Imaging intraorganellar Ca2+ at subcellularresolution using CEPIA. Nat. Commun. 5, 4153
114. Hoi, H. et al. (2013) Highlightable Ca2+ indicators for live cellimaging. J. Am. Chem. Soc. 135, 46–49
115. Berlin, S. et al. (2015) Photoactivatable genetically encodedcalcium indicators for targeted neuronal imaging. Nat. Methods12, 852–858
116. Ai, M. et al. (2015) Green-to-red photoconversion of GCaMP.PLoS One 10, e0138127
117. Fosque, B.F. et al. (2015) Neural circuits. Labeling of active neuralcircuits in vivo with designed calcium integrators. Science 347,755–760
118. Bean, B.P. (2007) The action potential in mammalian centralneurons. Nat. Rev. Neurosci. 8, 451–465
119. Broussard, G.J. et al. (2014) Monitoring activity in neuralcircuits with genetically encoded indicators. Front. Mol. Neurosci.7, 97
120. Siegel, M.S. and Isacoff, E.Y. (1997) A genetically encodedoptical probe of membrane voltage. Neuron 19, 735–741
121. Ataka, K. and Pieribone, V.A. (2002) A genetically targetablefluorescent probe of channel gating with rapid kinetics. Biophys.J. 82, 509–516
122. Sakai, R. et al. (2001) Design and characterization of a DNA-encoded, voltage-sensitive fluorescent protein. Eur. J. Neurosci.13, 2314–2318
123. Baker, B.J. et al. (2007) Three fluorescent protein voltage sen-sors exhibit low plasma membrane expression in mammaliancells. J. Neurosci. Methods 161, 32–38
124. Murata, Y. et al. (2005) Phosphoinositide phosphatase activitycoupled to an intrinsic voltage sensor. Nature 435, 1239–1243
125. St-Pierre, F. et al. (2015) Designs and sensing mechanisms ofgenetically encoded fluorescent voltage indicators. Curr. Opin.Chem. Biol. 27, 31–38
126. Lundby, A. et al. (2010) Biophysical characterization of the fluo-rescent protein voltage probe VSFP2.3 based on the voltage-sensing domain of Ci-VSP. Eur. Biophys. J. 39, 1625–1635
127. Akemann, W. et al. (2012) Imaging neural circuit dynamics with avoltage-sensitive fluorescent protein. J. Neurophysiol. 108,2323–2337
128. Perron, A. et al. (2009) Red-shifted voltage-sensitive fluorescentproteins. Chem. Biol. 16, 1268–1277
129. Jin, L. et al. (2012) Single action potentials and subthresholdelectrical events imaged in neurons with a fluorescent proteinvoltage probe. Neuron 75, 779–785
130. St-Pierre, F. et al. (2014) High-fidelity optical reporting of neuronalelectrical activity with an ultrafast fluorescent voltage sensor.Nat.Neurosci. 17, 884–889
131. Abdelfattah, A.S. et al. (2016) A bright and fast red fluorescentprotein voltage indicator that reports neuronal activity in organo-typic brain slices. J. Neurosci. 36, 2458–2472
132. Bayraktar, H. et al. (2012) Ultrasensitive measurements of micro-bial rhodopsin photocycles using photochromic FRET. Photo-chem. Photobiol. 88, 90–97
133. Gong, Y. et al. (2014) Imaging neural spiking in brain tissue usingFRET-opsin protein voltage sensors. Nat. Commun. 5, 3674
134. Zou, P. et al. (2014) Bright and fast multicoloured voltage report-ers via electrochromic FRET. Nat. Commun. 5, 4625
135. Gong, Y. et al. (2015) High-speed recording of neural spikes inawake mice and flies with a fluorescent voltage sensor. Science350, 1361–1366
136. Cao, G. et al. (2013) Genetically targeted optical electrophysiol-ogy in intact neural circuits. Cell 154, 904–913
137. Yang, H.H. et al. (2016) Subcellular imaging of voltage andcalcium signals reveals neural processing in vivo. Cell 166,245–257
128 Trends in Biochemical Sciences, February 2017, Vol. 42, No.
138. Boyden, E.S. et al. (2005) Millisecond-timescale, geneticallytargeted optical control of neural activity. Nat. Neurosci. 8,1263–1268
139. Jay, D.G. (1988) Selective destruction of protein function bychromophore-assisted laser inactivation. Proc. Natl. Acad. Sci.U.S.A. 85, 5454–5458
140. Beck, S. et al. (2002) Fluorophore-assisted light inactivation: ahigh-throughput tool for direct target validation of proteins. Pro-teomics 2, 247–255
141. McLean, M.A. et al. (2009) Mechanism of chromophore assistedlaser inactivation employing fluorescent proteins. Anal. Chem.81, 1755–1761
142. Surrey, T. et al. (1998) Chromophore-assisted light inactivationand self-organization of microtubules and motors. Proc. Natl.Acad. Sci. U.S.A. 95, 4293–4298
143. Rajfur, Z. et al. (2002) Dissecting the link between stress fibresand focal adhesions by CALI with EGFP fusion proteins. Nat. CellBiol. 4, 286–293
144. Monier, B. et al. (2010) An actomyosin-based barrier inhibits cellmixing at compartmental boundaries inDrosophila embryos.Nat.Cell Biol. 12, 60–65
145. Tanabe, T. et al. (2005) Multiphoton excitation-evoked chromo-phore-assisted laser inactivation using green fluorescent protein.Nat. Methods 2, 503–505
146. Bulina, M.E. et al. (2006) A genetically encoded photosensitizer.Nat. Biotechnol. 24, 95–99
147. Bulina, M.E. et al. (2006) Chromophore-assisted light inactivation(CALI) using the phototoxic fluorescent protein KillerRed. Nat.Protoc. 1, 947–953
148. Vegh, R.B. et al. (2011) Reactive oxygen species in photochem-istry of the red fluorescent protein ‘Killer Red’. Chem. Commun.(Camb.) 47, 4887–4889
149. Wang, Y. et al. (2012) ROS-induced mitochondrial depolarizationinitiates PARK2/PARKIN-dependent mitochondrial degradationby autophagy. Autophagy 8, 1462–1476
150. Takemoto, K. et al. (2013) SuperNova, a monomeric photosen-sitizing fluorescent protein for chromophore-assisted light inacti-vation. Sci. Rep. 3, 2629
151. Shu, X. et al. (2011) A genetically encoded tag for correlated lightand electron microscopy of intact cells, tissues, and organisms.PLoS Biol. 9, e1001041
152. Lin, J.Y. et al. (2013) Optogenetic inhibition of synaptic releasewith chromophore-assisted light inactivation (CALI). Neuron 79,241–253
153. Zhou, K. et al. (2013) Position of UNC-13 in the active zoneregulates synaptic vesicle release probability and release kinetics.Elife 2, e01180
154. Hoerndli, F.J. et al. (2015) Neuronal activity and CaMKII regulatekinesin-mediated transport of synaptic AMPARs. Neuron 86,457–474
155. Qi, Y.B. et al. (2012) Photo-inducible cell ablation in Caenorhab-ditis elegans using the genetically encoded singlet oxygen gen-erating protein miniSOG. Proc. Natl. Acad. Sci. U.S.A. 109,7499–7504
156. Westberg, M. et al. (2015) Rational design of an efficient, geneti-cally encodable, protein-encased singlet oxygen photosensitizer.J. Am. Chem. Soc. 137, 1632–1642
157. Torra, J. et al. (2015) Singlet oxygen photosensitisation by thefluorescent protein Pp2FbFP L30 M, a novel derivative of Pseu-domonas putida flavin-binding Pp2FbFP. Photochem. Photobiol.Sci. 14, 280–287
158. Zhou, X.X. et al. (2012) Optical control of protein activity byfluorescent protein domains. Science 338, 810–814
159. Hochbaum, D.R. et al. (2014) All-optical electrophysiology inmammalian neurons using engineered microbial rhodopsins.Nat. Methods 11, 825–833
160. Ormö, M. et al. (1996) Crystal structure of the Aequorea victoriagreen fluorescent protein. Science 273, 1392–1395
161. Shu, X. et al. (2006) Novel chromophores and buried chargescontrol color in mFruits. Biochemistry 45, 9639–9647
162. Peng, P.P. et al. (2014) The structure of allophycocyanin B fromSynechocystis PCC 6803 reveals the structural basis for the
2

extreme redshift of the terminal emitter in phycobilisomes. ActaCrystallogr. D Biol. Crystallogr. 70, 2558–2569
163. Dertinger, T. et al. (2009) Fast, background-free, 3D super-res-olution optical fluctuation imaging (SOFI). Proc. Natl. Acad. Sci.U.S.A. 106, 22287–22292
164. Dedecker, P. et al. (2012) Widely accessible method for super-resolution fluorescence imaging of living systems. Proc. Natl.Acad. Sci. U.S.A. 109, 10909–10914
165. Geissbuehler, S. et al. (2014) Live-cell multiplane three-dimen-sional super-resolution optical fluctuation imaging. Nat. Com-mun. 5, 5830
166. Richards, C.I. et al. (2010) Synchronously amplified fluorescenceimage recovery (SAFIRe). J. Phys. Chem. B 114, 660–665
167. Jablonski, A.E. et al. (2012) Signal discrimination between fluo-rescent proteins in live cells by long-wavelength optical modula-tion. J. Phys. Chem. Lett. 3, 3585–3591
168. Marriott, G. et al. (2008) Optical lock-in detection imagingmicros-copy for contrast-enhanced imaging in living cells. Proc. Natl.Acad. Sci. U. S. A. 105, 17789–17794
169. Querard, J. et al. (2015) Photoswitching kinetics andphase-sensitive detection add discriminative dimensions forselective fluorescence imaging. Angew. Chem. Int. Ed. Engl.54, 2633–2637
170. Ding, J. et al. (2014) Structural basis of the ultrasensitive calciumindicator GCaMP6. Sci. China Life Sci. 57, 269–274
Trends in Biochemical Sciences, February 2017, Vol. 42, No. 2 129