the great reversals: the politics of financial...
TRANSCRIPT

First Draft: July 2000This Draft: June 2001
The Great Reversals: The Politics ofFinancial Development in the 20th Century1
Raghuram G. Rajan
Luigi Zingales
Abstract
Indicators of the development of the financial sector do not improve monotonically over time. Inparticular, we find that by most measures, countries were more financially developed in 1913than in 1980 and only recently have they surpassed their 1913 levels. This pattern cannot beexplained by structural theories that attribute cross-country differences in financial developmentto time-invariant factors, such as a country’s legal origin or culture. We propose an “interestgroup” theory of financial development where incumbents oppose financial development becauseit breeds competition. The theory predicts that incumbents’ opposition will be weaker when aneconomy allows both cross-border trade and capital flows. This theory can go some way inaccounting for the cross-country differences and the time series variation of financialdevelopment. When we recognize that different kinds of institutional heritages afford differentscope for private interests to express themselves, we obtain a synthesis between the structuraltheories and private interest theory, which is supported by the data.
1 Rajan is visiting M.I.T., and Zingales is at the University of Chicago. This paper is adevelopment of some ideas in a previous working paper entitled “The Politics of FinancialDevelopment”. We thank the Bradley Foundation, the Center for Study of the State and theEconomy, the Center for Research on Securities Prices, the Kauffman Foundation, and the WorldBank for funding support. Rajan also thanks the National Science Foundation and M.I.T. forresearch support. Claudio Callegari, Henrik Cronqvist, Shola Fafunso, Isidro Ferrer, Jorg Kukies,Roger Laeven, Galina Ovtcharova, Nahid Rahman , Sofia Ramos, Ruy Ribeiro, Amir Sasson, andElfani Wen provided excellent research assistantship and Arnoud Boot, Pratip Kar, Claus Parum,Kristian Rydqvist, and Elu Von Thadden provided invaluable help. We benefited from commentsby Oren Bar-Gill, Lucian Bebchuk, Charles Borden, Peter Hogfeldt, Louis Kaplow, Fred Link,Colin Mayer, Mark Ramseyer, Eric Rasmussen, Mark Roe, Andrei Shleifer, and Richard Sylla.

1
There is a growing body of evidence indicating that the development of a country’s
financial sector greatly facilitates its growth (e.g., King and Levine (1993), Jayaratne and Strahan
(1996), Demirguc-Kunt and Maksimovic (1998) and Rajan and Zingales (1998a)). Why then do
so many countries still have underdeveloped financial sectors?
The simple answer, and one favored by many economists, is the absence of demand.
According to this view, when opportunities arise in an economy that require financing, the
economy will develop the necessary markets and institutions to finance these opportunities; In
other words (those of Joan Robinson (1952, p86)) ”where enterprise leads, finance follows". For
example, the enormous financing requirements of railroads in the United States (one billion
dollars up to 1867 and 10 billion dollars up to 1890) lead to the development of public markets
for corporate debt and later for stock, with 40% of this capital coming from Europe.1 Financial
institutions such as investment banks, including the famous Morgan bank, emerged to underwrite
and distribute these securities and to reassure European investors that the money was properly
invested. Thus the financing needs of the railroads lead to the creation of financial infrastructure
in the United States, which was then available to finance other industries that came later. What
we have just described is nothing but the reverse of Say’s Law – demand creates its own supply.
Certainly demand is a prime driver of financial development, but it cannot be the only
explanation; demand (as proxied for by level of industrialization or economic development)
cannot explain why countries at similar levels of economic development differ so much in the
level of their financial development. For instance, why was France’s stock market much bigger as
a fraction of its GDP than markets in the United States in 1913, even though the per capita GDP
in the United States was not any lower than France’s? It is hard to imagine that the demand for
financing in the United States at that time was inadequate – the demand for more, and cheaper,
credit was a recurrent theme in political debates in the United States, and it was among the most
industrialized countries in the world even then.

2
An alternative explanation is the existence of structural impediments to supply rising to
meet demand. Perhaps a country does not have the necessary levels of social capital (Guiso et al,
2000) or “savoir faire” to create a viable financial sector (see Bencivenga and Smith (1991) and
Greenwood and Jovanovic (1990)). Or perhaps it has not inherited the right legal, cultural, or
political system. In particular, the seminal work of LaPorta, Lopez de Silanes, Shleifer, and
Vishny (1997, 1998) shows that countries with a Common Law origin seem to have better
minority investor protection, and furthermore, these countries have more highly developed equity
markets. While there has been some debate as to the precise channel through which a country’s
institutional inheritance affects its financial development (see, for example, Berglof and Von
Thadden (1999), Coffee (2000), Holmen and Hogfeldt (2000), La Porta, et al. (1999, 2000),
Rajan and Zingales (1999) and Stulz and Williamson (2001)), the evidence of a strong empirical
correlation in recent times between whether a country is financially developed and whether it had
British colonial origins is hard to ignore.
But one implication of the “structural” theories of financial development that has not
been explored as yet is that financial development should either take-off permanently (for
example, once the country attains the necessary social or human capital), or remain permanently
constrained (for example, if the inherited legal system is hostile to investor protection and
financial markets).
To test this implication, we collect various indicators of financial development in
developed countries over the twentieth century. By most measures, countries were more
financially developed in 1913 than in 1980 and only recently have they surpassed their 1913
levels. Furthermore, the pattern across countries was quite different then from that in the 1990s.
In 1913, France's stock market capitalization as a fraction of GDP was almost twice that of the
United States (0.78 vs 0.41) – even though the French Civil Code is not friendly to investors
according to La Porta et al. (1998). By 1980, roles had reversed dramatically -- it was now barely
one fourth the capitalization in the United States (0.09 vs 0.46). And in 1999, the two countries

3
seem to be converging (1.17 vs 1.52). More generally, by most indicators, the main countries of
Continental Europe were more developed financially in 1913 than the United States. In fact, in
contrast to the findings of La Porta et al. (1997) for the 1990s, we find that countries with
Common Law systems were not more financially developed in 1913. What is especially
interesting is that indicators of financial development fell in all countries after 1929, reaching
their nadir around 1980. Since then, there has been a revival of financial markets.
A comprehensive theory, thus, should be able to explain both the time series variation in
financial development as well as cross-sectional differences. In our view, the strength of political
forces in favor of financial development should be a major aspect of such a theory. Clearly, there
may be structural aspects to these forces, which we will discuss shortly. But equally clearly the
prime mover is the dominant interest group, so we will propose an interest group theory of
financial development. Because we attempt to be general, our theory will be stylized. Others (see,
for example, Perez (1997), Rosenbluth (1989), or Shleifer and Treisman (2000)) have identified
interests groups in specific countries and their power to thwart or aid reform. The virtue of the
more stylized description we attempt is that it can be taken more objectively to the data, thus
enabling the identification of general patterns.
One challenge with such a theory is to identify who may be opposed to something as
economically beneficial as financial development. We believe that incumbents – especially in
finance, but also in industry --can be hostile to arm's length markets because anonymous markets
do not respect the value of incumbency (see, for example, Hellwig (2000) or Rajan and Zingales
(1998b)), and instead can give birth to competition. Specifically, financial markets
disproportionately favor new entrants over incumbents. Nevertheless, it is possible for the
incentives of incumbents to oppose development to be muted. One such situation is when an
economy experiences both cross-border trade and capital flows. The resulting competition from
external sources, especially in financial markets, coupled with the constraints on government

4
financing, makes it hard and unprofitable for domestic incumbents to continue to keep the
domestic financial sector repressed.
The greater challenge with any theory that suggests politics matters is how to test it.
Structural measures of a country’s political system are notoriously hard to capture. It is no
wonder the evidence thus far is mixed. For example, Fohlin (2000), Weber and Davis (2000), and
Verdier (1999) appear to find that measures of a country’s political structure seem correlated with
financial development. By contrast, Beck, Demirguc-Kunt and Levine (2001) find they are not.
Apart from differences in data and accuracy of measures, the difference in results may stem from
differences in incentives of the interest group in power. But how do we identify the most
powerful interest group, and how do we determine its incentives?
The following example should illustrate the problems. French financial liberalization was
kicked off in 1983 by a Socialist government. By many structural theories, France would be an
unlikely country to initiate liberalization, while Socialists do not seem to be an interest group that
would push for it. A more detailed study (e.g., Helleiner (1994)) suggests that there was a
liberalizing faction in the French Socialist party, led by Prime Minister Pierre Mauroy and
Finance Minister Jacques Dolors, whose hand was strengthened by France’s increased trade
integration into the European Community. This faction argued that liberalization was necessary to
preserve trade, and won the day. How could one ever hope to capture the strength of such factions
in a large sample cross-country study without a subjective country-by-country exercise?
Our theory suggests a way. Regardless of the nomenclature of the party in power or the
structure of government, we can use the extent of an economy’s openness as a proxy for the
strength of incumbents’ opposition to financial development. While crude, this gives us an
objective way to sidestep the morass of trying to identify specific interest groups and their ability
to exert power in different countries. Of course, there could be a more direct economic reason for
trade to be correlated with financial market development. Our theory offers an additional
5
prediction that helps deal with this concern. It is at times when cross-border capital flows are
plentiful that trade should matter. We take these predictions to the data.
We find that in the initial decades of the twentieth century and the closing decades, both
periods when cross-border capital flows were relatively plentiful, measures of a country’s
financial development are strongly correlated to exogenous measures of its openness to trade.
This evidence is consistent with our hypothesis that incumbents’ incentives to oppose financial
development are relatively muted when a country’s borders are open. By contrast, in the
intermediate periods (from the 1930s to the 1970s) when cross-border capital flows had dwindled
to a trickle for a variety of reasons (ranging from the autarkic policies adopted during the Great
Depression to the Bretton Woods agreement that favored trade at the expense of finance) we find
that trade openness did not have as strong a positive correlation (if at all) with financial
development. These findings suggest that it takes the combination of openness in product and
financial markets to mute incumbent incentives to oppose financial development. They also
suggest a rationale for why indicators of financial development fell between the 1930s and the
1970s; cross-border flows, especially of capital, were relatively small.
Finally, we attempt a synthesis of our private interest theory with structural theories,
which affords more testable implications. It has been argued that in countries with a civil law
origin, policies can be imposed more easily from the center (see Rajan and Zingales (1999) or
Glaeser and Shleifer (2001) for references). This should then imply that civil law countries should
be much more prone to capture by focused private interests, such as our incumbents. If so, we
would expect to see that as cross-border financial flows ebbed in the 1930s, trade openness
should have become much less potent a force for financial market development in civil law
countries than in common law countries. By contrast, as financial flows resumed in the 1990s,
incumbents in more open civil law countries should have had a stronger incentive and ability to
press for financial development, so trade openness should become more potent a force for
financial market development in civil law countries. This is, in fact, what we see in the data.

6
We are, of course, not the first to point to the influence of private interests on financial
development, though our focus is quite different from previous work. Jensen (1991) argues that
legislation backed by potential takeover targets crimped the market for corporate control even
while it was having salutary effects on U.S. industry. Kroszner and Strahan (1999) explain the
timing of financial liberalization across states in the United States in the 1970s and 1980s with
variables that relate to the power of private interest groups. Morck, Strangeland and Yeung
(1998) find that the share prices of heir-controlled Canadian firms fell on news that the Canada-
US free trade agreement would be ratified. One reason they suggest is that the treaty had a
provision for greater capital market openness, which would reduce the advantage heir-controlled
firms had from access to capital. Bebchuk and Roe (1999) argue that corporate governance
regimes will be strongly influenced by the initial positions of owners. Our paper is related to all
these in that we also emphasize the role of private interests in retarding financial development,
but we differ in that we attempt to find general patterns across countries.
We will postpone a discussion of the other related literature until we have presented the
theoretical reasoning and tests. The rest of the paper is as follows. In section 1 we describe how
we collected the data, then we present measures of financial sector development in different
countries at various points in the 20th century. In section 2, we present our interest group theory
of why some countries develop their financial systems and others not. In section 3, we test both
the time series and cross-sectional implications of this theory. In section 4 we explore the reasons
for the reversal, and offer a synthesis of structural and interest group theories, followed by a test.
We then conclude.
1. Evolution of Financial Development over the Twentieth Century
1.1. What do we mean by financial development
The immediate problem faced by any empiricist is how to measure financial
development. The right measure would capture the ease with which any needy entrepreneur or
7
company with a sound project can obtain finance, and the confidence with which investors
anticipate an adequate return. Presumably, also, a developed financial sector can gauge,
subdivide, and spread, difficult risks, letting them rest where they can best be borne. Finally, it
should be able to do all this at low cost.
In our view, the most important word in the above definition is “any”. In a perfect
financial system, it will be the quality of the underlying assets or ideas that will determine
whether finance is forthcoming, and the identity of the owner (to the extent it is orthogonal to his
capability of carrying out the project) will be irrelevant. Because our focus is on how easy it is to
raise finance without prior connections, our measures of financial development will emphasize
the availability of arm’s length market finance (and if the data were available, the availability of
non-relationship-based bank finance).
This choice is not innocuous. In some financial systems, capital is easily available for
anyone within a circle of firms and financiers, but it does not percolate outside (Hellwig (2000),
Rajan and Zingales (1998b)). It may well be that most investment opportunities originate within
this closed group, and this group can undertake more daring investment than would be possible in
an economy with more widespread access. We would not, however, deem this economy to be
financially developed. In a sense, we adopt the Schumpeterian view that a critical role of finance
is creative destruction, and this is possible only if there is a constant flow of capital into new
firms and out of old firms.
This then suggests we focus on different measures of the size of arm’s length
markets (such as equity market capitalization, volume of equity issues, or number of listed firms)
to measures of the size of the economy as our measures of financial development. While they are
no doubt crude proxies, these ratios broadly capture a country’s level of financial sophistication
and they are standard in the literature.

8
1.2.Historical Differences in Reporting Data
The second more formidable challenge, specific to the historical nature of our analysis, is
the difficulty in obtaining reliable sources for historical information about financial markets.
Primary sources are often lost or inaccessible, while secondary sources are contradictory, or
repeat uncritically the same primary sources. To further complicate our task, the type of
information statisticians and governing bodies of stock exchanges were interested in at the
beginning of the twentieth century seems quite different from the ones we are interested in today
(this seems a topic worthy of a separate study). We discuss some of these differences because
they help shed some light on the different perceptions of the nature and role of financial
instruments at that time.
A number that is often reported is the total nominal value of securities outstanding in a
country. This clubs together not only stocks and corporate bonds, but also Government bonds,
making the number difficult to interpret. The clubbing of information on corporate bonds and
stocks, which is pervasive even in the United Kingdom, probably the most sophisticated financial
market at that time, reflects the similarity of these two instruments at that time. The use of
preferred stock paying a fixed dividend was widespread. Also, common stock paid very high
dividends, making them more similar to bonds. One consequence of the high dividend payout
ratio was that most stocks traded fairly closely to their nominal value. In fact, stock prices in
many countries were quoted as a percentage of their nominal value. Thus, even from an investor’s
point of view, bonds and stocks were perceived as very close substitutes.
A second problem is that the official statistics at the beginning of the twentieth century
report the total universe of corporations existing at that time, rather then the subset of those that
are publicly traded. To make the numbers more comparable across time we classify companies as
publicly traded only if the firm is quoted during the year. Even with this requirement, we may
still have very infrequently traded stock.

9
A final problem comes from the existence of regional exchanges. At the beginning of the
century, not only was trading more fragmented across exchanges, but so was listing. For example,
the Banco do Brazil is listed in the Rio Stock Exchange but not in San Paulo. Companies listed
only in Osaka represent a not inconsiderable portion of the total companies listed in Japan. Most
extreme is Germany, probably as a consequence of the delayed political reunification. In 1913
Germany had nine major stock exchanges and Berlin represented only about 50% of the total
capitalization.
Data for regional (or secondary) stock exchanges are especially challenging. Since many
have disappeared or have been absorbed by the main exchange, they tend not to be well
documented. We try, as best as possible, to reconstruct a measure that includes all the major stock
exchanges, eliminating double listing. When this is not possible for the date of interest, we
compute the ratio of the capitalization of the secondary exchanges to main exchange at the
earliest date available and then use this ratio to extrapolate backwards the value of these
exchanges. Since the importance of regional exchanges has gone down over time, this procedure
clearly biases downwards the estimate of the total stock market capitalization in countries with
fragmented stock markets. This should be kept in mind in the analysis.
1.3. Various Measures of Financial Development
Let us now describe the various indicators of financial development we use.
1.3.1. Banking Sector
We use the ratio of deposits (commercial banks plus savings banks) to GDP as a measure
of the development of the banking sector. One shortcoming is that this measure captures only the
liability side of banks, ignoring differences in the composition of bank’s assets. Another
shortcoming is that this measure cannot indicate if banks operate as a cartel, forming a closed
shop to new industrial entrants. Despite this shortcoming, the measure has the virtue that it is
available for a long time series and for a large cross section of countries. In more recent periods,
10
we have domestic credit from the private sector to GDP, which will be our measure of banking
sector development.
1.3.2. Equity Issues
One measure of the importance of equity markets is the fraction of investments that are
funded through equity issues. The proxy we use is the ratio of equity issues to Gross Fixed
Capital Formation (GFCF) during the year. Ideally, we would have liked to normalize corporate
equity issues by the amount of corporate investments, but this datum is not consistently available.
In interpreting the results, therefore, it is important to realize that our measure will tend to
underestimate the level of financial development of countries where agriculture (which does not
enter in corporate investments but does enter in total investments) is more important. It will also
tend to underestimate the level of financial development in the earlier part of the century, when
corporate investments were a smaller fraction of total investments.
Another drawback of this measure stems from the well-known cyclicality of equity
issues. A disproportionate amount of equity issues are concentrated during boom years (Choe,
Masulis and Nanda (1993)). This can bias cross-country comparisons, to the extent stock market
booms are not contemporaneous across economies. It also biases the time series comparisons if
one of the reference years was a boom year .
1.3.3. Capitalization
A more stable measure of the importance of the equity market is the total stock market
capitalization. Since the capital-output ratio has remained fairly constant during the 20th century,
the ratio of equity market capitalization to GDP represents a good proxy for the fraction of fixed
capital financed via publicly traded equity.2
A drawback is this measure captures the amount of equity listed, not the amount of equity
raised. Thus, the presence of few companies that have greatly appreciated in value can give the
impression of an important equity market even when the amount of funds raised in the market is
11
tiny. On the positive side, however, this measure is less cyclical than the previous one, and thus
is better for making comparisons across countries and across time periods.
In measuring both equity issues and stock market capitalization we restrict ourselves,
whenever possible, to domestic companies. London and Paris at the beginning of the twentieth
century, and New York more recently, have attracted many foreign listings. We are especially
interested, however, in how a country’s financial and legal institutions help domestic industries
raise funds, and as some have argued (see Kennedy (1989) for example), the financial sector ‘s
ability to fund foreigners may not imply an ability to fund domestic firms. Moreover, our focus
reduces the possibility of mechanical correlations in our tests. This is why we limit ourselves to
domestic companies.
1.3.4. Number of companies listed.
A final indicator of the importance of equity markets is the number of publicly traded
domestic companies per million of population. This is a measure that is not tainted by fluctuations
in stock market valuations and possible mismeasurement of the level of GDP. One drawback is
that it is affected by the process of consolidation as well as by the fragmentation of the industrial
structure. Countries with a more concentrated industrial structure will have fewer, but larger,
companies and thus might score low according to this measure.
In sum, any indicator has its own drawbacks. This is the reason why they should be
looked at together to get a better sense of the development of a country’s financial structure.
One indicator that is missing from our list is the volume of securities traded.
Unfortunately, the way volume is recorded (even today) is quite controversial. The Federation
Internationale Bourses Valeurs (FIBV) classifies data on volume traded into two groups: trading
system view (TSV) and regulated environment view (REV). The TSV system counts as volume
only those transactions which pass through the exchange’s trading floor, or which take place on
the exchange’s trading floor. The REV system includes in volume all the transactions subject to
supervision by the market authority, with no distinction between on- and off-market transactions.
12
As the FIBV warns, comparisons are not valid between stock exchanges belonging to different
groups, because the numbers differ substantially depending on method used. For example, in
Paris, according to the TSV method the volume of equity traded in 1999 was $770,076 million,
while the REV method suggests a volume four times greater ($2,892,301 million). Given the
magnitude of the difference and the impossibility of obtaining consistent data both across
countries and over time, we chose to disregard this indicator.
1.4. Data Sources
1.4.1. Stock Market Capitalization and Number of Companies Listed
Our starting point was the official publication of the stock exchanges as well as those of
the Federation Internationale des Bourses Valeurs (FIBV). The latter provides extensive
information only starting in 1980. Official publications of individual stock exchanges often go
back only to WWII. When these are not available, we use information contained in private guides
to stock exchanges. Only for Japan and the United States did we find official publications before
WWII.
To assess the importance of the equity market in 1913 we rely on two approaches.
Whenever possible we secured a copy of a stock exchange handbook in 1913 (or the closest year
before 1913). Using the handbook we identify the number of domestic companies listed, the
number of shares of each company, and the price per share. We then compute the total stock
market capitalization as the sum of the product of price times the number of shares. We were
able to do this for Australia, Brazil, Canada, Cuba, Denmark, Germany, Italy, Netherlands,
Russia, Sweden, Switzerland, the United Kingdom, and the United States.
For example, the total equity market capitalization of U.S. domestic companies in 1913 is
obtained as follows. From the 1914 edition of “The Financial Review: Finance, commerce,
railroads” we obtain the list of the companies traded in New York, Boston, Philadelphia,
Baltimore, and Chicago and their corresponding prices (average of the high and low for 1913).
After eliminating cross-listings and the companies that were foreign, we collected the stated

13
capital and the par share price from Moody's Manual of Railroads and Corporation Securities.
This enabled us to calculate the number of shares. The final figure is the sum of the capitalization
of all five exchanges. We do not include the Curb Stock Exchange (the ancestor of Amex)
because it was officially set up only in 1921.
In some cases we had to make some educated guesses, but, whenever possible, we cross-
checked the realism of these choices. For example, it is a challenge to derive the total
capitalization of all German stock exchanges, as many have disappeared. We did the following:
We obtained both the nominal and the market value of stock traded at the Berlin Stock Exchange
in 1913 from adding up individual company values in Saling's Börsen-Jahrbuch (1914). The total
market capitalization of domestic companies is 18,957 million marks, with a nominal
capitalization of 12,065 million marks. From Gömmel and Pohl (1992) we know that the nominal
value of all shares traded in Germany is 16.0 billions Marks in 1913. This datum is consistent
with Gunzert, Benning, and Veesenmayer (1929) who estimate the total nominal capitalization of
German Stock Exchanges at 14.7 billions Marks in 1912. From these figures we derive an
estimate of the nominal values of shares traded in German stock markets other than Berlin. We
then apply the same market-to-book ratio we found for Berlin in 1913 and we arrive at the final
estimate of 25,280 million marks.
A second source was various issues of the Bulletin of the International Institute of
Statistics (IIS). Starting in the late nineteenth century, statisticians from all over the world met
each year for a conference. This association formed a special group to compute the importance of
security markets in different countries. Unfortunately, many of the reports club together stocks
and bonds but we do obtain some disaggregate information for some countries.
1.4.2. Data on Equity Issues
Data on equity issues are relatively easier to get for the pre WWII period than for the
period immediately after the war. This may reflect the greater importance that was attributed to
this information before World War II. When not available from official statistics, we gather this

14
information from financial newspapers of that time such as the Economist, Commercial and
Financial Chronicle, Deutsche Oekonomiste, etc.
1.4.3. Data on Deposits and National Accounts Data
Data on deposits, national income, and gross fixed capital formation come from Mitchell
(various issues). Mitchell’s data are available until the mid1990s. We extrapolate this to 1999 for
deposits by using the growth rate of deposits from the IMF's International Financial Statistics. For
national accounts, we use the data from the NBER web site whenever available. Post WWII
national accounts data come from the IMF's International Financial Statistics. We indicate
whenever data come from a different source. We document the procedure followed for each
country in our dataset. The sources are in an Appendix downloadable from the authors’ web site.
1.5. Stylized Facts
In Table 1, we report the average value of our four indicators of financial development for the
period 1913 to 1999. For every indicator we report both the average across all available
observations and the average for the countries with observations throughout the sample period.
In Table 2 to 5, we report the value of each indicator for each country. The countries reported in
these tables are those for which we could get pre-World War II financial market data. Since the
availability of data on financial development has exploded recently, in our tests for the most
recent years (see later) we include all the countries we can get data on.
An analysis of these tables suggests the following facts:
1) Financial systems were highly developed in 1913.
Regardless of the way we measure, the average level of financial development in 1913 was
quite high, comparable to that in 1980 or 1990.
The average ratio of deposits to GDP in 1913 is very similar to that in 1980 (see Table 1).
Similarly, the data on the capitalization of the stock market (Table 1 and Table 3) indicate that in
most countries, equity markets were bigger relative to GDP in 1913 than in 1980. Only by the end
of the 1990s do they seem to exceed their 1913 level.
15
Equity issues were also a relatively more important source of funds for corporate investments
in 1913 than in 1980 (and even 1990) for most countries we have data for (see Table 1 and Table
4). This is particularly noteworthy when we recognize that the 1913 figures are biased
downwards relative to the 1990 ones, because we normalize by Gross Fixed Capital Formation,
and corporate investments represent a much smaller proportion of GFCF in 1913 than in 1990.
Most countries have the same number of listed companies per million people in 1913 as
in 1980 (see Table 1 and Table 5). In some countries, even with the explosion of financial
markets during the late 1990s, the 1913 level has not been surpassed.
While, in general, the richest countries had highly developed financial sectors in 1913,
the degree of development does vary widely. The level of economic development explains only
14% of the cross-country variation in the deposit-to-GDP ratio and it is not even statistically
significant in explaining the level of equity market capitalization. Argentina, for instance, had
about the same per capita GDP as Germany and France, but its level of deposits is only about two
thirds that of France and Germany. Similarly, in 1913 Argentina’s per capita GDP was three
times as big as Japan’s, but the relative size of its equity market was only one third of Japan’s.
Surprisingly, Cuba is the most financially developed country, at least by equity market
capitalization. On close scrutiny, this figure does not appear to be an aberration. First, small
countries tend to be very financially developed (a fact that is not inconsistent with our proposed
theory). The countries with the highest market capitalization ratio in 1997 were Hong Kong
(2.45), Switzerland (2.08), and Luxembourg (1.98). Second, at the beginning of the century Cuba
was a fairly rich country. In any case, Cuba does not enter any of the regressions (because other
data are missing).
2) Countries that were most advanced in 1913 were not necessarily as advanced recently
By our measures, countries that were financially developed in 1913 are not necessarily
countries that were financially advanced in recent times. In 1913, equity issues appear to be more
important in France, Belgium and Russia, than they are in the United States. Thus, by this

16
measure, some Continental European markets seem to be at least as developed as the U.S. market
at that time. The data on market capitalization in Table 3 confirm this impression. While the U.K.
had a high capitalization in 1913, Belgium, France, Germany, and Sweden were close, ahead of
the United States. The distinction between Continental Europe and Anglo-American countries,
which has been highlighted in recent studies, does not seem to hold then. In fact, this distinction
seems to be a post-WWII phenomenon implying financial markets in Civil Law countries appear
to have declined more between 1913 and the early 1990s (though the gap has narrowed since).
Another way of seeing the change in patterns is to compute the correlation between indicators
of financial development at different points in time. Using the Spearman rank correlation test, we
find a correlation of 0.4 between capitalization to GDP in 1913 and capitalization to GDP in
1999. We reject the hypothesis that the two distributions across countries are independent at the
10 percent level (21 observations). The cross-country pattern of financial development in 1999 is
positively correlated with that in 1913! However, this is not true a decade earlier. The correlation
of the 1913 data with 1990 and 1980 data is lower (0.21 in 1990, -0.07 in 1980) and we cannot
reject the hypothesis that the distributions are independent.
By way of comparison, consider the cross-country correlation of per capita GDP measured at
two different points in time. Using the Spearman rank correlation test, we find a correlation of
0.55 between per capita GDP in 1913 and per capita GDP in 1999 (independence rejected at the 1
percent level with 22 observations). The correlation of the 1913 data with 1990 and 1980 data is
equally high (0.62 for 1990, 0.73 for 1980). Thus over long periods, the relative ranking of
countries according to financial development seems to be more volatile than their ranking
according to economic development.
3) Indicators of financial development fall then rise between 1913 and 1999.
The most striking fact that emerges from Table 1 is that indicators of financial development
fall considerably and then rise again. It is not easy to define precisely where the indicators start
falling, but the data suggest that the turning point is somewhere in the 1930s or 1940s.
17
It is worth noting that the decline in indicators is not limited to the countries that lost the war,
although it is more pronounced for such countries. It is not even seen only in countries involved
in the war, since we see it in Sweden, Argentina, and Brazil. Finally, it cannot be attributed to a
decline in the standard of living, since during the same period the average per capita GDP in 1990
dollars increased from $ 4,476 to $4,935.
While we cannot also date the recovery in indicators precisely, the turning point lies
somewhere in the 1980s. Over the 1980s and 1990s, for the countries reporting throughout, the
average ratio of deposits to GDP increased by 35%, the average ratio of stock market
capitalization to GDP increased four times, and so did the fraction of GFCF raised via equity. The
number of listed domestic companies shows a more modest increase (30%).
These facts cannot be explained by structural theories of financial development. In the
next section, we provide a more dynamic interest group theory that may account for the observed
facts. Later, we will argue that such a theory, when modified by structural explanations, may
indeed reconcile our historical findings and the more recent findings that structural theories have
relied on.
2. An Interest Group Theory of Financial Development.
We now describe a parsimonious theory that will attempt to explain the broad patterns we
have noted in the data. In essence, it will suggest why financial development can differ so much
between countries at similar levels of economic and industrial development. It will then explain
why the same forces that lead to financial development can also cause its reversal. No doubt, the
specifics of each country will differ and the theory, on occasion, may seem a caricature, but this is
the price we have to pay for parsimony.
2.1. The necessity for government intervention.
The starting point of our theory is that financial development is not a natural outcome of
market forces, but requires political intervention. The Government needs to create the essential
ingredients of a developed financial system, which includes respect for property rights, an
18
accounting and disclosure system that promotes transparency, a legal system that enforces arm’s
length contracts cheaply, and a regulatory infrastructure that protects consumers, promotes
competition, and controls egregious risk-taking.
No doubt, private arrangements could go some way in achieving all this. But the
government has the ability to co-ordinate standards, and to enforce non-monetary punishments
such as jail terms, that give it some advantage in laying out and policing the ducts in which
financial plumbing will go. In fact, there is ample evidence that Government intervention is
beneficial, if not necessary, for financial systems. La Porta et al (1997), for instance, show that
laws protecting investors are an important determinant of financial development across countries.
Similarly, in their study of the evolution of the Czech and Polish financial systems, Glaeser et al.
(2000) argue that the “laissez faire” attitude of the Czech government deprived the market of the
legal and regulatory infrastructure necessary for financial development.
Given that government action is needed for financial development, the focus of our
inquiry then shifts to when there is political will to undertake these actions.
2.2 The Political Economy of Financial Development
Financial development seems so beneficial that it seems strange that anyone would be
opposed to it. However, financial development is not always win-win. It could pose a threat to
industrial and financial incumbents. Industrial incumbents are firms in industry, who already have
assets in place (collateral) and a history of operations (reputation). Financial incumbents are
financial institutions such as commercial banks or investment banks, who already have
reputations and relationships with clients. We will argue that incumbents may be worse off as a
result of financial development.
Rich incumbents have the least to gain from financial development, but they may have
the most potentially to lose. An incumbent industrialist, for instance, facing limited growth
opportunities benefits very little from financial development. He (or she) can finance new
projects out of earnings – as most established firms do -- without accessing external capital

19
markets. Even when his business does not generate sufficient cash to fund desired investments, he
can use the collateral from existing projects and his prior reputation to borrow. By contrast, he is
likely to suffer indirectly from financial development. The better disclosure rules and
enforcement in a developed financial market reduce the relative importance of his collateral and
reputation, while permitting newcomers to enter and compete away profits.
Financial development not only levels the playing field between industrial incumbents
and entrants, it also hurts traditional ways of doing business. Better public disclosure reduces the
informational advantage incumbents typically have because they are better connected. Prompt
and unbiased enforcement subjects them to the same rules as everybody else. Regulation further
limits their ability to take advantage of their controlling position. In sum, the process of financial
development brings along with it the disinfectant of transparency, which tends to exterminate
cozy practices from the body economic.
Similar arguments apply to incumbent financiers. While financial development provides
them with an opportunity to expand their activities, it also strikes at their very source of
comparative advantage. In the absence of good disclosure and proper enforcement, financing can
only be “relationship-based”. The financier uses his connections to obtain information to monitor
his loans, and uses his various informal levers of power to cajole repayment. Key, therefore, to
his ability to lend, is his relationships with those who have influence over the firm (managers,
other lenders, suppliers, politicians, etc.) and his ability to monopolize the provision of finance to
a client (either through a monopoly over firm-specific information, or through a friendly cartel
amongst financiers). Disclosure and impartial enforcement tend to level the playing field and
reduce barriers to entry into the financial sector. The incumbent financier’s old skills become
redundant, while new ones of credit evaluation and risk management become necessary. Financial
development not only introduces competition, which destroys the financial institution’s rents and
its relationships (see Petersen and Rajan (1995)), it also destroys the financier’s human capital.3
20
In sum, a more efficient financial system facilitates entry, and thus leads to lower profits
for incumbent firms and financial institutions. Moreover, markets tend to be democratic, and
they particularly jeopardize ways of doing business that rely on unequal access. Thus, not only
are incumbents likely to benefit less from financial development, they might actually lose. This
would imply that incumbents might collectively have a vested interest in preventing financial
development, and might be a small enough group (following Olson (1965), Stigler (1971)) to
organize successfully against it.
There is some evidence consistent with our basic thesis that financial development has a
disproportionate effect on new and young firms. Rajan and Zingales (1998a) find that the growth
in the number of new establishments is significantly higher in industries dependent on external
finance when the economy is financially developed. Johnson et al. (2000), in an interesting recent
study of trade credit in transitional economies, find that an important consequence of an effective
legal system in a country is that a firm offers more trade credit to new trading partners. Firms that
believe in the effectiveness of the legal system are also more likely to seek out new trading
partners. Finally, Laeven (2000) finds in a study of 13 developing countries that financial
liberalization tends to alleviate credit constraints for small (typically young) domestic firms while
no such effect is seen for large domestic firms, which typically tend to have preferential access to
credit before.
Financial development also seems to affect product market competition. In a comparative
study of the textile industry in Mexico and Brazil around the beginning of the twentieth century,
Haber (1989) shows that Brazil, following its political revolution, liberalized finance, and saw the
textile industry grow faster and become less concentrated than the Mexican textile industry.
Porfirio Diaz, the Mexican dictator during this period, was much more a prisoner of incumbent
interests. Mexico’s financial markets remained underdeveloped during his regime, with the
consequence that Mexico’s textile industry, while starting out larger and relatively more
competitive, had less entry, and ended up smaller and more concentrated than Brazil’s.
21
2.3 Financial Repression is Not the Only Way to Protect Incumbent Rents.
Financial underdevelopment is not the only barrier to entry. Incumbents could restrict
entry into their industry directly through some kind of licensing scheme. Since the repression of
financial markets could be severely constraining when these incumbents occasionally need
external finance, why not ban entry into industry (or finance) outright? There are, however, some
advantages for incumbents from leaving finance underdeveloped as opposed to banning entry.
First, direct entry restrictions often require very costly enforcement. Enforcement
becomes particularly difficult, if not impossible, when innovation can create substitutes for the
product whose market is restricted. Each new threatening innovation has to be identified,
categorized and then banned. Second, the active enforcement of restrictions on entry is a very
public, and therefore, politically transparent process. In a democracy, citizens have to be
convinced that restrictions on entry benefit them, and this is a hard sell when they are faced with
the poor service and extortionate prices of the local monopoly. By contrast, the malign neglect
that leads to financial underdevelopment is less noticeable – it goes with the grain to have
comatose bureaucrats who do not act rather than have overly active ones -- and can be disguised
under more noble motives such as protecting citizens from charlatans. Leaving finance
underdeveloped is an act of omission with few of the costs entailed by an act of commission such
as the use of the apparatus of the state to stamp out entry. Malign neglect may be as effective as
active harassment but much easier to implement!
In general, however, we would expect direct entry restrictions and financial
underdevelopment to be used as complementary tools. In Figure 1, we graph the Djankov et al.
(2000) measure of the number of days in different countries to start a business (a measure of the
direct barriers to entry) against the accounting standards in that country (a measure of financial
development). The correlation is significantly negative, and regression estimates (not reported)
show that it persists after correcting for the level of GDP. Financial underdevelopment does seem
to be present in complement to other barriers to entry!

22
2.4. What determines outcomes?
Now that we have specified motives, what determines outcomes? In some situations,
incumbents may not have the ability, or the incentive, to oppose development, and that is when
we will see rapid progress.
The first, of course, is when there is political change. By creating a fresh power structure,
political change can foster anti-incumbent institutions, one of which may be financial
infrastructure. For example, a number of mortgage banks and institutions like the Credit
Mobiliere were encouraged by the government of Louis Napoleon after its coming to power in
1848 as a counter to the Bank of France and the Rothschilds who were thought to be sympathetic
to the deposed monarchy (Cameron (1965)). More recently, Weber and Davis (2000) find that a
country’s transition to a multi-party democracy increases its estimated rate of creation of a stock
exchange by 134% during the subsequent three years.
Industrial incumbents will also benefit from financial development when their investment
opportunities are high relative to their ability to finance them. A sudden expansion in required
scale, perhaps because of an opening of new markets, or because of technological change,
increases their demand for financing. The increased scale may also serve as a natural barrier to
new entrants, reducing the need for financial underdevelopment as an entry barrier. Alternatively,
a sustained period of poor economic conditions may deplete the reserves of incumbents,
increasing the need for external finance, and allowing them to be more amenable to financial
development when the economy turns up.
2.5. Financial Development and Openness.
One such period when opportunities expand disproportionately compared to available
resources is when an economy opens up to foreign trade. It is not surprising that the periods of
expansion in world trade – the latter halves of both the nineteenth and twentieth centuries – have
been, broadly speaking, associated with increasing financial development. But we believe that

23
openness promotes financial development, not just because it expands opportunities, but also
because it increases competition.
2.5.1. Openness to Capital Flows and Competition in the Financial Sector
First, consider the possibility of cross-border capital flows. Access to international capital
markets allows the largest and best-known firms to tap foreign markets for funds. This will
introduce competition in the richest segment of the market, where domestic financial firms were
previously earning their rents, and foster liberalization. For example, as Japanese firms escaped in
the 1980s to raise arm’s length finance from the Euromarkets, Japanese banks were forced to stop
repressing the Japanese corporate bond markets (see Rosenbluth (1989)).
Domestic financial institutions will also be forced to seek new clients, bringing finance to
a host of firms that previously did not have the relationships to obtain finance. Since these clients
will be riskier, and less well known, financial institutions will have no alternative but to press for
improved disclosure and better contract enforcement. In turn, this leveling of the playing field
will create the conditions for more entry and competition in the financial sector.
Faced with a loss of domestic clientele, financial institutions will also seek to enhance
their skills to compete with foreign financial institutions both internally and abroad. As they seek
new clients outside, they will be forced as a quid pro quo to increase access for foreigners, and
dismantle domestic regulations that give them their privileged competitive positions. For
example, the German government banned lead underwriting of Deutschmark bonds by Japanese
financial institutions until Japan agreed in 1985 to allow foreign securities firms to act as lead
underwriters for Euroyen bonds (see Rosenbluth (1989)).
Free capital mobility even turns individual investors into a force for financial
development. Once offered the choice, investors in a country that is financially repressed will
rush to move their funds to more developed markets, where they can be better diversified and
earn returns that are not diminished by transactions costs. The loss of a captive source of funds

24
will further push domestic financial institutions to improve their returns to compete with foreign
investment opportunities, again strengthening the push towards financial development.
Capital mobility is also likely to make the government more circumspect about directing
credit. Because it will have less control, as discussed above, over who gets credit, and because
product markets become more competitive, the risks in, and information requirements for,
lending will increase. The potential for large errors from the centralized direction of credit will
increase. Moreover, the ability of the government to provide large subsidized loans to favored
firms will decrease as mobile capital forces governments to maintain macro-economic prudence
(see, for example, Loriaux’s (1997) description of the constraints on French intervention in
allocating credit in the 1980s). The government’s role in the financial sector will diminish.
A final source of pressure for financial development comes from foreign financial firms.
Since they are not part of the domestic social and political networks, they prefer transparent arm’s
length contracts and enforcement procedures to opaque negotiated arrangements. It is not a
coincidence that these are the very requirements of would-be domestic entrepreneurs who are also
outsiders to the domestic clubs.
2.5.2. Openness to Trade and Competition in the Industrial Sector.
Consider now openness to trade. While foreign markets bring opportunity, openness also
brings foreign competitors to domestic markets. Foreign entry drives down monopoly rents
giving domestic industrial incumbents, especially in tradable sectors, less of an incentive to
oppose domestic entrants. Lower profits also drives down incumbent cash flows, making
incumbents more dependent on external finance. The inadequacies of the domestic financial
market will be especially magnified to these incumbents if foreign entrants are supported by
sophisticated financial institutions and markets in their own countries. As Perez (1997) argues, a
prime impetus for the capital market reforms in Spain in 1988 was that industry pushed for it after
Spain acceded to the European Union in 1986 and industry faced competition from rivals who
had access to lower cost financing.4

25
Openness will also have effects over time. It will be harder to accommodate foreigners in
cozy domestic arrangements, which are typically cemented through traditional and familial ties.
As these are forced to change, incumbents no longer need to protect them through restrictions on
domestic entry. Similarly, once domestic producers start competing effectively in a large world
market, they are less likely to worry about domestic entry, which cannot have much effect on
world prices (though entry may still affect domestic costs).
We have argued thus far as if industry, as a whole, will be more predisposed to financial
development when the economy opens up to trade. This need not be the case. When an economy
opens up to trade, the non-traded sectors, facing less competition, may become more profitable,
and consequently more powerful, than the traded sectors. They may have more of an incentive to
maintain financial entry barriers. Moreover, even in the traded sectors, there may be an incentive
to petition the government for loan subsidies in the face of foreign competition instead of
improving the quality of the domestic financial system. The effect of openness to trade is, by
itself, not unambiguous.
2.5.3. Interactions
When some countries relax capital controls and international markets, like the Euro
Market, arise, large pools of capital emerge that are willing to flow across borders. At such times,
trade flows in and out of a country are likely to create avenues for capital flows (through under-
invoicing, over-invoicing, and delayed payments – see Eichengreen (1996)) whether the county
has capital controls or not. Therefore, trade flows become a better proxy for capital flows, when
international capital mobility increases, as in the early and late part of the 20th century.
Secondly, high capital mobility further strengthens the discipline trade openness imposes
on Governments. In the absence of capital flows, Governments can more easily subsidize favored
incumbents and fix prices in the financial sector, reducing the beneficial effect of foreign
competition. Such forms of protection, which limit the role of private capital markets, are
unsustainable when capital is mobile across borders.

26
For both these reasons, we expect the effect of trade on financial development to be
particularly pronounced in periods of high international capital mobility.
3. A Test of the Political Theory of Financial Development.
As we have argued, direct measures of the political power of interest groups, and their
ability to influence outcomes are controversial at best. Our theory, however, does lead to some
indirect, but more objective, tests. Whatever the configuration of domestic political power, both
the incentive of domestic incumbents, and their ability, to hold back domestic financial
development is likely to be the least when the country is open to cross-border capital flows.
3.1. Preliminary concerns.
There are some issues to deal with before we proceed to tests. First, what is the relevant
measure of financial development from the perspective of our theory? Second, could there be
more mechanical channels for the link between openness and financial development?
3.1.1. The Relevant Measure of Financial Development.
As we have argued, the amount of funds raised from arm’s length financial markets or the
amount of credit offered by competitive banking systems could be measures (albeit crude) of
financial development. Unfortunately, we do not know how competitive the banking system is –
we only have measures of the quantity of deposits. The banking system could be concentrated and
captive to incumbent interests, dominated by state owned banks, or just plain inefficient.
Therefore, we prefer to use the size of the arm’s length financial markets as our measure of
development. This also accords well with the view that arm’s length markets will emerge only
when financial infrastructure such as disclosure requirements (see Sylla and Smith (1995)) and
investor protection are reasonably developed (see La Porta et al. (1998)), while banks can exist
even when infrastructure is primitive (see Rajan and Zingales (1998b)).
3.1.2. Measure of Openness

27
Foreigners may choose to invest in a country, or raise financing from it, when its
financial infrastructure is highly developed. This is why we cannot use a country’s cross-border
capital flows as a measure of openness because it may be directly connected with financial
development. However, the theory suggests a proxy. Capital can flow on the back of trade,
especially when there are large international pools of capital willing to flow across borders. Also,
countries that are more open to trade during a period when capital flows freely across borders are
also likely to have less stringent capital controls. Finally, we have readily available instruments
for trade (we discuss this shortly). So we will use openness to trade -- the ratio of the sum of
exports and imports of goods to GDP as our measure of openness, with the rationale that it is
likely to be correlated with the propensity for cross-border capital flows, but not directly to a
country’s financial development.
Of course, openness is partially endogenous. There is a large literature (see, for example,
Gourevitch (1986), Rogowski (1989), O’Rourke and Williamson (1999)) where it is suggested
that the decision to open up or close down an economy to trade is a political one, based on the
relative strengths of the sectors that stand to gain or lose from openness. For example, if
incumbents in the industrial sector are very efficient, they may welcome the opportunity to trade.
Also, because they are so efficient, they may not fear domestic competition. As a result, they may
welcome financial development. The concern the literature raises is that trade openness and
financial sector development may both be politically determined, but the former need not directly
influence the latter. The obvious solution is to use an instrument for openness that is correlated
with openness but not directly with politics, and this is what we will do.5
Finally, it would be useful to separate the direct effects of cross-border trade on financial
development (which are ambiguous) from the indirect effects through cross-border capital flows,
which are unambiguous. Our theory suggests a way. Trade is a better proxy for cross-border
private capital flows when there are large such pools of capital searching for high returns. World-
wide international capital mobility has varied during the 20th century. The first three decades were

28
characterized by high international capital mobility. As a result of the restrictions on flows
imposed during the Great Depression and the Bretton Woods agreement, this level was only
approached again in the 1990s (see O Rourke and Williamson (1999), p213). Since the
unambiguous indirect effects of trade openness kick in only when capital is internationally
mobile, we should expect to see a higher positive correlation between financial development and
openness during periods of high international capital mobility.
3.1.3. The Test
We thus have two hypotheses:
1) For any given level of demand for financing, a country’s domestic financial development
should be positively correlated with trade openness at a time when the world is open to cross-
border capital flows.
2) The correlation between a country’s trade openness and financial development should be
weaker when worldwide cross-border capital flows are lower.
We will need a proxy for the demand for financing. Bairoch (1982) computes an index of
industrialization across a group of countries for a number of years. The index number in a year
reflects a country's absolute level of industrialization in that year, with England in 1900 set at
100. There are measurement issues with any index, but this one seems well accepted among
economic historians. Bairoch's index will be our preferred control for the demand for financing
whenever it is available. We will use per capita GDP when Bairoch's numbers are not available.
To test the first hypothesis, we examine the effect of openness on financial development
in 1913, the earliest date for which we have data for a sizeable number of countries, and 1996-98,
the last period for which we have data. International trade and capital flows were relatively free in
both periods.
3.2. Financial development in 1913
We present summary statistics and pairwise correlations in Table 6 a and b. The ratio of
equity market capitalization to GDP is positively correlated with Bairoch’s index of
29
industrialization (0.58, p=0.01) and with openness (0.33, p=0.19), and negatively correlated with
tariffs on manufacturing (-0.37, p=0.15). The correlation with the interaction between the index
of industrialization and openness is both high and very significant (0.67, p=0.002).
In Table 7, panel A, the ratio of stock market capitalization to GDP is our measure of
financial development. As the estimates in column (i) show, more industrialized countries have
more developed financial markets. More relevant to our hypothesis, more open countries have
more developed financial markets, but due to the small number of observations, this effect is not
statistically significant at conventional level. Our hypothesis, however, is that for any given level
demand for financing, more openness should lead to more financial development. Therefore, in
column (ii) we insert the interaction between openness and the index of industrialization, which is
our proxy for the demand for finance. The coefficient estimate for the interaction term is highly
statistically significant (p=0.034). The magnitude of the effect is also large. A one standard
deviation increase in the interaction term increases the ratio of stock market capitalization to GDP
by 50 percent of its standard deviation. Since we have so few observations, we plot the data in
Figure 2 to show the result is not driven by outliers.
We can try to tell the effect of openness apart from the effect of openness working
through demand by including both the level of openness and the interaction term in column (iii).
It turns out that only the interaction has a positive coefficient estimate, and the explanatory power
of the specification in column (ii) is not enhanced by including openness. The magnitude of the
interaction coefficient is higher than in column (ii) but its standard error also goes up. The
problem is that openness and the interaction are highly correlated (=0.69), so it is hard to tell their
effects apart with so few observations. Since the correct specification could be debated, in what
follows we will present estimates for both the effect of openness and the effect of the interaction.
The results thus far indicate that in more open countries, a given demand for finance is
correlated with more financial development. Because openness and financial development may be
simultaneously determined by some omitted variable, we instrument openness with the size of a
30
country’s population in column (iv). Small countries typically have to be more open since it is
difficult to manufacture everything internally (see Katzenstein (1985)). The point estimate of the
effect of openness interacted with industrialization increases by 50% and, in spite of an inevitable
increase of the standard error, remains statistically significant at the 5% level.
Another concern may be that we proxy for openness with the volume of goods traded,
and there may be a disguised link between the volume of trade and the volume of financing. One
measure of openness that is not directly a measure of volume is the tariff on manufactured goods.
We use this as a proxy for the extent of openness in column (v), and the two-stage least squares
estimate (using the same instrument as in the previous column) is negative and significant.
As discussed before, the ratio of equity market capitalization to GDP is a very imperfect
measure of financial development. It is sensitive to fluctuations in relative valuations and to
mistakes in the computation of the GDP (national accounts statistics were widely calculated only
after WWII, all previous numbers are estimates computed in recent years). An alternative
measure, which is immune to both these criticisms, is the ratio of the number of publicly listed
companies to population. In panel 7b, we re-estimate the specifications in panel 7a with this
alternative dependent variable. The correlations are even stronger. Openness has a positive and
significant correlation with development even when included alone. When both openness and
openness interacted are included, the latter remains statistically significant at the 5% level.
Finally, our measure of financial development captures only the size of the equity market,
while the bond market has also played an important role in some of these countries.
Unfortunately, we were unable to obtain data for the size of the corporate bond market for the
same set of countries. From the 1915 Bulletin of the International Statistical Institute (IIS) in
Vienna we did obtain data, however, on the total issues of public corporate securities (both equity
and corporate bonds) by domestic firms in a set of countries in 1912. The IIS sample is slightly
different from our 1913 sample (which we have put together from different sources for each

31
country). We have checked that the data in the IIS sample seem accurate by comparing with
independent sources, and they do seem to represent net rather than gross issues.
In panel 7c, we re-estimate the same specifications using total issues to GDP in 1912 as
dependent variable.6 Here again, the interaction between industrialization and openness has a
positive and statistically significant coefficient. A one standard deviation increase in the
interaction term increases the ratio of total issues to GDP by 68 percent of its standard deviation.
3.3. Financial development in 1997
Regardless of the measure used, openness seems to be positively correlated with financial
development in 1913. The paucity of observations, however, is worrisome. But our hypothesis
suggests the results should also be present in recent times, when cross-border capital and trade
flows have regained the levels they had reached in the early part of the twentieth century.
In Table 8, we re-estimate the specifications in Table 7 using the largest cross section of
data available today. We obtain data for market capitalization from the World Bank’s World
Development Indicators, data on the number of domestic listed companies from the Emerging
Market Factbook, and data on security issues from Beck et al. (1999). Since Bairoch’s index of
industrialization is not available, we use instead the log of per capital GDP in PPP dollar, also
from the World Bank’s World Development Indicators.
To smooth the effects of the East Asian financial crisis we averaged the dependent
variable across three years (1996-98). As Panel A (with equity market capitalization to GDP as
the dependent variable) shows, the results are very similar to those in 1913. Openness has a
positive and statistically significant effect on financial development. This is true both if we use
openness directly (see column (i)) and if we interact it with our proxy for the demand for finance,
the log of per capital GDP (see column (ii)). A one standard deviation increase in the interaction
term increases the ratio of stock market capitalization to GDP by 25 percent of its standard
deviation. In spite of the very high correlation between openness and the interaction between
openness and log per capita income, the larger cross section allows us to distinguish the two, and

32
it is the interaction that is positively correlated (see column (iii)). At the mean level of openness
and log GDP per capital the combined effect is positive, but small (0.10).
Frankel and Romer (1999) predict bilateral trade between two countries using an
expanded version of the gravity model of trade (where trade is proportional to the distance
between countries). Their constructed trade share is then simply the sum of these fitted values
across all possible trading partners. It is perhaps a better instrument for trade than population,
which is all we had in 1913. When we use this instrument, the estimated coefficient almost
doubles (see column (iv)) and remains statistically significant at the 1% level.
We show these results hold for other measures of financial development. In Panel B the
dependent variable is the number of listed domestic companies per million inhabitants in 1997,
while in panel C it is the sum of equity and long-term private debt issues to GDP. To deal with
the cyclicality of equity and debt issues, we use an average across all the years during the 1990s
that are available in Beck et al. (1999). These panels confirm the finding that financial
development is higher for any level of demand when a country is more open.
3.3.1. Robustness.
The greater availability of data at the end of 1990s allows us to explore the robustness of
our results. La Porta et al. (1997) suggest that a better measure of financial development than
market capitalization is the amount of equity held by outsiders. Using this measure of
development, openness or openness interacted with GDP per capita have a positive and
statistically significant correlation with equity held by outsiders (estimates not reported).
Similarly, a good indicator of the ability to raise external funds, and thus a measure of the
development of a financial market, is the quality of the accounting standards, as measured by the
Center for International Financial Analysis and Research. This measure is available only for 39
countries, nevertheless openness alone and openness interacted with GDP per capita are
positively and statistically significantly correlated with it (estimates not reported).
33
One might worry that there is a mechanical link between openness and financial market
development. For example, a large trade deficit has to be financed through capital inflows. If
domestic government assets are insufficient, and if foreign direct investment is small, the inflows
will be reflected in a larger private market for financial assets. Is the link we have found merely
the flip side of a trade deficit? We re-estimate the basic specification using the ratio of trade
surplus to GDP as a substitute for openness (estimates not reported). Trade surplus does not seem
to be correlated with domestic financial development. When we include the interaction of
openness with log per capita GDP, the coefficient of trade surplus does not have statistical
significance, while the interaction term remains positive and statistically significant.
Another way of getting at this is to look at a form of financing that may not be arm’s
length -- domestic bank credit -- and is therefore less likely to be influenced by openness.
Openness does not seem to be statistically significantly correlated with the ratio of domestic
credit to the private sector to GDP (obtained from Beck et al. (1999)). Thus there does not seem
to be a mechanical link between openness and financing – instead the link is to arm’s length
financing (or potentially, if we could measure it, competitive private credit).
3.4. Financial Development Over Time
Our results thus far indicate that both in 1913 and in 1997, for any given level of
demand, measures of financial development were higher in countries that were more open to
trade. Of course, many good institutions are associated with more trade (see, for example, Wei
(2000) who finds lower corruption in countries that trade more). If trade openness affects the
political consensus in favor of financial development, in part by generating larger cross-border
capital mobility in the country, we should expect the correlation between trade openness and
financial development to be stronger in periods of high international capital mobility than in
periods of low mobility. International capital mobility remained high only up to 1930s.
Following the Depression and Bretton Woods, capital movement remained severely curtailed till
the 1980s. The United States opened up in the mid1970s, United Kingdom and Japan in 1980,

34
while the countries of Continental Europe only in the late 1980s. Thus the changes in capital
mobility over time give us the data to test our second hypothesis.
To begin with, we estimate our basic regression (specification (ii) in Table 7a) year by
year. Unfortunately, we do not have Bairoch’s measure of per capita industrialization over the
entire period. Thus, the first seven cross sections (for the years 1913, 1929, 1938, 1950, 1960,
1970, and 1980) use Bairoch’s index as a proxy for demand, while the last two use the logarithm
of per capita GDP adjusted for difference in the purchasing power parity (as computed by the
World Bank). Consequently, the magnitude of the coefficient before 1980 and after 1981 are not
directly comparable.
As Table 9 shows, the interaction between openness and demand for finance has a
reliable and statistically significant positive correlation with financial development both at the
beginning and at the end of the sample, which corresponds to the periods of high international
capital mobility. During the period of low capital mobility the effect is statistically insignificant
or even negative, when we measure financial development by the ratio of equity market
capitalization to GDP.
To formally test whether the effect of openness is smaller during periods of low capital
mobility, we pool the different cross sections, and we separately estimate the slope of the
interaction between per capita industrialization and openness in years with low capital mobility.
The results for the panel 1913-1980 are reported in Table 10. The specification is the same as the
basic regression in Table 7, with the inclusion of an additional slope term for the years of low
capital mobility.
In the first two columns, we report estimates obtained by OLS with country specific fixed
effects and calendar year dummies. Openness and openness interacted with the industrialization
index have a positive correlation with financial development in the period of high mobility, and
the correlation goes to zero during the period of low capital mobility (1938-1980). Only the
difference in the interaction is statistically significant at conventional levels. This weaker

35
statistical significance is not surprising in light of the fact all our variables are measured with
error. In such cases, fixed effect estimators tend to reduce the signal to noise ratio (Griliches and
Hausman, 1986).
As an alternative, we re-estimate the basic regression using instrumental variables
(columns (iii) and (iv)). As an instrument for openness, we use the constructed trade shares
computed by Frankel and Romer (1999). While this instrument will be weaker as we go back in
time because it is constructed based on country borders in the 1990s, all we care about is that it be
correlated with trade and not with financial development.7 When we use this instrument, the
estimated coefficients increase slightly in magnitude and all become statistically significant. We
obtain similar results (not reported) when we use the ratio of number of domestic firms listed to
million inhabitants as a measure of financial development.
A final task is to show that the strong positive correlation between trade and domestic
financial development reasserts itself as capital mobility increases in the last decades of the
twentieth century. The regression estimates are in Table 11. The first two columns report the
fixed effect estimates, where we include country indicators. The effect of trade openness has a
positive and statistically significant effect on financial development (column (i)) in 1997. This
effect is halved in 1981, when capital mobility is lower. The same is true for the interaction
between openness and the logarithm of per capita GDP (column (ii)). A one standard deviation
increase in the interaction of logarithm of per capita GDP and openness increases the ratio of
market capitalization to GDP by 14%, which is equal to 35% of its standard deviation. The
coefficient estimate for the period of lower capital mobility is about 32% smaller in magnitude
but not statistically significantly smaller.
In columns (iii) and (iv) we report the instrumental variable estimates, where openness is
instrumented with the constructed trade share in Frankel and Romer (1999). Both openness by
itself and the interaction between log per capita GDP and openness have a positive and
statistically significant effect on financial development during the period of high capital mobility.

36
The coefficient of the interaction term in periods of low capital mobility is now significantly
smaller both statistically and in magnitude (55% smaller, difference significant at the 5 percent
level). Overall, these results suggest that the positive correlation between openness and financial
development re-emerged, and became stronger, in the last two decades of the twentieth century,
in concert with the increased cross-border capital mobility. This conclusion is also supported by
the results obtained using the number of domestic firms listed as a measure of financial
development (not reported).
3.5 Summary of Results
Overall, the results suggest openness is reliably positively correlated with financial
development. This effect is distinct from that of legal origin (including an indicator for common
law in the basic specification does not change the coefficient estimates qualitatively). Our theory
suggests why openness matters: It reduces the incentives of incumbents to resist financial
development. We now argue that this finding can explain the reversal of financial development in
middle of the 20th century. Equally interesting, our theory can explain why legal origin seems to
matter for financial development in recent years. This is the subject of the next section.
4. An Explanation for the Reversal
It follows from our analysis thus far that the reversal in financial markets we noted in
section 1 is because countries closed down their borders to trade and capital flows in the 1930s
and 1940s, in response to a popular movement against openness. We do not have the space to
explore the reasons for this popular movement (see Eichengreen (1996), Rajan and Zingales
(2000) for details). It suffices to say that once incumbents were free from the constraints imposed
by open borders, they rode on the coattails of this movement to reverse financial development.
Banking systems became much more concentrated, and came under the control of governments
both directly and indirectly. Access to financial markets became more restricted. Capital controls
became orthodox international policy under the post-war Bretton Woods agreement so the
financial repression that began in the 1930s carried on after World War II. It is only with the

37
breakdown of the Bretton Woods agreement and the resumption of cross border capital flows in
the 1980s and 1990s that financial markets have revived the world over.
4.1. A synthesis of the private interest and structural theories.
There are, however, still some puzzles. Financial markets in countries with a civil law
system were not less developed than those in countries with common law in 1913 and in 1929.
Our data suggest that the ascendancy of markets in common law countries is a post World War II
phenomenon, though the differences have narrowed again more recently. Why did markets in
civil law countries fall more? A synthesis of our private interest theory with structural theories
may offer an explanation.
Since the seminal findings of La Porta et al (1997, 1998), there has been some debate as
to whether the legal origin of a country appears to matter so much for financial markets because it
reflects the inherent superiority of common law over civil law for financial transactions and
investor protection or whether it matters because it reflects something about a country’s culture,
religion, or politics (see, for example, Acemogulu, Johnson, and Robinson(2000), Beck et al
(2000), Berglof and Von Thadden (1999), La Porta et al. (1999), Rajan and Zingales (1999), and
Stulz and Williamson (2001)).
Rajan and Zingales (1999) argue that many complex legal constructs that first emerged in
common law, such as limited liability, were readily imitated by civil law countries. In fact, they
argue, when the government has a will, civil law countries may have a greater ability to translate
governmental policy into law because laws emanate from the center rather than evolving through
judicial decisions. Whether the tighter control the center maintains over the judiciary in civil law
countries is because the civil law system evolved in France in the 12th and 13th centuries when the
king was weak (Glaeser and Shleifer (2001)) or whether it simply reflects a general propensity for
centralization of power in these countries is not relevant to the argument we will make. What is
critical, however, is that private interests have a greater chance of seeing their agenda enacted in a
civil law country.

38
One reason is simply that if the governance system is more centralized, it is easier for
small private interests to capture it. If, in addition, the legal system is important for validating and
enforcing new policy, the civil law system is again easier to capture. The focus of influence
activity in a civil law country only has to be the legislator. By contrast, the judiciary in a
Common Law country can restrain a new political climate, and because it is dispersed and subject
to local influences (see Glaeser and Shleifer (2001)), is less easy to capture.
A second reason is that common law evolves at the periphery, and can innovate around
legislative or administrative roadblocks set up by the center. In England, for instance, after the
Bubble Act placed constraints on the incorporation of limited liability companies in 1720
(primarily to bolster the position of companies that were already incorporated), common law
courts continuously evolved their own interpretation of which companies did not contravene the
spirit of that law. It was precisely to overcome this ability of the judiciary to defy the will of the
center that Napoleon introduced the Civil Code as a way to prevail over judges still loyal to the
Ancien Regime (see Hayek (1960) or Glaeser and Shleifer (2001) and the references therein).
In summary, in a civil law country, it is easier for a small group representing private
interests, such as large incumbent industrialists and financiers to influence the implementation of
friendly policies. This need not be all bad. When these private interests are aligned with the
national interests, good policy can also be implemented quickly. Empirically, this would suggest
that civil law countries went further in repressing financial markets when borders closed down
(suggesting an explanation for the La Porta et al. findings in the mid 1990s that financial markets
were then more developed in common law countries), but have also begun developing them again
as borders have opened up again in recent years (explaining the convergence seen in the most
recent data (see Coffee (2000)). This would reconcile our findings with the findings of La Porta et
al (1997, 1998) and suggest a synthesis of the interest group explanation with the structural (albeit
political) explanation.
4.2. A Test.

39
Our methodology offers a way to test this hypothesis. As cross-border financial flows
ebbed in the 1930s, trade openness should have become much less potent a force for financial
market development in civil law countries than in common law countries. By contrast, as
financial flows resumed in the 1990s, incumbents in more open civil law countries should have
had a stronger incentive and ability to press for financial development, so trade openness should
become more potent a force for financial market development in civil law countries.
We test these conjectures in Table 12, by splitting the sample according to the type of
legal system prevailing and re-estimating the specifications used in Tables 10 and 11. The impact
of trade openness on our measure of financial development (coefficient of the interaction term)
drops by 90% in Civil Law countries versus 60% in Common Law countries (respectively 65%
vs. 48% if we use the IV estimates) when cross border capital flows are curtailed (Panel A).
These estimates suggest that a decline in the effect of openness can account for a great deal of the
changes in the importance of the equity market in Civil Law countries. Between 1913 and 1980
the actual ratio of equity market capitalization to GDP in France, for instance, dropped 88%, from
0.78 to 0.09. The predicted ratio dropped 106%, from 0.31 to –0.02.
In Panel B we repeat the analysis around the time capital movements are liberalized. As
predicted, civil law countries exhibit the largest increase in the impact of trade openness on
financial development: 160% increase in the coefficient vs. a 12% increase in Common Law
countries (108% vs –4 %if we use the IV estimates). Once again this greater sensitivity to
openness can explain the strong revival of financial markets in Civil Law countries. Between
1981 and 1997 the predicted ratio of equity market capitalization to GDP in France rose from
0.14 to 0.41, closely aligned with the actual ratio, which went from 0.08 to 0.54.8
This suggests that countries with Civil Law systems may have more exaggerated
reactions to changes in private interests, either because their political systems are intrinsically
more centralized and prone to capture, or because Civil Law tends to enhance centralization. This
may explain why following the Great Depression, civil law countries started to fall behind in the

40
degree of financial development, and why in the 1990s, following a generalized liberalization of
capital movement, the gap has started to narrow.
Our view that institutional differences between countries serve to modify the impact of
private interests offers a different view of convergence across countries than Coffee (2000). In his
view, financial development will take place through changes in practices when a constituency
emerges that demands it. Much later, the formal legal system will adapt to reflect these demands.
Thus he attributes the convergence to “Anglo-Saxon” norms of Corporate Governance practices
in Continental Europe to the privatization in the 1980s, which created a constituency of minority
shareholders. We differ primarily in that we attribute both a stronger role to private interests (not
just for, but also against, development) and also a role for structural factors.
Finally, it may help convince some readers if we bolster our large sample evidence with
some descriptive analysis. Let us briefly sketch events in one country, Japan, and then discuss
why, somewhat paradoxically, the United States enacted market friendly reforms during the
darkest days of the Depression.
4.3. The Case of Japan, a civil law country.
Japan, as our data suggest, was making rapid strides to developing a strong financial
sector before World War I. Until 1918, there were no restrictions on entry into banking, provided
minimum capital requirements were met. There were over two thousand banks in 1920. The five
large Zaibatsu (translated as "financial cliques") banks accounted for only 20.5 per cent of the
deposits before the war, and there were many small banks.9
As a result of increased competition in the post-World War I years and the Great Tokyo
Earthquake in 1923, which caused damage estimated at an incredible 38% of GDP, more and
more banks became troubled. This gave the government the excuse to enact regulations
promoting mergers in the name of stability. By 1945, there were only 65 banks, and the share of
Zaibatsu banks in total deposits had increased to 45.7 per cent.10

41
At the same time as the banking system was becoming more concentrated, the
government's control over it was increasing. This became especially pronounced as the
government sought to direct funds towards supplying the war against China in 1937. With the
Temporary Fund Adjustment Act in 1937 and the Corporate Profits Distribution and Fund
Raising Act in 1939, the government, through the Industrial Bank of Japan, assumed control of
financing. All security issuances and lending decisions above a certain amount had to be
approved by the government, and those that were not related to the war effort were typically not
approved. Further Acts simply strengthened the government's control and this culminated in the
designated lending system by which each munitions company was designated a major bank which
would take care of all its credit needs. By the end of the war, the banking system was not only
concentrated, but well and truly under the control of the government.
The accompanying demise of the arm's length financial markets was aided and abetted by
the banks. In 1929, 26 per cent of the liability side of large Japanese firm balance sheets consisted
of bonds while only 17 percent was bank debt. 11 As bond defaults increased as a result of the
earlier crisis and depression, a group of banks together with trust and insurance companies seized
on the poor economic conditions to agree in 1931 to make all subsequent bond issues secured in
principle. This immediately made it harder for their clients to issue public debt. With the
acquiescence of the Ministry of Finance, the agreement was formalized in 1933 through the
formation of a Bond Committee. The Committee determined which firms could issue bonds, on
what terms, and when. All bonds were required to be collateralized, and banks were to serve as
"trustees" for the collateral in exchange for a substantial fee. Giving banks the responsibility for
determining firms' right to access the public bond markets was like giving a fox who resided in a
chicken coop the right to determine which chickens could leave.12 The obvious outcome was that
a flourishing bond market was killed off. By 1936, bonds were down to 14 percent while bank
debt was up to 24 percent of the liability side. By 1943, 47 percent of liabilities were bank debt
while only 6 percent were bonds.

42
Japan illustrates yet another point. In the absence of outside competition, entrenched
interests can survive a long time. For example, despite their best efforts to break up the bank firm
combines established during the period of militarization, the post-war American occupying forces
could not prevent them re-emerging as the Keiretsu or main bank system (see Hoshi and Kashyap
(1998)). Similarly, the Bond Committee, set up ostensibly to improve the quality of bond
issuance during the Depression, survived until the 1980s. Even as Japanese industrial firms
invaded the rest of the world in the 1970s, their bond markets remained miniscule, and Hitachi,
an AA credit, was denied the ability to issue unsecured bonds. It was only in the early 1980s, as
Japanese firms decided to borrow abroad in the Euromarkets rather than depend on their
antiquated financial system that Japanese banks had to loosen their stranglehold. The powers of
the bond committee were eventually curtailed, not by a far-seeing government, but the forces of
outside competition.13
4.4. Why Not the United States?
As with any large sample study, there are exceptions. In the midst of the Depression, the
United States undertook a variety of market friendly actions including passing legislation
requiring greater disclosure in financial markets, setting up the Securities and Exchange
Commission, and passing the Glass Steagall Act, which brought more competition among
financial institutions by breaking up the universal banks. Was the United States an exception to
the trend at this time?
First, it is possible to overstate the extent to which proposed legislation was market
friendly. The National Recovery Administration, which was set up under the New Deal, sought to
fix prices in industry in order to eliminate “ruinous” competition, while Regulation Q attempted
to do the same thing in the banking sector. The U.S. government defaulted on the Gold Clause to
the detriment of creditors, and the sanctity of contracts (see Kroszner, (1999)). That markets and
competition were not seriously affected in the long run was not for the want of effort by the New
Deal politicians. But legislative zeal in the United States was also tempered by checks imposed

43
by the judiciary, a characteristic of common law countries (though it was the independent
judiciary rather than common law that was the source of the check). Roosevelt’s primary method
of intervention, the National Recovery Administration, was declared unconstitutional by the
Supreme Court.14 When the Supreme Court eventually became more pliant after threats to pack it,
Congress became more nervous about growing executive powers, and growing threats to
property, and became the main obstacle to proposed New Deal legislation.15
Checks and balances are not sufficient to explain the pro-market legislation. Of course,
the legislation was not as pro-market as it is often made out to be. Mahoney (2000) argues that
the ostensibly pro-market and pro-competitive Securities Act of 1933 and the Glass Steagall Act,
were really protection in disguise for established investment bankers. Various aspects of the
Securities Act reduced price competition among investment bankers, while the Glass Steagall Act
forced commercial banks out of the underwriting business. Mahoney provides evidence that the
Securities Act increased concentration in the underwriting business.
Nevertheless, even if private interests were at work, the United States did not go the way
of Japan. In part, the private interests were more fragmented. Investment banks did not see eye to
eye with commercial banks, nor did large banks form common cause with small banks. The
variety of conflicting private interests, more than any other factor, may have been the reason why
outcomes in the United States were not more anti-competitive. There was no way markets could
be closed down without hurting some powerful faction in the financial sector.
So this then leaves us with the final question – why were there so many different
groups within the financial sector? Roe (1994) suggests an answer: There has always been an
undercurrent of opposition in the United States to anyone getting overly powerful in the financial
sector. Whether it be the setting up of the Federal Reserve to undercut the power of JP Morgan,
the Glass Steagall Act to curtail the power of large universal banks, or the refusal of the Federal
Reserve to act to save Drexel Burnham, the United States has managed to cut powerful financiers
down to size. Perhaps it was its ability to ensure even in normal times that no small group of

44
incumbents ever became really powerful that enabled the United States to pass through crisis
relatively unscathed.
Before concluding this section, we must note two other explanations for the reversals.
Roe (1999) suggests that corporations in Continental Europe became more closely held because
of the potential for higher agency costs there as a result of pro-labor legislation passed in the
1920s and 1930s. This diminished the size of public markets. While we do believe that the
shrinkage of public equity markets and the passage of pro-labor legislation were coincident in
some countries, his theory does not account for the greater government intervention and
cartelization witnessed in many countries, or for the demise of corporate bond markets in some.
Pagano and Volpin (2000) develop a model in which entrepreneurs, who have already raised
finance, want low investor protection (so as to indulge in private benefits), and get the support of
workers by promising them high employment protection. This model of incumbent interests
(entrepreneurs who already have finance) is similar to ours (and suggests a different causality for
the correlation Roe finds – that incumbent industrialists bribed workers with pro-worker
legislation to go along with anti-finance legislation) but our emphasis on openness as a modifying
influence is different, and it helps us explain both pro-market and anti-market legislation.
5. Conclusion.
We see four contributions of this work. The first is to document the reversal in financial
markets, a finding inconsistent with pure structural theories of financial market development. The
second is to test whether interest group politics matters for financial development across countries
by focusing on the broad economic incentives of the interest groups rather than their
nomenclature or the political structure of the country. While others have detailed how interest
group politics matters within countries for financial development, we have not seen a large
sample test of the kind we attempt. The third is to add a new fact – that trade openness is
correlated with financial market development, especially when cross-border capital flows are
free, and that changes in openness are correlated with changes in the size of financial markets.

45
The last, and perhaps most important, contribution is to provide a synthesis between structural
and interest group theories, and to provide some support for it.
There are many implications of this work, but given that it is already long, we cannot do
more than state the most important very briefly. First, legal or cultural impediments to financial
development may not be as serious as one might conclude from the recent literature. Second, as
suggested by Olson (1982), openness (though not just to trade as he emphasizes but also to
financial flows) may be very important for financial development. Unilateral capital controls
imposed by a country can have long term consequences that far outweigh issues like credibility to
foreign investors that have been the focus of recent debates. The cost to Malaysia of the recent
controls may not be so much that foreign investors are wary of a repeat, but that domestic
financial institutions were merged in a non-transparent way during the period of controls – a way
that appears to favor the current political establishment (see also Johnson and Mitton (2001)).
Finally, while openness has virtues, it also has costs (see, for example, Rodrik (1997, 1998)).
How to preserve its virtues while spreading and softening its costs deserves far more attention.
46
References
Acemoglu, Daron, Simon Johnson, James A. Robinson, 2000, “The Colonial Origins ofComparative Development: An Empirical Investigation, NBER Working Paper #7771
Aoki, M. H. Patrick and P. Sheard, 1994, "Introductory Overview", in The Japanese Main BankSystem, M. Aoki and H. Patrick, New York: Oxford University Press.
Auerbach, Nancy, 2001, States, Banks, and Markets, Westview Press, Colorado.
Bairoch, 1982, "International Industrialization Levels from 1750 to 1980", Journal of EuropeanEconomic History, vol 11, 2, 269-334.
Bairoch ,1989, "European Trade Policy, 1815-1914", in The Cambridge Economic History ofEurope, Vol VIII, Peter Mathias and Sydney Pollard ed.
Bebchuk, L. and M. Roe, 1999, A Theory of Path Dependence in Corporate Ownershipand Governance Stanford Law Review, Vol. 52, pp. 127-170.
Beck, Thorsten, Asli Demirguc-Kunt, Ross Levine, 1999, “A New Database on FinancialDevelopment and Structure”, World Bank Working Paper.
Beck, Thorsten, Asli Demirguc-Kunt, Ross Levine, 2001, “Law, Politics, and Finance”World Bank Working Paper.
Bencivenga, Valerie and Bruce Smith, 1991, ``Financial Intermediation and endogenousgrowth", Review of Economic Studies, 58(2), pp 195-209.
Benston, George J., The Separation of Commercial and Investment Banking, Oxford: OxfordUniversity Press, 1990.
Berglof, Erik and Ernst Ludwig Von Thadden, “The Changing Corporate Governance Paradigm:Implications for Transition and Developing Countries”, Working Paper, June 1999.
Bordo, Michael D., Barry Eichengreen, Douglas A. Irwin, 1999, “Is Globalization Today ReallyDifferent than Globalization a Hunderd Years Ago?” NBER Working Paper No. W7195.
Chandler (1990), Scale and Scope, Bellknap Press, Cambridge, MA.
Choe, H., R. Masulis and V. Nanda, 1993, Common stock offerings across the businesscycle: Theory and evidence, Journal of Empirical Finance 1, 3-31.
Coffee, John, 2000, Convergence and its Critics: What are the Preconditions to theSeparation of Ownership and Control, mimeo, Columbia University.
Demirguc-Kunt, A. and V. Maksimovic, 1998, "Law, Finance, and Firm Growth",Journal of Finance, 53, 2107-2138.
Djankov, Simeon, Rafael La Porta, Florencio Lopez deSilanes, Andrei Shleifer, “Regulation ofEntry”, NBER Working Paper No. W7892.

47
Eichengreen, B., 1996, Globalizing Capital: A History of the International Monetary System,Princeton University Press, Princeton, New Jersey.
Englebourg, Saul and Leonard Bushkoff, 1996, The man who found the money : John StewartKennedy and the financing of the western railroads , East Lansing : Michigan StateUniversity Press.
Fohlin, C., 2000, "Economic, Political and Legal factors in Financial System Development:International Patterns in Historical Perspective
Frankel, Jeffrey A. and David Romer, 1999, “Does Trade Cause Growth?”, American EconomicReview 89: 379-399.
Glaeser, Edward L., Johnson, S. and Andrei Shleifer, 2001, “Coase vs. the Coasians”, NBER
Working Paper.
Glaeser, Edward L. and Andrei Shleifer, 2001, “Legal Origins: NBER Working Paper #8272.
Goldsmith, R., 1969, Financial Structure and Development, Yale University Press, New Haven.
Gourevitch, Peter, 1986, Politics in Hard Times: Comparative Responses to InternationalEconomic Crises, Cornell University Press, Ithaca.
Green, E., 1992, "The influence of the City over British Economic Policy: 1880-1960", inFinance and financiers in European history, 1880-1960, Youssef Cassis ed., CambridgeUniversity Press, New York.
Griliches, Z. and J. Hausman, 1986, “Errors in Variables in Panel Data”, Journal of Econometrics31: 93-118
Greenwood, Jeremy and Boyan Jovanovic, 1990,``Financial Development, Growth, and theDistribution of Income",Journal of Political Economy, 98, pp 1076-1107.
Guiso, L, P. Sapienza, and L. Zingales, 2001, “The Role of Social Capital in FinancialDevelopment”, NBER WP.
Gömmel, Rainer and Pohl, Hans, 1992, Deutsche Börsengeschichte, Knapp, Frankfurt am Main.
Gunzert, Rudolf, Bernhard Benning, and Edmund Veesenmayer, 1929, Effektenbörse undVolkswirtschaft, Effektenmarkt und Konjunktur, der "schwarze Freitag", Fischer, Jena.
Haber, S., 1989, Industry and Underdevelopment: The Industrialization of Mexico StanfordUniversity Press, Stanford California.
Hammond, Bray,1957, Banks and Politics in America from the Revolution to the Civil War,Princeton University Press, Princeton, NJ.
Hayek, Friedrich A., 1960, The constitution of liberty, Chicago : University of Chicago Press.
48
Helleiner, E.,1994, "From Bretton Woods to Global Finance: A World Turned Upside Down" inR. Stubbs and G. Underhill Ed., Political Economy and the Changing Global Order,Toronto.
Hellwig, Martin, 2000, “On the Economics and Politics of Corporate Finance and CorporateControl”, in Xavier Vives ed, Corporate governance: theoretical and empiricalperspectives. New York: Cambridge University Press.
Holmen, and Peter Hogfeldt, 2000, “A Law and Finance Analysis of Initial Public Offerings”,working paper, University of Chicago.
Hoshi, T. and A. Kashyap (1998), The Genesis of the Japanese Financial System, Chapter 2 inforthcoming book.
Jayaratne, Jith and Philip E. Strahan, 1996, ``The Finance-Growth Nexus: Evidence from BankBranch Deregulation," Quarterly Journal of Economics, CXI, 639-671.
Jensen, M., 1991, "Corporate Control and the Politics of Finance", Continental Bank Journal ofApplied Corporate Finance
Johnson, Simon, John McMillan, and Christopher Woodruff, 2000, “Courts and RelationalContracts”, mimeo, M.I.T.
Johnson, Simon and Todd Mitton, 20001, “Who Gains from Capital Controls? Evidence fromMalaysia”, mimeo, M.I.T.
Katzenstein, Peter, Small states in world markets : industrial policy in Europe,Ithaca, N.Y. : Cornell University Press, 1985.
Kennedy, David,1999, Freedom from fear: the American people in Depression and War, 1929-1945, The Oxford History of the United States, Oxford University Press, New York.
Kennedy, William, 1989, Industrial Structure, Capital Markets, and the Origins of BritishEconomic Decline, Cambridge University Press, Cambridge.
King, R. and R. Levine, 1993, ``Finance and Growth: Schumpeter Might Be Right", TheQuarterly Journal of Economics, Vol. CVIII, No. 3, 681-737.
Kroszner, R., 1999, "Is it Better to Forgive Than to Receive? Evidence from the Abrogation ofGold Index Clauses in Long-Term Debt During the Great Depression," University ofChicago Working Paper.
Kroszner, R. and R.Rajan, "Is the Glass Steagall Act Justified? A study of the US experience withUniversal Banking before 1933", American Economic Review 84, 810-832.
Kroszner, R. and P. Strahan, “What drives deregulation? The Economics and Politics of theRelaxation of Bank Branching Restrictions”, Quarterly Journal of Economics, N0v 1999,1437-1467.
Kukies, Jorg, 2000, "The Effect of Introducing a New stock exchange on the IPO Process",mimeo, University of Chicago.

49
La Porta, Florencio, Lopez de Silanes, Andrei Shleifer, and Robert Vishny, 1997, "The LegalDeterminants of External Finance," Journal of Finance, 52.
La Porta, R., Lopez-de-Silanes, F., Shleifer, A. and R. Vishny, 1998, ``Law and Finance," Journalof Political Economy, 106, 1113-1155.
La Porta, R., Lopez-de-Silanes, F., Shleifer, A. and R. Vishny, 1999, ``The Quality ofGovernment," Journal of Law, Economics, and Organization, vol 15, 222-279.
La Porta, R., Lopez-de-Silanes, F., Shleifer, A. and R. Vishny, 2000, ``Investor Protection:Origins, Consequences, and Reform”, Journal of Financial Economics, 58:3-27.
Laeven, Luc, 2000, “Financial Liberalization and Financing Constraints: Evidence from PanelData on Emerging Economies”, mimeo, World Bank.
Lamoureaux, N., 1994, Insider Lending, National Bureau of Economic Research.
Levine, R. And S. Zervos, 1998, "Stock Markets, Banks, and Economic Growth", AmericanEconomic Review, vol 88, no 3, 537-558.
Loriaux, Michael, 1997, Capital ungoverned : liberalizing finance in interventioniststates, Ithaca : Cornell University Press
Mahoney, Paul, 2001, The Political Economy of the Securities Act of 1933, Journal of LegalStudies, Vol. 30, No. 1, January 2001
Maier, Charles, 1987, In Search of Stability, Cambridge University Press, Cambridge, England.
McNeill, William, 1982, The Pursuit of Power: Technology, Armed Force and Society since AD1000, University of Chicago Press, Chicago.
Morck, R., David A. Stangeland, and Bernard Yeung, 2000, “Inherited wealth, corporate control,and economic growth: the Canadian disease?” in Randall Morck ed, Concentratedcorporate ownership Chicago: University of Chicago Press.
North, D. and B. Weingast,1989, "The Constitution of Commitment: The Evolution ofInstitutions Governing Public Choice in Seventeenth Century England", Journal ofEconomic History, vol 49, 4, 803-831.
Olson, M., 1965 , The Logic of Collective Action, Harvard University Press, Cambridge, MA.
Olson, M., 1982, The Rise and the Decline of Nations, Yale University Press, New Haven, CT.
O’Rourke, Kevin and Jeffrey Williamson, 1999, Globalization and history: The Evolution of aNineteenth Century Atlantic Economy, M.I.T. Press, Cambridge, MA.
Pagano, Marco and Paolo Volpin, 2000, “The Political Economy of Corporate Governance,mimeo, Harvard University.
Perez , Sofia A.,1997, “From Cheap Credit to the EC: The Politics of Financial Reform in Spain”,

50
in Michael Loriaux ed., Capital ungoverned : liberalizing finance in interventioniststates, Ithaca : Cornell University Press.
Petersen, M. and R. Rajan, 1995, "The Effect of Credit Market Competition on LendingRelationships", Quarterly Journal of Economics, vol 110, pp 407-443.
Rajan, R. and L. Zingales, 1998a, "Financial Dependence and Growth". The American EconomicReview, (1998), 88: 559-586.
Rajan, R. and L. Zingales, 1998b, "Which Capitalism? Lessons From the East Asia Crisis,”Journal of Applied Corporate Finance.
Rajan, R. and L. Zingales, 1999, “The Politics of Financial Development”, mimeo, University ofChicago.
Rajan, R. and L. Zingales, 2000, “The Great Reversals: The Politics of FinancialDevelopment in the 20th Century”, University of Chicago Working Paper.
Robinson, Joan, 1952, "The Generalization of the General Theory", in The Rate of Interest andOther Essays, London, Macmillan, pp67-142.
Rodrik, D. , 1997, Has Globalization Gone Too Far?, Institute for International Economics,Washington, DC.
Rodrik, D., 1998, “Why Do More Open Economies Have Bigger Governments? Journal ofPolitical Economy, October.
Roe, M., 1994, Strong Managers and Weak Owners: The Political Roots of American CorporateFinance, Princeton University Press, Princeton, N.J.
Roe, M., 1998, “Backlash”, Columbia Law Review.
Roe, M., 1999, "Political Preconditions to Separating Ownership from Corporate Control",mimeo, Columbia Law School.
Rogowski, R.,1989, Commerce and Coalitions: How Trade Affects Domestic PoliticalArrangements, Princeton University Press, Princeton, N.J.
Rosenbluth, Frances McCall, 1989, Financial politics in contemporary Japan, Ithaca : CornellUniversity Press.
Seligman, Joel, 1995, The Transformation of Wall Street, Northeastern University Press, Boston.
Shleifer, Andrei and Daniel Treisman, 2000, Without a map : political tactics andeconomic reform in Russia, MIT Press, Cambridge, Ma.
Stigler, G., 1971, “The Theory of Economic Regulation,” Bell Journal of Economics andManagement Science, 2: 3-21.
Stulz, Rene M. and Rohan Williamson, 2001, “Culture, Openness, and Finance”, Ohio UniversityWorking Paper.
51
Sylla, Richard, and George Smith, 1995, “Information and Capital Market Regulation in Anglo-American Finance”, in Anglo-American Financial Institutions, Bordo, Michael andRichard Sylla ed., Irwin Publishers, New York.
Taeuber, Rudolf, 1911, Die Börsen der Welt, Verlag, Berlin.
Teranishi, Juro, "Loan Syndication in War Time Japan and the Origins of the Main BankSystem", in The Japanese Main Bank System, M. Aoki and H. Patrick, ed. ClarendonPress, Oxford.
Verdier, Daniel, 1999, "The Origins of Universal Banking in the 19th Century", mimeo, EuropeanUniversity Institute.
Weber, Klaus and Davis Gerald, 2000, “The Global Spread of Stock Exchanges”, mimeo,University of Michigan
Wei, Shang-Jin, 2000, “Natural Openness and Good Government” NBER Working Paper # 7765

52
Table 1
Evolution of the Different Indicators of Financial Development
Whole sample indicates an average across all the countries we have data for. Constantsample indicates an average across countries for which we have data every year. Depositsto GDP is the ratio of commercial and savings bank deposits to GDP. Stock market Capto GDP is the ratio of the aggregate market value of equity of domestic companiesdivided by GDP. Number of companies to population is the ratio of number of domesticcompanies whose equity is publicly traded in a domestic stock exchange to the country’spopulation in millions. Equity issues to GFCF is the ratio of funds raised through publicequity offerings (both initial public offerings and seasoned equity issues) by domesticcompanies to gross fixed capital formation. N is the number of observations. Sources arein the Data Appendix, which is available on request from the authors.
Deposits to GDP Stock Market Cap toGDP
# companies to pop. Equity Issues to GFCF
Constantsample
Constantsample
Constantsample
Constantsample
Year
WholeSample
N
N=20
WholeSample
N
N=10
WholeSample
N
N=10
WholeSample
N
N=71913 0.38 22 0.40 0.57 22 0.40 28.68 22 24.00 0.12 12 0.131929 0.49 21 0.51 0.57 11 0.49 33.80 14 27.75 0.35 15 0.341938 0.45 21 0.46 0.64 12 0.64 30.78 13 28.55 0.13 12 0.101950 0.33 22 0.34 0.31 14 0.28 38.63 16 23.80 0.06 11 0.031960 0.31 22 0.33 0.48 18 0.45 31.85 19 22.38 0.07 16 0.051970 0.31 22 0.33 0.51 19 0.45 23.66 19 21.22 0.06 16 0.021980 0.34 22 0.35 0.26 22 0.25 26.70 21 23.71 0.03 18 0.031990 0.41 21 0.40 0.57 21 0.51 22.18 22 23.21 0.05 20 0.051999 0.46 21 0.45 1.02 23 1.08 26.30 22 24.46 0.13 20 0.18

53
Table 2
Evolution of the ratio of Deposits to GDP
Deposits to GDP is the ratio of commercial and savings deposits divided by GDP. Until1990 the source is Mitchell (1995). We extrapolate the 1999 data from the 1994 data inMitchell using the rate of growth of deposits as reported in International FinancialStatistics published by the International Monetary Fund.
YearCountry 1913 1929 1938 1950 1960 1970 1980 1990 1999
Argentina 0.29 0.36 0.36 0.30 0.22 0.19 0.28 0.07 0.24Australia 0.37 0.45 0.45 0.69 0.43 0.38 0.29 0.42 0.49Austria 1.12 0.37 0.33 0.21 0.28 0.31 0.62 0.73 0.70Belgium 0.68 0.48 0.69 0.44 0.35 0.40 0.39 0.38 0.85Brazil 0.12 0.16 0.21 0.20 0.15 0.12 0.17 . .Canada 0.22 0.13 0.16 0.17 0.13 0.37 0.47 0.49 0.61Chile 0.16 0.15 0.09 0.10 0.06 0.07 0.07 0.12 0.19Cuba . . . . . . . . .Denmark 0.76 0.46 0.39 0.32 0.27 0.25 0.28 0.55 0.54Egypt . . . 0.17 0.17 0.14 0.31 0.67 0.51France 0.42 0.44 0.36 0.24 0.30 0.33 0.45 0.42 0.47Germany 0.53 0.27 0.25 0.15 0.23 0.29 0.30 0.32 0.35India 0.04 0.09 0.12 0.08 0.08 0.09 0.08 0.09 0.09Italy 0.23 0.21 0.31 0.23 0.81 0.54 0.59 0.40 0.28Japan 0.13 0.22 0.52 0.14 0.21 0.33 0.48 0.51 0.53Netherlands 0.22 0.32 0.52 0.28 0.28 0.26 0.25 0.73 0.69Norway 0.65 0.89 0.56 0.52 0.43 0.49 0.30 0.50 0.49Russia 0.21 . . . . . . . .South Africa 0.09 0.09 0.16 0.18 0.18 0.16 0.12 0.16 0.21Spain 0.07 0.24 0.24 0.33 0.37 0.53 0.44 0.66 0.71Sweden 0.69 0.69 0.73 0.59 0.54 0.50 0.48 0.40 0.39Switzerland 0.93 1.08 1.13 0.79 0.78 0.69 0.69 0.54 0.66UK 0.10 2.88 1.34 0.67 0.32 0.22 0.14 0.33 0.39US 0.33 0.33 0.44 0.40 0.30 0.25 0.18 0.19 0.17

54
Table 3
Evolution of Stock Market Capitalization over GDP
Stock market capitalization to GDP is the ratio of the aggregate market value of equity ofdomestic companies to GDP. Sources are in the Data Appendix, which is available onrequest from the authors.
YearCountry 1913 1929 1938 1950 1960 1970 1980 1990 1999
Argentina 0.17 . . . 0.05 0.03 0.11 . 0.15Australia 0.39 0.50 0.91 0.75 0.94 0.76 0.38 0.37 1.13Austria 0.76 . . . . 0.09 0.03 0.17 0.17Belgium 0.99 1.31 . . 0.32 0.23 0.09 0.31 0.82Brazil 0.25 . . . . . 0.05 0.08 0.45Canada 0.74 . 1.00 0.57 1.59 1.75 0.46 1.22 1.22Chile 0.17 . . . 0.12 0.00 0.34 0.50 1.05Cuba 2.19 . . . . . . . .Denmark 0.36 0.17 0.25 0.10 0.14 0.17 0.09 0.67 0.67Egypt 1.09 . . . 0.16 . 0.01 0.06 0.29France 0.78 . 0.19 0.08 0.28 0.16 0.09 0.24 1.17Germany 0.44 0.35 0.18 0.15 0.35 0.16 0.09 0.20 0.67India 0.02 0.07 0.07 0.07 0.07 0.06 0.05 0.16 0.46Italy 0.17 0.23 0.26 0.07 0.42 0.14 0.07 0.13 0.68Japan 0.49 1.20 1.81 0.05 0.36 0.23 0.33 1.64 0.95Netherlands 0.56 . 0.74 0.25 0.67 0.42 0.19 0.50 2.03Norway 0.16 0.22 0.18 0.21 0.26 0.23 0.54 0.23 0.70Russia 0.18 . . . . . . . 0.11South Africa . . . 0.68 0.91 1.97 1.23 1.33 1.20Spain . . . . . . 0.17 0.41 0.69Sweden 0.47 0.41 0.30 0.18 0.24 0.14 0.11 0.39 1.77Switzerland 0.58 . . . . 0.50 0.44 1.93 3.23UK 1.09 1.03 1.92 0.86 1.15 1.99 0.38 0.81 2.25US 0.39 0.75 0.56 0.33 0.61 0.66 0.46 0.54 1.52

55
Table 4
Evolution of Fraction of Gross Fixed Capital Formation Raised via Equity
Amount of funds raised through public equity offerings (both initial public offerings andseasoned equity issues) by domestic companies divided by gross fixed capital formation.Sources are in the Data Appendix, which is available on request from the authors.
YearCountry 1913 1929 1938 1950 1960 1970 1980 1990 1999
Argentina . . . . 0.01 . 0.01 0.10 0.02Australia . 0.13 . 0.19 0.09 0.05 0.05 0.09 0.24Austria . 0.07 . . 0.04 0.07 0.00 0.07 0.03Belgium 0.23 0.85 0.03 . 0.09 0.08 0.03 0.01 0.06Brazil . . . 0.20 0.19 0.19 0.06 0.01 0.07Canada . 1.34 0.02 0.03 0.03 0.01 0.04 0.01 0.07Chile . . . . . . . . .Cuba . . . . . . . . .Denmark . 0.03 0.01 . . . 0.01 0.08 0.09Egypt . . . . . . . . 0.31France 0.14 0.26 0.03 0.02 0.04 0.04 0.06 0.02 0.09Germany 0.07 0.17 0.06 0.00 0.04 0.02 0.01 0.04 0.06India . . . . . 0.00 0.00 0.00 0.08Italy 0.07 0.26 0.03 0.02 0.08 0.02 0.04 0.04 0.12Japan 0.08 0.13 0.75 . 0.15 0.03 0.01 0.02 0.08Netherlands 0.38 0.61 0.45 0.02 0.02 0.00 0.01 0.10 0.67Norway . 0.05 0.01 . . . . 0.04 0.06Russia 0.17 . . . . . . . .South Africa . . . . . 0.33 0.08 0.10 0.14Spain 0.01 0.33 . 0.08 0.11 0.07 0.03 0.06 0.10Sweden 0.08 0.34 0.06 0.01 0.03 0.00 0.00 0.03 0.10Switzerland 0.03 . . . 0.02 . . 0.02 .UK 0.14 0.35 0.09 0.08 0.09 0.01 0.04 0.06 0.09US 0.04 0.38 0.01 0.04 0.02 0.07 0.04 0.04 0.12

56
Table 5
Evolution of Number of Listed Companies per Million PeopleThe number of listed companies per million people is the number of domestic companieswhose equity is publicly traded in a domestic stock exchange divided by the population inmillions. Sources are in the Data Appendix, which is available on request from theauthors.
YearCountry 1913 1929 1938 1950 1960 1970 1980 1990 1999
Argentina 15.29 . . . 26.78 15.58 9.85 5.54 3.63Australia 61.74 76.92 84.88 122.05 93.72 . 68.53 63.89 64.91Austria 38.72 42.62 30.06 16.29 13.34 12.05 8.74 12.57 12.02Belgium 108.7 . . 55.09 42.60 38.39 22.85 18.50 14.33Brazil 12.43 9.85 5.17 41.02 . 4.32 4.06 3.86 3.18Canada 14.65 . . 66.61 62.43 55.20 50.52 42.99 130.13Chile 20.62 . . . 44.52 38.72 23.78 16.32 19.03Cuba 12.69 . . . . . . . .Denmark 38.22 54.86 85.25 81.28 75.75 52.14 42.54 50.18 44.80Egypt 16.58 13.44 . . 10.58 1.76 . 11.01 13.71France 13.29 . 24.64 26.20 18.34 15.98 13.99 15.05 .Germany 27.96 19.73 10.91 13.22 11.33 9.07 7.46 6.53 12.74India 0.82 1.81 2.59 3.13 0.00 0.00 3.11 7.31 6.48Italy 6.32 6.40 3.11 2.70 2.79 2.46 2.36 3.82 4.54Japan 7.53 16.65 19.48 9.15 8.35 15.19 14.80 16.76 20.00Netherlands 65.87 95.48 . . 21.42 15.95 15.12 17.39 15.14Norway 33.51 41.50 45.98 37.98 37.10 37.90 44.53 44.80 49.62Russia 2.02 . . . . . . . 0.81South Africa . . . 69.05 60.93 51.39 42.48 20.75 15.86Spain . . . . . . 25.20 10.96 22.25Sweden 20.64 16.36 14.93 12.83 14.04 13.18 12.39 14.14 31.46Switzerland 61.53 67.80 55.46 52.47 51.74 58.72 78.03 49.61 34.01UK 47.06 . . . . . 47.22 29.63 31.11US 4.75 9.72 9.16 8.94 9.33 11.48 23.11 26.41 28.88
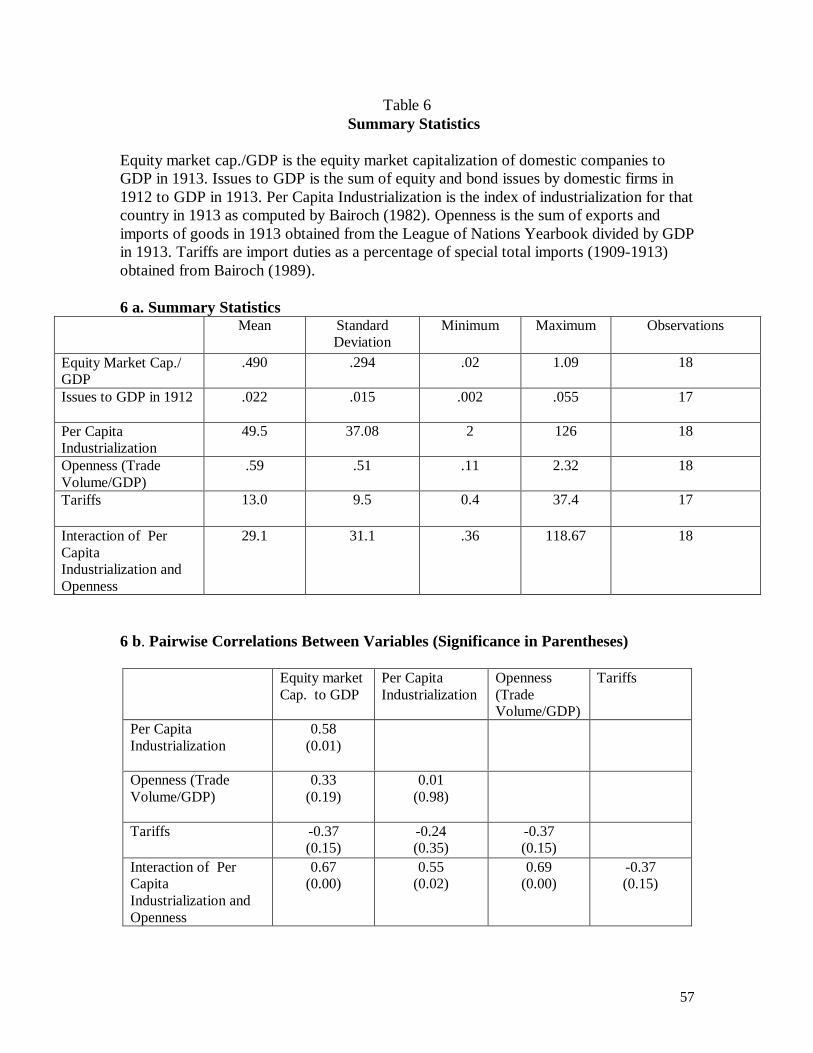
57
Table 6 Summary Statistics
Equity market cap./GDP is the equity market capitalization of domestic companies toGDP in 1913. Issues to GDP is the sum of equity and bond issues by domestic firms in1912 to GDP in 1913. Per Capita Industrialization is the index of industrialization for thatcountry in 1913 as computed by Bairoch (1982). Openness is the sum of exports andimports of goods in 1913 obtained from the League of Nations Yearbook divided by GDPin 1913. Tariffs are import duties as a percentage of special total imports (1909-1913)obtained from Bairoch (1989).
6 a. Summary StatisticsMean Standard
DeviationMinimum Maximum Observations
Equity Market Cap./GDP
.490 .294 .02 1.09 18
Issues to GDP in 1912 .022 .015 .002 .055 17
Per CapitaIndustrialization
49.5 37.08 2 126 18
Openness (TradeVolume/GDP)
.59 .51 .11 2.32 18
Tariffs 13.0 9.5 0.4 37.4 17
Interaction of PerCapitaIndustrialization andOpenness
29.1 31.1 .36 118.67 18
6 b. Pairwise Correlations Between Variables (Significance in Parentheses)
Equity marketCap. to GDP
Per CapitaIndustrialization
Openness(TradeVolume/GDP)
Tariffs
Per CapitaIndustrialization
0.58(0.01)
Openness (TradeVolume/GDP)
0.33(0.19)
0.01(0.98)
Tariffs -0.37(0.15)
-0.24(0.35)
-0.37(0.15)
Interaction of PerCapitaIndustrialization andOpenness
0.67(0.00)
0.55(0.02)
0.69(0.00)
-0.37(0.15)
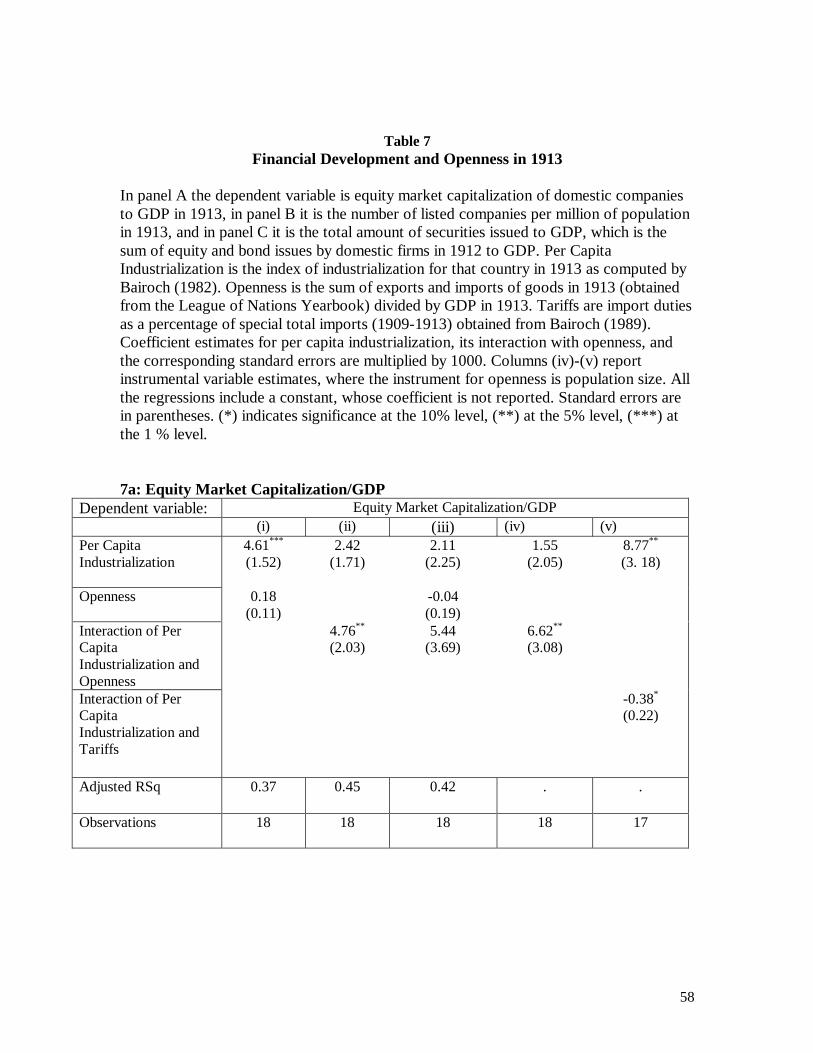
58
Table 7Financial Development and Openness in 1913
In panel A the dependent variable is equity market capitalization of domestic companiesto GDP in 1913, in panel B it is the number of listed companies per million of populationin 1913, and in panel C it is the total amount of securities issued to GDP, which is thesum of equity and bond issues by domestic firms in 1912 to GDP. Per CapitaIndustrialization is the index of industrialization for that country in 1913 as computed byBairoch (1982). Openness is the sum of exports and imports of goods in 1913 (obtainedfrom the League of Nations Yearbook) divided by GDP in 1913. Tariffs are import dutiesas a percentage of special total imports (1909-1913) obtained from Bairoch (1989).Coefficient estimates for per capita industrialization, its interaction with openness, andthe corresponding standard errors are multiplied by 1000. Columns (iv)-(v) reportinstrumental variable estimates, where the instrument for openness is population size. Allthe regressions include a constant, whose coefficient is not reported. Standard errors arein parentheses. (*) indicates significance at the 10% level, (**) at the 5% level, (***) atthe 1 % level.
7a: Equity Market Capitalization/GDPDependent variable: Equity Market Capitalization/GDP
(i) (ii) (iii) (iv) (v)Per CapitaIndustrialization
4.61***
(1.52)2.42
(1.71)2.11
(2.25)1.55
(2.05)8.77**
(3. 18)
Openness 0.18(0.11)
-0.04(0.19)
Interaction of PerCapitaIndustrialization andOpenness
4.76**
(2.03)5.44
(3.69)6.62**
(3.08)
Interaction of PerCapitaIndustrialization andTariffs
-0.38*
(0.22)
Adjusted RSq 0.37 0.45 0.42 . .
Observations 18 18 18 18 17

59
7b: Number of domestic companies listed/million populationDependent variable: N. companies/million population
(i) (ii) (iii) (iv) (v)Per CapitaIndustrialization
215.8(133.6)
-210.6(116.0)
-199.5(152.8)
-252.0*
(137.0)927.7**
(442.3)
Openness 38.8***
(9.6)-1.5
(12.7)Interaction of PerCapitaIndustrialization andOpenness
924.1***
(138.1) 899.8***
(250.8)1012.8***
(206.0)
Interaction of PerCapitaIndustrialization andTariffs
-60.9**
(29.9)
Adjusted RSq 0.50 0.74 0.72 . .
Observations 18 18 18 18 17
7c: Total securities issued/GDPDependent variable: Securities issued/GDP
(i) (ii) (iii) (iv) (v)Per CapitaIndustrialization
0.17(0.10)
0.02(0.10)
-0.09(0.12)
-0.02(0.11)
0.52**
(0.22)
Openness 0.1(0.01)
-0.01(0.01)
Interaction of PerCapitaIndustrialization andOpenness
0.33**
(0.11)0.56**
(0.19)0.41**
(0.17)
Interaction of PerCapitaIndustrialization andTariffs
-0.03*
(0.01)
Adjusted RSq 0.14 0.39 0.44 . .
Observations 17 17 17 17 17

60
Table 8Financial Development and Openness in 1997
In panel A the dependent variable is the ratio of equity market capitalization to grossdomestic product averaged over 1996-1998 from the World Development Indicators(World Bank). In panel B the dependent variable is the number of domestic companieslisted over million inhabitants in 1997 from the Emerging Market Factbook. In panel Cthe dependent variable is the sum of equity and long-term private debt issues to GDPaveraged over the 1990s from Beck et al. (1999). Log Per Capita Gross DomesticProduct is the logarithm of the per capita GDP in PPP dollars as reported in the WorldDevelopment Indicators. Openness is the sum of exports and imports of goods divided byGDP in 1980-82 and 1996-98 (source World Bank). In column (iv) the interactionbetween logarithm of the per capita GDP and openness is instrumented by the interactionbetween logarithm of the per capita GDP and constructed trade share in Frankel andRomer (1999). All the regressions include a constant, whose coefficient is not reported.The standard errors are in parentheses. (*) indicates significance at the 10% level, (**) atthe 5% level, (***) at the 1 % level.
8a: Equity Market Capitalization/GDPDependent variable: Equity Market Capitalization/GDP
(i) (ii) (iii) (iv)Log Per Capita GDP 0.264***
(0.044) 0.243 ***
(0.046)0.108
(0.084) 0.198***
(0.063)
Openness 0.214***
(0.082)-1.606*
(0.833)Interaction of Log PerCapita GDP andOpenness
0.025***
(0.009) 0.195**
(0.089) 0.048***
(0.024)
Adjusted RSq 0.34 0.34 0.36 .
Observations 96 96 96 82

61
8b: Number of domestic companies listed/million populationDependent variable: N. companies/million population
(i) (ii) (iii) (iv)Log Per Capita GDP 10.96***
(3.83)8.86**
(3.98)8.95
(7.38)4.26
(4.71)
Openness 25.10***
(7.11)1.04
(75.59)Interaction of Log PerCapita GDP andOpenness
2.69***
(0.76)2.58
(8.06)5.35***
(1.78)
Adjusted RSq 0.20 0.20 0.20 .
Observations 91 91 91 81
8c: Security issues/GDPDependent variable: Security Issues n/GDP
(i) (ii) (iii) (iv)Log Per Capita GDP 0.026***
(0.007) 0.025 ***
(0.007) 0.031**
(0.012)0.018*
(0.009)
Openness 0.022**
(0.011)0.082
(0.142)Interaction of Log PerCapita GDP andOpenness
0.002*
(0.001)-0.006(0.015)
0.006**
(0.003)
Adjusted RSq 0.39 0.38 0.37 .
Observations 34 34 34 34
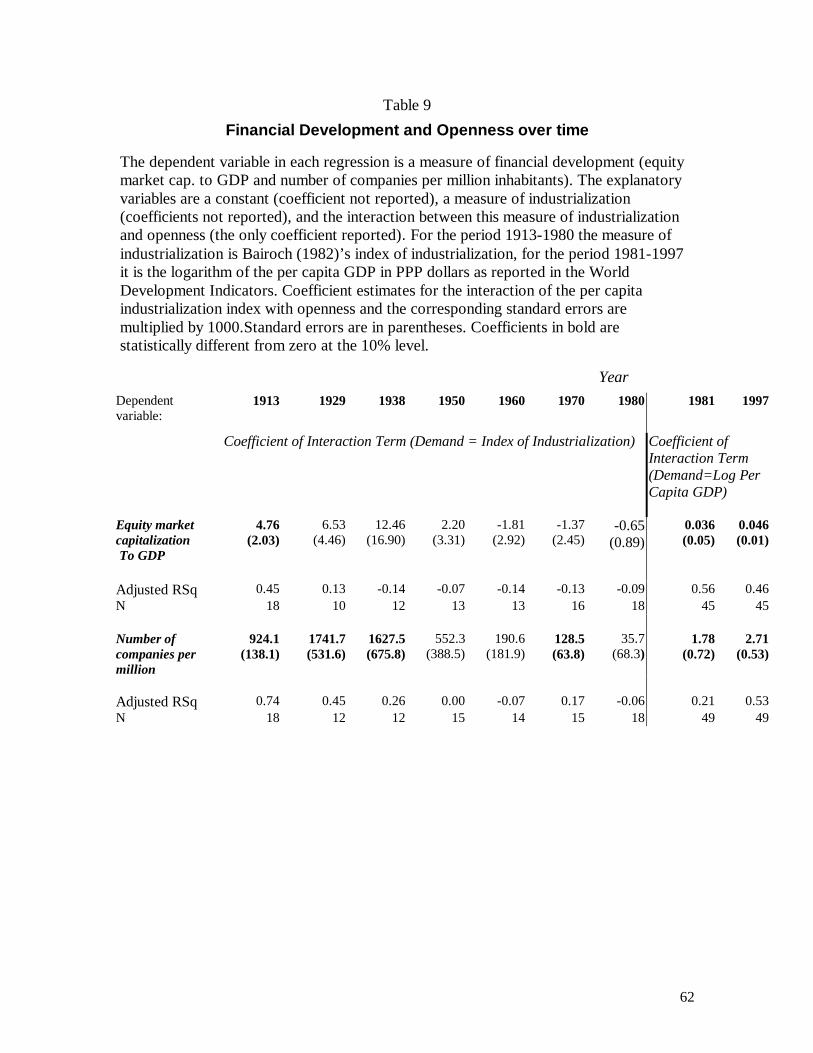
62
Table 9
Financial Development and Openness over time
The dependent variable in each regression is a measure of financial development (equitymarket cap. to GDP and number of companies per million inhabitants). The explanatoryvariables are a constant (coefficient not reported), a measure of industrialization(coefficients not reported), and the interaction between this measure of industrializationand openness (the only coefficient reported). For the period 1913-1980 the measure ofindustrialization is Bairoch (1982)’s index of industrialization, for the period 1981-1997it is the logarithm of the per capita GDP in PPP dollars as reported in the WorldDevelopment Indicators. Coefficient estimates for the interaction of the per capitaindustrialization index with openness and the corresponding standard errors aremultiplied by 1000.Standard errors are in parentheses. Coefficients in bold arestatistically different from zero at the 10% level.
YearDependentvariable:
1913 1929 1938 1950 1960 1970 1980 1981 1997
Coefficient of Interaction Term (Demand = Index of Industrialization) Coefficient ofInteraction Term(Demand=Log PerCapita GDP)
Equity marketcapitalization To GDP
4.76(2.03)
6.53(4.46)
12.46(16.90)
2.20(3.31)
-1.81(2.92)
-1.37(2.45)
-0.65(0.89)
0.036(0.05)
0.046(0.01)
Adjusted RSq 0.45 0.13 -0.14 -0.07 -0.14 -0.13 -0.09 0.56 0.46N 18 10 12 13 13 16 18 45 45
Number ofcompanies permillion
924.1(138.1)
1741.7(531.6)
1627.5(675.8)
552.3(388.5)
190.6(181.9)
128.5(63.8)
35.7(68.3)
1.78(0.72)
2.71(0.53)
Adjusted RSq 0.74 0.45 0.26 0.00 -0.07 0.17 -0.06 0.21 0.53N 18 12 12 15 14 15 18 49 49

63
Table 10Financial Development and Openness 1913-1980
This panel pools the cross-sections from the following years: 1913, 1929, 1938, 1950,1960, 1970, and 1980. The dependent variable is the ratio of equity market capitalizationto gross domestic product measure in a year. The first two columns are estimated byinstrumental variables, where openness is instrumented by constructed trade share inFrankel and Romer (1999). The next two have fixed country effects. Per CapitaIndustrialization is the index of industrialization for that country in that year as computedby Bairoch (1982). Openness is the ratio of the sum of exports and imports of goods toGDP that year (source Mitchell (1995)). The indicator for low international capitalmobility equals 1 in the years from 1938 to 1980 and 0 otherwise. All regressions includea calendar year dummy. All coefficient estimates and standard errors referring to percapital industrialization index are multiplied by 1000. The standard errors, which arecorrected for possible clustering of the residual at a country level, are in parentheses. (*)indicates significance at the 10% level, (**) at the 5% level, (***) at the 1 % level.
Estimation Technique: FixedEffects
Fixed Effects IV IV
(i) (ii) (iii) (iv)Per CapitaIndustrialization
0.157(0.741)
0.308(0.799)
0.360(1.171)
1.301(1.312)
Openness 0.186 (0.220)
0. 700*
(0.404)Openness *Indicator ifperiod of LowInternational CapitalMobility
-0.236 (0.286)
-1. 750*
(0.921)
Interaction of PerCapitaIndustrialization andOpenness
4. 467 (3.316)
6. 515***
(0.974)
Interaction of PerCapitaIndustrialization andOpenness *Indicator ifperiod of LowInternational CapitalMobility
- 4. 853*
(2.639)- 10. 463*
(2.210)
Adjusted RSq 0.51 0.53 . .
Observations 100 100 100 100
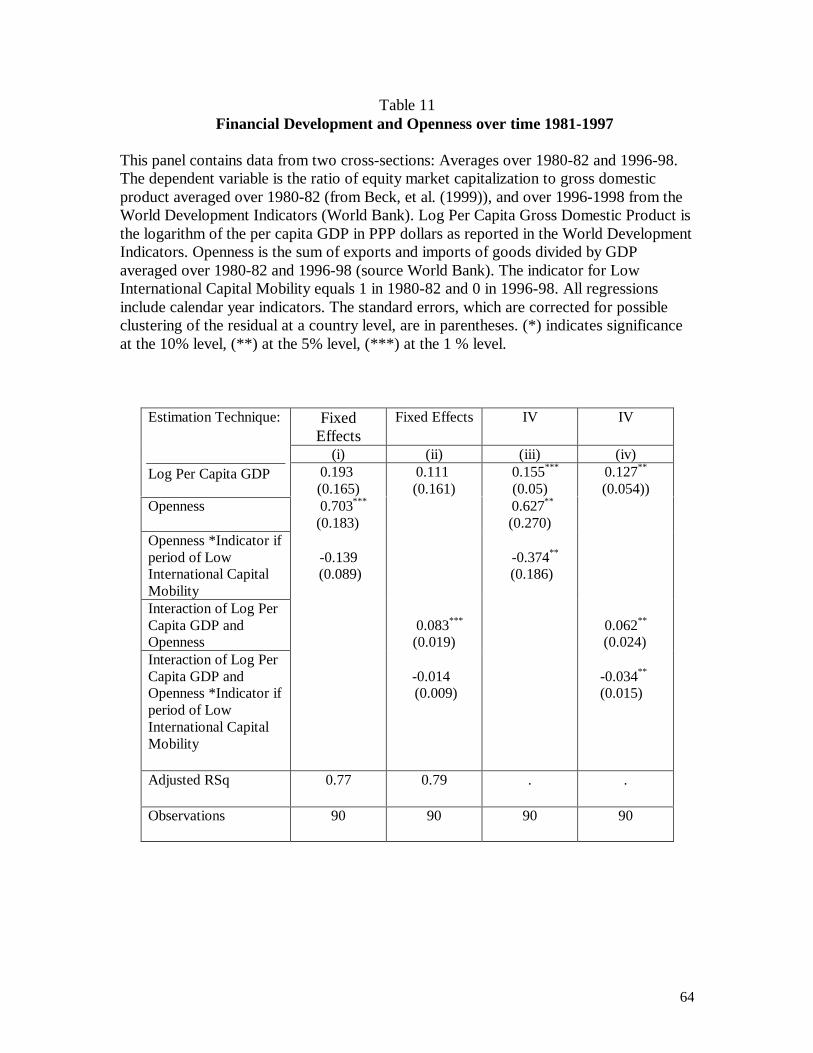
64
Table 11Financial Development and Openness over time 1981-1997
This panel contains data from two cross-sections: Averages over 1980-82 and 1996-98.The dependent variable is the ratio of equity market capitalization to gross domesticproduct averaged over 1980-82 (from Beck, et al. (1999)), and over 1996-1998 from theWorld Development Indicators (World Bank). Log Per Capita Gross Domestic Product isthe logarithm of the per capita GDP in PPP dollars as reported in the World DevelopmentIndicators. Openness is the sum of exports and imports of goods divided by GDPaveraged over 1980-82 and 1996-98 (source World Bank). The indicator for LowInternational Capital Mobility equals 1 in 1980-82 and 0 in 1996-98. All regressionsinclude calendar year indicators. The standard errors, which are corrected for possibleclustering of the residual at a country level, are in parentheses. (*) indicates significanceat the 10% level, (**) at the 5% level, (***) at the 1 % level.
Estimation Technique: FixedEffects
Fixed Effects IV IV
(i) (ii) (iii) (iv)Log Per Capita GDP 0.193
(0.165) 0.111
(0.161) 0.155***
(0.05)0.127**
(0.054))Openness 0.703***
(0.183) 0.627**
(0.270)Openness *Indicator ifperiod of LowInternational CapitalMobility
-0.139 (0.089)
-0.374**
(0.186)
Interaction of Log PerCapita GDP andOpenness
0.083***
(0.019)0.062**
(0.024)Interaction of Log PerCapita GDP andOpenness *Indicator ifperiod of LowInternational CapitalMobility
-0.014 (0.009)
-0.034**
(0.015)
Adjusted RSq 0.77 0.79 . .
Observations 90 90 90 90

65
Table 12Openness and Legal System over time
Panel A pools the cross-sections from the following years: 1913, 1929, 1938, 1950, 1960,1970, and 1980. Panel B contains data from two cross-sections: Averages over 1980-82and 1996-98. The first two columns are estimated by OLS, the next two by instrumentalvariables, where openness is instrumented by constructed trade share in Frankel andRomer (1999). The dependent variable is the ratio of equity market capitalization to grossdomestic product measure in a year. Per Capita Industrialization is the index ofindustrialization for that country in that year as computed by Bairoch (1982). Log PerCapita Gross Domestic Product is the logarithm of the per capita GDP in PPP dollars asreported in the World Development Indicators. Openness is the sum of exports andimports of goods divided by GDP in 1980-82 and 1996-98 (source World Bank). Theindicator for Low International Capital Mobility equals 1 in 1980-82 and 0 in 1996-98.The sample is divided into countries with a legal system based upon common law andcountries with a legal system based upon civil coded law. All regressions includecalendar year indicators. The standard errors, which are corrected for possible clusteringof the residual at a country level, are in parentheses. (*) indicates significance at the 10%level, (**) at the 5% level, (***) at the 1 % level.
Panel A: 1913-1980Estimation Technique: OLS IVSample: Common
LawCivil Law Common
LawCivil Law
(i) (ii) (iii) (iv)Per CapitaIndustrialization
- 1.06(0.68)
-0.60(0.47))
- 1.38(0.77)
-2.39(4.09)
Interaction of PerCapitaIndustrializationand Openness
14.84***
(2.57) 6.35***
(1.78) 14.87***
(2.89) 9.44***
(2.76)
Interaction of PerCapitaIndustrialization andOpenness *Indicator ifperiod of LowInternational CapitalMobility
-8.99**
(2.86) -5.77***
(1.93) -7.21**
(2.45) -6.09 (4.34)
RSq 0.51 0.35 . .
Observations 34 66 34 66

66
Panel B: 1981-1997Estimation Technique: OLS IV
CommonLaw
Civil Law CommonLaw
Civil Law
(i) (ii) (iii) (iv)Log Per Capita GDP 0.271***
(0.050) 0.073
(0.040) 0.275***
(0.048) 0.042
(0.050)
Interaction of Log PerCapita GDP andOpenness
0.027(0.019)
0.071***
(0.017)0.024
(0.019)0.094***
(0.011)
Interaction of Log PerCapita GDP andOpenness *Indicator ifperiod of LowInternational CapitalMobility
-0.003(0.019)
-0.044***
(0.010)0.001
(0.017)-0.049***
(0.048)
RSq 0.67 0.68 . .
Observations 32 58 32 58

67
Figure 1: Regulation of Entry and Financial Development# o
f pro
cedure
s to
open a
busi
ne
Equity market cap./GDP0 1 2 3
0
5
10
15
20
arg
aus
aut
bel
bgr
bra
can
chn
chl
dnk
egy
fra
deu
grc
ind
ita jpn
nld
nor
prt
rom
rus
zaf
esp
swe
che
tur
gbr
usafin
idn
irl
kor
mys
mex
hkg
nzl
per
phl
sgp
lka
thapol
svn
isl
ven
col
bol
lva
kgz
pak
ltu
ecu
tun
svk
hrv
jor
hun
lbn
nga
ken
ghaukr
pan
kaz
cze
ury
zwe
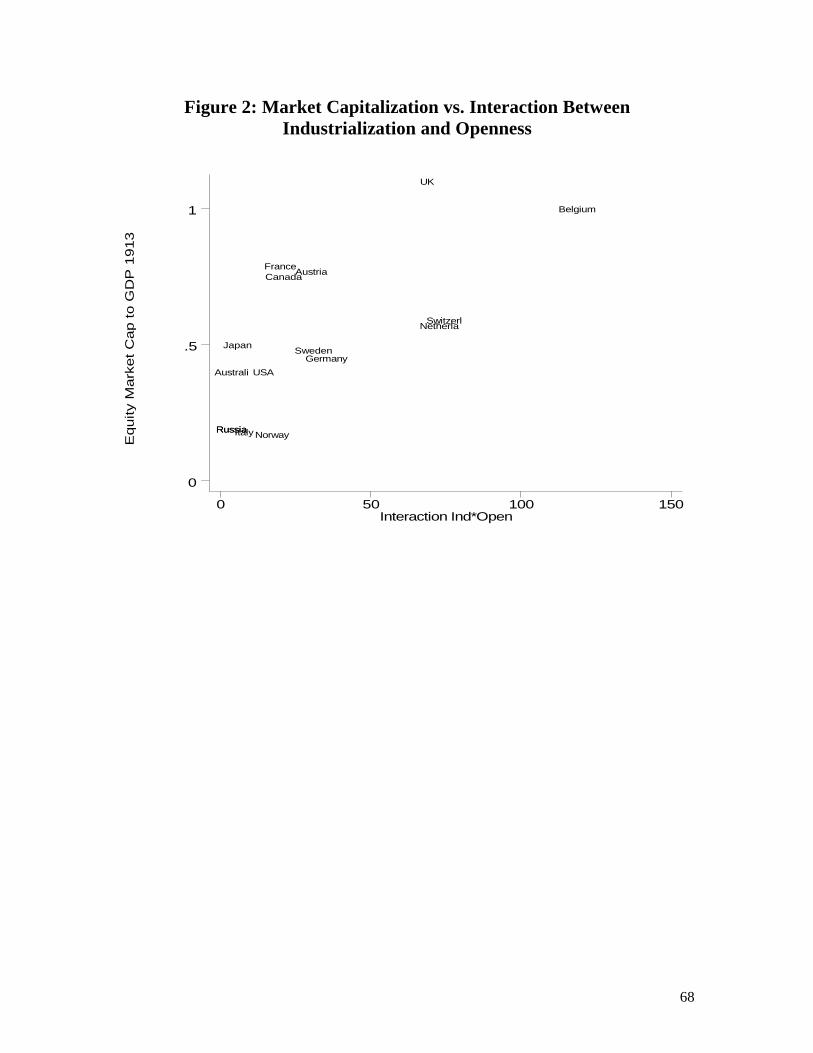
68
Figure 2: Market Capitalization vs. Interaction BetweenIndustrialization and Openness
Equity
Mark
et
Cap t
o G
DP
1913
Interaction Ind*Open0 50 100 150
0
.5
1
Australi
Austria
Belgium
Canada
Switzerl
Germany
France
UK
Italy
Japan
Netherla
NorwayRussia
Sweden
USA
Russia

69
Endnotes 1 See Engelbourg and Bushkoff (1996) and Chandler (1990).2 In the United States, the ratio of private fixed nonresidential assets to GDP in 1925 (the firstyear the numerator is computed by the Bureau of Economic Analysis) is 2.56, while in 1999 is2.19.3 One could also argue for the existence of political incumbents. To the extent that financialdevelopment makes matters transparent, and constrains the political favors they can do or thepower they have, they may also be opposed.4 We have not considered the government as an interest group in its own right. But it is one, and ithas the incentive to support financial development when it sees, for example, that doing so willalleviate its budget constraint. Thus the government may support opening up if it finds that it canborrow resources from international markets, i.e., when the world economy is healthy.5 There may be a mechanical link between the volume of transactions on the international capitalmarket and trade. For this reason, we only use the capitalization of domestic companies or thevolume of their securities issues as our measure of financial development. This measure shouldnot be mechanically linked to the volume of trade since it includes only domestic firms.6 As a denominator we use GDP rather than GFCF to maximize the number of observationsavailable.7 We use population in Table 7 as an instrument because it is available contemporaneously in1913, but we check that the results hold even when we use the.Frankel and Romer instrument.8 We have also estimated the differential impact of openness in the two sets of countries bypooling all the observations. In the first panel the coefficient of the interaction in Civil Lawcountries in periods of low capital flows is significantly lower than its value in periods of highcapital flows and also significantly lower than its contemporaneous value in Common Lawcountries. In the second panel the coefficient of the interaction in Civil Law countries in periodsof high capital flows is similarly significantly higher.9 Aoki, Patrick and Sheard (1994), and Hoshi and Kashyap (1998).10 Aoki, Patrick and Sheard (1994)11 These figures are from Teranishi (1994)12 That this was a cartel is further reinforced by Hoshi and Kashyap's observation that securityhouses that were not part of the 1931 agreement started competing fiercely for underwritingbusiness and continued to underwrite unsecured bonds. Thus the market itself did not appear todevelop a distaste for unsecured bonds.13 Bebchuk and Roe (1999) develop a theory of path dependence of governance to account forphenomena such as these.14 Kennedy (1999, p328)15 Kennedy (1999, p341)