the great recession and school district property tax...
TRANSCRIPT

Introduction The dramatic decline in home values during the Great Recession
reduced available local revenues for most Georgia school districts.
The budgetary strain caused by the housing decline differed greatly
across districts and was primarily concentrated in the Atlanta
metropolitan area school systems, which represent a large share of
statewide taxable property and K-12 students. The lack of economic
recovery has left most of Georgia’s districts at or below pre-recession
local revenue amounts.
The first section of this brief summarizes the statewide changes in
per student net property tax digests through the recession. Section
two describes the varying degrees of decline in the per student net
property tax digests by urban classification and geographic location.
Section three covers the extent to which districts’ nominal per student
net tax digest have recovered from their recession minimums by fiscal
year 2014.
This report uses Property Tax Consolidation Sheet data obtained from
the Georgia Department of Revenue for fiscal years 2008 through
2014.1 Full-time equivalent (FTE) student counts, local revenues
and total revenues were obtained from the Georgia Department
of Education.2 District urban classifications were obtained from the
National Center for Education Statistics.3
1 All local revenues represent fiscal years that end on June 30 of the indicated year.
Property tax digest values also represent fiscal years but describe the taxable properties as of January 1 of the previous year; this is because the digest values in a tax year are the basis for the local revenues in the following fiscal year’s budget.
2 “DE 46 Detailed Revenue and Expenditure Files and Fall Full Time Equivalent Data Files,” Georgia Department of Education, accessed December 17, 2014, retrieved from app3.doe.k12.ga.us/ows-bin/owa/fte_pack_enrollgrade.entry_form.
3 “District Universe Files,” The National Center for Education Statistics, accessed January 1, 2015, retrieved from nces.ed.gov/ccd/.
The Great Recession and School District Property Tax Revenues in Georgia NICHOLAS WARNER Center for State and Local Finance
Georgia State University
CSLF.GSU.EDU • FEBRUARY 10, 2015
IN COLLABORATION WITH
The Great Recession and School District Property Tax Revenues in Georgia cslf.gsu.edu • 2
Section 1. Statewide Net Property Tax Digest during the Great Recession
A school district’s net maintenance and operating digest
represents the value of all taxable property, net of
exemptions, upon which a school district may collect ad
valorem taxes and support operations. Changes in local
property values translate into changes in available local
revenue through variations in a district’s net digest. During
the Great Recession, home values plummeted, and this
devaluation drove down the amount of tax revenue that
districts had to operate their schools.4
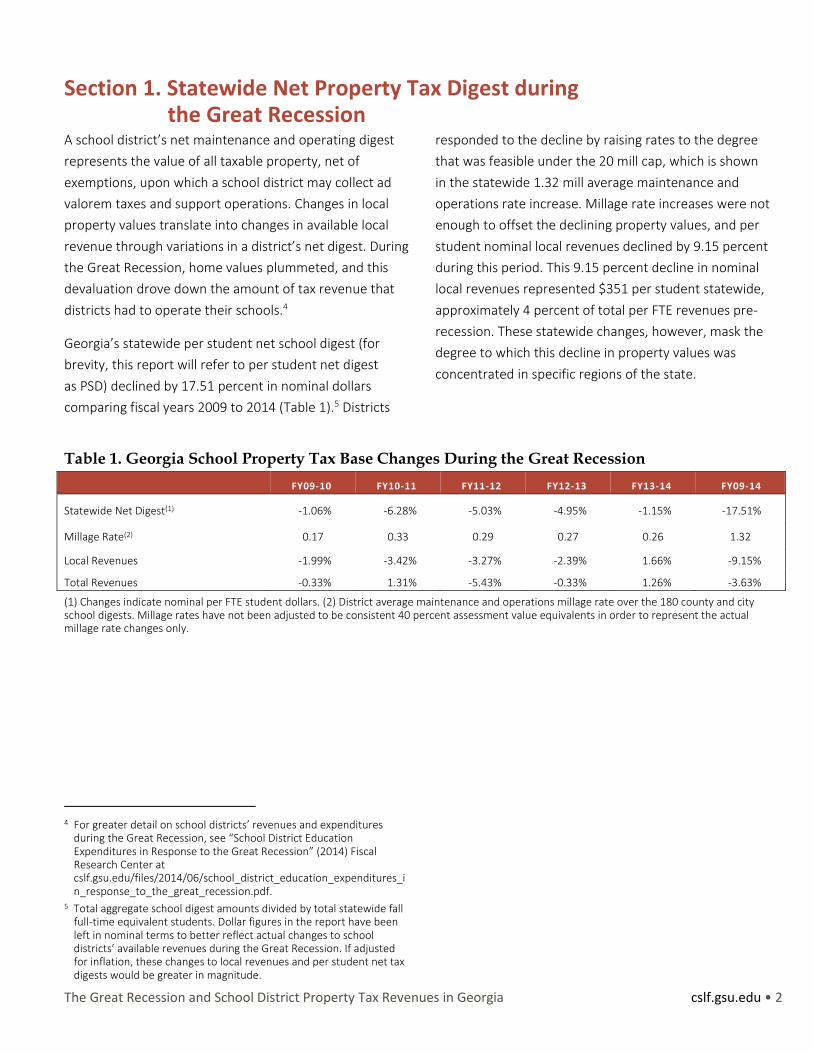
Georgia’s statewide per student net school digest (for
brevity, this report will refer to per student net digest
as PSD) declined by 17.51 percent in nominal dollars
comparing fiscal years 2009 to 2014 (Table 1).5 Districts
4 For greater detail on school districts’ revenues and expenditures
during the Great Recession, see “School District Education Expenditures in Response to the Great Recession” (2014) Fiscal Research Center at cslf.gsu.edu/files/2014/06/school_district_education_expenditures_in_response_to_the_great_recession.pdf.
5 Total aggregate school digest amounts divided by total statewide fall full-time equivalent students. Dollar figures in the report have been left in nominal terms to better reflect actual changes to school districts’ available revenues during the Great Recession. If adjusted for inflation, these changes to local revenues and per student net tax digests would be greater in magnitude.
responded to the decline by raising rates to the degree
that was feasible under the 20 mill cap, which is shown
in the statewide 1.32 mill average maintenance and
operations rate increase. Millage rate increases were not
enough to offset the declining property values, and per
student nominal local revenues declined by 9.15 percent
during this period. This 9.15 percent decline in nominal
local revenues represented $351 per student statewide,
approximately 4 percent of total per FTE revenues pre-
recession. These statewide changes, however, mask the
degree to which this decline in property values was
concentrated in specific regions of the state.
Table 1. Georgia School Property Tax Base Changes During the Great Recession
FY09-10 FY10-11 FY11-12 FY12-13 FY13-14 FY09-14
Statewide Net Digest(1) -1.06% -6.28% -5.03% -4.95% -1.15% -17.51%
Millage Rate(2) 0.17 0.33 0.29 0.27 0.26 1.32
Local Revenues -1.99% -3.42% -3.27% -2.39% 1.66% -9.15%
Total Revenues -0.33% 1.31% -5.43% -0.33% 1.26% -3.63%
(1) Changes indicate nominal per FTE student dollars. (2) District average maintenance and operations millage rate over the 180 county and city school digests. Millage rates have not been adjusted to be consistent 40 percent assessment value equivalents in order to represent the actual millage rate changes only.

The Great Recession and School District Property Tax Revenues in Georgia cslf.gsu.edu • 3
Section 2. Geographic Differences The collapse in housing values affected communities to
varying degrees. Examining PSD recession changes for
various urban classifications and geographic locations
uncovers the kinds of districts that were the driving force
for the statewide decline during the recession.6 The
degree of decline and the district’s ability to raise revenue
through millage rate increases were also critical to a
district’s ability to maintain local revenues through the
recession. Changes to local revenues and average millage
rates in different areas of the state also are explored
to highlight types of districts that were better able to
maintain revenues during a period of declining PSDs.
Georgia’s only district classified as a large city district
is Atlanta Public Schools, and its PSD in nominal dollars
declined by 20.46 percent between fiscal years 2009 and
2014. This represented 9.44 percent of the statewide
PSD decline during that period (Table 2). Mostly located
in the Atlanta metropolitan area, the 14 suburban districts
associated with a large city in Georgia represented
39.9 percent of Georgia’s students, and these districts
experienced the most dramatic decline in nominal PSD,
25.53 percent, of any urban classification type between
fiscal years 2009 and 2014. Combined with the fact that
they made up a disproportionate share of the statewide
PSD, these districts accounted for 58.57 percent of the
statewide nominal decline in PSD and 99.02 percent of
the statewide change in nominal local revenue.7 Together
these school districts plus Atlanta’s made up more than
two-thirds of the statewide drop in the net tax digest.
Rural fringe districts, which are defined as fewer than five
miles from an urbanized area, had 26.5 percent of the
state’s students and accounted for 22.62 percent of the
statewide net tax digest change in nominal dollars.
6 For the definitions of the urban classifications, see Table A-1 in the
appendix. Table A-2 provides each district’s urban classification. 7 Total nominal aggregate local revenues across the 14 suburb districts
declined by $402 million nominal dollars between fiscal years 2009 and 2014. Some non-suburb districts were able to maintain local revenues through millage rate increases, and some districts’ property tax digests had started to increase as of fiscal year 2014. The aggregate change in local revenues across the 180 county and city districts between fiscal years 2009 and 2014 was a decline of $406 million (nominal dollars).
In Georgia, the urban classification groups that
experienced smaller percentage declines in their PSDs
tended to have lower relative millage rates in fiscal year
2009 and were better able to increase their rate to
maintain per student nominal local revenues during
the recession (Table 2). The 40 rural distant districts’
aggregate digests declined by 10.72 percent, but they
raised their average millage rate by 1.47 mills, leaving their
per student nominal local revenues relatively unaffected.
With the exception of the large city, large suburb and
rural fringe districts, nominal local revenues between
fiscal years 2009 and 2014 declined by insignificant
percentages or grew. The entire drop in statewide
nominal local revenues came from the decline in the
75 districts where PSDs declined by double-digit
percentages, particularly large city suburb districts.
In Figure 1, the recession minimum PSD is compared to
the pre-recession peak value. Comparing the pre-recession
peak of PSD to its recession minimum provides a more
accurate picture of the peak to trough percentage decline
for that district (Figure 1) than comparing two pre-selected
years for comparison as shown in Table 2, as each district
experienced its own timing of decline and recovery.
Specifically, this is the highest value from fiscal years 2009,
2010 and 2011, compared to the lowest value from fiscal
years 2012, 2013 and 2014.
Forty-one districts experienced a nominal decline in PSD of
20 percent or more comparing their pre-peak amount to
their recession minimum, and these districts were primarily
located in the Atlanta metropolitan area (Figure 1). Of the
districts in or close to urban clusters that did not have a
decline of greater than 20 percent, most experienced a
decline greater than 10 percent. Only 25 school districts
experienced no nominal decline in the PSD during the
recession, and these districts were, for the most part, not
located in or near an urban cluster. The 17.51 percent
statewide decline in nominal PSD (Table 1) was driven to a
large degree by the dramatic declines the Atlanta metropolitan
area and suburb districts, along with the corresponding
decline in statewide nominal local revenues.

The Great Recession and School District Property Tax Revenues in Georgia cslf.gsu.edu • 4
Table 2. Georgia Districts’ Change in Net School Tax Digest by Urban Classification FY 2009 and FY 2014
COUNT OF DISTRICTS
PERCENTAGE OF
STUDENTS
FY09-14 CHANGE IN NOMINAL PER FTE NET DIGEST
SHARE OF STATEWIDE NET DIGEST
CHANGE
FY09-14 MILLAGE
RATE INCREASE (1)
FY09-14 CHANGE IN
NOMINAL PER FTE LOC. REV.
SHARE OF STATEWIDE LOC. REV. CHANGE (2)
City: Large (Atlanta) 1 3.0% -20.46% 9.44% 0.00 (21.64) -16.99% 19.43%
City: Mid-size 4 6.7% -3.23% 0.34% 0.78 (19.03) 7.54% -10.67%
City: Small 9 6.8% -6.87% 1.66% 0.30 (14.61) -0.63% -2.45%
Suburb: Large 14 39.9% -25.53% 58.57% 1.32 (17.78) -18.72% 99.02%
Town: Fringe 2 0.9% -11.74% 0.24% 1.00 (14.52) -0.74% -0.47%
Town: Distant 24 5.3% -7.49% 1.98% 1.26 (14.12) 7.16% -4.13%
Town: Remote 11 2.6% -3.07% 0.10% 0.74 (14.06) 7.70% -2.56%
Rural: Fringe 60 26.5% -15.08% 22.62% 1.30 (15.13) -3.17% 9.52%
Rural: Distant 40 6.9% -10.72% 4.21% 1.47 (14.84) 5.63% -3.99%
Rural: Remote 15 1.4% -4.35% 0.83% 2.46 (12.16) 23.09% -3.71%
Urban Centric Codes are provided by The National Center for Education Statistics. (1) Change in the average maintenance and operations millage rates across the applicable districts. The number in parenthesis is the millage rate in FY 2009. (2) Share of statewide local revenue change is the aggregate local revenue change in the urban classification divided by the statewide aggregate local revenue change. This does not incorporate any decline in per FTE local revenue due to growth in FTEs, and this is why declining per FTE local revenues in the column to the left can actually be paired with a negative share in the statewide local revenue change.

The Great Recession and School District Property Tax Revenues in Georgia cslf.gsu.edu • 5
Figure 1. Change in Per FTE Net Tax Digest from Pre-Recession Peak to Recession Minimum
For district data relating to this map, see column B in Table A-2 in the Appendix.

The Great Recession and School District Property Tax Revenues in Georgia cslf.gsu.edu • 6
Section 3. Delayed Recovery The dramatic decline in Georgia’s PSD was driven by the
tax digest associated with the Atlanta metropolitan area.
As of fiscal year 2014, the recovery in these net school
digests had not yet occurred. This left available local
revenues below pre-recession levels for the largest
districts in Georgia. According to multiple sources, the
housing market in Georgia hit bottom in fiscal years 2012
or 2013, depending on location, and it has since started
to recover.8 If the increasing estimates of home valuations
are accurate, then some recovery in net school digests
has occurred recently or is set to occur. The lag in the
PSD’s decline and recovery from the recession is a
necessary result of the process. Changes in property
values slowly affect the assessed property values, which
then become the basis of the subsequent year’s tax
digests and district revenues; this lag was one or two
years during the downturn.
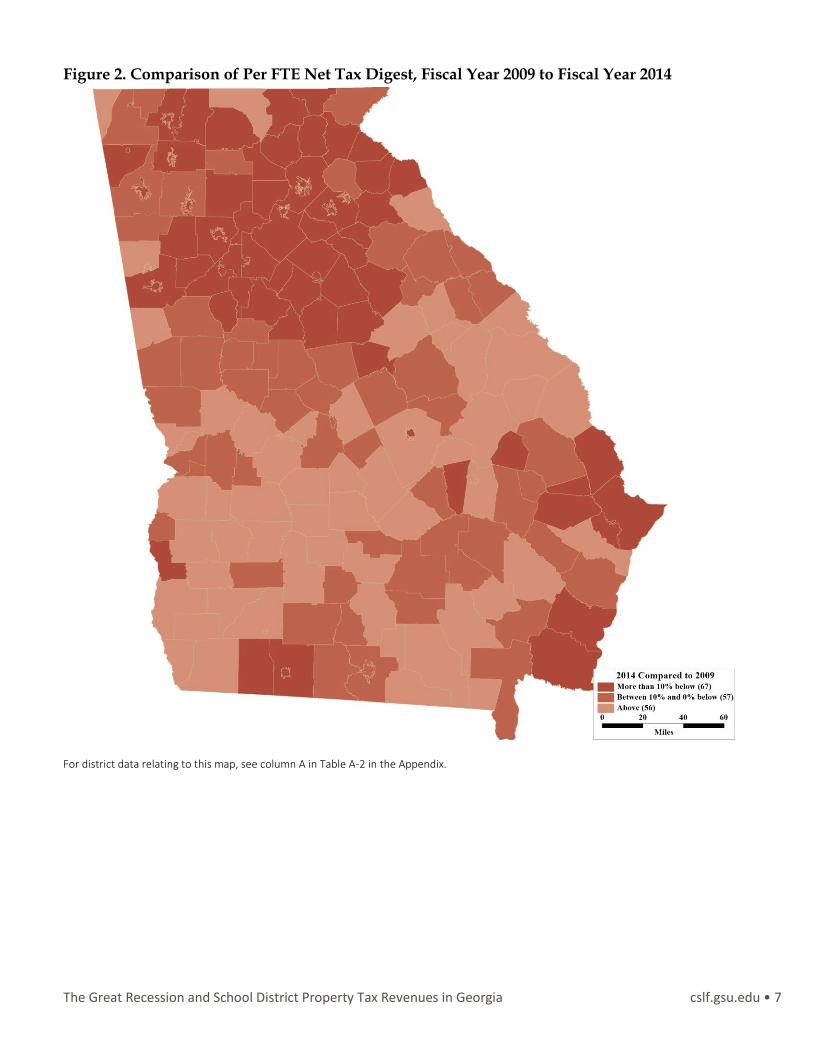
Figure 2 shows whether a school district’s PSD had
increased or decreased from the 2009 PSD in nominal
dollars by 2014. This form of recovery had not happened
for the majority of districts in Georgia as of fiscal year 2014
(Figure 2). The PSDs that were above their fiscal year 2009
levels in fiscal year 2014 were, generally, the least affected
rural and remote districts, which includes the systems
8 Zillow Real Estate Research, retrieved from
www.zillow.com/research/. The Zillow Home value Index for Georgia takes a minimum in March of 2012 and has steadily increased since. The Atlanta Region Case-Shiller Home Value Index started increasing in January 2013, which understates the statewide effect, retrieved from us.spindices.com/indices/real-estate/sp-case-shiller-ga-atlanta-home-price-index.
that experienced no recession decline. The suburban,
fringe and city districts whose PSDs experienced dramatic
pre-peak to recession minimum declines remained
substantially below their fiscal year 2009 PSD levels in
fiscal year 2014 (Figure 2).
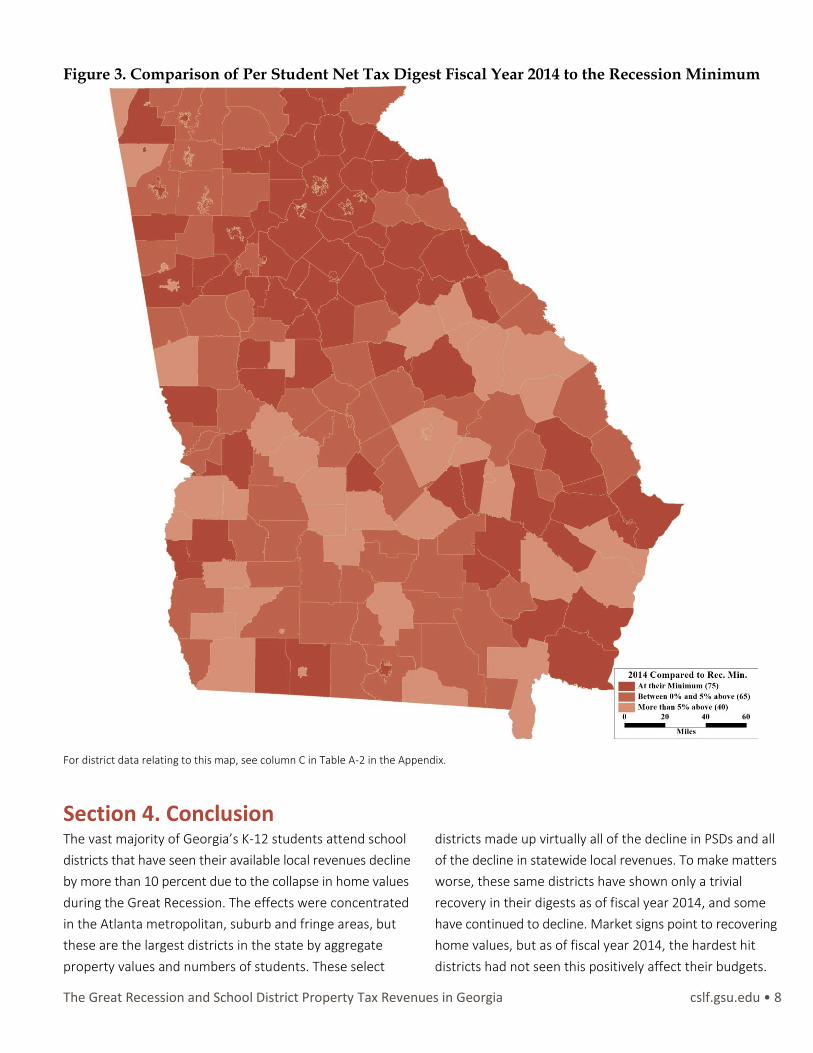
Figure 3 shows whether, as of 2014, a school district has
at least started to rebound from its lowest point during
the recession. For 75 districts, fiscal year 2014 was actually
their recession minimum PSD to date (Figure 3). In other
words, their PSDs had not yet stopped declining as of fiscal
year 2014. For the urban districts whose current PSD was
above their recession minimum in fiscal year 2014, it was
only by a small percentage and had not grown enough to
surpass fiscal year 2009 PSD levels. The statewide PSD
in nominal dollars continued to decline between fiscal
years 2013 and 2014 and continued to be at its recession
minimum, driven to a large extent by the continued
decline within the largest districts. Unfortunately, for the
districts whose digests were affected by the collapse in
housing prices the most – large city, large city suburb
and fringe districts – the decline in PSDs persisted as of
fiscal year 2014. This effect of the Great Recession has
continued five years after districts’ total revenues began
declining in fiscal year 2009.9
9 Statewide total per FTE operating revenues first declined between
fiscal years 2008 and 2009. The first year showing increase is between fiscal years 2013 and 2014.
The Great Recession and School District Property Tax Revenues in Georgia cslf.gsu.edu • 7
Figure 2. Comparison of Per FTE Net Tax Digest, Fiscal Year 2009 to Fiscal Year 2014
For district data relating to this map, see column A in Table A-2 in the Appendix.
The Great Recession and School District Property Tax Revenues in Georgia cslf.gsu.edu • 8
Figure 3. Comparison of Per Student Net Tax Digest Fiscal Year 2014 to the Recession Minimum
For district data relating to this map, see column C in Table A-2 in the Appendix.
Section 4. Conclusion The vast majority of Georgia’s K-12 students attend school
districts that have seen their available local revenues decline
by more than 10 percent due to the collapse in home values
during the Great Recession. The effects were concentrated
in the Atlanta metropolitan, suburb and fringe areas, but
these are the largest districts in the state by aggregate
property values and numbers of students. These select
districts made up virtually all of the decline in PSDs and all
of the decline in statewide local revenues. To make matters
worse, these same districts have shown only a trivial
recovery in their digests as of fiscal year 2014, and some
have continued to decline. Market signs point to recovering
home values, but as of fiscal year 2014, the hardest hit
districts had not seen this positively affect their budgets.

The Great Recession and School District Property Tax Revenues in Georgia cslf.gsu.edu • 9
Appendix
Table A-1. Urban Classification Definitions
CLASSIFICATION DEFINITION
City: Large Territory inside an urbanized area and inside a principal city with population of 250,000 or more
City: Mid-size Territory inside an urbanized area and inside a principal city with population less than 250,000 and greater than or equal to 100,000
City: Small Territory inside an urbanized area and inside a principal city with population less than 100,000
Suburb: Large Territory outside a principal city and inside an urbanized area with population of 250,000 or more
Town: Fringe Territory inside an urban cluster that is less than or equal to 10 miles from an urbanized area
Town: Distant Territory inside an urban cluster that is more than 10 miles and less than or equal to 35 miles from an urbanized area
Town: Remote Territory inside an urban cluster that is more than 35 miles from an urbanized area
Rural: Fringe Census-defined rural territory that is less than or equal to 5 miles from an urbanized area, as well as rural territory that is less than or equal to 2.5 miles from an urban cluster
Rural: Distant Census-defined rural territory that is more than 5 miles but less than or equal to 25 miles from an urbanized area, as well as rural territory that is more than 2.5 miles but less than or equal to 10 miles from an urban cluster
Rural: Remote Census-defined rural territory that is more than 25 miles from an urbanized area and is also more than 10 miles from an urban cluster
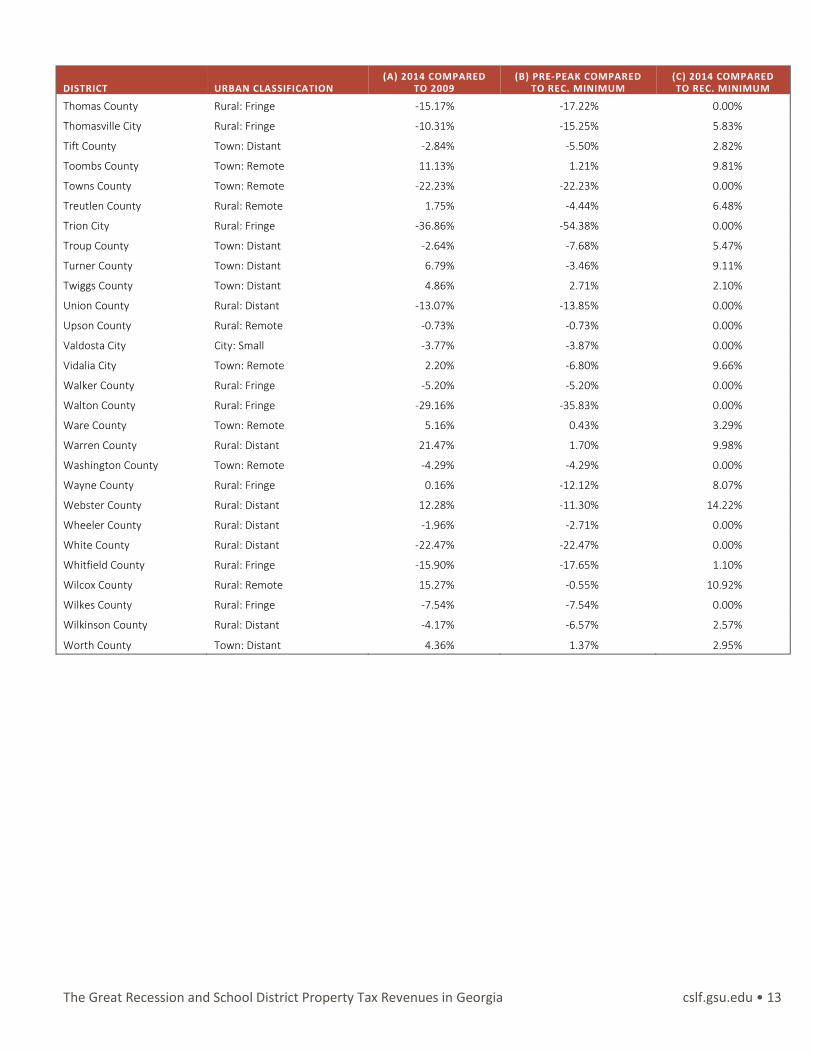
Table A-2. Data Corresponding to Figures 1, 2 and 3
DISTRICT URBAN CLASSIFICATION (A) 2014 COMPARED
TO 2009 (B) PRE-PEAK COMPARED
TO REC. MINIMUM (C) 2014 COMPARED TO REC. MINIMUM
Appling County Town: Remote -0.77% -0.77% 0.00%
Atkinson County Rural: Remote -3.26% -5.83% 2.73%
Atlanta Public Schools City: Large -21.83% -22.03% 0.25%
Bacon County Rural: Fringe -9.03% -9.03% 0.00%
Baker County Rural: Distant 16.73% 6.11% 6.58%
Baldwin County Rural: Fringe -13.98% -13.98% 0.00%
Banks County Rural: Distant -5.58% -5.82% 0.00%
Barrow County Rural: Fringe -29.08% -33.75% 0.00%
Bartow County Rural: Fringe -6.74% -7.59% 0.43%
Ben Hill County Rural: Fringe -0.27% -3.70% 3.56%
Berrien County Rural: Fringe 7.13% -7.07% 12.81%
Bibb County City: Small -3.31% -4.48% 1.23%
Bleckley County Rural: Fringe -7.53% -9.67% 2.37%
Brantley County Rural: Remote -2.31% -2.59% 0.00%
Bremen City Rural: Fringe 1.81% -8.46% 7.82%
Brooks County Rural: Fringe -4.08% -13.62% 2.07%
Bryan County Town: Fringe -14.65% -14.88% 0.00%
Buford City Suburb: Large -34.93% -35.23% 0.00%
Bulloch County Town: Remote -9.95% -9.95% 0.00%
Burke County Rural: Fringe 55.57% 14.32% 32.88%

The Great Recession and School District Property Tax Revenues in Georgia cslf.gsu.edu • 10
DISTRICT URBAN CLASSIFICATION (A) 2014 COMPARED
TO 2009 (B) PRE-PEAK COMPARED
TO REC. MINIMUM (C) 2014 COMPARED TO REC. MINIMUM
Butts County Rural: Fringe -11.36% -12.25% 0.00%
Calhoun City Town: Distant -19.43% -22.35% 3.06%
Calhoun County Rural: Remote 1.20% -11.70% 5.27%
Camden County Rural: Fringe -19.89% -19.89% 0.00%
Candler County Rural: Fringe -11.10% -13.69% 3.00%
Carroll County Rural: Fringe -12.11% -12.96% 0.00%
Carrollton City Town: Distant -17.60% -26.27% 10.92%
Cartersville City Town: Distant -17.11% -19.48% 0.50%
Catoosa County Suburb: Large -5.04% -7.61% 2.26%
Charlton County Rural: Fringe -2.18% -12.88% 6.04%
Chatham County City: Mid-Size -11.57% -11.98% 0.00%
Chattahoochee County Rural: Distant -3.33% -3.33% 0.00%
Chattooga County Rural: Distant -25.80% -29.41% 5.12%
Cherokee County Suburb: Large -24.09% -29.35% 0.63%
Chickamauga City Suburb: Large -10.48% -15.25% 5.63%
Clarke County City: Mid-Size -10.57% -10.57% 0.00%
Clay County Rural: Remote -15.75% -17.67% 0.00%
Clayton County Suburb: Large -31.66% -34.30% 0.00%
Clinch County Rural: Fringe 6.37% 0.43% 2.16%
Cobb County Suburb: Large -19.73% -21.23% 0.00%
Coffee County Rural: Fringe -3.19% -5.40% 2.33%
Colquitt County Town: Distant -1.44% -4.21% 2.21%
Columbia County Rural: Fringe -3.89% -5.85% 0.06%
Commerce City Town: Distant -7.87% -7.87% 0.00%
Cook County Rural: Fringe -1.75% -9.40% 3.63%
Coweta County Rural: Fringe -8.13% -11.85% 2.88%
Crawford County Rural: Distant -5.26% -8.59% 3.64%
Crisp County Rural: Fringe 5.28% -2.95% 7.08%
Dade County Town: Distant 4.37% -4.91% 9.75%
Dalton City City: Small -19.44% -22.12% 0.00%
Dawson County Rural: Distant -33.14% -34.38% 0.00%
Decatur City Suburb: Large -34.65% -34.65% 0.00%
Decatur County Town: Distant 0.24% -10.11% 5.27%
DeKalb County Suburb: Large -24.25% -26.79% 0.00%
Dodge County Rural: Fringe 0.02% -1.45% 1.49%
Dooly County Rural: Distant 7.81% 0.10% 7.70%
Dougherty County City: Small -5.39% -8.02% 2.82%
Douglas County Suburb: Large -25.00% -26.33% 0.00%
Dublin City Town: Remote -10.16% -20.14% 12.50%
Early County Town: Distant 5.54% 0.98% 2.50%
Echols County Rural: Distant 4.46% -7.98% 5.37%
Effingham County Rural: Distant -14.49% -15.38% 1.05%
Elbert County Town: Distant 3.85% 2.90% 0.92%
Emanuel County Rural: Fringe 4.38% -1.42% 2.76%

The Great Recession and School District Property Tax Revenues in Georgia cslf.gsu.edu • 11
DISTRICT URBAN CLASSIFICATION (A) 2014 COMPARED
TO 2009 (B) PRE-PEAK COMPARED
TO REC. MINIMUM (C) 2014 COMPARED TO REC. MINIMUM
Evans County Rural: Fringe -2.26% -3.77% 1.57%
Fannin County Rural: Remote 3.99% 0.47% 2.09%
Fayette County Rural: Fringe -16.22% -16.59% 0.45%
Floyd County Rural: Fringe -4.13% -5.34% 1.28%
Forsyth County Suburb: Large -27.25% -31.44% 0.00%
Franklin County Rural: Distant -15.47% -16.89% 0.00%
Fulton County Suburb: Large -15.69% -17.87% 0.00%
Gainesville City City: Small -25.55% -27.32% 0.00%
Gilmer County Rural: Fringe -38.13% -43.09% 0.79%
Glascock County Rural: Remote 12.49% 1.38% 6.40%
Glynn County Rural: Fringe -25.33% -26.41% 0.00%
Gordon County Rural: Distant -18.89% -19.36% 0.59%
Grady County Town: Distant -18.94% -20.43% 0.00%
Greene County Rural: Fringe -29.90% -32.84% 0.00%
Gwinnett County Suburb: Large -27.74% -30.64% 0.00%
Habersham County Rural: Fringe -19.35% -19.35% 0.00%
Hall County Rural: Fringe -23.31% -23.31% 0.00%
Hancock County Rural: Fringe 12.50% 2.95% 9.12%
Haralson County Rural: Distant 1.36% 0.49% 0.31%
Harris County Rural: Distant -9.35% -10.92% 0.00%
Hart County Town: Distant -21.80% -21.80% 0.00%
Heard County Rural: Distant 3.68% -1.16% 4.89%
Henry County Rural: Fringe -29.26% -32.34% 0.00%
Houston County City: Small -0.85% -1.35% 0.51%
Irwin County Rural: Fringe 0.13% -0.83% 0.97%
Jackson County Rural: Distant -23.82% -25.70% 0.00%
Jasper County Rural: Distant -32.36% -34.47% 0.00%
Jeff Davis County Town: Remote -1.98% -6.34% 3.65%
Jefferson City Rural: Distant -18.87% -22.02% 0.00%
Jefferson County Rural: Distant 15.25% -0.15% 12.85%
Jenkins County Rural: Fringe 16.54% -6.35% 19.40%
Johnson County Rural: Remote -1.93% -2.70% 0.79%
Jones County Rural: Distant -7.90% -7.97% 0.08%
Lamar County Town: Distant -6.17% -14.69% 9.64%
Lanier County Rural: Distant 1.28% -5.59% 3.66%
Laurens County Rural: Distant 1.08% -9.48% 7.43%
Lee County Rural: Fringe 2.98% -0.83% 3.84%
Liberty County City: Small 6.92% 0.87% 6.00%
Lincoln County Rural: Distant -3.59% -5.31% 0.00%
Long County Rural: Distant -2.47% -5.12% 0.00%
Lowndes County Rural: Fringe -1.84% -3.81% 2.05%
Lumpkin County Town: Distant -27.31% -30.19% 0.00%
Macon County Town: Distant 18.79% -1.68% 20.82%
Madison County Rural: Distant -10.39% -14.25% 2.65%

The Great Recession and School District Property Tax Revenues in Georgia cslf.gsu.edu • 12
DISTRICT URBAN CLASSIFICATION (A) 2014 COMPARED
TO 2009 (B) PRE-PEAK COMPARED
TO REC. MINIMUM (C) 2014 COMPARED TO REC. MINIMUM
Marietta City City: Small -24.65% -25.15% 0.00%
Marion County Rural: Distant -6.06% -6.06% 0.00%
McDuffie County Rural: Fringe -0.41% -2.98% 0.00%
McIntosh County Rural: Fringe -0.84% -12.29% 13.05%
Meriwether County Rural: Distant -4.35% -5.98% 1.73%
Miller County Rural: Remote 13.80% -1.00% 14.95%
Mitchell County Rural: Distant 6.47% 2.16% 4.22%
Monroe County Rural: Fringe -8.83% -9.71% 0.00%
Montgomery County Rural: Distant -44.32% -44.32% 0.00%
Morgan County Rural: Fringe -36.84% -37.41% 0.00%
Murray County Town: Fringe -10.13% -14.76% 4.69%
Muscogee County City: Mid-Size 6.19% 1.46% 4.49%
Newton County Suburb: Large -34.84% -38.29% 0.00%
Oconee County Rural: Fringe -16.89% -19.05% 0.00%
Oglethorpe County Rural: Distant -5.45% -5.45% 0.00%
Paulding County Rural: Fringe -30.95% -37.38% 0.96%
Peach County Rural: Fringe 4.93% 0.43% 4.48%
Pelham City Town: Distant 7.09% -2.92% 10.31%
Pickens County Rural: Fringe -4.06% -4.06% 0.00%
Pierce County Rural: Fringe 2.63% -1.38% 2.98%
Pike County Rural: Distant -9.64% -11.05% 0.00%
Polk County Town: Distant -5.15% -7.73% 0.00%
Pulaski County Town: Distant 6.77% -1.22% 0.00%
Putnam County Rural: Fringe -10.95% -12.44% 1.70%
Quitman County Town: Remote -1.47% -43.44% 8.83%
Rabun County Rural: Remote -4.17% -8.67% 1.94%
Randolph County Town: Distant 18.51% 15.60% 0.00%
Richmond County City: Mid-Size 5.48% 1.41% 2.91%
Rockdale County Suburb: Large -36.70% -37.30% 0.00%
Rome City City: Small -12.17% -12.17% 0.00%
Schley County Rural: Remote -6.98% -7.89% 1.00%
Screven County Rural: Fringe 9.30% 3.18% 4.44%
Seminole County Rural: Fringe 0.27% -4.58% 1.91%
Social Circle City Rural: Distant -11.27% -15.42% 0.00%
Spalding County Rural: Fringe -5.09% -6.11% 0.53%
Stephens County Rural: Fringe -10.64% -10.64% 0.00%
Stewart County Rural: Distant 3.03% -8.52% 12.62%
Sumter County Rural: Fringe 3.45% 1.59% 1.56%
Talbot County Rural: Distant 9.37% 2.13% 0.72%
Taliaferro County Rural: Remote -2.88% -20.01% 0.00%
Tattnall County Rural: Distant -3.43% -5.53% 0.00%
Taylor County Rural: Remote 0.68% -5.70% 5.37%
Telfair County Town: Remote 3.50% -2.74% 5.20%
Terrell County Town: Distant 4.85% 0.86% 3.96%
The Great Recession and School District Property Tax Revenues in Georgia cslf.gsu.edu • 13
DISTRICT URBAN CLASSIFICATION (A) 2014 COMPARED
TO 2009 (B) PRE-PEAK COMPARED
TO REC. MINIMUM (C) 2014 COMPARED TO REC. MINIMUM
Thomas County Rural: Fringe -15.17% -17.22% 0.00%
Thomasville City Rural: Fringe -10.31% -15.25% 5.83%
Tift County Town: Distant -2.84% -5.50% 2.82%
Toombs County Town: Remote 11.13% 1.21% 9.81%
Towns County Town: Remote -22.23% -22.23% 0.00%
Treutlen County Rural: Remote 1.75% -4.44% 6.48%
Trion City Rural: Fringe -36.86% -54.38% 0.00%
Troup County Town: Distant -2.64% -7.68% 5.47%
Turner County Town: Distant 6.79% -3.46% 9.11%
Twiggs County Town: Distant 4.86% 2.71% 2.10%
Union County Rural: Distant -13.07% -13.85% 0.00%
Upson County Rural: Remote -0.73% -0.73% 0.00%
Valdosta City City: Small -3.77% -3.87% 0.00%
Vidalia City Town: Remote 2.20% -6.80% 9.66%
Walker County Rural: Fringe -5.20% -5.20% 0.00%
Walton County Rural: Fringe -29.16% -35.83% 0.00%
Ware County Town: Remote 5.16% 0.43% 3.29%
Warren County Rural: Distant 21.47% 1.70% 9.98%
Washington County Town: Remote -4.29% -4.29% 0.00%
Wayne County Rural: Fringe 0.16% -12.12% 8.07%
Webster County Rural: Distant 12.28% -11.30% 14.22%
Wheeler County Rural: Distant -1.96% -2.71% 0.00%
White County Rural: Distant -22.47% -22.47% 0.00%
Whitfield County Rural: Fringe -15.90% -17.65% 1.10%
Wilcox County Rural: Remote 15.27% -0.55% 10.92%
Wilkes County Rural: Fringe -7.54% -7.54% 0.00%
Wilkinson County Rural: Distant -4.17% -6.57% 2.57%
Worth County Town: Distant 4.36% 1.37% 2.95%

The Great Recession and School District Property Tax Revenues in Georgia cslf.gsu.edu • 14
About the Author
Nicholas Warner is a research associate at the Center for State and Local Finance and the Fiscal
Research Center. His recent research has focused on school district expenditure and revenue
portfolio analysis, tax expenditure estimation, examination of Georgia’s special option sales tax
for school facility funding, and school districts’ responses to the Great Recession.
About the Fiscal Research Center
Established in 1995, the Fiscal Research Center (FRC) provides nonpartisan research, technical assistance and
education in the evaluation and design of state tax and economic policy. FRC’s responsibilities include developing
estimates for tax-related fiscal notes, writing the Georgia State Tax Expenditure Budget, supporting the state’s
economist, and conducting policy and academic research on a variety of topics associated with state tax policy issues.
FRC Reports, Policy Briefs, and other publications maintain a position of neutrality on public policy issues in order to
safeguard the academic freedom of the authors. Thus, interpretations or conclusions in FRC publications should be
understood to be solely those of the author(s).
For more information on the Fiscal Research Center, visit our website at: frc.gsu.edu.
About the Center for State and Local Finance
The Center for State and Local Finance (CSLF) mission is to develop the people and technologies for next generation
public finance. Key initiatives include: 1) Developing executive education programs in public finance to provide
professional development for the next generation of practitioners in state and local finance; 2) Building technical
assistance capacity in next generation technologies for the public sector that include the use of “big data” and
improved analytics to better inform policy-makers and to better target solutions to public sector problems; 3)
Supporting scholarship on critical challenges in state and local fiscal and economic policy; and 4) Building and strong
capacity to translate and communicate academic research for the practitioner audience.
CSLF Reports, Policy Briefs, and other publications maintain a position of neutrality on public policy issues in
order to safeguard the academic freedom of the authors. Thus, interpretations or conclusion in CSLF
publications should be understood to be solely those of the author(s).
For more information on the Center for State and Local Finance, visit our website at: cslf.gsu.edu.