the gold standard micro-scale scheme...
TRANSCRIPT

1
THE GOLD STANDARD MICRO-SCALE SCHEME PROJECT DESIGN DOCUMENT
FORM - Version 2.2
CONTENTS
A. General description of the micro scale project activity
B. Application of an existing or new baseline and monitoring methodology
C. Duration of the project activity and crediting period
D. Stakeholders’ comments
A. Annexes
Annex 1: Contact information on participants in the proposed micro scale project activity
Annex 2: Information regarding Public Funding
Annex 3: Calculation of SEC
Annex 4: List of Participants of Local Stakeholder Consultation (typed copy)
Annex 5: List of Participants of Local Stakeholder Consultation (original)
Annex 6: Original feedback forms
Annex 7: Translation of feedback forms
Annex 8: Sustainability Monitoring Plan
Annex 9: Template of project/monitoring & usage survey
Annex 10: Uganda Water Supply Atlas (27.04.2016)

2
SECTION A. General description of micro-scale project activity
A.1 Title of the micro-scale project activity:
South Western Household Water Project (SWHWP) - Masha
>> Date & version of the PDD
Date: 06.09.2016
Version: V1.02
A.2. Project participants:
The project participants are:
Name of Party involved ((host)
indicates a host Party)
Private and/or public
entitiesproject participants (as
applicable)
Party involved wishes to be
considered as project
participant (Yes/No)
Uganda Samaritan’s Purse Uganda (SPU) No
Germany Geschenke der Hoffnung e.V. No
Germany Klima ohne Grenzen
gemeinnützige GmbH (KoG)
No
Samaritan’s Purse Uganda (SPU) is the local branch of Samaritan's Purse (SP) an evangelical Christian
humanitarian organization based in the USA. Samaritan’s Purse has been active across Uganda since
the late 1990s. SPU is especially interested in ensuring access to safe drinking water supplies
accompanied by education in sanitation and hygiene. SPU is the project owner and the local contact in
Uganda. SPU is responsible for the implementation and monitoring of the project.
Geschenke der Hoffnung e.V. (GH) is a non-profit organization (NPO) based in Germany. It is part of
Samaritan's Purse global network. GH supports various community based projects in developing
countries.
Klima ohne Grenzen (KoG) is a non-profit organization (NPO) based in Germany. Its vision is a low-
carbon society. KoG follows this vision by fighting climate change and poverty together. With its
consulting services and its climate mitigation projects KoG supports individuals and public / private
entities in their efforts to address the challenges linked with climate change and poverty. KoG assists
SPU in developing the carbon program and markets the carbon credits (agreement signed August
2013).
A.3 Description of the micro-scale project activity:
A.3.1. Location of the micro-scale project activity:

3
A.3.1.1. Host Country:
The Republic of Uganda
A.3.1.2. Region/State/Province etc.:
Western Region, Isingiro District, Masha sub-county
A.3.1.3. City/Town/Community etc:
The project boundary includes the following villages and towns:
No Village No Village
1 Nyakakoni A 23 Buyonzwa
2 Nyakakoni B 24 Nyamitanga
3 Nyakakoni C 25 Rumuri
4 Masha 26 Kakyeka
5 Rwembogo 27 Nyabushozi
6 Kyenyangi 28 Rwakahunde
7 Nyabweshongoza 29 Nyamitsindo
8 Butenga I 30 Rwenyanga
9 Butenga II 31 Kyekyakyire
10 Kyabutoto 32 Kakuuto A
11 Rutsya 33 Kakuuto B
12 Kabare I 34 Rwendenzi
13 Kabare II 35 Rwenshebashebe
14 Kishuro 36 Rukuuba
15 Nyarubungo I 37 Nyamabare
16 Nyarubungo II 38 Akafunda
17 Nyakasharara 39 Kiyenje (Kabaare V)
18 Omukabare 40 Nyakabungo (Kabaare II)
19 Igyereka 41 Karubanda (Kabaare IV)
20 Ruyonza 42 Rubeeho (Kabaare VI)
21 Rwengando 43 Kaganda (Kabaare VII)
22 Katerera 44 Omukabare II

4
A.3.1.4. Details of physical location, including information allowing the
unique identification of this micro-scale project activity:
Masha sub-county is located in the northwestern corner of the Isingiro district.
Country Region District Sub-county Geographical Reference
Uganda Western
Region
Isingiro Masha Masha Village
S 00º 43.126', E 030º 43.906'
Map 1: Regions and districts of Uganda

5
Map 2: Isingiro District (green line) and Masha sub-county (purple)
A.3.2. Description including technology and/or measure of the micro-scale project activity:
This micro-scale project activity will distribute 3,000 BioSand Filters (BSFs) in various small community
based projects in the Masha sub-county of the Isingiro District of Uganda’s Western Region. The BSFs
will displace the combustion of fire wood used to purify water in the absence of the project activity.
The organization implementing and supervising the project on-site in Uganda is Samaritan’s Purse
Uganda (SPU) which will guide the manufacturing process and the installation of the BSFs. In its work,
Samaritan’s Purse Uganda especially focuses on the provision of safe water as well as sanitation and
hygiene education. The organization already runs several projects concerning safe water provision in
Uganda, in the context of which it has also provided BSFs to rural communities in Northern Uganda.
Samaritan’s purse Uganda is thus experienced in manufacturing and distributing BSFs in rural Uganda.
With the BSF each family receives a jerry can so that the clean storage of the filtered water is secured.
Additionally, the beneficiaries are provided with a sanitation and hygiene training, teaching them how
to protect the filtered water from recontamination.
The BSFs distributed by the project activity will be produced and distributed locally. SPU´s trained staff
will build the filters in the villages and install them. SPU´s will monitor the usage of the filters within
the project period. The beneficiaries (poor households) will contribute to the manufacturing of the
filters by assisting to source locally and for free available materials (e.g. sand, gravel) needed for the
construction of the BSFs. Since the BSFs are constructed in the villages, the costs as well as the

6
emissions caused by transportation of material are kept low. GHG emissions arising from production,
transport, installation and delivery will not reach 5% or more of the overall emissions.
Most of the production material is sourced locally. Therefore the transportation of these materials is
no major source of GHG emissions. The construction of the concrete filter container (~100kg) leads to
GHG emissions of less than 20 kg CO2e. (Online database ProBas (concrete): 107 kgCO2e/t)1
The majority of the beneficiaries live close to a production site and can use trolleys provided by the
project to transport the filters to their homes. Only a few filters are delivered by a truck.
The beneficiaries do not have to pay for receiving a filter. The distribution and installation of the BSFs
is financed by donations from SP Uganda´s partner Geschenke der Hoffnung and by marketing carbon
credits. Geschenke der Hoffnung and Klima ohne Grenzen signed the agreement (PIN) to partly finance
the project by marketing carbon credits in August 2013. SP Uganda was only able to go ahead with the
project since KoG agreed in this document to finance the BSF with revenues from the carbon market.
(PIN – BioSand Filter Project, Western Uganda – Carbon Credit Program” / section 1: “Klima ohne
Grenzen (KoG) will financially support this project with proceeds from the sale of carbon credits.
Without this financial support the project cannot be implemented due to the lack of funds.”)
1 http://www.probas.umweltbundesamt.de/php/prozessdetails.php?id={707E23CA-304F-485C-
83A6-90C0A0F1BAA6}

7
Picture 1: Beneficiaries with BSF
Picture 2: BSF construction
Picture 3: Labeling filters
Applied technology

8
The BioSand Water Filter is an adaptation of slow-sand filtration that is designed for use by families at
the household level. This award-winning water filtration technology was developed by Dr. David Manz,
a former University of Calgary professor. BSFs are an established water treatment system and are used
and supported by internationally active NGOs such as, for example, UNICEF and WHO, or the non-
profit entity CAWST2,3
. They have successfully been used as water treatment systems in communities
for more than two decades and have been documented to be an effective water treatment
technology4,5,6
. The filter removes organisms responsible for diseases spread by water, such as cholera,
typhoid fever, and amoebic dysentery. The filter also strains out particles causing cloudiness, and much
of the organic matter responsible for taste, color and odor.
From start to finish the filters can be constructed in roughly 10 days. The filter is very durable7,
constructed from concrete, sand, gravel, and PVC piping. These materials can be found in almost every
country and enable community members to help construct the filters on location.
Picture 4: BSF components (CAWST 2009)
Water is poured into the top of the filter and flows down through sand. Water that requires filtration
usually contains various types of organic matter, sediment, and living organisms. The water first passes
through the diffuser plate, which reduces the disruptive force of the input water and large debris, and
protects a delicate biological layer. The filter sand functions as a physical barrier that traps particles
and larger organisms, causing them to accumulate in the uppermost layers of the filter. Organic
2 Huisman & Wood. 1974. “Slow Sand Filtration”. WHO. 3 Clasen. 2009. “Scaling up household water treatment among low-income populations”. WHO.
4 Clasen, WHO. “Scaling up household water treatment among low-income populations”. 2009.
5 Hijnen at al. “Quantitative assessment of the removal of indicator bacteria in full-scale treatment
plants”. 2004. 6 Liang et al. “Improving Household Drinking Water Quality. Water and Sanitation Program”. 2010. 7 CAWST: Estimated Lifespan 30+ years (http://biosandfilters.info/technical/fact-sheet-biosand-
filter) Liang et al. “Improving Household Drinking Water Quality. Water and Sanitation Program”.
2010. (p.14, Fig. 4)

9
material and organisms caught in the sand eventually develop into a dense population referred to as
the biological layer. As the water passes through the biological layer, microbial contaminants such as
parasites, bacteria, viruses, and organic contaminants are consumed by the organisms. The filter is
designed to hold water above the top of the sand to sustain the biological layer while the filter water is
not in use. This provides the constant aquatic environment that is necessary for the organisms present
in the biological layer to survive. The fine sand acts as a microscopic sedimentation bed as the water
passes through the filter, helping remove cloudiness, odor, taste, and harmful micro-organisms from
the water. The size and shape of the sand grains are critical to the formation of the biological layer and
therefore the effectiveness of the filter. Sand is specifically selected and prepared to achieve proper
filtration. By the time the water reaches the layers of coarse sand and gravel at the bottom of the filter,
95 to 99.0 per cent of microbial contaminants have been eliminated by the BioSand Water Filter. The
filtered water flows out of the spout and is collected in a safe storage container to prevent post-
treatment contamination. The average flow rate of the filter is one litre per minute, which allows for
60 litres to be filtered per hour, enough to provide a family of eight with sufficient water for their daily
drinking, cooking, cleaning, and hygiene needs.
As the filter is used, the biological layer matures and thickens, causing the flow of water through the
filter to slow. Recipients of filters are trained to watch for decreased flow and can renew the filter
simply by skimming off any debris from the top of the sand, and by gently stirring the sand to break-up
the biological layer. The quality of source water will determine how often this process is necessary.
The project region
The Isingiro District consists of 10 sub-counties. According to the Uganda Water Supply Atlas 20168 in
the Isingiro district only 33% of the population has access to safe water supply services. The access
rates vary between 9% in the Insigiro TC sub-county and 74% in the Kabuyanda sub-county. The access
rate of people in Masha sub-county of 21% is one of the lowest in the district (see ANNEX 10). In
addition, there are reasons to assume that in general the actual number of people who make use of
the access to water supply services in everyday life is even lower. This is due to the fact that people
have to walk long distances to reach the safe water suppliesWalking of long distances is time-
consuming and carrying water over long distances is hard physical labor, especially for girls and women.
People thus often draw on unsafe water supplies such as ponds or surface water closer to their homes.
8 http://www.wateruganda.com/index.php/reports/district/18, accessed 28th April 2016 (see
ANNEX 10)

10
Picture 5: Water source distribution - Masha sub-county (Source: Uganda water supply atlas 2010)
The consumption of unsafe water leads to health problems, such as infections and diarrhea caused by
E. coli bacteria. According to the World Health Organization (WHO)11
, 88% of diarrheal diseases
worldwide are attributed to unsafe water supply, while 1.8 million people die every year from
diarrheal diseases (90% of which are children below the age of five). In Uganda, 90 out of 1000
children die below the age of 512
. Consequently, a large percentage of the Ugandan population boils
their water to purify it before consumption. Uganda Demographic and Health Survey (2011): Rural
households boil their drinking water (38 percent) or do not treat their drinking water (59 percent).13
Boiling of water is usually done on a three-stone fire using firewood as fuel. According to the Uganda
National Household Survey 2009/201014
, 82.1% of the Western Ugandan population uses a traditional
three-stone fire for cooking and 10.1% an open charcoal stove. Similarly, the survey shows that 84.2%
of the Western Ugandan population uses firewood for cooking and boiling of water and 10.8% charcoal.
During the combustion of these non-renewable biomasses (firewood and charcoal) greenhouse gases
(GHG) are released. GHG, especially carbon dioxide (CO2), Methane (CH4), and Nitrous oxide (N2O), are
known to have increased due to human activity and cause climate change. Furthermore, the steady
demand of firewood for cooking and the boiling of water makes it necessary to cut down trees and
contributes a large part to deforestation in Uganda. Deforestation also has a negative impact on
climate change (forests store CO2) resulting in a loss of storage capacity of the forests and leading to
erosion and destruction of eco-systems. In Uganda, the fraction of non-renewable biomass is 82%15
.
Finally, the combustion of firewood and charcoal and as a consequence thereof the permanent
exposure to smoke poses a severe threat to peoples’ health. As shown by the Global Burden of Disease
11
WHO. “Water, Sanitation and Hygiene Links to Health - Facts and Figures 2004”. 12
UNICEF country statistics Uganda. 13
https://www.usaid.gov/sites/default/files/documents/1860/Uganda_Demographic_and_Health_
Survey_2011.pdf, (Chapter 2: Housing Charateristics and Household Population, p.12) 14
Uganda Bureau of Statistics. “Uganda National Household Survey 2009/2010”, Chapter 9.5.3. 15 UNFCCC-Default values of fraction of non-renewable biomass
http://cdm.unfccc.int/DNA/fNRB/index.html

11
Study 201016
, the exposure to smoke is the fourth worse risk factor for diseases in developing
countries. According to a study recently released by the WHO, 4.3 million people worldwide died in
2012 resulting from household air pollution. Thereof, almost 600,000 deaths occurred in Africa alone17
.
Apart from the threatening effect that boiling on open fires and charcoal stoves has on the
environment and people’s health, it also directly impacts people’s social and economic everyday life.
Especially girls and women are engaged in collecting firewood and spend a lot of time for these time-
consuming activities. Women in Western Uganda spend on average 35.6 hours per week on care labor
activities (including cooking, fetching water, fetching firewood and taking care of children)18
. This
keeps many women from being productive in income-generating activities and thus negatively affects
the economic situation of families in a region where 22.3% of the rural population lives in poverty19.
Furthermore, not having access to SDW forces some families to spend a large proportion of their
income on firewood and charcoal if they want to avoid getting sick from drinking contaminated water.
The positive effects caused by the activity of this project will help to achieve targets of several
Millennium Goal’s (MG) concerned with environmental sustainability (MG7, especially Target 7C
“Halve, by 2015, the proportion of the population without sustainable access to safe drinking water
and basic sanitation”20
) and child mortality (MG 4). By supplying SDW the project will also improve
people’s health in general and thus also support MG5 (improve maternal health). Finally, gender
equality and empowerment of women (MG3) is supported, since girls and women have to spend less
time on care labor activities and are thus free to pursue economic activities or education.
Project objectives
The project activity will
• install 3,000 BSFs,
• distribute 3,000 safe water storage container,
• provide safe water to approximately 15,000 people and safe 3,853 tCO2e per year,
• ensure proper usage of the BSFs, and
• educate 3,000 households in proper hygiene and sanitation practices.
Contribution to Sustainable Development
In summary, the project contributes to sustainable environmental, social, and economic development
in the Isingiro District in the following ways:
16
WHO. “Global Burden of Disease Study 2010” 17
WHO. “Burden of disease from Household Air Pollution for 2012” 18
Uganda Bureau of Statistics. “Uganda National Household Survey 2005/2006”, Table 4.10 19
Uganda Bureau of Statistics. “Uganda National Household Survey 2009/2010”, Table 6.8 20
http://www.un.org/millenniumgoals/environ.shtml

12
Environmental benefits
• Reduction of the consumption of non-renewable biomass, especially firewood, by making it
unnecessary to boil water before consumption.
• Reduction of greenhouse gas emissions.
• Protection of forest through prevention of deforestation and thus erosion. Less trees will be cut
down, because of lower firewood demand.
Social benefits
• Time benefits especially for girls and women: less time spent collecting firewood as well as
carrying and purifying the water. Increases possibility for girls to attend school and for women
to pursue economic activities.
• Less money spent on firewood/charcoal.
Benefits to health:
• Less infections and diarrhea caused by contaminated water.
• Less respiratory disease and lower health risk, because of reduction of smoke resulting in
better indoor air quality.
Economic benefits
• Employment for local population in building, distributing, and maintaining the BSFs.
• Potentially improving economic situation for women, because more time can be spent in
economic activities.
A.3.3 Estimated amount of emission reductions over the chosen crediting period:
The estimated amount of emission reductions over the crediting period of the project are the
following:
Year Estimated emission reduction in tCO2e
1 3,853
2 3,853
3 3,853
4 3,853
5 3,853
6 3,853
7 3,853

13
8 3,853
9 3,853
10 3,853
Total estimated ER 38,530
Average ER / year 3,853
A.3.4. Public funding of the micro-scale project activity:
The micro-scale project activity does not receive any public funding. Should public funding be received
by the PDD, it will be confirmed that this does not result in division of official development assistance
(ODA). For the ODA declaration see Annex 2.
SECTION B. Application of an existing baseline and monitoring methodology or of a new
methodology submitted as part of this project activity
B.1. Title and reference of the existing or new baseline and monitoring methodology applied to
the micro-scale project activity:
The project applies the Gold Standard baseline and monitoring methodology Technologies and
Practices to Displace Decentralized Thermal Energy Consumption, Version 1.0 (11/04/2011). Reference
is the Gold Standard website. 21
B.2 Justification of the choice of the methodology and applicability:
The choice of the methodology is justified as shown in the table below. All the requirements of this
methodology are applicable to the installation of BSFs.
Requirement of applied methodology Justification
This methodology is applicable to programs or
activities introducing technologies and/or
practices that reduce or displace greenhouse gas
(GHG) emissions from the thermal energy
consumption of households and non-domestic
premises.
The project activity will install point-of-use water
purification systems which provide safe drinking
water (SDW). The installed technology will
displace the combustion of fire wood used to
purify water in the absence of the project activity.
The project boundary can be clearly identified,
and the technologies counted in the project are
not included in another voluntary market or CDM
The project boundary includes domestic
households in the Masha sub-county. Each BSF
has a unique identification number which will be
21 http://www.cdmgoldstandard.org/wp-
content/uploads/2011/10/GS_110411_TPDDTEC_Methodology.pdf

14
project activity (i.e. no double counting takes
place). Project proponents must have a survey
mechanism in place together with appropriate
mitigation measures so as to prevent double-
counting in case of another similar activity with
some of the target area in common.
registered in order to prevent double counting. At
the time of installation of the BSFs it is ensured
that only households that currently boil water for
purification or us unsafe water receive a filter.
The technologies each have continuous useful
energy outputs of less than 150kW per unit
(defined as total energy delivered usefully from
start to end of operation of a unit divided by time
of operation). For technologies or practices that
do not deliver thermal energy in the project
scenario but only displace thermal energy
supplied in the baseline scenario, the 150kW
threshold applies to the displaced baseline
technology.
The BSFs do not deliver any thermal energy. In
the baseline, thermal energy is provided by
means of woody biomass to boil water. The
thermal energy displaced by the baseline
technology is below 150kW.
Power delivered by a three stone open fire: 1.16
kW (Uganda´s Ministry of Energy and Mineral
Development)22
The use of the baseline technology as a backup or
auxiliary technology in parallel with the improved
technology introduced by the project activity is
permitted as long as a mechanism is put into
place to encourage the removal of the old
technology (e.g. discounted price for the
improved technology) and the definitive
discontinuity of its use. The project
documentation must provide a clear description
of the approach chosen and the monitoring plan
must allow for a good understanding of the
extent to which the baseline technology is still in
use after the introduction of the improved
technology, whether the existing baseline
technology is not surrendered at the time of the
introduction of the improved technology, or
whether a new baseline technology is acquired
and put to use by targeted end users during the
project crediting period – see section III. The
success of the mechanism put into place must
therefore be monitored, and the approach must
be adjusted if proven unsuccessful. If an old
technology remains in use in parallel with the
improved technology, corresponding emissions
must of course be accounted for as part of the
project emissions – see section II.5.
The project technology will displace traditional
three-stone-fires used for boiling water only (not
for cooking). Households can therefore not be
encouraged to abandon the combustion of
firewood completely, but will be encouraged to
not boil water anymore. The ex-ante assumption
is that 87.5% of households will abandon the
combustion of firewood for boiling water in the
project scenario. This will be monitored.
The project proponent must clearly communicate The project proponent will clearly communicate
22 Uganda´s Ministry of Energy and Mineral Development, A Comparison of Wood-Burning
Cookstoves for Uganda: Testing and Development, p.21

15
to all project participants the entity that is
claiming ownership rights of and selling the
emission reductions resulting from the project
activity. This must be communicated to the
technology producers and the retailers of the
improved technology or the renewable fuel in use
in the project situation by contract or clear
written assertions in the transaction paperwork,
If the claimants are not the project technology
end users, the end users should be notified that
they cannot claim for emission reductions from
the project.
to all project participants the entity that is
claiming ownership rights of and selling the
emission reductions resulting from the project
activity. The beneficiaries will be informed at the
point of installing the BSF. Each household
receiving a BSF will confirm in writing that it was
informed and that it will not claim for the
emission reductions of the project technology.
Project activities making use of a new biomass
feedstock in the project situation (e.g. shift from
non-renewable to green charcoal, plant oil or
renewable biomass briquettes) must comply with
relevant Gold Standard specific requirements for
biomass related project activities, as defined in
the latest version of the Gold Standard rules.
Not applicable.
Only end users that boil water or are currently
using unsafe water are eligible for crediting.
BSF will only be installed at households that
currently boil water or that currently consume
unsafe water.
The baseline scenario is the existing practice of
treating water for consumption by boiling using
high emission fuels including non-renewable
biomass and fossil fuels.
In the baseline scenario water is treated by
boiling it using non-renewable biomass.
B.3. Description of the project boundary:
The project is located in the Masha sub-county of the Isingiro district. The project boundary are the
villages listed in the table in section A.3.1.3., in which the BSF will be installed.
Geo-coordinates are recorded for each village where BSF are installed by the project activity.

16
B.4. Description of the baseline and its development as per the chosen methodology:
The baseline scenario is the current practice of boiling of water in order to purify it before
consumption. The baseline technology is an open three-stone fire using the non-renewable biomass
firewood. It is assumed that the quantity of water consumed per person and day in the baseline
scenario is subject to suppressed demand. Suppressed demand refers to the situation in which the
level of energy service is not sufficient to meet human development needs due to the lack of financial
means and/or access to modern energy infrastructure or recourses. This means that the project
population has to overcome many barriers in order to obtain SDW. These are above all obtaining
firewood and water for purification. Problems are the shortage of available firewood, and the lack of
time and/or money to obtain it. Therefore, as for the methodology used here, the quantity of water in
the baseline is measured using the project scenario circumstances, i.e. after the introduction of the
water purification technology. This quantity of water is assumed to be the amount of water per person
and day that would be consumed in absence of suppressed demand. This quantity will be measured
and monitored (see section B.7.)
The project activity introduces a new water purification technology (BSFs) which replaces the baseline
technology as means of water purification. Since the BSFs do not consume any fuel there is no longer
suppressed demand regarding firewood.
B.5. Description of how the anthropogenic emissions of GHG by sources are reduced below those
that would have occurred in the absence of the registered micro-scale project activity:
The following GHGs of the baseline scenario are included and reduced by the project activity:
Source Gas Included? Justification/Explanation
Baseline Combustion of fossil fuels
to purify water by boiling
CO2 Yes Important source of emission
CH4 Yes Important source of emission
N2O Yes Important source of emission
Source Gas Included? Justification/Explanation
Project Combustion of fossil fuels
to boil water already
treaded with the BSF
CO2 Yes Important source of emission
CH4 Yes Important source of emission
N2O Yes Important source of emission
GHG emissions arising from production, transport, installation and delivery will not reach 5% or more
of the overall emissions. Therefore, the project will include these GHG emissions in the project
scenario.
Most of the production material is sourced locally. Therefore the transportation of these materials is
no major source of GHG emissions. The construction of the concrete filter container (~100kg) leads to

17
GHG emissions of less than 20 kg CO2e. (Online database ProBas (concrete): 107 kgCO2e/t)23
The
majority of the beneficiaries live close to a production site and can use trolleys provided by the project
to transport the filters to their homes. Only a few filters are delivered by a truck.
The water purification technology introduced by the project activity replaces the boiling of water on
three-stone fires as water purification technology. The BSFs installed by the project technology do not
consume any fuel and therefore do not emit any GHG. The project activity will generate emission
reductions of 3,853 t CO2e per year. Thus, the GHG emissions will be reduced below those that would
have occurred in the absence of this project.
B.6 Emission reductions:
B.6.1. Explanation of methodological options or description of new proposed approach:
The Gold Standard methodology “Technologies and Practices to Displace Decentralized Thermal
Energy Consumption – 11/04/2011” was applied to estimate emission reductions. Annex 3 of the
methodology especially describes the application of the methodology to safe water supply project
scenarios. Detailed justification that this methodology is applicable to this project can be found in
section B.2.
1. Project Boundary
a.) Project Boundary
The project boundary is defined by the households of the project population using the BSF.
b.) Target Area
see A 3.1.3.
c.) Fuel Collection Area
The fuel collection area is the area around the villages listed under A.3.1.3
2. Baseline Scenario
The baseline scenario is the current practice of boiling of water in order to purify it before
consumption. A fixed baseline is applied since all units are installed at the start. It therefore
does not require continuous monitoring. (see methodology, p.6)
3. Emission sources included in the project boundary
The main source of emissions in the baseline scenario is the consumption of NRB. Values
required to calculate these baseline emissions are based on publicly available and verifiable
data.
23 http://www.probas.umweltbundesamt.de/php/prozessdetails.php?id={707E23CA-304F-485C-
83A6-90C0A0F1BAA6}

18
4. Project Scenario
The project scenario is the installation of BSFs in households.
5. Suppressed Demand
The concept of suppressed demand is applied.
6. Additionality
Only 21 percent of Masha population has access to safe water (see ANNEX 10).24
Whereas, safe
water is defined as water that does not contain biological or chemical agents directly
detrimental to health. It includes treated surface water and untreated but uncontaminated
water from protected springs, bore-holes, sanitary well, etc.25
Uganda´s government
additionally considers rain water as safe water.26
Masha´s population that has access to safe water gets this water in most cases from point
water sources like shallow wells , deep boreholes and rainwater harvesting tanks .27
The
project technology (BioSand Filters for point-of-use water treatment) has by far not been
adopted by ≥ 20% of the population (only 21 % of the population has access to safe water in
total). Therefore, the technology can be qualified as “first of its kind” and additional according
to the applied methodology.
7. Baseline Studies
A baseline non-renewable biomass (NRB) assessment was not contacted, since UNFCCC-Default
values are available.
“Uganda´s National Household Survey” and “Uganda´s water supply atlas” have been used as
main sources to evaluate target population characteristics, baseline technology use, fuel
consumption, leakage and sustainable development indicators.
In line with Annex 4 / footnote 53 a baseline performance field test was not contacted. Default
efficiency is applied to the baseline cooking technology.
8. Project Studies
The project survey of target population characteristics and the water consumption field test
will be submitted post registration, on time for the verification and prior to the request for
issuance. The Project Estimation of expected project emissions is supported by appropriate and
credible sources of information.
The emission reductions are calculated identifying the baseline (b) and project (p) fuel consumption
and on the basis of this the baseline and project emissions.
24 Uganda Water Supply Atlas online database (accessed April 27, 2016)
(http://www.wateruganda.com/) 25 UNICEF/WHO, Charting the Progress of Populations, Chapter X, p.71 26Uganda Bureau of Statistics. “Uganda National Household Survey 2009/2010”, p.121 27 Ministry of Water and Environment. “Uganda water supply atlas, Isingiro District Information
2010”

19
(1) Baseline Scenario Fuel Consumption Calculation:
Bp,y = (1 - Cj) * Nj,y * Wb,y * (Qj,y + Qj,rawboil,y)
(2) Baseline emissions:
BEb,y = Bb,y * ((fNRB,b,y * EFb,fuel,CO2) + EFb,fuel,nonCO2) * NCVb,fuel
(3) Project Scenario Fuel Consumption Calculation:
Bp,y = (1 - Cj) * Np,y * Wp,y * (Qp,rawboil,y + Qp,cleanboil,y)
(4) Project emissions:
PEp,y = Bp,y * ((fNRB,p,y * EFp,fuel,CO2) + EFp,fuel,nonCO2) * NCVp,fuel
(5) Emission Reductions:
ERy = (Σ BEb,y – Σ PEp,y) * Up,y – Σ LEp,y
B.6.2. Data and parameters that are available at validation:
Data / Parameter: Cj
Data unit: %
Description: Expressed as a percentage, this is the portion of users of the project technology
j who in the baseline were already consuming safe water without boiling it
Source of data used: Uganda Water Supply Atlas online database (accessed April 27, 2016) (see
ANNEX 10) (http://www.wateruganda.com/)
Value applied: 21.0%
Justification of the
choice of data or
description of
measurement
methods and
procedures actually
applied:
Any comment:
Data / Parameter: Wb,y
Data unit: t/l
Description: Quantity of fuel in tons required to treat 1 litre of water using technologies
representative of baseline scenario b during project year y, as per Baseline
Water Boiling Test.

20
Source of data used:
Value applied: 0.0002383
Justification of the
choice of data or
description of
measurement
methods and
procedures actually
applied:
This value can be calculated as follows:
SEC / NCVb,fuel
As per AMS-III.AV, the specific energy consumption required to boil one litre of
water is to be calculated as follows:
Any comment: For the calculation of SEC see Annex 3
Data / Parameter: fNRB,y
Data unit:
Description: Factor of non-renewable biomass
Source of data used: UNFCCC-Default values of fraction of non-renewable biomass
http://cdm.unfccc.int/DNA/fNRB/index.html
Value applied: 0.82
Justification of the
choice of data or
description of
measurement
methods and
procedures actually
applied:
Fraction of woody biomass used in the absence of the project activity in year y
that can be established as non-renewable as per the relevant provisions of
AMS-I.E “Switch from Non-Renewable Biomass for Thermal Applications by the
User” Version 05.0.
Any comment:
Data / Parameter: EFb,fuel,CO2
Data unit: tCO2/TJ
Description: CO2 emission factor of wood fuel

21
Source of data used: IPCC default value29
Value applied: 112
Justification of the
choice of data or
description of
measurement
methods and
procedures actually
applied:
IPCC default values provide an approved estimate of emission reductions;
deemed valid as per methodology.
Any comment:
Data / Parameter: EFb,fuel,CH4
Data unit: tCO2e
Description: CH4 emission factor of wood fuel
Source of data used: IPCC default value30
Value applied: 7.5 (0.300*25)
Justification of the
choice of data or
description of
measurement
methods and
procedures actually
applied:
IPCC default values provide an approved estimate of emission reductions;
deemed valid as per methodology.
Any comment:
Data / Parameter: EFb,fuel,N2O
Data unit: tCO2e
Description: N2O emission factor of wood fuel
Source of data used: IPCC default value31
29 IPCC Guidelines for National Greenhouse Gas Inventories, 2006, Volume 2: Stationary Combustion,
Table 2.5 30 IPCC Guidelines for National Greenhouse Gas Inventories, 2006, Volume 2: Stationary Combustion,
Table 2.5

22
Value applied: 1.192 (0.004*298)
Justification of the
choice of data or
description of
measurement
methods and
procedures actually
applied:
IPCC default values provide an approved estimate of emission reductions;
deemed valid as per methodology.
Any comment:
Data / Parameter: NCVb,fuel
Data unit: TJ/ton
Description: Net calorific value of wood fuel
Source of data used: Applied methodology p.15 / IPCC default value
Value applied: 0.015
Justification of the
choice of data or
description of
measurement
methods and
procedures actually
applied:
IPCC default values provide an approved estimate of emission reductions;
deemed valid as per methodology.
Any comment:
B.6.3 Ex-ante calculation of emission reductions:
Using the methodology Technologies and Practices to Displace Decentralized Thermal Energy
Consumption the emission reductions are calculated identifying the baseline (b) and project (p) fuel
consumption and on the basis of this the baseline and project emissions. The following calculations are
done in the following:
(1) Baseline Scenario Fuel Consumption Calculation:
Bp,y = (1 - Cj) * Nj,y * Wb,y * (Qj,y + Qj,rawboil,y)
31 IPCC Guidelines for National Greenhouse Gas Inventories, 2006, Volume 2: Stationary Combustion,
Table 2.5

23
(2) Baseline emissions:
BEb,y = Bb,y * ((fNRB,b,y * EFb,fuel,CO2) + EFb,fuel,nonCO2) * NCVb,fuel
(3) Project Scenario Fuel Consumption Calculation:
Bp,y = (1 - Cj) * Np,y * Wp,y * (Qp,rawboil,y + Qp,cleanboil,y)
(4) Project emissions:
PEp,y = Bp,y * ((fNRB,p,y * EFp,fuel,CO2) + EFp,fuel,nonCO2) * NCVp,fuel
(5) Emission Reductions:
ERy = (Σ BEb,y – Σ PEp,y) * Up,y – Σ LEp,y
Baseline Scenario Fuel Consumption Calculation
Bp,y = Number of person-days x Baseline Fuel used to Treat Water (T/L) x Total Safe Water consumed in
project scenario (L/p/d)
The quantity of fuel consumed in the baseline scenario b during the year y (Bb,y) shall be calculated as
follows:
Bp,y = (1 - Cj) * Nj,y * Wb,y * (Qj,y + Qj,rawboil,y)
Where:
Cj = Expressed as a percentage, this is the portion of users of the project technology
j who in the baseline were already consuming safe water without boiling it
Nj,y = Number of person.days consuming water supplied by project scenario p
through year y
Wb,y = Quantity of fuel in tons required to treat 1 litre of water using technologies
representative of baseline scenario b during project year y, as per Baseline
Water Boiling Test.
Qp,y = Quantity of safe water in litres consumed in the project scenario p and supplied
by project technology per person per day
Qp,rawboil,y = Quantity of raw water boiled in the project scenario p per person per day
Cj Expressed as a percentage, this is the portion of users of the project technology j who in the
baseline were already consuming safe water without boiling it
At the point of installation of the BSF it will be ensured that only households are included in the project
activity that previously did not have access to SDW without boiling it before consumption.

24
In line with the WHO “Guidelines for drinking – water quality” (section 5.3)32
intermediate or optimal
access (see following table) to a safe source of water is required. In addition, the flow at the source
should not be characterised by daily or weekly interruptions.
Table 1: Service level of SDW + intervention priority/actions (source: WHO33
)
Nj,y Number of person.days consuming water supplied by project scenario p through year y
According to a study34
of the Uganda Bureau of Statistics the average household size in Western
Uganda is 5.1. The project activity will install 3,000 BSFs. Through one year Nj,y thus is 5,584,500
person.days. This value will be obtained prior to the first verification by means of project survey.
Wb,y Quantity of fuel in tons required to treat 1 litre of water using technologies representative of
baseline scenario b during project year y
The specific energy consumption required to boil one litre of water (SEC) is commonly calculated as
as per AMS-III.AV using default values (for the
calculation of SEC refer to Annex 3). Divided by the net calorific value of wood fuel that is substituted
32 http://apps.who.int/iris/bitstream/10665/44584/1/9789241548151_eng.pdf 33 http://apps.who.int/iris/bitstream/10665/44584/1/9789241548151_eng.pdf 34 Uganda Bureau of Statistics, Uganda National Household Survey 2009/2010, Table 2.6

25
or reduced (NCVb,fuel), for which an IPCC default value of 0.015 TJ/ton can be used, it gives the quantity
of wood fuel required to boil 1 litre of water with baseline technology.
As per the methodology, the total safe water consumed in the project scenario is the amount of safe
water supplied by the project technology and consumed in the project scenario, plus the amount of
raw water boiled after introducing the project technology (respectively represented below as Qp,y +
Qp,rawboil,y). This total is assumed to be equivalent to water boiled in the baseline.
Qp,y Quantity of safe water in litres consumed in the project scenario p and supplied by project
technology per person per day
Based on the experiences of the project owner gained through the implementation of comparable
projects, the average quantity of water needed per person per day is 3.0 L. This value will be assessed
prior to the first verification by means of the Water Consumption Field Test (WCFT).
The quantity of treated water is assumed to underlie suppressed demand, meaning that the quantity
of water consumed per person per day would be higher if barriers, such as gathering firewood or
fetching water, would be removed.
Qj,rawboil,y Quantity of raw water boiled in the project scenario p per person per day
It is assumed that after the installation of the BSFs none of the households adapting the technology
will boiled water for purification. However, studies on BSFs indicate that the rate of acceptability of the
BSFs by the beneficiaries is 87.5%.35
This value will be monitored. The drop off rate of 12.5% will be
accounted for in the parameter Up,y in the overall calculation of emission reductions.
The parameter applied in the project activity are the following:
Parameter Application within project Value Data source
Cj BSF are only installed at households that do not
have access to SDW without boiling
21 % Uganda Water Supply
Atlas online database
(accessed April 27, 2016)
Nj,y Total number of people supplied by BSF (= number
of people per household multiplied by the number
of filters) multiplied by the number of days/year the
5,584,500 No. of persons/household:
5.1 (official data36
)
35 Liang et al. “Improving Household Drinking Water Quality. Water and Sanitation Program”. 2010.,
p.14 36 Uganda Bureau of Statistics, Uganda National Household Survey 2009/2010, Table 2.6

26
BSF are in use 365 days/year
Wb,y Amount of wood used to boil 1 litre of water 0.0002383 t Calculated: SEC / NCVb,fuel
SEC Specific energy consumption required to boil one
litre of water
3,574.8 kJ/L Calculated as per AMS-
III.AV
Qp,y Quantity of water per person per day used in the
project scenario
3.0 L Estimated value based on
experience gained through
comparable projects in the
region
Qp,rawboil,y Quantity of water still boiled after the introduction
of the project technology
0 L Technology training
Baseline emissions
Baseline emissions are calculated as follows:
BEb,y = Bb,y * ((fNRB,b,y * EFb,fuel,CO2) + EFb,fuel,nonCO2) * NCVb,fuel
Where:
Bb,y = Quantity of fuel consumed in baseline scenario b during year y, in tons, as per
by-default factors
fNRB,b,y = Fraction of biomass used during year y for the considered scenario that can be
established as non-renewable biomass
EFb,fuel,CO2 = CO2 emission factor of the fuel that is substituted or reduced. 112 tCO2/TJ for
Wood/Wood Waste, or the IPCC default value of other relevant fuel
EFb,fuel,nonCO2 = Non-CO2 emission factor of the fuel that is substituted or reduced
NCVb,fuel = Net calorific value of the fuel that is substituted or reduced (IPCC default for
wood fuel, 0.015 TJ/ton)
Parameter Application within project Value Data source
Bb,y Quantity of wood fuel consumed in baseline
scenario b during year y, in tons
Calculated (see above)
fNRB,b,y Fraction of non-renewable biomass used in year y 0.82 UNFCCC-Default value37
EFb,fuel,CO2 CO2 emission factor of the wood fuel 112 tCO2/TJ IPCC default value
37 http://cdm.unfccc.int/DNA/fNRB/index.html

27
EFb,fuel,CH4 CH4 emission factor of wood fuel 7.5 tCO2e/TJ IPCC default value
EFb,fuel,N2O N2O emission factor of wood fuel 1.192 tCO2e/TJ IPCC default value
EFb,fuel,nonCO2 Non-CO2 emission factor of the wood fuel
(EFb,fuel,CH4 + EFb,fuel,N2O)
8.695 tCO2e/TJ IPCC default value
NCVb,fuel Net calorific value of wood fuel 0.015 TJ/t IPCC default value
Project Scenario Fuel Consumption Calculation
Bp,y = Number of person.days x Project Fuel used to boil water (T/L) x Total volume of water boiled in
project scenario (L/p/d)
The quantity of fuel consumed in the project scenario p during the year y (Bp,y) shall be calculated as
follows:
Bp,y = (1 - Cj) * Np,y * Wp,y * (Qp,rawboil,y + Qp,cleanboil,y)
Where:
Cj = Expressed as a percentage, this is the portion of users of the project technology
or j who in the baseline were already consuming safe water without boiling it
Np,y = Number of person.days consuming water supplied by project scenario p
through year y
Wp,y = Quantity of fuel in tons required to treat 1 litre of water using technologies
representative of the project scenario p during project year y
Qj,rawboil,y = Quantity of raw water boiled in the project scenario p per person per day
Qp,cleanboil,y = Quantity of safe water boiled in the project scenario p per person per day
Cj Expressed as a percentage, this is the portion of users of the project technology j who in the
baseline were already consuming safe water without boiling it
At the point of installation of the BSF it will be ensured that only households are included in the project
activity that previously did not have access to SDW without boiling it before consumption.

28
In line with the WHO “Guidelines for drinking – water quality” (section 5.3)38
intermediate or optimal
access (see following table) to a safe source of water is required. In addition, the flow at the source
should not be characterised by daily or weekly interruptions.
Table 2: Service level of SDW + intervention priority/actions (source: WHO39
)
Qp,rawboil,y Quantity of raw water boiled in the project scenario p per person per day
It is assumed that after the installation of the BSFs none of the households adapting the technology
will boiled water for purification. This parameter will be included in the monitoring.
Qp,cleanboil,y Quantity of safe water boiled in the project scenario p per person per day
It is assumed that no household using the BSF as means of water purification will additionally boil the
purified water for purification. This will be part of the technology training and will be monitored.
Project Emissions
PEp,y = Bp,y * ((fNRB,p,y * EFp,fuel,CO2) + EFp,fuel,nonCO2) * NCVp,fuel
38 http://apps.who.int/iris/bitstream/10665/44584/1/9789241548151_eng.pdf, p.83ff 39 http://apps.who.int/iris/bitstream/10665/44584/1/9789241548151_eng.pdf, p.83ff

29
Where:
Bp,y = Quantity of fuel consumed in project scenario p during year y, in tons, as per
by-default factors
Remaining parameters are defined as in the calculation of the baseline emissions above.
Leakage
The core methodology requires to investigate the following potential sources of leakage. However, not
all potential sources are applicable for the installation of BSF.
a) The displaced baseline technologies are reused outside the project boundary in place of lower
emitting technology or in a manner suggesting more usage than would have occurred in the
absence of the project.
Wood fuel is the main source of energy for cooking and boiling water everywhere in rural Uganda. The
project activity only replaces the boiling of water for purification before consumption. The baseline
technology, the three-stone fire, is still used for cooking and is therefore not displaced completely.
It is highly unlikely that the installation of the project technology will influence the consumption
behaviour of any household outside the project boundary.
b) The non-renewable biomass or fossil fuels saved under the project activity are used by non-
project users who previously used lower emitting energy sources.
Firewood is used for cooking and boiling water by almost all households within the project boundary.
Since the project technology only replaces the wood fuel used for boiling water the beneficiaries’
households will still use firewood for cooking. It is therefore highly unlikely that the NRB saved due to
the project activity will influence any households’ cooking behaviour or cause any change in fuel.
c) The project significantly impacts the NRB fraction within an area where other CDM or VER
project activities account for NRB fraction in their baseline scenario.
Due to the small size of the project activity (installation of 3,000 BSFs), it is highly unlikely that the
project significantly influences the NRB fraction of the area.

30
d) The project population compensates for loss of the space heating effect of inefficient technology
by adopting some other form of heating or by retaining some use of inefficient technology.
Not applicable, since the replaced technology (three-stone fire) does not serve as a space heating.
e) By virtue of promotion and marketing of a new technology with high efficiency, the project
stimulates substitution within households who commonly used a technology with relatively
lower emissions, in cases where such a trend is not eligible as an evolving baseline.
The project activity includes via selection only households that use a three-stone fire for boiling water
as purification treatment. The substitution of a technology with relatively lower emissions by the
project activity is therefore excluded.
Emission Reductions
ERy = (Σ BEb,y – Σ PEp,y) * Up,y – Σ LEp,y
Where:
Up,y = Cumulative usage rate for technologies in project scenario p during year y,
based on cumulative installation rate and drop off rate.
The parameter Up,y describes the usage rate of the BSF. A study on BSFs40
has shown that 87.5% of the
BSFs are accepted and continuously used by the beneficiaries.
B.6.4 Summary of the ex-ante estimation of emission reductions:
The baseline emissions and the estimated emission reductions are the following:
40 Liang et al. 2010. Improving Household Drinking Water Quality. Water and Sanitation Program, p.14

31
Year Estimation of
project activity
emission (tCO2)
Estimation of
baseline
emissions
(tCO2)
Estimation of
leakage (tCO2)
Estimation of
overall emission
reductions
(tCO2)
1 0 3,853 0 3,853
2 0 3,853 0 3,853
3 0 3,853 0 3,853
4 0 3,853 0 3,853
5 0 3,853 0 3,853
6 0 3,853 0 3,853
7 0 3,853 0 3,853
8 0 3,853 0 3,853
9 0 3,853 0 3,853
10 0 3,853 0 3,853
Total (tCO2) 0 38,530 0 38,530
B.7 Application of a monitoring methodology and description of the monitoring plan as per the
existing or new methodology applied to the micro-scale project activity:
B.7.1 Data and parameters monitored:
Data / Parameter: Qp,y
Data unit: Litres per person per day
Description: Quantity of safe water in litres consumed in the project scenario p and supplied
by project technology per person per day
Source of data to be
used:
Water consumption field test (WCFT)
Monitoring As per WCFT/WCFT updates

32
frequency:
QA/QC procedures
to be applied:
Random sampling test as outlined in the General Guidelines for Sampling and
Surveys for Small-scale CDM Project Activities, V 0142
Any comment:
Data / Parameter: Qp,rawboil,y
Data unit: Litres per person per day
Description: The raw or unsafe water that is still boiled after installation of the water
treatment technology
Source of data to be
used:
Water consumption field test (WCFT)
Monitoring
frequency:
As per WCFT/WCFT updates
QA/QC procedures
to be applied:
Random sampling test as outlined in the General Guidelines for Sampling and
Surveys for Small-scale CDM Project Activities, V 01.
Any comment:
Data / Parameter: Qp,cleanboil,y
Data unit: Litres per person per day
Description: Quantity of safe (treated, or from safe supply) water boiled in the project
scenario p, after installation of project technology
Source of data to be
used:
Water consumption field test (WCFT)
Monitoring
frequency:
As per WCFT/WCFT updates
QA/QC procedures
to be applied:
Random sampling test as outlined in the General Guidelines for Sampling and
Surveys for Small-scale CDM Project Activities, V 01.
Any comment:
42 http://cdm.unfccc.int/Reference/Guidclarif/ssc/methSSC_guid20.pdf

33
Data / Parameter: Quality of the treated water
Data unit: %
Description: Performance of the BSF shall be tested in accordance with national standards
or the WHO’s Health Based Targets and Microbiological Specifications
document’. Only samples that meet Uganda´s standard on treated water
quality or the ”highly protective level” performance requirements as outlined
in Table 1, page 7 of the WHO´s Health Based Targets and Microbiological
Specifications document will pass the water quality test.
[If available, testing in a laboratory might be used instead of the field test. A
credible 3rd
party endorsement will be submitted with the monitoring report.]
Source of data to be
used:
Monitoring
frequency:
As per WCFT/WCFT updates
QA/QC procedures
to be applied:
Any comment: (Please refer to section B.7.2)
Data / Parameter: Up,y
Data unit: Percentage
Description: Usage rate in project scenario p during year y. As part of the usage survey BSF
users will be asked to demonstrate the use of the filter. Only users that are able
to successfully demonstrate this are regarded as regular users.
Source of data to be
used:
Usage survey
Monitoring
frequency:
The usage survey is conducted annually.
QA/QC procedures
to be applied:
Sampling test. Transparent data analysis and reporting.
Since all BSF are installed within 2 years (25.2.2016 – 01.12.2015) and the
lifetime of the BSF is >10 years samples of different age groups are not
required.
Any comment:

34
Data / Parameter: Np,y
Data unit: Person.days
Description: Number of persons consuming water supplied by project scenario p through
year y
Source of data to be
used:
Project / monitoring survey
Monitoring
frequency:
The survey is conducted annually.
QA/QC procedures
to be applied:
Sampling test. Transparent data analysis and reporting.
Any comment:
Data / Parameter: LEp,y
Data unit: tCO2e per year
Description: Leakage in project scenario p during year y
Source of data to be
used:
Monitoring
frequency:
N/A (see section B.7.2)
QA/QC procedures
to be applied:
Any comment:
B.7.2 Description of the monitoring plan:
The monitoring will follow the rules stated in “A3.3 Application of the Monitoring Methodology for
Water Treatment Scenarios” (p.38 39) of the applied Gold Standard methodology “Technologies and
Practices to Displace Decentralized Thermal Energy Consumption – 11/04/2011”.

35
Project preparation and
monitoring schedule
Prior to
validation
Prior to first
verification
Annual: after first
verification
Every two years:
after first verification
A. Project studies
A.1 NRB assessment x
A.2 Project & usage
survey
x
A.3 Water consumption
field test (WCFT)
X
B. Ongoing monitoring
tasks
B.1 Maintenance of total
installation record &
project database
continuous
B.2 Monitoring & usage
survey
x
B.3 WCFT updates x
B.4 Leakage assessment x
B.5 Updating NRB
assessments
N/A N/A N/A
C. Quality assurance &
control
continuous
Table 3: Project and monitoring schedule
A. Project studies – (completed prior to first verification)
Project studies are conducted prior to first verification of achieved emission reductions. This approach
uses ex-post project studies from which fuel consumption in the baseline scenario is back-calculated.
1. Project non-renewable biomass (NRB) assessment – (completed prior to first verification)
The NRB assessment is based on the most recent default values published by the UNFCCC at:
http://cdm.unfccc.int/DNA/fNRB/index.html
2. Project & usage survey – (completed prior to first verification)
The project survey provides information on user characteristics, baseline technology use and
sustainable development indicators. The usage survey provides a single usage parameter based on
drop off rates.
36
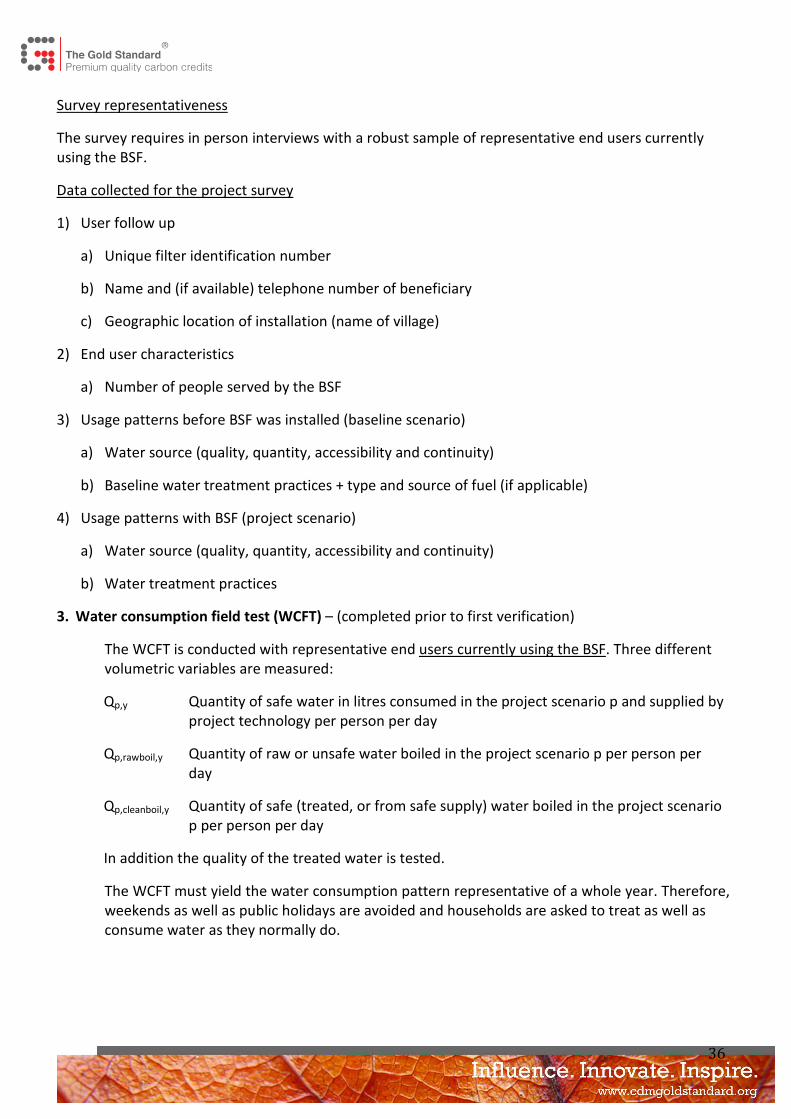
Survey representativeness
The survey requires in person interviews with a robust sample of representative end users currently
using the BSF.
Data collected for the project survey
1) User follow up
a) Unique filter identification number
b) Name and (if available) telephone number of beneficiary
c) Geographic location of installation (name of village)
2) End user characteristics
a) Number of people served by the BSF
3) Usage patterns before BSF was installed (baseline scenario)
a) Water source (quality, quantity, accessibility and continuity)
b) Baseline water treatment practices + type and source of fuel (if applicable)
4) Usage patterns with BSF (project scenario)
a) Water source (quality, quantity, accessibility and continuity)
b) Water treatment practices
3. Water consumption field test (WCFT) – (completed prior to first verification)
The WCFT is conducted with representative end users currently using the BSF. Three different
volumetric variables are measured:
Qp,y Quantity of safe water in litres consumed in the project scenario p and supplied by
project technology per person per day
Qp,rawboil,y Quantity of raw or unsafe water boiled in the project scenario p per person per
day
Qp,cleanboil,y Quantity of safe (treated, or from safe supply) water boiled in the project scenario
p per person per day
In addition the quality of the treated water is tested.
The WCFT must yield the water consumption pattern representative of a whole year. Therefore,
weekends as well as public holidays are avoided and households are asked to treat as well as
consume water as they normally do.
37
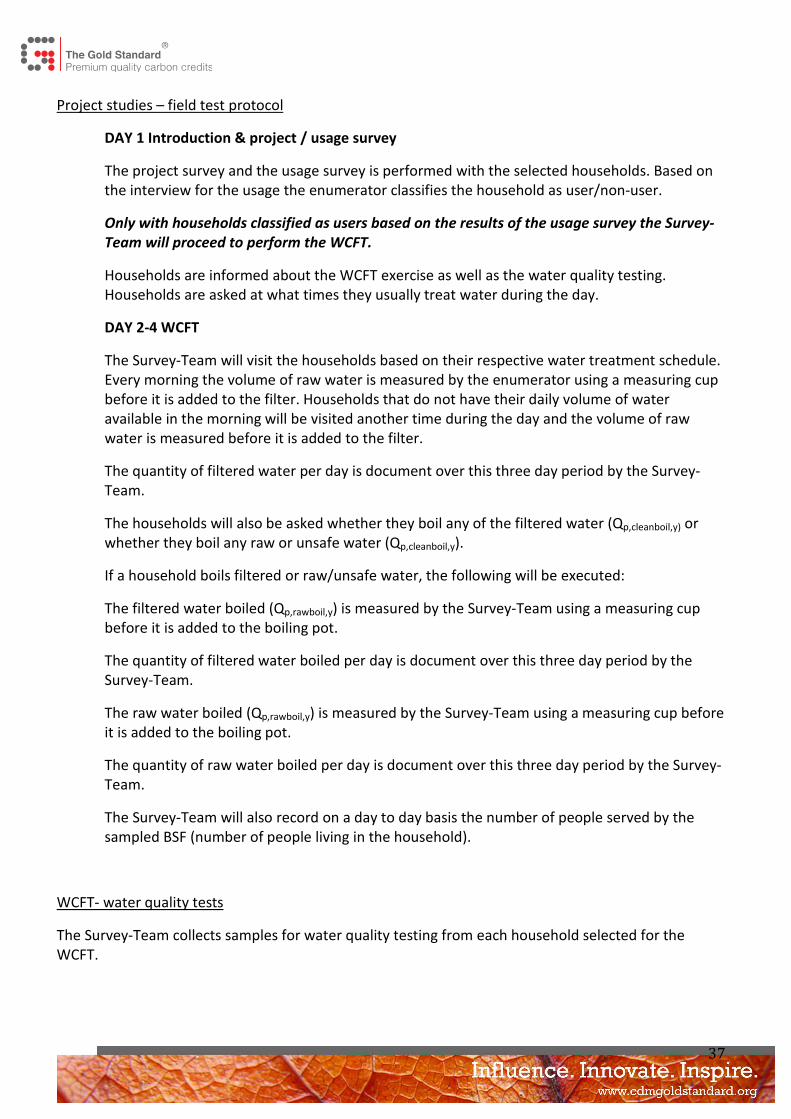
Project studies – field test protocol
DAY 1 Introduction & project / usage survey
The project survey and the usage survey is performed with the selected households. Based on
the interview for the usage the enumerator classifies the household as user/non-user.
Only with households classified as users based on the results of the usage survey the Survey-
Team will proceed to perform the WCFT.
Households are informed about the WCFT exercise as well as the water quality testing.
Households are asked at what times they usually treat water during the day.
DAY 2-4 WCFT
The Survey-Team will visit the households based on their respective water treatment schedule.
Every morning the volume of raw water is measured by the enumerator using a measuring cup
before it is added to the filter. Households that do not have their daily volume of water
available in the morning will be visited another time during the day and the volume of raw
water is measured before it is added to the filter.
The quantity of filtered water per day is document over this three day period by the Survey-
Team.
The households will also be asked whether they boil any of the filtered water (Qp,cleanboil,y) or
whether they boil any raw or unsafe water (Qp,cleanboil,y).
If a household boils filtered or raw/unsafe water, the following will be executed:
The filtered water boiled (Qp,rawboil,y) is measured by the Survey-Team using a measuring cup
before it is added to the boiling pot.
The quantity of filtered water boiled per day is document over this three day period by the
Survey-Team.
The raw water boiled (Qp,rawboil,y) is measured by the Survey-Team using a measuring cup before
it is added to the boiling pot.
The quantity of raw water boiled per day is document over this three day period by the Survey-
Team.
The Survey-Team will also record on a day to day basis the number of people served by the
sampled BSF (number of people living in the household).
WCFT- water quality tests
The Survey-Team collects samples for water quality testing from each household selected for the
WCFT.

38
The BSF is an established water treatment system which is supported and endorsed by well-known
NGOs, for example WHO43
and CAWST. Consequently, a number of studies has been conducted testing
the water quality of the BSFs. These include two types of studies: laboratory and field studies. A
Biosand Filter Literature Summary44
compiled by the organization CAWST provides an overview of the
enormous amount of studies. All studies on BSFs confirm that BSFs effectively remove E.coli bacteria,
viruses, turbidity and odor from the raw water. The table below provides some examples of the
removal rate of E.coli bacteria.
Author Type of study E.coli removal
Stauber et al. 201145
field 93.3%
Jenkins et al. 201146
laboratory 96%
Vanderzwaag at al. 200947
field 97%
Baker et al. 200648
field 98.5%
It is therefore assumed that the water quality provided by the BSFs if used correctly is high.
Only samples that meet Uganda´s standard on treated water quality or the ”highly protective level”
performance requirements as outlined in Table 1, page 7 of the WHO´s Health Based Targets and
Microbiological Specifications document will pass the water quality test.
3rd
party endorsement for testing methodology / equipment: 3M Petrifilm E.Coli/ Coliform Count
Plate Test
United Nations Human Settlements Programme (UN-HABITAT)
In its guide “A Practical Method for Assessment of the Baterial Quality of Water” the United Nations
Human Settlements Programme (UN-HABITAT)49
the 3M Petrifilm E.Coli/ Coliform Count Plate Test is
one of the two tested and endorsed testing procedures. “The Colilert and Petrifilm tests correlate with
the relative risk of disease from drinking-water (WHO Guidelines for Drinking Water, 2nd
Edition).”
43
WHO, Huisman & Wood. “Slow Sand Filtration”. 1974.;
http://www.who.int/water_sanitation_health/dwq/wsh0207/en/index5.html; Clasen. 2009. Scaling up
household water treatment among low-income populations. 44
CAWST. “Biosand Filter Literature Summary”. 2012. 45
Stauber et al. 2011. “Cluster Randomized Controlled Trial of the Plastic BioSand Water Filter in
Cambodia”. Environ. Sci. Technol., 2012, 46 (2), pp 722–728. 46
Jenkins et al. 2011. “Bacterial, viral and turbidity removal by intermittent slow sand filtration for
household use in developing countries: Experimental investigation and modelling”. Water Research 45
(2011) 6227-6239. 47
Vanderzwaag at al. 2009. “Field Evaluation of Long-Term Performance and Use of Biosand Filters in
Posoltega, Nicaragua”. Water Quality Research Journal of Canada, Vol. 44 (2): 111 – 121. 48
Baker et al. 2006. “Performance of BSF in Haiti: A Field Study of 107 Households”. Rural and Remote
Health. 6: 570. 49 http://mirror.unhabitat.org/pmss/listItemDetails.aspx?publicationID=3056

39
CAWST - Centre for Affordable Water and Sanitation Technology
CAWST endorses the 3M Petrifilm E.Coli/ Coliform Count Plate Test as an alternative for rapid e. coli
testing. 50
Engineers Without Borders -USA
EWB-USA evaluated the 3M Petrifilm E.Coli/ Coliform Count Plate Test in its technical paper: “Fecal
Coliform Contamination of Drinking Water – An Evaluation of World Field Assessment Techniques”. 51
The accuracy of test results was rated as good.
Selection of sampled households for the project studies (project/usage survey + WCFT)
1) Sample size determination
For the calculation of the provisional minimum sample size the 90/10 rule with coefficient of
variation (COV) of 0.6 shall be applied.
Picture 6: Sample size (source: applied methodology p.44)
The sample size according to Picture 6: Sample size (source: applied methodology p.44) shall be
increased by a sufficient amount (20 – 30 samples) to allow for “sample size attrition” (e.g.
households classed as non-users in the usage survey, outliers in the WCFT). This gives a sample size
of 120-130 households.
The COV and the sample size may be adjusted if the gathered data indicate that the applied COV is
higher/lower than the real COV. However, the minimum sample size shall not be lower than 110
households.
2) Selection of the sampled households
The sampled households are selected with a random selection method. The following
approach is applied:
1. Village groups with a total of at least 400 installed BSF each are defined based on
geographical characteristics.
The BSF in these village groups receive an ongoing number in the order of their unique
filter identification number.
2. One village group is selected by casting lots.
50 http://www.biosandfilters.info/faq/what-are-cawst%E2%80%99s-preferences-water-testing-
kits
51 http://www.ewb-usa.org/files/EWB-USA-TP-104-Fecal-Coliform-Contamination-of-Drinking-
Water-an-Evaluation-of-World-Field-Techniques-revc.pdf

40
This geographical cluster sampling is necessary because it helps to reduce travel time that
has an impact on monitoring costs and on the handling of samples for the water quality
testing.
3. The sample interval (SI) is calculated by dividing the total number of filters installed in the
selected village group by the sample size. (Note: Values are rounded down to the full
value.)
4. The Random Start (RS) is determined by randomly selecting a number between 1 and the
sample interval (SI).
5. Sample units SU1=RS; SU2=RS+S1; SUn=RS+(n-1)SI;… are selected from the list of
households in the selected village group based on the ongoing number that each filter
received in addition to their unique filter identification number.
The sampling of different age groups is not applied since all BSF were manufactured and installed
within one year.
Households that:
• are unreachable or
• do no longer reside within the project boundary (Masha sub-county)
are classed as non-users. These households are not replaced in the sample frame.
B. Ongoing monitoring tasks
1. Maintenance of total installation record & project data base – (continuous)
An accurate and complete installation record will be maintained. This record contains the following
data:
1. Unique filter identification number
2. Date of installation
3. Geographic location of installation (name of village)
4. Name and (if available) telephone number of beneficiary
5. Signed receipt and carbon waiver
The project data base is derived from the total installation record. The project data base is updated
based on the findings of the project, usage, monitoring surveys and the WCFT(updates).
2. Usage & monitoring survey – (annual after first verification)
The monitoring & usage survey is completed annually and in all cases on time for any request of
issuance.

41
The part “usage survey” provides a single usage parameter based on drop off rates. The part
“monitoring survey” investigates changes over time in the project scenario, and in the baseline
scenario, by surveying users of the BSF on an annual basis.
3. WCFT updates – (every two years after first verification)
WCFT updates are conducted with representative end users using the BSF. For scope and procedure
see WCFT.
Usage & monitoring survey + WCFT updates – field test protocol
See WCFT protocol
Selection of sampled households for the Usage & monitoring survey + WCFT updates
- see selection process for project studies –
If no WCFT update is scheduled, the minimum sample size for the UMS is 110.
4. Leakage assessment– (N/A)
As demonstrated in section B.6.3 no leakage is likely to occur during the entire project lifetime
given that the project is too small to impact the population outside the project boundary and
that it does not replace the entire baseline technology, but only a specific usage of it (i.e. as
means of water purification). No Leakage assessment update will have to be conducted.
5. Updating NRB assessment – (N/A)
No non-renewable biomass assessment update will have to be conducted, since the baseline is
fixed and the crediting period will not be renewed.
C. Quality assurance and quality control
Field test and surveys are conducted by trained staff. A documents and records for the project are
stored electronically and can be made accessible for spot checking and cross referencing by a third
party.

42
B.8 Date of completion of the application of the existing or new baseline and monitoring
methodology and name of the responsible person(s)/entity(ies)
Date of completion of the baseline study and monitoring plan:
25th
January 2016
Responsible entities:
Klima ohne Grenzen gemeinnützige GmbH, Samaritan´s Purse Uganda
SECTION C. Duration of the project activity / crediting period
C.1 Duration of the project activity:
C.1.1. Starting date of the project activity:
1st
October 2013
During October 2013 SP Uganda discussed the project with local authorities and started to set up the
infrastructure for the project. In January 2014 the Local Stakeholder Meeting was organized and at the
end of February 2014 the first BSF were manufactured. In May 2014 the first draft of the PDD was
uploaded into the GS registry.
C.1.2. Expected operational lifetime of the project activity:
>10 years 52
,
C.2 Choice of the crediting period and related information:
Fixed crediting period
C.2.1. Renewable crediting period
N.A.
C.2.1.1. Starting date of the first crediting period:
52 CAWST: Estimated Lifespan BSF 30+ years (http://biosandfilters.info/technical/fact-sheet-
biosand-filter) Liang et al. “Improving Household Drinking Water Quality. Water and Sanitation
Program”. 2010. (p.14, Fig. 4)

43
C.2.1.2. Length of the first crediting period:
C.2.2. Fixed crediting period:
C.2.2.1. Starting date:
1st
July 2014
C.2.2.2. Length:
10 years
SECTION D. Stakeholders’ comments
>> Please note that the blind scoring exercise during stakeholder consultation need not be carried out.
D.1. Brief description how comments by local stakeholders have been invited and compiled:
>> Please describe the agenda of physical meeting, Non-technical summary, Invitation tracking table,
Text of invitations sent, any other consultation method used
The physical local stakeholder meeting took place on the 22nd
of January 2014 at the Masha sub-
county headquarters.
1. Way of invitation
Invitation letters were sent via email to members of the government and officials. These were written
in English. To the local population invitation letters written in Nyankore (also called Runyankole) were
handed over personally. The local population was additionally informed via radio announcements as
well as phone calls five days before the meeting.
English text of invitation letter:

44
Nyankore text of invitation letter:

45
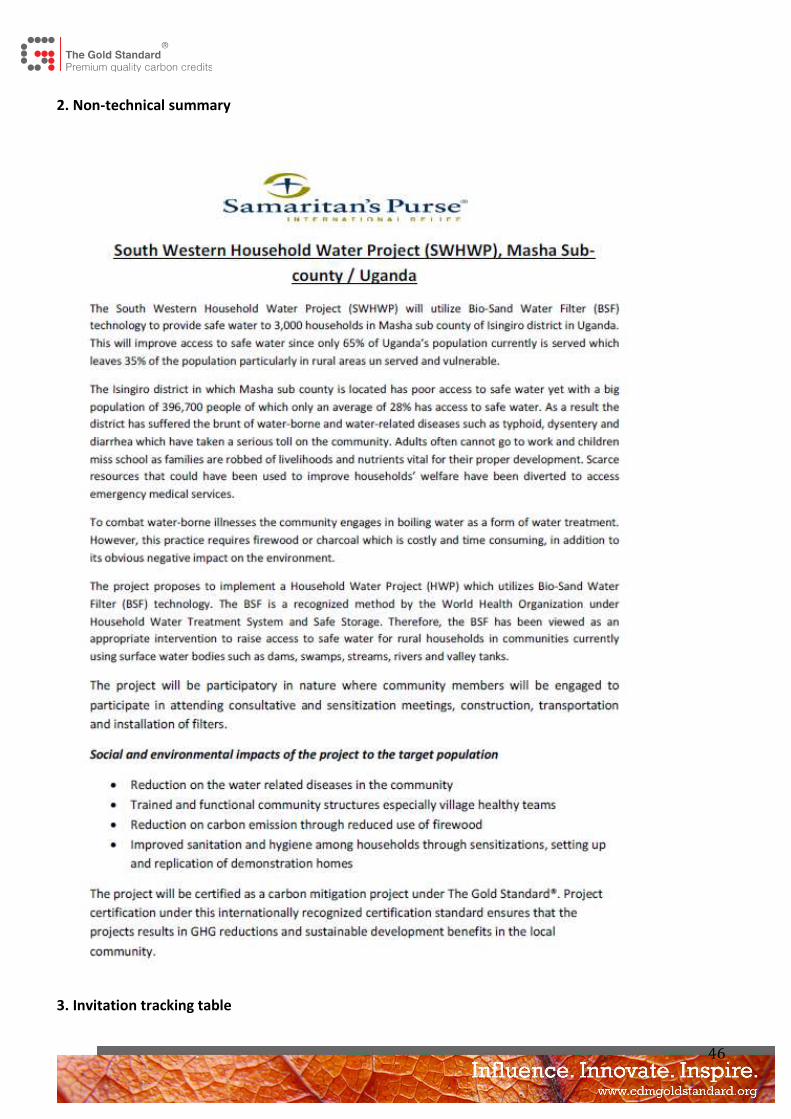
46
2. Non-technical summary
3. Invitation tracking table

47
Category
code
Organisation (if relevant) Name of invitee Method of
invitation
Date of
invitation
Confirmation
received?
Y/N
B Ministry of Water and
Environment, Climate Change
Unit Grounds
Maikut, Chebet email 20/12/2013 Y
B National Planning Authority –
Planning for development
email 20/12/2013 Y
B District water officer Rwehwezahura, Francis by hand 16/12/2013 Y
B District Engineer Kanyamuhanga, Edison by hand 16/12/2013 Y
B District community
development officer
Kobusingye, Barbara by hand 16/12/2013 Y
B District chairman local council
V
Byaruhanga, Ignetious by hand 16/12/2013 Y
B Masha sub county chairman
local council III
Tumwesigye, Milton by hand 16/12/2013 Y
B Sub county chief - Masha Byaruhanga, Arthur by hand 16/12/2013 Y
B Community development
officer - Masha
Kamugisha, Nobert by hand 16/12/2013 Y
D Councilor Nyarubungo parish Kyomugisha, Penlop by hand 17/12/2013 Y
D Councilor Nyarubungo parish Namuleme, Janet by hand 17/12/2013 Y
D Councilor Kabaare parish Abin, Lubega by hand 17/12/2013 Y
D Councilor Kabaare parish Aisha, Karungi by hand 17/12/2013 Y
D Councilor Nyamitsindo parish Buruhan, Turyakira by hand 17/12/2013
D Councilor Nyamitsindo parish Kgizi, Janat by hand 17/12/2013 Y
D Councilor Nyakakoni parish Kiiza, Justus by hand 17/12/2013 Y
D Councilor Nyakakoni parish Muhumuza, Irene by hand 17/12/2013 Y
D Councilor Rukuuba Parish Tumwesigye, Edmond by hand 17/12/2013 Y
D Councilor Rukuuba Parish Tushabomwe, Peace by hand 17/12/2013 Y
D Councilor Rukuuba Parish Haddija, Birungi by hand 17/12/2013 Y
D Councilor Rwentago parish Ntunga, Emmanuel by hand 17/12/2013 Y
D Councilor Rwentago parish El Bashil, Mubiru by hand 17/12/2013 Y
B Area member of parliament Bright, Rwemirama by hand 17/12/2013 Y

48
B Masha sub county All Chairpersons of local
council I‘s
Hand
invitation
delivered by
the
community
developmen
t officer –
Masha sub
county and
radio
announcem
ent
18 –
20/12/2013
Y
B Masha sub county All Chairpersons of local
council II‘s
Hand
invitation
delivered by
the
community
developmen
t officer –
Masha sub
county and
radio
announcem
ent
18-
20/12/2013
Y
C Ministry of Water and
Environment
Prof. Ephraim Kamuntu
(MP)
email 20/12/2013 N
D Network for Water and
Sanitation (NETWAS) Uganda
email 20/12/2013 N
D Friendly Water for the World David H. Albert / Richard
Kyambadde
email 20/12/2013 Y
D Link to Progress (LTP) email 20/12/2013 N
D GIZ Office Uganda Georg Zenk email 20/12/2013 N
D Greenpeace Africa email 20/12/2013 Y
D Uganda Red Cross Society Dr. Bildard Baguma email 20/12/2013 N
D WWF Uganda Country Office email 20/12/2013 N
D UNICEF Uganda email 20/12/2013 N
D WHO Uganda Country Office email 20/12/2013 N
D Uganda Water and Sanitation
NGO Network (UWASNET)
email 20/12/2013 N
E The Gold Standard Foundation Johann Franz Thaler email 20/12/2013 Y
F REEEP Regional Secretariat
Southern Africa
Jason Schäffler email 20/12/2013 N
F CARE International Kathleen Hunt email 20/12/2013 N

49
F Helio International Andrew Marquard email 20/12/2013 N
F Impact Carbon USA/Uganda email 20/12/2013 N
(D)
CME of
GS PoA
Uganda Carbon Bureau email 20/12/2013 N
(D)
CME of
GS PoA
co2balance UK Ltd. email 20/12/2013 N
(D)
CME of
GS PoA
ClimateCare email 20/12/2013 N
(D)
CME of
GS PoA
South Pole Carbon Asset
Management Ltd.
Lars Osterwalder email 20/12/2013 N
Picture 7: Invitation via email

50
Picture 8: Receipt - 7 radio announcements (4 in Runyankole, 3 in English)

51
4. Agenda of physical meeting
1. Prayer.
2. Introductions.
3. Opening Remarks by Chairman Local Council III.
4. Communication from Country Director – Samaritan’s Purse.
5. Explanation of the Project Design.
6. Reactions/Questions from the Participants.
7. Closure of the meeting.
5. Minutes of physical meeting

52

53

54

55

56

57

58
Pictures of the Local Stakeholder Consultation

59
D.2. Summary of the comments received:
>> Please describe the outcome of the meeting, assessment of stakeholders comment, list of
participants.
Questions asked during the meeting and the answers given to these can be found in the minutes of the
physical meeting (see item No. 5 in section D1 of this report).
In total 31 participants commented on the project using the feedback forms that were provided in the
local stakeholder consultation.
Positive aspects
• Providing safe water to the people in the Masha sub-county
• Training local people in sanitation and hygiene
• Sensitization of sanitation and hygiene
Negative aspects
• Places without any water cannot benefit from the project
• Concerns about the capacity of the BSF
• No installation of an improved source of water
Copies of the original feedback forms and typed translations of the feedback forms received in
Nyankore can be found in Annex 6 and Annex 7 respectively.
D.3. Report on how due account was taken of any comments received and on measures taken to
address concerns raised:

60
>> Please discuss how the stakeholder’s comments have been addressed and include the changes to the
design of the programme based on their feedback.
Stakeholder comment Comment taken into
account (Yes / No)
Explanation (Why / How)
Stakeholders were criticizing the
capacity and small size of the BSF
(used for demonstration)
No The BSF used for demonstration at
the stakeholder meeting was less
than half of the size of the actual
filters that will be installed. It will be
communicated that the BSF are
bigger than the filter used for
demonstration and that capacity is
therefore big enough for a
household.
The project could involve the
installation of water tanks in
households or valley tanks in the
parish.
No The project mainly focuses on
bringing safe water to households.
Nevertheless, public institutions can
also benefit from the project.
The project does not help in places
without any access to water
No The project is aware of the fact that
its technology requires the
availability of a water source. For a
detailed reply see answer to
question 9 in the minutes of the LSC.
The project does not install an
improved water source
No See previous explanation.
D.4. Report on the Continuous input / grievance mechanism:
>>
Discuss the Continuous input / grievance mechanism expression method and details, as discussed with
local stakeholders.
Method Chosen (include all
known details e.g. location of
book, phone, number, identity of
mediator)
Justification
Continuous Input /
Grievance Expression
The project can be contacted via
the project manager:
The project manager is permanently
associated with the project and
supervises the installation and

61
Mr. Robert MabanoP.O. Box
21810
Kampala
monitoring processes of the project. He
is easily reachable and open to any
feedback and question concerning the
project.
Telephone access +256772713215
Internet/email access [email protected]
Process Book The process books is available at
Masha sub county headquarters
The process book is available at the sub
county headquarters because this is
easily accessible for beneficiaries to
register any complaints.
Nominated
Independent Mediator
(optional)
Gold Standard Foundation
Johann Thaler
Regional Manager Africa
All issues identified during the crediting period through any of the Methods shall have a mitigation
measure in place that should be added to the monitoring plan.
D.5. Report on stakeholder consultation feedback round:
Once the project is listed in the Gold Standard registry the stakeholder feedback round (SFR) will start.
Al stakeholders invited for participation in the Local Stakeholder Consultation will have the opportunity
to take part in the SFR.
Stakeholders that were invited via email will receive the Local Stakeholder Consultation report via
email. All relevant international NGOs supporting The Gold Standard, with a representation in the
region an all GS Supporter NGOs located in Uganda will be invited to make comments on the Local
Stakeholder Consultation report via email.
The local community will be included via Masha´s community development officer and the councilors
of the various parishes in the project area. The community development officer and the councilors will
receive a hard copy of the Local Stakeholder Consultation report. The report will also be available on
the website: www.klimaohnegrenzen.de/swhwp-masha and in the Gold Standard registry.
The stakeholder consultation feedback round will not include a physical meeting. The SFR will be open
for comments for a period of at least two months.

62

63
Annex 1
CONTACT INFORMATION ON PARTICIPANTS IN THE PROJECT ACTIVITY
Organization: Klima ohne Grenzen gemeinnützige GmbH
Street/P.O.Box: Grassistr. 12
Building:
City: Leipzig
State/Region:
Postfix/ZIP: 04107
Country: Germany
Telephone: +49 341 253564-15
FAX: +49 341 253564-16
E-Mail: [email protected]
URL: www.climate-borders.org
Represented by: Christian Bachmann
Title: Managing Director
Salutation:
Last Name: Bachmann
Middle Name:
First Name: Christian
Department:
Mobile:
Direct FAX:
Direct tel:
Personal E-Mail:

64
Organization: Samaritan’s Purse
Street/P.O.Box: P.O. Box 21810
Building:
City: Kampala
State/Region: Kampala
Postfix/ZIP:
Country: Uganda
Telephone: +256-414-220 256
FAX:
E-Mail:
URL: www.samaritanspurse.org
Represented by: Daniel Enarson
Title: Country Director
Salutation: Mr.
Last Name: Enarson
Middle Name:
First Name: Daniel
Department: International Projects
Mobile:
Direct FAX:
Direct tel:
Personal E-Mail: [email protected]

65
Annex 2
Information regarding public funding

66

67
Annex 3
Calculation of SEC
Specific energy consumption (SEC)
Specific energy consumption required to boil one litre of water is to be calculated as follows:
Where:
= Specific heat of water (kJ/L oC). Use a default value of 4.186 kJ/L C
= Final temperature (oC). Use a default value of 100 °C
53
= Initial temperature of water (°C). Use annual average ambient
temperature;54
or use a default value of 20 °C
= Latent heat of water evaporation (kJ/L). Use a default value of 2260 kJ/L.
The latent heat required to boil one litre of water for five minutes is
assumed to be equivalent to latent heat for the evaporation of 1% of the
water volume (WHO recommends a minimum duration of five minutes of
water boiling)55
53
Boiling point of water at standard conditions. 54
Ambient temperature data must be from globally accepted data sources, for example data published
by the National Aeronautics and Space Administration (NASA) or the National Renewable Energy
Laboratory (NREL). Data can be used only if they are for a location that can be demonstrated to be
representative of the project location. 55 WHO guidelines for emergency treatment of drinking water at point of the use
<http://www.searo.who.int/LinkFiles/List_of_Guidelines_for_Health_Emergency_Emergency_treatme
nt_of_drinking_water.pdf>.

68
= Efficiency of the water boiling systems being replaced. Use one of the
options below:
(a) The efficiency of the water boiling system shall be established
using representative sampling methods or based on referenced
literature values (fraction), use weighted average values if more
than one type of systems are encountered;
(b) 0.10 default value may be optionally used if the replaced system
or the system that would have been used is a three stone fire or a
conventional system for woody biomass lacking improved
combustion air supply mechanism and flue gas ventilation system
that is without a grate as well as a chimney; for the rest of the
systems using woody biomass 0.2 default value may be optionally
used;
(c) 0.5 default value may be used if the replaced system or the
system that would have been used is a fossil fuel combusting
system
For nwb the default value of 0.10 is chosen, since the BSFs replace three stone fires or other
conventional systems combusting woody biomass.
Therefore, SEC = 3,574.8 kJ/L.
Data / Parameter: WH
Data unit: kJ/L °C
Description: Specific heat of water
Source of data used: AMS-III.AV
Value applied: 4.186
Justification of the
choice of data or
description of
measurement
methods and
procedures actually
applied:
Default value
Any comment: Used for the calculation of the specific energy consumption (SEC), equation 2 of
AMS-III.AV.

69
Data / Parameter: Tf
Data unit: °C
Description: Final temperature
Source of data used: AMS-III.AV
Value applied: 100
Justification of the
choice of data or
description of
measurement
methods and
procedures actually
applied:
Default value (boiling point of water at standard conditions)
Any comment: Used for the calculation of the specific energy consumption (SEC), equation 2 of
AMS-III.AV.
Data / Parameter: Ti
Data unit: °C
Description: Initial temperature of water
Source of data used: AMS-III.AV
Value applied: 20
Justification of the
choice of data or
description of
measurement
methods and
procedures actually
applied:
Default value
Any comment: Used for the calculation of the specific energy consumption (SEC), equation 2 of
AMS-III.AV.
Data / Parameter: WHE
Data unit: kJ/L

70
Description: Latent heat of water evaporation
Source of data used: AMS-III.AV
Value applied: 2260
Justification of the
choice of data or
description of
measurement
methods and
procedures actually
applied:
Default value. The latent heat required to boil one litre of water for five
minutes is assumed to be equivalent to latent heat for the evaporation of 1% of
the water volume (WHO recommends a minimum duration of five minutes of
water boiling, “WHO guidelines for emergency treatment of drinking water at
point of the use”).
Any comment: Used for the calculation of the specific energy consumption (SEC), equation 2 of
AMS-III.AV.
Data / Parameter: nwb
Data unit: -
Description: Efficiency of the water boiling system being replaced
Source of data used: AMS-III.AV
Value applied: 0.10
Justification of the
choice of data or
description of
measurement
methods and
procedures actually
applied:
Default value.
(b) 0.10 default value may be optionally used if the replaced system or the
system that would have been used is a three stone fire or a conventional
system for woody biomass lacking improved combustion air supply mechanism
and flue gas ventilation system that is without a grate as well as a chimney.
Any comment: This value can be applied since the replaced systems are three stone fires.
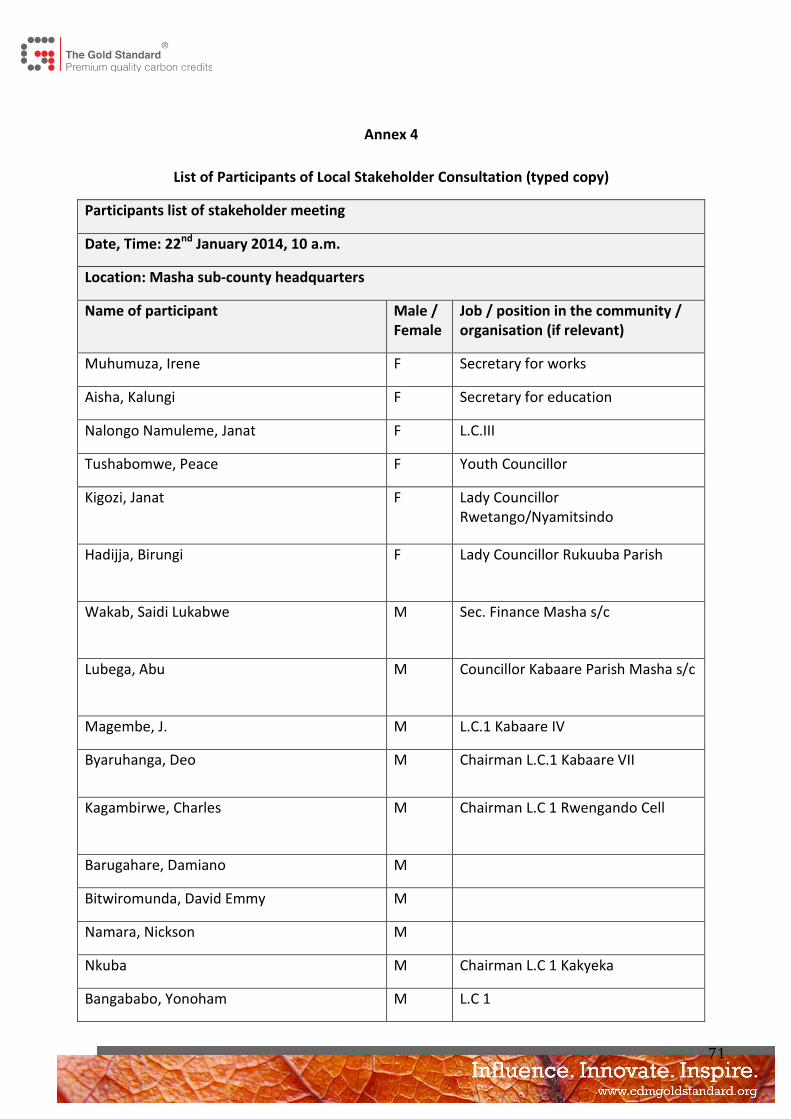
71
Annex 4
List of Participants of Local Stakeholder Consultation (typed copy)
Participants list of stakeholder meeting
Date, Time: 22nd
January 2014, 10 a.m.
Location: Masha sub-county headquarters
Name of participant Male /
Female
Job / position in the community /
organisation (if relevant)
Muhumuza, Irene F Secretary for works
Aisha, Kalungi F Secretary for education
Nalongo Namuleme, Janat F L.C.III
Tushabomwe, Peace F Youth Councillor
Kigozi, Janat F Lady Councillor
Rwetango/Nyamitsindo
Hadijja, Birungi F Lady Councillor Rukuuba Parish
Wakab, Saidi Lukabwe M Sec. Finance Masha s/c
Lubega, Abu M Councillor Kabaare Parish Masha s/c
Magembe, J. M L.C.1 Kabaare IV
Byaruhanga, Deo M Chairman L.C.1 Kabaare VII
Kagambirwe, Charles M Chairman L.C 1 Rwengando Cell
Barugahare, Damiano M
Bitwiromunda, David Emmy M
Namara, Nickson M
Nkuba M Chairman L.C 1 Kakyeka
Bangababo, Yonoham M L.C 1

72
Tinka, Abel M Chairman L.C 1
Muhumuza, Julius M Chairman L.C 1
Zavuga, John M Chairman L.C 1
Kato, Kayiga Charles M Friendly Water For The World
Segirinya, Brian Vincent M Friendly Water For The World
Ssentamu, Majidu M Chairman L.C 1
Mukalazi, Nanku M Information Sec
Caesur, Lubangakene M M&E Officer, Innovations for
Poverty Action-Dispensers for Safe
Water Project
Mugerwa, G M
Kamugasha, Bosco M H/I Masha s/c
Kamugisha, Nobert M CDO Masha Sub county
Bwereere, .K. Enock Rwetango M L.C II Chairperson
Hommy, M. Kaaki M C/man L.C Kabaare VI
Twesigye, Boaz M C/man L.C I Igyereka
Jacentah, Mujurizi F Sec L.C II for women Nyamistido
Bateho, David M C/man L.C I Kabaara V
Mateke, Edson M Chairman L.C I
Muhanguzi, Benon M Chairman L.C I
Kajungu, Robert M Chairman L.C. I
Mugumya, Alex M
Ndyahisyahe, Jackson M
Byaruhanga, Patrick M Chairman L.C I

73
Niwamanya, Boaz M Isingiro D.L.G Water Dep‘t
Taita, .F. M Parish Chief Nyarubungo/Rwetango
Nuwagaba, Christoper M Sec for security Katereera cell
Wandega Andrew, Field Associate
Innovations for Poverty Action (I.P.A)
M Innovations for Poverty Action
(I.P.A) Dispensers for Safe Water
Program
Kumanya, Christian M Agric. Officer, Masha s/c NAADS
Musanyufu, Joseph M
Mutahunga, Apolinari M
Kahangirwe, Elisa M
Rumanyika, Godfrey M Chairman L.C I
Mutungi, John M Chairman L.C I
Kaheeru, Nazario M
Turyakira, Enock M
Pastor Turyatemba, Nelson M
Baguma, Francis M
Muhanguzi, Dauid M
Byamukama, Julius M
Asiimwe, Amon M
Mugyema, Herbert M
Kibuyage, Naboth M
Brigent, Kahumi M
Kikafunda, Joseph M
Joseph, Wamara M
Kakuuto, Bernard M
Kagwa, Alex M

74
Mwesigya, Robert M
Tooto, Francis M
Byaruhanga, Arthur M Masha S/c L.G
Niwamanya, Boaz M Water Dep’t Isingiro D.L.G
Mpaka, Sam M Office of area Member of
Parliament
Mabano, Robert M Project Manager, Samaritan’s Purse
Enarson, Daniel M County Director, Samaritan’s Purse
Irumba, Asaba Stephen M National WASH Manager,
Samaritan’s Purse
Munyantwari, Daniel M Samaritan’s Purse
Stephenson, Butaka Byarugaba M Samaritan’s Purse
Tumwesigye, Milton M Chairman LC III, Masha sub county

75
Annex 5: List of Participants of Local Stakeholder Consultation (original)

76

77

78

79

80

81
Annex 6: Original feedback forms

82

83

84

85

86

87

88

89

90

91

92

93

94

95

96

97
Annex 7
Translation of feedback forms originally written in Nyankore
Name Zavuga John
What is your impression of the
meeting?
Enabling us have access to safe water.
What do you like about the project? Beneficiary’s access to safe water at no cost
(no payments involved).
What do you not like about the
project?
Discouraged by not putting in place an
improved water source.
Signature [See original]
Name Tooto Francis
What is your impression of the
meeting?
Gained hope of improved health after
accessing safe water.
What do you like about the project? Availing possibility to have access to safe
water.
What do you not like about the
project?
Nothing.
Signature [See original]
Name Muhumuza Irene
What is your impression of the
meeting?
It was encouraging.
What do you like about the project? Giving us opportunity to access safe water.
What do you not like about the
project?
Nothing
Signature [See original]
Name Kajungu Robert
What is your impression of the The teaching about the filter was good.

98
meeting?
What do you like about the project? Impressed by the safe water accessibility
message.
What do you not like about the
project?
Nothing
Signature [See original]
Name Bright Kahima
What is your impression of the
meeting?
The project sounds giving hope.
What do you like about the project? Helping us have safe water
What do you not like about the
project?
Nothing
Signature [See original]
Name Muhumuza Julius
What is your impression of the
meeting?
Good impression
What do you like about the project? Accessing safe water
What do you not like about the
project?
Nothing
Signature [See original]
Name Hommy M. Kaaki
What is your impression of the
meeting?
Impressed to hear of an opportunity to have
access to safe water.
What do you like about the project? Getting access to safe water.
What do you not like about the
project?
Nothing
Signature [See original]

99
Name Musanyufu Joseph
What is your impression of the
meeting?
What do you like about the project? Accessibility to clean water.
What do you not like about the
project?
Signature [See original]
Name Mutungi John
What is your impression of the
meeting?
Reflected the improvement of our household’s
livelihood.
What do you like about the project? Message of clean water.
What do you not like about the
project?
Signature [See original]
Name Nkuba Patrick
What is your impression of the
meeting?
Convinced of change from the long time water
stress in our village to clean and safe water.
What do you like about the project? Encouraged by the awareness raising
pertaining safe water accessible.
What do you not like about the
project?
Signature [See original]
Name Tinka Abel
What is your impression of the
meeting?
Impressed by project’s activities concerning
improving our health.
What do you like about the project? Incorporating hygiene and sanitation in the
project.
What do you not like about the None

100
project?
Signature [See original]
Name Muhanguzi Benon
What is your impression of the
meeting?
Good knowledge
What do you like about the project? The issue of safe water accessible to the local
people.
What do you not like about the
project?
All was good.
Signature [See original]
Name Jacenta Mujurizi
What is your impression of the
meeting?
Good impression as the presentation
What do you like about the project? Helping us have safe and clean water by
filtering method
What do you not like about the
project?
No facilitation on transport
Signature [See original]
Name Kagwa Alex
What is your impression of the
meeting?
All was alright
What do you like about the project? Clean and safe water accessibility.
What do you not like about the
project?
All was good.
Signature [See original]
Name Byaruhanga Deo
What is your impression of the Promising accessibility to clean and safe

101
meeting? water.
What do you like about the project? Helping us reduce on ill-health water related
problems.
What do you not like about the
project?
Signature [See original]
Name Magembe James
What is your impression of the
meeting?
Impressed by the method of water treatment
that is simple and cheap.
What do you like about the project? Reduction on use of firewood hence having
enough safe water for household.
What do you not like about the
project?
The small size of the demonstration filter.
Signature [See original]
Name Kiiza Emmanuel
What is your impression of the
meeting?
Good impression
What do you like about the project? People having access to clean and safe water.
What do you not like about the
project?
None
Signature [See original]
Name Kigozi Janat
What is your impression of the
meeting?
Filtered water is safe and contributes to
environmental preservation.
What do you like about the project? Their outreach approach allows us time to
interact enabling us acquire the right
information.
What do you not like about the
project?
I like all the presentation apart from few
things.

102
Signature [See original]

103
Annex 8
Sustainability Monitoring Plan
No 1
Indicator Air quality
Mitigation measure N/A
Repeat for each parameter
Chosen parameter Average reduction of biomass consumed for boiling water by
the owners of the filter
Current situation of parameter The WHO estimates that indoor air pollution is responsible for
19,700 deaths per year in Uganda. Indoor cooking activities on
open fires plays a major role.
Estimation of baseline situation of
parameter
See above
Future target for parameter Reduction of indoor smoke due to reduced emissions from
treating water
Way of monitoring How Calculation of reduced CO-Emissions based on amount of wood
saved by using BSF.
When Annually
By who Project Owner
No 2
Indicator Water quality and quantity
Mitigation measure N/A
Repeat for each parameter
Chosen parameter Number of people served with safe water
Current situation of parameter According to the Uganda Water Supply Atlas 2010 in the Isingiro
district only 26% of the rural population has access to safe
water supply services.
Estimation of baseline situation of
parameter
See above
Future target for parameter 3,000 household will receive a BSF

104
Way of monitoring How Usage survey and installation record
When Annually
By who Project owner
No 3
Indicator Soil condition
Mitigation measure N/A
Repeat for each parameter
Chosen parameter Wood consumption
Current situation of parameter The steady demand of firewood for cooking and boiling of water
makes it necessary to cut down trees and contributes a large
part to deforestation in Uganda. Deforestation leads to erosion
and destruction of eco-systems. In Uganda, the fraction of non-
renewable biomass is 82%.
Estimation of baseline situation of
parameter
Non-sustainable wood consumption (NRB 82%)
Future target for parameter Reduced wood consumption
Way of monitoring How Calculation of the amount of wood saved by using BSF (based on
water quantity)
When Annually
By who Project owner
No 4
Indicator Other pollutants
Mitigation measure N/A
Repeat for each parameter
Chosen parameter N/A
Current situation of parameter N/A
Estimation of baseline situation of
parameter
N/A

105
Future target for parameter N/A
Way of monitoring How Not monitored
When
By who
No 5
Indicator Biodiversity
Mitigation measure N/A
Repeat for each parameter
Chosen parameter Wood consumption
Current situation of parameter The steady demand of firewood for cooking and boiling of water
makes it necessary to cut down trees and contributes a large
part to deforestation in Uganda. Deforestation leads to erosion
and destruction of eco-systems. In Uganda, the fraction of non-
renewable biomass is 82%.
Estimation of baseline situation of
parameter
Non-sustainable wood consumption (NRB 82%)
Future target for parameter Reduced wood consumption
Way of monitoring How Calculation of the amount of wood saved by using BSF (based on
water quantity)
When Annually
By who Project owner
No 6
Indicator Quality of employment
Mitigation measure N/A
Repeat for each parameter
Chosen parameter N/A
Current situation of parameter N/A
Estimation of baseline situation of N/A

106
parameter
Future target for parameter N/A
Way of monitoring How Not monitored
When
By who
No 7
Indicator Livelihood of the poor
Mitigation measure N/A
Repeat for each parameter
Chosen parameter Firewood savings from reduced boiling of water for
consumption
Current situation of parameter People have to walk long distances to reach the safe water
supplies. In Western Uganda 67% of the population has to walk
up to 1km and 31.7% between 1 and 5km; 0.8% has to walk
even more than 5km . Walking of long distances is time-
consuming and carrying water over long distances is hard
physical labor, especially for girls and women. People thus often
draw on unsafe water supplies such as ponds or surface water
closer to their homes.
Estimation of baseline situation of
parameter
See above
Future target for parameter Decreased firewood consumption
Way of monitoring How Calculation of the amount of wood saved by using BSF (based on
water quantity) + monitoring survey
When Annually
By who Project owner
No 8
Indicator Access to affordable and clean energy services
Mitigation measure N/A
Repeat for each parameter

107
Chosen parameter N/A
Current situation of parameter N/A
Estimation of baseline situation of
parameter
N/A
Future target for parameter N/A
Way of monitoring How Not monitored
When
By who
No 9
Indicator Human and institutional capacity
Mitigation measure N/A
Repeat for each parameter
Chosen parameter N/A
Current situation of parameter N/A
Estimation of baseline situation of
parameter
N/A
Future target for parameter N/A
Way of monitoring How Not monitored
When
By who
No 10
Indicator Quantitative employment and income generation
Mitigation measure N/A
Repeat for each parameter
Chosen parameter N/A
Current situation of parameter N/A

108
Estimation of baseline situation of
parameter
N/A
Future target for parameter N/A
Way of monitoring How Not monitored
When
By who
No 11
Indicator Access to investment
Mitigation measure N/A
Repeat for each parameter
Chosen parameter N/A
Current situation of parameter N/A
Estimation of baseline situation of
parameter
N/A
Future target for parameter N/A
Way of monitoring How Not monitored
When
By who
No 12
Indicator Technology transfer and technological self-reliance
Mitigation measure N/A
Repeat for each parameter
Chosen parameter N/A
Current situation of parameter N/A
Estimation of baseline situation of
parameter
N/A
Future target for parameter N/A

109
Way of monitoring How Not monitored
When
By who

110
Annex 9
Uganda Water Supply Atlas (27.04.2016)

111
Annex 10
Template of project/monitoring &usage survey

South Western Household Water Project (SWHWP) - Masha
PROJECT/MONITORING & USAGE SURVEY V1.0
Date:
Interviewer:
Filter ID:
Name of beneficiary:
Community:
Address (if available):
Phone number of beneficiary (if available):
Number of household members:
Questions should be directed to primary users only to ensure accuracy!
Is the person being interviewed the primary user of the BSF?
� yes
� no
Only proceed when the person is the primary user!
Part I: Project/Monitoring Survey
Section I: Before BSF was installed (baseline scenario)
1) Did you have sufficient safe water available (either from a safe source or by
treatment of raw water) for drinking, washing hands, cleaning fruits and vegetables,
cooking and personal hygiene?
� Yes
� No

South Western Household Water Project (SWHWP) - Masha
Project/monitoring & usage survey - V1.0
2
2) If no, can you name the reasons?
3) What was the source of your water?
� River or pond / lake
� Open spring / well
� Rainwater harvesting tank
� Protected spring / well
� Tap stand
� Piped water
� Valley tank
� Deep borehole with pump
� Other:
4) What was the distance to the water supply or the total collection time required?
� More than 1km / more than 30 min round-trip
� Within 1 km / within 30 min round-trip
� On plot or in the house
5) Did you experience interruptions in water supply from that source?
� No /almost no interruption of flow at the source
� Frequent (daily or weekly) interruptions of flow at the source
� Seasonal service variation resulting from source fluctuation

South Western Household Water Project (SWHWP) - Masha
Project/monitoring & usage survey - V1.0
3
6) Did you do anything to make your water safer to drink?
� Yes
� No
7) If yes, what method did you use to make your water safer?
� Settling
� Boiling
� Chlorine
� Other:
If boiling was one/the treatment method for making your water safer:
8) What did you use to boil your water?
� Three-stone-fire
� Charcoal stove
� Efficient stove
� Other:
9) What type of fuel did you use to boil your water?
� Firewood
� hand-collected
� purchased
� Charcoal
� Other:
South Western Household Water Project (SWHWP) - Masha
Project/monitoring & usage survey - V1.0
4
10) Did you have a save water source on your plot?
� Yes
� No
11) If yes, did you experience interruptions in water supply from that source?
� No /almost no interruption of flow at the source
� Frequent (daily or weekly) interruptions of flow at the source
� Seasonal service variation resulting from source fluctuation
12) Did members of your household frequently experience water borne diseases?
� Yes
� No
13) Did you or members of your household take part in sanitation and hygiene
training?
� Yes
� No
Section II: With the BSF installed (project scenario)
14) Did you have sufficient safe water available (either from a safe source or by
treatment of raw water) for drinking, washing hands, cleaning fruits and vegetables,
cooking and personal hygiene?
� Yes
� No

South Western Household Water Project (SWHWP) - Masha
Project/monitoring & usage survey - V1.0
5
15) If no, can you name the reasons?
16) What was the source of your water?
� River or pond / lake
� Open spring / well
� Rainwater harvesting tank
� Protected spring / well
� Tap stand
� Piped water
� Valley tank
� Deep borehole with pump
� Other:
17) What was the distance to the water supply or the total collection time
required?
� More than 1km / more than 30 min round-trip
� Within 1 km / within 30 min round-trip
� On plot or in the house

South Western Household Water Project (SWHWP) - Masha
Project/monitoring & usage survey - V1.0
6
18) Did you experience interruptions in water supply from that source?
� No /almost no interruption of flow at the source
� Frequent (daily or weekly) interruptions of flow at the source
� Seasonal service variation resulting from source fluctuation
19) Did you have a save water source (rainwater harvesting tank, protected spring
/ well, tap stand, piped water, valley tank, deep borehole with pump) on your plot?
� Yes
� No
20) If yes, did you experience interruptions in water supply from that source?
� No /almost no interruption of flow at the source
� Frequent (daily or weekly) interruptions of flow at the source
� Seasonal service variation resulting from source fluctuation
21) Did members of your household experience less water borne diseases
compared to the time before your BSF was installed?
� Yes
� No
22) Did you or members of your household take part in sanitation and hygiene
training?
� Yes
� No

South Western Household Water Project (SWHWP) - Masha
Project/monitoring & usage survey - V1.0
7
23) Did expenditures (e.g. money/ time for acquiring fuel) for water treatment
change with the BSF?
� Yes, now we spend less money/time.
� Yes, now we spend more money/time.
� No

South Western Household Water Project (SWHWP) - Masha
Project/monitoring & usage survey - V1.0
8
Guidelines for evaluating whether the sampled household was using a non-boiling safe
water supply in the baseline scenario
In the project/monitoring survey the sampled household must show the following
characteristics:
Section I: Before BSF was installed (baseline scenario)
There was no source of safe water (rainwater harvesting tank, protected spring / well, tap
stand, piped water, valley tank, deep borehole with pump) on plot / in the house.
or:
If there was a source of safe water on plot / in the house, there were frequent (daily or
weekly) interruptions of flow at the source.
in addition:
Household did not threat water or treated water by boiling (simple/three-stone-fire or
charcoal stove).
Section II: With the BSF installed (project scenario)
There was no source of safe water (rainwater harvesting tank, protected spring / well, tap
stand, piped water, valley tank, deep borehole with pump) on plot / in the house.
or:
If there was a source of safe water on plot / in the house, there were frequent (daily or
weekly) interruptions of flow at the source.

South Western Household Water Project (SWHWP) - Masha
Project/monitoring & usage survey - V1.0
9
Part II: Usage Survey
Topic 1: Rate of usage
1) How often do you filter water with the BSF?
� Everyday
� 4-6 times per week
� 2-3 times per week
� 1 time per week
� Less than once per week
� Never
2) When was the last time you filtered water using the BSF?
� Today
� Yesterday
� 2-3 days ago
� 4-7 days ago
� More than a week ago
Section III: Water storage
3) Do you store filtered water?
� Yes
� No
4) If yes, can I see the storage container please?
Document your observations!
� Has narrow mouth

South Western Household Water Project (SWHWP) - Masha
Project/monitoring & usage survey - V1.0
10
� Has lid/cover
� Size is appropriate
� Inside appears clean
5) Do you clean your safe storage container once per week?
� Yes
� No
Section IV: Physical signs of usage
Observe the following to see if the BSF shows signs of usage!
6) Is the depth of the water above the sand according to the requirements?
� Yes
� No
7) Does the safe storage container contain filtered water (at the time of visit)?
� Yes
� No
8) Is there a two bucket system (one container to receive and one container to store)?
� Yes
� No

South Western Household Water Project (SWHWP) - Masha
Project/monitoring & usage survey - V1.0
11
9) Is the lid extensively covered with dust?
� Yes
� No
Section V: Demonstration & knowledge
10) Ask the individual responsible for filtering to demonstrate use of the BSF.
� User demonstrated how to use the BSF correctly.
� User was not able demonstrate how to use the BSF correctly.
11) Ask the individual responsible for filtering to demonstrate/explain how to clean
the BSF and safe storage container.
� User demonstrated/explained cleaning process correctly.
� User was not able demonstrate/explain cleaning process correctly.
Section VI: Functionality
Observe whether the BSF is currently functional!
12) Is the filter in a good location, away from weather and animals?
� Yes
� No
13) Is the BSF is installed correctly?
� Yes
� No

South Western Household Water Project (SWHWP) - Masha
Project/monitoring & usage survey - V1.0
12
14) The filter container has no leaks and the lid as well as the diffuser have no
damage.
� Yes
� No (If no, please describe the damage.)
15) Is the surface of the sand flat and level?
� Yes
� No
16) Is the depth of the water above the sand according to the requirements?
� Yes
� No
17) Is the flow rate of the BSF in a normal range?
� Yes
� No
18) Are the lid and the diffuser in place?
� Yes
� No
Take a picture of the beneficiary with its BSF (Filter ID must be visible)!

South Western Household Water Project (SWHWP) - Masha
Project/monitoring & usage survey - V1.0
13
Guidelines for classifying the sampled household as user / non-user
It is compulsory to cover each of the six topics of the survey. If all six topics outlined are
successfully completed the surveyed household can be classes as a user. If failure occurs in
one or more of the topics, than the respondent is classed as a non-user.
The sampled household give one of the highlighted answers for the questions in the usage
survey to be classed as user:
Topic I: Rate of usage
1) How often do you filter water with the BSF?
� Everyday
� 4-6 times per week
� 2-3 times per week
� 1 time per week
� Less than once per week
� Never
2) When was the last time you filtered water using the BSF?
� Today
� Yesterday
� 2-3 days ago
� 4-7 days ago
� More than a week ago

South Western Household Water Project (SWHWP) - Masha
Project/monitoring & usage survey - V1.0
14
Topic II: Water storage
3) Do you store filtered water?
� Yes
� No
4) If yes, can I see the storage container please?
Document your observations!
� Has narrow mouth
� Has lid/cover
� Size is appropriate
� Inside appears clean
5) Do you clean your safe storage container once per week?
� Yes
� No
Topic III: Physical signs of usage
Observe the following to see if the BSF shows signs of usage!
6) Is the depth of the water above the sand according to the requirements?
� Yes
� No
7) Does the safe storage container contain filtered water (at the time of visit)?
� Yes
� No

South Western Household Water Project (SWHWP) - Masha
Project/monitoring & usage survey - V1.0
15
8) Is there a two bucket system (one container to receive and one container to store)?
� Yes
� No
9) Is the lid extensively covered with dust?
� Yes
� No
Topic IV: Demonstration & knowledge
10) Ask the individual responsible for filtering to demonstrate use of the BSF.
� User demonstrated how to use the BSF correctly.
� User was not able demonstrate how to use the BSF correctly.
11) Ask the individual responsible for filtering to demonstrate/explain how to clean
the BSF and safe storage container.
� User demonstrated/explained cleaning process correctly.
� User was not able demonstrate/explain cleaning process correctly.
Topic V: Functionality
Observe whether the BSF is currently functional!
12) Is the filter in a good location, away from weather and animals?
� Yes
� No

South Western Household Water Project (SWHWP) - Masha
Project/monitoring & usage survey - V1.0
16
13) Is the BSF is installed correctly?
� Yes
� No
14) The filter container has no leaks and the lid as well as the diffuser have no
damage.
� Yes
� No (If no, please describe the damage.)
15) Is the surface of the sand flat and level?
� Yes
� No
16) Is the depth of the water above the sand according to the requirements?
� Yes
� No
17) Is the flow rate of the BSF in a normal range?
� Yes
� No
18) Are the lid and the diffuser in place?
� Yes
� No