the global subsea irm sector - championing the uk subsea sector asia - jason... · 2015-03-31 ·...
TRANSCRIPT
1 SUT London ndash February 2011
The Global
Subsea IRM Sector
Jason Waldie Associate Director
Douglas-Westwood
Subsea Asia Conference Kuala Lumpur 2nd June 2011
2 SUT London ndash February 2011
wwwdw-1com
Our Business
LNG
offshore
onshore
downstream
power
LNG
renewables
History and Locations
bull Established 1990
bull Aberdeen New York amp Canterbury
Setting up in Singapore
Activities amp Service Lines
bull Market research amp analysis
bull Commercial due-diligence
bull Business strategy amp advisory
bull Published market studies
Industry Sector Coverage
bull Oil amp Gas
bull Renewables
bull Power
Large Diversified Client Base
bull 650 projects 400 clients 70 countries
bull Leading global corporates
bull Energy majors and their suppliers
bull Investment banks amp PE firms
bull Government agencies
copy Douglas-Westwood Limited 2011
3 SUT London ndash February 2011
Financial Transaction Credentials Includehellip
Market amp commercial due diligence as part of financial transactions
is one of our largest activities
Further information at wwwdw-1com
copy Douglas-Westwood Limited 2009
euro670 acquisition by
Ferd Private Equity
Fund-raising for rig
newbuild programme
Acquisition by Cable
Solutions Group Inc pound319 million IPO
$768 million IPO Arcapita completes
acquisition of Roxar
Perry Slingsby Systems
capital acquired by Triton
Group Holdings pound535m finance facility
Songa Drilling
pound29 million
Refinancing
pound345 million Rovtech
acquired by Fugro
Acquisition Growth and
Working Capital Facilities
pound15 million MBO of
Motherwell Bridge
Expro Group $675m
acquisition of Powerwell
Services
Inflexion Private Equity
Backs pound22m MBO of
Viking Moorings
pound50 million credit facility
for Sovereigns
acquisition of Forfab
Investor syndicate
$925m acquisition of
ABB Oil amp Gas
$280m acquisition of
KBR Production
Services
pound130m debt facility
to finance the
construction of two
specialist vessels
Epcon Offshore AS
acquisition by M-I
SWACO
Serimer Holdings
acquisition of the UMAX
group
UMAX Ltd
Recapitalisation
pound755 million MBO $719 million IPO AGT Energy acquisition of
50 share of Oilflow
Solutions from Vienco
Management buyout of ESS
Steel Holdings
$305 million project
financing of FPSO RJS-409
(Espadarte Sul)
$180 million project
financing of FSO Cidade de
Macae MV15
Acquisition by
Inflexion Private
Equity
pound142m
acquisition by
Close Brothers
Private Equity
Sale of Motherwell
Bridge to Kuwait Finance
House
NOK 43 billion
joint acquisition
by First Reserve
amp DOF
Acquisition of
APAC division
by Champ
Ventures
Borets Group $150
million debt facility led
by EBRD
MBO backed by
HSBC Private
Equity
Acquisition by SCF
Partners
Acquisition of Anson by
NOV
Acquisition of ASEP by
NOV
Equity investments in
Advantec
4 SUT London ndash February 2011
Energy Macro Factors
Offshore Oil amp Gas
Lifecycle Opportunities
Conclusions
5 SUT London ndash February 2011
Energy Macro Factors
A global drive for energy that is
Sustainable
Secure
Affordable
A growing demand driven by
Population growth
GDP growth
6 SUT London ndash February 2011
The Importance of Oil
Oil is the fuel of
transportation
Demand is growing
Supplies are limited
Prices will rise
Other energy prices often
linked to oil
7 SUT London ndash February 2011 Source Financial Times London 5 January 2011
Source BP
Energy Consumption 1965-2009
00
05
10
15
20
25
30
35
40
45
19
65
19
68
19
71
19
74
19
77
19
80
19
83
19
86
19
89
19
92
19
95
19
98
20
01
20
04
20
07
Bill
ion to
nnes o
f o
il eq
uiv
ele
nt
North America
S amp Cent America
Europe amp Eurasia
Middle East
Africa
Asia Pacif ic
Energy Demand Growth ndash Historic amp Outlook
bull Energy demand growth outpaces population growth (95 v 55)
bull Close correlation between GDP growth and energy consumption
bull Recently driven by growth in China and India
8
bull Spring 08 ndash Spring 09 dramatic
drop in consumption of 5mbpd
from gt87mbpd
bull Strengthening recovery to new
peaks in consumption 876
bull Forecast for 2011 up 12 mbpd
compared to Jan 2010 forecast
bull OECD up modestly in 2010
bull US up 200k
bull EU up 200k
bull Japan down -150k
bull China up 6 +500k
bull Global consumption up 18
mbpd over last year
Source EIA STEO Jan 2010 and Jan 2011
EIA World Oil Consumption Actual and Forecast
million barrels per day (3 mma)
83
84
85
86
87
88
89
Mar
-07
Jul-
07
No
v-0
7
Mar
-08
Jul-
08
No
v-0
8
Mar
-09
Jul-
09
No
v-0
9
Mar
-10
Jul-
10
No
v-1
0
Mar
-11
Jul-
11
No
v-1
1
Actual
Jan 2010 Forecast
Jan 2011 Forecast
Short-term Outlook
9
bull Worldlsquos second largest economy 10 GDP growth
bull ―Astonishing oil demand growth
bull 18 million light vehicle sales vs 136 million prior year (126 m for US in 2010)
bull 120 million new cars by 2015 = all passenger vehicles UK + France + Germany
bull In 2010 China was 13 of total global oil demand growth (less than other Asia and
non-OECD)
bull Chinalsquos foreign oil dependence rises from 1 in 2 bbls to potentially 9 in 10 by 2030
Source EIA Douglas-Westwood Analysis
China Crude Oil Production and Constrained Demand
0
2
4
6
8
10
12
14
16
18
20
Mill
ions o
f barr
els
per
Day
Onshore oil production
Offshore oil production
Oil consumption
5
10
15
20
25
30
35
40
45
50
55
mill
ion b
arr
els
per
day
China as Japan(1960-1973)
China as Korea(1976-1996)
China - EIA IEO2010
Source EIA Douglas-Westwood Analysis
China Unconstrained Demand
Longer Term Outlook China Chinaand Others
For more information please
contact Douglas-Westwood
For m
ore
info
rmatio
n p
lease
conta
ct D
ougla
s-W
estw
ood
10
bull North Sea and Mexico continue
decline
bull Canada flat
bull Brazil underperforms
bull FSUmdashmostly Azerbaijanmdash
doing well
bull China and USA at front of the
pack
bull OPEC NGLs are leading the
way
bull Total world supply up 20 mbpd
half is NGLs
bull EIA expects 2011 largely flat
Source EIA STEO Jan 2011
World Liquids Production Growth 2010
million barrels per day
(600)
(400)
(200)
-
200
400
600
800
1000
Liquids Supply in 2010
11 SUT London ndash February 2011
bull Iraq
bull Output up 300 kbpd to 27 mbpd
bull Potential to increase by 05 mbpd per year to 6-7 mbpd
bull Bakken
bull Output up 80 kpbd to 380000 bpd
bull Potential to add 80 kbpd year potentially to greater than 1 mpbd or more
bull Like gas shales production is front-loaded
bull More to come from other sources
Supply Risks Iraq and Bakken
12
$50
$60
$70
$80
$90
$100
$110
$120
2005 2006 2007 2008 2009 2010 2011 2012 2013 2014 2015
WTI
Cru
de
Oil
Spo
t P
rice
- A
nn
ual
B
asis
- C
urr
en
t D
olla
rs
Actual WTI
EIA - Reference Case
DWL - Base Case
bull We assume supply is flat to modestly increasing
bull Historically US could not add oil consumption at more than 4 of
GDPmdashequals $86
bull In last three months of 2010 US up 230 kbpd at average $85
bull US up 700 kbpd in December at $89
bull WTI at $92mdashabove our expectation of mid-to-high $80s for 2011
bull If US can reset to a higher tolerance for oil prices a substantial oil
price rally could be in store
Source EIA AEO ( adjusted RACC + $150) Douglas-Westwood
Annual WTI Spot Oil Price Forecasts EIA Douglas-Westwood
bull
Current oil price
Medium Term Oil Price Outlook
For more information please
contact Douglas-Westwood
13
0
20
40
60
80
100
Year 2030
Uppsala University
IEA EIA IOClsquos
Douglas-Westwood
Total Production Capacity
Current Production
Only material difference between
Uppsala and IEA is depletion rates
on fields to be discovered and
developed to 2030
Range of Global Oil Supply Forecasts ndash 2030 ndash All
Liquids Source various
bull Petroleum liquids
supply forecasts from
75 ndash 105 mbpd for
2030
bull All are essentially
peak oil forecasts
bull Quiet consensus has
emergedmdash
disagreements are
increasingly narrow
and specific
Long-term Outlook A Narrowing of Views
14
Oil Production ndash The Importance of Offshore
There is an increasing reliance on offshore and deepwater production
bull Offshore oil 25 of global production in 1990 31 in 2000 33 in 2010
and 34 by 2020
bull Deepwater 0 in 1990 2 in 2000 9 in 2010 13 by 2020
Global Oil Production 1950-2025
0
10
20
30
40
50
60
70
80
90
100
1930 1937 1944 1951 1958 1965 1972 1979 1986 1993 2000 2007 2014 2021
mill
ion b
arr
els
of
oil
per
day
Bitumen and Oil Sands
Offshore Deep
Offshore Shallow
Conventional Onshore
For m
ore
info
rmatio
n p
lease
conta
ct D
ougla
s-W
estw
ood
15
Peak Oil is a Reality
Data Petroleum Review May 2010
bull With most of the easy oillsquo in the hands of the NOCs
majors are scrambling to replace reserves and off-
set production decline
bull They are moving to harsh environments ndash offshore
deepwater politically difficult geographically remote
Peak Year
2002 2003 2004 2005 2006 2007 2008 2009
ExxonMobil 2496 2516 2571 2523 2681 2616 2404 2387
BP 2018 2121 2531 2562 2475 2414 2410 2535
PetroChina 2109 2119 2233 2270 2276 2312 2380 2311
Shell 2359 2379 2253 2093 2030 1899 1771 1680
Petrobras 1533 1701 1661 1847 1908 1920 1996 2103
Chevron 1897 1823 1737 1701 1759 1783 1676 1872
Total 1589 1661 1695 1621 1506 1509 1456 1381
ConocoPhillips 891 1237 1242 1447 1698 1644 1367 1615
ENI 921 981 1034 1111 1079 1020 1026 1007
StatoilHydro 1112 1132 1135 1102 1058 1054 1056 1067
Source Offshore Technology
NOCs (limited equity access )
78
NOCs (equity access)
10
New Russian Companies
6
Full IOC access6
Restricted access to oil reserves
16 SUT London ndash February 2011
85
86
87
88
89
90
91
92
93
94
95
2009 2010 2011 2012 2013
mill
ion
bar
rels
pe
r d
ay
Demand Growth as 2002-2005
Demand Growth as 1976-1979
IEA Supply Demand Forecast
Effective Global Liquids Production Capacity
Medium term outlook risks of oil shock growing
bull Adequate spare capacity today ndash
but frac34 of it is in Saudi
bull IEA sees demand rising slowly
less than 14 mbpd year in 2011
bull Previous recoveries saw strong
demand growth during first three
years
bull After 2002 77 mbpd
bull After 1976 73 mbpd
bull If previous patterns hold true a
possible supply crunch in
20122013
bull What will Saudi do Source IEA Douglas-Westwood analysis
Oil Demand under Three Scenarios and Global
Liquids Production Capacity
Oil shock
IEA forecast (2010)
Surplus Capacity
bull Dec 2010 demand
Spare Capacity at Saudi 10 mbpd limit
bull Jan 2011 forecast
For m
ore
info
rmatio
n p
lease
conta
ct D
ougla
s-W
estw
ood
17 SUT London ndash February 2011
The WikiLeaks Saudi cables
Crude oil reserves may have been overstated by as much as 300bn barrels
ndash nearly 40
bull Al-Husseini [believes] Aramcos reserves are overstated by as much
as 300bn barrels In his view once 50 of original proven reserves has
been reached hellip a steady output in decline will ensue and no amount of
effort will be able to stop it He believes that what will result is a plateau in
total output that will last approximately 15 years followed by decreasing
outputldquo
bull ldquoClearly they [Saudi] can drive prices up but we question whether they
any longer have the power to drive prices down for a prolonged periodrdquo
Source US Embassy cables to Washington 2007-2009 The Guardian 8 February 2010
Sadad al-Husseini a geologist and former head of exploration at the Saudi oil monopoly Aramco met the US
consul general in Riyadh in November 2007
18
United States
Russia
Iran
Qatar
Other OPEC
Rest of World
100
yearslsquo
US
supply
05
10
15
20
25
30
19
98
19
99
20
00
20
01
20
02
20
03
20
04
20
05
20
06
20
07
20
08
20
09
20
10
20
11
20
12
20
13
20
14
20
15
20
16
20
17
20
18
20
19
Btu ratio Oil-to-Gas
Avg ratio Feb 2010 -Dec 2018Avg ratio 1998 - 2005
Oil-to-Gas Price Ratio on a BTU Parity Basis Source EIA NYMEX futures
Proved Gas Reserves 6300 trillion cubic feet (60 years) Source EIA
bull Gas shales have revolutionized US outlook
bull 100 yearslsquo supply in US resources 2 quadrillion cf resources on 23 tcf consumption
bull Some questions about economics but $7-8 mmbtu gas looks plausible indefinitely
bull Other shale initiatives beginning (BP in China)
bull Major LNG projects continue to come on line
bull Right now the world looks to have plenty of natural gas
The Gas Story is Very Different
For more information please
contact Douglas-Westwood
19 SUT London ndash February 2011
bull Dominated by E Europe amp FSU but others to see significant growth
bull Deepwater gas and LNG to be of growing importance
bull Impact of shale gas on North America (amp other markets)
bull But local supply issues eg Europe to import gt73 by 2020
Natural gas production and use to soar
Source Energyfiles
0
10
20
30
40
50
60
70
80
90
100
1930 1937 1944 1951 1958 1965 1972 1979 1986 1993 2000 2007 2014 2021
million b
arr
els
of o
il eq
uiv
ale
nt p
er d
ay
Africa
Asia
Australasia
Eastern Europe amp FSU
Latin America
Middle East
North America
Western Europe
ME
FSU
NA
For m
ore
info
rmatio
n p
lease
conta
ct D
ougla
s-W
estw
ood
20 SUT London ndash February 2011
10
2428
31
3941
47 48
5356
60
0
1
2
3
4
5
6
Capex ($ m
llion m
W)
Source EIA Nov 2010
Gas ndash lowest Capex for power plants
21 SUT London ndash February 2011
Gas ndash FLNG in prospect
bull Liquefaction ndash $20 bn spend by 2017
bull Australasia to account for 60
bull Woodside has raised the prospect of FLNG for its Greater Sunrise project
bull Inpex (Japan) considering FLNG at its $196 billion Abadi field in Indonesia
bull GDF Suez and Australias Santos set up a joint venture to develop a floating
LNG project off northwest Australia
Picture Shell
Source The World FLNG Report Douglas-Westwood
0
1
2
3
4
5
6
7
8
2006 2007 2008 2009 2010 2011 2012 2013 2014 2015 2016 2017
Exp
en
ditur
e ($ b
illio
n)
Africa
Asia
Australasia
Latin America
Middle East
North America
0
1
2
3
4
5
6
7
8
2006 2007 2008 2009 2010 2011 2012 2013 2014 2015 2016 2017
Exp
en
ditur
e ($ b
illio
n)
Africa
Asia
Australasia
Latin America
Middle East
North America
$67bn
For more information please
contact Douglas-Westwood
22 SUT London ndash February 2011
$0
$100
$200
$300
$400
$500
$600
1995
1996
1997
1998
1999
2000
2001
2002
2003
2004
2005
2006
2007
2008
2009
2010
2011
US
Do
llar
Bil
lio
ns
Outside North America
Canada
United States
bull Recovery in 2010 up 10 to $442 bn
bull Continued growth in 2011 to $490 bn up 11 a new peak
bull US spend up 8 Canada up 5 international up 12
bull Spend up $48 bn in 2011 of which 82 is international
Recovery and growth in global EampP spend
Source Jim Crandell Barclaylsquos EampP Spending Survey December 2010
Global EampP Spend
+10 -15 +11
23 SUT London ndash February 2011
0
10
20
30
40
50
60
70
80
90
100
$70 $75 $80 $85 $90 $95 $100
Cu
mu
lati
ve P
erc
en
t o
f R
esp
on
de
nts
0
10
20
30
40
50
60
70
80
90
100
$35 $40 $45 $50 $55 $60 $65 $70 $75
Cu
mu
lati
ve P
erc
en
t o
f R
esp
on
de
nts
bull EampP companies prepared budgets assuming $77 oil on average
up from $70 last year
bull Expect capex to materially decrease in the industry if oil prices fall
much below $60
bull Expect capex to increase materially if oil prices sustain above $90
up from $85 last year
Source Barclays Capital EampP Spending Survey Dec2010
Oil Price Threshold for Reducing Capex Oil Price Threshold for Increasing Capex
Source Barclays Capital EampP Spending Survey Dec2010
Percent of Respondents Decreasing Capex at a Given Oil Price
Percent of Respondents Increasing Capex at a Given Oil Price
2011 ndash EampP Spend Sensitivity to Oil Prices
24 SUT London ndash February 2011
Offshore Oil amp Gas
Nowhere else left for big finds
Strong Capex growth
Importance of deepwater
The beauty of Opex
25 SUT London ndash February 2011
Global offshore oil amp gas production amp spend to grow
Source Datamonitor
bull Global Capex fell in lsquo0910 but Opex grew
bull Both Capex amp Opex to grow strongly in the years ahead
bull 28 new rigs ordered since October + 8 options 10-15 more in 2011
bull Deepwater Capex to exceed $205 billion
0
20
40
60
80
100
120
140
160
180
200
2006 2007 2008 2009 2010 2011 2012 2013 2014 2015
Ex
pe
nd
itu
re ($
bill
ion
s)
AfricaAsiaAustralasiaEastern Europe and FSULatin AmericaMiddle EastNorth AmericaWestern Europe For more information please
contact Douglas-Westwood
26 SUT London ndash February 2011
OPTIONS
ORDERS
The next rig cycle begins
27 SUT London ndash February 2011
Deepwater Capex to reach new highs
bull Deepwater production to double
bull Drilling $72bn (35) Subsea processing emerging ($26 bn)
Source ldquoThe World Deepwater Market Report 2011-2015rdquo
Douglas-Westwood
0
10
20
30
40
50
60
70
2006 2007 2008 2009 2010 2011 2012 2013 2014 2015
Exp
en
ditur
e ($ b
illio
ns)
DrillingFloating PlatformsPipelinesSubsea ProductionSubsea ProcessingSURF
For more information please
contact Douglas-Westwood
28 SUT London ndash February 2011
Deepwater ndash Africa amp Brazil to lead spend
bull Brazil amp W Africa to total $126bn (62)
bull But much more Brazil spend to come
Source ldquoThe World Deepwater Market Report 2011-2015rdquo
Douglas-Westwood
0
10
20
30
40
50
60
70
2006 2007 2008 2009 2010 2011 2012 2013 2014 2015
Exp
en
ditur
e ($ b
illio
ns)
AfricaAsiaAustralasiaEastern Europe and FSULatin AmericaMiddle EastNorth AmericaWestern Europe
For more information please
contact Douglas-Westwood
29 SUT London ndash February 2011
Brazil ndash Petrobrasrsquos pre-salt deepwater lsquoshopping listrsquo
50 bn boe reserves 2 million production bpd by 2020
By 2018
bull Includes 58 new drilling rigs
By 2020
bull 72 VLCCs
bull 146 supply amp service vessels
bull 45 production platforms
bull Plus subsea hardware
Finance
bull 2010 $70bn stock offering
bull 2011 $6bn corporate bond
bull Next 4 years $30-40bn debt raising
bull Capex of $224bn by 2014
bull Capex amp Opex to total $1 trillion
Tupi Discovery Source CGG Veritas
30 SUT London ndash February 2011
Floating production recovery expected
Global Floating Production Expenditure Source Douglas-Westwood
bull Material decrease in orders in 2009 but market bottomed in 2010
bull Increasing share of market to leased FPSOs Consolidation likely
bull Deepwater Horizon unlikely to impact GoM small part of the market
bull Long term gt200 prospects exist and growth will return
bull Market to reach $16 billion in 2014
0
2
4
6
8
10
12
14
16
18
2006 2007 2008 2009 2010 2011 2012 2013 2014 2015
Exp
en
ditur
e ($ b
illio
ns)
AfricaAsiaAustralasiaEE amp FSULatin AmericaMiddle EastNorth AmericaWestern Europe
For more information please
contact Douglas-Westwood
31 SUT London ndash February 2011
Subsea
Hardware
Operational Demands
Inspection Maintenance Repair
Well intervention
ROV AUV and Subsea Vessels
Operations Market
32 SUT London ndash February 2011
Subsea technology is vital to offshore production
bull Unlocking deepwater reserves
bull Improving economics of marginal fields in shallow waters
bull Tie-backs of small reservoirs into existing facilities
Subsea ndash long term outlook is sound
0
5
10
15
20
25
30
35
40
45
50
0
10
20
30
40
50
60
70
80
2001 2004 2007 2010 2013 2016 2019 2022 2025
Mill
ion B
oep
d
Topside ProductionSubsea Production Subsea Production
Offshore Production 2000-2025 Source Datamonitor
For more information please
contact Douglas-Westwood
33 SUT London ndash February 2011
$0
$5
$10
$15
$20
$25
$30
$35
$40
2006 2007 2008 2009 2010 2011 2012 2013 2014 2015
Exp
en
ditur
e $
bn
Africa AsiaAustralasia Eastern Europe amp FSULatin America Middle EastNorth America NorwayRoWE UK
bull $135 billion forecast for next five years
bull Pipelines to account for half of forecast expenditure
bull Major pipeline projects in Eastern Europe amp FSU Asia and the Middle
East
bull Subsea production hardware SURF and subsea processing driven by
deepwater regions
Source FMC Technologies
Subsea Hardware
For more information please
contact Douglas-Westwood
34 SUT London ndash February 2011
0
10
20
30
40
50
60
70
80
Mill
ion B
oepd
Incremental ProductionLost through DeclineProduction Base
Global Offshore Production 2010-2015 Source Datamonitor
bull 462 million boepd in 2010
bull Average global decline rates of 51 (115 in North Sea)
bull Substantial investment in operational expenditure to be required
Operational demands intensifying
For more information please
contact Douglas-Westwood
35 SUT London ndash February 2011
Offshore ops amp maint spend to see good growth
Source ldquoThe World Offshore Operations amp Maintenance Market Report 2010-14rdquo
Douglas-Westwood
$0
$10
$20
$30
$40
$50
$60
$70
$80
2005 2006 2007 2008 2009 2010 2011 2012 2013 2014
$bill
ions
AfricaAsia-PacificEastern Europe amp FSULatin AmericaMiddle EastNorth AmericaNorwayUKRest of Europe
bull gt7000 fixed amp gt200 floating platforms
bull Plus demand for major modifications
Fo
r more
info
rmatio
n p
lease
conta
ct D
ougla
s-W
estw
ood
36 SUT London ndash February 2011
Subsea IRM Expenditure 2004-2015 Source Douglas-Westwood
bull Over 7000 production platforms 190000km of pipeline currently installed
bull $28 billion of expenditure in Subsea IRM in 2010
bull Nearly $20 billion of further investment expected over the next five years
bull 55 forecast expenditure expected in the North Sea amp Gulf of Mexico
bull Less exposure to market cyclicality
00
10
20
30
40
50
60
2005 2006 2007 2008 2009 2010 2011 2012 2013 2014 2015
$m
illio
ns
Others
Western Europe
North America
Latin America
Asia-Pacific
Africa
Subsea Inspection Repair amp Maintenance
For m
ore
info
rmatio
n p
lease
conta
ct D
ougla
s-W
estw
ood
37 SUT London ndash February 2011
Subsea Well Intervention Expenditure 2004-2015 Source Douglas-Westwood
bull Demand driven by production decline of existing wells Nearly 4000 active
bull Market has been historically been constrained by technology amp economics
bull Deepwater intervention to become increasingly significant to global demand
00
05
10
15
20
25
2005 2006 2007 2008 2009 2010 2011 2012 2013 2014 2015
$bill
ions
Others
Western Europe
North America
Latin America
Asia-Pacific
Africa
Subsea Well Intervention
For more information please
contact Douglas-Westwood
38 SUT London ndash February 2011
320
370
420
470
520
570
620
$00
$05
$10
$15
$20
$25
$30
$35
2005 2006 2007 2008 2009 2010 2011 2012 2013 2014
Ac
tiv
e R
OV
s
Ex
pe
nd
itu
re ($
billio
ns
)
Africa
Asia Pacific
E EuropeFSU
Latin America
Middle East
North America
Western Europe
Active ROVs
The World Work Class ROV Operations Market 2005-2014
(Oil amp Gas) Source ―The World ROV Report 2010-2014 ndash Douglas-Westwood
ROV Paces the Growth of Deepwater
For m
ore
info
rmatio
n p
lease
conta
ct D
ougla
s-W
estw
ood
39 SUT London ndash February 2011
bull Self-guided under water survey and inspection vessels
bull From 1 to 5 meters long
bull Priced from $150000 to $7 million
bull Very hot topic recentlymdashmilitary contractors looking for commercial
applications
bull Greater acceptance for not only deep but shallow water oil and gas
survey
bull But a small market
Hugin 1000 MR AUV Courtesy Kongsberg Marine
AUV ndash Autonomous Underwater Vehicles
40 SUT London ndash February 2011
Subsea Vessel Operations Market
Subsea Operation Vessel Demand by Workscope Source Douglas-Westwood
bull Current IRM market demand for around 92 vessels
bull Field development market still depressed ndash upturn in 2012 amp beyond
bull Well intervention and PampA to see substantial growth
-
50
100
150
200
250
300
2005 2006 2007 2008 2009 2010 2011 2012 2013 2014 2015
V
essels
Intervention amp PampA
Field Development
Inspection Repair amp Maintenance
For m
ore
info
rmatio
n p
lease
conta
ct D
ougla
s-W
estw
ood
41 SUT London ndash February 2011
Macondo ndash a $40 billion tragedy
bull 11 dead
bull Environmental amp PR disaster
bull Blamed on ldquoa failure of
managementrdquo
bull ldquoThe costs of getting it wrong
have gone up a lotrdquo Ceres
bull Will liabilities of deepwater
mean that only the majors can
participate in US
bull Regulatory change bringing
US standards in line with best
practise
bull But US dependence on
deepwater is clear
bull Little long-term impact
elsewhere
US Gulf of Mexico Oil Production ( 2010 view)
0
200
400
600
800
1000
1200
1400
1600
1800
2000
1993 1995 1997 1999 2001 2003 2005 2007 2009F 2011F 2013F 2015F
Barr
els
per
day (
000s)
Additional Deepwater Potential
Deepwater Oil
Shallow Water Oil
Deepwater
42 SUT London ndash February 2011
The next last offshore frontier
43 SUT London ndash February 2011
The Arctic
Credit Hugo Ahlenius UNEPGRID-Arendal
bull Over 400 fields discovered with
approx 240 bn Bboe
bull Further 412 bn Boe yet
undiscovered (USGS) technically
recoverable resources
bull Approx 84 offshore
bull 90 billion barrels (13) of the
worlds undiscovered oil reserves
and 30 of the gas resources
according to USGS
bull But USGS recently reduced
Alaska oil resources by 90
44 SUT London ndash February 2011
Some arctic projects
Norway - Goliat bull Predominantly oil
bull Extended shutdown now back on line
Cairn bull Two drilling rigs off coast of Greenland
bull Modestly promising results to date
Hebron ndash ExxonMobil bull East Canada
bull Fourth Newfoundland field
bull 400 ndash 700 m barrels 92 meters
bull First oil 2017
Shell bull Chukchi and Beaufort seas
bull Permits pulled
bull One year delay
bull Macondo will cast a long shadow
Goliat Source Eni Norge
Sevan 1000 Source Sevan
45 SUT London ndash February 2011
Lifecycle Opportunities
The easy oil goes first
NOCs need to internationalise
And local OFS companies
46 SUT London ndash February 2011
Hyd
roca
rbo
n P
rod
uctio
n
Australia
UK
China
Norway
Thailand
Malaysia
USA
46
Points on the OampG life cycle
bull Australia ndash to see good EampP (gas) growth over the next decade
bull China ndash still growing (mainly from offshore)
bull Malaysia ndash near peak Marginals amp EOR focus High CO2 gas OFS
bull Norway ndash drive to internationalisation of OFS industry
bull UK ndash terminal production decline Decommissioning
Growth Peak and plateau EampP
begins Conventional production decline
Each phase offers a different business opportunity
47 SUT London ndash February 2011
The significance of the national oil company
bull NOCs can be tasked with building a local supply chain
bull and building a knowledge base
bull Examples include
bull Petrobras ndash massive drive to build Brazilian OFS industry
bull Statoil ndash major RampD focus aids Norwegian companies
bull Petronas ndash a heavy focus on local needs
bull But ultimately local OampG production declines
bull Then NOCs need to access other countrieslsquo reserves
bull local OFS companies have to gain business in world markets
bull Then need to upscale and gain external investment
48 SUT London ndash February 2011
Conclusions
49 SUT London ndash February 2011
Conclusions
bull Global economic growth has resumed
bull Oil supply outlook remains restrained
bull Will OPEC answer the call for its nominal spare capacity
bull Oil prices are high but few visible drivers to push them down
bull OFS pricing competition should remain pronounced in 2011
bull Spare capacity in offshore sector rigs equipment services
bull High oil prices and restrained cost pressures should encourage
operators to bring projects forward ndash activity levels should pick up
bull Market players appear to be anticipating the next cycle
bull A good future for the Subsea IRM sector
50 SUT London ndash February 2011
Thank you
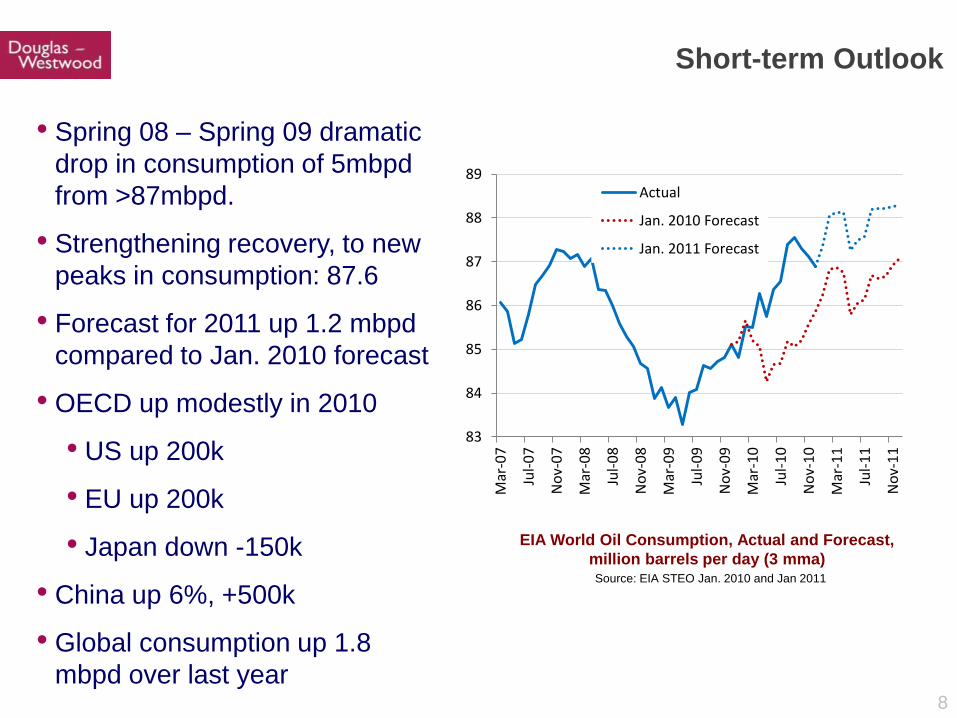
8
bull Spring 08 ndash Spring 09 dramatic
drop in consumption of 5mbpd
from gt87mbpd
bull Strengthening recovery to new
peaks in consumption 876
bull Forecast for 2011 up 12 mbpd
compared to Jan 2010 forecast
bull OECD up modestly in 2010
bull US up 200k
bull EU up 200k
bull Japan down -150k
bull China up 6 +500k
bull Global consumption up 18
mbpd over last year
Source EIA STEO Jan 2010 and Jan 2011
EIA World Oil Consumption Actual and Forecast
million barrels per day (3 mma)
83
84
85
86
87
88
89
Mar
-07
Jul-
07
No
v-0
7
Mar
-08
Jul-
08
No
v-0
8
Mar
-09
Jul-
09
No
v-0
9
Mar
-10
Jul-
10
No
v-1
0
Mar
-11
Jul-
11
No
v-1
1
Actual
Jan 2010 Forecast
Jan 2011 Forecast
Short-term Outlook
9
bull Worldlsquos second largest economy 10 GDP growth
bull ―Astonishing oil demand growth
bull 18 million light vehicle sales vs 136 million prior year (126 m for US in 2010)
bull 120 million new cars by 2015 = all passenger vehicles UK + France + Germany
bull In 2010 China was 13 of total global oil demand growth (less than other Asia and
non-OECD)
bull Chinalsquos foreign oil dependence rises from 1 in 2 bbls to potentially 9 in 10 by 2030
Source EIA Douglas-Westwood Analysis
China Crude Oil Production and Constrained Demand
0
2
4
6
8
10
12
14
16
18
20
Mill
ions o
f barr
els
per
Day
Onshore oil production
Offshore oil production
Oil consumption
5
10
15
20
25
30
35
40
45
50
55
mill
ion b
arr
els
per
day
China as Japan(1960-1973)
China as Korea(1976-1996)
China - EIA IEO2010
Source EIA Douglas-Westwood Analysis
China Unconstrained Demand
Longer Term Outlook China Chinaand Others
For more information please
contact Douglas-Westwood
For m
ore
info
rmatio
n p
lease
conta
ct D
ougla
s-W
estw
ood
10
bull North Sea and Mexico continue
decline
bull Canada flat
bull Brazil underperforms
bull FSUmdashmostly Azerbaijanmdash
doing well
bull China and USA at front of the
pack
bull OPEC NGLs are leading the
way
bull Total world supply up 20 mbpd
half is NGLs
bull EIA expects 2011 largely flat
Source EIA STEO Jan 2011
World Liquids Production Growth 2010
million barrels per day
(600)
(400)
(200)
-
200
400
600
800
1000
Liquids Supply in 2010
11 SUT London ndash February 2011
bull Iraq
bull Output up 300 kbpd to 27 mbpd
bull Potential to increase by 05 mbpd per year to 6-7 mbpd
bull Bakken
bull Output up 80 kpbd to 380000 bpd
bull Potential to add 80 kbpd year potentially to greater than 1 mpbd or more
bull Like gas shales production is front-loaded
bull More to come from other sources
Supply Risks Iraq and Bakken
12
$50
$60
$70
$80
$90
$100
$110
$120
2005 2006 2007 2008 2009 2010 2011 2012 2013 2014 2015
WTI
Cru
de
Oil
Spo
t P
rice
- A
nn
ual
B
asis
- C
urr
en
t D
olla
rs
Actual WTI
EIA - Reference Case
DWL - Base Case
bull We assume supply is flat to modestly increasing
bull Historically US could not add oil consumption at more than 4 of
GDPmdashequals $86
bull In last three months of 2010 US up 230 kbpd at average $85
bull US up 700 kbpd in December at $89
bull WTI at $92mdashabove our expectation of mid-to-high $80s for 2011
bull If US can reset to a higher tolerance for oil prices a substantial oil
price rally could be in store
Source EIA AEO ( adjusted RACC + $150) Douglas-Westwood
Annual WTI Spot Oil Price Forecasts EIA Douglas-Westwood
bull
Current oil price
Medium Term Oil Price Outlook
For more information please
contact Douglas-Westwood
13
0
20
40
60
80
100
Year 2030
Uppsala University
IEA EIA IOClsquos
Douglas-Westwood
Total Production Capacity
Current Production
Only material difference between
Uppsala and IEA is depletion rates
on fields to be discovered and
developed to 2030
Range of Global Oil Supply Forecasts ndash 2030 ndash All
Liquids Source various
bull Petroleum liquids
supply forecasts from
75 ndash 105 mbpd for
2030
bull All are essentially
peak oil forecasts
bull Quiet consensus has
emergedmdash
disagreements are
increasingly narrow
and specific
Long-term Outlook A Narrowing of Views
14
Oil Production ndash The Importance of Offshore
There is an increasing reliance on offshore and deepwater production
bull Offshore oil 25 of global production in 1990 31 in 2000 33 in 2010
and 34 by 2020
bull Deepwater 0 in 1990 2 in 2000 9 in 2010 13 by 2020
Global Oil Production 1950-2025
0
10
20
30
40
50
60
70
80
90
100
1930 1937 1944 1951 1958 1965 1972 1979 1986 1993 2000 2007 2014 2021
mill
ion b
arr
els
of
oil
per
day
Bitumen and Oil Sands
Offshore Deep
Offshore Shallow
Conventional Onshore
For m
ore
info
rmatio
n p
lease
conta
ct D
ougla
s-W
estw
ood
15
Peak Oil is a Reality
Data Petroleum Review May 2010
bull With most of the easy oillsquo in the hands of the NOCs
majors are scrambling to replace reserves and off-
set production decline
bull They are moving to harsh environments ndash offshore
deepwater politically difficult geographically remote
Peak Year
2002 2003 2004 2005 2006 2007 2008 2009
ExxonMobil 2496 2516 2571 2523 2681 2616 2404 2387
BP 2018 2121 2531 2562 2475 2414 2410 2535
PetroChina 2109 2119 2233 2270 2276 2312 2380 2311
Shell 2359 2379 2253 2093 2030 1899 1771 1680
Petrobras 1533 1701 1661 1847 1908 1920 1996 2103
Chevron 1897 1823 1737 1701 1759 1783 1676 1872
Total 1589 1661 1695 1621 1506 1509 1456 1381
ConocoPhillips 891 1237 1242 1447 1698 1644 1367 1615
ENI 921 981 1034 1111 1079 1020 1026 1007
StatoilHydro 1112 1132 1135 1102 1058 1054 1056 1067
Source Offshore Technology
NOCs (limited equity access )
78
NOCs (equity access)
10
New Russian Companies
6
Full IOC access6
Restricted access to oil reserves
16 SUT London ndash February 2011
85
86
87
88
89
90
91
92
93
94
95
2009 2010 2011 2012 2013
mill
ion
bar
rels
pe
r d
ay
Demand Growth as 2002-2005
Demand Growth as 1976-1979
IEA Supply Demand Forecast
Effective Global Liquids Production Capacity
Medium term outlook risks of oil shock growing
bull Adequate spare capacity today ndash
but frac34 of it is in Saudi
bull IEA sees demand rising slowly
less than 14 mbpd year in 2011
bull Previous recoveries saw strong
demand growth during first three
years
bull After 2002 77 mbpd
bull After 1976 73 mbpd
bull If previous patterns hold true a
possible supply crunch in
20122013
bull What will Saudi do Source IEA Douglas-Westwood analysis
Oil Demand under Three Scenarios and Global
Liquids Production Capacity
Oil shock
IEA forecast (2010)
Surplus Capacity
bull Dec 2010 demand
Spare Capacity at Saudi 10 mbpd limit
bull Jan 2011 forecast
For m
ore
info
rmatio
n p
lease
conta
ct D
ougla
s-W
estw
ood
17 SUT London ndash February 2011
The WikiLeaks Saudi cables
Crude oil reserves may have been overstated by as much as 300bn barrels
ndash nearly 40
bull Al-Husseini [believes] Aramcos reserves are overstated by as much
as 300bn barrels In his view once 50 of original proven reserves has
been reached hellip a steady output in decline will ensue and no amount of
effort will be able to stop it He believes that what will result is a plateau in
total output that will last approximately 15 years followed by decreasing
outputldquo
bull ldquoClearly they [Saudi] can drive prices up but we question whether they
any longer have the power to drive prices down for a prolonged periodrdquo
Source US Embassy cables to Washington 2007-2009 The Guardian 8 February 2010
Sadad al-Husseini a geologist and former head of exploration at the Saudi oil monopoly Aramco met the US
consul general in Riyadh in November 2007
18
United States
Russia
Iran
Qatar
Other OPEC
Rest of World
100
yearslsquo
US
supply
05
10
15
20
25
30
19
98
19
99
20
00
20
01
20
02
20
03
20
04
20
05
20
06
20
07
20
08
20
09
20
10
20
11
20
12
20
13
20
14
20
15
20
16
20
17
20
18
20
19
Btu ratio Oil-to-Gas
Avg ratio Feb 2010 -Dec 2018Avg ratio 1998 - 2005
Oil-to-Gas Price Ratio on a BTU Parity Basis Source EIA NYMEX futures
Proved Gas Reserves 6300 trillion cubic feet (60 years) Source EIA
bull Gas shales have revolutionized US outlook
bull 100 yearslsquo supply in US resources 2 quadrillion cf resources on 23 tcf consumption
bull Some questions about economics but $7-8 mmbtu gas looks plausible indefinitely
bull Other shale initiatives beginning (BP in China)
bull Major LNG projects continue to come on line
bull Right now the world looks to have plenty of natural gas
The Gas Story is Very Different
For more information please
contact Douglas-Westwood
19 SUT London ndash February 2011
bull Dominated by E Europe amp FSU but others to see significant growth
bull Deepwater gas and LNG to be of growing importance
bull Impact of shale gas on North America (amp other markets)
bull But local supply issues eg Europe to import gt73 by 2020
Natural gas production and use to soar
Source Energyfiles
0
10
20
30
40
50
60
70
80
90
100
1930 1937 1944 1951 1958 1965 1972 1979 1986 1993 2000 2007 2014 2021
million b
arr
els
of o
il eq
uiv
ale
nt p
er d
ay
Africa
Asia
Australasia
Eastern Europe amp FSU
Latin America
Middle East
North America
Western Europe
ME
FSU
NA
For m
ore
info
rmatio
n p
lease
conta
ct D
ougla
s-W
estw
ood
20 SUT London ndash February 2011
10
2428
31
3941
47 48
5356
60
0
1
2
3
4
5
6
Capex ($ m
llion m
W)
Source EIA Nov 2010
Gas ndash lowest Capex for power plants
21 SUT London ndash February 2011
Gas ndash FLNG in prospect
bull Liquefaction ndash $20 bn spend by 2017
bull Australasia to account for 60
bull Woodside has raised the prospect of FLNG for its Greater Sunrise project
bull Inpex (Japan) considering FLNG at its $196 billion Abadi field in Indonesia
bull GDF Suez and Australias Santos set up a joint venture to develop a floating
LNG project off northwest Australia
Picture Shell
Source The World FLNG Report Douglas-Westwood
0
1
2
3
4
5
6
7
8
2006 2007 2008 2009 2010 2011 2012 2013 2014 2015 2016 2017
Exp
en
ditur
e ($ b
illio
n)
Africa
Asia
Australasia
Latin America
Middle East
North America
0
1
2
3
4
5
6
7
8
2006 2007 2008 2009 2010 2011 2012 2013 2014 2015 2016 2017
Exp
en
ditur
e ($ b
illio
n)
Africa
Asia
Australasia
Latin America
Middle East
North America
$67bn
For more information please
contact Douglas-Westwood
22 SUT London ndash February 2011
$0
$100
$200
$300
$400
$500
$600
1995
1996
1997
1998
1999
2000
2001
2002
2003
2004
2005
2006
2007
2008
2009
2010
2011
US
Do
llar
Bil
lio
ns
Outside North America
Canada
United States
bull Recovery in 2010 up 10 to $442 bn
bull Continued growth in 2011 to $490 bn up 11 a new peak
bull US spend up 8 Canada up 5 international up 12
bull Spend up $48 bn in 2011 of which 82 is international
Recovery and growth in global EampP spend
Source Jim Crandell Barclaylsquos EampP Spending Survey December 2010
Global EampP Spend
+10 -15 +11
23 SUT London ndash February 2011
0
10
20
30
40
50
60
70
80
90
100
$70 $75 $80 $85 $90 $95 $100
Cu
mu
lati
ve P
erc
en
t o
f R
esp
on
de
nts
0
10
20
30
40
50
60
70
80
90
100
$35 $40 $45 $50 $55 $60 $65 $70 $75
Cu
mu
lati
ve P
erc
en
t o
f R
esp
on
de
nts
bull EampP companies prepared budgets assuming $77 oil on average
up from $70 last year
bull Expect capex to materially decrease in the industry if oil prices fall
much below $60
bull Expect capex to increase materially if oil prices sustain above $90
up from $85 last year
Source Barclays Capital EampP Spending Survey Dec2010
Oil Price Threshold for Reducing Capex Oil Price Threshold for Increasing Capex
Source Barclays Capital EampP Spending Survey Dec2010
Percent of Respondents Decreasing Capex at a Given Oil Price
Percent of Respondents Increasing Capex at a Given Oil Price
2011 ndash EampP Spend Sensitivity to Oil Prices
24 SUT London ndash February 2011
Offshore Oil amp Gas
Nowhere else left for big finds
Strong Capex growth
Importance of deepwater
The beauty of Opex
25 SUT London ndash February 2011
Global offshore oil amp gas production amp spend to grow
Source Datamonitor
bull Global Capex fell in lsquo0910 but Opex grew
bull Both Capex amp Opex to grow strongly in the years ahead
bull 28 new rigs ordered since October + 8 options 10-15 more in 2011
bull Deepwater Capex to exceed $205 billion
0
20
40
60
80
100
120
140
160
180
200
2006 2007 2008 2009 2010 2011 2012 2013 2014 2015
Ex
pe
nd
itu
re ($
bill
ion
s)
AfricaAsiaAustralasiaEastern Europe and FSULatin AmericaMiddle EastNorth AmericaWestern Europe For more information please
contact Douglas-Westwood
26 SUT London ndash February 2011
OPTIONS
ORDERS
The next rig cycle begins
27 SUT London ndash February 2011
Deepwater Capex to reach new highs
bull Deepwater production to double
bull Drilling $72bn (35) Subsea processing emerging ($26 bn)
Source ldquoThe World Deepwater Market Report 2011-2015rdquo
Douglas-Westwood
0
10
20
30
40
50
60
70
2006 2007 2008 2009 2010 2011 2012 2013 2014 2015
Exp
en
ditur
e ($ b
illio
ns)
DrillingFloating PlatformsPipelinesSubsea ProductionSubsea ProcessingSURF
For more information please
contact Douglas-Westwood
28 SUT London ndash February 2011
Deepwater ndash Africa amp Brazil to lead spend
bull Brazil amp W Africa to total $126bn (62)
bull But much more Brazil spend to come
Source ldquoThe World Deepwater Market Report 2011-2015rdquo
Douglas-Westwood
0
10
20
30
40
50
60
70
2006 2007 2008 2009 2010 2011 2012 2013 2014 2015
Exp
en
ditur
e ($ b
illio
ns)
AfricaAsiaAustralasiaEastern Europe and FSULatin AmericaMiddle EastNorth AmericaWestern Europe
For more information please
contact Douglas-Westwood
29 SUT London ndash February 2011
Brazil ndash Petrobrasrsquos pre-salt deepwater lsquoshopping listrsquo
50 bn boe reserves 2 million production bpd by 2020
By 2018
bull Includes 58 new drilling rigs
By 2020
bull 72 VLCCs
bull 146 supply amp service vessels
bull 45 production platforms
bull Plus subsea hardware
Finance
bull 2010 $70bn stock offering
bull 2011 $6bn corporate bond
bull Next 4 years $30-40bn debt raising
bull Capex of $224bn by 2014
bull Capex amp Opex to total $1 trillion
Tupi Discovery Source CGG Veritas
30 SUT London ndash February 2011
Floating production recovery expected
Global Floating Production Expenditure Source Douglas-Westwood
bull Material decrease in orders in 2009 but market bottomed in 2010
bull Increasing share of market to leased FPSOs Consolidation likely
bull Deepwater Horizon unlikely to impact GoM small part of the market
bull Long term gt200 prospects exist and growth will return
bull Market to reach $16 billion in 2014
0
2
4
6
8
10
12
14
16
18
2006 2007 2008 2009 2010 2011 2012 2013 2014 2015
Exp
en
ditur
e ($ b
illio
ns)
AfricaAsiaAustralasiaEE amp FSULatin AmericaMiddle EastNorth AmericaWestern Europe
For more information please
contact Douglas-Westwood
31 SUT London ndash February 2011
Subsea
Hardware
Operational Demands
Inspection Maintenance Repair
Well intervention
ROV AUV and Subsea Vessels
Operations Market
32 SUT London ndash February 2011
Subsea technology is vital to offshore production
bull Unlocking deepwater reserves
bull Improving economics of marginal fields in shallow waters
bull Tie-backs of small reservoirs into existing facilities
Subsea ndash long term outlook is sound
0
5
10
15
20
25
30
35
40
45
50
0
10
20
30
40
50
60
70
80
2001 2004 2007 2010 2013 2016 2019 2022 2025
Mill
ion B
oep
d
Topside ProductionSubsea Production Subsea Production
Offshore Production 2000-2025 Source Datamonitor
For more information please
contact Douglas-Westwood
33 SUT London ndash February 2011
$0
$5
$10
$15
$20
$25
$30
$35
$40
2006 2007 2008 2009 2010 2011 2012 2013 2014 2015
Exp
en
ditur
e $
bn
Africa AsiaAustralasia Eastern Europe amp FSULatin America Middle EastNorth America NorwayRoWE UK
bull $135 billion forecast for next five years
bull Pipelines to account for half of forecast expenditure
bull Major pipeline projects in Eastern Europe amp FSU Asia and the Middle
East
bull Subsea production hardware SURF and subsea processing driven by
deepwater regions
Source FMC Technologies
Subsea Hardware
For more information please
contact Douglas-Westwood
34 SUT London ndash February 2011
0
10
20
30
40
50
60
70
80
Mill
ion B
oepd
Incremental ProductionLost through DeclineProduction Base
Global Offshore Production 2010-2015 Source Datamonitor
bull 462 million boepd in 2010
bull Average global decline rates of 51 (115 in North Sea)
bull Substantial investment in operational expenditure to be required
Operational demands intensifying
For more information please
contact Douglas-Westwood
35 SUT London ndash February 2011
Offshore ops amp maint spend to see good growth
Source ldquoThe World Offshore Operations amp Maintenance Market Report 2010-14rdquo
Douglas-Westwood
$0
$10
$20
$30
$40
$50
$60
$70
$80
2005 2006 2007 2008 2009 2010 2011 2012 2013 2014
$bill
ions
AfricaAsia-PacificEastern Europe amp FSULatin AmericaMiddle EastNorth AmericaNorwayUKRest of Europe
bull gt7000 fixed amp gt200 floating platforms
bull Plus demand for major modifications
Fo
r more
info
rmatio
n p
lease
conta
ct D
ougla
s-W
estw
ood
36 SUT London ndash February 2011
Subsea IRM Expenditure 2004-2015 Source Douglas-Westwood
bull Over 7000 production platforms 190000km of pipeline currently installed
bull $28 billion of expenditure in Subsea IRM in 2010
bull Nearly $20 billion of further investment expected over the next five years
bull 55 forecast expenditure expected in the North Sea amp Gulf of Mexico
bull Less exposure to market cyclicality
00
10
20
30
40
50
60
2005 2006 2007 2008 2009 2010 2011 2012 2013 2014 2015
$m
illio
ns
Others
Western Europe
North America
Latin America
Asia-Pacific
Africa
Subsea Inspection Repair amp Maintenance
For m
ore
info
rmatio
n p
lease
conta
ct D
ougla
s-W
estw
ood
37 SUT London ndash February 2011
Subsea Well Intervention Expenditure 2004-2015 Source Douglas-Westwood
bull Demand driven by production decline of existing wells Nearly 4000 active
bull Market has been historically been constrained by technology amp economics
bull Deepwater intervention to become increasingly significant to global demand
00
05
10
15
20
25
2005 2006 2007 2008 2009 2010 2011 2012 2013 2014 2015
$bill
ions
Others
Western Europe
North America
Latin America
Asia-Pacific
Africa
Subsea Well Intervention
For more information please
contact Douglas-Westwood
38 SUT London ndash February 2011
320
370
420
470
520
570
620
$00
$05
$10
$15
$20
$25
$30
$35
2005 2006 2007 2008 2009 2010 2011 2012 2013 2014
Ac
tiv
e R
OV
s
Ex
pe
nd
itu
re ($
billio
ns
)
Africa
Asia Pacific
E EuropeFSU
Latin America
Middle East
North America
Western Europe
Active ROVs
The World Work Class ROV Operations Market 2005-2014
(Oil amp Gas) Source ―The World ROV Report 2010-2014 ndash Douglas-Westwood
ROV Paces the Growth of Deepwater
For m
ore
info
rmatio
n p
lease
conta
ct D
ougla
s-W
estw
ood
39 SUT London ndash February 2011
bull Self-guided under water survey and inspection vessels
bull From 1 to 5 meters long
bull Priced from $150000 to $7 million
bull Very hot topic recentlymdashmilitary contractors looking for commercial
applications
bull Greater acceptance for not only deep but shallow water oil and gas
survey
bull But a small market
Hugin 1000 MR AUV Courtesy Kongsberg Marine
AUV ndash Autonomous Underwater Vehicles
40 SUT London ndash February 2011
Subsea Vessel Operations Market
Subsea Operation Vessel Demand by Workscope Source Douglas-Westwood
bull Current IRM market demand for around 92 vessels
bull Field development market still depressed ndash upturn in 2012 amp beyond
bull Well intervention and PampA to see substantial growth
-
50
100
150
200
250
300
2005 2006 2007 2008 2009 2010 2011 2012 2013 2014 2015
V
essels
Intervention amp PampA
Field Development
Inspection Repair amp Maintenance
For m
ore
info
rmatio
n p
lease
conta
ct D
ougla
s-W
estw
ood
41 SUT London ndash February 2011
Macondo ndash a $40 billion tragedy
bull 11 dead
bull Environmental amp PR disaster
bull Blamed on ldquoa failure of
managementrdquo
bull ldquoThe costs of getting it wrong
have gone up a lotrdquo Ceres
bull Will liabilities of deepwater
mean that only the majors can
participate in US
bull Regulatory change bringing
US standards in line with best
practise
bull But US dependence on
deepwater is clear
bull Little long-term impact
elsewhere
US Gulf of Mexico Oil Production ( 2010 view)
0
200
400
600
800
1000
1200
1400
1600
1800
2000
1993 1995 1997 1999 2001 2003 2005 2007 2009F 2011F 2013F 2015F
Barr
els
per
day (
000s)
Additional Deepwater Potential
Deepwater Oil
Shallow Water Oil
Deepwater
42 SUT London ndash February 2011
The next last offshore frontier
43 SUT London ndash February 2011
The Arctic
Credit Hugo Ahlenius UNEPGRID-Arendal
bull Over 400 fields discovered with
approx 240 bn Bboe
bull Further 412 bn Boe yet
undiscovered (USGS) technically
recoverable resources
bull Approx 84 offshore
bull 90 billion barrels (13) of the
worlds undiscovered oil reserves
and 30 of the gas resources
according to USGS
bull But USGS recently reduced
Alaska oil resources by 90
44 SUT London ndash February 2011
Some arctic projects
Norway - Goliat bull Predominantly oil
bull Extended shutdown now back on line
Cairn bull Two drilling rigs off coast of Greenland
bull Modestly promising results to date
Hebron ndash ExxonMobil bull East Canada
bull Fourth Newfoundland field
bull 400 ndash 700 m barrels 92 meters
bull First oil 2017
Shell bull Chukchi and Beaufort seas
bull Permits pulled
bull One year delay
bull Macondo will cast a long shadow
Goliat Source Eni Norge
Sevan 1000 Source Sevan
45 SUT London ndash February 2011
Lifecycle Opportunities
The easy oil goes first
NOCs need to internationalise
And local OFS companies
46 SUT London ndash February 2011
Hyd
roca
rbo
n P
rod
uctio
n
Australia
UK
China
Norway
Thailand
Malaysia
USA
46
Points on the OampG life cycle
bull Australia ndash to see good EampP (gas) growth over the next decade
bull China ndash still growing (mainly from offshore)
bull Malaysia ndash near peak Marginals amp EOR focus High CO2 gas OFS
bull Norway ndash drive to internationalisation of OFS industry
bull UK ndash terminal production decline Decommissioning
Growth Peak and plateau EampP
begins Conventional production decline
Each phase offers a different business opportunity
47 SUT London ndash February 2011
The significance of the national oil company
bull NOCs can be tasked with building a local supply chain
bull and building a knowledge base
bull Examples include
bull Petrobras ndash massive drive to build Brazilian OFS industry
bull Statoil ndash major RampD focus aids Norwegian companies
bull Petronas ndash a heavy focus on local needs
bull But ultimately local OampG production declines
bull Then NOCs need to access other countrieslsquo reserves
bull local OFS companies have to gain business in world markets
bull Then need to upscale and gain external investment
48 SUT London ndash February 2011
Conclusions
49 SUT London ndash February 2011
Conclusions
bull Global economic growth has resumed
bull Oil supply outlook remains restrained
bull Will OPEC answer the call for its nominal spare capacity
bull Oil prices are high but few visible drivers to push them down
bull OFS pricing competition should remain pronounced in 2011
bull Spare capacity in offshore sector rigs equipment services
bull High oil prices and restrained cost pressures should encourage
operators to bring projects forward ndash activity levels should pick up
bull Market players appear to be anticipating the next cycle
bull A good future for the Subsea IRM sector
50 SUT London ndash February 2011
Thank you

10
bull North Sea and Mexico continue
decline
bull Canada flat
bull Brazil underperforms
bull FSUmdashmostly Azerbaijanmdash
doing well
bull China and USA at front of the
pack
bull OPEC NGLs are leading the
way
bull Total world supply up 20 mbpd
half is NGLs
bull EIA expects 2011 largely flat
Source EIA STEO Jan 2011
World Liquids Production Growth 2010
million barrels per day
(600)
(400)
(200)
-
200
400
600
800
1000
Liquids Supply in 2010
11 SUT London ndash February 2011
bull Iraq
bull Output up 300 kbpd to 27 mbpd
bull Potential to increase by 05 mbpd per year to 6-7 mbpd
bull Bakken
bull Output up 80 kpbd to 380000 bpd
bull Potential to add 80 kbpd year potentially to greater than 1 mpbd or more
bull Like gas shales production is front-loaded
bull More to come from other sources
Supply Risks Iraq and Bakken
12
$50
$60
$70
$80
$90
$100
$110
$120
2005 2006 2007 2008 2009 2010 2011 2012 2013 2014 2015
WTI
Cru
de
Oil
Spo
t P
rice
- A
nn
ual
B
asis
- C
urr
en
t D
olla
rs
Actual WTI
EIA - Reference Case
DWL - Base Case
bull We assume supply is flat to modestly increasing
bull Historically US could not add oil consumption at more than 4 of
GDPmdashequals $86
bull In last three months of 2010 US up 230 kbpd at average $85
bull US up 700 kbpd in December at $89
bull WTI at $92mdashabove our expectation of mid-to-high $80s for 2011
bull If US can reset to a higher tolerance for oil prices a substantial oil
price rally could be in store
Source EIA AEO ( adjusted RACC + $150) Douglas-Westwood
Annual WTI Spot Oil Price Forecasts EIA Douglas-Westwood
bull
Current oil price
Medium Term Oil Price Outlook
For more information please
contact Douglas-Westwood
13
0
20
40
60
80
100
Year 2030
Uppsala University
IEA EIA IOClsquos
Douglas-Westwood
Total Production Capacity
Current Production
Only material difference between
Uppsala and IEA is depletion rates
on fields to be discovered and
developed to 2030
Range of Global Oil Supply Forecasts ndash 2030 ndash All
Liquids Source various
bull Petroleum liquids
supply forecasts from
75 ndash 105 mbpd for
2030
bull All are essentially
peak oil forecasts
bull Quiet consensus has
emergedmdash
disagreements are
increasingly narrow
and specific
Long-term Outlook A Narrowing of Views
14
Oil Production ndash The Importance of Offshore
There is an increasing reliance on offshore and deepwater production
bull Offshore oil 25 of global production in 1990 31 in 2000 33 in 2010
and 34 by 2020
bull Deepwater 0 in 1990 2 in 2000 9 in 2010 13 by 2020
Global Oil Production 1950-2025
0
10
20
30
40
50
60
70
80
90
100
1930 1937 1944 1951 1958 1965 1972 1979 1986 1993 2000 2007 2014 2021
mill
ion b
arr
els
of
oil
per
day
Bitumen and Oil Sands
Offshore Deep
Offshore Shallow
Conventional Onshore
For m
ore
info
rmatio
n p
lease
conta
ct D
ougla
s-W
estw
ood
15
Peak Oil is a Reality
Data Petroleum Review May 2010
bull With most of the easy oillsquo in the hands of the NOCs
majors are scrambling to replace reserves and off-
set production decline
bull They are moving to harsh environments ndash offshore
deepwater politically difficult geographically remote
Peak Year
2002 2003 2004 2005 2006 2007 2008 2009
ExxonMobil 2496 2516 2571 2523 2681 2616 2404 2387
BP 2018 2121 2531 2562 2475 2414 2410 2535
PetroChina 2109 2119 2233 2270 2276 2312 2380 2311
Shell 2359 2379 2253 2093 2030 1899 1771 1680
Petrobras 1533 1701 1661 1847 1908 1920 1996 2103
Chevron 1897 1823 1737 1701 1759 1783 1676 1872
Total 1589 1661 1695 1621 1506 1509 1456 1381
ConocoPhillips 891 1237 1242 1447 1698 1644 1367 1615
ENI 921 981 1034 1111 1079 1020 1026 1007
StatoilHydro 1112 1132 1135 1102 1058 1054 1056 1067
Source Offshore Technology
NOCs (limited equity access )
78
NOCs (equity access)
10
New Russian Companies
6
Full IOC access6
Restricted access to oil reserves
16 SUT London ndash February 2011
85
86
87
88
89
90
91
92
93
94
95
2009 2010 2011 2012 2013
mill
ion
bar
rels
pe
r d
ay
Demand Growth as 2002-2005
Demand Growth as 1976-1979
IEA Supply Demand Forecast
Effective Global Liquids Production Capacity
Medium term outlook risks of oil shock growing
bull Adequate spare capacity today ndash
but frac34 of it is in Saudi
bull IEA sees demand rising slowly
less than 14 mbpd year in 2011
bull Previous recoveries saw strong
demand growth during first three
years
bull After 2002 77 mbpd
bull After 1976 73 mbpd
bull If previous patterns hold true a
possible supply crunch in
20122013
bull What will Saudi do Source IEA Douglas-Westwood analysis
Oil Demand under Three Scenarios and Global
Liquids Production Capacity
Oil shock
IEA forecast (2010)
Surplus Capacity
bull Dec 2010 demand
Spare Capacity at Saudi 10 mbpd limit
bull Jan 2011 forecast
For m
ore
info
rmatio
n p
lease
conta
ct D
ougla
s-W
estw
ood
17 SUT London ndash February 2011
The WikiLeaks Saudi cables
Crude oil reserves may have been overstated by as much as 300bn barrels
ndash nearly 40
bull Al-Husseini [believes] Aramcos reserves are overstated by as much
as 300bn barrels In his view once 50 of original proven reserves has
been reached hellip a steady output in decline will ensue and no amount of
effort will be able to stop it He believes that what will result is a plateau in
total output that will last approximately 15 years followed by decreasing
outputldquo
bull ldquoClearly they [Saudi] can drive prices up but we question whether they
any longer have the power to drive prices down for a prolonged periodrdquo
Source US Embassy cables to Washington 2007-2009 The Guardian 8 February 2010
Sadad al-Husseini a geologist and former head of exploration at the Saudi oil monopoly Aramco met the US
consul general in Riyadh in November 2007
18
United States
Russia
Iran
Qatar
Other OPEC
Rest of World
100
yearslsquo
US
supply
05
10
15
20
25
30
19
98
19
99
20
00
20
01
20
02
20
03
20
04
20
05
20
06
20
07
20
08
20
09
20
10
20
11
20
12
20
13
20
14
20
15
20
16
20
17
20
18
20
19
Btu ratio Oil-to-Gas
Avg ratio Feb 2010 -Dec 2018Avg ratio 1998 - 2005
Oil-to-Gas Price Ratio on a BTU Parity Basis Source EIA NYMEX futures
Proved Gas Reserves 6300 trillion cubic feet (60 years) Source EIA
bull Gas shales have revolutionized US outlook
bull 100 yearslsquo supply in US resources 2 quadrillion cf resources on 23 tcf consumption
bull Some questions about economics but $7-8 mmbtu gas looks plausible indefinitely
bull Other shale initiatives beginning (BP in China)
bull Major LNG projects continue to come on line
bull Right now the world looks to have plenty of natural gas
The Gas Story is Very Different
For more information please
contact Douglas-Westwood
19 SUT London ndash February 2011
bull Dominated by E Europe amp FSU but others to see significant growth
bull Deepwater gas and LNG to be of growing importance
bull Impact of shale gas on North America (amp other markets)
bull But local supply issues eg Europe to import gt73 by 2020
Natural gas production and use to soar
Source Energyfiles
0
10
20
30
40
50
60
70
80
90
100
1930 1937 1944 1951 1958 1965 1972 1979 1986 1993 2000 2007 2014 2021
million b
arr
els
of o
il eq
uiv
ale
nt p
er d
ay
Africa
Asia
Australasia
Eastern Europe amp FSU
Latin America
Middle East
North America
Western Europe
ME
FSU
NA
For m
ore
info
rmatio
n p
lease
conta
ct D
ougla
s-W
estw
ood
20 SUT London ndash February 2011
10
2428
31
3941
47 48
5356
60
0
1
2
3
4
5
6
Capex ($ m
llion m
W)
Source EIA Nov 2010
Gas ndash lowest Capex for power plants
21 SUT London ndash February 2011
Gas ndash FLNG in prospect
bull Liquefaction ndash $20 bn spend by 2017
bull Australasia to account for 60
bull Woodside has raised the prospect of FLNG for its Greater Sunrise project
bull Inpex (Japan) considering FLNG at its $196 billion Abadi field in Indonesia
bull GDF Suez and Australias Santos set up a joint venture to develop a floating
LNG project off northwest Australia
Picture Shell
Source The World FLNG Report Douglas-Westwood
0
1
2
3
4
5
6
7
8
2006 2007 2008 2009 2010 2011 2012 2013 2014 2015 2016 2017
Exp
en
ditur
e ($ b
illio
n)
Africa
Asia
Australasia
Latin America
Middle East
North America
0
1
2
3
4
5
6
7
8
2006 2007 2008 2009 2010 2011 2012 2013 2014 2015 2016 2017
Exp
en
ditur
e ($ b
illio
n)
Africa
Asia
Australasia
Latin America
Middle East
North America
$67bn
For more information please
contact Douglas-Westwood
22 SUT London ndash February 2011
$0
$100
$200
$300
$400
$500
$600
1995
1996
1997
1998
1999
2000
2001
2002
2003
2004
2005
2006
2007
2008
2009
2010
2011
US
Do
llar
Bil
lio
ns
Outside North America
Canada
United States
bull Recovery in 2010 up 10 to $442 bn
bull Continued growth in 2011 to $490 bn up 11 a new peak
bull US spend up 8 Canada up 5 international up 12
bull Spend up $48 bn in 2011 of which 82 is international
Recovery and growth in global EampP spend
Source Jim Crandell Barclaylsquos EampP Spending Survey December 2010
Global EampP Spend
+10 -15 +11
23 SUT London ndash February 2011
0
10
20
30
40
50
60
70
80
90
100
$70 $75 $80 $85 $90 $95 $100
Cu
mu
lati
ve P
erc
en
t o
f R
esp
on
de
nts
0
10
20
30
40
50
60
70
80
90
100
$35 $40 $45 $50 $55 $60 $65 $70 $75
Cu
mu
lati
ve P
erc
en
t o
f R
esp
on
de
nts
bull EampP companies prepared budgets assuming $77 oil on average
up from $70 last year
bull Expect capex to materially decrease in the industry if oil prices fall
much below $60
bull Expect capex to increase materially if oil prices sustain above $90
up from $85 last year
Source Barclays Capital EampP Spending Survey Dec2010
Oil Price Threshold for Reducing Capex Oil Price Threshold for Increasing Capex
Source Barclays Capital EampP Spending Survey Dec2010
Percent of Respondents Decreasing Capex at a Given Oil Price
Percent of Respondents Increasing Capex at a Given Oil Price
2011 ndash EampP Spend Sensitivity to Oil Prices
24 SUT London ndash February 2011
Offshore Oil amp Gas
Nowhere else left for big finds
Strong Capex growth
Importance of deepwater
The beauty of Opex
25 SUT London ndash February 2011
Global offshore oil amp gas production amp spend to grow
Source Datamonitor
bull Global Capex fell in lsquo0910 but Opex grew
bull Both Capex amp Opex to grow strongly in the years ahead
bull 28 new rigs ordered since October + 8 options 10-15 more in 2011
bull Deepwater Capex to exceed $205 billion
0
20
40
60
80
100
120
140
160
180
200
2006 2007 2008 2009 2010 2011 2012 2013 2014 2015
Ex
pe
nd
itu
re ($
bill
ion
s)
AfricaAsiaAustralasiaEastern Europe and FSULatin AmericaMiddle EastNorth AmericaWestern Europe For more information please
contact Douglas-Westwood
26 SUT London ndash February 2011
OPTIONS
ORDERS
The next rig cycle begins
27 SUT London ndash February 2011
Deepwater Capex to reach new highs
bull Deepwater production to double
bull Drilling $72bn (35) Subsea processing emerging ($26 bn)
Source ldquoThe World Deepwater Market Report 2011-2015rdquo
Douglas-Westwood
0
10
20
30
40
50
60
70
2006 2007 2008 2009 2010 2011 2012 2013 2014 2015
Exp
en
ditur
e ($ b
illio
ns)
DrillingFloating PlatformsPipelinesSubsea ProductionSubsea ProcessingSURF
For more information please
contact Douglas-Westwood
28 SUT London ndash February 2011
Deepwater ndash Africa amp Brazil to lead spend
bull Brazil amp W Africa to total $126bn (62)
bull But much more Brazil spend to come
Source ldquoThe World Deepwater Market Report 2011-2015rdquo
Douglas-Westwood
0
10
20
30
40
50
60
70
2006 2007 2008 2009 2010 2011 2012 2013 2014 2015
Exp
en
ditur
e ($ b
illio
ns)
AfricaAsiaAustralasiaEastern Europe and FSULatin AmericaMiddle EastNorth AmericaWestern Europe
For more information please
contact Douglas-Westwood
29 SUT London ndash February 2011
Brazil ndash Petrobrasrsquos pre-salt deepwater lsquoshopping listrsquo
50 bn boe reserves 2 million production bpd by 2020
By 2018
bull Includes 58 new drilling rigs
By 2020
bull 72 VLCCs
bull 146 supply amp service vessels
bull 45 production platforms
bull Plus subsea hardware
Finance
bull 2010 $70bn stock offering
bull 2011 $6bn corporate bond
bull Next 4 years $30-40bn debt raising
bull Capex of $224bn by 2014
bull Capex amp Opex to total $1 trillion
Tupi Discovery Source CGG Veritas
30 SUT London ndash February 2011
Floating production recovery expected
Global Floating Production Expenditure Source Douglas-Westwood
bull Material decrease in orders in 2009 but market bottomed in 2010
bull Increasing share of market to leased FPSOs Consolidation likely
bull Deepwater Horizon unlikely to impact GoM small part of the market
bull Long term gt200 prospects exist and growth will return
bull Market to reach $16 billion in 2014
0
2
4
6
8
10
12
14
16
18
2006 2007 2008 2009 2010 2011 2012 2013 2014 2015
Exp
en
ditur
e ($ b
illio
ns)
AfricaAsiaAustralasiaEE amp FSULatin AmericaMiddle EastNorth AmericaWestern Europe
For more information please
contact Douglas-Westwood
31 SUT London ndash February 2011
Subsea
Hardware
Operational Demands
Inspection Maintenance Repair
Well intervention
ROV AUV and Subsea Vessels
Operations Market
32 SUT London ndash February 2011
Subsea technology is vital to offshore production
bull Unlocking deepwater reserves
bull Improving economics of marginal fields in shallow waters
bull Tie-backs of small reservoirs into existing facilities
Subsea ndash long term outlook is sound
0
5
10
15
20
25
30
35
40
45
50
0
10
20
30
40
50
60
70
80
2001 2004 2007 2010 2013 2016 2019 2022 2025
Mill
ion B
oep
d
Topside ProductionSubsea Production Subsea Production
Offshore Production 2000-2025 Source Datamonitor
For more information please
contact Douglas-Westwood
33 SUT London ndash February 2011
$0
$5
$10
$15
$20
$25
$30
$35
$40
2006 2007 2008 2009 2010 2011 2012 2013 2014 2015
Exp
en
ditur
e $
bn
Africa AsiaAustralasia Eastern Europe amp FSULatin America Middle EastNorth America NorwayRoWE UK
bull $135 billion forecast for next five years
bull Pipelines to account for half of forecast expenditure
bull Major pipeline projects in Eastern Europe amp FSU Asia and the Middle
East
bull Subsea production hardware SURF and subsea processing driven by
deepwater regions
Source FMC Technologies
Subsea Hardware
For more information please
contact Douglas-Westwood
34 SUT London ndash February 2011
0
10
20
30
40
50
60
70
80
Mill
ion B
oepd
Incremental ProductionLost through DeclineProduction Base
Global Offshore Production 2010-2015 Source Datamonitor
bull 462 million boepd in 2010
bull Average global decline rates of 51 (115 in North Sea)
bull Substantial investment in operational expenditure to be required
Operational demands intensifying
For more information please
contact Douglas-Westwood
35 SUT London ndash February 2011
Offshore ops amp maint spend to see good growth
Source ldquoThe World Offshore Operations amp Maintenance Market Report 2010-14rdquo
Douglas-Westwood
$0
$10
$20
$30
$40
$50
$60
$70
$80
2005 2006 2007 2008 2009 2010 2011 2012 2013 2014
$bill
ions
AfricaAsia-PacificEastern Europe amp FSULatin AmericaMiddle EastNorth AmericaNorwayUKRest of Europe
bull gt7000 fixed amp gt200 floating platforms
bull Plus demand for major modifications
Fo
r more
info
rmatio
n p
lease
conta
ct D
ougla
s-W
estw
ood
36 SUT London ndash February 2011
Subsea IRM Expenditure 2004-2015 Source Douglas-Westwood
bull Over 7000 production platforms 190000km of pipeline currently installed
bull $28 billion of expenditure in Subsea IRM in 2010
bull Nearly $20 billion of further investment expected over the next five years
bull 55 forecast expenditure expected in the North Sea amp Gulf of Mexico
bull Less exposure to market cyclicality
00
10
20
30
40
50
60
2005 2006 2007 2008 2009 2010 2011 2012 2013 2014 2015
$m
illio
ns
Others
Western Europe
North America
Latin America
Asia-Pacific
Africa
Subsea Inspection Repair amp Maintenance
For m
ore
info
rmatio
n p
lease
conta
ct D
ougla
s-W
estw
ood
37 SUT London ndash February 2011
Subsea Well Intervention Expenditure 2004-2015 Source Douglas-Westwood
bull Demand driven by production decline of existing wells Nearly 4000 active
bull Market has been historically been constrained by technology amp economics
bull Deepwater intervention to become increasingly significant to global demand
00
05
10
15
20
25
2005 2006 2007 2008 2009 2010 2011 2012 2013 2014 2015
$bill
ions
Others
Western Europe
North America
Latin America
Asia-Pacific
Africa
Subsea Well Intervention
For more information please
contact Douglas-Westwood
38 SUT London ndash February 2011
320
370
420
470
520
570
620
$00
$05
$10
$15
$20
$25
$30
$35
2005 2006 2007 2008 2009 2010 2011 2012 2013 2014
Ac
tiv
e R
OV
s
Ex
pe
nd
itu
re ($
billio
ns
)
Africa
Asia Pacific
E EuropeFSU
Latin America
Middle East
North America
Western Europe
Active ROVs
The World Work Class ROV Operations Market 2005-2014
(Oil amp Gas) Source ―The World ROV Report 2010-2014 ndash Douglas-Westwood
ROV Paces the Growth of Deepwater
For m
ore
info
rmatio
n p
lease
conta
ct D
ougla
s-W
estw
ood
39 SUT London ndash February 2011
bull Self-guided under water survey and inspection vessels
bull From 1 to 5 meters long
bull Priced from $150000 to $7 million
bull Very hot topic recentlymdashmilitary contractors looking for commercial
applications
bull Greater acceptance for not only deep but shallow water oil and gas
survey
bull But a small market
Hugin 1000 MR AUV Courtesy Kongsberg Marine
AUV ndash Autonomous Underwater Vehicles
40 SUT London ndash February 2011
Subsea Vessel Operations Market
Subsea Operation Vessel Demand by Workscope Source Douglas-Westwood
bull Current IRM market demand for around 92 vessels
bull Field development market still depressed ndash upturn in 2012 amp beyond
bull Well intervention and PampA to see substantial growth
-
50
100
150
200
250
300
2005 2006 2007 2008 2009 2010 2011 2012 2013 2014 2015
V
essels
Intervention amp PampA
Field Development
Inspection Repair amp Maintenance
For m
ore
info
rmatio
n p
lease
conta
ct D
ougla
s-W
estw
ood
41 SUT London ndash February 2011
Macondo ndash a $40 billion tragedy
bull 11 dead
bull Environmental amp PR disaster
bull Blamed on ldquoa failure of
managementrdquo
bull ldquoThe costs of getting it wrong
have gone up a lotrdquo Ceres
bull Will liabilities of deepwater
mean that only the majors can
participate in US
bull Regulatory change bringing
US standards in line with best
practise
bull But US dependence on
deepwater is clear
bull Little long-term impact
elsewhere
US Gulf of Mexico Oil Production ( 2010 view)
0
200
400
600
800
1000
1200
1400
1600
1800
2000
1993 1995 1997 1999 2001 2003 2005 2007 2009F 2011F 2013F 2015F
Barr
els
per
day (
000s)
Additional Deepwater Potential
Deepwater Oil
Shallow Water Oil
Deepwater
42 SUT London ndash February 2011
The next last offshore frontier
43 SUT London ndash February 2011
The Arctic
Credit Hugo Ahlenius UNEPGRID-Arendal
bull Over 400 fields discovered with
approx 240 bn Bboe
bull Further 412 bn Boe yet
undiscovered (USGS) technically
recoverable resources
bull Approx 84 offshore
bull 90 billion barrels (13) of the
worlds undiscovered oil reserves
and 30 of the gas resources
according to USGS
bull But USGS recently reduced
Alaska oil resources by 90
44 SUT London ndash February 2011
Some arctic projects
Norway - Goliat bull Predominantly oil
bull Extended shutdown now back on line
Cairn bull Two drilling rigs off coast of Greenland
bull Modestly promising results to date
Hebron ndash ExxonMobil bull East Canada
bull Fourth Newfoundland field
bull 400 ndash 700 m barrels 92 meters
bull First oil 2017
Shell bull Chukchi and Beaufort seas
bull Permits pulled
bull One year delay
bull Macondo will cast a long shadow
Goliat Source Eni Norge
Sevan 1000 Source Sevan
45 SUT London ndash February 2011
Lifecycle Opportunities
The easy oil goes first
NOCs need to internationalise
And local OFS companies
46 SUT London ndash February 2011
Hyd
roca
rbo
n P
rod
uctio
n
Australia
UK
China
Norway
Thailand
Malaysia
USA
46
Points on the OampG life cycle
bull Australia ndash to see good EampP (gas) growth over the next decade
bull China ndash still growing (mainly from offshore)
bull Malaysia ndash near peak Marginals amp EOR focus High CO2 gas OFS
bull Norway ndash drive to internationalisation of OFS industry
bull UK ndash terminal production decline Decommissioning
Growth Peak and plateau EampP
begins Conventional production decline
Each phase offers a different business opportunity
47 SUT London ndash February 2011
The significance of the national oil company
bull NOCs can be tasked with building a local supply chain
bull and building a knowledge base
bull Examples include
bull Petrobras ndash massive drive to build Brazilian OFS industry
bull Statoil ndash major RampD focus aids Norwegian companies
bull Petronas ndash a heavy focus on local needs
bull But ultimately local OampG production declines
bull Then NOCs need to access other countrieslsquo reserves
bull local OFS companies have to gain business in world markets
bull Then need to upscale and gain external investment
48 SUT London ndash February 2011
Conclusions
49 SUT London ndash February 2011
Conclusions
bull Global economic growth has resumed
bull Oil supply outlook remains restrained
bull Will OPEC answer the call for its nominal spare capacity
bull Oil prices are high but few visible drivers to push them down
bull OFS pricing competition should remain pronounced in 2011
bull Spare capacity in offshore sector rigs equipment services
bull High oil prices and restrained cost pressures should encourage
operators to bring projects forward ndash activity levels should pick up
bull Market players appear to be anticipating the next cycle
bull A good future for the Subsea IRM sector
50 SUT London ndash February 2011
Thank you

12
$50
$60
$70
$80
$90
$100
$110
$120
2005 2006 2007 2008 2009 2010 2011 2012 2013 2014 2015
WTI
Cru
de
Oil
Spo
t P
rice
- A
nn
ual
B
asis
- C
urr
en
t D
olla
rs
Actual WTI
EIA - Reference Case
DWL - Base Case
bull We assume supply is flat to modestly increasing
bull Historically US could not add oil consumption at more than 4 of
GDPmdashequals $86
bull In last three months of 2010 US up 230 kbpd at average $85
bull US up 700 kbpd in December at $89
bull WTI at $92mdashabove our expectation of mid-to-high $80s for 2011
bull If US can reset to a higher tolerance for oil prices a substantial oil
price rally could be in store
Source EIA AEO ( adjusted RACC + $150) Douglas-Westwood
Annual WTI Spot Oil Price Forecasts EIA Douglas-Westwood
bull
Current oil price
Medium Term Oil Price Outlook
For more information please
contact Douglas-Westwood
13
0
20
40
60
80
100
Year 2030
Uppsala University
IEA EIA IOClsquos
Douglas-Westwood
Total Production Capacity
Current Production
Only material difference between
Uppsala and IEA is depletion rates
on fields to be discovered and
developed to 2030
Range of Global Oil Supply Forecasts ndash 2030 ndash All
Liquids Source various
bull Petroleum liquids
supply forecasts from
75 ndash 105 mbpd for
2030
bull All are essentially
peak oil forecasts
bull Quiet consensus has
emergedmdash
disagreements are
increasingly narrow
and specific
Long-term Outlook A Narrowing of Views
14
Oil Production ndash The Importance of Offshore
There is an increasing reliance on offshore and deepwater production
bull Offshore oil 25 of global production in 1990 31 in 2000 33 in 2010
and 34 by 2020
bull Deepwater 0 in 1990 2 in 2000 9 in 2010 13 by 2020
Global Oil Production 1950-2025
0
10
20
30
40
50
60
70
80
90
100
1930 1937 1944 1951 1958 1965 1972 1979 1986 1993 2000 2007 2014 2021
mill
ion b
arr
els
of
oil
per
day
Bitumen and Oil Sands
Offshore Deep
Offshore Shallow
Conventional Onshore
For m
ore
info
rmatio
n p
lease
conta
ct D
ougla
s-W
estw
ood
15
Peak Oil is a Reality
Data Petroleum Review May 2010
bull With most of the easy oillsquo in the hands of the NOCs
majors are scrambling to replace reserves and off-
set production decline
bull They are moving to harsh environments ndash offshore
deepwater politically difficult geographically remote
Peak Year
2002 2003 2004 2005 2006 2007 2008 2009
ExxonMobil 2496 2516 2571 2523 2681 2616 2404 2387
BP 2018 2121 2531 2562 2475 2414 2410 2535
PetroChina 2109 2119 2233 2270 2276 2312 2380 2311
Shell 2359 2379 2253 2093 2030 1899 1771 1680
Petrobras 1533 1701 1661 1847 1908 1920 1996 2103
Chevron 1897 1823 1737 1701 1759 1783 1676 1872
Total 1589 1661 1695 1621 1506 1509 1456 1381
ConocoPhillips 891 1237 1242 1447 1698 1644 1367 1615
ENI 921 981 1034 1111 1079 1020 1026 1007
StatoilHydro 1112 1132 1135 1102 1058 1054 1056 1067
Source Offshore Technology
NOCs (limited equity access )
78
NOCs (equity access)
10
New Russian Companies
6
Full IOC access6
Restricted access to oil reserves
16 SUT London ndash February 2011
85
86
87
88
89
90
91
92
93
94
95
2009 2010 2011 2012 2013
mill
ion
bar
rels
pe
r d
ay
Demand Growth as 2002-2005
Demand Growth as 1976-1979
IEA Supply Demand Forecast
Effective Global Liquids Production Capacity
Medium term outlook risks of oil shock growing
bull Adequate spare capacity today ndash
but frac34 of it is in Saudi
bull IEA sees demand rising slowly
less than 14 mbpd year in 2011
bull Previous recoveries saw strong
demand growth during first three
years
bull After 2002 77 mbpd
bull After 1976 73 mbpd
bull If previous patterns hold true a
possible supply crunch in
20122013
bull What will Saudi do Source IEA Douglas-Westwood analysis
Oil Demand under Three Scenarios and Global
Liquids Production Capacity
Oil shock
IEA forecast (2010)
Surplus Capacity
bull Dec 2010 demand
Spare Capacity at Saudi 10 mbpd limit
bull Jan 2011 forecast
For m
ore
info
rmatio
n p
lease
conta
ct D
ougla
s-W
estw
ood
17 SUT London ndash February 2011
The WikiLeaks Saudi cables
Crude oil reserves may have been overstated by as much as 300bn barrels
ndash nearly 40
bull Al-Husseini [believes] Aramcos reserves are overstated by as much
as 300bn barrels In his view once 50 of original proven reserves has
been reached hellip a steady output in decline will ensue and no amount of
effort will be able to stop it He believes that what will result is a plateau in
total output that will last approximately 15 years followed by decreasing
outputldquo
bull ldquoClearly they [Saudi] can drive prices up but we question whether they
any longer have the power to drive prices down for a prolonged periodrdquo
Source US Embassy cables to Washington 2007-2009 The Guardian 8 February 2010
Sadad al-Husseini a geologist and former head of exploration at the Saudi oil monopoly Aramco met the US
consul general in Riyadh in November 2007
18
United States
Russia
Iran
Qatar
Other OPEC
Rest of World
100
yearslsquo
US
supply
05
10
15
20
25
30
19
98
19
99
20
00
20
01
20
02
20
03
20
04
20
05
20
06
20
07
20
08
20
09
20
10
20
11
20
12
20
13
20
14
20
15
20
16
20
17
20
18
20
19
Btu ratio Oil-to-Gas
Avg ratio Feb 2010 -Dec 2018Avg ratio 1998 - 2005
Oil-to-Gas Price Ratio on a BTU Parity Basis Source EIA NYMEX futures
Proved Gas Reserves 6300 trillion cubic feet (60 years) Source EIA
bull Gas shales have revolutionized US outlook
bull 100 yearslsquo supply in US resources 2 quadrillion cf resources on 23 tcf consumption
bull Some questions about economics but $7-8 mmbtu gas looks plausible indefinitely
bull Other shale initiatives beginning (BP in China)
bull Major LNG projects continue to come on line
bull Right now the world looks to have plenty of natural gas
The Gas Story is Very Different
For more information please
contact Douglas-Westwood
19 SUT London ndash February 2011
bull Dominated by E Europe amp FSU but others to see significant growth
bull Deepwater gas and LNG to be of growing importance
bull Impact of shale gas on North America (amp other markets)
bull But local supply issues eg Europe to import gt73 by 2020
Natural gas production and use to soar
Source Energyfiles
0
10
20
30
40
50
60
70
80
90
100
1930 1937 1944 1951 1958 1965 1972 1979 1986 1993 2000 2007 2014 2021
million b
arr
els
of o
il eq
uiv
ale
nt p
er d
ay
Africa
Asia
Australasia
Eastern Europe amp FSU
Latin America
Middle East
North America
Western Europe
ME
FSU
NA
For m
ore
info
rmatio
n p
lease
conta
ct D
ougla
s-W
estw
ood
20 SUT London ndash February 2011
10
2428
31
3941
47 48
5356
60
0
1
2
3
4
5
6
Capex ($ m
llion m
W)
Source EIA Nov 2010
Gas ndash lowest Capex for power plants
21 SUT London ndash February 2011
Gas ndash FLNG in prospect
bull Liquefaction ndash $20 bn spend by 2017
bull Australasia to account for 60
bull Woodside has raised the prospect of FLNG for its Greater Sunrise project
bull Inpex (Japan) considering FLNG at its $196 billion Abadi field in Indonesia
bull GDF Suez and Australias Santos set up a joint venture to develop a floating
LNG project off northwest Australia
Picture Shell
Source The World FLNG Report Douglas-Westwood
0
1
2
3
4
5
6
7
8
2006 2007 2008 2009 2010 2011 2012 2013 2014 2015 2016 2017
Exp
en
ditur
e ($ b
illio
n)
Africa
Asia
Australasia
Latin America
Middle East
North America
0
1
2
3
4
5
6
7
8
2006 2007 2008 2009 2010 2011 2012 2013 2014 2015 2016 2017
Exp
en
ditur
e ($ b
illio
n)
Africa
Asia
Australasia
Latin America
Middle East
North America
$67bn
For more information please
contact Douglas-Westwood
22 SUT London ndash February 2011
$0
$100
$200
$300
$400
$500
$600
1995
1996
1997
1998
1999
2000
2001
2002
2003
2004
2005
2006
2007
2008
2009
2010
2011
US
Do
llar
Bil
lio
ns
Outside North America
Canada
United States
bull Recovery in 2010 up 10 to $442 bn
bull Continued growth in 2011 to $490 bn up 11 a new peak
bull US spend up 8 Canada up 5 international up 12
bull Spend up $48 bn in 2011 of which 82 is international
Recovery and growth in global EampP spend
Source Jim Crandell Barclaylsquos EampP Spending Survey December 2010
Global EampP Spend
+10 -15 +11
23 SUT London ndash February 2011
0
10
20
30
40
50
60
70
80
90
100
$70 $75 $80 $85 $90 $95 $100
Cu
mu
lati
ve P
erc
en
t o
f R
esp
on
de
nts
0
10
20
30
40
50
60
70
80
90
100
$35 $40 $45 $50 $55 $60 $65 $70 $75
Cu
mu
lati
ve P
erc
en
t o
f R
esp
on
de
nts
bull EampP companies prepared budgets assuming $77 oil on average
up from $70 last year
bull Expect capex to materially decrease in the industry if oil prices fall
much below $60
bull Expect capex to increase materially if oil prices sustain above $90
up from $85 last year
Source Barclays Capital EampP Spending Survey Dec2010
Oil Price Threshold for Reducing Capex Oil Price Threshold for Increasing Capex
Source Barclays Capital EampP Spending Survey Dec2010
Percent of Respondents Decreasing Capex at a Given Oil Price
Percent of Respondents Increasing Capex at a Given Oil Price
2011 ndash EampP Spend Sensitivity to Oil Prices
24 SUT London ndash February 2011
Offshore Oil amp Gas
Nowhere else left for big finds
Strong Capex growth
Importance of deepwater
The beauty of Opex
25 SUT London ndash February 2011
Global offshore oil amp gas production amp spend to grow
Source Datamonitor
bull Global Capex fell in lsquo0910 but Opex grew
bull Both Capex amp Opex to grow strongly in the years ahead
bull 28 new rigs ordered since October + 8 options 10-15 more in 2011
bull Deepwater Capex to exceed $205 billion
0
20
40
60
80
100
120
140
160
180
200
2006 2007 2008 2009 2010 2011 2012 2013 2014 2015
Ex
pe
nd
itu
re ($
bill
ion
s)
AfricaAsiaAustralasiaEastern Europe and FSULatin AmericaMiddle EastNorth AmericaWestern Europe For more information please
contact Douglas-Westwood
26 SUT London ndash February 2011
OPTIONS
ORDERS
The next rig cycle begins
27 SUT London ndash February 2011
Deepwater Capex to reach new highs
bull Deepwater production to double
bull Drilling $72bn (35) Subsea processing emerging ($26 bn)
Source ldquoThe World Deepwater Market Report 2011-2015rdquo
Douglas-Westwood
0
10
20
30
40
50
60
70
2006 2007 2008 2009 2010 2011 2012 2013 2014 2015
Exp
en
ditur
e ($ b
illio
ns)
DrillingFloating PlatformsPipelinesSubsea ProductionSubsea ProcessingSURF
For more information please
contact Douglas-Westwood
28 SUT London ndash February 2011
Deepwater ndash Africa amp Brazil to lead spend
bull Brazil amp W Africa to total $126bn (62)
bull But much more Brazil spend to come
Source ldquoThe World Deepwater Market Report 2011-2015rdquo
Douglas-Westwood
0
10
20
30
40
50
60
70
2006 2007 2008 2009 2010 2011 2012 2013 2014 2015
Exp
en
ditur
e ($ b
illio
ns)
AfricaAsiaAustralasiaEastern Europe and FSULatin AmericaMiddle EastNorth AmericaWestern Europe
For more information please
contact Douglas-Westwood
29 SUT London ndash February 2011
Brazil ndash Petrobrasrsquos pre-salt deepwater lsquoshopping listrsquo
50 bn boe reserves 2 million production bpd by 2020
By 2018
bull Includes 58 new drilling rigs
By 2020
bull 72 VLCCs
bull 146 supply amp service vessels
bull 45 production platforms
bull Plus subsea hardware
Finance
bull 2010 $70bn stock offering
bull 2011 $6bn corporate bond
bull Next 4 years $30-40bn debt raising
bull Capex of $224bn by 2014
bull Capex amp Opex to total $1 trillion
Tupi Discovery Source CGG Veritas
30 SUT London ndash February 2011
Floating production recovery expected
Global Floating Production Expenditure Source Douglas-Westwood
bull Material decrease in orders in 2009 but market bottomed in 2010
bull Increasing share of market to leased FPSOs Consolidation likely
bull Deepwater Horizon unlikely to impact GoM small part of the market
bull Long term gt200 prospects exist and growth will return
bull Market to reach $16 billion in 2014
0
2
4
6
8
10
12
14
16
18
2006 2007 2008 2009 2010 2011 2012 2013 2014 2015
Exp
en
ditur
e ($ b
illio
ns)
AfricaAsiaAustralasiaEE amp FSULatin AmericaMiddle EastNorth AmericaWestern Europe
For more information please
contact Douglas-Westwood
31 SUT London ndash February 2011
Subsea
Hardware
Operational Demands
Inspection Maintenance Repair
Well intervention
ROV AUV and Subsea Vessels
Operations Market
32 SUT London ndash February 2011
Subsea technology is vital to offshore production
bull Unlocking deepwater reserves
bull Improving economics of marginal fields in shallow waters
bull Tie-backs of small reservoirs into existing facilities
Subsea ndash long term outlook is sound
0
5
10
15
20
25
30
35
40
45
50
0
10
20
30
40
50
60
70
80
2001 2004 2007 2010 2013 2016 2019 2022 2025
Mill
ion B
oep
d
Topside ProductionSubsea Production Subsea Production
Offshore Production 2000-2025 Source Datamonitor
For more information please
contact Douglas-Westwood
33 SUT London ndash February 2011
$0
$5
$10
$15
$20
$25
$30
$35
$40
2006 2007 2008 2009 2010 2011 2012 2013 2014 2015
Exp
en
ditur
e $
bn
Africa AsiaAustralasia Eastern Europe amp FSULatin America Middle EastNorth America NorwayRoWE UK
bull $135 billion forecast for next five years
bull Pipelines to account for half of forecast expenditure
bull Major pipeline projects in Eastern Europe amp FSU Asia and the Middle
East
bull Subsea production hardware SURF and subsea processing driven by
deepwater regions
Source FMC Technologies
Subsea Hardware
For more information please
contact Douglas-Westwood
34 SUT London ndash February 2011
0
10
20
30
40
50
60
70
80
Mill
ion B
oepd
Incremental ProductionLost through DeclineProduction Base
Global Offshore Production 2010-2015 Source Datamonitor
bull 462 million boepd in 2010
bull Average global decline rates of 51 (115 in North Sea)
bull Substantial investment in operational expenditure to be required
Operational demands intensifying
For more information please
contact Douglas-Westwood
35 SUT London ndash February 2011
Offshore ops amp maint spend to see good growth
Source ldquoThe World Offshore Operations amp Maintenance Market Report 2010-14rdquo
Douglas-Westwood
$0
$10
$20
$30
$40
$50
$60
$70
$80
2005 2006 2007 2008 2009 2010 2011 2012 2013 2014
$bill
ions
AfricaAsia-PacificEastern Europe amp FSULatin AmericaMiddle EastNorth AmericaNorwayUKRest of Europe
bull gt7000 fixed amp gt200 floating platforms
bull Plus demand for major modifications
Fo
r more
info
rmatio
n p
lease
conta
ct D
ougla
s-W
estw
ood
36 SUT London ndash February 2011
Subsea IRM Expenditure 2004-2015 Source Douglas-Westwood
bull Over 7000 production platforms 190000km of pipeline currently installed
bull $28 billion of expenditure in Subsea IRM in 2010
bull Nearly $20 billion of further investment expected over the next five years
bull 55 forecast expenditure expected in the North Sea amp Gulf of Mexico
bull Less exposure to market cyclicality
00
10
20
30
40
50
60
2005 2006 2007 2008 2009 2010 2011 2012 2013 2014 2015
$m
illio
ns
Others
Western Europe
North America
Latin America
Asia-Pacific
Africa
Subsea Inspection Repair amp Maintenance
For m
ore
info
rmatio
n p
lease
conta
ct D
ougla
s-W
estw
ood
37 SUT London ndash February 2011
Subsea Well Intervention Expenditure 2004-2015 Source Douglas-Westwood
bull Demand driven by production decline of existing wells Nearly 4000 active
bull Market has been historically been constrained by technology amp economics
bull Deepwater intervention to become increasingly significant to global demand
00
05
10
15
20
25
2005 2006 2007 2008 2009 2010 2011 2012 2013 2014 2015
$bill
ions
Others
Western Europe
North America
Latin America
Asia-Pacific
Africa
Subsea Well Intervention
For more information please
contact Douglas-Westwood
38 SUT London ndash February 2011
320
370
420
470
520
570
620
$00
$05
$10
$15
$20
$25
$30
$35
2005 2006 2007 2008 2009 2010 2011 2012 2013 2014
Ac
tiv
e R
OV
s
Ex
pe
nd
itu
re ($
billio
ns
)
Africa
Asia Pacific
E EuropeFSU
Latin America
Middle East
North America
Western Europe
Active ROVs
The World Work Class ROV Operations Market 2005-2014
(Oil amp Gas) Source ―The World ROV Report 2010-2014 ndash Douglas-Westwood
ROV Paces the Growth of Deepwater
For m
ore
info
rmatio
n p
lease
conta
ct D
ougla
s-W
estw
ood
39 SUT London ndash February 2011
bull Self-guided under water survey and inspection vessels
bull From 1 to 5 meters long
bull Priced from $150000 to $7 million
bull Very hot topic recentlymdashmilitary contractors looking for commercial
applications
bull Greater acceptance for not only deep but shallow water oil and gas
survey
bull But a small market
Hugin 1000 MR AUV Courtesy Kongsberg Marine
AUV ndash Autonomous Underwater Vehicles
40 SUT London ndash February 2011
Subsea Vessel Operations Market
Subsea Operation Vessel Demand by Workscope Source Douglas-Westwood
bull Current IRM market demand for around 92 vessels
bull Field development market still depressed ndash upturn in 2012 amp beyond
bull Well intervention and PampA to see substantial growth
-
50
100
150
200
250
300
2005 2006 2007 2008 2009 2010 2011 2012 2013 2014 2015
V
essels
Intervention amp PampA
Field Development
Inspection Repair amp Maintenance
For m
ore
info
rmatio
n p
lease
conta
ct D
ougla
s-W
estw
ood
41 SUT London ndash February 2011
Macondo ndash a $40 billion tragedy
bull 11 dead
bull Environmental amp PR disaster
bull Blamed on ldquoa failure of
managementrdquo
bull ldquoThe costs of getting it wrong
have gone up a lotrdquo Ceres
bull Will liabilities of deepwater
mean that only the majors can
participate in US
bull Regulatory change bringing
US standards in line with best
practise
bull But US dependence on
deepwater is clear
bull Little long-term impact
elsewhere
US Gulf of Mexico Oil Production ( 2010 view)
0
200
400
600
800
1000
1200
1400
1600
1800
2000
1993 1995 1997 1999 2001 2003 2005 2007 2009F 2011F 2013F 2015F
Barr
els
per
day (
000s)
Additional Deepwater Potential
Deepwater Oil
Shallow Water Oil
Deepwater
42 SUT London ndash February 2011
The next last offshore frontier
43 SUT London ndash February 2011
The Arctic
Credit Hugo Ahlenius UNEPGRID-Arendal
bull Over 400 fields discovered with
approx 240 bn Bboe
bull Further 412 bn Boe yet
undiscovered (USGS) technically
recoverable resources
bull Approx 84 offshore
bull 90 billion barrels (13) of the
worlds undiscovered oil reserves
and 30 of the gas resources
according to USGS
bull But USGS recently reduced
Alaska oil resources by 90
44 SUT London ndash February 2011
Some arctic projects
Norway - Goliat bull Predominantly oil
bull Extended shutdown now back on line
Cairn bull Two drilling rigs off coast of Greenland
bull Modestly promising results to date
Hebron ndash ExxonMobil bull East Canada
bull Fourth Newfoundland field
bull 400 ndash 700 m barrels 92 meters
bull First oil 2017
Shell bull Chukchi and Beaufort seas
bull Permits pulled
bull One year delay
bull Macondo will cast a long shadow
Goliat Source Eni Norge
Sevan 1000 Source Sevan
45 SUT London ndash February 2011
Lifecycle Opportunities
The easy oil goes first
NOCs need to internationalise
And local OFS companies
46 SUT London ndash February 2011
Hyd
roca
rbo
n P
rod
uctio
n
Australia
UK
China
Norway
Thailand
Malaysia
USA
46
Points on the OampG life cycle
bull Australia ndash to see good EampP (gas) growth over the next decade
bull China ndash still growing (mainly from offshore)
bull Malaysia ndash near peak Marginals amp EOR focus High CO2 gas OFS
bull Norway ndash drive to internationalisation of OFS industry
bull UK ndash terminal production decline Decommissioning
Growth Peak and plateau EampP
begins Conventional production decline
Each phase offers a different business opportunity
47 SUT London ndash February 2011
The significance of the national oil company
bull NOCs can be tasked with building a local supply chain
bull and building a knowledge base
bull Examples include
bull Petrobras ndash massive drive to build Brazilian OFS industry
bull Statoil ndash major RampD focus aids Norwegian companies
bull Petronas ndash a heavy focus on local needs
bull But ultimately local OampG production declines
bull Then NOCs need to access other countrieslsquo reserves
bull local OFS companies have to gain business in world markets
bull Then need to upscale and gain external investment
48 SUT London ndash February 2011
Conclusions
49 SUT London ndash February 2011
Conclusions
bull Global economic growth has resumed
bull Oil supply outlook remains restrained
bull Will OPEC answer the call for its nominal spare capacity
bull Oil prices are high but few visible drivers to push them down
bull OFS pricing competition should remain pronounced in 2011
bull Spare capacity in offshore sector rigs equipment services
bull High oil prices and restrained cost pressures should encourage
operators to bring projects forward ndash activity levels should pick up
bull Market players appear to be anticipating the next cycle
bull A good future for the Subsea IRM sector
50 SUT London ndash February 2011
Thank you

13
0
20
40
60
80
100
Year 2030
Uppsala University
IEA EIA IOClsquos
Douglas-Westwood
Total Production Capacity
Current Production
Only material difference between
Uppsala and IEA is depletion rates
on fields to be discovered and
developed to 2030
Range of Global Oil Supply Forecasts ndash 2030 ndash All
Liquids Source various
bull Petroleum liquids
supply forecasts from
75 ndash 105 mbpd for
2030
bull All are essentially
peak oil forecasts
bull Quiet consensus has
emergedmdash
disagreements are
increasingly narrow
and specific
Long-term Outlook A Narrowing of Views
14
Oil Production ndash The Importance of Offshore
There is an increasing reliance on offshore and deepwater production
bull Offshore oil 25 of global production in 1990 31 in 2000 33 in 2010
and 34 by 2020
bull Deepwater 0 in 1990 2 in 2000 9 in 2010 13 by 2020
Global Oil Production 1950-2025
0
10
20
30
40
50
60
70
80
90
100
1930 1937 1944 1951 1958 1965 1972 1979 1986 1993 2000 2007 2014 2021
mill
ion b
arr
els
of
oil
per
day
Bitumen and Oil Sands
Offshore Deep
Offshore Shallow
Conventional Onshore
For m
ore
info
rmatio
n p
lease
conta
ct D
ougla
s-W
estw
ood
15
Peak Oil is a Reality
Data Petroleum Review May 2010
bull With most of the easy oillsquo in the hands of the NOCs
majors are scrambling to replace reserves and off-
set production decline
bull They are moving to harsh environments ndash offshore
deepwater politically difficult geographically remote
Peak Year
2002 2003 2004 2005 2006 2007 2008 2009
ExxonMobil 2496 2516 2571 2523 2681 2616 2404 2387
BP 2018 2121 2531 2562 2475 2414 2410 2535
PetroChina 2109 2119 2233 2270 2276 2312 2380 2311
Shell 2359 2379 2253 2093 2030 1899 1771 1680
Petrobras 1533 1701 1661 1847 1908 1920 1996 2103
Chevron 1897 1823 1737 1701 1759 1783 1676 1872
Total 1589 1661 1695 1621 1506 1509 1456 1381
ConocoPhillips 891 1237 1242 1447 1698 1644 1367 1615
ENI 921 981 1034 1111 1079 1020 1026 1007
StatoilHydro 1112 1132 1135 1102 1058 1054 1056 1067
Source Offshore Technology
NOCs (limited equity access )
78
NOCs (equity access)
10
New Russian Companies
6
Full IOC access6
Restricted access to oil reserves
16 SUT London ndash February 2011
85
86
87
88
89
90
91
92
93
94
95
2009 2010 2011 2012 2013
mill
ion
bar
rels
pe
r d
ay
Demand Growth as 2002-2005
Demand Growth as 1976-1979
IEA Supply Demand Forecast
Effective Global Liquids Production Capacity
Medium term outlook risks of oil shock growing
bull Adequate spare capacity today ndash
but frac34 of it is in Saudi
bull IEA sees demand rising slowly
less than 14 mbpd year in 2011
bull Previous recoveries saw strong
demand growth during first three
years
bull After 2002 77 mbpd
bull After 1976 73 mbpd
bull If previous patterns hold true a
possible supply crunch in
20122013
bull What will Saudi do Source IEA Douglas-Westwood analysis
Oil Demand under Three Scenarios and Global
Liquids Production Capacity
Oil shock
IEA forecast (2010)
Surplus Capacity
bull Dec 2010 demand
Spare Capacity at Saudi 10 mbpd limit
bull Jan 2011 forecast
For m
ore
info
rmatio
n p
lease
conta
ct D
ougla
s-W
estw
ood
17 SUT London ndash February 2011
The WikiLeaks Saudi cables
Crude oil reserves may have been overstated by as much as 300bn barrels
ndash nearly 40
bull Al-Husseini [believes] Aramcos reserves are overstated by as much
as 300bn barrels In his view once 50 of original proven reserves has
been reached hellip a steady output in decline will ensue and no amount of
effort will be able to stop it He believes that what will result is a plateau in
total output that will last approximately 15 years followed by decreasing
outputldquo
bull ldquoClearly they [Saudi] can drive prices up but we question whether they
any longer have the power to drive prices down for a prolonged periodrdquo
Source US Embassy cables to Washington 2007-2009 The Guardian 8 February 2010
Sadad al-Husseini a geologist and former head of exploration at the Saudi oil monopoly Aramco met the US
consul general in Riyadh in November 2007
18
United States
Russia
Iran
Qatar
Other OPEC
Rest of World
100
yearslsquo
US
supply
05
10
15
20
25
30
19
98
19
99
20
00
20
01
20
02
20
03
20
04
20
05
20
06
20
07
20
08
20
09
20
10
20
11
20
12
20
13
20
14
20
15
20
16
20
17
20
18
20
19
Btu ratio Oil-to-Gas
Avg ratio Feb 2010 -Dec 2018Avg ratio 1998 - 2005
Oil-to-Gas Price Ratio on a BTU Parity Basis Source EIA NYMEX futures
Proved Gas Reserves 6300 trillion cubic feet (60 years) Source EIA
bull Gas shales have revolutionized US outlook
bull 100 yearslsquo supply in US resources 2 quadrillion cf resources on 23 tcf consumption
bull Some questions about economics but $7-8 mmbtu gas looks plausible indefinitely
bull Other shale initiatives beginning (BP in China)
bull Major LNG projects continue to come on line
bull Right now the world looks to have plenty of natural gas
The Gas Story is Very Different
For more information please
contact Douglas-Westwood
19 SUT London ndash February 2011
bull Dominated by E Europe amp FSU but others to see significant growth
bull Deepwater gas and LNG to be of growing importance
bull Impact of shale gas on North America (amp other markets)
bull But local supply issues eg Europe to import gt73 by 2020
Natural gas production and use to soar
Source Energyfiles
0
10
20
30
40
50
60
70
80
90
100
1930 1937 1944 1951 1958 1965 1972 1979 1986 1993 2000 2007 2014 2021
million b
arr
els
of o
il eq
uiv
ale
nt p
er d
ay
Africa
Asia
Australasia
Eastern Europe amp FSU
Latin America
Middle East
North America
Western Europe
ME
FSU
NA
For m
ore
info
rmatio
n p
lease
conta
ct D
ougla
s-W
estw
ood
20 SUT London ndash February 2011
10
2428
31
3941
47 48
5356
60
0
1
2
3
4
5
6
Capex ($ m
llion m
W)
Source EIA Nov 2010
Gas ndash lowest Capex for power plants
21 SUT London ndash February 2011
Gas ndash FLNG in prospect
bull Liquefaction ndash $20 bn spend by 2017
bull Australasia to account for 60
bull Woodside has raised the prospect of FLNG for its Greater Sunrise project
bull Inpex (Japan) considering FLNG at its $196 billion Abadi field in Indonesia
bull GDF Suez and Australias Santos set up a joint venture to develop a floating
LNG project off northwest Australia
Picture Shell
Source The World FLNG Report Douglas-Westwood
0
1
2
3
4
5
6
7
8
2006 2007 2008 2009 2010 2011 2012 2013 2014 2015 2016 2017
Exp
en
ditur
e ($ b
illio
n)
Africa
Asia
Australasia
Latin America
Middle East
North America
0
1
2
3
4
5
6
7
8
2006 2007 2008 2009 2010 2011 2012 2013 2014 2015 2016 2017
Exp
en
ditur
e ($ b
illio
n)
Africa
Asia
Australasia
Latin America
Middle East
North America
$67bn
For more information please
contact Douglas-Westwood
22 SUT London ndash February 2011
$0
$100
$200
$300
$400
$500
$600
1995
1996
1997
1998
1999
2000
2001
2002
2003
2004
2005
2006
2007
2008
2009
2010
2011
US
Do
llar
Bil
lio
ns
Outside North America
Canada
United States
bull Recovery in 2010 up 10 to $442 bn
bull Continued growth in 2011 to $490 bn up 11 a new peak
bull US spend up 8 Canada up 5 international up 12
bull Spend up $48 bn in 2011 of which 82 is international
Recovery and growth in global EampP spend
Source Jim Crandell Barclaylsquos EampP Spending Survey December 2010
Global EampP Spend
+10 -15 +11
23 SUT London ndash February 2011
0
10
20
30
40
50
60
70
80
90
100
$70 $75 $80 $85 $90 $95 $100
Cu
mu
lati
ve P
erc
en
t o
f R
esp
on
de
nts
0
10
20
30
40
50
60
70
80
90
100
$35 $40 $45 $50 $55 $60 $65 $70 $75
Cu
mu
lati
ve P
erc
en
t o
f R
esp
on
de
nts
bull EampP companies prepared budgets assuming $77 oil on average
up from $70 last year
bull Expect capex to materially decrease in the industry if oil prices fall
much below $60
bull Expect capex to increase materially if oil prices sustain above $90
up from $85 last year
Source Barclays Capital EampP Spending Survey Dec2010
Oil Price Threshold for Reducing Capex Oil Price Threshold for Increasing Capex
Source Barclays Capital EampP Spending Survey Dec2010
Percent of Respondents Decreasing Capex at a Given Oil Price
Percent of Respondents Increasing Capex at a Given Oil Price
2011 ndash EampP Spend Sensitivity to Oil Prices
24 SUT London ndash February 2011
Offshore Oil amp Gas
Nowhere else left for big finds
Strong Capex growth
Importance of deepwater
The beauty of Opex
25 SUT London ndash February 2011
Global offshore oil amp gas production amp spend to grow
Source Datamonitor
bull Global Capex fell in lsquo0910 but Opex grew
bull Both Capex amp Opex to grow strongly in the years ahead
bull 28 new rigs ordered since October + 8 options 10-15 more in 2011
bull Deepwater Capex to exceed $205 billion
0
20
40
60
80
100
120
140
160
180
200
2006 2007 2008 2009 2010 2011 2012 2013 2014 2015
Ex
pe
nd
itu
re ($
bill
ion
s)
AfricaAsiaAustralasiaEastern Europe and FSULatin AmericaMiddle EastNorth AmericaWestern Europe For more information please
contact Douglas-Westwood
26 SUT London ndash February 2011
OPTIONS
ORDERS
The next rig cycle begins
27 SUT London ndash February 2011
Deepwater Capex to reach new highs
bull Deepwater production to double
bull Drilling $72bn (35) Subsea processing emerging ($26 bn)
Source ldquoThe World Deepwater Market Report 2011-2015rdquo
Douglas-Westwood
0
10
20
30
40
50
60
70
2006 2007 2008 2009 2010 2011 2012 2013 2014 2015
Exp
en
ditur
e ($ b
illio
ns)
DrillingFloating PlatformsPipelinesSubsea ProductionSubsea ProcessingSURF
For more information please
contact Douglas-Westwood
28 SUT London ndash February 2011
Deepwater ndash Africa amp Brazil to lead spend
bull Brazil amp W Africa to total $126bn (62)
bull But much more Brazil spend to come
Source ldquoThe World Deepwater Market Report 2011-2015rdquo
Douglas-Westwood
0
10
20
30
40
50
60
70
2006 2007 2008 2009 2010 2011 2012 2013 2014 2015
Exp
en
ditur
e ($ b
illio
ns)
AfricaAsiaAustralasiaEastern Europe and FSULatin AmericaMiddle EastNorth AmericaWestern Europe
For more information please
contact Douglas-Westwood
29 SUT London ndash February 2011
Brazil ndash Petrobrasrsquos pre-salt deepwater lsquoshopping listrsquo
50 bn boe reserves 2 million production bpd by 2020
By 2018
bull Includes 58 new drilling rigs
By 2020
bull 72 VLCCs
bull 146 supply amp service vessels
bull 45 production platforms
bull Plus subsea hardware
Finance
bull 2010 $70bn stock offering
bull 2011 $6bn corporate bond
bull Next 4 years $30-40bn debt raising
bull Capex of $224bn by 2014
bull Capex amp Opex to total $1 trillion
Tupi Discovery Source CGG Veritas
30 SUT London ndash February 2011
Floating production recovery expected
Global Floating Production Expenditure Source Douglas-Westwood
bull Material decrease in orders in 2009 but market bottomed in 2010
bull Increasing share of market to leased FPSOs Consolidation likely
bull Deepwater Horizon unlikely to impact GoM small part of the market
bull Long term gt200 prospects exist and growth will return
bull Market to reach $16 billion in 2014
0
2
4
6
8
10
12
14
16
18
2006 2007 2008 2009 2010 2011 2012 2013 2014 2015
Exp
en
ditur
e ($ b
illio
ns)
AfricaAsiaAustralasiaEE amp FSULatin AmericaMiddle EastNorth AmericaWestern Europe
For more information please
contact Douglas-Westwood
31 SUT London ndash February 2011
Subsea
Hardware
Operational Demands
Inspection Maintenance Repair
Well intervention
ROV AUV and Subsea Vessels
Operations Market
32 SUT London ndash February 2011
Subsea technology is vital to offshore production
bull Unlocking deepwater reserves
bull Improving economics of marginal fields in shallow waters
bull Tie-backs of small reservoirs into existing facilities
Subsea ndash long term outlook is sound
0
5
10
15
20
25
30
35
40
45
50
0
10
20
30
40
50
60
70
80
2001 2004 2007 2010 2013 2016 2019 2022 2025
Mill
ion B
oep
d
Topside ProductionSubsea Production Subsea Production
Offshore Production 2000-2025 Source Datamonitor
For more information please
contact Douglas-Westwood
33 SUT London ndash February 2011
$0
$5
$10
$15
$20
$25
$30
$35
$40
2006 2007 2008 2009 2010 2011 2012 2013 2014 2015
Exp
en
ditur
e $
bn
Africa AsiaAustralasia Eastern Europe amp FSULatin America Middle EastNorth America NorwayRoWE UK
bull $135 billion forecast for next five years
bull Pipelines to account for half of forecast expenditure
bull Major pipeline projects in Eastern Europe amp FSU Asia and the Middle
East
bull Subsea production hardware SURF and subsea processing driven by
deepwater regions
Source FMC Technologies
Subsea Hardware
For more information please
contact Douglas-Westwood
34 SUT London ndash February 2011
0
10
20
30
40
50
60
70
80
Mill
ion B
oepd
Incremental ProductionLost through DeclineProduction Base
Global Offshore Production 2010-2015 Source Datamonitor
bull 462 million boepd in 2010
bull Average global decline rates of 51 (115 in North Sea)
bull Substantial investment in operational expenditure to be required
Operational demands intensifying
For more information please
contact Douglas-Westwood
35 SUT London ndash February 2011
Offshore ops amp maint spend to see good growth
Source ldquoThe World Offshore Operations amp Maintenance Market Report 2010-14rdquo
Douglas-Westwood
$0
$10
$20
$30
$40
$50
$60
$70
$80
2005 2006 2007 2008 2009 2010 2011 2012 2013 2014
$bill
ions
AfricaAsia-PacificEastern Europe amp FSULatin AmericaMiddle EastNorth AmericaNorwayUKRest of Europe
bull gt7000 fixed amp gt200 floating platforms
bull Plus demand for major modifications
Fo
r more
info
rmatio
n p
lease
conta
ct D
ougla
s-W
estw
ood
36 SUT London ndash February 2011
Subsea IRM Expenditure 2004-2015 Source Douglas-Westwood
bull Over 7000 production platforms 190000km of pipeline currently installed
bull $28 billion of expenditure in Subsea IRM in 2010
bull Nearly $20 billion of further investment expected over the next five years
bull 55 forecast expenditure expected in the North Sea amp Gulf of Mexico
bull Less exposure to market cyclicality
00
10
20
30
40
50
60
2005 2006 2007 2008 2009 2010 2011 2012 2013 2014 2015
$m
illio
ns
Others
Western Europe
North America
Latin America
Asia-Pacific
Africa
Subsea Inspection Repair amp Maintenance
For m
ore
info
rmatio
n p
lease
conta
ct D
ougla
s-W
estw
ood
37 SUT London ndash February 2011
Subsea Well Intervention Expenditure 2004-2015 Source Douglas-Westwood
bull Demand driven by production decline of existing wells Nearly 4000 active
bull Market has been historically been constrained by technology amp economics
bull Deepwater intervention to become increasingly significant to global demand
00
05
10
15
20
25
2005 2006 2007 2008 2009 2010 2011 2012 2013 2014 2015
$bill
ions
Others
Western Europe
North America
Latin America
Asia-Pacific
Africa
Subsea Well Intervention
For more information please
contact Douglas-Westwood
38 SUT London ndash February 2011
320
370
420
470
520
570
620
$00
$05
$10
$15
$20
$25
$30
$35
2005 2006 2007 2008 2009 2010 2011 2012 2013 2014
Ac
tiv
e R
OV
s
Ex
pe
nd
itu
re ($
billio
ns
)
Africa
Asia Pacific
E EuropeFSU
Latin America
Middle East
North America
Western Europe
Active ROVs
The World Work Class ROV Operations Market 2005-2014
(Oil amp Gas) Source ―The World ROV Report 2010-2014 ndash Douglas-Westwood
ROV Paces the Growth of Deepwater
For m
ore
info
rmatio
n p
lease
conta
ct D
ougla
s-W
estw
ood
39 SUT London ndash February 2011
bull Self-guided under water survey and inspection vessels
bull From 1 to 5 meters long
bull Priced from $150000 to $7 million
bull Very hot topic recentlymdashmilitary contractors looking for commercial
applications
bull Greater acceptance for not only deep but shallow water oil and gas
survey
bull But a small market
Hugin 1000 MR AUV Courtesy Kongsberg Marine
AUV ndash Autonomous Underwater Vehicles
40 SUT London ndash February 2011
Subsea Vessel Operations Market
Subsea Operation Vessel Demand by Workscope Source Douglas-Westwood
bull Current IRM market demand for around 92 vessels
bull Field development market still depressed ndash upturn in 2012 amp beyond
bull Well intervention and PampA to see substantial growth
-
50
100
150
200
250
300
2005 2006 2007 2008 2009 2010 2011 2012 2013 2014 2015
V
essels
Intervention amp PampA
Field Development
Inspection Repair amp Maintenance
For m
ore
info
rmatio
n p
lease
conta
ct D
ougla
s-W
estw
ood
41 SUT London ndash February 2011
Macondo ndash a $40 billion tragedy
bull 11 dead
bull Environmental amp PR disaster
bull Blamed on ldquoa failure of
managementrdquo
bull ldquoThe costs of getting it wrong
have gone up a lotrdquo Ceres
bull Will liabilities of deepwater
mean that only the majors can
participate in US
bull Regulatory change bringing
US standards in line with best
practise
bull But US dependence on
deepwater is clear
bull Little long-term impact
elsewhere
US Gulf of Mexico Oil Production ( 2010 view)
0
200
400
600
800
1000
1200
1400
1600
1800
2000
1993 1995 1997 1999 2001 2003 2005 2007 2009F 2011F 2013F 2015F
Barr
els
per
day (
000s)
Additional Deepwater Potential
Deepwater Oil
Shallow Water Oil
Deepwater
42 SUT London ndash February 2011
The next last offshore frontier
43 SUT London ndash February 2011
The Arctic
Credit Hugo Ahlenius UNEPGRID-Arendal
bull Over 400 fields discovered with
approx 240 bn Bboe
bull Further 412 bn Boe yet
undiscovered (USGS) technically
recoverable resources
bull Approx 84 offshore
bull 90 billion barrels (13) of the
worlds undiscovered oil reserves
and 30 of the gas resources
according to USGS
bull But USGS recently reduced
Alaska oil resources by 90
44 SUT London ndash February 2011
Some arctic projects
Norway - Goliat bull Predominantly oil
bull Extended shutdown now back on line
Cairn bull Two drilling rigs off coast of Greenland
bull Modestly promising results to date
Hebron ndash ExxonMobil bull East Canada
bull Fourth Newfoundland field
bull 400 ndash 700 m barrels 92 meters
bull First oil 2017
Shell bull Chukchi and Beaufort seas
bull Permits pulled
bull One year delay
bull Macondo will cast a long shadow
Goliat Source Eni Norge
Sevan 1000 Source Sevan
45 SUT London ndash February 2011
Lifecycle Opportunities
The easy oil goes first
NOCs need to internationalise
And local OFS companies
46 SUT London ndash February 2011
Hyd
roca
rbo
n P
rod
uctio
n
Australia
UK
China
Norway
Thailand
Malaysia
USA
46
Points on the OampG life cycle
bull Australia ndash to see good EampP (gas) growth over the next decade
bull China ndash still growing (mainly from offshore)
bull Malaysia ndash near peak Marginals amp EOR focus High CO2 gas OFS
bull Norway ndash drive to internationalisation of OFS industry
bull UK ndash terminal production decline Decommissioning
Growth Peak and plateau EampP
begins Conventional production decline
Each phase offers a different business opportunity
47 SUT London ndash February 2011
The significance of the national oil company
bull NOCs can be tasked with building a local supply chain
bull and building a knowledge base
bull Examples include
bull Petrobras ndash massive drive to build Brazilian OFS industry
bull Statoil ndash major RampD focus aids Norwegian companies
bull Petronas ndash a heavy focus on local needs
bull But ultimately local OampG production declines
bull Then NOCs need to access other countrieslsquo reserves
bull local OFS companies have to gain business in world markets
bull Then need to upscale and gain external investment
48 SUT London ndash February 2011
Conclusions
49 SUT London ndash February 2011
Conclusions
bull Global economic growth has resumed
bull Oil supply outlook remains restrained
bull Will OPEC answer the call for its nominal spare capacity
bull Oil prices are high but few visible drivers to push them down
bull OFS pricing competition should remain pronounced in 2011
bull Spare capacity in offshore sector rigs equipment services
bull High oil prices and restrained cost pressures should encourage
operators to bring projects forward ndash activity levels should pick up
bull Market players appear to be anticipating the next cycle
bull A good future for the Subsea IRM sector
50 SUT London ndash February 2011
Thank you
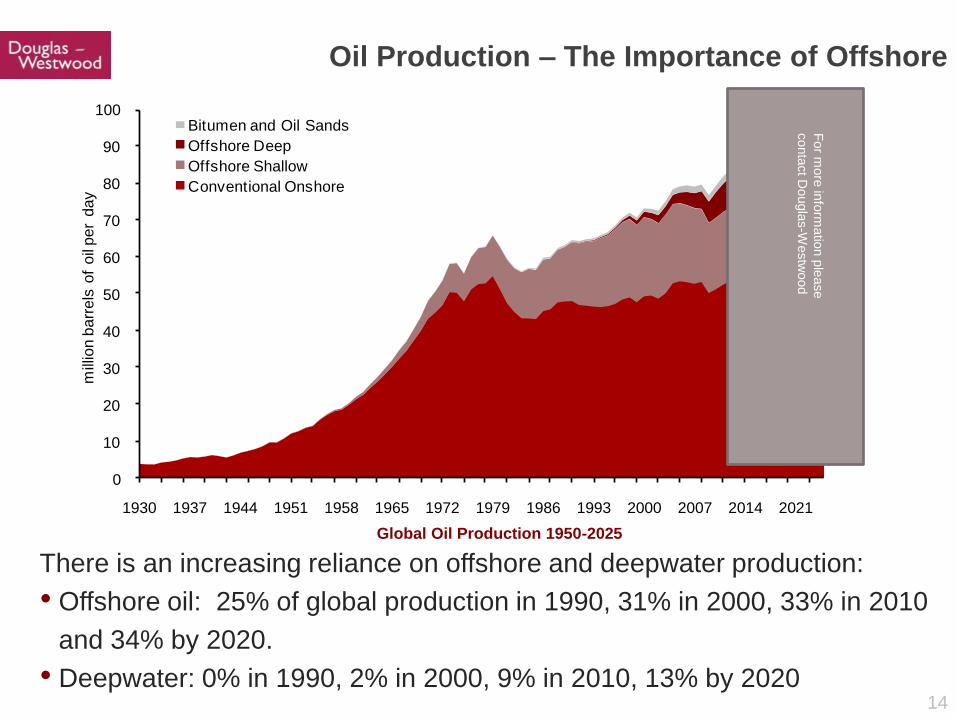
14
Oil Production ndash The Importance of Offshore
There is an increasing reliance on offshore and deepwater production
bull Offshore oil 25 of global production in 1990 31 in 2000 33 in 2010
and 34 by 2020
bull Deepwater 0 in 1990 2 in 2000 9 in 2010 13 by 2020
Global Oil Production 1950-2025
0
10
20
30
40
50
60
70
80
90
100
1930 1937 1944 1951 1958 1965 1972 1979 1986 1993 2000 2007 2014 2021
mill
ion b
arr
els
of
oil
per
day
Bitumen and Oil Sands
Offshore Deep
Offshore Shallow
Conventional Onshore
For m
ore
info
rmatio
n p
lease
conta
ct D
ougla
s-W
estw
ood
15
Peak Oil is a Reality
Data Petroleum Review May 2010
bull With most of the easy oillsquo in the hands of the NOCs
majors are scrambling to replace reserves and off-
set production decline
bull They are moving to harsh environments ndash offshore
deepwater politically difficult geographically remote
Peak Year
2002 2003 2004 2005 2006 2007 2008 2009
ExxonMobil 2496 2516 2571 2523 2681 2616 2404 2387
BP 2018 2121 2531 2562 2475 2414 2410 2535
PetroChina 2109 2119 2233 2270 2276 2312 2380 2311
Shell 2359 2379 2253 2093 2030 1899 1771 1680
Petrobras 1533 1701 1661 1847 1908 1920 1996 2103
Chevron 1897 1823 1737 1701 1759 1783 1676 1872
Total 1589 1661 1695 1621 1506 1509 1456 1381
ConocoPhillips 891 1237 1242 1447 1698 1644 1367 1615
ENI 921 981 1034 1111 1079 1020 1026 1007
StatoilHydro 1112 1132 1135 1102 1058 1054 1056 1067
Source Offshore Technology
NOCs (limited equity access )
78
NOCs (equity access)
10
New Russian Companies
6
Full IOC access6
Restricted access to oil reserves
16 SUT London ndash February 2011
85
86
87
88
89
90
91
92
93
94
95
2009 2010 2011 2012 2013
mill
ion
bar
rels
pe
r d
ay
Demand Growth as 2002-2005
Demand Growth as 1976-1979
IEA Supply Demand Forecast
Effective Global Liquids Production Capacity
Medium term outlook risks of oil shock growing
bull Adequate spare capacity today ndash
but frac34 of it is in Saudi
bull IEA sees demand rising slowly
less than 14 mbpd year in 2011
bull Previous recoveries saw strong
demand growth during first three
years
bull After 2002 77 mbpd
bull After 1976 73 mbpd
bull If previous patterns hold true a
possible supply crunch in
20122013
bull What will Saudi do Source IEA Douglas-Westwood analysis
Oil Demand under Three Scenarios and Global
Liquids Production Capacity
Oil shock
IEA forecast (2010)
Surplus Capacity
bull Dec 2010 demand
Spare Capacity at Saudi 10 mbpd limit
bull Jan 2011 forecast
For m
ore
info
rmatio
n p
lease
conta
ct D
ougla
s-W
estw
ood
17 SUT London ndash February 2011
The WikiLeaks Saudi cables
Crude oil reserves may have been overstated by as much as 300bn barrels
ndash nearly 40
bull Al-Husseini [believes] Aramcos reserves are overstated by as much
as 300bn barrels In his view once 50 of original proven reserves has
been reached hellip a steady output in decline will ensue and no amount of
effort will be able to stop it He believes that what will result is a plateau in
total output that will last approximately 15 years followed by decreasing
outputldquo
bull ldquoClearly they [Saudi] can drive prices up but we question whether they
any longer have the power to drive prices down for a prolonged periodrdquo
Source US Embassy cables to Washington 2007-2009 The Guardian 8 February 2010
Sadad al-Husseini a geologist and former head of exploration at the Saudi oil monopoly Aramco met the US
consul general in Riyadh in November 2007
18
United States
Russia
Iran
Qatar
Other OPEC
Rest of World
100
yearslsquo
US
supply
05
10
15
20
25
30
19
98
19
99
20
00
20
01
20
02
20
03
20
04
20
05
20
06
20
07
20
08
20
09
20
10
20
11
20
12
20
13
20
14
20
15
20
16
20
17
20
18
20
19
Btu ratio Oil-to-Gas
Avg ratio Feb 2010 -Dec 2018Avg ratio 1998 - 2005
Oil-to-Gas Price Ratio on a BTU Parity Basis Source EIA NYMEX futures
Proved Gas Reserves 6300 trillion cubic feet (60 years) Source EIA
bull Gas shales have revolutionized US outlook
bull 100 yearslsquo supply in US resources 2 quadrillion cf resources on 23 tcf consumption
bull Some questions about economics but $7-8 mmbtu gas looks plausible indefinitely
bull Other shale initiatives beginning (BP in China)
bull Major LNG projects continue to come on line
bull Right now the world looks to have plenty of natural gas
The Gas Story is Very Different
For more information please
contact Douglas-Westwood
19 SUT London ndash February 2011
bull Dominated by E Europe amp FSU but others to see significant growth
bull Deepwater gas and LNG to be of growing importance
bull Impact of shale gas on North America (amp other markets)
bull But local supply issues eg Europe to import gt73 by 2020
Natural gas production and use to soar
Source Energyfiles
0
10
20
30
40
50
60
70
80
90
100
1930 1937 1944 1951 1958 1965 1972 1979 1986 1993 2000 2007 2014 2021
million b
arr
els
of o
il eq
uiv
ale
nt p
er d
ay
Africa
Asia
Australasia
Eastern Europe amp FSU
Latin America
Middle East
North America
Western Europe
ME
FSU
NA
For m
ore
info
rmatio
n p
lease
conta
ct D
ougla
s-W
estw
ood
20 SUT London ndash February 2011
10
2428
31
3941
47 48
5356
60
0
1
2
3
4
5
6
Capex ($ m
llion m
W)
Source EIA Nov 2010
Gas ndash lowest Capex for power plants
21 SUT London ndash February 2011
Gas ndash FLNG in prospect
bull Liquefaction ndash $20 bn spend by 2017
bull Australasia to account for 60
bull Woodside has raised the prospect of FLNG for its Greater Sunrise project
bull Inpex (Japan) considering FLNG at its $196 billion Abadi field in Indonesia
bull GDF Suez and Australias Santos set up a joint venture to develop a floating
LNG project off northwest Australia
Picture Shell
Source The World FLNG Report Douglas-Westwood
0
1
2
3
4
5
6
7
8
2006 2007 2008 2009 2010 2011 2012 2013 2014 2015 2016 2017
Exp
en
ditur
e ($ b
illio
n)
Africa
Asia
Australasia
Latin America
Middle East
North America
0
1
2
3
4
5
6
7
8
2006 2007 2008 2009 2010 2011 2012 2013 2014 2015 2016 2017
Exp
en
ditur
e ($ b
illio
n)
Africa
Asia
Australasia
Latin America
Middle East
North America
$67bn
For more information please
contact Douglas-Westwood
22 SUT London ndash February 2011
$0
$100
$200
$300
$400
$500
$600
1995
1996
1997
1998
1999
2000
2001
2002
2003
2004
2005
2006
2007
2008
2009
2010
2011
US
Do
llar
Bil
lio
ns
Outside North America
Canada
United States
bull Recovery in 2010 up 10 to $442 bn
bull Continued growth in 2011 to $490 bn up 11 a new peak
bull US spend up 8 Canada up 5 international up 12
bull Spend up $48 bn in 2011 of which 82 is international
Recovery and growth in global EampP spend
Source Jim Crandell Barclaylsquos EampP Spending Survey December 2010
Global EampP Spend
+10 -15 +11
23 SUT London ndash February 2011
0
10
20
30
40
50
60
70
80
90
100
$70 $75 $80 $85 $90 $95 $100
Cu
mu
lati
ve P
erc
en
t o
f R
esp
on
de
nts
0
10
20
30
40
50
60
70
80
90
100
$35 $40 $45 $50 $55 $60 $65 $70 $75
Cu
mu
lati
ve P
erc
en
t o
f R
esp
on
de
nts
bull EampP companies prepared budgets assuming $77 oil on average
up from $70 last year
bull Expect capex to materially decrease in the industry if oil prices fall
much below $60
bull Expect capex to increase materially if oil prices sustain above $90
up from $85 last year
Source Barclays Capital EampP Spending Survey Dec2010
Oil Price Threshold for Reducing Capex Oil Price Threshold for Increasing Capex
Source Barclays Capital EampP Spending Survey Dec2010
Percent of Respondents Decreasing Capex at a Given Oil Price
Percent of Respondents Increasing Capex at a Given Oil Price
2011 ndash EampP Spend Sensitivity to Oil Prices
24 SUT London ndash February 2011
Offshore Oil amp Gas
Nowhere else left for big finds
Strong Capex growth
Importance of deepwater
The beauty of Opex
25 SUT London ndash February 2011
Global offshore oil amp gas production amp spend to grow
Source Datamonitor
bull Global Capex fell in lsquo0910 but Opex grew
bull Both Capex amp Opex to grow strongly in the years ahead
bull 28 new rigs ordered since October + 8 options 10-15 more in 2011
bull Deepwater Capex to exceed $205 billion
0
20
40
60
80
100
120
140
160
180
200
2006 2007 2008 2009 2010 2011 2012 2013 2014 2015
Ex
pe
nd
itu
re ($
bill
ion
s)
AfricaAsiaAustralasiaEastern Europe and FSULatin AmericaMiddle EastNorth AmericaWestern Europe For more information please
contact Douglas-Westwood
26 SUT London ndash February 2011
OPTIONS
ORDERS
The next rig cycle begins
27 SUT London ndash February 2011
Deepwater Capex to reach new highs
bull Deepwater production to double
bull Drilling $72bn (35) Subsea processing emerging ($26 bn)
Source ldquoThe World Deepwater Market Report 2011-2015rdquo
Douglas-Westwood
0
10
20
30
40
50
60
70
2006 2007 2008 2009 2010 2011 2012 2013 2014 2015
Exp
en
ditur
e ($ b
illio
ns)
DrillingFloating PlatformsPipelinesSubsea ProductionSubsea ProcessingSURF
For more information please
contact Douglas-Westwood
28 SUT London ndash February 2011
Deepwater ndash Africa amp Brazil to lead spend
bull Brazil amp W Africa to total $126bn (62)
bull But much more Brazil spend to come
Source ldquoThe World Deepwater Market Report 2011-2015rdquo
Douglas-Westwood
0
10
20
30
40
50
60
70
2006 2007 2008 2009 2010 2011 2012 2013 2014 2015
Exp
en
ditur
e ($ b
illio
ns)
AfricaAsiaAustralasiaEastern Europe and FSULatin AmericaMiddle EastNorth AmericaWestern Europe
For more information please
contact Douglas-Westwood
29 SUT London ndash February 2011
Brazil ndash Petrobrasrsquos pre-salt deepwater lsquoshopping listrsquo
50 bn boe reserves 2 million production bpd by 2020
By 2018
bull Includes 58 new drilling rigs
By 2020
bull 72 VLCCs
bull 146 supply amp service vessels
bull 45 production platforms
bull Plus subsea hardware
Finance
bull 2010 $70bn stock offering
bull 2011 $6bn corporate bond
bull Next 4 years $30-40bn debt raising
bull Capex of $224bn by 2014
bull Capex amp Opex to total $1 trillion
Tupi Discovery Source CGG Veritas
30 SUT London ndash February 2011
Floating production recovery expected
Global Floating Production Expenditure Source Douglas-Westwood
bull Material decrease in orders in 2009 but market bottomed in 2010
bull Increasing share of market to leased FPSOs Consolidation likely
bull Deepwater Horizon unlikely to impact GoM small part of the market
bull Long term gt200 prospects exist and growth will return
bull Market to reach $16 billion in 2014
0
2
4
6
8
10
12
14
16
18
2006 2007 2008 2009 2010 2011 2012 2013 2014 2015
Exp
en
ditur
e ($ b
illio
ns)
AfricaAsiaAustralasiaEE amp FSULatin AmericaMiddle EastNorth AmericaWestern Europe
For more information please
contact Douglas-Westwood
31 SUT London ndash February 2011
Subsea
Hardware
Operational Demands
Inspection Maintenance Repair
Well intervention
ROV AUV and Subsea Vessels
Operations Market
32 SUT London ndash February 2011
Subsea technology is vital to offshore production
bull Unlocking deepwater reserves
bull Improving economics of marginal fields in shallow waters
bull Tie-backs of small reservoirs into existing facilities
Subsea ndash long term outlook is sound
0
5
10
15
20
25
30
35
40
45
50
0
10
20
30
40
50
60
70
80
2001 2004 2007 2010 2013 2016 2019 2022 2025
Mill
ion B
oep
d
Topside ProductionSubsea Production Subsea Production
Offshore Production 2000-2025 Source Datamonitor
For more information please
contact Douglas-Westwood
33 SUT London ndash February 2011
$0
$5
$10
$15
$20
$25
$30
$35
$40
2006 2007 2008 2009 2010 2011 2012 2013 2014 2015
Exp
en
ditur
e $
bn
Africa AsiaAustralasia Eastern Europe amp FSULatin America Middle EastNorth America NorwayRoWE UK
bull $135 billion forecast for next five years
bull Pipelines to account for half of forecast expenditure
bull Major pipeline projects in Eastern Europe amp FSU Asia and the Middle
East
bull Subsea production hardware SURF and subsea processing driven by
deepwater regions
Source FMC Technologies
Subsea Hardware
For more information please
contact Douglas-Westwood
34 SUT London ndash February 2011
0
10
20
30
40
50
60
70
80
Mill
ion B
oepd
Incremental ProductionLost through DeclineProduction Base
Global Offshore Production 2010-2015 Source Datamonitor
bull 462 million boepd in 2010
bull Average global decline rates of 51 (115 in North Sea)
bull Substantial investment in operational expenditure to be required
Operational demands intensifying
For more information please
contact Douglas-Westwood
35 SUT London ndash February 2011
Offshore ops amp maint spend to see good growth
Source ldquoThe World Offshore Operations amp Maintenance Market Report 2010-14rdquo
Douglas-Westwood
$0
$10
$20
$30
$40
$50
$60
$70
$80
2005 2006 2007 2008 2009 2010 2011 2012 2013 2014
$bill
ions
AfricaAsia-PacificEastern Europe amp FSULatin AmericaMiddle EastNorth AmericaNorwayUKRest of Europe
bull gt7000 fixed amp gt200 floating platforms
bull Plus demand for major modifications
Fo
r more
info
rmatio
n p
lease
conta
ct D
ougla
s-W
estw
ood
36 SUT London ndash February 2011
Subsea IRM Expenditure 2004-2015 Source Douglas-Westwood
bull Over 7000 production platforms 190000km of pipeline currently installed
bull $28 billion of expenditure in Subsea IRM in 2010
bull Nearly $20 billion of further investment expected over the next five years
bull 55 forecast expenditure expected in the North Sea amp Gulf of Mexico
bull Less exposure to market cyclicality
00
10
20
30
40
50
60
2005 2006 2007 2008 2009 2010 2011 2012 2013 2014 2015
$m
illio
ns
Others
Western Europe
North America
Latin America
Asia-Pacific
Africa
Subsea Inspection Repair amp Maintenance
For m
ore
info
rmatio
n p
lease
conta
ct D
ougla
s-W
estw
ood
37 SUT London ndash February 2011
Subsea Well Intervention Expenditure 2004-2015 Source Douglas-Westwood
bull Demand driven by production decline of existing wells Nearly 4000 active
bull Market has been historically been constrained by technology amp economics
bull Deepwater intervention to become increasingly significant to global demand
00
05
10
15
20
25
2005 2006 2007 2008 2009 2010 2011 2012 2013 2014 2015
$bill
ions
Others
Western Europe
North America
Latin America
Asia-Pacific
Africa
Subsea Well Intervention
For more information please
contact Douglas-Westwood
38 SUT London ndash February 2011
320
370
420
470
520
570
620
$00
$05
$10
$15
$20
$25
$30
$35
2005 2006 2007 2008 2009 2010 2011 2012 2013 2014
Ac
tiv
e R
OV
s
Ex
pe
nd
itu
re ($
billio
ns
)
Africa
Asia Pacific
E EuropeFSU
Latin America
Middle East
North America
Western Europe
Active ROVs
The World Work Class ROV Operations Market 2005-2014
(Oil amp Gas) Source ―The World ROV Report 2010-2014 ndash Douglas-Westwood
ROV Paces the Growth of Deepwater
For m
ore
info
rmatio
n p
lease
conta
ct D
ougla
s-W
estw
ood
39 SUT London ndash February 2011
bull Self-guided under water survey and inspection vessels
bull From 1 to 5 meters long
bull Priced from $150000 to $7 million
bull Very hot topic recentlymdashmilitary contractors looking for commercial
applications
bull Greater acceptance for not only deep but shallow water oil and gas
survey
bull But a small market
Hugin 1000 MR AUV Courtesy Kongsberg Marine
AUV ndash Autonomous Underwater Vehicles
40 SUT London ndash February 2011
Subsea Vessel Operations Market
Subsea Operation Vessel Demand by Workscope Source Douglas-Westwood
bull Current IRM market demand for around 92 vessels
bull Field development market still depressed ndash upturn in 2012 amp beyond
bull Well intervention and PampA to see substantial growth
-
50
100
150
200
250
300
2005 2006 2007 2008 2009 2010 2011 2012 2013 2014 2015
V
essels
Intervention amp PampA
Field Development
Inspection Repair amp Maintenance
For m
ore
info
rmatio
n p
lease
conta
ct D
ougla
s-W
estw
ood
41 SUT London ndash February 2011
Macondo ndash a $40 billion tragedy
bull 11 dead
bull Environmental amp PR disaster
bull Blamed on ldquoa failure of
managementrdquo
bull ldquoThe costs of getting it wrong
have gone up a lotrdquo Ceres
bull Will liabilities of deepwater
mean that only the majors can
participate in US
bull Regulatory change bringing
US standards in line with best
practise
bull But US dependence on
deepwater is clear
bull Little long-term impact
elsewhere
US Gulf of Mexico Oil Production ( 2010 view)
0
200
400
600
800
1000
1200
1400
1600
1800
2000
1993 1995 1997 1999 2001 2003 2005 2007 2009F 2011F 2013F 2015F
Barr
els
per
day (
000s)
Additional Deepwater Potential
Deepwater Oil
Shallow Water Oil
Deepwater
42 SUT London ndash February 2011
The next last offshore frontier
43 SUT London ndash February 2011
The Arctic
Credit Hugo Ahlenius UNEPGRID-Arendal
bull Over 400 fields discovered with
approx 240 bn Bboe
bull Further 412 bn Boe yet
undiscovered (USGS) technically
recoverable resources
bull Approx 84 offshore
bull 90 billion barrels (13) of the
worlds undiscovered oil reserves
and 30 of the gas resources
according to USGS
bull But USGS recently reduced
Alaska oil resources by 90
44 SUT London ndash February 2011
Some arctic projects
Norway - Goliat bull Predominantly oil
bull Extended shutdown now back on line
Cairn bull Two drilling rigs off coast of Greenland
bull Modestly promising results to date
Hebron ndash ExxonMobil bull East Canada
bull Fourth Newfoundland field
bull 400 ndash 700 m barrels 92 meters
bull First oil 2017
Shell bull Chukchi and Beaufort seas
bull Permits pulled
bull One year delay
bull Macondo will cast a long shadow
Goliat Source Eni Norge
Sevan 1000 Source Sevan
45 SUT London ndash February 2011
Lifecycle Opportunities
The easy oil goes first
NOCs need to internationalise
And local OFS companies
46 SUT London ndash February 2011
Hyd
roca
rbo
n P
rod
uctio
n
Australia
UK
China
Norway
Thailand
Malaysia
USA
46
Points on the OampG life cycle
bull Australia ndash to see good EampP (gas) growth over the next decade
bull China ndash still growing (mainly from offshore)
bull Malaysia ndash near peak Marginals amp EOR focus High CO2 gas OFS
bull Norway ndash drive to internationalisation of OFS industry
bull UK ndash terminal production decline Decommissioning
Growth Peak and plateau EampP
begins Conventional production decline
Each phase offers a different business opportunity
47 SUT London ndash February 2011
The significance of the national oil company
bull NOCs can be tasked with building a local supply chain
bull and building a knowledge base
bull Examples include
bull Petrobras ndash massive drive to build Brazilian OFS industry
bull Statoil ndash major RampD focus aids Norwegian companies
bull Petronas ndash a heavy focus on local needs
bull But ultimately local OampG production declines
bull Then NOCs need to access other countrieslsquo reserves
bull local OFS companies have to gain business in world markets
bull Then need to upscale and gain external investment
48 SUT London ndash February 2011
Conclusions
49 SUT London ndash February 2011
Conclusions
bull Global economic growth has resumed
bull Oil supply outlook remains restrained
bull Will OPEC answer the call for its nominal spare capacity
bull Oil prices are high but few visible drivers to push them down
bull OFS pricing competition should remain pronounced in 2011
bull Spare capacity in offshore sector rigs equipment services
bull High oil prices and restrained cost pressures should encourage
operators to bring projects forward ndash activity levels should pick up
bull Market players appear to be anticipating the next cycle
bull A good future for the Subsea IRM sector
50 SUT London ndash February 2011
Thank you

15
Peak Oil is a Reality
Data Petroleum Review May 2010
bull With most of the easy oillsquo in the hands of the NOCs
majors are scrambling to replace reserves and off-
set production decline
bull They are moving to harsh environments ndash offshore
deepwater politically difficult geographically remote
Peak Year
2002 2003 2004 2005 2006 2007 2008 2009
ExxonMobil 2496 2516 2571 2523 2681 2616 2404 2387
BP 2018 2121 2531 2562 2475 2414 2410 2535
PetroChina 2109 2119 2233 2270 2276 2312 2380 2311
Shell 2359 2379 2253 2093 2030 1899 1771 1680
Petrobras 1533 1701 1661 1847 1908 1920 1996 2103
Chevron 1897 1823 1737 1701 1759 1783 1676 1872
Total 1589 1661 1695 1621 1506 1509 1456 1381
ConocoPhillips 891 1237 1242 1447 1698 1644 1367 1615
ENI 921 981 1034 1111 1079 1020 1026 1007
StatoilHydro 1112 1132 1135 1102 1058 1054 1056 1067
Source Offshore Technology
NOCs (limited equity access )
78
NOCs (equity access)
10
New Russian Companies
6
Full IOC access6
Restricted access to oil reserves
16 SUT London ndash February 2011
85
86
87
88
89
90
91
92
93
94
95
2009 2010 2011 2012 2013
mill
ion
bar
rels
pe
r d
ay
Demand Growth as 2002-2005
Demand Growth as 1976-1979
IEA Supply Demand Forecast
Effective Global Liquids Production Capacity
Medium term outlook risks of oil shock growing
bull Adequate spare capacity today ndash
but frac34 of it is in Saudi
bull IEA sees demand rising slowly
less than 14 mbpd year in 2011
bull Previous recoveries saw strong
demand growth during first three
years
bull After 2002 77 mbpd
bull After 1976 73 mbpd
bull If previous patterns hold true a
possible supply crunch in
20122013
bull What will Saudi do Source IEA Douglas-Westwood analysis
Oil Demand under Three Scenarios and Global
Liquids Production Capacity
Oil shock
IEA forecast (2010)
Surplus Capacity
bull Dec 2010 demand
Spare Capacity at Saudi 10 mbpd limit
bull Jan 2011 forecast
For m
ore
info
rmatio
n p
lease
conta
ct D
ougla
s-W
estw
ood
17 SUT London ndash February 2011
The WikiLeaks Saudi cables
Crude oil reserves may have been overstated by as much as 300bn barrels
ndash nearly 40
bull Al-Husseini [believes] Aramcos reserves are overstated by as much
as 300bn barrels In his view once 50 of original proven reserves has
been reached hellip a steady output in decline will ensue and no amount of
effort will be able to stop it He believes that what will result is a plateau in
total output that will last approximately 15 years followed by decreasing
outputldquo
bull ldquoClearly they [Saudi] can drive prices up but we question whether they
any longer have the power to drive prices down for a prolonged periodrdquo
Source US Embassy cables to Washington 2007-2009 The Guardian 8 February 2010
Sadad al-Husseini a geologist and former head of exploration at the Saudi oil monopoly Aramco met the US
consul general in Riyadh in November 2007
18
United States
Russia
Iran
Qatar
Other OPEC
Rest of World
100
yearslsquo
US
supply
05
10
15
20
25
30
19
98
19
99
20
00
20
01
20
02
20
03
20
04
20
05
20
06
20
07
20
08
20
09
20
10
20
11
20
12
20
13
20
14
20
15
20
16
20
17
20
18
20
19
Btu ratio Oil-to-Gas
Avg ratio Feb 2010 -Dec 2018Avg ratio 1998 - 2005
Oil-to-Gas Price Ratio on a BTU Parity Basis Source EIA NYMEX futures
Proved Gas Reserves 6300 trillion cubic feet (60 years) Source EIA
bull Gas shales have revolutionized US outlook
bull 100 yearslsquo supply in US resources 2 quadrillion cf resources on 23 tcf consumption
bull Some questions about economics but $7-8 mmbtu gas looks plausible indefinitely
bull Other shale initiatives beginning (BP in China)
bull Major LNG projects continue to come on line
bull Right now the world looks to have plenty of natural gas
The Gas Story is Very Different
For more information please
contact Douglas-Westwood
19 SUT London ndash February 2011
bull Dominated by E Europe amp FSU but others to see significant growth
bull Deepwater gas and LNG to be of growing importance
bull Impact of shale gas on North America (amp other markets)
bull But local supply issues eg Europe to import gt73 by 2020
Natural gas production and use to soar
Source Energyfiles
0
10
20
30
40
50
60
70
80
90
100
1930 1937 1944 1951 1958 1965 1972 1979 1986 1993 2000 2007 2014 2021
million b
arr
els
of o
il eq
uiv
ale
nt p
er d
ay
Africa
Asia
Australasia
Eastern Europe amp FSU
Latin America
Middle East
North America
Western Europe
ME
FSU
NA
For m
ore
info
rmatio
n p
lease
conta
ct D
ougla
s-W
estw
ood
20 SUT London ndash February 2011
10
2428
31
3941
47 48
5356
60
0
1
2
3
4
5
6
Capex ($ m
llion m
W)
Source EIA Nov 2010
Gas ndash lowest Capex for power plants
21 SUT London ndash February 2011
Gas ndash FLNG in prospect
bull Liquefaction ndash $20 bn spend by 2017
bull Australasia to account for 60
bull Woodside has raised the prospect of FLNG for its Greater Sunrise project
bull Inpex (Japan) considering FLNG at its $196 billion Abadi field in Indonesia
bull GDF Suez and Australias Santos set up a joint venture to develop a floating
LNG project off northwest Australia
Picture Shell
Source The World FLNG Report Douglas-Westwood
0
1
2
3
4
5
6
7
8
2006 2007 2008 2009 2010 2011 2012 2013 2014 2015 2016 2017
Exp
en
ditur
e ($ b
illio
n)
Africa
Asia
Australasia
Latin America
Middle East
North America
0
1
2
3
4
5
6
7
8
2006 2007 2008 2009 2010 2011 2012 2013 2014 2015 2016 2017
Exp
en
ditur
e ($ b
illio
n)
Africa
Asia
Australasia
Latin America
Middle East
North America
$67bn
For more information please
contact Douglas-Westwood
22 SUT London ndash February 2011
$0
$100
$200
$300
$400
$500
$600
1995
1996
1997
1998
1999
2000
2001
2002
2003
2004
2005
2006
2007
2008
2009
2010
2011
US
Do
llar
Bil
lio
ns
Outside North America
Canada
United States
bull Recovery in 2010 up 10 to $442 bn
bull Continued growth in 2011 to $490 bn up 11 a new peak
bull US spend up 8 Canada up 5 international up 12
bull Spend up $48 bn in 2011 of which 82 is international
Recovery and growth in global EampP spend
Source Jim Crandell Barclaylsquos EampP Spending Survey December 2010
Global EampP Spend
+10 -15 +11
23 SUT London ndash February 2011
0
10
20
30
40
50
60
70
80
90
100
$70 $75 $80 $85 $90 $95 $100
Cu
mu
lati
ve P
erc
en
t o
f R
esp
on
de
nts
0
10
20
30
40
50
60
70
80
90
100
$35 $40 $45 $50 $55 $60 $65 $70 $75
Cu
mu
lati
ve P
erc
en
t o
f R
esp
on
de
nts
bull EampP companies prepared budgets assuming $77 oil on average
up from $70 last year
bull Expect capex to materially decrease in the industry if oil prices fall
much below $60
bull Expect capex to increase materially if oil prices sustain above $90
up from $85 last year
Source Barclays Capital EampP Spending Survey Dec2010
Oil Price Threshold for Reducing Capex Oil Price Threshold for Increasing Capex
Source Barclays Capital EampP Spending Survey Dec2010
Percent of Respondents Decreasing Capex at a Given Oil Price
Percent of Respondents Increasing Capex at a Given Oil Price
2011 ndash EampP Spend Sensitivity to Oil Prices
24 SUT London ndash February 2011
Offshore Oil amp Gas
Nowhere else left for big finds
Strong Capex growth
Importance of deepwater
The beauty of Opex
25 SUT London ndash February 2011
Global offshore oil amp gas production amp spend to grow
Source Datamonitor
bull Global Capex fell in lsquo0910 but Opex grew
bull Both Capex amp Opex to grow strongly in the years ahead
bull 28 new rigs ordered since October + 8 options 10-15 more in 2011
bull Deepwater Capex to exceed $205 billion
0
20
40
60
80
100
120
140
160
180
200
2006 2007 2008 2009 2010 2011 2012 2013 2014 2015
Ex
pe
nd
itu
re ($
bill
ion
s)
AfricaAsiaAustralasiaEastern Europe and FSULatin AmericaMiddle EastNorth AmericaWestern Europe For more information please
contact Douglas-Westwood
26 SUT London ndash February 2011
OPTIONS
ORDERS
The next rig cycle begins
27 SUT London ndash February 2011
Deepwater Capex to reach new highs
bull Deepwater production to double
bull Drilling $72bn (35) Subsea processing emerging ($26 bn)
Source ldquoThe World Deepwater Market Report 2011-2015rdquo
Douglas-Westwood
0
10
20
30
40
50
60
70
2006 2007 2008 2009 2010 2011 2012 2013 2014 2015
Exp
en
ditur
e ($ b
illio
ns)
DrillingFloating PlatformsPipelinesSubsea ProductionSubsea ProcessingSURF
For more information please
contact Douglas-Westwood
28 SUT London ndash February 2011
Deepwater ndash Africa amp Brazil to lead spend
bull Brazil amp W Africa to total $126bn (62)
bull But much more Brazil spend to come
Source ldquoThe World Deepwater Market Report 2011-2015rdquo
Douglas-Westwood
0
10
20
30
40
50
60
70
2006 2007 2008 2009 2010 2011 2012 2013 2014 2015
Exp
en
ditur
e ($ b
illio
ns)
AfricaAsiaAustralasiaEastern Europe and FSULatin AmericaMiddle EastNorth AmericaWestern Europe
For more information please
contact Douglas-Westwood
29 SUT London ndash February 2011
Brazil ndash Petrobrasrsquos pre-salt deepwater lsquoshopping listrsquo
50 bn boe reserves 2 million production bpd by 2020
By 2018
bull Includes 58 new drilling rigs
By 2020
bull 72 VLCCs
bull 146 supply amp service vessels
bull 45 production platforms
bull Plus subsea hardware
Finance
bull 2010 $70bn stock offering
bull 2011 $6bn corporate bond
bull Next 4 years $30-40bn debt raising
bull Capex of $224bn by 2014
bull Capex amp Opex to total $1 trillion
Tupi Discovery Source CGG Veritas
30 SUT London ndash February 2011
Floating production recovery expected
Global Floating Production Expenditure Source Douglas-Westwood
bull Material decrease in orders in 2009 but market bottomed in 2010
bull Increasing share of market to leased FPSOs Consolidation likely
bull Deepwater Horizon unlikely to impact GoM small part of the market
bull Long term gt200 prospects exist and growth will return
bull Market to reach $16 billion in 2014
0
2
4
6
8
10
12
14
16
18
2006 2007 2008 2009 2010 2011 2012 2013 2014 2015
Exp
en
ditur
e ($ b
illio
ns)
AfricaAsiaAustralasiaEE amp FSULatin AmericaMiddle EastNorth AmericaWestern Europe
For more information please
contact Douglas-Westwood
31 SUT London ndash February 2011
Subsea
Hardware
Operational Demands
Inspection Maintenance Repair
Well intervention
ROV AUV and Subsea Vessels
Operations Market
32 SUT London ndash February 2011
Subsea technology is vital to offshore production
bull Unlocking deepwater reserves
bull Improving economics of marginal fields in shallow waters
bull Tie-backs of small reservoirs into existing facilities
Subsea ndash long term outlook is sound
0
5
10
15
20
25
30
35
40
45
50
0
10
20
30
40
50
60
70
80
2001 2004 2007 2010 2013 2016 2019 2022 2025
Mill
ion B
oep
d
Topside ProductionSubsea Production Subsea Production
Offshore Production 2000-2025 Source Datamonitor
For more information please
contact Douglas-Westwood
33 SUT London ndash February 2011
$0
$5
$10
$15
$20
$25
$30
$35
$40
2006 2007 2008 2009 2010 2011 2012 2013 2014 2015
Exp
en
ditur
e $
bn
Africa AsiaAustralasia Eastern Europe amp FSULatin America Middle EastNorth America NorwayRoWE UK
bull $135 billion forecast for next five years
bull Pipelines to account for half of forecast expenditure
bull Major pipeline projects in Eastern Europe amp FSU Asia and the Middle
East
bull Subsea production hardware SURF and subsea processing driven by
deepwater regions
Source FMC Technologies
Subsea Hardware
For more information please
contact Douglas-Westwood
34 SUT London ndash February 2011
0
10
20
30
40
50
60
70
80
Mill
ion B
oepd
Incremental ProductionLost through DeclineProduction Base
Global Offshore Production 2010-2015 Source Datamonitor
bull 462 million boepd in 2010
bull Average global decline rates of 51 (115 in North Sea)
bull Substantial investment in operational expenditure to be required
Operational demands intensifying
For more information please
contact Douglas-Westwood
35 SUT London ndash February 2011
Offshore ops amp maint spend to see good growth
Source ldquoThe World Offshore Operations amp Maintenance Market Report 2010-14rdquo
Douglas-Westwood
$0
$10
$20
$30
$40
$50
$60
$70
$80
2005 2006 2007 2008 2009 2010 2011 2012 2013 2014
$bill
ions
AfricaAsia-PacificEastern Europe amp FSULatin AmericaMiddle EastNorth AmericaNorwayUKRest of Europe
bull gt7000 fixed amp gt200 floating platforms
bull Plus demand for major modifications
Fo
r more
info
rmatio
n p
lease
conta
ct D
ougla
s-W
estw
ood
36 SUT London ndash February 2011
Subsea IRM Expenditure 2004-2015 Source Douglas-Westwood
bull Over 7000 production platforms 190000km of pipeline currently installed
bull $28 billion of expenditure in Subsea IRM in 2010
bull Nearly $20 billion of further investment expected over the next five years
bull 55 forecast expenditure expected in the North Sea amp Gulf of Mexico
bull Less exposure to market cyclicality
00
10
20
30
40
50
60
2005 2006 2007 2008 2009 2010 2011 2012 2013 2014 2015
$m
illio
ns
Others
Western Europe
North America
Latin America
Asia-Pacific
Africa
Subsea Inspection Repair amp Maintenance
For m
ore
info
rmatio
n p
lease
conta
ct D
ougla
s-W
estw
ood
37 SUT London ndash February 2011
Subsea Well Intervention Expenditure 2004-2015 Source Douglas-Westwood
bull Demand driven by production decline of existing wells Nearly 4000 active
bull Market has been historically been constrained by technology amp economics
bull Deepwater intervention to become increasingly significant to global demand
00
05
10
15
20
25
2005 2006 2007 2008 2009 2010 2011 2012 2013 2014 2015
$bill
ions
Others
Western Europe
North America
Latin America
Asia-Pacific
Africa
Subsea Well Intervention
For more information please
contact Douglas-Westwood
38 SUT London ndash February 2011
320
370
420
470
520
570
620
$00
$05
$10
$15
$20
$25
$30
$35
2005 2006 2007 2008 2009 2010 2011 2012 2013 2014
Ac
tiv
e R
OV
s
Ex
pe
nd
itu
re ($
billio
ns
)
Africa
Asia Pacific
E EuropeFSU
Latin America
Middle East
North America
Western Europe
Active ROVs
The World Work Class ROV Operations Market 2005-2014
(Oil amp Gas) Source ―The World ROV Report 2010-2014 ndash Douglas-Westwood
ROV Paces the Growth of Deepwater
For m
ore
info
rmatio
n p
lease
conta
ct D
ougla
s-W
estw
ood
39 SUT London ndash February 2011
bull Self-guided under water survey and inspection vessels
bull From 1 to 5 meters long
bull Priced from $150000 to $7 million
bull Very hot topic recentlymdashmilitary contractors looking for commercial
applications
bull Greater acceptance for not only deep but shallow water oil and gas
survey
bull But a small market
Hugin 1000 MR AUV Courtesy Kongsberg Marine
AUV ndash Autonomous Underwater Vehicles
40 SUT London ndash February 2011
Subsea Vessel Operations Market
Subsea Operation Vessel Demand by Workscope Source Douglas-Westwood
bull Current IRM market demand for around 92 vessels
bull Field development market still depressed ndash upturn in 2012 amp beyond
bull Well intervention and PampA to see substantial growth
-
50
100
150
200
250
300
2005 2006 2007 2008 2009 2010 2011 2012 2013 2014 2015
V
essels
Intervention amp PampA
Field Development
Inspection Repair amp Maintenance
For m
ore
info
rmatio
n p
lease
conta
ct D
ougla
s-W
estw
ood
41 SUT London ndash February 2011
Macondo ndash a $40 billion tragedy
bull 11 dead
bull Environmental amp PR disaster
bull Blamed on ldquoa failure of
managementrdquo
bull ldquoThe costs of getting it wrong
have gone up a lotrdquo Ceres
bull Will liabilities of deepwater
mean that only the majors can
participate in US
bull Regulatory change bringing
US standards in line with best
practise
bull But US dependence on
deepwater is clear
bull Little long-term impact
elsewhere
US Gulf of Mexico Oil Production ( 2010 view)
0
200
400
600
800
1000
1200
1400
1600
1800
2000
1993 1995 1997 1999 2001 2003 2005 2007 2009F 2011F 2013F 2015F
Barr
els
per
day (
000s)
Additional Deepwater Potential
Deepwater Oil
Shallow Water Oil
Deepwater
42 SUT London ndash February 2011
The next last offshore frontier
43 SUT London ndash February 2011
The Arctic
Credit Hugo Ahlenius UNEPGRID-Arendal
bull Over 400 fields discovered with
approx 240 bn Bboe
bull Further 412 bn Boe yet
undiscovered (USGS) technically
recoverable resources
bull Approx 84 offshore
bull 90 billion barrels (13) of the
worlds undiscovered oil reserves
and 30 of the gas resources
according to USGS
bull But USGS recently reduced
Alaska oil resources by 90
44 SUT London ndash February 2011
Some arctic projects
Norway - Goliat bull Predominantly oil
bull Extended shutdown now back on line
Cairn bull Two drilling rigs off coast of Greenland
bull Modestly promising results to date
Hebron ndash ExxonMobil bull East Canada
bull Fourth Newfoundland field
bull 400 ndash 700 m barrels 92 meters
bull First oil 2017
Shell bull Chukchi and Beaufort seas
bull Permits pulled
bull One year delay
bull Macondo will cast a long shadow
Goliat Source Eni Norge
Sevan 1000 Source Sevan
45 SUT London ndash February 2011
Lifecycle Opportunities
The easy oil goes first
NOCs need to internationalise
And local OFS companies
46 SUT London ndash February 2011
Hyd
roca
rbo
n P
rod
uctio
n
Australia
UK
China
Norway
Thailand
Malaysia
USA
46
Points on the OampG life cycle
bull Australia ndash to see good EampP (gas) growth over the next decade
bull China ndash still growing (mainly from offshore)
bull Malaysia ndash near peak Marginals amp EOR focus High CO2 gas OFS
bull Norway ndash drive to internationalisation of OFS industry
bull UK ndash terminal production decline Decommissioning
Growth Peak and plateau EampP
begins Conventional production decline
Each phase offers a different business opportunity
47 SUT London ndash February 2011
The significance of the national oil company
bull NOCs can be tasked with building a local supply chain
bull and building a knowledge base
bull Examples include
bull Petrobras ndash massive drive to build Brazilian OFS industry
bull Statoil ndash major RampD focus aids Norwegian companies
bull Petronas ndash a heavy focus on local needs
bull But ultimately local OampG production declines
bull Then NOCs need to access other countrieslsquo reserves
bull local OFS companies have to gain business in world markets
bull Then need to upscale and gain external investment
48 SUT London ndash February 2011
Conclusions
49 SUT London ndash February 2011
Conclusions
bull Global economic growth has resumed
bull Oil supply outlook remains restrained
bull Will OPEC answer the call for its nominal spare capacity
bull Oil prices are high but few visible drivers to push them down
bull OFS pricing competition should remain pronounced in 2011
bull Spare capacity in offshore sector rigs equipment services
bull High oil prices and restrained cost pressures should encourage
operators to bring projects forward ndash activity levels should pick up
bull Market players appear to be anticipating the next cycle
bull A good future for the Subsea IRM sector
50 SUT London ndash February 2011
Thank you
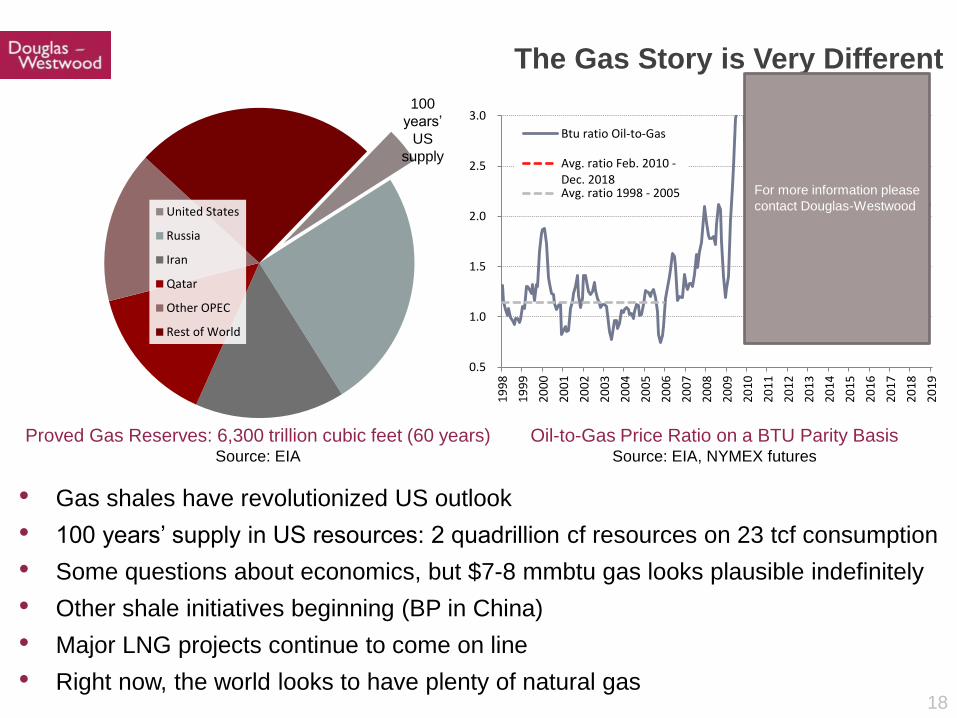
18
United States
Russia
Iran
Qatar
Other OPEC
Rest of World
100
yearslsquo
US
supply
05
10
15
20
25
30
19
98
19
99
20
00
20
01
20
02
20
03
20
04
20
05
20
06
20
07
20
08
20
09
20
10
20
11
20
12
20
13
20
14
20
15
20
16
20
17
20
18
20
19
Btu ratio Oil-to-Gas
Avg ratio Feb 2010 -Dec 2018Avg ratio 1998 - 2005
Oil-to-Gas Price Ratio on a BTU Parity Basis Source EIA NYMEX futures
Proved Gas Reserves 6300 trillion cubic feet (60 years) Source EIA
bull Gas shales have revolutionized US outlook
bull 100 yearslsquo supply in US resources 2 quadrillion cf resources on 23 tcf consumption
bull Some questions about economics but $7-8 mmbtu gas looks plausible indefinitely
bull Other shale initiatives beginning (BP in China)
bull Major LNG projects continue to come on line
bull Right now the world looks to have plenty of natural gas
The Gas Story is Very Different
For more information please
contact Douglas-Westwood
19 SUT London ndash February 2011
bull Dominated by E Europe amp FSU but others to see significant growth
bull Deepwater gas and LNG to be of growing importance
bull Impact of shale gas on North America (amp other markets)
bull But local supply issues eg Europe to import gt73 by 2020
Natural gas production and use to soar
Source Energyfiles
0
10
20
30
40
50
60
70
80
90
100
1930 1937 1944 1951 1958 1965 1972 1979 1986 1993 2000 2007 2014 2021
million b
arr
els
of o
il eq
uiv
ale
nt p
er d
ay
Africa
Asia
Australasia
Eastern Europe amp FSU
Latin America
Middle East
North America
Western Europe
ME
FSU
NA
For m
ore
info
rmatio
n p
lease
conta
ct D
ougla
s-W
estw
ood
20 SUT London ndash February 2011
10
2428
31
3941
47 48
5356
60
0
1
2
3
4
5
6
Capex ($ m
llion m
W)
Source EIA Nov 2010
Gas ndash lowest Capex for power plants
21 SUT London ndash February 2011
Gas ndash FLNG in prospect
bull Liquefaction ndash $20 bn spend by 2017
bull Australasia to account for 60
bull Woodside has raised the prospect of FLNG for its Greater Sunrise project
bull Inpex (Japan) considering FLNG at its $196 billion Abadi field in Indonesia
bull GDF Suez and Australias Santos set up a joint venture to develop a floating
LNG project off northwest Australia
Picture Shell
Source The World FLNG Report Douglas-Westwood
0
1
2
3
4
5
6
7
8
2006 2007 2008 2009 2010 2011 2012 2013 2014 2015 2016 2017
Exp
en
ditur
e ($ b
illio
n)
Africa
Asia
Australasia
Latin America
Middle East
North America
0
1
2
3
4
5
6
7
8
2006 2007 2008 2009 2010 2011 2012 2013 2014 2015 2016 2017
Exp
en
ditur
e ($ b
illio
n)
Africa
Asia
Australasia
Latin America
Middle East
North America
$67bn
For more information please
contact Douglas-Westwood
22 SUT London ndash February 2011
$0
$100
$200
$300
$400
$500
$600
1995
1996
1997
1998
1999
2000
2001
2002
2003
2004
2005
2006
2007
2008
2009
2010
2011
US
Do
llar
Bil
lio
ns
Outside North America
Canada
United States
bull Recovery in 2010 up 10 to $442 bn
bull Continued growth in 2011 to $490 bn up 11 a new peak
bull US spend up 8 Canada up 5 international up 12
bull Spend up $48 bn in 2011 of which 82 is international
Recovery and growth in global EampP spend
Source Jim Crandell Barclaylsquos EampP Spending Survey December 2010
Global EampP Spend
+10 -15 +11
23 SUT London ndash February 2011
0
10
20
30
40
50
60
70
80
90
100
$70 $75 $80 $85 $90 $95 $100
Cu
mu
lati
ve P
erc
en
t o
f R
esp
on
de
nts
0
10
20
30
40
50
60
70
80
90
100
$35 $40 $45 $50 $55 $60 $65 $70 $75
Cu
mu
lati
ve P
erc
en
t o
f R
esp
on
de
nts
bull EampP companies prepared budgets assuming $77 oil on average
up from $70 last year
bull Expect capex to materially decrease in the industry if oil prices fall
much below $60
bull Expect capex to increase materially if oil prices sustain above $90
up from $85 last year
Source Barclays Capital EampP Spending Survey Dec2010
Oil Price Threshold for Reducing Capex Oil Price Threshold for Increasing Capex
Source Barclays Capital EampP Spending Survey Dec2010
Percent of Respondents Decreasing Capex at a Given Oil Price
Percent of Respondents Increasing Capex at a Given Oil Price
2011 ndash EampP Spend Sensitivity to Oil Prices
24 SUT London ndash February 2011
Offshore Oil amp Gas
Nowhere else left for big finds
Strong Capex growth
Importance of deepwater
The beauty of Opex
25 SUT London ndash February 2011
Global offshore oil amp gas production amp spend to grow
Source Datamonitor
bull Global Capex fell in lsquo0910 but Opex grew
bull Both Capex amp Opex to grow strongly in the years ahead
bull 28 new rigs ordered since October + 8 options 10-15 more in 2011
bull Deepwater Capex to exceed $205 billion
0
20
40
60
80
100
120
140
160
180
200
2006 2007 2008 2009 2010 2011 2012 2013 2014 2015
Ex
pe
nd
itu
re ($
bill
ion
s)
AfricaAsiaAustralasiaEastern Europe and FSULatin AmericaMiddle EastNorth AmericaWestern Europe For more information please
contact Douglas-Westwood
26 SUT London ndash February 2011
OPTIONS
ORDERS
The next rig cycle begins
27 SUT London ndash February 2011
Deepwater Capex to reach new highs
bull Deepwater production to double
bull Drilling $72bn (35) Subsea processing emerging ($26 bn)
Source ldquoThe World Deepwater Market Report 2011-2015rdquo
Douglas-Westwood
0
10
20
30
40
50
60
70
2006 2007 2008 2009 2010 2011 2012 2013 2014 2015
Exp
en
ditur
e ($ b
illio
ns)
DrillingFloating PlatformsPipelinesSubsea ProductionSubsea ProcessingSURF
For more information please
contact Douglas-Westwood
28 SUT London ndash February 2011
Deepwater ndash Africa amp Brazil to lead spend
bull Brazil amp W Africa to total $126bn (62)
bull But much more Brazil spend to come
Source ldquoThe World Deepwater Market Report 2011-2015rdquo
Douglas-Westwood
0
10
20
30
40
50
60
70
2006 2007 2008 2009 2010 2011 2012 2013 2014 2015
Exp
en
ditur
e ($ b
illio
ns)
AfricaAsiaAustralasiaEastern Europe and FSULatin AmericaMiddle EastNorth AmericaWestern Europe
For more information please
contact Douglas-Westwood
29 SUT London ndash February 2011
Brazil ndash Petrobrasrsquos pre-salt deepwater lsquoshopping listrsquo
50 bn boe reserves 2 million production bpd by 2020
By 2018
bull Includes 58 new drilling rigs
By 2020
bull 72 VLCCs
bull 146 supply amp service vessels
bull 45 production platforms
bull Plus subsea hardware
Finance
bull 2010 $70bn stock offering
bull 2011 $6bn corporate bond
bull Next 4 years $30-40bn debt raising
bull Capex of $224bn by 2014
bull Capex amp Opex to total $1 trillion
Tupi Discovery Source CGG Veritas
30 SUT London ndash February 2011
Floating production recovery expected
Global Floating Production Expenditure Source Douglas-Westwood
bull Material decrease in orders in 2009 but market bottomed in 2010
bull Increasing share of market to leased FPSOs Consolidation likely
bull Deepwater Horizon unlikely to impact GoM small part of the market
bull Long term gt200 prospects exist and growth will return
bull Market to reach $16 billion in 2014
0
2
4
6
8
10
12
14
16
18
2006 2007 2008 2009 2010 2011 2012 2013 2014 2015
Exp
en
ditur
e ($ b
illio
ns)
AfricaAsiaAustralasiaEE amp FSULatin AmericaMiddle EastNorth AmericaWestern Europe
For more information please
contact Douglas-Westwood
31 SUT London ndash February 2011
Subsea
Hardware
Operational Demands
Inspection Maintenance Repair
Well intervention
ROV AUV and Subsea Vessels
Operations Market
32 SUT London ndash February 2011
Subsea technology is vital to offshore production
bull Unlocking deepwater reserves
bull Improving economics of marginal fields in shallow waters
bull Tie-backs of small reservoirs into existing facilities
Subsea ndash long term outlook is sound
0
5
10
15
20
25
30
35
40
45
50
0
10
20
30
40
50
60
70
80
2001 2004 2007 2010 2013 2016 2019 2022 2025
Mill
ion B
oep
d
Topside ProductionSubsea Production Subsea Production
Offshore Production 2000-2025 Source Datamonitor
For more information please
contact Douglas-Westwood
33 SUT London ndash February 2011
$0
$5
$10
$15
$20
$25
$30
$35
$40
2006 2007 2008 2009 2010 2011 2012 2013 2014 2015
Exp
en
ditur
e $
bn
Africa AsiaAustralasia Eastern Europe amp FSULatin America Middle EastNorth America NorwayRoWE UK
bull $135 billion forecast for next five years
bull Pipelines to account for half of forecast expenditure
bull Major pipeline projects in Eastern Europe amp FSU Asia and the Middle
East
bull Subsea production hardware SURF and subsea processing driven by
deepwater regions
Source FMC Technologies
Subsea Hardware
For more information please
contact Douglas-Westwood
34 SUT London ndash February 2011
0
10
20
30
40
50
60
70
80
Mill
ion B
oepd
Incremental ProductionLost through DeclineProduction Base
Global Offshore Production 2010-2015 Source Datamonitor
bull 462 million boepd in 2010
bull Average global decline rates of 51 (115 in North Sea)
bull Substantial investment in operational expenditure to be required
Operational demands intensifying
For more information please
contact Douglas-Westwood
35 SUT London ndash February 2011
Offshore ops amp maint spend to see good growth
Source ldquoThe World Offshore Operations amp Maintenance Market Report 2010-14rdquo
Douglas-Westwood
$0
$10
$20
$30
$40
$50
$60
$70
$80
2005 2006 2007 2008 2009 2010 2011 2012 2013 2014
$bill
ions
AfricaAsia-PacificEastern Europe amp FSULatin AmericaMiddle EastNorth AmericaNorwayUKRest of Europe
bull gt7000 fixed amp gt200 floating platforms
bull Plus demand for major modifications
Fo
r more
info
rmatio
n p
lease
conta
ct D
ougla
s-W
estw
ood
36 SUT London ndash February 2011
Subsea IRM Expenditure 2004-2015 Source Douglas-Westwood
bull Over 7000 production platforms 190000km of pipeline currently installed
bull $28 billion of expenditure in Subsea IRM in 2010
bull Nearly $20 billion of further investment expected over the next five years
bull 55 forecast expenditure expected in the North Sea amp Gulf of Mexico
bull Less exposure to market cyclicality
00
10
20
30
40
50
60
2005 2006 2007 2008 2009 2010 2011 2012 2013 2014 2015
$m
illio
ns
Others
Western Europe
North America
Latin America
Asia-Pacific
Africa
Subsea Inspection Repair amp Maintenance
For m
ore
info
rmatio
n p
lease
conta
ct D
ougla
s-W
estw
ood
37 SUT London ndash February 2011
Subsea Well Intervention Expenditure 2004-2015 Source Douglas-Westwood
bull Demand driven by production decline of existing wells Nearly 4000 active
bull Market has been historically been constrained by technology amp economics
bull Deepwater intervention to become increasingly significant to global demand
00
05
10
15
20
25
2005 2006 2007 2008 2009 2010 2011 2012 2013 2014 2015
$bill
ions
Others
Western Europe
North America
Latin America
Asia-Pacific
Africa
Subsea Well Intervention
For more information please
contact Douglas-Westwood
38 SUT London ndash February 2011
320
370
420
470
520
570
620
$00
$05
$10
$15
$20
$25
$30
$35
2005 2006 2007 2008 2009 2010 2011 2012 2013 2014
Ac
tiv
e R
OV
s
Ex
pe
nd
itu
re ($
billio
ns
)
Africa
Asia Pacific
E EuropeFSU
Latin America
Middle East
North America
Western Europe
Active ROVs
The World Work Class ROV Operations Market 2005-2014
(Oil amp Gas) Source ―The World ROV Report 2010-2014 ndash Douglas-Westwood
ROV Paces the Growth of Deepwater
For m
ore
info
rmatio
n p
lease
conta
ct D
ougla
s-W
estw
ood
39 SUT London ndash February 2011
bull Self-guided under water survey and inspection vessels
bull From 1 to 5 meters long
bull Priced from $150000 to $7 million
bull Very hot topic recentlymdashmilitary contractors looking for commercial
applications
bull Greater acceptance for not only deep but shallow water oil and gas
survey
bull But a small market
Hugin 1000 MR AUV Courtesy Kongsberg Marine
AUV ndash Autonomous Underwater Vehicles
40 SUT London ndash February 2011
Subsea Vessel Operations Market
Subsea Operation Vessel Demand by Workscope Source Douglas-Westwood
bull Current IRM market demand for around 92 vessels
bull Field development market still depressed ndash upturn in 2012 amp beyond
bull Well intervention and PampA to see substantial growth
-
50
100
150
200
250
300
2005 2006 2007 2008 2009 2010 2011 2012 2013 2014 2015
V
essels
Intervention amp PampA
Field Development
Inspection Repair amp Maintenance
For m
ore
info
rmatio
n p
lease
conta
ct D
ougla
s-W
estw
ood
41 SUT London ndash February 2011
Macondo ndash a $40 billion tragedy
bull 11 dead
bull Environmental amp PR disaster
bull Blamed on ldquoa failure of
managementrdquo
bull ldquoThe costs of getting it wrong
have gone up a lotrdquo Ceres
bull Will liabilities of deepwater
mean that only the majors can
participate in US
bull Regulatory change bringing
US standards in line with best
practise
bull But US dependence on
deepwater is clear
bull Little long-term impact
elsewhere
US Gulf of Mexico Oil Production ( 2010 view)
0
200
400
600
800
1000
1200
1400
1600
1800
2000
1993 1995 1997 1999 2001 2003 2005 2007 2009F 2011F 2013F 2015F
Barr
els
per
day (
000s)
Additional Deepwater Potential
Deepwater Oil
Shallow Water Oil
Deepwater
42 SUT London ndash February 2011
The next last offshore frontier
43 SUT London ndash February 2011
The Arctic
Credit Hugo Ahlenius UNEPGRID-Arendal
bull Over 400 fields discovered with
approx 240 bn Bboe
bull Further 412 bn Boe yet
undiscovered (USGS) technically
recoverable resources
bull Approx 84 offshore
bull 90 billion barrels (13) of the
worlds undiscovered oil reserves
and 30 of the gas resources
according to USGS
bull But USGS recently reduced
Alaska oil resources by 90
44 SUT London ndash February 2011
Some arctic projects
Norway - Goliat bull Predominantly oil
bull Extended shutdown now back on line
Cairn bull Two drilling rigs off coast of Greenland
bull Modestly promising results to date
Hebron ndash ExxonMobil bull East Canada
bull Fourth Newfoundland field
bull 400 ndash 700 m barrels 92 meters
bull First oil 2017
Shell bull Chukchi and Beaufort seas
bull Permits pulled
bull One year delay
bull Macondo will cast a long shadow
Goliat Source Eni Norge
Sevan 1000 Source Sevan
45 SUT London ndash February 2011
Lifecycle Opportunities
The easy oil goes first
NOCs need to internationalise
And local OFS companies
46 SUT London ndash February 2011
Hyd
roca
rbo
n P
rod
uctio
n
Australia
UK
China
Norway
Thailand
Malaysia
USA
46
Points on the OampG life cycle
bull Australia ndash to see good EampP (gas) growth over the next decade
bull China ndash still growing (mainly from offshore)
bull Malaysia ndash near peak Marginals amp EOR focus High CO2 gas OFS
bull Norway ndash drive to internationalisation of OFS industry
bull UK ndash terminal production decline Decommissioning
Growth Peak and plateau EampP
begins Conventional production decline
Each phase offers a different business opportunity
47 SUT London ndash February 2011
The significance of the national oil company
bull NOCs can be tasked with building a local supply chain
bull and building a knowledge base
bull Examples include
bull Petrobras ndash massive drive to build Brazilian OFS industry
bull Statoil ndash major RampD focus aids Norwegian companies
bull Petronas ndash a heavy focus on local needs
bull But ultimately local OampG production declines
bull Then NOCs need to access other countrieslsquo reserves
bull local OFS companies have to gain business in world markets
bull Then need to upscale and gain external investment
48 SUT London ndash February 2011
Conclusions
49 SUT London ndash February 2011
Conclusions
bull Global economic growth has resumed
bull Oil supply outlook remains restrained
bull Will OPEC answer the call for its nominal spare capacity
bull Oil prices are high but few visible drivers to push them down
bull OFS pricing competition should remain pronounced in 2011
bull Spare capacity in offshore sector rigs equipment services
bull High oil prices and restrained cost pressures should encourage
operators to bring projects forward ndash activity levels should pick up
bull Market players appear to be anticipating the next cycle
bull A good future for the Subsea IRM sector
50 SUT London ndash February 2011
Thank you
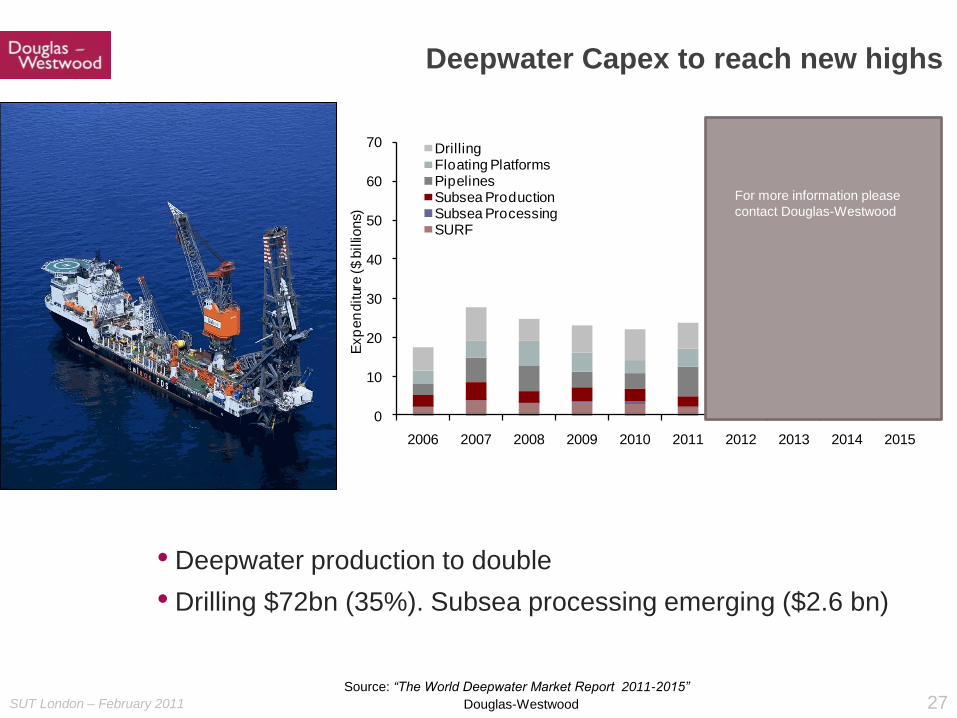
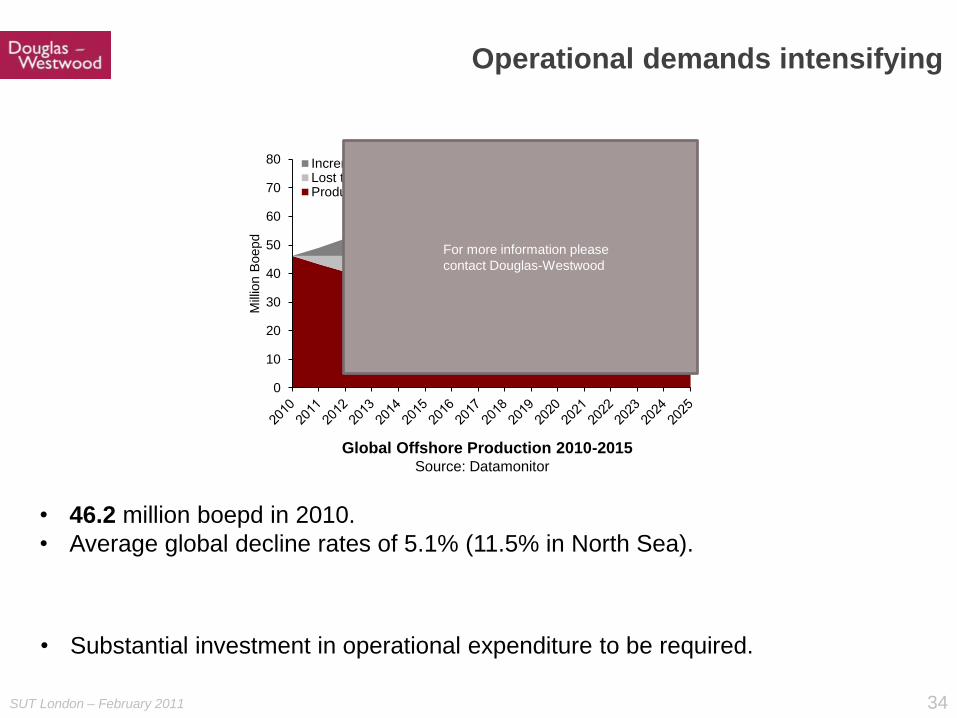
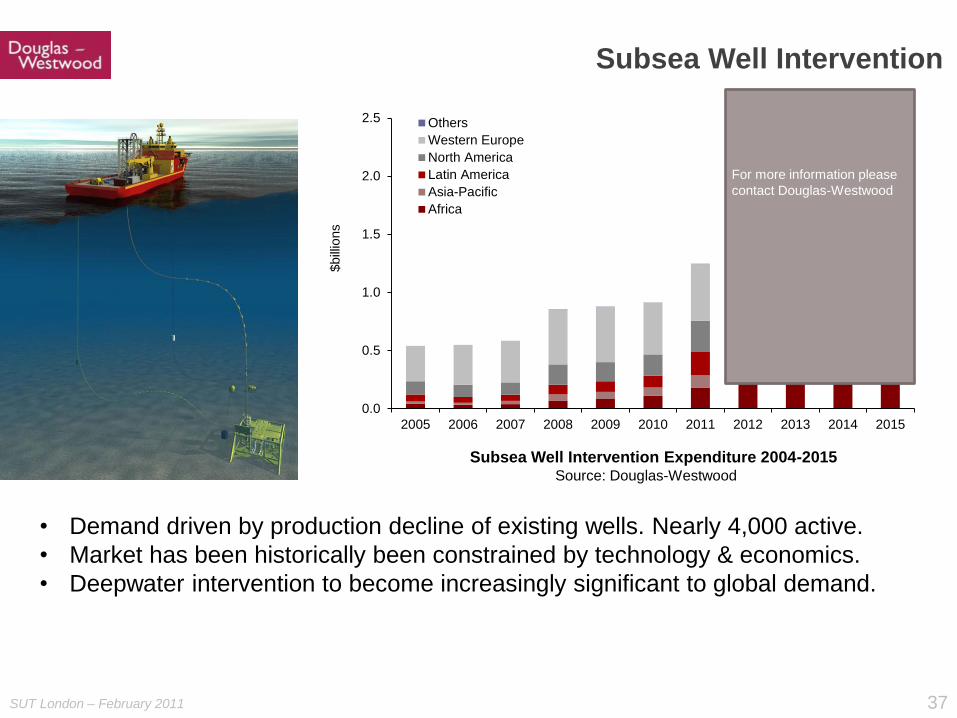
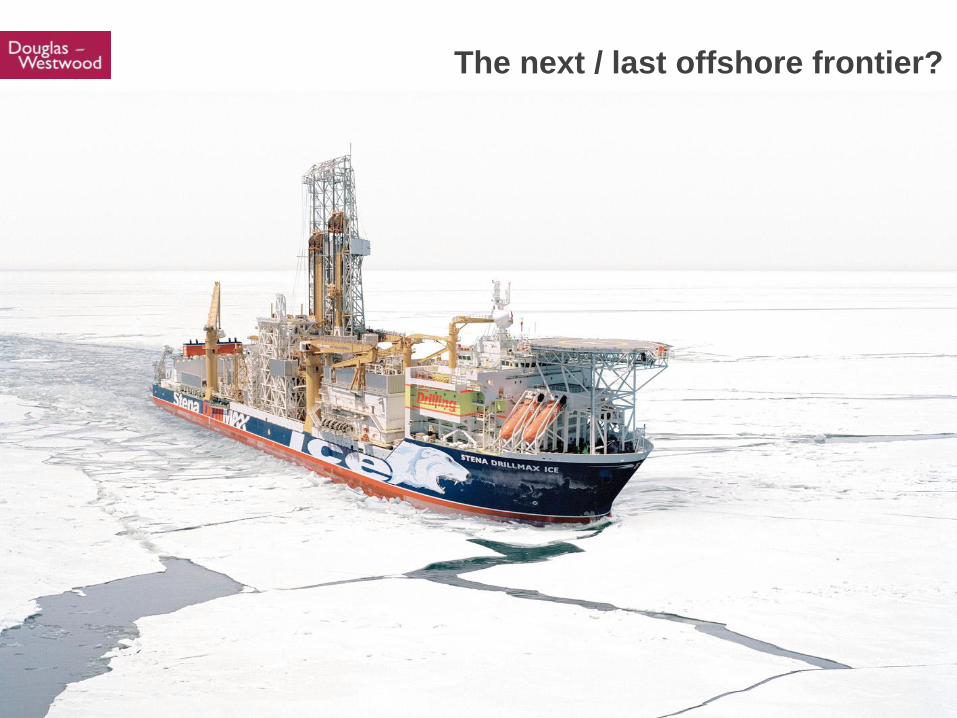
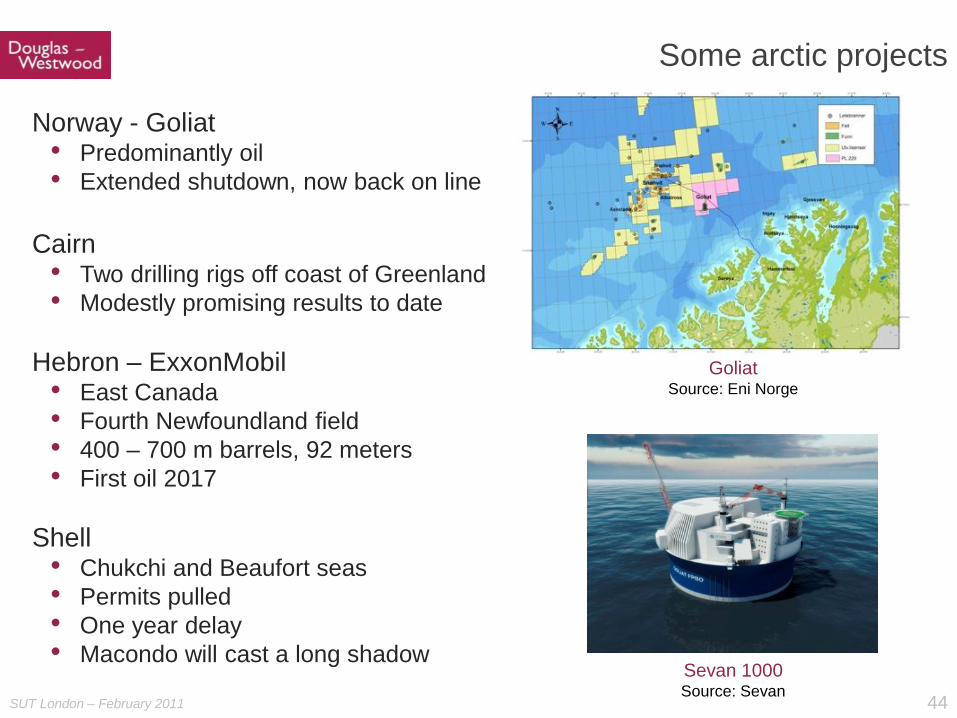
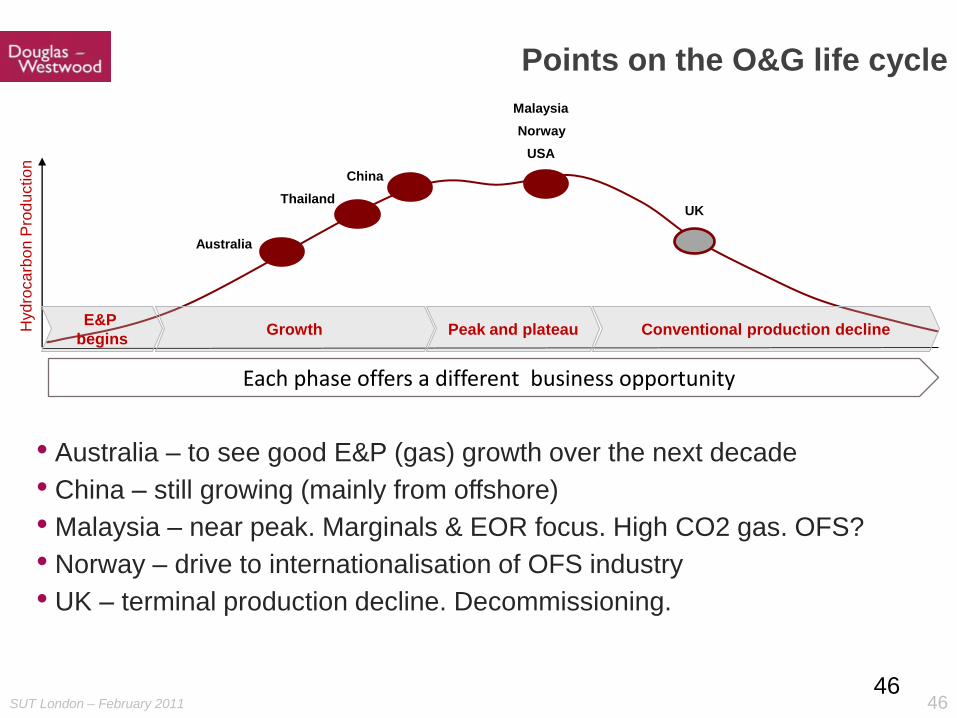

50 SUT London ndash February 2011
Thank you