the global state of democracy indices - idea · contents acknowledgements iii the global state of...
TRANSCRIPT

www.idea.int
The Global State of Democracy Indices
Technical Procedures Guide

© 2017 International Institute for Democracy and Electoral Assistance
International IDEA publications are independent of specific national or political interests. Views expressed in this publication do not necessarily represent the views of International IDEA, its Board or its Council members.
References to the names of countries and regions in this publication do not represent the official position of International IDEA with regard to the legal status or policy of the entities mentioned.
Applications for permission to reproduce or translate all or any part of this publication should be made to:
International IDEAStrömsborgSE–103 34 STOCKHOLMSWEDENTel: +46 8 698 37 00, fax: +46 8 20 24 22Email: [email protected]
International IDEA encourages dissemination of its work and will promptly respond to requests for permission to reproduce or translate its publications.
This publication has received support from International IDEA’s Member States through the Institute’s core funding. Grateful acknowledgement is made to the governments of Sweden and Norway, whose generous support made this publication possible.
Text editing: Andrew MashLayout: International IDEA Original design concept: Phoenix Design AidLayout: KPR Group + Santángelo Diseño

Contents
Acknowledgements III
The Global State of Democracy IndicesTechnical Procedures Guide
Introduction 2Background 2Conceptual structure 3
1. Data source 6
2. Coverage 7Spatial coverage 7Temporal coverage 8Geographical regions 8Regional organizations 9
3. Indicators 10
4. Assessing the unidimensionality of the indices 12Item response theory (IRT) 12Bayesian factor analysis (BFA) 13Formative approach 13
5. Aggregating the indicators into indices 14
6. Scaling 19
7. Confidence intervals 19
8. Valid checks 20
Conclusions 21
References 22
Annexes
Annex ASource data sets 25
Annex BCountries, regions and subregions included in International IDEA's GSoD indices 26
Annex CRegional organizations included in the data set 32
Annex D Attributes, subattributes and indicators 33
Annex EDimensionality tests 46
Annex F Item–item correlations 54
Annex GComparisons with extant measures 61
II

Acknowledgements
We thank everyone who has been involved in this first edition of the Global State of Democracy Indices. This publication has benefited from contributions made by many individuals at International IDEA, and from the expert input of members of the Institute’s partner organizations.
In particular, thanks to Mélida Jiménez, Victoria Perotti, Lina Antara and Joseph Noonan at International IDEA, Svend-Erik Skaaning at Aarhus University and Claudiu Tufis at the University of Bucharest for their contributions to the development of the Global State of Democracy indices, and to the members of the Expert Advisory Board for their advice in the development of the Global State of Democracy indices and related documentation.
Methodology and data set development (Global State of Democracy Indices)Svend-Erik Skaaning, Professor at the Department of Political Science at Aarhus
University, Co-Principal Investigator of the Varieties of Democracy (V-Dem) project
Claudiu Tufis, Associate Professor, University of Bucharest, Political Science Department
Expert Advisory Board (Global State of Democracy Indices)Michael Bernhard, Raymond and Miriam Ehrlich Chair, Professor at the Department
of Political Science at the University of Florida
Michael Coppedge, Professor at the Department of Political Science and Faculty Fellow at the Kellogg Institute of International Studies at the University of Notre Dame, Co-Principal Investigator of the Varieties of Democracy (V-Dem) project
Carl-Henrik Knutsen, Professor at the Department of Political Science at the University of Oslo, Co-Principal Investigator of the Historical Varieties of Democracy (V-Dem) project
Staffan Lindberg, Professor at the Department of Political Science at the University of Gothenburg, Director of the Varieties of Democracy (V-Dem) Institute
Gerardo Munck, Professor at the School of International Relations at the University of Southern California
III

1
The Global State of Democracy Indices: Tecchnical Procedures Guide is the second in a series of documents prepared by International IDEA to present the Global State of Democracy (GSoD) indices. It outlines the technical aspects of constructing the indices, and complements The Global State of Democracy Indices Methodology: Conceptualization and Measurement Framework (Skaaning 2017), which presents the theoretical framework that guided the construction of the indices, and The Global State of Democracy Indices Codebook (Tufis 2017), which presents information about the data set, including variables, attributes of democracy, subattributes, subcomponents and indicators.
The Global State of Democracy IndicesTechnical Procedures Guide
The Global State of Democracy (GSoD) indices depict democratic trends at the country, regional and global levels across a broad range of different attributes of democracy in the period 1975–2015 but do not provide a single index of democracy. The indices produce data for 155 countries. The data underlying the indices is based on 98 indicators developed by various scholars and organizations using different types of source, including expert surveys, standards-based coding by research groups and analysts, observational data and composite measures.
The Global State of Democracy 2017: Exploring Democracy’s Resilience (International IDEA 2017) aims to provide policymakers with an evidence-based analysis of the state of global democracy, supported by the GSoD indices, in order to inform policy interventions and identify problem-solving approaches to trends affecting the quality of democracy around the world. It explores the conditions under which democracy can be resilient and how to strengthen its capacity as a system to overcome challenges and threats.
The full publication, as well as the GSoD Indices Database, can be accessed online: <http://www.idea.int/gsod>.
* Claudiu D. Tufis is an Associate Professor in the Political Science Department at the University of Bucharest.
Claudiu D. Tufis*

The Global State of Democracy IndicesTechnical Procedures Guide
International IDEA
2
Introduction This Guide outlines the process of constructing the Global State of Democracy (GSoD) indices, which form part of The Global State of Democracy (International IDEA 2017a). It is written for readers who want a better understanding of the indices, as well as researchers who may wish to use and build on the data contained within them. This Guide builds upon the GSoD Indices Methodology. For a detailed outline of the conceptual and measurement framework see The Global State of Democracy Indices Methodology: Conceptualization and Measurement Framework (Skaaning 2017).
For each component of the construction of the GSoD indices, the Guide provides information about the procedures followed, outlined in a step-by-step description to allow the interested reader to understand the research process. The eight steps can be summarized as follows:
1. Identifying the data sources (see Chapter 1);2. Preparing the data sources for merger (see Chapter 2);3. Preparing the indicators for merger (see Chapter 3);4. Assessing the unidimensionality of the indices (see Chapter 4);5. Aggregating the indicators into indices (see Chapter 5);6. Scaling the indices (see Chapter 6);7. Computing the confidence intervals (see Chapter 7); and8. Conducting validity checks (see Chapter 8).
After a brief description of the theoretical structure that guided this project, the Guide presents the data sources, the coverage of the data set, the indicators used to construct the main attributes of democracy, the procedures used to compute these attributes and the structure of the complete data set.
BackgroundThe main objective of the GSoD indices is to identify systematic data that captures trends at the global, regional and national levels for different aspects of International IDEA’s comprehensive understanding of democracy. The indices turn a broad range of empirical indicators from various data sets into measures of different aspects (attributes, and subattributes; see Figure I.1) of democracy that can be used to evaluate the state of democracy at the global, regional and national levels. The indices can also help stakeholders, such as policymakers, researchers and civil society actors, in their analysis of trends related to different aspects of democracy and to identify priority policy areas. The Global State of Democracy 2017: Exploring Democracy’s Resilience (International IDEA 2017a) is an example of how the GSoD indices can be used to track trends in democratic development.
The GSoD indices, which were constructed for the first time in 2017, cover the 155 independent countries with a population of more than one million that existed in the period 1975–2015. The indices are composite measures based on 98 indicators from different kinds of extant data sources. These indicators are assigned to the different subattributes in the conceptual framework and combined into the GSoD indices using either item-response theory (IRT) modelling, Bayesian factor analysis (BFA) or mathematical operations such as multiplication and averaging. A key feature of the methodology is that it generates uncertainty estimates for each index, which allows users of the data set to assess whether the differences in scores over time and across countries are significant.

The Global State of Democracy IndicesTechnical Procedures Guide
International IDEA
3
The GSoD indices were produced by a team of International IDEA staff and two external experts. The construction of the indices was supervised by an Expert Advisory Board consisting of five leading experts in the field of democracy measurement. To ensure consistency, transparency and high levels of measurement validity and reliability, careful justification and documentation of the conceptual distinctions and methodological choices made, and the use of state-of-the-art procedures were emphasized at all stages of the construction of the indices.
Conceptual structureThe GSoD indices build on an elaborate conceptual framework that is rooted in International IDEA’s State of Democracy (SoD) Assessment Framework (Beetham et al. 2008). The SoD Assessment Framework is defined by two principles (popular control and political equality), seven mediating values (participation, authorization, representation, accountability, transparency, responsiveness and, solidarity), and four pillars (citizens, law and rights; representative and accountable government; civil society and popular participation; and democracy beyond the state). For more details, see the SoD Assessment framework (Beetham et al. 2008) and the GSoD indices methodology (Skaaning 2017).
The democratic principles underpinning the SoD framework—popular control and political equality—are also at the core of the GSoD indices. In order to construct the GSoD indices, however, the SoD conceptual framework was modified to transform it into a systematic, cross-national and cross-temporal quantitative measurement tool (Skaaning 2017).
The GSoD indices aim to capture the extent to which (a) there is effective popular control over public decision-makers, or vertical accountability; (b) citizens have politically relevant freedoms and power resources; (c) executive power is checked effectively by other powers, or horizontal accountability; (d) public authorities are impartial and predictable in implementing the law; and (e) people have and make use of various opportunities for political participation at different levels (Skaaning 2017).
The GSoD data set therefore contains separate, fine-grained indices and subindices related to five attributes of democracy (see Beetham 1999: 154–57; Beetham et al. 2008: 27–28):
1. Representative Government (free and equal access to political power)2. Fundamental Rights (individual liberties and resources)3. Checks on Government (effective control of executive power)4. Impartial Administration (fair and predictable public administration)5. Participatory Engagement (instruments for and realization of political
involvement)

The Global State of Democracy IndicesTechnical Procedures Guide
International IDEA
4
In addition, the GSoD conceptual framework contains, at lower levels of abstraction, 16 subattributes and an additional five subcomponents of civil liberties and three subcomponents of social rights and equality. Figure 1 presents a schematic overview of the GSoD conceptual framework.
Separate GSoD indices are constructed for each attribute and subattribute (see Table I.1). The only exception is the fifth attribute, participatory engagement. This theoretical dimension is conceptually and empirically multidimensional and there are no obvious ways to aggregate its subattributes.
Conceptual framework: The Global State of Democracy
Part
icip
ator
yen
gage
men
tRepresentative
government
government
Checks onadministration
Impartial
Fundamental
rightsCl
ean
elec
tions
Civil society
participation
Electoralparticipation
Directdemocracy
Subnational
elections
Incl
usiv
e
su�r
age
Free
pol
itica
lpa
rtie
s
Elec
ted
gove
rnm
ent
Access
to justic
e
Civil
liberties
Social rightsand equality
E�ectiveparliament
Judicial
independence
Media
integrityAbse
nce
ofco
rrup
tion
Predictable
enforcement
DemocracyPopular control and
political equality
FIGURE 1.

The Global State of Democracy IndicesTechnical Procedures Guide
International IDEA
5
TABLE 1.1.
Attributes, subattributes and general assessment questions of the GSoD conceptual framework
Attribute Subattribute Assessment question
1Representative Government(free and equal access to political power)
1.1. Clean ElectionsTo what extent are elections free from irregularities?
1.2. Inclusive SuffrageTo what extent do all adult citizens have voting rights?
1.3. Free Political PartiesTo what extent are political parties free to form and campaign for office?
1.4. Elected GovernmentTo what extent is access to government determined by elections?
2Fundamental Rights(individual liberties and resources)
2.1. Access to JusticeTo what extent is there equal, fair access to justice?
2.2. Civil LibertiesTo what extent are civil liberties respected?
2.3. Social Rights and EqualityTo what extent are there basic welfare, and social and political equality?
3Checks on Government(effective control of executive power)
3.1. Effective Parliament To what extent does parliament oversee the executive?
3.2. Judicial IndependenceTo what extent are the courts independent?
3.3. Media IntegrityTo what extent are there diverse, critical media sources?
4Impartial Administration (fair and predictable public administration)
4.1. Absence of CorruptionTo what extent is the exercise of public authority free from corruption?
4.2. Predictable EnforcementTo what extent is the enforcement of public authority predictable?
5Participatory Engagement(instruments of and for the realization of political involvement)
5.1. Civil Society ParticipationTo what extent do people participate in civil society organizations?
5.2. Electoral ParticipationTo what extent do people participate in national elections?
5.3. Direct DemocracyTo what extent are mechanisms of direct democracy available and used?
5.4. Subnational ElectionsTo what extent are there free regional and local elections?
Source: The Global State of Democracy Indices Methodology: Conceptualization and Measurement Framework (Skaaning 2017)
The Global State of Democracy IndicesTechnical Procedures Guide
International IDEA
6
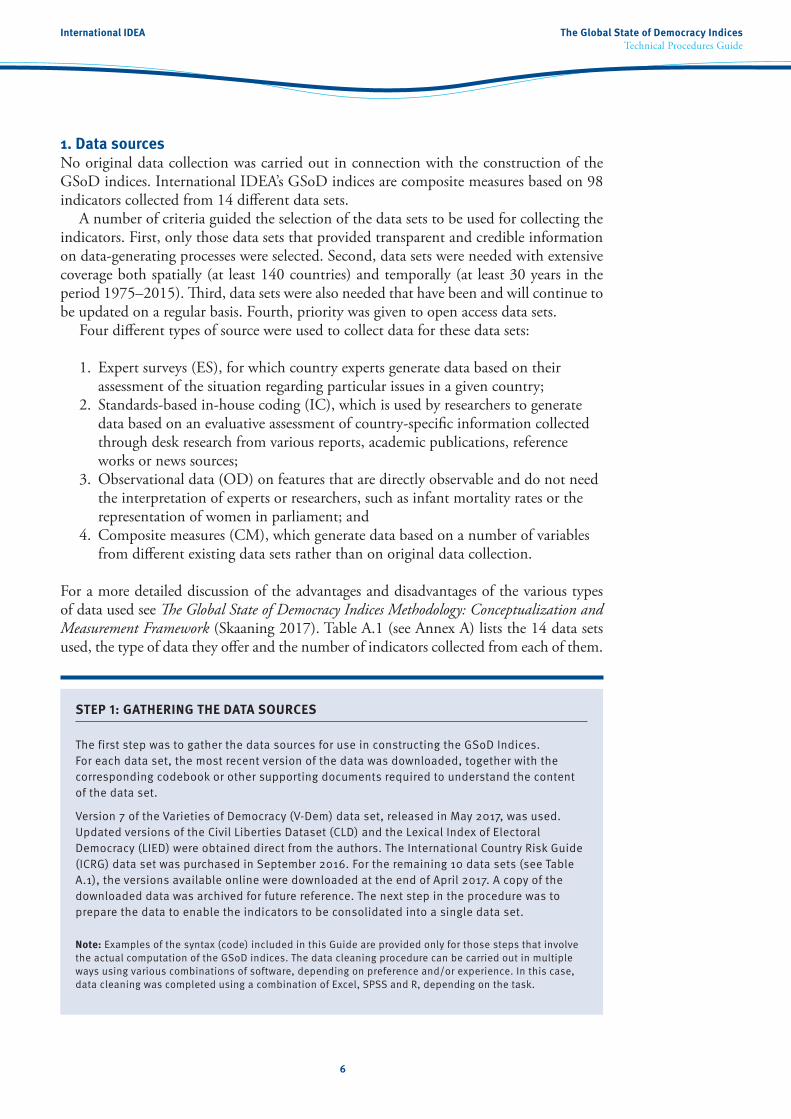
1. Data sourcesNo original data collection was carried out in connection with the construction of the GSoD indices. International IDEA’s GSoD indices are composite measures based on 98 indicators collected from 14 different data sets.
A number of criteria guided the selection of the data sets to be used for collecting the indicators. First, only those data sets that provided transparent and credible information on data-generating processes were selected. Second, data sets were needed with extensive coverage both spatially (at least 140 countries) and temporally (at least 30 years in the period 1975–2015). Third, data sets were also needed that have been and will continue to be updated on a regular basis. Fourth, priority was given to open access data sets.
Four different types of source were used to collect data for these data sets:
1. Expert surveys (ES), for which country experts generate data based on their assessment of the situation regarding particular issues in a given country;
2. Standards-based in-house coding (IC), which is used by researchers to generate data based on an evaluative assessment of country-specific information collected through desk research from various reports, academic publications, reference works or news sources;
3. Observational data (OD) on features that are directly observable and do not need the interpretation of experts or researchers, such as infant mortality rates or the representation of women in parliament; and
4. Composite measures (CM), which generate data based on a number of variables from different existing data sets rather than on original data collection.
For a more detailed discussion of the advantages and disadvantages of the various types of data used see The Global State of Democracy Indices Methodology: Conceptualization and Measurement Framework (Skaaning 2017). Table A.1 (see Annex A) lists the 14 data sets used, the type of data they offer and the number of indicators collected from each of them.
STEP 1: GATHERING THE DATA SOURCES
The first step was to gather the data sources for use in constructing the GSoD Indices. For each data set, the most recent version of the data was downloaded, together with the corresponding codebook or other supporting documents required to understand the content of the data set.
Version 7 of the Varieties of Democracy (V-Dem) data set, released in May 2017, was used. Updated versions of the Civil Liberties Dataset (CLD) and the Lexical Index of Electoral Democracy (LIED) were obtained direct from the authors. The International Country Risk Guide (ICRG) data set was purchased in September 2016. For the remaining 10 data sets (see Table A.1), the versions available online were downloaded at the end of April 2017. A copy of the downloaded data was archived for future reference. The next step in the procedure was to prepare the data to enable the indicators to be consolidated into a single data set.
Note: Examples of the syntax (code) included in this Guide are provided only for those steps that involve the actual computation of the GSoD indices. The data cleaning procedure can be carried out in multiple ways using various combinations of software, depending on preference and/or experience. In this case, data cleaning was completed using a combination of Excel, SPSS and R, depending on the task.

The Global State of Democracy IndicesTechnical Procedures Guide
International IDEA
7
2. CoverageThe unit of observation for International IDEA’s Global State of Democracy Indices is the country– year. The 2017 release of the data set contains data for 155 countries for up to 41 years, giving a total of 5894 country–years. Details of the spatial and temporal coverage of the data set are presented in the following sections.
Spatial coverageInternational IDEA’s GSoD indices provide data for all the independent countries in the world with a population of at least one million people. Countries are included in the data set from 1975 or, if the country was not independent in 1975, the year it gained independence (see Step 2). The data set does not include semi-sovereign units such as Palestine/Gaza, Palestine West Bank or Somaliland. Countries that have been dissolved remain in the data set until they cease to exist. Using these inclusion rules, the data set is composed of 155 countries. The only country that has exited the data set is the German Democratic Republic, which was dissolved in 1990 after unification with the Federal Republic of Germany.
The spatial coverage of the GSoD indices for the most recent year in the data set (2015) is shown in Figure 2.1. A complete list of the 155 countries included in the GSoD indices data set is provided in Table B.1 (see Annex B).
FIGURE 2.1.
Spatial coverage of International IDEA’s Global State of Democracy indices, 2015

The Global State of Democracy IndicesTechnical Procedures Guide
International IDEA
8
Temporal coverageThe first edition of International IDEA’s GSoD indices covers the period 1975–2015. The data set covers the period since the International Covenant on Civil and Political Rights and the International Covenant on Economic, Social and Cultural Rights took effect in 1976, using 1975 as a reference point. Moreover, the data set starts with a period that is often called ‘the third wave of democratization’ (Huntington 1991) in the democratization literature.
The number of countries covered each year by the GSoD indices is shown in Figure 2.2. Table B.1 (see Annex B) indicates the temporal coverage for each of the 155 countries included in the data set.
FIGURE 2.2.
Temporal coverage of International IDEA’s Global State of Democracy indices, 2015
Geographical regionsInternational IDEA’s GSoD indices also include aggregated values at the regional and subregional levels. The regional definitions follow closely those developed by International IDEA for The Global State of Democracy (see International IDEA 2017b), which creates regions based on a geographical criterion while also taking account of the cultural and historical links among countries that belong to the same subregion or region. In total, aggregated values are presented for six regions and 17 subregions:

The Global State of Democracy IndicesTechnical Procedures Guide
International IDEA
9
• Africa (East Africa, Central Africa, Southern Africa, West Africa and North Africa)
• Latin America and the Caribbean (the Caribbean, Central America and Mexico, and South America)
• North America • Asia and the Pacific (Central Asia, East Asia, South Asia, South East Asia, and
Oceania) • Middle East and Iran • Europe (East-Central Europe, Eastern Europe/Post-Soviet Europe, South Europe,
and North and West Europe
It should be noted that the values in the data set are aggregated without using population weights. Table B.2 (see Annex B) contains a complete list of the regions and subregions, as well as their membership.
Regional organizationsInternational IDEA’s GSoD indices also contains aggregated values for five regional organizations: the African Union (AU), the Association of South East Asian Nations (ASEAN), the European Union (EU), the Organization for Economic Co-operation and Development (OECD) and the Organization of American States (OAS).
As in the case of the geographical regions, the values in the data set are aggregated without using population weights. A complete list of the regional organizations and their membership is given in Table C.1. (see Annex C).
STEP 2: PREPARING THE DATA SOURCES FOR MERGER
Once the coverage of the GSoD Indices had been established (155 countries with a population of over one million, and the period 1975–2015), the next step was to prepare the various data sources used to be merged into a single data set.
An initial country–year matrix was created containing 6355 country–years (155 countries over 41 years). However, not all the countries were in existence for the entire period. The German Democratic Republic ceased to exist during the period so the country–years after its dissolution were deleted. In other cases, such as the former Soviet republics, the countries were formed during the period covered. The country–years before these countries gained independence were therefore deleted. After excluding all these country–years, the country–year matrix contained 5894 country–years. In all cases, a standard procedure was followed. Czechia is the successor of Czechoslovakia, Russia is the successor of the Soviet Union, Serbia is a successor of Yugoslavia and so on. For a detailed description of this procedure see Coppedge et al. (2016b).
Since the different data sources came in different forms, a common set of identifying variables was created for each of the 14 data sources: the year, the country name, the country code and the country–year. The codes from the Correlates of War (COW code) were used for the country code variable. Some data sources, such as V-Dem, already included this variable but it had to be created for other data sources based on the name or abbreviation of the country. The country–year variable was created by concatenating the values from the country-code variable (of between 2 and 920) with the values for the year variable (from 1975 to 2015). This resulted in a country–year variable with a value from 21975 to 9202015, which uniquely identifies each combination of country and year in the data set.

The Global State of Democracy IndicesTechnical Procedures Guide
International IDEA
10
In some cases, the data sources also had to be put into country–year format. The National Elections across Democracy and Autocracy (NELDA) data set, for instance, only has data for years in which elections are held. The missing years had to be added to complete the 1995–2015 period. The International Country Risk Guide (ICRG) data set comes in a wide format that had to be transformed into the long format by transposing the variable years into country–years.
The GSoD indices data set also includes geographical regions and subregions. To keep things simple, codes for the regions and subregions were added to the variable indicating the country codes. These are additional to the country codes based on the COW codes. The codes from 971 to 989 were reserved for the geographical subregions, while the codes from 991 to 996 were reserved for the geographical regions and code 999 reserved for the whole world. The same approach was used for the regional organizations included in the data set. Codes 961 to 965 were reserved for them. Unique country–year identifiers were also constructed for these additional regions and regional organizations by concatenating their codes and the years. For more details about the codes reserved for the geographical regions and subregions and for the regional organizations see the GSoD Codebook (Tufis 2017).
3. IndicatorsThe GSoD indices conceptual framework guided selection of the indicators to be included in the data set. The indicators rely on various types of sources and are collected from extant data sets compiled by different organizations and researchers. The main priority in the selection of indicators was a high level of concept–measure consistency, or the extent to which the indicators really capture the core meaning of the particular concepts in question. In addition, the aim wherever possible was to select multiple indicators for each subattribute—especially where an adequate observable indicator was not available.
Assuming the selection of high-quality indicators, a cumulative approach to measurement generally improves confidence in the scores since it utilizes the combined efforts of various data providers in order to make the resulting measures more nuanced and reliable. The use of different indicators enables the capture of related, but nonetheless distinct, aspects of the features to be measured. It also tends to reduce the influence of idiosyncratic measurement errors associated with individual indicators. Finally, drawing on several indicators makes it possible to assess the level of agreement between indicators and use this information to calculate uncertainty estimates for the indices (see Pemstein, Meserve and Melton 2010; Fariss 2014).
Each of the 98 indicators selected from the 14 data sources corresponds to one of the subattributes or attributes of democracy developed for International IDEA’s GSoD indices. Table D.1 links a complete list of the indicators to the attributes and subattributes. Table D.2 presents information about the source for each indicator. Finally, Table D.3 summarizes the coverage and missing data for each indicator (see Annex D). There is an extensive discussion on the selection of indicators in The Global State of Democracy Indices Methodology: Conceptualization and Measurement Framework gy (Skaaning 2017), while detailed information on each of the indicators is available in the GSoD Codebook (Tufis 2017).

The Global State of Democracy IndicesTechnical Procedures Guide
International IDEA
11
STEP 3: PREPARING THE INDICATORS FOR MERGER
All the indicators selected for inclusion in International IDEA’s GSoD indices have been put through a process of data cleaning to ensure that the data is correct and follows the country–year format. The GSoD codebook indicates for each indicator whether it was changed in any way from the original data and, if so, lists the specific changes.
Only the types of changes made to prepare the indicators are set out below. These can be grouped into three main categories: (a) recoding the data; (b) interpolation of data; and (c) computing the data for geographical regions and subregions, and regional organizations included in the data set.
Different types of recoding procedures were used for different indicators in order to prepare them for calculating the GSoD indices. First, in some cases, the original data included specific codes for missing values. All the specific codes for missing values were recoded as system missing, indicating that the value for that variable for the particular country–year is not available.
Second, for all those variables that were measured on an interval-level scale or that were aggregated using item response theory (IRT) models, the original variables were recoded into ordinal-level variables. For more details about the aggregating procedures used see The Global State of Democracy Indices Methodology: Conceptualization and Measurement Framework (Skaaning 2017, section 3.4). The recoding was done by grouping the original data into 20 categories, each of five percentiles. In this way, interval-level variables ranging from approximately –3.5 to approximately 3.5 were recoded into ordinal-level variables ranging from 1 (the first category, comprised of the bottom five percentiles) to 20 (the last category, comprised of the top five percentiles).
Third, some indicators had a number of categories with a very low number of cases (country–years). As a general rule, categories with less than 1 per cent of the data were recoded into adjacent categories (specific cases are indicated in the codebook).
Fourth, in some cases the scale was inversed so that all the indicators included in an index run in the same direction, with low values indicating the absence or low levels of an attribute and high values indicating the presence or high levels of an attribute.
With respect to interpolating the data, that is, replacing missing values with reasonable estimates of values in order to increase the coverage of an indicator, different approaches were used, depending on the characteristics of the specific indicator being analysed.
The indicators used from the NELDA data sets had multiple values for a country in the years in which there were multiple rounds of elections organized in that country. Rather than selecting only a particular type of elections and/or using some other selection criterion, the scores of the different country–year elections were averaged into a single country–year score.
Two different types of interpolation were used for indicators from data sources that did not code the data every year. For indicators related to electoral processes, the values from the election year were duplicated for the remaining years in the electoral cycle. For instance, the value observed for voter turnout in a particular country in 1976 was used for the remaining years in the electoral cycle, 1977, 1978 and 1979, until a new election was held with a new observed value for voter turnout in 1980. For other indicators, which were measured at various time intervals and where the phenomenon being measured is likely to change only slowly, linear interpolation was used from one measurement to the next, assuming a linear process of change over time. For example, the percentage of women in ministerial positions was coded by the Inter-Parliamentary Union in 1987, 1994, 1998 and 2005, and then every two years from 2008 until 2014 and again in 2015. Starting from the observed values in those years, values were linearly imputed for the missing years using the closest surrounding years.
Finally, the values for all the indicators had to be computed for the geographical regions and subregions, and the regional organizations included in the GSoD indices data set. Data for
The Global State of Democracy IndicesTechnical Procedures Guide
International IDEA
12
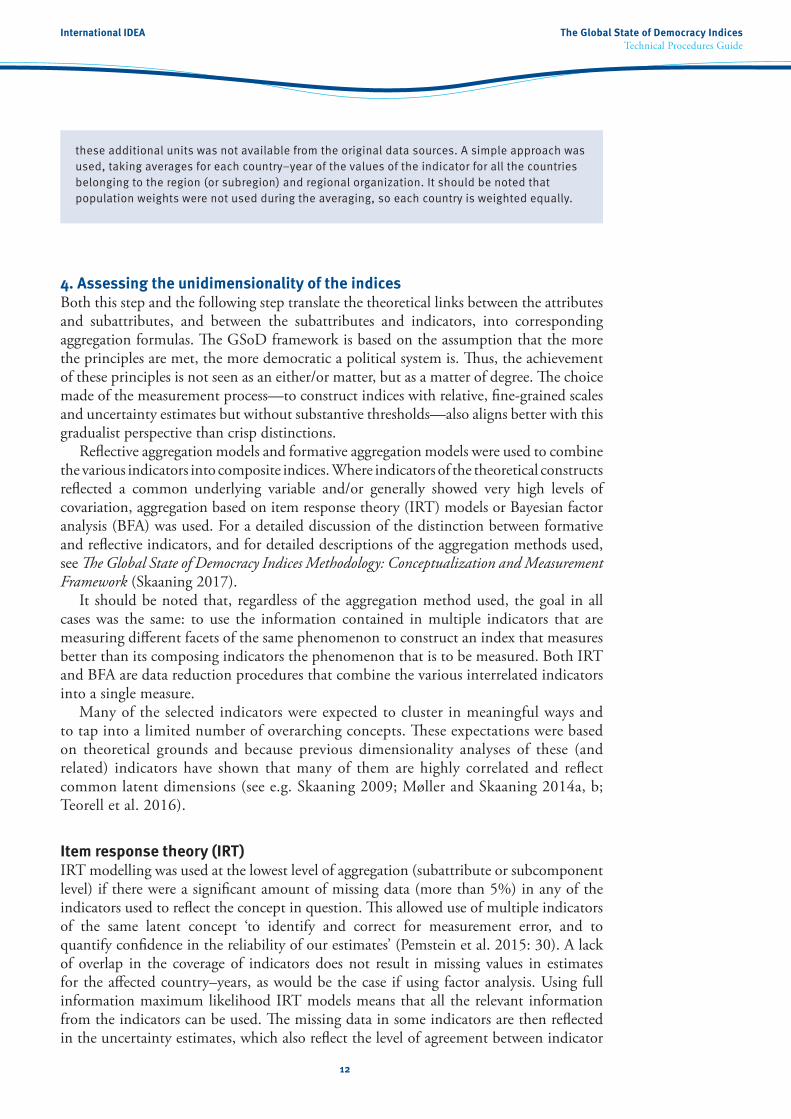
these additional units was not available from the original data sources. A simple approach was used, taking averages for each country–year of the values of the indicator for all the countries belonging to the region (or subregion) and regional organization. It should be noted that population weights were not used during the averaging, so each country is weighted equally.
4. Assessing the unidimensionality of the indicesBoth this step and the following step translate the theoretical links between the attributes and subattributes, and between the subattributes and indicators, into corresponding aggregation formulas. The GSoD framework is based on the assumption that the more the principles are met, the more democratic a political system is. Thus, the achievement of these principles is not seen as an either/or matter, but as a matter of degree. The choice made of the measurement process—to construct indices with relative, fine-grained scales and uncertainty estimates but without substantive thresholds—also aligns better with this gradualist perspective than crisp distinctions.
Reflective aggregation models and formative aggregation models were used to combine the various indicators into composite indices. Where indicators of the theoretical constructs reflected a common underlying variable and/or generally showed very high levels of covariation, aggregation based on item response theory (IRT) models or Bayesian factor analysis (BFA) was used. For a detailed discussion of the distinction between formative and reflective indicators, and for detailed descriptions of the aggregation methods used, see The Global State of Democracy Indices Methodology: Conceptualization and Measurement Framework (Skaaning 2017).
It should be noted that, regardless of the aggregation method used, the goal in all cases was the same: to use the information contained in multiple indicators that are measuring different facets of the same phenomenon to construct an index that measures better than its composing indicators the phenomenon that is to be measured. Both IRT and BFA are data reduction procedures that combine the various interrelated indicators into a single measure.
Many of the selected indicators were expected to cluster in meaningful ways and to tap into a limited number of overarching concepts. These expectations were based on theoretical grounds and because previous dimensionality analyses of these (and related) indicators have shown that many of them are highly correlated and reflect common latent dimensions (see e.g. Skaaning 2009; Møller and Skaaning 2014a, b; Teorell et al. 2016).
Item response theory (IRT)IRT modelling was used at the lowest level of aggregation (subattribute or subcomponent level) if there were a significant amount of missing data (more than 5%) in any of the indicators used to reflect the concept in question. This allowed use of multiple indicators of the same latent concept ‘to identify and correct for measurement error, and to quantify confidence in the reliability of our estimates’ (Pemstein et al. 2015: 30). A lack of overlap in the coverage of indicators does not result in missing values in estimates for the affected country–years, as would be the case if using factor analysis. Using full information maximum likelihood IRT models means that all the relevant information from the indicators can be used. The missing data in some indicators are then reflected in the uncertainty estimates, which also reflect the level of agreement between indicator

The Global State of Democracy IndicesTechnical Procedures Guide
International IDEA
13
scores, or the extent to which they are correlated. If none of the indicators provides data for a given country–year, no estimate is calculated for this country–year. The mirt package developed by Philip Chalmers (2017) was used to conduct the modelling.
Bayesian factor analysis (BFA)If there is virtually perfect overlap in the measures, then BFA becomes a more viable option. Like IRT models, BFA provides point estimates for the latent dimension and confidence intervals, but it does so only for country–years with uniform indicator coverage. BFA was therefore used to combine indicators only if all of them had a low level of missing data. Moreover, when applicable, BFA was used to combine subcomponent scores into subattribute scores, and thereafter subattribute scores into attribute scores (i.e. if the measures were expected to reflect the same latent concept in the framework, and when the indicators/indices to be aggregated showed very strong correlations). For BFA the MCMCpack package in R was used (Martin, Quinn and Park 2017).
Formative approachWhen indicators are understood as constitutive components of the concept of interest, this means that the indicators are not necessarily highly correlated. Here the use of a formative approach is more plausible. Formative models were used in the GSoD framework when a particular version of the procedure was judged to be more appropriate than purely reflective procedures. Hence, a formative model was used to combine the contestation index with an inclusiveness indicator to create the representative government index, and a formative model used to aggregate indicators related to the presence, and freedom and fairness of subnational elections (see Step 5: Aggregating the indicators into indices).
STEP 4: ASSESSING THE UNIDIMENSIONALITY OF INDICES
Aggregating multiple indicators into a single index rests on the assumption that the indicators are interrelated, and that they are measuring different manifestations/forms of the same phenomenon. These assumptions, however, have to be tested and confirmed before proceeding with constructing the indices. Four different ways were used to test the assumption or verify that the indicators could be combined into indices.
First, the bivariate correlations among all the indicators included were computed in an index for all the indices. There was an expectation that all the indicators included in an index would be interrelated (correlated), which indicates that they are measuring some aspect of the phenomenon that the index is supposed to measure. The correlation tables are presented in Annex F. Most of the indicators are highly to very highly correlated with the other indicators belonging to the same index. The correlations usually range from .6 to .9, and most of them are higher than .8. Some indicators display only medium correlations of around .4 to .5, but these are few in number and there are theoretical reasons for keeping them as part of the construction of the index.
Second, high correlations among the indicators are necessary, but not sufficient for constructing the indices. Since the goal is to construct one index for each of the main attributes of democracy, the indicators that are included in an index have to be related in such a way that they measure the same attribute (a single factor). Thus, a number of factor analyses were computed that allow one of up to three factors to be extracted, depending on the number of indicators included in the index (The results of these analyses are not shown but are
The Global State of Democracy IndicesTechnical Procedures Guide
International IDEA
14
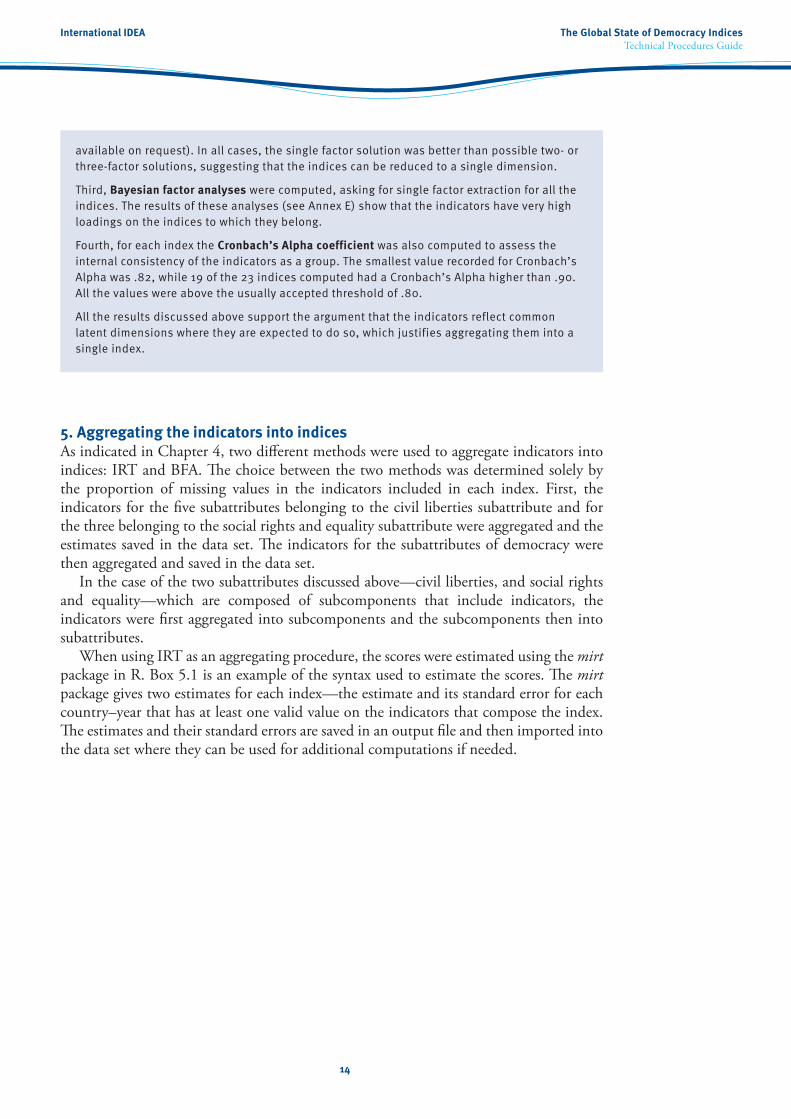
available on request). In all cases, the single factor solution was better than possible two- or three-factor solutions, suggesting that the indices can be reduced to a single dimension.
Third, Bayesian factor analyses were computed, asking for single factor extraction for all the indices. The results of these analyses (see Annex E) show that the indicators have very high loadings on the indices to which they belong.
Fourth, for each index the Cronbach’s Alpha coefficient was also computed to assess the internal consistency of the indicators as a group. The smallest value recorded for Cronbach’s Alpha was .82, while 19 of the 23 indices computed had a Cronbach’s Alpha higher than .90. All the values were above the usually accepted threshold of .80.
All the results discussed above support the argument that the indicators reflect common latent dimensions where they are expected to do so, which justifies aggregating them into a single index.
5. Aggregating the indicators into indices As indicated in Chapter 4, two different methods were used to aggregate indicators into indices: IRT and BFA. The choice between the two methods was determined solely by the proportion of missing values in the indicators included in each index. First, the indicators for the five subattributes belonging to the civil liberties subattribute and for the three belonging to the social rights and equality subattribute were aggregated and the estimates saved in the data set. The indicators for the subattributes of democracy were then aggregated and saved in the data set.
In the case of the two subattributes discussed above—civil liberties, and social rights and equality—which are composed of subcomponents that include indicators, the indicators were first aggregated into subcomponents and the subcomponents then into subattributes.
When using IRT as an aggregating procedure, the scores were estimated using the mirt package in R. Box 5.1 is an example of the syntax used to estimate the scores. The mirt package gives two estimates for each index—the estimate and its standard error for each country–year that has at least one valid value on the indicators that compose the index. The estimates and their standard errors are saved in an output file and then imported into the data set where they can be used for additional computations if needed.

The Global State of Democracy IndicesTechnical Procedures Guide
International IDEA
15
BOX 5.1.
Syntax for aggregating indicators into indices using IRT
library(mirt) # load the mirt library
### 1.3. IRT: Free political parties # estimate sub-attribute 1.3
# Select all cases that have values on at least one variable
SD13score <- subset(Scoresv01, !is.na(v_13_01) | !is.na(v_13_02) |
!is.na(v_13_03) | !is.na(v_13_04) | !is.na(v_13_05) |
!is.na(v_13_06) | !is.na(v_13_07) | !is.na(v_13_08) |
!is.na(v_13_09))
nrow(SD13score) # Check the number of cases
# Run the model and compute the scores
SD13irt <- mirt(SD13score[,16:24], 1, itemtype = ‘graded’, technical =
list(NCYCLES = 5000))
Scores_SD13 <- fscores(SD13irt, method = ‘MAP’, full.scores = TRUE,
full.scores.SE = TRUE)
# Save the scores
SD13_save <- cbind(SD13score[,1:8], Scores_SD13)
# Export the scores
write.csv(SD13_save, file = “SD13_save.csv”)
Note: Text in italics represents the names of the variables and files. For more detail on the options for the procedures used see Chalmers (2017).
When using BFA as an aggregating procedure, the scores were estimated using the MCMCpack package in R, more specifically the MCMCfactanal command. Box 5.2 provides an example of the syntax used to estimate the scores. For each index, the MCMCpack package gives two estimates, the estimate and its standard error, for each country–year that has valid values on all the indicators that compose the index. The estimates and their standard errors are saved in an output file and then imported into the data set, where they can be used for additional computations if needed.

The Global State of Democracy IndicesTechnical Procedures Guide
International IDEA
16
BOX 5.2.
Syntax for aggregating indicators into indices using BFA
library(MCMCpack) # load the MCMCpack library
# 2.2.A. BFA: Freedom of expression
# Run the model and compute the scores
SD22a <-MCMCfactanal(~v_22_01 + v_22_02 + v_22_03 + v_22_04 + v_22_05 +
v_22_06 + v_22_07, factors = 1, lambda.constraints = list(),
data = Scoresv01, burnin = 5000, mcmc = 100000, thin = 100,
verbose = 1000, seed = NA, lambda.start = NA, psi.start = NA,
l0=0, L0=0, a0=0.001, b0=0.001, store.scores=TRUE, std.var =
TRUE)
# Save and export the scores
capture.output(summary(SD22a), file = “SD22a_score.txt”)
system(“Say Oh, most wonderful, your data analysis is complete!”)
Note: Text in italics represents the names of the variables and files. For more detail on the options for the procedures used see Martin, Quinn and Park (2017).
The aggregation rules used for each sub-dimension, subattribute and attribute computed are shown in Table 5.1.

The Global State of Democracy IndicesTechnical Procedures Guide
International IDEA
17
TABLE 5.1.
Aggregation rules for the creation of indices at the attribute and subattribute levels
Attribute Aggregation Subattribute Aggregation
1
Representative Government(free and equal access to political power)
Bayesian factor analysis of clean elections, free political parties and elected government to create contestation index; thereafter, multiplication of contestation and inclusive suffrage
1.1 Clean Elections Bayesian factor analysis
1.2 Inclusive Suffrage NA (only one indicator)
1.3 Free Political Parties Item response modelling
1.4 Elected Government Item response modelling
2Fundamental Rights(individual liberties and resources)
Bayesian factor analysis
2.1 Access to Justice Bayesian factor analysis
2.2 Civil Liberties
First item response modelling or Bayesian factor analysis by subcomponents (i.e. freedom of expression [BFA], freedom of association and assembly [BFA], freedom of religion [BFA], freedom of movement [BFA], and personal integrity and security [IRT]). Thereafter, Bayesian factor analysis of subcomponent indices.
2.3 Social Rights and Equality
First item response modelling by subcomponents (i.e. social group equality, gender equality, and basic welfare). Thereafter, Bayesian factor analysis of subcomponent indices.
3Checks on Government(effective control of executive power)
Bayesian factor analysis
3.1 Effective Parliament Item response modelling
3.2 Judicial Independence Item response modelling
3.3 Media Integrity Bayesian factor analysis
4
Impartial Administration (fair and predictable public administration)
Bayesian factor analysis
4.1 Absence of Corruption Item response modelling
4.2 Predictable Enforcement Item response modelling
5
Participatory Engagement(instruments for realization of political involvement)
NA (no obvious way to combine the multi-dimensional subattributes)
5.1 Civil Society Participation Bayesian factor analysis
5.2 Electoral Participation NA (only one indicator)
5.3 Direct Democracy NA (only one indicator)
5.4 Subnational Elections
Multiplication of indicators related to regional elections and local elections, respectively. Thereafter, the scores for the two levels are averaged.
Source: The Global State of Democracy Indices Methodology: Conceptualization and Measurement Framework (Skaaning 2017)

The Global State of Democracy IndicesTechnical Procedures Guide
International IDEA
18
STEP 5: AGGREGATING THE INDICATORS INTO INDICES
Due to missing data, two of the subattributes (free political parties and elected government) were aggregated using IRT. The clean elections subattribute is composed of indicators that do not suffer from high levels of missing data, so this was aggregated using BFA. Since there is only one indicator for inclusive elections, this subattribute does not need any aggregation. In a final step, all the country–years without an electoral regime according to V-Dem were scored the minimum value of 0.
The suffrage indicator was combined with the three other subattribute indices to construct an overall representative government index but only after the construction of an ‘intermediate’ index based on the other subattribute indices. Inspired by Dahl’s theoretical distinction between two dimensions of representative government, contestation and inclusion (1971; 1989; see also Coppedge, Alvarez and Maldonado 2008; Miller 2015), the factor scores from a BFA were first used to construct a contestation index. Thereafter a formative aggregation procedure was chosen to combine the contestation index with the suffrage measure. Although contestation and inclusion are not highly correlated, they both constitute necessary conditions for representative government. Accordingly, the representative government index is based on a multiplication of the suffrage scores and the normalized scores for the contestation index.
Since none of the indicators linked to access to justice have significant amounts of missing data, they were combined using BFA. Regarding the second subattribute of fundamental rights, civil liberties, the first four subcomponent indices were constructed using BFA, while the personal integrity and security subcomponent index was constructed using IRT. In the next step, BFA was used to reduce the highly correlated subcomponents into a single index score for the civil liberties subattribute. IRT was used to construct the three subcomponents of the social rights and equality subattribute, which were then combined in the subattribute using BFA. Finally, the three fundamental rights subattributes were aggregated into the fundamental rights index using BFA.
Three reflective indices were created—on effective parliament, judicial independence and media integrity—using IRT in the first two cases (due to the significant gaps in some of the indicators) and BFA in the latter case. These indices were then aggregated into a more general index using BFA, as they tend to reflect a common underlying dimension, which was interpreted as checks on government.
Since the ICRG indicators had substantial deficiencies in coverage, the two indices constructed from the indicators grouped with absence of corruption and predictable enforcement were based on IRT modelling. These were then used to construct an impartial administration index based on BFA scores.
On the participatory engagement subattributes, no aggregation was needed for direct democracy since an existing index was used and there are no viable alternatives; or for electoral participation, since only one indicator was used. The two indicators on civil society participation clearly tapped into a common dimension. They were aggregated into an index based on BFA since the indicators have an almost perfect overlap. For subnational elections, a formative aggregation formula was chosen, which took into account the reinforcing relationship between the mere existence of subnational elections and their freeness and fairness.
A measure of free local level elections was created by multiplying the indicators on elected local government and free and fair subnational elections, and a measure of free regional elections by multiplying the indicators on elected regional governments and free and fair subnational elections. Since free elections at the local level can be considered partially substitutable with free elections at the regional level, the aggregation was completed by calculating the average of these products.
The relationship between the subattributes and the overarching attribute is less evident for participatory engagement. Furthermore, the subattribute indices linked to this attribute are

The Global State of Democracy IndicesTechnical Procedures Guide
International IDEA
19
not highly correlated. This could reflect the fact that they capture fairly distinct phenomena even though they are all conceptually related by being expressions of popular participation. Aggregation through reflective models did not appear to be a plausible solution.
As it is also not clear from extant theory whether the different aspects of popular participation stand in an interactive and/or substitutable relationship with each other, there was no aggregation to the attribute level. Users are encouraged to use the subattribute indices.
6. ScalingAll the indices in the data set offer nuanced scores in the form of interval scale measurement. The indices have been normalized (step 6) to range from 0 (lowest achievement among all the country–years) to 1 (highest achievement among all the country–years). A score of 0 generally refers to the worst performance in the whole sample of country–years covered by a particular index, while 1 refers to the best country-year performance in the sample.
For a number of indices, however, 0 also has an absolute meaning as the lowest score that is theoretically possible. The subattribute indices capturing clean elections, elected government, direct democracy and subnational elections all have substantively meaningful minimum values that refer to the total absence of the features in question.
STEP 6: SCALING THE INDICES
The normalization of the indices was carried out by subtracting for each country–year the minimum score for the index from the value of the country–year and by dividing the result by the difference between the maximum and the minimum value of the index. The formula used for the normalization of the indices was:
where xi represents the value of index x for country–year i, while x'i represents the normalized value of index x for country–year i.
In this way, the lowest value in the population of country–years in the data set becomes 0, while the highest value in the same population of country–years in the data set becomes 1, while all the remaining country–years are given values between these two values.
x'i = (xi–min(xi)) ⁄ (max(xi)–min(xi))
7. Confidence intervalsFor most indices, the yearly scores for each country are accompanied by uncertainty estimates, which can be used to assess whether differences between countries and within countries over time are significant. These uncertainty estimates, in the form of confidence intervals or margins of error, reflect the statistically likely range for the country–year index scores based on the indicators used.
The GSoD indices confidence levels refer to one standard deviation below and above the estimated score. This means that about 68 per cent of the ‘true’ values would be found within these intervals. Confidence intervals are only available for those indices that are constructed from multiple indicators. The more the underlying indicators are in agreement

The Global State of Democracy IndicesTechnical Procedures Guide
International IDEA
20
regarding the scoring (high-low) of a particular aspect of democracy, the narrower the confidence intervals. The more the underlying indicators are in disagreement, the wider the confidence intervals.
If the confidence levels overlap when comparing the scores for two or more countries on the same GSoD (attribute) index, the difference between the scores is not statistically significant. Similarly, overlapping confidence intervals for different years when comparing the scores of one country for a particular GSoD index also indicates that the difference is statistically insignificant. More generally, short-term fluctuations are hard to capture and should be interpreted with caution, while it is usually possible to be certain about longer-term trends.
STEP 7: COMPUTING THE CONFIDENCE INTERVALS
Confidence intervals were computed by subtracting or adding the standard deviation from the estimated score. The lower bound of the 68 per cent confidence interval was computed by subtracting the standard deviation from the estimated score of the index, while the upper bound of the 68 per cent confidence interval was computed by adding the standard deviation to the estimated score of the index. These values were saved in the data set so that each index is represented by three different values: the point estimate and the two limits of the confidence interval. Confidence intervals have been computed for all the attributes and subattributes of democracy with the exception of the inclusive suffrage (1.2), electoral participation (5.2) and direct democracy (5.3) subattributes, which are composed of a single indicator, and the subnational elections (5.4) subattribute, which is aggregated using a formative formula.
8. Validity checksA series of validity checks on the indices was run throughout the process of constructing International IDEA’s GSoD indices. These tests were conducted to verify that the indices constructed really measure what they are thought to be measuring. Comparisons with extant measures should indicate a high degree of correspondence between the GSoD measures and existing measures of the same phenomena.
STEP 8: VALIDITY CHECKS
As discussed in Step 4, the dimensionality of each index was tested by running bivariate correlations for the indicators included in the index, various factor analyses and computing Cronbach’s Alpha coefficients. The correlation coefficients are shown in Annex F and the data from the dimensionality tests in Annex E.
In addition to the unidimensionality tests discussed above, a second type of validity check compared extant measures that attempt to capture relatively similar aspects of democracy at the attribute, subattribute or subcomponent levels. These measures were taken from nine large-scale data collection projects: the Bertelsmann Transformation Index (Bertelsmann Stiftung, various years); the CIRI Human Rights Database (Cingranelli, Richards and Clay 2014); the Democracy Index (Economist Intelligence Unit 2016); the Freedom in the World survey (Freedom House 2016); the Perceptions of Electoral Integrity (PEI) data (Norris et al. 2016); Polity IV data (Marshall, Gurr and Jaggers 2016); the Worldwide Governance Indicators

The Global State of Democracy IndicesTechnical Procedures Guide
International IDEA
21
(Kaufmann and Kray 2010); the Rule of Law Index (World Justice Project 2016); and the Varieties of Democracy (Coppedge et al. 2016a, 2016b). For a summary of these data sets see Table G.1.
Assuming that the extant measures are valid, high correlations would indicate that the GSoD indices are also valid. If the extant measures are based on similar or the same information, high correlations would indicate that the GSoD indices are reliable. However, correlations should be interpreted with caution since none of the extant measures are perfect and many of them capture slightly different concepts compared to the GSoD indices.
The correlations between the GSoD indices and existing data sets that measure relatively similar concepts are shown in Annex G. For more information see The Global State of Democracy Indices Methodology: Conceptualization and Measurement Framework (Skaaning 2017). Overall, the correlations presented in Annex G offer sufficient evidence that the GSoD indices are characterized by high levels of validity and reliability.
An additional validity check conducted for both the indicators and the indices as constructed at various levels of aggregation was to plot the indicators and indices over time for each country in the data set and visually checking their validity using specific country knowledge and expertise. This method allowed easy identification of whether the indices constructed corresponded to or contradicted team-based knowledge of the situation in a particular country.
Finally, all the countries in each of the indices were sorted at 10-year intervals (1975, 1985, 1995, 2005, and 2015) to check again the face validity of the indices by comparing their relative position at these times, as well as the changes in their relative position over time, to confirm that these conformed with existing knowledge of the evolution of different countries over the period.
ConclusionThis Guide presents the technical procedures used to construct International IDEA’s Global State of Democracy indices to provide a guide for those who want a better understanding of how the indices were constructed and, eventually, for those who want to use, modify or build on the indices. It provides a detailed step-by-step description of the procedures used, allowing the interested reader to follow each step.
It should be noted that this technical methodology only provides information about the method used to construct the indices. The information presented in this document builds on and is complemented by an elaborate discussion of the conceptual background to the indices in the GSoD indices methodology (Skaaning 2017). If the reader is interested in a particular indicator used, more information is available in the GSoD Codebook (Tufis 2017). These three documents taken together provide complete information on the GSoD indices.
The Annexes present additional information that some readers or users of the GSoD indices might find useful, including a complete list of the data sets used as data sources (Annex A); a list of the countries, regions and subregions in the GSoD data set (Annex B); a list of the regional organizations included in the GSoD data set (Annex C); the attributes, subattributes and indicators included in the GSoD data set (Annex D); and the results of the unidimensionality and validity tests performed during the creation of the GSoD data set (Annexes E, F and G).

The Global State of Democracy IndicesTechnical Procedures Guide
International IDEA
22
References Beetham, D., Democracy and Human Rights (Cambridge: Polity, 1999)Bertelsmann Stiftung, Bertelsmann Transformation Index: Towards Democracy and a
Market Economy (Washington, DC: Brookings Institution Press, various years) Cingranelli, D. L., Richards, D. L. and Chad Clay, K., ‘The CIRI Human Rights
Dataset’, Version 14, April 2014, <http://www.humanrightsdata.com>, accessed 14 July 2017
Chalmers, P., Package ‘mirt’ (2017), <https://cran.r-project.org/web/packages/mirt/mirt.pdf>, accessed 11 August 2017
Coppedge, M., Alvarez, A. and Maldonado, C., ‘Two persistent dimensions of democracy: contestation and inclusiveness’, Journal of Politics, 70/3 (2008), pp. 632–47
Coppedge, M. et al.,V-Dem [Country-Year/Country-Date] Dataset v. 7 (Gothenburg: Varieties of Democracy (V-Dem) Project, 2016a)
—, V-Dem Country Coding Units v. 6. (Gothenburg: V-Dem Project, 2016b)Dahl, R. A., Polyarchy: Participation and Opposition (New Haven: Yale University Press,
1971)—, Democracy and its Critics (New Haven: Yale University Press, 1989)Economist Intelligence Unit (EIU), Democracy Index 2016: Revenge of the ‘Deplorables’
(London: EIU, 2016), <http://www.eiu.com/public/democracy_index.aspx>, accessed 14 July 2017
Freedom House, Freedom in the World, 1973–2017 (Washington, D.C.: Freedom House, 2017)
Fariss, C., ‘Respect for human rights has improved over time: Modeling the changing standard of accountability’, American Political Science Review, 108/2 (2014), pp. 297–318
Gibney, M. and Dalton, M., ‘The Political Terror Scale’, in D. L. Cingranelli (ed.), Policy Studies and Developing Nations, Volume 4: Human Rights and Developing Countries (Greenwich, CT: JAI Press, 1996)
Howell, L. D., ‘International country risk guide methodology’, Political Risk Services (PRS Group), 2011, <http://www.prsgroup.com/about-us/our-two-methodologies/icrg>, accessed 1 August 2017
Huntington, S. P., The Third Wave: Democratization in the Late Twentieth Century (Norman, OK: University of Oklahoma Press, 1991)
Beetham, D., Carvalho, E., Landman, T. and Weir, T., Assessing the Quality of Democracy: A Practical Guide (Stockholm: International IDEA, 2008), <http://www.idea.int/publications/catalogue/assessing-quality-democracy-practical-guide>, accessed 31 July 2017
International Institute for Democracy and Electoral Assistance (International IDEA), The Global State of Democracy 2017: Exploring Democracy’s Resilience (Stockholm: International IDEA, 2017a), <http://www.idea.int/gsod>
—, ‘Geographic definitions of regions and in The Global State of Democracy’, Background Paper, 2017b, <http://www.idea.int/gsod>
Institute for Health Metrics and Evaluation (IHME), Global Educational Attainment 1970–2015 (Seattle, WA: IHME, 2015)
Kaufmann, D., Kraay, A. and Mastruzzi, M., ‘The Worldwide Governance Indicators: Methodology and Analytical Issues’, World Bank Policy Research Working Paper No. 5430 (2010), <http://papers.ssrn.com/sol3/papers.cfm?abstract_id=1682130>, accessed 14 July 2017

The Global State of Democracy IndicesTechnical Procedures Guide
International IDEA
23
Linzer, D. and Staton, J. K., ‘A global measure of judicial independence, 1948–2012’ (formerly, ‘A Measurement Model for Synthesizing Multiple Comparative Indicators: The Case of Judicial Independence’), Journal of Law and Courts, 3/2 (2015), pp. 223–56
Marshall, M. G., Gurr, T. R. and Jaggers, K., Polity IV Project: Political Regime Characteristics and Transitions, 1800–2015, 19 May 2016, <http://www.systemicpeace.org/inscr/p4manualv2015.pdf>, accessed 14 July 2017
Martin, A. D., Quinn, K. M. and Park, J-H., Package ‘MCMCpack’, 2017, <https://cran.r-project.org/web/packages/MCMCpack/MCMCpack.pdf>, accessed 8 August 2017
Miller, M., ‘Democratic pieces: Autocratic elections and democratic development since 1815’, British Journal of Political Science, 45/3 (2015), pp. 501–30
Møller, J. and Skaaning, S-E., ‘Respect for civil liberties during the third wave of democratization: presenting a new dataset’, Social Indicators Research, 117/3 (2014a), pp. 1069–87
—, The Rule of Law: Definitions, Measures, Patterns, and Causes (Houndmills: Palgrave, 2014b)
Norris, P. et al., ‘The expert survey of Perceptions of Electoral Integrity’, Release 4.5, (PEI_4.5), August 2016, <www.electoralintegrityproject.com>, accessed 14 July 2017
Pemstein, D., Meserve, S. and Melton, J., ‘Democratic compromise: a latent variable analysis of ten measures of regime type’, Political Analysis, 18/4 (2010), pp. 426–49
Pemstein, D. et al., The V-Dem Measurement Model: Latent Variable Analysis for Cross-National and Cross-Temporal Expert-Coded Data, Varieties of Democracy Institute Working Paper No. 20, 2015
Skaaning, S-E., The Global State of Democracy Indices Methodology: Conceptualization and Measurement Framework (Stockholm: International IDEA, 2017), <http://www.idea.int/gsod>
—, ‘Measuring civil liberty: an assessment of standards-based data sets’, Revista de Ciencia Política, 29/3 (2009), pp. 721–40
—, ‘The civil liberty dataset: conceptualization and measurement’, Zeitschrift für vergleichende Politikwissenschaft/Comparative Governance and Politics, 2/1 (2008), pp. 29–51
Teorell, J., Coppedge, M., Skaaning S-E. and Lindberg S., Measuring Electoral Democracy with V-Dem Data: Introducing a New Polyarchy Index, Varieties of Democracy Institute Working Paper No. 25, 2016
Tufis, C., The Global State of Democracy Indices Codebook (Stockholm: International IDEA, 2017a), <http://www.idea.int/gsod>
United Nations Educational, Scientific and Cultural Organization, Institute for Statistics (UIS), ‘Literacy rate (2015)’, <http://data.uis.unesco.org/Index.aspx>, accessed 14 July 2017
United Nations, Inter-agency Group for Child Mortality Estimation, Levels and Trends in Child Mortality (New York: UN, 2015)
United Nations, Department of Economic and Social Affairs, Statistics Division, The World’s Women, 2000: Trends and Statistics (New York: United Nations, 2000)
—, The World’s Women 1995: Trends and Statistics (New York: UN, 1995)—, The World’s Women, 1970– 1990: Trends and Statistics (New York: UN, 1990)United Nations, Food and Agriculture Organization (FAO), FAOSTAT Database
(Rome: FAO, 2016)

The Global State of Democracy IndicesTechnical Procedures Guide
International IDEA
24
Whitten-Woodring, J. and Van Belle, D. A., ‘The correlates of media freedom: an introduction of the global media freedom dataset’, Political Science Research and Methods, 5/1 (2017), pp. 179–88
World Justice Project, Rule of Law Index 2016, 2016, <https://worldjusticeproject.org/sites/default/files/documents/RoLI_Final-Digital_0.pdf>, accessed 16 August 2017

The Global State of Democracy IndicesTechnical Procedures Guide
International IDEA
25
Annex A
Sources
TABLE A.1.
Data sets used for collecting indicators
Data set Type of data Number of indicators Spatial coverage Temporal
coverage
Civil Liberties Dataset (CLD) IC 5 207 countries 1976–2010
Food and Agriculture Organization (FAO) OD 1 245 countries 1961–2015
Gapminder OD 2 Varying Varying
Global Health Data Exchange (GHDx) OD 2 195 countries 1970–2015
Human Rights Protection Scores (HRPS) CM 1 202 countries 1949–2013
International Country Risk Guide (ICRG) ES 3 140 countries 1984–2015
Inter-Parliamentary Union (IPU) OD 1 193 countries 1987–2015
Lexical Index of Electoral Democracy (LIED) IC, OD 4 All independent 1800–2013
Latent Judicial Independence Scores (LJIS) CM 1 200 countries 1948–2012
Media Freedom Data (MFD) IC 1 196 countries 1948–2014
National Elections Across Democracy and Autocracy (NELDA) IC, OD 3 200 countries 1960–2006
Polity IV IC 4 167 countries 1800–2015
United Nation Educational, Scientific and Cultural Organization (UNESCO) OD 1 varying Varying
Varieties of Democracy (V-Dem) CM, ES, IC, OD 68 177 countries 1900–2015
Note: ES = expert surveys; IC = standards-based in-house coding; OD = observational data; CM = composite measures.

The Global State of Democracy IndicesTechnical Procedures Guide
International IDEA
26
Annex B
Countries, regions and subregions included in International IDEA’s GSoD indices
TABLE B.1.
List of countries included in International IDEA’s GSoD Indices
Country First Year Last Year Country–years
Afghanistan 1975 2015 41
Albania 1975 2015 41
Algeria 1975 2015 41
Angola 1975 2015 41
Argentina 1975 2015 41
Armenia 1991 2015 25
Australia 1975 2015 41
Austria 1975 2015 41
Azerbaijan 1991 2015 25
Bangladesh 1975 2015 41
Belarus 1991 2015 25
Belgium 1975 2015 41
Benin 1975 2015 41
Bolivia 1975 2015 41
Bosnia and Herzegovina 1992 2015 24
Botswana 1975 2015 41
Brazil 1975 2015 41
Bulgaria 1975 2015 41
Burkina Faso 1975 2015 41
Burundi 1975 2015 41
Cambodia 1975 2015 41
Cameroon 1975 2015 41
Canada 1975 2015 41
Central African Republic 1975 2015 41
Chad 1975 2015 41
Chile 1975 2015 41
China 1975 2015 41
Colombia 1975 2015 41
Costa Rica 1975 2015 41
Côte d’Ivoire 1975 2015 41
Croatia 1991 2015 25

The Global State of Democracy IndicesTechnical Procedures Guide
International IDEA
27
Country First Year Last Year Country–years
Cuba 1975 2015 41
Cyprus 1975 2015 41
Czechia 1975 2015 41
Democratic People’s Republic of Korea 1975 2015 41
Democratic Republic of the Congo (DRC) 1975 2015 41
Denmark 1975 2015 41
Dominican Republic 1975 2015 41
Ecuador 1975 2015 41
Egypt 1975 2015 41
El Salvador 1975 2015 41
Eritrea 1993 2015 23
Estonia 1991 2015 25
Ethiopia 1975 2015 41
Finland 1975 2015 41
France 1975 2015 41
Gabon 1975 2015 41
Gambia 1975 2015 41
Georgia 1991 2015 25
German Democratic Republic 1975 1990 16
Germany 1975 2015 41
Ghana 1975 2015 41
Greece 1975 2015 41
Guatemala 1975 2015 41
Guinea 1975 2015 41
Guinea-Bissau 1975 2015 41
Haiti 1975 2015 41
Honduras 1975 2015 41
Hungary 1975 2015 41
India 1975 2015 41
Indonesia 1975 2015 41
Iran 1975 2015 41
Iraq 1975 2015 41
Ireland 1975 2015 41
Israel 1975 2015 41
Italy 1975 2015 41
Jamaica 1975 2015 41
Japan 1975 2015 41
Jordan 1975 2015 41

The Global State of Democracy IndicesTechnical Procedures Guide
International IDEA
28
Country First Year Last Year Country–years
Kazakhstan 1991 2015 25
Kenya 1975 2015 41
Kosovo 2008 2015 8
Kuwait 1975 2015 41
Kyrgyzstan 1991 2015 25
Laos 1975 2015 41
Latvia 1991 2015 25
Lebanon 1975 2015 41
Lesotho 1975 2015 41
Liberia 1975 2015 41
Libya 1975 2015 41
Lithuania 1991 2015 25
Macedonia 1991 2015 25
Madagascar 1975 2015 41
Malawi 1975 2015 41
Malaysia 1975 2015 41
Mali 1975 2015 41
Mauritania 1975 2015 41
Mauritius 1975 2015 41
Mexico 1975 2015 41
Moldova 1991 2015 25
Mongolia 1975 2015 41
Morocco 1975 2015 41
Mozambique 1975 2015 41
Myanmar 1975 2015 41
Namibia 1990 2015 26
Nepal 1975 2015 41
Netherlands 1975 2015 41
New Zealand 1975 2015 41
Nicaragua 1975 2015 41
Niger 1975 2015 41
Nigeria 1975 2015 41
Norway 1975 2015 41
Oman 1975 2015 41
Pakistan 1975 2015 41
Panama 1975 2015 41
Papua New Guinea 1975 2015 41
Paraguay 1975 2015 41

The Global State of Democracy IndicesTechnical Procedures Guide
International IDEA
29
Country First Year Last Year Country–years
Peru 1975 2015 41
Philippines 1975 2015 41
Poland 1975 2015 41
Portugal 1975 2015 41
Qatar 1975 2015 41
Republic of Congo 1975 2015 41
Republic of Korea 1975 2015 41
Romania 1975 2015 41
Russia 1975 2015 41
Rwanda 1975 2015 41
Saudi Arabia 1975 2015 41
Senegal 1975 2015 41
Serbia 1975 2015 41
Sierra Leone 1975 2015 41
Singapore 1975 2015 41
Slovakia 1993 2015 23
Slovenia 1991 2015 25
Somalia 1975 2015 41
South Africa 1975 2015 41
South Sudan 2011 2015 5
Spain 1975 2015 41
Sri Lanka 1975 2015 41
Sudan 1975 2015 41
Swaziland 1975 2015 41
Sweden 1975 2015 41
Switzerland 1975 2015 41
Syria 1975 2015 41
Taiwan 1975 2015 41
Tajikistan 1991 2015 25
Tanzania 1975 2015 41
Thailand 1975 2015 41
Timor-Leste 2002 2015 14
Togo 1975 2015 41
Trinidad and Tobago 1975 2015 41
Tunisia 1975 2015 41
Turkey 1975 2015 41
Turkmenistan 1991 2015 25
Uganda 1975 2015 41

The Global State of Democracy IndicesTechnical Procedures Guide
International IDEA
30
Country First Year Last Year Country–years
Ukraine 1991 2015 25
United Kingdom 1975 2015 41
United States 1975 2015 41
Uruguay 1975 2015 41
Uzbekistan 1991 2015 25
Venezuela 1975 2015 41
Viet Nam 1975 2015 41
Yemen 1975 2015 41
Zambia 1975 2015 41
Zimbabwe 1975 2015 41
TABLE B.2.
Division of countries into regions as covered by the GSoD indices (2017)
Region Countries
Africa
East Africa Burundi, Eritrea, Ethiopia, Kenya, Rwanda, Somalia, Tanzania, Uganda
Central AfricaCameroon, Central African Republic, Chad, Democratic Republic of the Congo (DRC), Gabon, Republic of Congo
Southern AfricaAngola, Botswana¸ Lesotho, Madagascar, Malawi, Mauritius, Mozambique, Namibia, South Africa, Swaziland, Zambia, Zimbabwe
West AfricaBenin, Burkina Faso, Côte d’Ivoire, Gambia, Ghana, Guinea, Guinea-Bissau, Liberia, Mali, Mauritania, Niger, Nigeria, Senegal, Sierra Leone, Togo
North Africa Algeria, Egypt, Libya, Morocco, South Sudan, Sudan, Tunisia,
Latin America and the Caribbean
Caribbean Cuba, Dominican Republic, Haiti, Jamaica, Trinidad and Tobago
Central America and Mexico Costa Rica, El Salvador, Guatemala, Honduras, Mexico, Nicaragua, Panama
South America Argentina, Bolivia, Brazil, Chile, Colombia, Ecuador, Paraguay, Peru, Uruguay, Venezuela
North America
North America Canada, United States of America
Asia and the Pacific
Central Asia Kazakhstan, Kyrgyzstan, Tajikistan, Turkmenistan, Uzbekistan
East Asia China, Democratic People’s Republic of Korea, Japan, Mongolia, Republic of Korea, Taiwan
South Asia Afghanistan, Bangladesh, India, Nepal, Pakistan, Sri Lanka
South East Asia Cambodia, Indonesia, Laos, Malaysia, Myanmar, Philippines, Singapore, Thailand, Timor-Leste, Viet Nam
Oceania Australia, New Zealand, Papua New Guinea

The Global State of Democracy IndicesTechnical Procedures Guide
International IDEA
31
Region Countries
Middle East and Iran
Middle East and Iran Iran, Iraq, Jordan, Kuwait, Lebanon, Oman, Qatar, Saudi Arabia, Syria, Yemen
Europe
East-Central EuropeAlbania, Bosnia and Herzegovina, Bulgaria, Croatia, Czechia, Estonia, German Democratic Republic, Hungary, Kosovo, Latvia, Lithuania, Macedonia, Poland, Romania, Serbia, Slovakia, Slovenia
Eastern Europe/Post-Soviet Europe Armenia, Azerbaijan, Belarus, Georgia, Moldova, Russia, Ukraine
North and West EuropeAustria, Belgium, Denmark, Finland, France, Germany, Ireland, Netherlands, Norway, Sweden, Switzerland, United Kingdom
South Europe Cyprus, Greece, Israel, Italy, Portugal, Spain, Turkey
Note: Country names in this list do not represent the official position of International IDEA with regard to the legal status or policy of the entities mentioned. The list represents a harmonization of often-divergent lists and practices.

The Global State of Democracy IndicesTechnical Procedures Guide
International IDEA
32
Annex C
Regional organizations included in the data set
TABLE C.1.
Regional organizations included in the data set
Regional organization Countries
African Union (AU) Algeria, Angola, Benin, Botswana, Burkina Faso, Burundi, Cameroon, Central African Republic, Chad, Côte d’Ivoire, Democratic Republic of the Congo (DRC), Egypt, Eritrea, Ethiopia, Gabon, Gambia, Ghana, Guinea, Guinea-Bissau, Kenya, Lesotho, Liberia, Libya, Madagascar, Malawi, Mali, Mauritania, Mauritius, Morocco, Mozambique, Namibia, Niger, Nigeria, Republic of Congo, Rwanda, Senegal, Sierra Leone, Somalia, South Africa, South Sudan, Sudan, Swaziland, Tanzania, Togo, Tunisia, Uganda, Zambia, Zimbabwe
Association of South East Asian Nations (ASEAN) Cambodia, Indonesia, Laos, Malaysia, Myanmar, Philippines, Singapore, Thailand, Viet Nam
European Union (EU) Austria, Belgium, Bulgaria, Croatia, Cyprus, Czechia, Denmark, Estonia, Finland, France, Germany, Greece, Hungary, Ireland, Italy, Latvia, Lithuania, Netherlands, Poland, Portugal, Romania, Slovakia, Slovenia, Spain, Sweden, United Kingdom
Organization for Economic Co-operation and Development (OECD)
Australia, Austria, Belgium, Canada, Chile, Czechia, Denmark, Estonia, Finland, France, Germany, Greece, Hungary, Ireland, Israel, Italy, Japan, Latvia, Mexico, Netherlands, New Zealand, Norway, Poland, Portugal, Slovakia, Slovenia, Republic of Korea, Spain, Sweden, Switzerland, Turkey, United Kingdom, United States
Organization of American States (OAS) Argentina, Bolivia, Brazil, Canada, Chile, Colombia, Costa Rica, Dominican Republic, Ecuador, El Salvador, Guatemala, Haiti, Honduras, Jamaica, Mexico, Nicaragua, Panama, Paraguay, Peru, Trinidad and Tobago, United States, Uruguay, Venezuela

The Global State of Democracy IndicesTechnical Procedures Guide
International IDEA
33
Annex D
Attributes, subattributes and indicators
TABLE D.1.
Attributes, subattributes, assessment questions and empirical indicators
Attributes Subattributes Assessment questions No. Indicators
1.Representative Government
1.1. Clean Elections To what extent are elections free from irregularities?
1.1.1 EMB autonomy
1.1.2 Election voter registry
1.1.3 Election other voting irregularities
1.1.4 Election government intimidation
1.1.5 Election free and fair
1.1.6 Competition
1.2. Inclusive Suffrage To what extent do all adult citizens have voting rights?
1.2.1 Suffrage
1.3. Free Political Parties
To what extent are political parties free to form and campaign for office?
1.3.1 Party ban
1.3.2 Barriers to parties
1.3.3 Opposition parties’ autonomy
1.3.4 Elections multiparty
1.3.5 Competitiveness of participation
1.3.6 Multiparty elections
1.3.7 Was opposition allowed?
1.3.8 Was more than one party legal?
1.3.9 Were opposition leaders prevented from running?
1.4. Elected Government
To what extent is access to government determined by elections?
1.4.1 Elected executive index
1.4.2 Competitiveness of executive recruitment
1.4.3 Openness of executive recruitment
1.4.4 Legislative elections
1.4.5 Executive elections
2.Fundamental Rights
2.1. Access to Justice To what extent is there equal, fair access to justice?
2.1.1 Access to justice for men
2.1.2 Access to justice for women
2.1.3 Judicial corruption decision
2.1.4 Judicial accountability
2.1.5 Fair trial
2.2. Civil Liberties To what extent are civil liberties respected?
Subcomponent 2.2.A: Freedom of Expression
2.2.1 Print/broadcast censorship effort
2.2.2 Harassment of journalists
2.2.3 Media self-censorship
2.2.4 Freedom of discussion for women
2.2.5 Freedom of discussion for men
2.2.6 Freedom of academic and cultural expression
2.2.7 Freedom of opinion and expression

The Global State of Democracy IndicesTechnical Procedures Guide
International IDEA
34
Attributes Subattributes Assessment questions No. Indicators
2.Fundamental Rights
2.2. Civil Liberties To what extent are civil liberties respected?
Subcomponent 2.2.B: Freedom of Association and Assembly
2.2.8 CSO entry and exit
2.2.9 CSO repression
2.2.10 Freedom of assembly and association
Subcomponent 2.2.C: Freedom of Religion
2.2.11 Freedom of religion
2.2.12 Religious organization repression
2.2.13 Freedom of thought, conscience and religion
Subcomponent 2.2.D: Freedom of Movement
2.2.14 Freedom of foreign movement
2.2.15 Freedom of domestic movement for women
2.2.16 Freedom of domestic movement for men
2.2.17 Freedom of movement and residence
Subcomponent 2.2.E: Personal Integrity and Security
2.2.18 Freedom from forced labour for women
2.2.19 Freedom from forced labour for men
2.2.20 Freedom from torture
2.2.21 Freedom from political killings
2.2.22 Human rights protection scores
2.2.23 Internal conflict
2.3. Social Rights and Equality
To what extent are basic welfare and social and political equality realized?
Subcomponent 2.3.A: Social Group Equality
2.3.1 Social class equality in respect for civil liberties
2.3.2 Social group equality in respect for civil liberties
2.3.3 Power distributed by socio-economic position
2.3.4 Power distributed by social group
2.3.5 Representation of disadvantaged social groups
Subcomponent 2.3.B: Basic Welfare
2.3.6 Infant mortality rate
2.3.7 Life expectancy
2.3.8 Kilocalories per person per day
2.3.9 Literacy
2.3.10 Mean years of schooling
2.3.11 Educational equality
2.3.12 Health equality
Subcomponent 2.3.C: Gender Equality
2.3.13 Power distributed by gender
2.3.14 CSO women’s participation
2.3.15 Female vs. male mean years of schooling
2.3.16 Lower chamber female legislators
2.3.17 Proportion of women in ministerial level positions

The Global State of Democracy IndicesTechnical Procedures Guide
International IDEA
35
Attributes Subattributes Assessment questions No. Indicators
3.Checks on Government
3.1. Effective Parliament
To what extent does parliament oversee the executive?
3.1.1 Legislature questions officials in practice
3.1.2 Executive oversight
3.1.3 Legislature investigates in practice
3.1.4 Legislature opposition parties
3.1.5 Executive constraints
3.2. Judicial Independence
To what extent are the courts independent?
3.2.1 High Court independence
3.2.2 Lower court independence
3.2.3 Compliance with High Court
3.2.4 Compliance with judiciary
3.2.5 Latent judicial independence
3.3. Media Integrity To what extent are there diverse, critical media?
3.3.1 Critical print/broadcast media
3.3.2 Print/broadcast media perspectives
3.3.3 Media bias
3.3.4 Media corrupt
3.3.5 Media freedom
4.Impartial Administration
4.1. Absence of Corruption
To what extent is the exercise of public authority free from corruption?
4.1.1 Public sector corrupt exchanges
4.1.2 Public sector theft
4.1.3 Executive embezzlement and theft
4.1.4 Executive bribery and corrupt exchanges
4.1.5 Corruption
4.2. Predictable Enforcement
To what extent is the enforcement of public authority predictable?
4.2.1 Executive respects constitution
4.2.2 Transparent laws with predictable enforcement
4.2.3 Rigorous and impartial public administration
4.2.4 Bureaucratic quality
5.Participatory Engagement
5.1. Civil Society Participation
To what extent do people participate in civil society organizations?
5.1.1 CSO participatory environment
5.1.2 Engaged society
5.2. Electoral Participation
To what extent do people participate in national elections?
5.2.1 Election voting age population (VAP) turnout
5.3. Direct DemocracyTo what extent are mechanisms of direct democracy available and used?
5.3.1 Direct popular vote index
5.4. Subnational Elections
To what extent are there free regional and local elections?
5.4.1 Local government elected
5.4.2 Regional government elected
5.4.3 Subnational elections free and fair

The Global State of Democracy IndicesTechnical Procedures Guide
International IDEA
36
TABLE D.2.
Overview of indicators and sources
No. Indicator Description / question Data set
1. Representative Government (free and equal access to political power)
1.1. Indicators of Clean Elections
1.1.1EMB autonomy(v2elembaut )
ES: Does the election management body (EMB) have autonomy from government to apply election laws and administrative rules impartially in national elections?
V-Dem
1.1.2Election voter registry (v2elrgstry)
ES: In this national election, was there a reasonably accurate voter registry in place and was it used?
V-Dem
1.1.3Election: other voting irregularities (v2elirreg)
ES: In this national election, was there evidence of other intentional irregularities by incumbent and/or opposition parties, and/or vote fraud?
V-Dem
1.1.4Election government intimidation(v2elintim)
ES: In this national election, were opposition candidates/parties/campaign workers subjected to repression, intimidation, violence or harassment by the government, the ruling party or their agents?
V-Dem
1.1.5Election free and fair(v2elfrfair)
ES: Taking all aspects of the pre-election period, election day and the post-election process into account, would you consider this national election to be free and fair?
V-Dem
1.1.6Competition(competitive elections)
IC: The chief executive offices and seats in the effective legislative body are filled by elections characterized by uncertainty, meaning that the elections are, in principle, sufficiently free to enable the opposition to gain power if it were to attract sufficient support from the electorate.
LIED
1.2. Indicators of Inclusive Suffrage
1.2.1Suffrage(v2elsuffrage)
OD: What percentage (%) of adult citizens (as defined by statute) has the legal right to vote in national elections?
V-Dem
1.3. Indicators of Free Political Parties
1.3.1Party ban(v2psparban)
ES: Are any political parties banned? V-Dem
1.3.2Barriers to parties(v2psbars)
ES: How restrictive are the barriers to forming a party? V-Dem
1.3.3Opposition parties’ autonomy(v2psoppaut)
ES: Are opposition parties independent and autonomous of the ruling regime?
V-Dem
1.3.4Elections multiparty(v2elmulpar)
ES: Was this national election multiparty? V-Dem
1.3.5Competitiveness of participation(parcomp)
IC: The competitiveness of participation refers to the extent to which alternative preferences for policy and leadership can be pursued in the political arena.
Polity
1.3.6Multiparty elections(multiparty legislative elections)
IC: The lower house (or unicameral chamber) of the legislature is (at least in part) elected by voters faced with more than one choice. Specifically, parties are not banned and more than one party is allowed to compete or elections are non-partisan (i.e. all candidates run without party labels).
LIED
1.3.7Was opposition allowed?(NELDA 3)
IC: At least one opposition political party existed to contest the election.NELDA
1.3.8Was more than one party legal?(NELDA 4)
IC: Multiple political parties were technically legalNELDA
1.3.9 Were opposition leaders prevented from running?(NELDA 13)
IC: At least some opposition leaders were prevented from running and contesting the elections; a decision to boycott the election if in response to the government preventing opposition figures from running; or opposition was not allowed.
NELDA

The Global State of Democracy IndicesTechnical Procedures Guide
International IDEA
37
No. Indicator Description / question Data set
1.4. Indicators of Elected Government
1.4.1Elected executive index(v2x_accex)
CM: Measure based on 12 variables from the V-Dem expert survey, in-house coding and observational data collected by V-Dem.1 V-Dem
1.4.2Competitivenessof executive recruitment(xrcomp)
IC: Competitiveness refers to the extent that prevailing modes of advancement give subordinates equal opportunities to become superordinates.
Polity
1.4.3Openness of executive recruitment(xropen)
IC: Recruitment of the chief executive is ‘open’ to the extent that all the politically active population has an opportunity, in principle, to attain the position through a regularized process.
Polity
1.4.4Legislative elections(legislative elections)
IC: A legislative body issues at least some laws and does not perform executive functions. The lower house (or unicameral chamber) of the legislature is at least partly elected. The legislature has not been closed.
LIED
1.4.5Executive elections(executive elections)
IC: The chief executive is either directly or indirectly elected (i.e. chosen by people who have been elected).
LIED
2. Fundamental Rights (individual liberties and resources)
2.1. Indicators of Access to Justice
2.1.1Access to justice for men(v2clacjstm)
ES: Do men enjoy secure and effective access to justice? V-Dem
2.1.2Access to justice for women(v2clacjstw)
ES: Do women enjoy equal, secure and effective access to justice? V-Dem
2.1.3Judicial corruption decision(v2jucorrdc)
ES: How often do individuals or businesses make undocumented extra payments or bribes in order to speed up or delay the process or to obtain a favourable judicial decision?
V-Dem
2.1.4Judicial accountability(v2juaccnt)
ES: When judges are found responsible for serious misconduct, how often are they removed from their posts or otherwise disciplined?
V-Dem
2.1.5Fair trial(fairtrial)
IC: Extent to which citizens have the right to a fair trial in practice, that is, they are not subjected to arbitrary arrest, detention or exile; they have the right to recognition as a person before the law, the right to be under the jurisdiction of, and to seek redress from, competent, independent and impartial tribunals, and the right to be heard; and they are entitled to trial without undue delay if arrested, detained or charged with a criminal offence.
CLD
2.2. Indicators of Civil Liberties
2.2.A. Freedom of Expression
2.2.1Print/ broadcast censorship effort (v2mecenefm)
ES: Does the government directly or indirectly attempt to censor the print or broadcast media?
V-Dem
2.2.2Harassment of journalists (v2meharjrn)
ES: Are individual journalists harassed; that is, threatened with libel, arrested, imprisoned, beaten or killed, by governmental or powerful non-governmental actors while engaged in legitimate journalistic activities?
V-Dem
2.2.3Mediaself-censorship(v2meslfcen)
ES: Is there self-censorship among journalists when reporting on issues that the government considers politically sensitive?
V-Dem
2.2.4Freedom of discussion for women (v2cldiscw)
ES: Are women able to openly discuss political issues in private homes and in public spaces?
V-Dem
2.2.5Freedom of discussion for men (v2cldiscm)
ES: Are men able to openly discuss political issues in private homes and in public spaces?
V-Dem
2.2.6Freedom of academic and cultural expression(v2clacfree)
ES: Is there academic freedom and freedom of cultural expression related to political issues?
V-Dem
2.2.7Freedom of opinion and expression(freexp)
IC: The extent to which individual citizens, groups and the media have freedom of opinion and expression, that is, the right of the citizens, groups and press to hold views freely and to seek, obtain and pass on information on political issues as broadly understood without being subject to actual limitations or restrictions.
CLD

The Global State of Democracy IndicesTechnical Procedures Guide
International IDEA
38
No. Indicator Description / question Data set
2.2.B. Freedom of Association and Assembly
2.2.8CSO entry and exit (v2cseeorgs)
ES: To what extent does the government achieve control over entry and exit by civil society organizations into public life?
V-Dem
2.2.9CSO repression (v2csreprss)
ES: Does the government attempt to repress civil society organizations? V-Dem
2.2.10Freedom of assembly and association(freass)
IC: The extent to which individuals and groups have freedom of assembly and association, that is, the right of citizens to gather freely and carry out peaceful demonstrations as well as to join, form and participate with other persons in political parties, cultural organizations, trade unions or the like of their choice without being subject to limitations or restrictions.
CLD
2.2.C. Freedom of Religion
2.2.11Freedom ofreligion (v2clrelig)
ES: Is there freedom of religion? V-Dem
2.2.12Religious organization repression (v2csrlgrep)
ES: Does the government attempt to repress religious organizations? V-Dem
2.2.13Freedom of thought, conscience and religion(frerel)
IC: The extent to which individuals and groups have freedom of thought, conscience and religion, that is, the right of the citizens to have and change their religion or belief of choice; and alone or in community manifest their religion or belief in practice, worship, observance and teaching, in private or public, as well as to proselytize peacefully without being subject to limitations or restrictions.
CLD
2.2.D. Freedom of Movement
2.2.14Freedom of foreignmovement (v2clfmove)
ES: Is there freedom of foreign travel and emigration?V-Dem
2.2.15Freedom of domestic movement for women(v2cldmovew)
ES: Do women enjoy freedom of movement within the country?V-Dem
2.2.16Freedom of domestic movement for men (v2cldmovem)
ES: Do men enjoy freedom of movement within the country?V-Dem
2.2.17Freedom of movement and residence(fremov)
IC: The extent to which individuals and groups have freedom of movement and residence, that is, the right of citizens to settle and travel in their country as well as to leave and return to their country of their own volition without being subject to limitations or restrictions.
CLD
2.2.E. Personal Integrity and Security
2.2.18Freedom from forced labour for women (v2clslavef)
ES: Are adult women free from servitude and other kinds of forced labour? V-Dem
2.2.19Freedom from forced labour for men (v2clslavem)
ES: Are adult men free from servitude and other kinds of forced labour? V-Dem
2.2.20Freedom from torture (v2cltort)
ES: Is there freedom from torture? V-Dem
2.2.21Freedom from political killings (v2clkill)
ES: Is there freedom from political killings? V-Dem
2.2.22 Human rights protection scoresMeasure based on 13 in-house coded variables from nine different data sets.2 Fariss
2.2.23Internal conflict(D)
ES: Is there political violence in the country? The rating assigned is the sum of three subcomponents: civil war/coup threat, terrorism/political violence and civil disorder
ICRG

The Global State of Democracy IndicesTechnical Procedures Guide
International IDEA
39
No. Indicator Description / question Data set
2.3. Indicators of Social Rights and Equality
2.3.A. Social Group Equality
2.3.1Social class equality in respect for civil liberties(v2clacjust)
ES: Do poor people enjoy the same level of civil liberties as rich people do? V-Dem
2.3.2Social group equality in respect for civil liberties(v2clsocgrp)
ES: Do all social groups, as distinguished by language, ethnicity, religion, race, region or caste, enjoy the same level of civil liberties, or are some groups generally in a more favourable position?
V-Dem
2.3.3Power distributed by socio-economic position(v2pepwrses)
ES: Is political power distributed according to socio-economic position? V-Dem
2.3.4Power distributed by social group(v2pepwrsoc)
ES: Is political power distributed according to social groups? V-Dem
2.3.5Representation of disadvantaged social groups (v2lgdsadlo)
ES: Considering all disadvantaged social groups in the country, how well represented are these groups, as a whole, in the national legislature?
V-Dem
2.3.B. Basic Welfare
2.3.6 Infant mortality rate OD Gapminder
2.3.7 Life expectancy OD Gapminder
2.3.8 Kilocalories per person per day OD FAO
2.3.9 Literacy OD UNESCO
2.3.10 Mean years of schooling OD GHDx
2.3.11Educational equality(v2peedueq)
ES: To what extent is high quality basic education guaranteed to all, sufficient to enable them to exercise their basic rights as adult citizens?
V-Dem
2.3.12Health equality(v2pehealth)
ES: To what extent is high quality basic health care guaranteed to all, sufficient to enable them to exercise their basic political rights as adult citizens?
V-Dem
2.3.C. Gender Equality
2.3.13Power distributed by gender(v2pepwrgen)
ES: Is political power distributed according to gender? V-Dem
2.3.14CSO women’s participation(v2csgender)
ES: Are women prevented from participating in civil society organizations? V-Dem
2.3.15Female vs. male mean years of schooling
OD GHDx
2.3.16Lower chamber female legislators(v2lgfemleg)
ODV-Dem
2.3.17Proportion of women in ministerial level positions
OD IPU

The Global State of Democracy IndicesTechnical Procedures Guide
International IDEA
40
No. Indicator Description / question Data set
3. Checks on Government (effective control of executive power)
3.1. Indicators of Effective Parliament
3.1.1Legislature questions officials in practice(v2lgqstexp)
ES: In practice, does the legislature routinely question executive branch officials?
V-Dem
3.1.2.Executive oversight(v2lgotovst)
ES: If executive branch officials were engaged in unconstitutional, illegal or unethical activity, how likely is it that a body other than the legislature, such as a comptroller general, general prosecutor or ombudsman, would question or investigate them and issue an unfavourable decision or report?
V-Dem
3.1.3Legislature investigates in practice(v2lginvstp)
ES: If the executive were engaged in unconstitutional, illegal or unethical activity, how likely is it that a legislative body (perhaps a whole chamber, perhaps a committee, whether aligned with government or opposition) would conduct an investigation that would result in a decision or report that is unfavourable to the executive?
V-Dem
3.1.4Legislature opposition parties(v2lgoppart)
ES: Are opposition parties (those not in the ruling party or coalition) able to exercise oversight and investigatory functions against the wishes of the governing party or coalition?
V-Dem
3.1.5Executive constraints(xconst)
IC: The extent of institutionalized constraints on the decision-making powers of chief executives, whether individuals or collectivities.
Polity
3.2. Indicators of Judicial Independence
3.2.1High Court independence(v2juhcind)
ES: When the High Court in the judicial system is ruling in cases that are salient to the government, how often would you say that it makes decisions that merely reflect government wishes regardless of its sincere view of the legal record?
V-Dem
3.2.2Lower court independence(v2juncind)
ES: When judges not on the High Court are ruling in cases that are salient to the government, how often would you say that their decisions merely reflect government wishes regardless of their sincere view of the legal record?
V-Dem
3.2.3Compliance with High Court(v2juhccomp)
ES: How often would you say the government complies with important decisions of the High Court with which it disagrees?
V-Dem
3.2.4Compliance with judiciary(v2jucomp)
ES: How often would you say the government complies with important decisions by other courts with which it disagrees?
V-Dem
3.2.5 Latent judicial independenceCM: Measure based on seven in-house coded variables and one observational variable from eight different data sets.3 Linzer / Staton
3.3. Indicators of Media Integrity
3.3.1Print/broadcast media critical(v2mecrit)
ES: Of the major print and broadcast media outlets, how many routinely criticize the government?
V-Dem
3.3.2Print/broadcast media perspectives(v2merange)
ES: Do the major print and broadcast media represent a wide range of political perspectives?
V-Dem
3.3.3Media bias(v2mebias)
ES: Is there media bias against opposition parties or candidates? V-Dem
3.3.4Media corrupt(v2mecorrpt)
ES: Do journalists, publishers or broadcasters accept payments in exchange for altering news coverage?
V-Dem
3.3.5 Media freedomIC: Is criticism of government and government officials a common and normal part of the political dialogue in the mediated public sphere?
Media Freedom Data

The Global State of Democracy IndicesTechnical Procedures Guide
International IDEA
41
No. Indicator Description / question Data set
4. Impartial Administration (fair and predictable public administration)
4.1. Indicators of Absence of Corruption
4.1.1Public sector corrupt exchanges(v2excrptps)
ES: How routinely do public sector employees grant favours in exchange for bribes, kickbacks or other material inducements?
V-Dem
4.1.2Public sector theft(v2exthftps)
ES: How often do public sector employees steal, embezzle or misappropriate public funds or other state resources for personal or family use?
V-Dem
4.1.3Executive embezzlement and theft (v2exembez)
ES: How often do members of the executive (the head of state, head of government and cabinet ministers) or their agents steal, embezzle or misappropriate public funds or other state resources for personal or family use?
V-Dem
4.1.4Executive bribery and corrupt exchanges(v2exbribe)
ES: How routinely do members of the executive (the head of state, the head of government and cabinet ministers) or their agents grant favours in exchange for bribes, kickbacks or other material inducements?
V-Dem
4.1.5Corruption(F)
ES: How widespread is actual or potential corruption in the form of excessive patronage, nepotism, job reservations, ‘favour-for-favours’, secret party funding and suspiciously close ties between politics and business?
ICRG
4.2. Indicators of Predictable Enforcement
4.2.1 Executive respects constitution(v2exrescon)
ES: Do members of the executive (the head of state, the head of government and cabinet ministers) respect the constitution?
V-Dem
4.2.2Transparent laws with predictable enforcement(v2cltrnslw)
ES: Are the laws of the land clear, well-publicized, coherent (consistent with each other), relatively stable from year to year and enforced in a predictable manner?
V-Dem
4.2.3Rigorous and impartial public administration(v2clrspct)
ES: Are public officials rigorous and impartial in the performance of their duties?
V-Dem
4.2.4Bureaucratic quality(L)
ES: Bureaucracy has the strength and expertise to govern without drastic changes in policy or interruptions in government services.
ICRG
5. Participatory Engagement (instruments for and realization of political involvement)
5.1. Indicators of Civil Society Participation
5.1.1CSO participatory environment(v2csprtcpt)
ES: Are people involved in civil society organizations (CSOs)? V-Dem
5.1.2Engaged society(v2dlengage)
ES: When important policy changes are being considered, how wide and how independent are public deliberations?
V-Dem
5.2. Indicators of Electoral Participation
5.2.1Election: VAP turnout(v2elvaptrn)
OD V-Dem
5.3. Indicators of Direct Democracy
5.3.1Direct popular vote index(v2xdd_dd)
CM: Measure based on 12 observable variables from V-Dem. It results from the combination of scores for each type of popular vote (popular initiatives, referendums, plebiscites and obligatory referendums). The measure captures how easy it is to initiate and approve each type of popular vote, and how consequential that vote is if approved. Ease of initiation is measured by the existence of a direct democratic process, the number of signatures needed, and time limits to collect signatures. Ease of approval is measured by quorums pertaining to participation, approval, supermajority and district majority. Consequences are measured by the legal status of the decision made by citizens (binding or consultative) and the frequency with which direct popular votes have been used and approved in the past.
V-Dem

The Global State of Democracy IndicesTechnical Procedures Guide
International IDEA
42
No. Indicator Description / question Data set
5.4. Indicators of Subnational Elections
5.4.1Local government elected(v2ellocelc)
IC: At the local level, are government (local government) offices elected in practice?
V-Dem
5.4.2Regional government elected(v2elsrgel)
IC: At the regional level, are government offices elected in practice? V-Dem
5.4.3Subnational elections free and fair(v2elffelr)
ES: Taking all aspects of the pre-election period, election day and the post-election process into account, would you consider subnational elections (regional and local, as previously identified) to be free and fair on average?
V-Dem
Note: ES = expert surveys; IC = standards-based in-house coding; OD = observational data; CM = composite measures.
1 The 15 variables are: legislature closed down or aborted, lower chamber elected, upper chamber elected, legislature dominant chamber, head of state selection by legislature in practice, head of state appointment in practice, head of government selection by legislature in practice, head of government appointment in practice, head of state appoints cabinet in practice, head of government appoints cabinet in practice, head of state dismisses ministers in practice, head of government dismisses ministers in practice, head of state also head of government, chief executive appointment by upper chamber explicit approval, chief executive appointment by upper chamber.
2 The nine data sets are: the CIRI physical integrity data (extrajudicial killings, disappearances, torture, political imprisonment) (Cingranelli and Richards 2014); Hathaway torture data (Hathawa, 2002); Ill-treatment and Torture(Conrad et al 2013); Political Terror Scale (Gilby and Dalton 1996); Mass-repression (Harff and Gurr 1998); Political Instability Task Force (PITF) (Marshal et al 2017); (PITF); Genocide and Democide (Rummel 1994a and 1994b); Uppsala Conflict Data Program One-sided Killing)(Sundberg 2009) (UCDP); World Handbook of Political and Social Indicators (Political Executions) (WHPSI)Taylor and Jodice 1983).
3 The variables are de facto judicial independence (Feld and Voigt 2003; Gwartney and Lawson 2007; Keith 2012; Howard and Carey 2004; Cingranelli and Richards 2014), contract intensive money (Clauge et al 1999), constraints on the executive (Marshall et al 2016) and law and order (Howell 2011).

The Global State of Democracy IndicesTechnical Procedures Guide
International IDEA
43
TABLE D.3
Indicator summary
ID Indicator Data set Variable Missing (N) Missing (%) Year (min) Year (max)
1.1.1 EMB autonomy V-Dem V2elembaut 0 0.00% 1975 2015
1.1.2 Election voter registry V-Dem V2elrgstry 3 0.05% 1975 2015
1.1.3 Election: other voting irregularities V-Dem V2elirreg 3 0.05% 1975 2015
1.1.4 Election government intimidation V-Dem V2elintim 3 0.05% 1975 2015
1.1.5 Election free and fair V-Dem V2elfrfair 3 0.05% 1975 2015
1.1.6 Competition LIEDcompetitive
elections4 0.07% 1975 2015
1.2.1 Suffrage V-Dem v2elsuffrage 0 0.00% 1975 2015
1.3.1 Party ban V-Dem v2psparban 0 0.00% 1975 2015
1.3.2 Barriers to parties V-Dem v2psbars 0 0.00% 1975 2015
1.3.3 Opposition parties’ autonomy V-Dem v2psoppaut 130 2.21% 1975 2015
1.3.4 Elections multiparty V-Dem v2elmulpar 3 0.05% 1975 2015
1.3.5 Competitiveness of participation Polity parcomp 277 4.70% 1975 2015
1.3.6 Multiparty elections LIEDmulti-party elections
4 0.07% 1975 2015
1.3.7 Was opposition allowed? NELDA NELDA 3 71 1.20% 1975 2015
1.3.8 Was more than one party legal? NELDA NELDA 4 71 1.20% 1975 2015
1.3.9 Were opposition leaders prevented from running? NELDA NELDA 13 190 3.22% 1975 2015
1.4.1 Elected executive index V-Dem v2x_elecoff 1 0.02% 1975 2015
1.4.2 Competitiveness of executive recruitment Polity xrcomp 277 4.70% 1975 2015
1.4.3 Openness of executive recruitment Polity xropen 277 4.70% 1975 2015
1.4.4 Legislative elections LIED Leg. elections 4 0.07% 1975 2015
1.4.5 Executive elections LIED Exec. elections 4 0.07% 1975 2015
2.1.1 Access to justice for men V-Dem v2clacjstm 0 0.00% 1975 2015
2.1.2 Access to justice for women V-Dem v2clacjstw 0 0.00% 1975 2015
2.1.3 Judicial corruption decision V-Dem v2jucorrdc 0 0.00% 1975 2015
2.1.4 Judicial accountability V-Dem v2juaccnt 0 0.00% 1975 2015
2.1.5 Fair trial CLD fairtrial 18 0.31% 1975 2015
2.2.1 Print/ broadcast censorship V-Dem v2mecenefm 3 0.05% 1975 2015
2.2.2 Harassment of journalists V-Dem v2meharjrn 3 0.05% 1975 2015
2.2.3 Media self-censorship V-Dem v2meslfcen 3 0.05% 1975 2015
2.2.4 Freedom of discussion for women V-Dem v2cldiscw 0 0.00% 1975 2015
2.2.5 Freedom of discussion for men V-Dem v2cldiscm 0 0.00% 1975 2015
2.2.6 Freedom of academic and cultural expression V-Dem v2clacfree 0 0.00% 1975 2015

The Global State of Democracy IndicesTechnical Procedures Guide
International IDEA
44
ID Indicator Data set Variable Missing (N) Missing (%) Year (min) Year (max)
2.2.7 Freedom of opinion and expression CLD freexp 18 0.31% 1975 2015
2.2.8 CSO entry and exit V-Dem v2cseeorgs 0 0.00% 1975 2015
2.2.9 CSO repression V-Dem v2csreprss 3 0.05% 1975 2015
2.2.10 Freedom of assembly and association CLD freass 18 0.31% 1975 2015
2.2.11 Freedom of religion V-Dem v2clrelig 0 0.00% 1975 2015
2.2.12 Religious organization repression V-Dem v2csrlgrep 3 0.05% 1975 2015
2.2.13 Freedom of thought, conscience and religion CLD frerel 18 0.31% 1975 2015
2.2.14 Freedom of foreign movement V-Dem v2clfmove 0 0.00% 1975 2015
2.2.15 Freedom of domestic movement for women V-Dem v2cldmovew 0 0.00% 1975 2015
2.2.16 Freedom of domestic movement for men V-Dem v2cldmovem 0 0.00% 1975 2015
2.2.17 Freedom of movement and residence CLD fremov 18 0.31% 1975 2015
2.2.18 Freedom from forced labour for women V-Dem v2clslavef 0 0.00% 1975 2015
2.2.19 Freedom from forced labour for men V-Dem v2clslavem 0 0.00% 1975 2015
2.2.20 Freedom from torture V-Dem v2cltort 0 0.00% 1975 2015
2.2.21 Freedom from political killings V-Dem v2clkill 0 0.00% 1975 2015
2.2.22 Human rights protection scores Fariss latentmean 311 5.28% 1975 2013
2.2.23 Internal conflict ICRG D 1932 32.78% 1984 2015
2.3.1 Social class equality in respect for civil liberties V-Dem v2clacjust 0 0.00% 1975 2015
2.3.2 Social group equality in respect for civil liberties V-Dem v2clsocgrp 0 0.00% 1975 2015
2.3.3 Power distributed by socio-economic position V-Dem v2pepwrses 0 0.00% 1975 2015
2.3.4 Power distributed by social group V-Dem v2pepwrsoc 0 0.00% 1975 2015
2.3.5 Representation of disadvantaged social groups V-Dem v2lgdsadlo 468 7.94% 1975 2015
2.3.6 Infant mortality rate Gapminder --- 52 0.88% 1975 2015
2.3.7 Life expectancy Gapminder --- 24 0.41% 1975 2015
2.3.8 Kilocalories per person per day FAOSTAT --- 380 6.45% 1975 2015
2.3.9 Literacy UNESCO --- 2453 41.62% 1975 2015
2.3.10 Average years of schooling GHDx --- 24 0.41% 1975 2015
2.3.11 Educational equality V-Dem v2peedueq 0 0.00% 1975 2015
2.3.12 Health equality V-Dem v2pehealth 0 0.00% 1975 2015
2.3.13 Power distributed by gender V-Dem v2pepwrgen 0 0.00% 1975 2015
2.3.14 CSO women’s participation V-Dem v2csgender 3 0.05% 1975 2015
2.3.15 Female vs. male mean years of schooling GHDx — 24 0.41% 1975 2015
2.3.16 Lower chamber female legislators V-Dem v2lgfemleg 296 5.02% 1975 2015
2.3.17 Proportion of women in ministerial level positions IPU — 1709 29.00% 1987 2015
3.1.1 Legislature questions officials in practice V-Dem v2lgqstexp 468 7.94% 1975 2015

The Global State of Democracy IndicesTechnical Procedures Guide
International IDEA
45
ID Indicator Data set Variable Missing (N) Missing (%) Year (min) Year (max)
3.1.2 Executive oversight V-Dem v2lgotovst 469 7.96% 1975 2015
3.1.3 Legislature investigates in practice V-Dem v2lginvstp 468 7.94% 1975 2015
3.1.4 Legislature opposition parties V-Dem v2lgoppart 467 7.92% 1975 2015
3.1.5 Executive constraints Polity xconst 277 4.70% 1975 2015
3.2.1 High Court independence V-Dem v2juhcind 0 0.00% 1975 2015
3.2.2 Lower court independence V-Dem v2juncind 0 0.00% 1975 2015
3.2.3 Compliance with High Court V-Dem v2juhccomp 0 0.00% 1975 2015
3.2.4 Compliance with judiciary V-Dem v2jucomp 0 0.00% 1975 2015
3.2.5 Latent judicial independenceLinzer / Staton
--- 488 8.28% 1975 2012
3.3.1 Print/broadcast media critical V-Dem v2mecrit 3 0.05% 1975 2015
3.3.2 Print/broadcast media perspectives V-Dem v2merange 3 0.05% 1975 2015
3.3.3 Media bias V-Dem v2mebias 3 0.05% 1975 2015
3.3.4 Media corrupt V-Dem v2mecorrpt 3 0.05% 1975 2015
3.3.5 Media freedom MFD --- 11 0.19% 1975 2015
4.1.1 Public sector corrupt exchanges V-Dem v2excrptps 0 0.00% 1975 2015
4.1.2 Public sector theft V-Dem v2exthftps 0 0.00% 1975 2015
4.1.3 Executive embezzlement and theft V-Dem v2exembez 0 0.00% 1975 2015
4.1.4 Executive bribery and corrupt exchanges V-Dem v2exbribe 0 0.00% 1975 2015
4.1.5 Corruption ICRG F 1932 32.78% 1984 2015
4.2.1 Executive respects constitution V-Dem v2exrescon 0 0.00% 1975 2015
4.2.2 Transparent laws with predictable enforcement V-Dem v2cltrnslw 0 0.00% 1975 2015
4.2.3 Rigorous and impartial public administration V-Dem v2clrspct 0 0.00% 1975 2015
4.2.4 Bureaucratic quality ICRG L 1932 32.78% 1984 2015
5.1.1 CSO participatory environment V-Dem v2csprtcpt 3 0.05% 1975 2015
5.1.2 Engaged society V-Dem v2dlengage 0 0.00% 1975 2015
5.2.1 Election: VAP turnoutV-Dem /
IDEAv2elvaptrn 688 11.67% 1975 2015
5.3.1 Direct popular vote index V-Dem v2xdd_dd 0 0.00% 1975 2015
5.4.1 Local government elected V-Dem v2ellocelc 126 2.14% 1975 2015
5.4.2 Regional government elected V-Dem v2elsrgel 467 7.92% 1975 2015
5.4.3 Subnational elections free and fair V-Dem v2elffelr 1135 19.26% 1975 2015

The Global State of Democracy IndicesTechnical Procedures Guide
International IDEA
46
Factor loadings and Cronbach’s alpha values
Attribute 1: Representative Government
No. Component Loading SE Uniqueness SE Cronbach’s alpha if item deleted
1.1 Clean Elections 0.947 0.000 0.103 0.000 .845
1.3 Free Political Parties -0.944 0.000 0.111 0.000 .880
1.4 Elected Officials -0.837 0.000 0.299 0.000 .926
Cronbach’s alpha = .934
1.1. Clean Elections
No. Component Loading SE Uniqueness SE Cronbach’s alpha if item deleted
1.1.1 EMB autonomy -0.948 0.000 0.102 0.000 .930
1.1.2 Election voter registry -0.887 0.000 0.214 0.000 .939
1.1.3 Election other voting irregularities -0.879 0.000 0.228 0.000 .939
1.1.4 Election government intimidation -0.963 0.000 0.074 0.000 .933
1.1.5 Election free and fair -0.980 0.000 0.041 0.000 .928
1.1.6 Competition -0.812 0.000 0.341 0.000 .971
Cronbach’s alpha = .967
Annex E
Dimensionality testsThe empirical dimensionality of the indicators selected to capture latent theoretical concepts at all aggregation levels were assessed using Bayesian factor analysis models. For each model, the first 5,000 iterations of the chain were discarded and the next 100,000 iterations selected. Saving each 100th iteration of the chain produced a data set of 1000 estimates for the parameters of interest in the models. As a general strategy, Bayesian factor analysis models were estimated by asking for a single factor. Two- and in some cases three-factor models were also run but none of these showed a better general fit with regard to capturing the empirical dimensionality in the data than the unidimensional solutions. Moreover, Cronbach’s Alpha (CA) was calculated as a measure of scalability. To inform the choices made, the pairwise bivariate correlation coefficients (Pearson’s r) were also calculated for each cluster of indicators. These are presented in Annex F. The tables in this Annex include, for each indicator, the loadings and their corresponding standard error, the uniqueness coefficients and their corresponding standard errors, and the Cronbach’s Alpha coefficients computed for the scale with the item deleted.

The Global State of Democracy IndicesTechnical Procedures Guide
International IDEA
47
1.3. Free Political Parties
No. Component Loading SE Uniqueness SE Cronbach’s alpha if item deleted
1.3.1 Party ban -0.843 0.000 0.291 0.000 .954
1.3.2 Barriers to parties -0.888 0.000 0.213 0.000 .952
1.3.3 Opposition parties’ autonomy -0.874 0.000 0.239 0.000 .953
1.3.4 Elections multiparty -0.898 0.000 0.196 0.000 .951
1.3.5 Competitiveness of participation -0.867 0.000 0.249 0.000 .953
1.3.6 Multiparty elections -0.860 0.000 0.261 0.000 .951
1.3.7 Was opposition allowed? -0.842 0.000 0.292 0.000 .951
1.3.8 Was more than one party legal? -0.860 0.000 0.262 0.000 .950
1.3.9Were opposition leaders prevented from running?
-0.824 0.000 0.323 0.000 .954
Cronbach’s alpha = .963
1.4. Elected Government
No. Component Loading SE Uniqueness SE Cronbach’s alpha if item deleted
1.4.1 Elected executive index -0.803 0.000 0.357 0.000 .803
1.4.2Competitiveness of executive recruitment
-0.569 0.000 0.676 0.000 .854
1.4.3 Openness of executive recruitment -0.639 0.000 0.592 0.000 .834
1.4.4 Legislative elections -0.781 0.000 0.390 0.000 .828
1.4.5 Executive elections -0.907 0.000 0.179 0.000 .796
Cronbach’s alpha = .860
Attribute 2: Fundamental Rights
No. Component Loading SE Uniqueness SE Cronbach’s alpha if item deleted
2.1 Access to Justice -0.944 0.000 0.109 0.000 .847
2.2 Civil Liberties 0.909 0.000 0.174 0.000 .878
2.3 Social Rights 0.829 0.000 0.311 0.000 .916
Cronbach’s alpha = .922

The Global State of Democracy IndicesTechnical Procedures Guide
International IDEA
48
2.1. Access to Justice
No. Component Loading SE Uniqueness SE Cronbach’s alpha if item deleted
2.1.1 Access to justice for men 0.980 0.000 0.041 0.000 .880
2.1.2 Access to justice for women 0.960 0.000 0.080 0.000 .883
2.1.3 Judicial corruption decision 0.675 0.000 0.545 0.000 .899
2.1.4 Judicial accountability 0.638 0.000 0.593 0.000 .910
2.1.5 Fair trial 0.856 0.000 0.268 0.000 .892
Cronbach’s alpha = .924
2.2. Civil Liberties
No. Component Loading SE Uniqueness SE Cronbach’s alpha if item deleted
2.2.A Freedom of expression 0.984 0.000 0.032 0.000 .937
2.2.B Freedom of association and assembly 0.956 0.000 0.086 0.000 .943
2.2.C Freedom of religion 0.853 0.000 0.272 0.000 .954
2.2.D Freedom of movement 0.892 0.000 0.205 0.000 .949
2.2.E Personal integrity and security -0.865 0.000 0.253 0.000 .957
Cronbach’s alpha = .961
2.2.A. Freedom of expression
No. Component Loading SE Uniqueness SE Cronbach’s alpha if item deleted
2.2.1 Print/ broadcast censorship effort -0.938 0.000 0.120 0.000 .966
2.2.2 Harassment of journalists -0.920 0.000 0.154 0.000 .968
2.2.3 Media self-censorship -0.912 0.000 0.170 0.000 .969
2.2.4 Freedom of discussion for women -0.960 0.000 0.079 0.000 .967
2.2.5 Freedom of discussion for men -0.963 0.000 0.074 0.000 .967
2.2.6Freedom of academic and cultural expression
-0.926 0.000 0.143 0.000 .969
2.2.7 Freedom of opinion and expression -0.860 0.000 0.261 0.000 .977
Cronbach’s alpha = .977

The Global State of Democracy IndicesTechnical Procedures Guide
International IDEA
49
2.2.B. Freedom of association and assembly
No. Component Loading SE Uniqueness SE Cronbach’s alpha if item deleted
2.2.8 CSO entry and exit -0.959 0.000 0.080 0.000 .854
2.2.9 CSO repression -0.933 0.000 0.130 0.000 .874
2.2.10 Freedom of assembly and association -0.867 0.000 0.249 0.000 .944
Cronbach’s alpha = .942
2.2.C. Freedom of religion
No. Component Loading SE Uniqueness SE Cronbach’s alpha if item deleted
2.2.11 Freedom of religion -0.935 0.000 0.126 0.000 .804
2.2.12 Religious organization repression -0.885 0.000 0.217 0.000 .833
2.2.13Freedom of thought, conscience and religion
-0.786 0.000 0.383 0.000 .905
Cronbach’s alpha = .901
2.2.D. Freedom of movement
No. Component Loading SE Uniqueness SE Cronbach’s alpha if item deleted
2.2.14 Freedom of foreign movement -0.900 0.000 0.190 0.000 .855
2.2.15Freedom of domestic movement for women
-0.891 0.000 0.205 0.000 .873
2.2.16 Freedom of domestic movement for men -0.907 0.000 0.176 0.000 .872
2.2.17 Freedom of movement and residence -0.784 0.000 0.385 0.000 .924
Cronbach’s alpha = .926
2.2.E. Personal integrity and security
No. Component Loading SE Uniqueness SE Cronbach’s alpha if item deleted
2.2.18 Freedom from forced labour for women 0.717 0.000 0.488 0.000 .903
2.2.19 Freedom from forced labour for men 0.682 0.000 0.537 0.000 .908
2.2.20 Freedom from torture 0.938 0.000 0.123 0.000 .891
2.2.21 Freedom from political killings 0.956 0.000 0.088 0.000 .888
2.2.22 Human rights protection scores 0.848 0.000 0.282 0.000 .894
2.2.23 Internal conflict 0.634 0.000 0.598 0.000 .924
Cronbach’s alpha = .918

The Global State of Democracy IndicesTechnical Procedures Guide
International IDEA
50
2.3. Social Rights and Equality
No. Component Loading SE Uniqueness SE Cronbach’s alpha if item deleted
2.3.A Social group equality -0.796 0.000 0.367 0.000 .787
2.3.B Basic welfare -0.752 0.000 0.434 0.000 .818
2.3.C Gender equality -0.871 0.000 0.242 0.000 .746
Cronbach’s alpha = .847
2.3.A. Social group equality
No. Component Loading SE Uniqueness SE Cronbach’s alpha if item deleted
2.3.1Social class equality in respect for civil liberties
-0.888 0.000 0.212 0.000 .820
2.3.2Social group equality in respect for civil liberties
-0.781 0.000 0.391 0.000 .846
2.3.3Power distributed by socio-economic position
-0.787 0.000 0.381 0.000 .836
2.3.4 Power distributed by social group -0.784 0.000 0.386 0.000 .840
2.3.5Representation of disadvantaged social groups
-0.573 0.000 0.671 0.000 .883
Cronbach’s alpha = .873
2.3.B. Basic welfare
No. Component Loading SE Uniqueness SE Cronbach’s alpha if item deleted
2.3.6 Infant mortality rate -0.978 0.000 0.046 0.000 .910
2.3.7 Life expectancy -0.893 0.000 0.205 0.000 .922
2.3.8 Kilocalories per person per day -0.706 0.001 0.503 0.000 .932
2.3.9 Literacy -0.861 0.000 0.261 0.000 .917
2.3.10 Average years of schooling -0.852 0.000 0.277 0.000 .919
2.3.11 Educational equality -0.656 0.001 0.572 0.000 .930
2.3.12 Health equality -0.711 0.001 0.497 0.000 .925
Cronbach’s alpha = .933
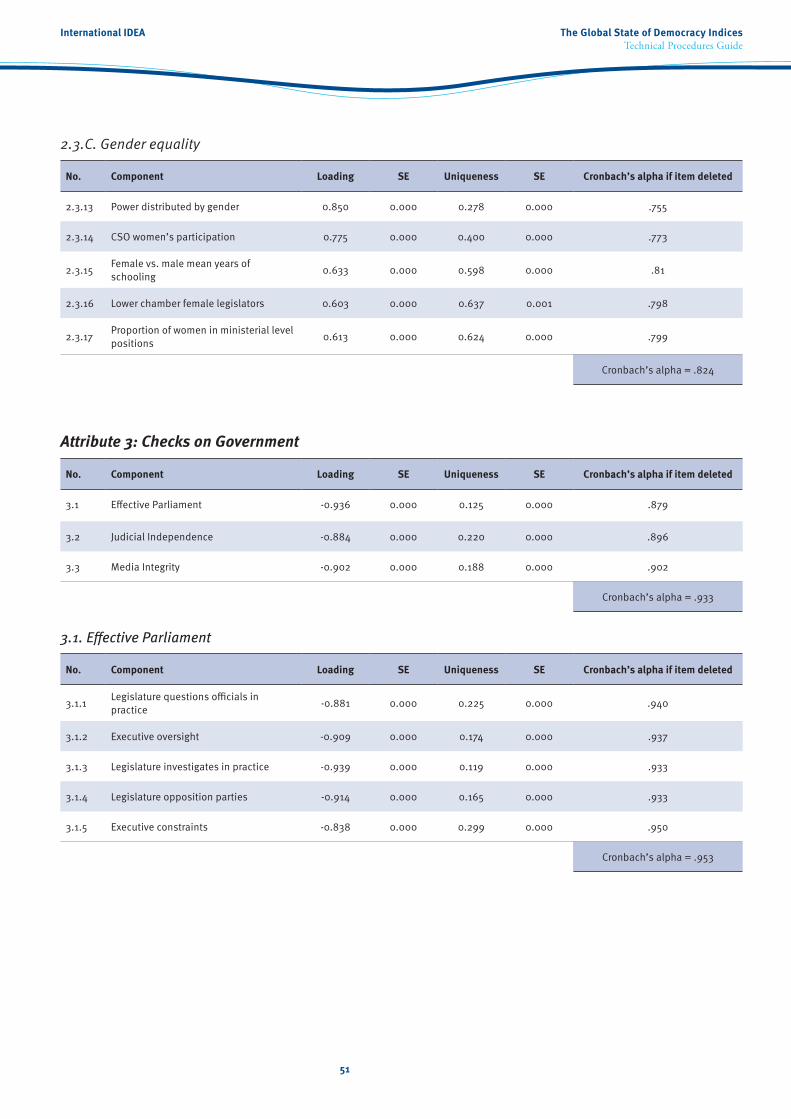
The Global State of Democracy IndicesTechnical Procedures Guide
International IDEA
51
3.2 Judicial Independence -0.884 0.000 0.220 0.000 .896
3.3 Media Integrity -0.902 0.000 0.188 0.000 .902
Cronbach’s alpha = .933
3.1. Effective Parliament
No. Component Loading SE Uniqueness SE Cronbach’s alpha if item deleted
3.1.1Legislature questions officials in practice
-0.881 0.000 0.225 0.000 .940
3.1.2 Executive oversight -0.909 0.000 0.174 0.000 .937
3.1.3 Legislature investigates in practice -0.939 0.000 0.119 0.000 .933
3.1.4 Legislature opposition parties -0.914 0.000 0.165 0.000 .933
3.1.5 Executive constraints -0.838 0.000 0.299 0.000 .950
Cronbach’s alpha = .953
2.3.C. Gender equality
No. Component Loading SE Uniqueness SE Cronbach’s alpha if item deleted
2.3.13 Power distributed by gender 0.850 0.000 0.278 0.000 .755
2.3.14 CSO women’s participation 0.775 0.000 0.400 0.000 .773
2.3.15Female vs. male mean years of schooling
0.633 0.000 0.598 0.000 .81
2.3.16 Lower chamber female legislators 0.603 0.000 0.637 0.001 .798
2.3.17Proportion of women in ministerial level positions
0.613 0.000 0.624 0.000 .799
Cronbach’s alpha = .824
Attribute 3: Checks on Government
No. Component Loading SE Uniqueness SE Cronbach’s alpha if item deleted
3.1 Effective Parliament -0.936 0.000 0.125 0.000 .879

The Global State of Democracy IndicesTechnical Procedures Guide
International IDEA
52
3.2. Judicial Independence
No. Component Loading SE Uniqueness SE Cronbach’s alpha if item deleted
3.2.1 High Court independence -0.878 0.000 0.229 0.000 .934
3.2.2 Lower court independence -0.872 0.000 0.241 0.000 .936
3.2.3 Compliance with High Court -0.916 0.000 0.163 0.000 .933
3.2.4 Compliance with judiciary -0.918 0.000 0.158 0.000 .932
3.2.5 Latent judicial independence -0.843 0.000 0.291 0.000 .943
Cronbach’s alpha = .948
3.3. Media Integrity
No. Component Loading SE Uniqueness SE Cronbach’s alpha if item deleted
3.3.1 Critical print/broadcast media 0.960 0.000 0.079 0.000 .908
3.3.2 Print/broadcast media perspectives 0.954 0.000 0.090 0.000 .908
3.3.3 Media bias 0.951 0.000 0.096 0.000 .910
3.3.4 Media corrupt 0.895 0.000 0.200 0.000 .913
3.3.5 Media freedom 0.751 0.000 0.437 0.000 .967
Cronbach’s alpha = .956
Attribute 4: Impartial Administration
No. Component Loading SE Uniqueness SE Cronbach’s alpha if item deleted
4.1 Absence of Corruption 0.879 0.015 0.225 0.027 ——
4.2 Predictable Enforcement 0.948 0.016 0.100 0.031 ——
Cronbach’s alpha = .907
4.1. Absence of Corruption
No. Component Loading SE Uniqueness SE Cronbach’s alpha if item deleted
4.1.1 Public sector corrupt exchanges 0.955 0.000 0.089 0.000 .930
4.1.2 Public sector theft 0.955 0.000 0.089 0.000 .930
4.1.3 Executive embezzlement and theft 0.934 0.000 0.128 0.000 .931
4.1.4 Executive bribery and corrupt exchanges 0.898 0.000 0.193 0.000 .936
4.1.5 Corruption 0.706 0.000 0.503 0.000 .966
Cronbach’s alpha = .950

The Global State of Democracy IndicesTechnical Procedures Guide
International IDEA
53
4.2. Predictable Enforcement
No. Component Loading SE Uniqueness SE Cronbach’s alpha if item deleted
4.2.1 Executive respects constitution 0.868 0.000 0.247 0.000 .887
4.2.2Transparent laws with predictable enforcement
0.923 0.000 0.148 0.000 .876
4.2.3Rigorous and impartial public administration
0.934 0.000 0.129 0.000 .871
4.2.4 Bureaucratic quality 0.710 0.000 0.495 0.000 .933
Cronbach’s alpha = .918
Attribute 5: Participatory Engagement
5.1. Civil Society Participation
No. Component Loading SE Uniqueness SE Cronbach’s alpha if item deleted
5.1.1 CSO participatory environment -0.933 0.034 0.124 0.064 ---
5.1.2 Engaged society -0.840 0.034 0.288 0.065 ---
Cronbach’s alpha = .875

The Global State of Democracy IndicesTechnical Procedures Guide
International IDEA
54
Attribute 1. Representative Government
1.1 1.2 1.3 1.4
1.1 Clean Elections .663 .893 .793
1.2 Inclusive Suffrage 5887 .533 .609
1.3 Free Political Parties 5887 5894 .789
1.4 Elected Officials 5887 5894 5894
1.1. Clean Elections
1.1.1 1.1.2 1.1.3 1.1.4 1.1.5 1.1.6
1.1.1 EMB autonomy .830 .809 .906 .932 .822
1.1.2 Election voter registry 5891 .862 .868 .857 .660
1.1.3 Election other voting irregularities 5891 5891 .854 .854 .671
1.1.4 Election government intimidation 5891 5891 5891 .944 .760
1.1.5 Election free and fair 5891 5891 5891 5891 .803
1.1.6 Competition 5890 5887 5887 5887 5887
1.3. Free Political Parties
1.3.1 1.3.2 1.3.3 1.3.4 1.3.5 1.3.6 1.3.7 1.3.8 1.3.9
1.3.1 Party ban .807 .786 .755 .758 .707 .668 .688 .674
1.3.2 Barriers to parties 5894 .877 .816 .844 .704 .668 .700 .685
1.3.3 Opposition parties autonomy 5764 5764 .799 .847 .676 .639 .661 .659
1.3.4 Elections multiparty 5891 5891 5761 .805 .763 .757 .772 .749
1.3.5Competitiveness of participation
5617 5617 5487 5614 .716 .678 .692 .678
1.3.6 Multiparty elections 5890 5890 5760 5887 5616 .855 .855 .765
1.3.7 Was opposition allowed? 5823 5823 5701 5823 5548 5820 .902 .806
1.3.8 Was more than one party legal? 5823 5823 5701 5823 5548 5820 5823 .775
1.3.9Were opposition leaders prevented from running?
5704 5704 5586 5704 5431 5702 5704 5704
Annex F
Item–item correlationsThe tables in this Annex present the pairwise bivariate correlation coefficients (Pearson’s r) for each of the clusters of indicators that were subsequently aggregated into subcomponents, subattributes or attributes.

The Global State of Democracy IndicesTechnical Procedures Guide
International IDEA
55
1.4. Elected Government
1.4.1 1.4.2 1.4.3 1.4.4 1.4.5
1.4.1 Elected executive index .549 .506 .579 .708
1.4.2 Competitiveness of executive recruitment 5616 .517 .386 .468
1.4.3 Openness of executive recruitment 5616 5617 .461 .570
1.4.4 Legislative elections 5889 5616 5616 .746
1.4.5 Executive elections 5889 5616 5616 5890
Attribute 2. Fundamental Rights
2.1 2.2 2.3
2.1 Access to Justice .858** .784**
2.2 Civil Liberties 5914 .755**
2.3 Social Rights 5917 5914
2.1. Access to Justice
2.1.1 2.1.2 2.1.3 2.1.4 2.1.5
2.1.1 Access to justice for men .944 .645 .611 .833
2.1.2 Access to justice for women 5894 .619 .588 .808
2.1.3 Judicial corruption decision 5894 5894 .689 .721
2.1.4 Judicial accountability 5894 5894 5894 .634
2.1.5 Fair trial 5876 5876 5876 5876
2.2. Fundamental Rights
2.2.A 2.2.B 2.2.C 2.2.D 2.2.E
2.2.A Freedom of expression .944 .825 .870 .862
2.2.B Freedom of association and assembly 5873 .834 .840 .795
2.2.C Freedom of religion 5873 5873 .847 .693
2.2.D Freedom of movement 5873 5873 5873 .790
2.2.E Personal integrity and security 5873 5873 5873 5876

The Global State of Democracy IndicesTechnical Procedures Guide
International IDEA
56
2.2.A. Freedom of expression
2.2.1 2.2.2 2.2.3 2.2.4 2.2.5 2.2.6 2.2.7
2.2.1 Print/ broadcast censorship effort .896 .895 .881 .878 .872 .845
2.2.2 Harassment of journalists 5891 .868 .867 .868 .841 .829
2.2.3 Media self-censorship 5891 5891 .846 .860 .844 .815
2.2.4 Freedom of discussion for women 5891 5891 5891 .960 .890 .802
2.2.5 Freedom of discussion for men 5891 5891 5891 5894 .895 .805
2.2.6 Freedom of academic and cultural expression 5891 5891 5891 5894 5894 .783
2.2.7 Freedom of opinion and expression 5873 5873 5873 5876 5876 5876
2.2.B. Freedom of association and assembly
2.2.8 2.2.9 2.2.10
2.2.8 CSO entry and exit .894 .836
2.2.9 CSO repression 5891 .810
2.2.10 Freedom of assembly and association 5876 5873
2.2.C. Freedom of religion
2.2.11 2.2.12 2.2.13
2.2.11 Freedom of religion .826 .733
2.2.12 Religious organization repression 5891 .693
2.2.13 Freedom of thought, conscience, and religion 5876 5873
2.2.D. Freedom of movement
2.2.14 2.2.15 2.2.16 2.2.17
2.2.14 Freedom of foreign movement .793 .808 .742
2.2.15 Freedom of domestic movement for women 5894 .825 .677
2.2.16 Freedom of domestic movement for men 5894 5894 .695
2.2.17 Freedom of movement and residence 5876 5876 5876

The Global State of Democracy IndicesTechnical Procedures Guide
International IDEA
57
2.2.E. Personal integrity and security
2.2.18 2.2.19 2.2.20 2.2.21 2.2.22 2.2.23
2.2.18 Freedom from forced labor for women .894 .646 .638 .578 .435
2.2.29 Freedom from forced labor for men 5894 .642 .643 .575 .410
2.2.20 Freedom from torture 5894 5894 .902 .758 .565
2.2.21 Freedom from political killings 5894 5894 5894 .786 .598
2.2.22 Human rights protection scores 5583 5583 5583 5583 .666
2.2.23 Internal conflict 3962 3962 3962 3962 3702
2.3. Social Rights and Equality
2.3.A 2.3.B 2.3.C
2.3.A Social group equality .601 .696
2.3.B Basic welfare 5894 .655
2.3.C Gender equality 5894 5894
2.3.A. Social group equality
2.3.1 2.3.2 2.3.3 2.3.4 2.3.5
2.3.1 Social class equality in respect for civil liberties .716 .694 .669 .495
2.3.2 Social group equality in respect for civil liberties 5894 .529 .674 .393
2.3.3 Power distributed by socioeconomic position 5894 5894 .605 .559
2.3.4 Power distributed by social group 5894 5894 5894 .405
2.3.5 Representation of disadvantaged social groups 5426 5426 5426 5426
2.3.B. Basic welfare
2.3.6 2.3.7 2.3.8 2.3.9 2.3.10 2.3.11 2.3.12
2.3.6 Infant mortality rate .924 .777 .816 .866 .731 .755
2.3.7 Life expectancy 5827 .742 .700 .780 .641 .689
2.3.8 Kilocalories per person per day 5477 5514 .548 .689 .619 .673
2.3.9 Literacy 3441 3441 3225 .947 .587 .596
2.3.10 Average years of schooling 5827 5870 5514 3441 .694 .686
2.3.11 Educational equality 5842 5870 5514 3441 5870 .917
2.3.12 Health equality 5842 5870 5514 3441 5870 5894
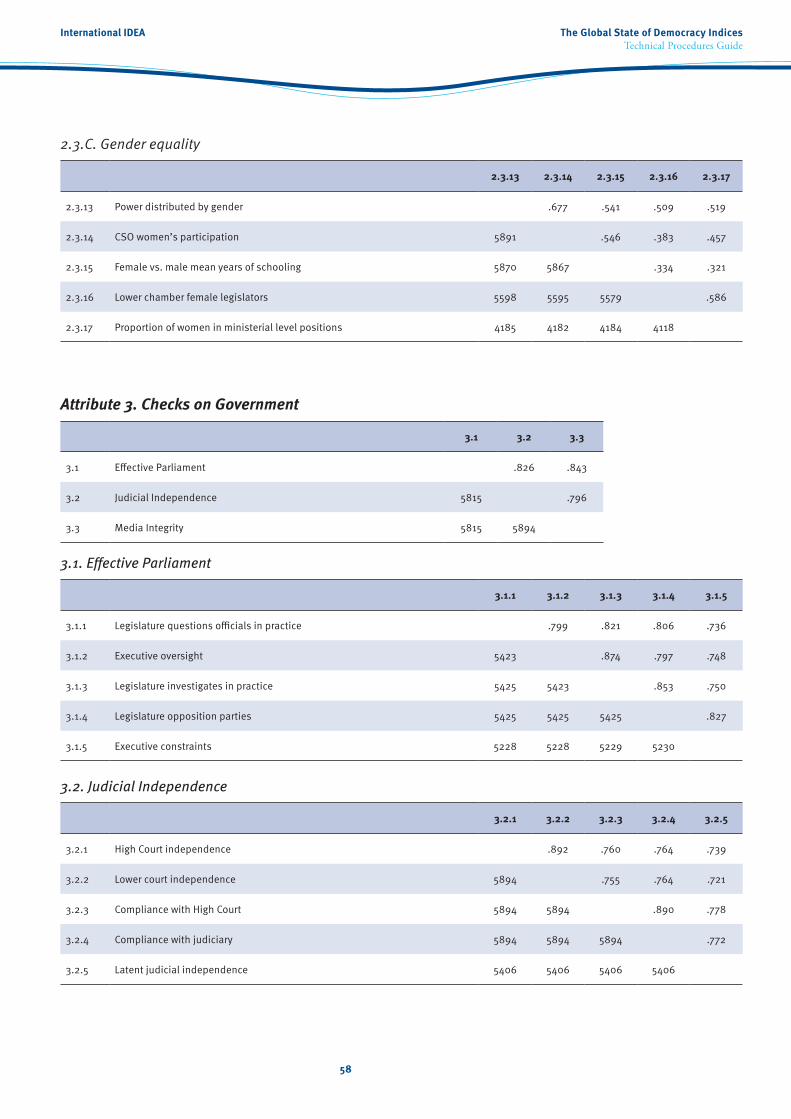
The Global State of Democracy IndicesTechnical Procedures Guide
International IDEA
58
2.3.C. Gender equality
2.3.13 2.3.14 2.3.15 2.3.16 2.3.17
2.3.13 Power distributed by gender .677 .541 .509 .519
2.3.14 CSO women’s participation 5891 .546 .383 .457
2.3.15 Female vs. male mean years of schooling 5870 5867 .334 .321
2.3.16 Lower chamber female legislators 5598 5595 5579 .586
2.3.17 Proportion of women in ministerial level positions 4185 4182 4184 4118
Attribute 3. Checks on Government
3.1 3.2 3.3
3.1 Effective Parliament .826 .843
3.2 Judicial Independence 5815 .796
3.3 Media Integrity 5815 5894
3.1. Effective Parliament
3.1.1 3.1.2 3.1.3 3.1.4 3.1.5
3.1.1 Legislature questions officials in practice .799 .821 .806 .736
3.1.2 Executive oversight 5423 .874 .797 .748
3.1.3 Legislature investigates in practice 5425 5423 .853 .750
3.1.4 Legislature opposition parties 5425 5425 5425 .827
3.1.5 Executive constraints 5228 5228 5229 5230
3.2. Judicial Independence
3.2.1 3.2.2 3.2.3 3.2.4 3.2.5
3.2.1 High Court independence .892 .760 .764 .739
3.2.2 Lower court independence 5894 .755 .764 .721
3.2.3 Compliance with High Court 5894 5894 .890 .778
3.2.4 Compliance with judiciary 5894 5894 5894 .772
3.2.5 Latent judicial independence 5406 5406 5406 5406

The Global State of Democracy IndicesTechnical Procedures Guide
International IDEA
59
3.3. Media Integrity
3.3.1 3.3.2 3.3.3 3.3.4 3.3.5
3.3.1 Print/broadcast media critical .920 .907 .859 .720
3.3.2 Print/broadcast media perspectives 5891 .911 .838 .692
3.3.3 Media bias 5891 5891 .854 .710
3.3.4 Media corrupt 5891 5891 5891 .731
3.3.5 Media Freedom 5880 5880 5880 5880
Attribute 4. Impartial Administration
4.1 4.2
4.1 Absence of Corruption .829
4.2 Predictable Enforcement 5894
4.1. Absence of Corruption
4.1.1 4.1.2 4.1.3 4.1.4 4.1.5
4.1.1 Public sector corrupt exchanges .913 .860 .833 .660
4.1.2 Public sector theft 5894 .858 .809 .673
4.1.3 Executive embezzlement and theft 5894 5894 .870 .663
4.1.4 Executive bribery and corrupt exchanges 5894 5894 5894 .658
4.1.5 Corruption 3962 3962 3962 3962
4.2. Predictable Enforcement
4.2.1 4.2.2 4.2.3 4.2.4
4.2.1 Executive respects constitution .789 .780 .636
4.2.2 Transparent laws with predictable enforcement 5894 .850 .642
4.2.3 Rigorous and impartial public administration 5894 5894 .665
4.2.4 Bureaucratic quality 3962 3962 3962

The Global State of Democracy IndicesTechnical Procedures Guide
International IDEA
60
Attribute 5. Participatory Engagement
5.1. Civil Society Participation
5.1.1 5.1.2
5.1.1 CSO participatory environment .777
5.1.2 Engaged society 5891
5.4. Subnational Democracy
5.4.1 5.4.2 5.4.3
5.4.1 Local government elected .419 .492
5.4.2 Regional government elected 5360 .272
5.4.3 Subnational elections free and fair 4688 4386

The Global State of Democracy IndicesTechnical Procedures Guide
International IDEA
61
Annex G
Comparisons with extant measures
TABLE G.1.
Selected characteristics of ten large-scale data sets
Data set Years coveredTypes of sources
Based on various data sets
Uncertainty estimates Scale
IC OD ES PS
International IDEA: GSODI
1975–2015 X X X Yes Yes Interval
Bertelsmann Stiftung: Bertelsmann Transformation Index (BTI)
2003–2015 (biennial)
X No No Ordinal
Cingranelli and Richards (CIRI): CIRI Human Rights Database
1981–2011 X No No Ordinal
Electoral Integrity Project (EIP): Perceptions of Electoral Integrity (PEI)
2012–2016 X No Yes Interval
Economist Intelligence Unit (EIU): Democracy Index
2006, 2008,2010–2016
X X Yes No Interval
Freedom House (FH): Freedom in the World
1972–2016 X No No Ordinal
Marshall, Jaggers and Gurr: Polity IV
1800–2015 X No No Ordinal
V-Dem Project: V-Dem data set
1900-2016 X X X No Yes Interval
Kaufmann and Kray: Worldwide Governance Indicators (WGI)
1996, 1998,2000-2015
X X X X Yes Yes Interval
World Justice Project (WJP): Rule of Law Index
2012-2016 X X No No Interval
Note: ES = expert survey; IC = Standards-based in-house coding; OD = observational data; PS = population surveys.

The Global State of Democracy IndicesTechnical Procedures Guide
International IDEA
62
TABLE G.2.
Correlations between GSoD indices and extant measures
Attribute 1: Representative Government
Correlation with: Correlation coefficient N % of GSODI N
Voice and accountability (WGI) .885 2559 43.12%
Political rights (FH) (inversed) .889 5378 90.61%
Electoral process and pluralism (EIU) .889 1519 25.59%
Political participation (BTI) .884 719 12.11%
Polity2 (Polity) .877 5325 89.72%
Polyarchy index (V-Dem) .936 5609 94.51%
Subattribute 1.1: Clean Elections
Correlation with: Correlation coefficient N % of GSODI N
Perceptions of electoral integrity (EIP) .858 142 2.39%
Electoral self-determination (CIRI) .771 4234 71.34%
Free and fair elections (BTI) .878 719 12.11%
Subattribute 1.4: Elected Government
Correlation with: Correlation coefficient N % of GSODI N
Effective power to govern (BTI) .701 720 12.13%
Attribute 2: Fundamental Rights
Subattribute 2.1: Access to Justice
Correlation with: Correlation coefficient N % of GSODI N
Due process of law and rights of the accused (WJP) .832 288 4.85%
Civil justice (WJP) .839 288 4.85%
The covariation between GSoD indices and existing measures constructed to measure relatively similar concepts are set out below. The correlation coefficients (Pearson’s r) indicate the general level of agreement (covariation) between them. As a rule-of-thumb , in a country–year setting such as this, with this kind of data, correlation coefficients above .80 indicate very high levels of agreement, coefficients above .60 signify high levels of agreement, correlations above .40 denote moderate levels of agreement, while correlations below .40 show low levels of agreement.

The Global State of Democracy IndicesTechnical Procedures Guide
International IDEA
63
Subattribute 2.2: Civil Liberties
Correlation with: Correlation coefficient N % of GSODI N
Civil liberties (FH) (inversed) .901 5381 90.67%
Civil liberties (EIU) .878 1517 25.56%
Subcomponent 2.2.A: Freedom of expression
Correlation with: Correlation coefficient N % of GSODI N
Freedom of opinion and expression is effectively guaranteed (WJP) .872 286 4.82%
Freedom of speech (CIRI) .670 4234 71.34%
Freedom of expression (BTI) .877 1440 24.26%
Subcomponent 2.2.B: Freedom of association and assembly
Correlation with: Correlation coefficient N % of GSODI N
Freedom of assembly and association is effectively guaranteed (WJP) .819 286 4.82%
Freedom of assembly and association (CIRI) .750 4229 71.26%
Freedom of assembly and association (BTI) .874 1440 24.26%
Subcomponent 2.2.C: Freedom of religion
Correlation with: Correlation coefficient N % of GSODI N
Freedom of belief and religion is effectively guaranteed (WJP) .772 286 4.82%
Freedom of religion (CIRI) .619 3490 58.80%
Subcomponent 2.2.D: Freedom of movement
Correlation with: Correlation coefficient N % of GSODI N
Freedom of movement (CIRI) .588 3495 58.89%
Subcomponent 2.2.E: Personal integrity and security
Correlation with: Correlation coefficient N % of GSODI N
The right to life and security of the person is effectively guaranteed (WJP) .853 288 4.85%
Conflict intensity (BTI) (inversed) .605 1440 24.26%

The Global State of Democracy IndicesTechnical Procedures Guide
International IDEA
64
Subattribute 2.3: Social Rights and Equality
Correlation with: Correlation coefficient N % of GSODI N
Equal opportunity (BTI) .768 720 12.13%
Subcomponent 2.3.A: Social group equality
Correlation with: Correlation coefficient N % of GSODI N
Equal treatment and absence of discrimination (WJP) .698 288 4.85%
Subcomponent 2.3.B: Basic needs provisions
Correlation with: Correlation coefficient N % of GSODI N
Social safety nets (BTI) .822 720 12.13%
Subcomponent 2.3.C: Gender equality
Correlation with: Correlation coefficient N % of GSODI N
Women’s social rights (CIRI) .523 4194 70.67%
Women’s economic rights (CIRI) .599 3235 54.51%
Attribute 3: Checks on Government
Correlation with: Correlation coefficient N % of GSODI N
Separation of powers (BTI) .842 718 12.10%
Subattribute 3.1: Effective Parliament
Correlation with: Correlation coefficient N % of GSODI N
Government powers are effectively limited by the legislature (WJP) .757 288 4.85%
Subattribute 3.2: Judicial Independence
Correlation with: Correlation coefficient N % of GSODI N
Government powers are effectively limited by the judiciary (WJP) .783 288 4.85%
Judicial independence (BTI) .810 720 12.13%
Independence of the judiciary (CIRI) .699 4275 72.03%
Subattribute 3.3: Media Integrity
Correlation with: Correlation coefficient N % of GSODI N
Government powers are subject to non-governmental checks (WJP) .778 288 4.85%

The Global State of Democracy IndicesTechnical Procedures Guide
International IDEA
65
Absence of corruption (WJP) .904 288 4.90%
Absence of corruption (WGI) .885 2559 43.12%
Prosecution of office abuse (BTI) .737 720 12.13%
Anti-corruption policy (BTI) .758 719 12.11%
Subattribute 4.2: Predictable Enforcement
Correlation with: Correlation coefficient N % of GSODI N
Government regulations are effectively enforced (WJP) .760 288 4.90%
Administrative proceedings are conducted without unreasonable delay (WJP)
.610 288 4.90%
Government effectiveness (WGI) .862 2559 43.12%
Implementation (BTI) .796 719 12.11%
Attribute 5: Participatory Engagement
Subattribute 5.1: Civil Society Participation
Correlation with: Correlation coefficient N % of GSODI N
Interest groups (BTI) .662 1400 24.26%
Civil society traditions (BTI) (inversed) .583 1400 24.26%
Attribute 4: Impartial Administration
Correlation with: Correlation coefficient N % of GSODI N
Government regulations are applied and enforced without improper influence (WJP)
.842 288 4.90%
Basic administration (BTI) .643 720 12.13%
Subattribute 4.1: Absence of Corruption
Correlation with: Correlation coefficient N % of GSODI N

International IDEA
Strömsborg
SE–103 34 Stockholm
Sweden
Tel: +46 8 698 37 00
Email: [email protected]
Web: www.idea.int