the global recovery: status update
DESCRIPTION
Global Economic Outlook Business and Policy Dilemmas Draft Zbyszko Tabernacki, CFA Executive Managing Director Economics and Country Risk IHS Global Insight November 18, 2010. The Global Recovery: Status Update. The global expansion is continuing, but at a more gradual pace - PowerPoint PPT PresentationTRANSCRIPT

Global Economic OutlookBusiness and Policy Dilemmas Draft
Zbyszko Tabernacki, CFAExecutive Managing DirectorEconomics and Country RiskIHS Global Insight
November 18, 2010

Copyright © 2010 IHS Inc. All Rights Reserved.
The Global Recovery: Status Update
• The global expansion is continuing, but at a more gradual pace
• Recoveries from financial crises are typically slow
• Debt levels will influence the speed of country recoveries
• Inflation will not be a serious problem in most countries
• Interest rates will remain low through 2011 in advanced countries but will rise in emerging markets
• Quantitative easing will have little impact on economic growth
• The probability of a global double-dip recession is about 20% and declining

Copyright © 2010 IHS Inc. All Rights Reserved.
After Slowing in Mid-2010, World Real GDP Growth Is Expected to Gradually Pick Up
-8
-6
-4
-2
0
2
4
6
2006 2007 2008 2009 2010 2011 2012
(Quarter-on-quarter percent change, annual rate)
Source: IHS Global Insight

Copyright © 2010 IHS Inc. All Rights Reserved.
Global Economic Indicators: Mixed Signals
Net Output Surprises
Global Yield Curve
Global Real Policy Rate
Global Consumer Price Inflation
Global Real Narrow Money (M1) Supply
Global Real Broad Money (M2) Supply
Lending Standards
TED Spread: LIBOR vs. T-bill
Global Equity Prices
Global Foreign Exchange Reserves
Global Manufacturing Confidence
Global New Orders
Industrial Metals Prices
Global Industrial Production
Real Baltic Dry Bulk Shipping Rate Index
Global Real Merchandise Imports
Real Crude Oil Prices
Consumer Confidence Diffusion
Global Real Retail Sales
Corporate Profit Proxy: CPI–WPI Difference
Global Employment Growth
In October 2010, 18 of 21 indicators signaled expansion (green), but only 10 had improved since August (up arrow)
Source: IHS Global Insight

Copyright © 2010 IHS Inc. All Rights Reserved. 5
Crawling Economies
• High debt levels
• Weak growth — post-crisis recoveries are almost always slow
• No inflation
• Rock-bottom interest rates
• Downward pressure on currencies
• Risks: double-dips and/or lost decades
• Risk: currency “wars” and protectionism
• Macro challenges: monetary and fiscal policy “exit strategies” without aborting the recovery
• Micro challenges: boosting productivity and competitiveness (especially in Southern Europe), reining in healthcare and pensions costs, cleaning up housing wreckage, help for the chronically unemployed

Copyright © 2010 IHS Inc. All Rights Reserved. 6
Global Unemployment
(Percent of unemployed out of work for at least six months)
Source: OECD
Of which: 12 months or more
7.5
UnemploymentRate, %
11.6
10.1
20.5
5.1
10.5
7.7
9.6
5.1
7.4
3.3
3.4
8.1

Copyright © 2010 IHS Inc. All Rights Reserved. 7
Booming Economies
• Low debt levels
• Strong growth
• Rising (but still low) inflation
• Rising interest rates
• Upward pressure on currencies
• Risks: overheating and asset bubbles
• Risk: currency “wars”
• Macro challenges: less intervention in currency markets, more support for consumer spending
• Micro challenges: structural and institutional changes to increase share of consumer spending in economy (i.e. less export dependence)

Copyright © 2010 IHS Inc. All Rights Reserved. 8
0
5
10
15
20
25
30
35
40
45
2000
2002
2004
2006
2008
2010
2012
2014
2016
2018
2020M
illi
on
s
Triad LV Sales BRICs LV Sales
Global Auto Markets Reflect Two-Speed World
Light Vehicle Sales
Note: Triad comprises U.S., Japan, and Western Europe
Copyright © 2010 IHS Inc. All Rights Reserved.
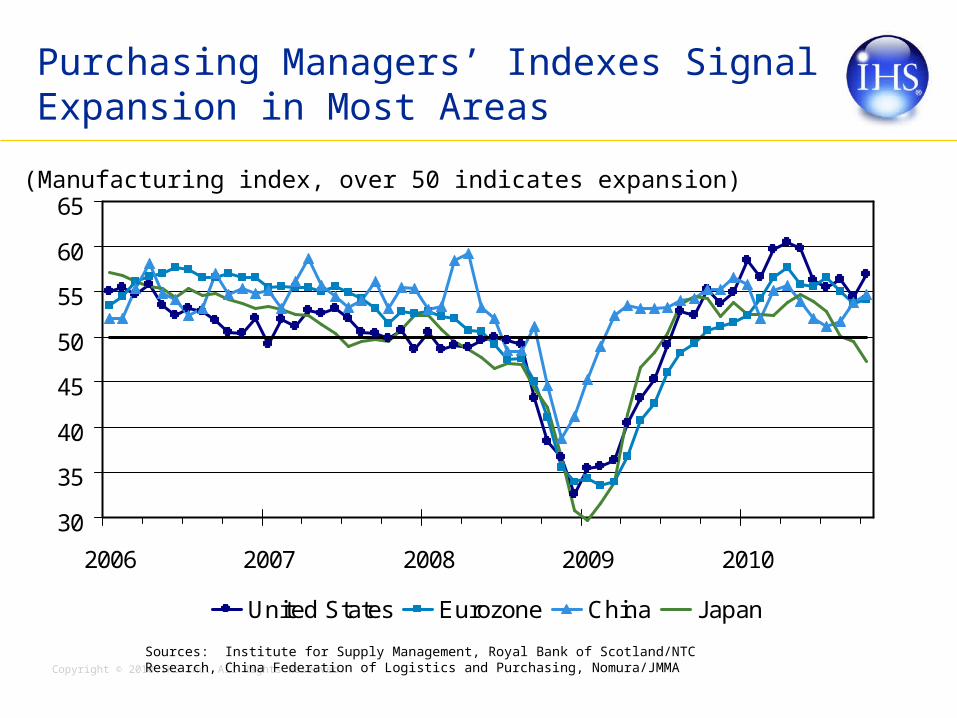
Purchasing Managers’ Indexes Signal Expansion in Most Areas
(Manufacturing index, over 50 indicates expansion)
30
35
40
45
50
55
60
65
2006 2007 2008 2009 2010
United States Eurozone China Japan
Sources: Institute for Supply Management, Royal Bank of Scotland/NTC Research, China Federation of Logistics and Purchasing, Nomura/JMMA

Copyright © 2010 IHS Inc. All Rights Reserved.
0
1
2
3
4
5
2000 2001 2002 2003 2004 2005 2006 2007 2008 2009 2010
In U.S. Dollars In GDP-Weighted Currency Basket
(IHS Global Insight Indexes, 2002:1=1.0)
Industrial Materials Prices Are Rising Again, Partly in Response to Dollar Depreciation
Source: IHS Global Insight
Copyright © 2010 IHS Inc. All Rights Reserved.
Currency Wars Could Lead to Trade Wars
• Fundamental problem: the world economy needs to reflate and rebalance at the same time
• Textbook solution: currencies of surplus countries appreciate and the currencies of deficit countries depreciate
• Motivations for market intervention
• deflationary fears (Japan and Switzerland)
• concerns about capital inflows (Brazil)
• insecurities about the strength of domestic demand (China)
• worries about China’s competitiveness (Brazil, South Korea)
• Zero-sum game: shades of 1930s competitive devaluations

Copyright © 2010 IHS Inc. All Rights Reserved.
The U.S. Dollar Will Depreciate Against Currencies of Emerging Markets
0.6
0.8
1.0
1.2
1.4
1.6
1978 1982 1986 1990 1994 1998 2002 2006 2010 2014
Major Trading Partners Other Important Trading Partners
(Real Trade-Weighted Dollar Index, 2005=1.0)

Copyright © 2010 IHS Inc. All Rights Reserved. 13
The U.S. Recovery: Uneven and Subpar
• Recession “over”, but GDP hasn’t regained previous peak yet
• Growth boost from fiscal stimulus and inventories is fading
• Headwinds are blowing from consumer and business caution
• Policy uncertainties don’t help, but the key problem is the hangover from the financial boom and bust
• QE II is on the way; it’s not a cure-all
• It’s too early to tighten fiscal policy when the private sector is gripped by an “epidemic of thrift”

Copyright © 2010 IHS Inc. All Rights Reserved.
A Deeper U.S. Recession and Slower Recovery than in Past Cycles
-2
0
2
4
6
8
10
-8 -7 -6 -5 -4 -3 -2 -1 0 1 2 3 4 5 6 7 8
Quarters from Trough
Current Recovery Average of Post-1950 Recoveries
(Real GDP, percent difference from recession trough)
Source: IHS Global Insight

Copyright © 2010 IHS Inc. All Rights Reserved. 15
-6-4-20246
2007 2008 2009 2010
Household Credit Conditions:Beginning To Loosen
-5
0
5
10
2007 2008 2009 2010
*% change y/y; **Percent of banks tightening less percent loosening
Consumer Credit Growth* Home Mortgage Credit Growth*
Banks Tightening Cons. Credit** Banks Tightening Mortgage Credit**
-20
0
20
40
60
80
2007 2008 2009 2010
Prime Loans
-20
0
20
40
60
80
2007 2008 2009 2010
Credit Cards
Other Loans

Copyright © 2010 IHS Inc. All Rights Reserved. 16
-1,000
-750
-500
-250
0
250
Jan-08 Jul-08 Jan-09 Jul-09 Jan-10 Jul-10
Employment Is Turning, But Not Rapidly
4
6
8
10
12
Jan-08 Jul-08 Jan-09 Jul-09 Jan-10 Jul-10
*Thousands, monthly change, SA; **Percent; ***Hours, SA
Private Payroll Employment* Unemployment Rate**
Length of Workweek*** Temporary Employment*
-100
-50
0
50
100
Jan-08 Jul-08 Jan-09 Jul-09 Jan-10 Jul-10
32.5
33.0
33.5
34.0
Jan-08 Jul-08 Jan-09 Jul-09 Jan-10 Jul-10

Copyright © 2010 IHS Inc. All Rights Reserved. 17
-4
-2
0
2
4
6
2003 2004 2005 2006 2007 2008 2009 2010 2011 2012
(Annualized rate of growth)
Consumer Spending Stabilizing, But Not a Strong Driver of Recovery
Copyright © 2010 IHS Inc. All Rights Reserved. 18
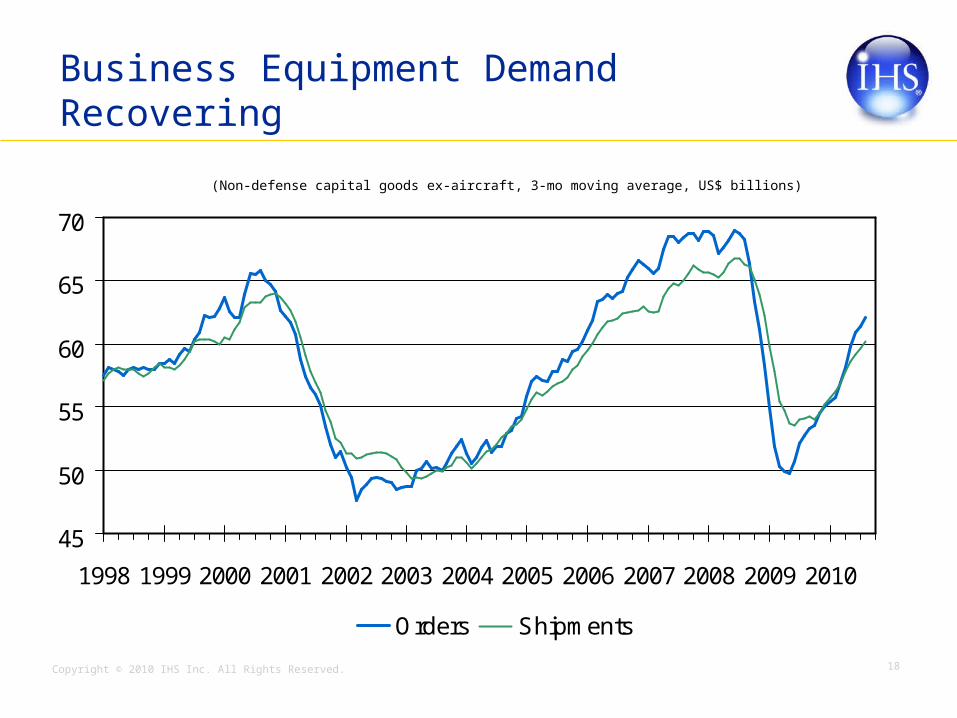
Business Equipment Demand Recovering
(Non-defense capital goods ex-aircraft, 3-mo moving average, US$ billions)
45
50
55
60
65
70
1998 1999 2000 2001 2002 2003 2004 2005 2006 2007 2008 2009 2010
Orders Shipments

Copyright © 2010 IHS Inc. All Rights Reserved. 19
(Percent change unless otherwise noted)
U.S. Economic Growth by Sector
2009 2010 2011 2012
Real GDP -2.6 2.7 2.3 2.9
Final Sales -2.1 1.2 2.5 2.9
Consumption -1.2 1.7 2.4 2.0
Light Vehicle Sales (Millions) 10.4 11.4 12.8 14.8
Residential Investment -22.9 -4.2 4.1 33.4
Housing Starts (Millions) 0.55 0.60 0.78 1.21
Business Fixed Investment -17.1 5.6 5.9 7.3
Federal Government 5.7 4.7 0.0 -3.5
State and Local Government -0.9 -1.3 0.2 0.0
Exports -9.5 11.5 8.3 8.1
Imports -13.8 13.2 5.6 5.3

Copyright © 2010 IHS Inc. All Rights Reserved. 20
(Percent unless otherwise noted)
Other Key Indicators
2009 2010 2011 2012
Industrial Production (% growth) -9.3 5.3 2.9 3.5
Employment (% growth) -4.3 -0.5 0.9 2.2
Unemployment Rate 9.3 9.7 9.6 9.1
CPI Inflation -0.3 1.7 1.5 1.9
Oil Prices (WTI, US$/bbl) 62 79 83 89
Core PCE Price Inflation 1.5 1.4 1.3 1.4
Federal Funds Rate 0.16 0.17 0.14 1.27
10-year Government Bond Yield 3.26 3.14 2.58 3.43
Dollar (Major Currencies, 2005=1) 0.93 0.90 0.86 0.88

Copyright © 2010 IHS Inc. All Rights Reserved. 21
What Can QE II Accomplish?
• Don’t expect too much from QE II
• Quantitative easing is powerful in a crisis...
• ...but financial markets are not in meltdown now...
• QE II of $500bln-$1 trl can push down long-term interest rates (25-50bps?), at least partly priced in already...
• ...and help growth a tenth or two in 2011...
• ...not a game-changer

Copyright © 2010 IHS Inc. All Rights Reserved. 22* Ivey, n.s.a; ** ISM Index
22
24
26
28
30
2005 2006 2007 2008 2009
240
260
280
300
320
Canada (LS) United States (RS)
Retail Sales (Excluding motor vehicles and parts, billions)
Real GDP(Percent change)
Canada Recovery Hits a Speed Bump
1.2
1.4
1.6
1.8
2.0
2007 2008 2008 2009 2009 2010 2010
8.0
10.5
13.0
15.5
18.0
Canada (LS) United States (RS)
Total New Motor Vehicle Sales (Millions of units, SAAR)
2009 2010 2011-5.0
-2.5
0.0
2.5
5.0
-2.5
2.92.3
-2.6
2.7 2.3
Canada United States
30
40
50
60
70
2005 2006 2007 2008 2009 2010
Canada* United States**
Leading Manufacturing Indicators(Diffusion index, over 50 indicates expansion)

Copyright © 2010 IHS Inc. All Rights Reserved. 23
2
4
6
8
10
2000 2002 2004 2006 2008 2010 2012
*Annual average, **Billions of U.S. dollars
-30
-20
-10
0
2000 2002 2004 2006 2008 2010 2012
9
10
11
12
13
14
2000 2002 2004 2006 2008 2010 2012
-10
-5
0
5
10
2000 2002 2004 2006 2008 2010 2012
Real GDP Growth (%) Consumer Price Inflation (%)
Exchange Rate per US$* Current Account Balance**
Mexico Outlook Summary

Copyright © 2010 IHS Inc. All Rights Reserved. 24
Eurozone Growth Likely to Be Uneven and Sluggish
• Despite strong Q2, Eurozone growth will remain sluggish overall
• Two-speed Europe (as well) — marked divergences in performance of member countries, with North doing relatively well (especially Germany) and South struggling
• But fiscal policy was already becoming less accommodative even before Eurozone sovereign debt crisis increased pressure for policy to be tightened earlier and faster
• High unemployment, weak wage gains, and tight credit will restrain consumer
• Business investment limited by substantial excess capacity and concerns about strength and sustainability of recovery
• Exports will be hurt by slowing global growth and the recent strength in the euro

Copyright © 2010 IHS Inc. All Rights Reserved. 25
Asia’s Recovery Is At a Flexing Point
• Impetus from inventories has already peaked
• Net exports will slow considerably in coming quarters
• China has become a source of near-term risk
• Slight shift in policy stance betrays worry about outlook
-6
-3
0
3
6
9
12
08Q1 08Q3 09Q1 09Q3 10Q1
-30
-20
-10
0
10
20
30
GDP (Left scale)
Industrial Production (Right scale)
(Percent change from a year earlier, SAAR)

Copyright © 2010 IHS Inc. All Rights Reserved.
A Mild Slowdown in China’s Industrial Outputas the Economy Rebalances
(Percent change from year earlier)
-30
-20
-10
0
10
20
30
40
50
2007 2008 2009 2010
Industrial Output Real Merchandise Exports
Real Fixed Investment Real Retail Sales
Source: IHS Global Insight

Copyright © 2010 IHS Inc. All Rights Reserved. 27
China: Focus on Risks
• Slowdown has stabilized― Property sector tightening policy effective in deflating bubble, so far― Following the initial sharp slide, construction and overall output have
leveled off― Growth downtrend should continue, as tightening policy will remain in
effect and export growth is expected to slow
• Soft-landing is still the most probable scenario― External demand will stagger, not collapse― Policy will be “cautiously accommodative”, including RMB appreciation― Consumer demand should remain stable
• But risks of hard-landing have increased― Recovery in the U.S. and EU still unstable― 2009 credit binge could turn into a full-fledged banking crisis, especially
local government debt― The usually steady consumer demand will likely then collapse― If all flashpoints ignited, we are looking at the worst case scenario

Copyright © 2010 IHS Inc. All Rights Reserved. 28
Bottom Line and Business Implications
• The next decade will be less “fun” than the 1990s or the pre-crisis 2000s
• The risk of a lost decade is higher than a double-dip — but still relatively low
• The risk of deflation is greater than inflation — but also relatively low
• Many companies will pursue market share (or hunker down) strategies in the developed world and growth strategies in the emerging world
• Since the emerging world is not without risk, diversification will be key — in other words, don’t put all your eggs in the Chinese basket
• Fiscal consolidation is inevitable and taxes will rise — businesses have a huge stake in how this happens
• Businesses also have a huge stake in the outcome of the currency “wars” and especially in keeping the protectionist instincts of politicians in check
